Article

A PSO-VMD-LSTM-Based Photovoltaic Power Forecasting Model Incorporating PV Converter Characteristics

1
China State Grid Yichun Electric Power Supply Company, Yichun 336000, China
2
College of Electrical Engineering and New Energy, China Three Gorges University, Yichang 443002, China
*
Author to whom correspondence should be addressed.
Appl. Sci. 2025, 15(19), 10612; https://doi.org/10.3390/app151910612
Submission received: 20 August 2025 / Revised: 28 September 2025 / Accepted: 29 September 2025 / Published: 30 September 2025
(This article belongs to the Section Energy Science and Technology)

Abstract

High-precision photovoltaic (PV) power generation prediction models are essential for ensuring secure and stable grid operation and optimized dispatch. Existing models often ignore the significant variations in PV grid-connected inverter loss distributions and exhibit inadequate data decomposition processing, which influences the accuracy of the prediction models. This paper proposes a PSO-VMD-LSTM prediction model that includes PV converter loss characteristics. Firstly, the Particle Swarm Optimization (PSO) algorithm is employed to optimize the parameters of Variational Mode Decomposition (VMD), enabling effective decomposition of data under different weather conditions. Secondly, the decomposed sub-modes are individually fed into Long Short-Term Memory (LSTM) networks for prediction, and the results are subsequently reconstructed to obtain preliminary predictions. Finally, a neural network-based equivalent model for inverter losses is constructed; the preliminary predictions are fed into this model to obtain the final prediction results. Simulation case studies demonstrate that the proposed PSO-VMD-LSTM-based model can comprehensively consider the impact of uneven converter loss distribution and effectively improve the accuracy of PV power prediction models.

1. Introduction

Against the backdrop of global energy transition toward low-carbon structures, photovoltaic power generation has become a critical component in power systems owing to its environmental cleanliness and sustainability [1,2,3]. However, the intermittency and stochasticity of photovoltaic power generation pose substantial challenges to grid dispatching and stable operation. Consequently, high-accuracy power forecasting technologies have become important for enhancing renewable energy accommodation capacity and operational economy [4,5].
Currently, research on photovoltaic power forecasting primarily focuses on enhancing prediction accuracy, reducing model complexity, and improving data preprocessing techniques. According to the classification of forecasting models, they can primarily be divided into mathematical statistical methods and artificial neural network methods [6,7]. Statistical methods construct forecasting models through parametric estimation and curve fitting using historical data. While offering strong generalizability and modeling convenience, their prediction reliability significantly deteriorates when original data contain noise interference or missing information [8]. In contrast, artificial neural networks require no precise mathematical models, possessing the capability to learn intrinsic feature relationships from historical data while continuously enhancing predictive performance [9]. Various neural networks including Recurrent Neural Networks (RNNs) [10], Support Vec-tor Machines (SVMs) [11], and Long Short-Term Memory (LSTM) networks [12] have been extensively applied in photovoltaic power forecasting. However, single prediction models suffer from significant limitations when dealing with fluctuating data and in the selection of model parameters. Therefore, hybrid models, which integrate optimization algorithms and data decomposition techniques, have emerged as a viable solution to this problem.
Reference [13] compared LSTM, Convolutional Neural Networks (CNNs), and hybrid models for photovoltaic power forecasting, the results demonstrate that the hybrid model achieves superior forecasting accuracy compared to individual models. Reference [14] processes original photovoltaic data by EMD to mitigate noise and interference, yet this approach may induce numerical fluctuations and mode mixing phenomena. Reference [15] utilizes VMD for PV data processing, effectively suppressing mode mixing issues. While VMD of PV power signals circumvents mode mixing, the selection of decomposition parameters—mode number k and penalty factor α—critically in-fluences decomposition efficacy [16,17]. Reference [18] constructed a VMD-SSA-LSTM combined model, which significantly enhanced model performance by optimizing the parameters of VMD using an optimization algorithm. Therefore, in contrast to the mode mixing problem inherent in EMD, VMD can effectively decompose data but requires an optimization algorithm for parameter selection. However, existing studies still exhibit one primary shortcoming. Most models only focus on the mappings relationship between meteorological inputs and historical power output, thereby neglecting the impact of power losses in the PV system’s internal power electronic devices (e.g., inverters) on the actual output power. During modeling, inverter efficiency models are typically overlooked [19] or simplistically assumed to be constant [20], neglecting the impact of efficiency fluctuations under varying operational conditions. It will introduce significant errors into subsequent power system strategy formulation and configuration optimization.
In order to incorporate the influence of the photovoltaic inverter on the final output power. This paper proposes an integrated PSO-VMD-LSTM photovoltaic forecasting model that incorporates PV inverter efficiency model and parametric optimization. The model enhances prediction accuracy by constructing inverter loss models and optimizing de-composition parameters through optimization algorithms. First, during the prediction stage, VMD is applied to decompose PV power into multiple intrinsic mode functions (IMFs), followed by reconstruction of the components. Second, a PSO algorithm is designed to adaptively optimize the VMD parameters—mode number k and penalty factor α—dynamically adjusting decomposition parameters according to categorized weather patterns. Finally, the power output predicted by the LSTM network is real-time adjusted through a constructed inverter efficiency model. Simulation case studies demonstrate that the proposed methodology significantly enhances forecasting accuracy.

2. Photovoltaic Data Processing

Data preprocessing reduces the computational complexity of intricate datasets, extracts effective feature information from high-dimensional data, enhances model training efficiency, and improves the performance of predictive models.

2.1. Feature Extraction from Meteorological Data

Correlation analysis of meteorological variables was conducted employing Pearson’s correlation coefficient, expressed as follows:
P x y = i = 1 n ( x i x ¯ ) ( y i y ¯ ) i = 1 n ( x i x ¯ ) 2 i = 1 n ( y i y ¯ ) 2
where P x y denotes the correlation coefficient x i , y i represent the meteorological data values used to compute the correlation between two variables. x ¯ , y ¯ represents the corresponding data mean. A correlation coefficient greater than zero indicates a positive correlation, while a coefficient less than zero indicates a negative correlation. The absolute value of the coefficient reflects the strength of the correlation.

2.2. Variational Mode Decomposition

Photovoltaic power signals, influenced by meteorological factors such as solar irradiance and temperature, exhibit multi-time-scale fluctuation characteristics. VMD is an adaptive signal processing method that effectively handles non-stationary and nonlinear characteristics in photovoltaic power output. By decomposing complex signals into multiple intrinsic mode functions with limited bandwidth, VMD significantly enhances the predictive model’s ability to capture dynamic features, providing theoretical support for improving the accuracy and robustness of photovoltaic power forecasting. The procedure is as follows:
(1)
The photovoltaic power time series is decomposed into K intrinsic mode functions. The mathematical formulation of the decomposition and its associated constraints is as follows:
min u k , ω k k = 1 K t [ ( δ ( t ) + j π t ) u k ( t ) ] e j ω k t 2 2 s.t. k = 1 K u k = f ( t ) ,   k = 1 , 2 , , K
where u k is the k-th modal components obtained from the decomposition, ω k is the corresponding center frequency, δ ( t ) denotes the Dirac delta function, and f ( t ) represents the original photovoltaic power signal.
(2)
Randomly initialize each modal component, the center frequency, and the Lagrange multipliers.
(3)
The center frequency and bandwidth of each component are determined through iterative optimization, introducing Lagrange multipliers λ and quadratic penalty terms α for the solution, as shown in the following equation:
L ( { u k } , { ω k } , λ ) = α k = 1 K t [ ( δ ( t ) + j π t ) u k ( t ) ] e j ω k t 2 2 + f ( t ) k = 1 K u k ( t ) 2 2 + λ ( t ) ,   f ( t ) k = 1 K u k ( t )
(4)
The error between modal components in successive iterations is calculated to determine whether the termination criteria are met. The finite bandwidth modal components and their corresponding center frequencies are then output. The iterative update method employed is the Alternating Direction Method of Multipliers, as described by the following equation:
u ^ k ( n + 1 ) ( ω ) = f ^ ( ω ) n k u ^ k ( n ) ( ω ) + λ ^ ( n ) ( ω ) 2 1 + 2 α ( ω ω k ( n ) ) 2 ω k ( n + 1 ) = 0 ω u ^ k ( n + 1 ) ( ω ) 2 d ω 0 u ^ k ( n + 1 ) ( ω ) 2 d ω
where f ^ ( ω ) , u ^ k ( ω ) , and λ ^ ( ω ) denote the Fourier transforms of f ( t ) , u k ( t ) and λ ( t ) , respectively; ω represents the frequency, and n is the iteration number.
Appropriate parameter selection is critical prior to VMD. An excessively large value of k may cause over-decomposition, while a too small k may result in under-decomposition. Similarly, a large α value may lead to loss of frequency band information, whereas a small α value may cause redundant mode functions. Therefore, it is necessary to determine the optimal parameter combination. In this paper, PSO algorithm is proposed to optimize the VMD parameters.

2.3. Particle Swarm Optimization Algorithm

The PSO algorithm, originally proposed by Kennedy and Eberhart, draws inspiration from avian foraging behavior. By facilitating information sharing within the swarm, it coordinates distributed exploration of the search space through region assignment, and ultimately locating the food source [21]. The optimization process is illustrated in Figure 1.
During the iterative process, particles move systematically multiple times within the search space to evaluate the fitness of each position. They continuously update their positions according to the following update formula:
x i k + 1 = x i k + v i k + 1
where x i k denotes the position of the i particle in the k generation, and v i k + 1 represents the velocity of the i particle in the k + 1 generation.
During each iteration, the velocity and position of each particle are updated based on its individual best position and the global best position. The update equations are:
v i k + 1 = ω v i k + c 1 r 1 ( p b e s t i k x i k ) + c 2 r 2 ( g b e s t k x i k )
where ω denotes the inertia weight, c 1 and c 2 are the cognitive and social acceleration coefficients, respectively, r 1 and r 2 are independent random variables uniformly distributed in the interval (0,1), p b e s t i k represents the individual best position of the i particle at generation k and g b e s t k denotes the global best position of the swarm at generation k.

3. Construction of Predictive Model

Processed photovoltaic data inherently contains temporal information. LSTM networks, an enhanced variant of Recurrent Neural Networks, are capable of capturing sequential dependencies. Subsequently, a converter efficiency model is developed to dynamically adjust the real-time output of the photovoltaic power forecast, thereby enhancing prediction accuracy.

3.1. LSTM Model

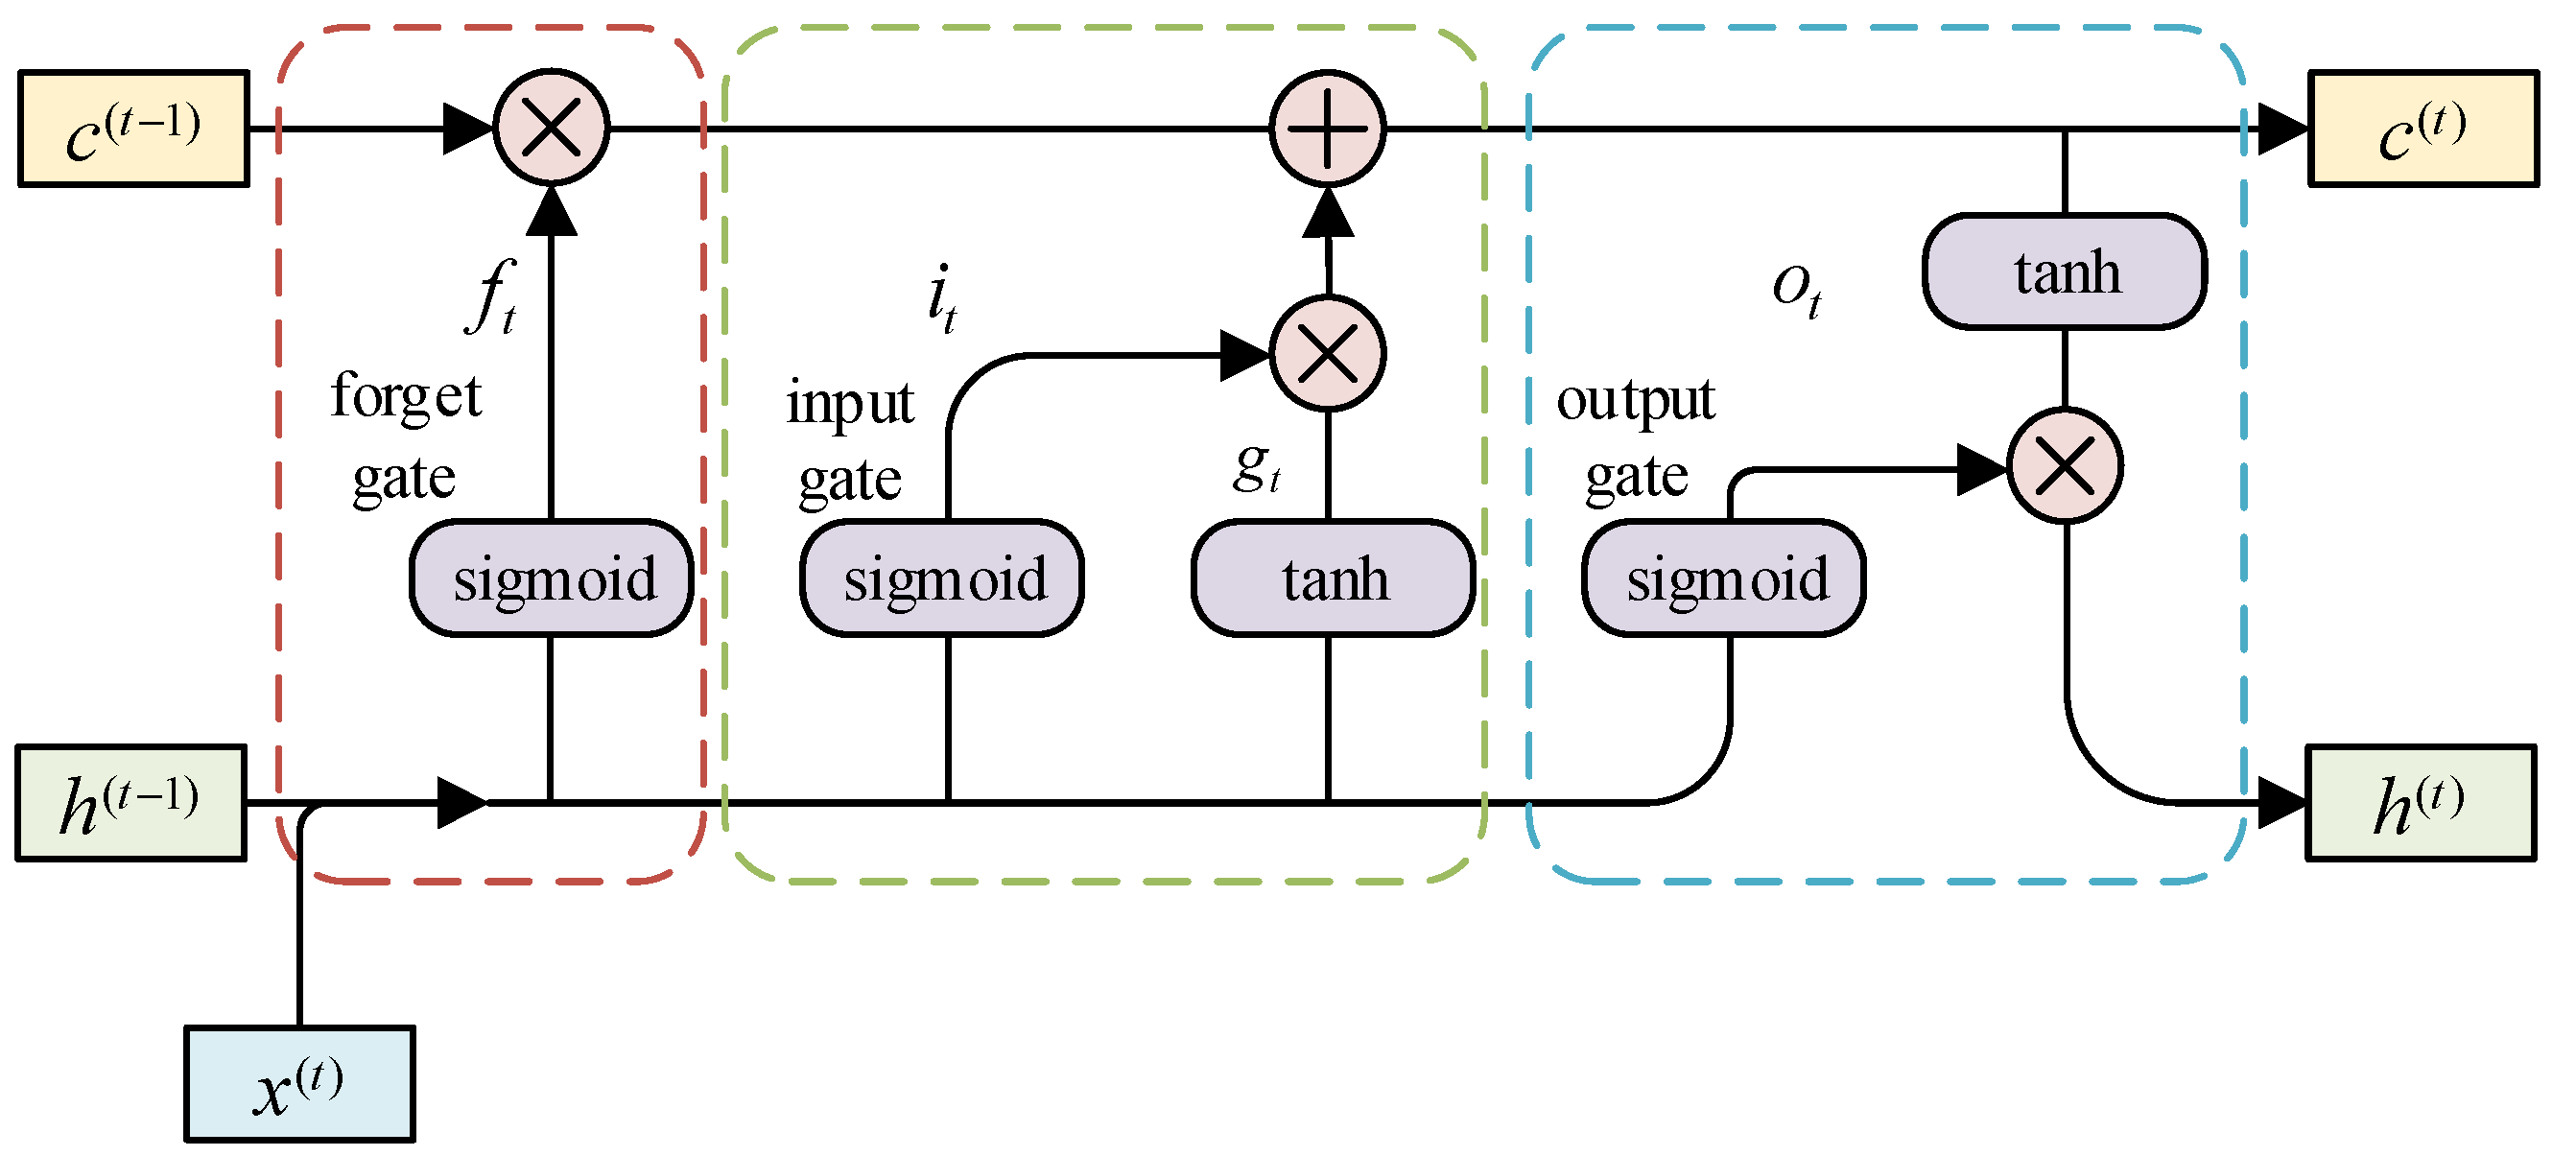
The LSTM core structure replaces the traditional single-hidden-layer architecture with gated units. It comprises four cooperative control units—forget gate, input gate, update gate, and output gate, that strengthen interdependence in sequential data and effectively suppress gradient instability during backpropagation, thereby significantly enhancing time-series training performance. The structure is illustrated in Figure 2.
The first step in LSTM is to determine which information in the cell state should be discarded, and this decision is handled by the forget-gate’s sigmoid unit. By examining h(t−1) and x(t), it outputs a vector of values between 0 and 1, where each value indicates how much information from the previous cell state c(t−1) should be retained or discarded: 0 means fully discard and 1 means fully retain. As shown in the following equation:
f t = sigmoid ( W f [ h ( t 1 ) , x ( t ) ] + b f )
The next step is to decide what new information to add to the cell state. First, h(t−1) and x(t) are processed through the input gate to determine which information to update. Then, these same inputs are passed through a tanh layer to generate the candidate cell-state information gt, as shown in the following equation:
i t = sigmoid ( W i [ h ( t 1 ) , x ( t ) ] + b i )
g t = tanh ( W c [ h ( t 1 ) , x ( t ) ] + b c )
c ( t ) = f t c ( t 1 ) + i t g t
Finally, the output is obtained using the following equation:
o t = sigmoid ( W o [ h ( t 1 ) , x ( t ) ] + b o )
h ( t ) = o t tanh ( c ( t ) )
In the above equations, t denotes the time step, xt is the input sequence at time step t, h(t−1) is the hidden state output from the previous time step (t − 1), and c(t−1) represents the cell state from the previous time step (t − 1). Furthermore, ft, it and ot are the outputs of the forget gate, input gate, and output gate, respectively, with W representing the weight matrices and b the bias vectors for their corresponding gates.

3.2. Efficiency Model of the Converter

Photovoltaic power measurements are typically based on PV modules. However, all electrical energy within the system must pass through the converter, and the converter’s efficiency directly affects overall system efficiency. Therefore, it is necessary to develop converter efficiency model.
In power electronic converter systems, energy losses primarily occur in power-switching components, magnetic elements, capacitors, control circuits, and PCB traces. These losses are closely related to the actual operating conditions of the converter [22]. For instance, in a Boost converter, losses can be categorized as follows:
P S = I in 2 R S ( on ) D + t S ( on ) + t S ( off ) + t S ( r ) + t S ( f ) 2 f I in U out P D = I out U D ( on ) + ( 1 D ) ( 1 D I out ) 2 R D _ esr P L = I in 2 R L + V c o r e ( L Δ I L N L A e ) α ( b 1 f + 0.1228 f b 2 ) P C = ( D I out 2 + ( 1 D ) ( 1 D D I out ) 2 ) tan δ 2 π f C P c o n t r o l = 2
In the above expressions, Iin denotes the input current; RS(on) is the on-state resistance; D is the duty cycle; tS(on) and tS(off) represent the turn-on and turn-off delay times, respectively; tS(r) and tS(f) denote the rise and fall times; f is the switching frequency; Uout and Iout are the output voltage and current, respectively; UD(on) is the forward voltage drop; RD_esr denotes the equivalent series resistance; RL is the inductor’s winding resistance; Vcore represents the core volume; L is the inductance; ΔIL is the inductor current ripple; NL denotes the number of inductor turns; Ae is the core’s effective cross-sectional area; tan δ is the dielectric loss tangent; and C is the capacitance. The total loss is expressed as follows:
P l o s s = P S + P D + P L + P C + P c o n t r o l
In the above expressions, PS represents the MOSFET switching and conduction losses; PD denotes diode conduction and recovery losses; PL corresponds to inductor core and winding losses; PC enotes capacitor losses; and Pcontrol represents the losses associated with the control circuitry.
The current can be expressed in terms of the operating power P, input voltage Uin, and output voltage Uout, as shown in the following equation:
I in = P U in ,   I out = P U out
The relationship between efficiency, operating power, and losses is given by
η = 1 P l o s s P
Based on the preceding derivation of converter principles and acquisition of device parameters, the relationship between efficiency and power can be determined. However, analyzing the operational principles of photovoltaic converter circuits with complex interdependencies proves time-consuming and labor-intensive. Therefore, this study employs circuit simulation and backpropagation neural networks to investigate the relationship between power and efficiency in photovoltaic converters. The analysis is presented in Figure 3.
First, based on the MATLAB 2020b Simulink module, a simulation circuit was constructed. In this circuit, component parameters were set according to the loss analysis to simulate circuit losses. Subsequently, iterative parameters were configured to perform simulations, generating operational data. Finally, a BP neural network model was developed, and the obtained circuit operation data were used for training, thereby establishing a model that correlates power with efficiency.

3.3. Power Generation Prediction Model

The flowchart of the photovoltaic power prediction model based on PSO-VMD-LSTM is shown in Figure 4. Initially, a correlation analysis of relevant meteorological features is conducted to preprocess the data and obtain data samples. Subsequently, VMD is applied to decompose the photovoltaic power data, and PSO is utilized to optimize the key parameters of the VMD. Following this, LSTM models are established for each decomposed mode component to predict their respective outputs. Finally, the individual predictions are aggregated to obtain the final forecasted photovoltaic power.

4. Case Study Analysis

The case study is conducted using real-time meteorological measurements from a photovoltaic station in the Northern Hemisphere. Data were collected from 1 March to 1 June 2019, at 15 min intervals during daily operational hours (07:00–19:00).

4.1. Feature Analysis

Feature correlation analysis was conducted on measured meteorological data using Pearson correlation method, and the results are presented in Table 1.
As shown in Table 1, photovoltaic power exhibits varying degrees of correlation with meteorological features. To reduce feature dimensionality, irradiance, temperature, humidity, and wind speed were selected as input variables.

4.2. Photovoltaic Power Decomposition

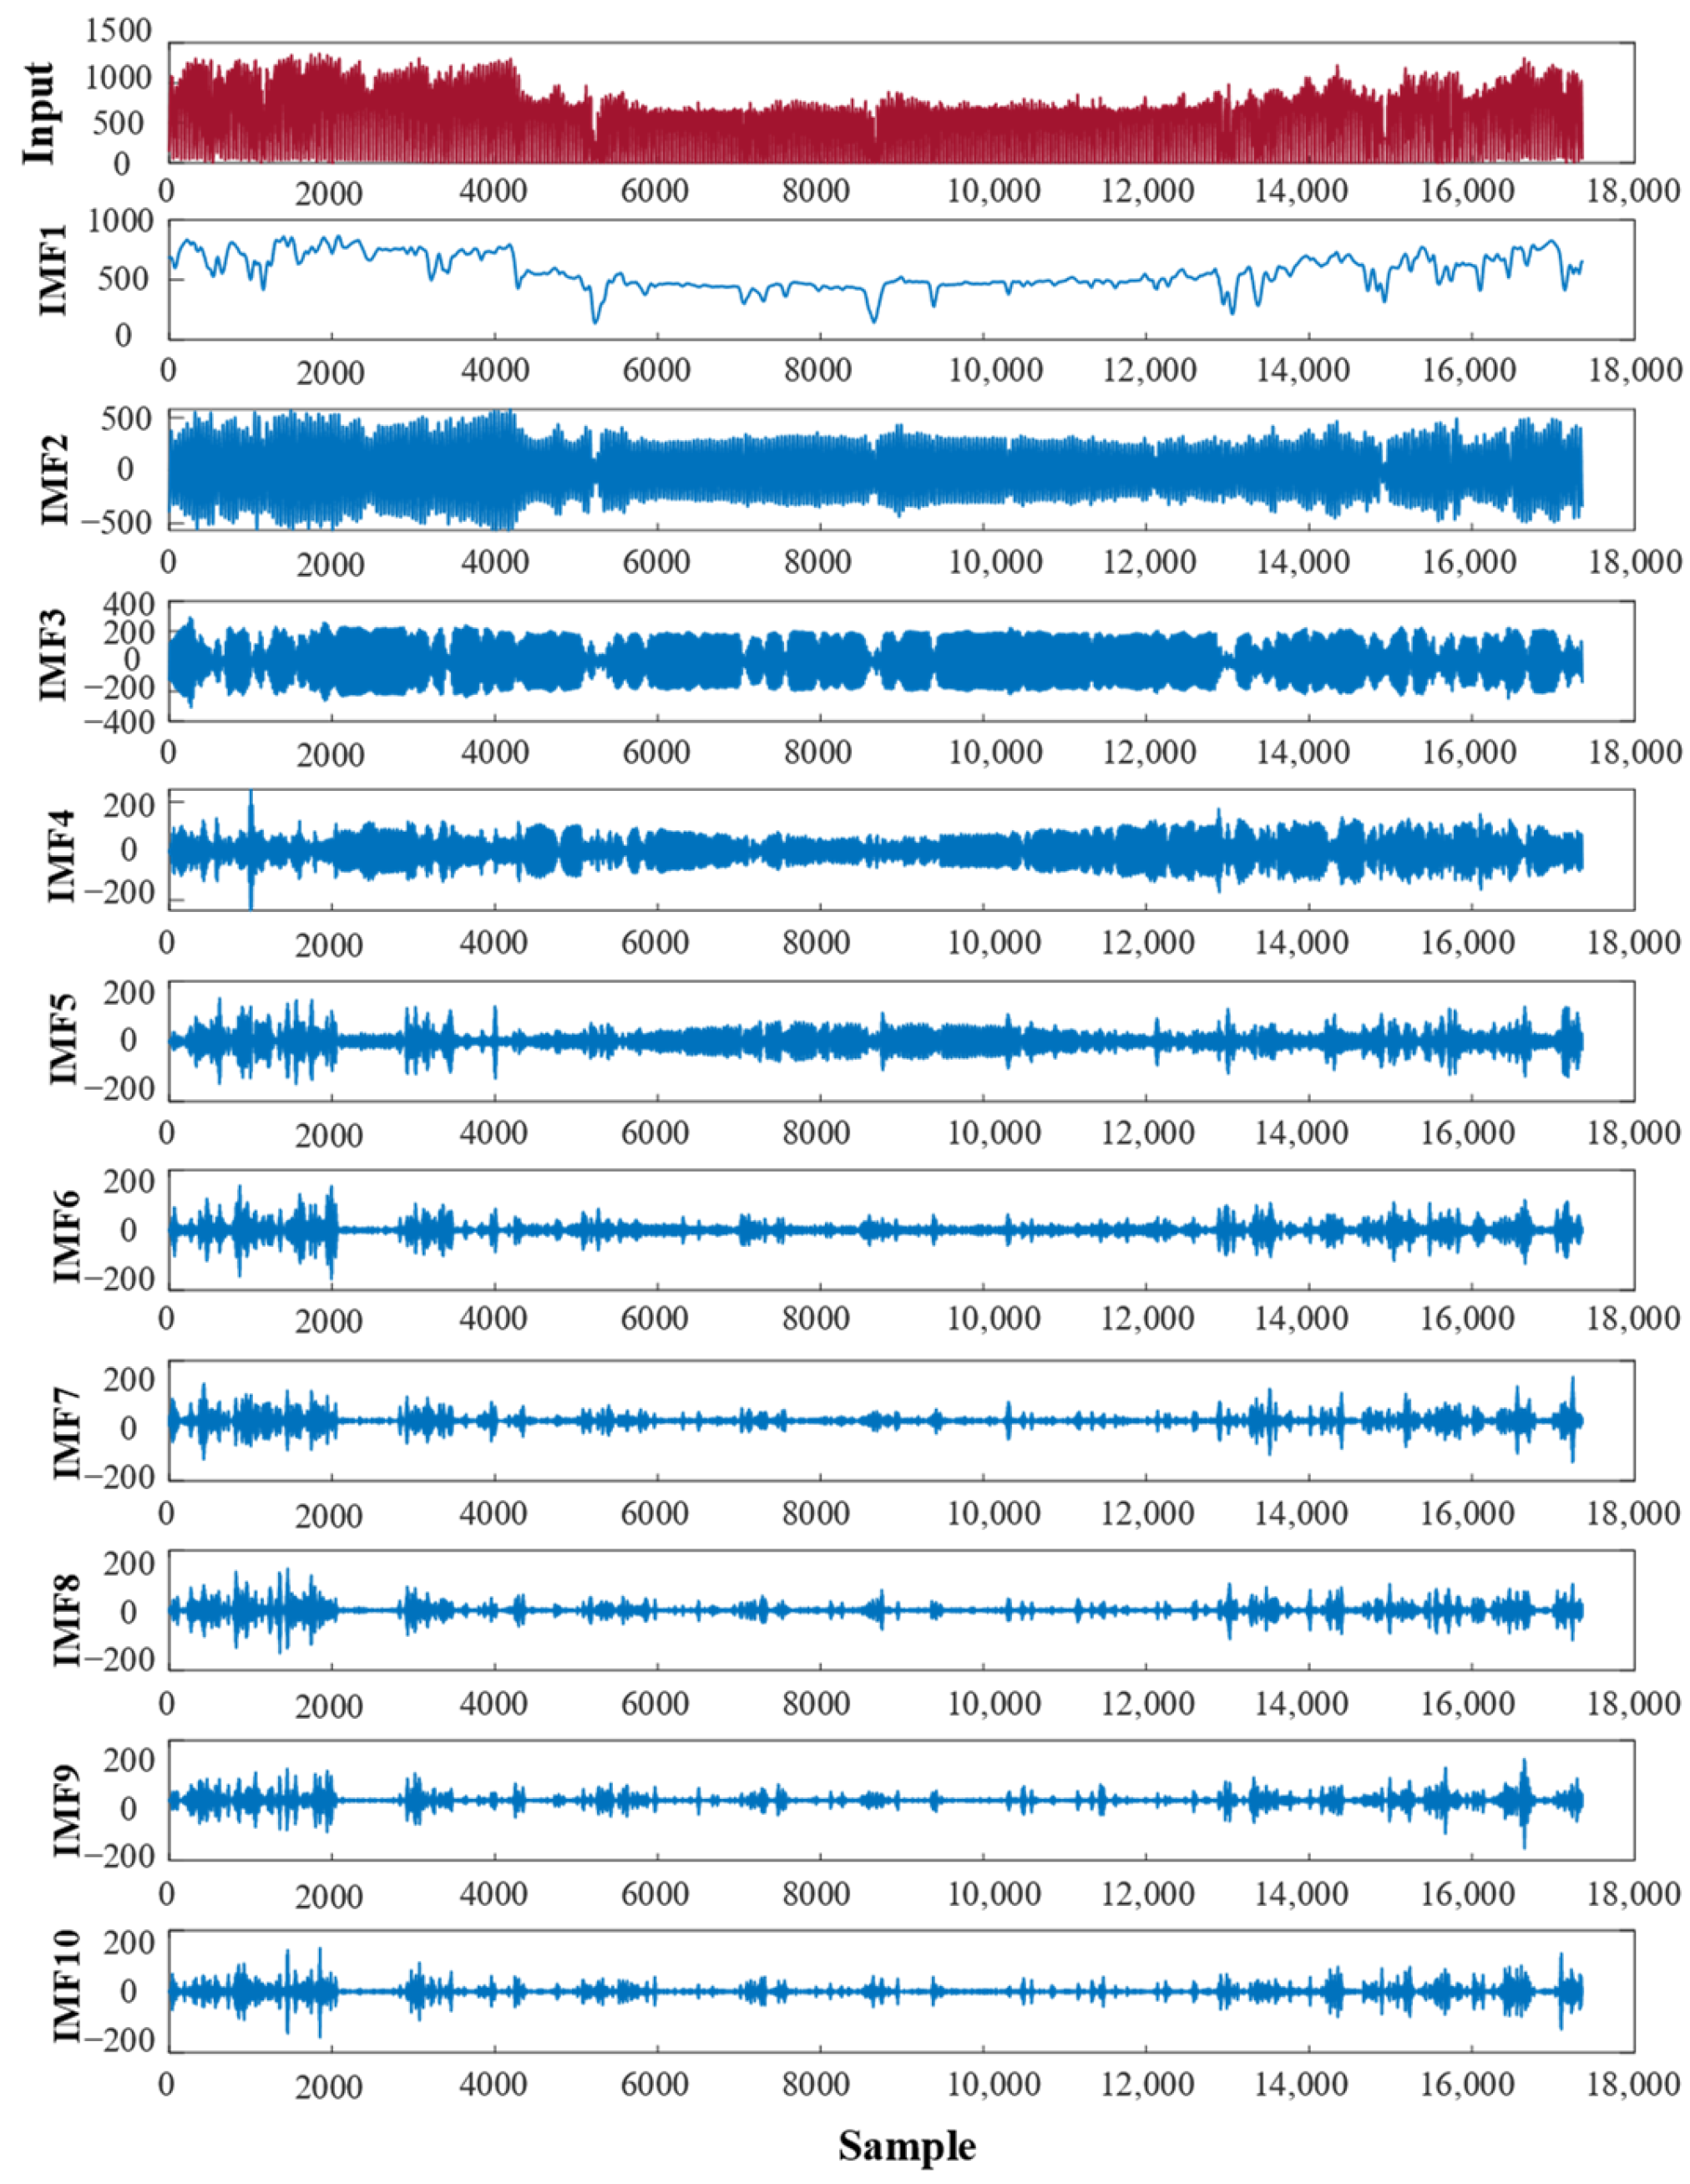
The PSO algorithm was employed to optimize the VMD parameters k and α, configuring the following settings: the minimum sample entropy was adopted as the fitness function; the swarm size was set to 30 particles; the maximum number of iterations was 30; the penalty factor α search range was set to [100, 5000]; and the IMFs number k range was [2, 15]. The optimal parameter combination was determined to be k = 10 and α = 3500.
Using photovoltaic power data as input, the PSO-VMD model decomposes the signal into intrinsic mode functions (IMFs) of varying frequency and amplitude, as shown in Figure 5. The low frequency components (IMF7–IMF10) exhibit high stability—they display small fluctuations and gradual trends, often appearing nearly constant or linearly varying. These observations confirm the effectiveness of the proposed PSO-VMD algorithm in mode decomposition.

4.3. Model Validation

To verify that the power sequences decomposed by VMD can effectively assist model training and improve prediction accuracy, and that incorporating the converter efficiency model further enhances the results, this paper employs Mean Absolute Percentage Error (MAPE), Root Mean Square Error (RMSE), and the coefficient of determination (R2) to evaluate the model performance. The corresponding expressions are given as follows:
e MAPE = 1 n i = 1 n y i y ˜ i y ˜ i × 100 %
e RMSE = 1 n i = 1 n y i y ˜ i 2
R 2 = 1 i = 1 n y i y ˜ i 2 i = 1 n y i y ¯ i 2
where n denotes the total number of samples, y i represents the actual values, y ˜ i denotes the predicted values, and y ¯ i is the mean of the actual values.
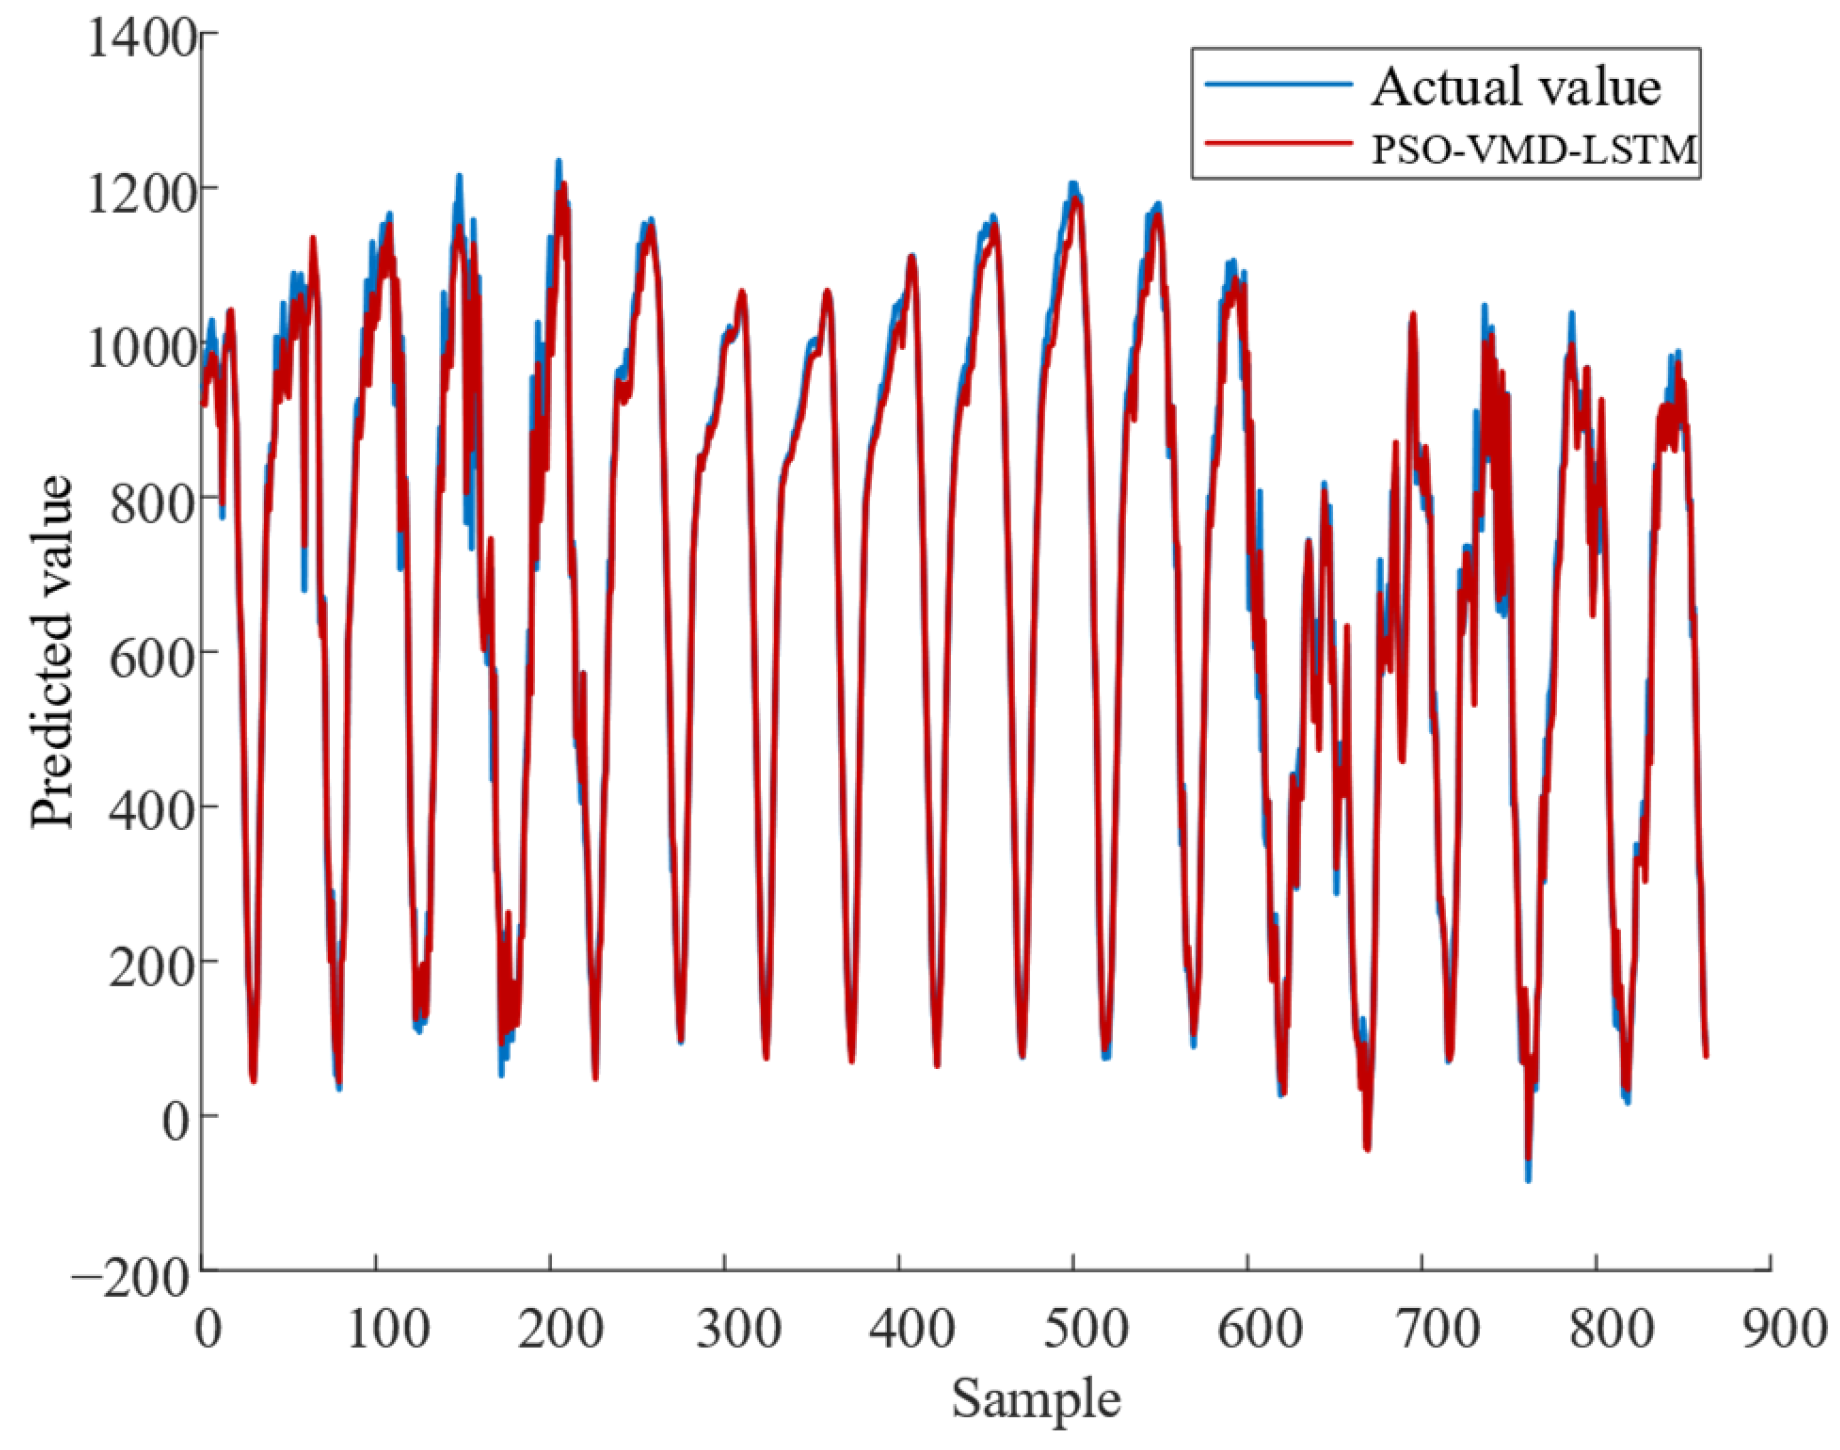
To validate the effectiveness of the proposed model, training and prediction were conducted on a photovoltaic dataset. The prediction results of the PSO-VMD-LSTM model are illustrated in Figure 6.
As shown in the figure, the predicted results closely match the actual power values, and the model demonstrates good predictive performance even in regions with significant fluctuations in the power curve. Specifically, the performance metrics of the PSO-VMD-LSTM model are as follows: MAPE of 5.94%, RMSE of 29.08, and R2 of 0.9929.
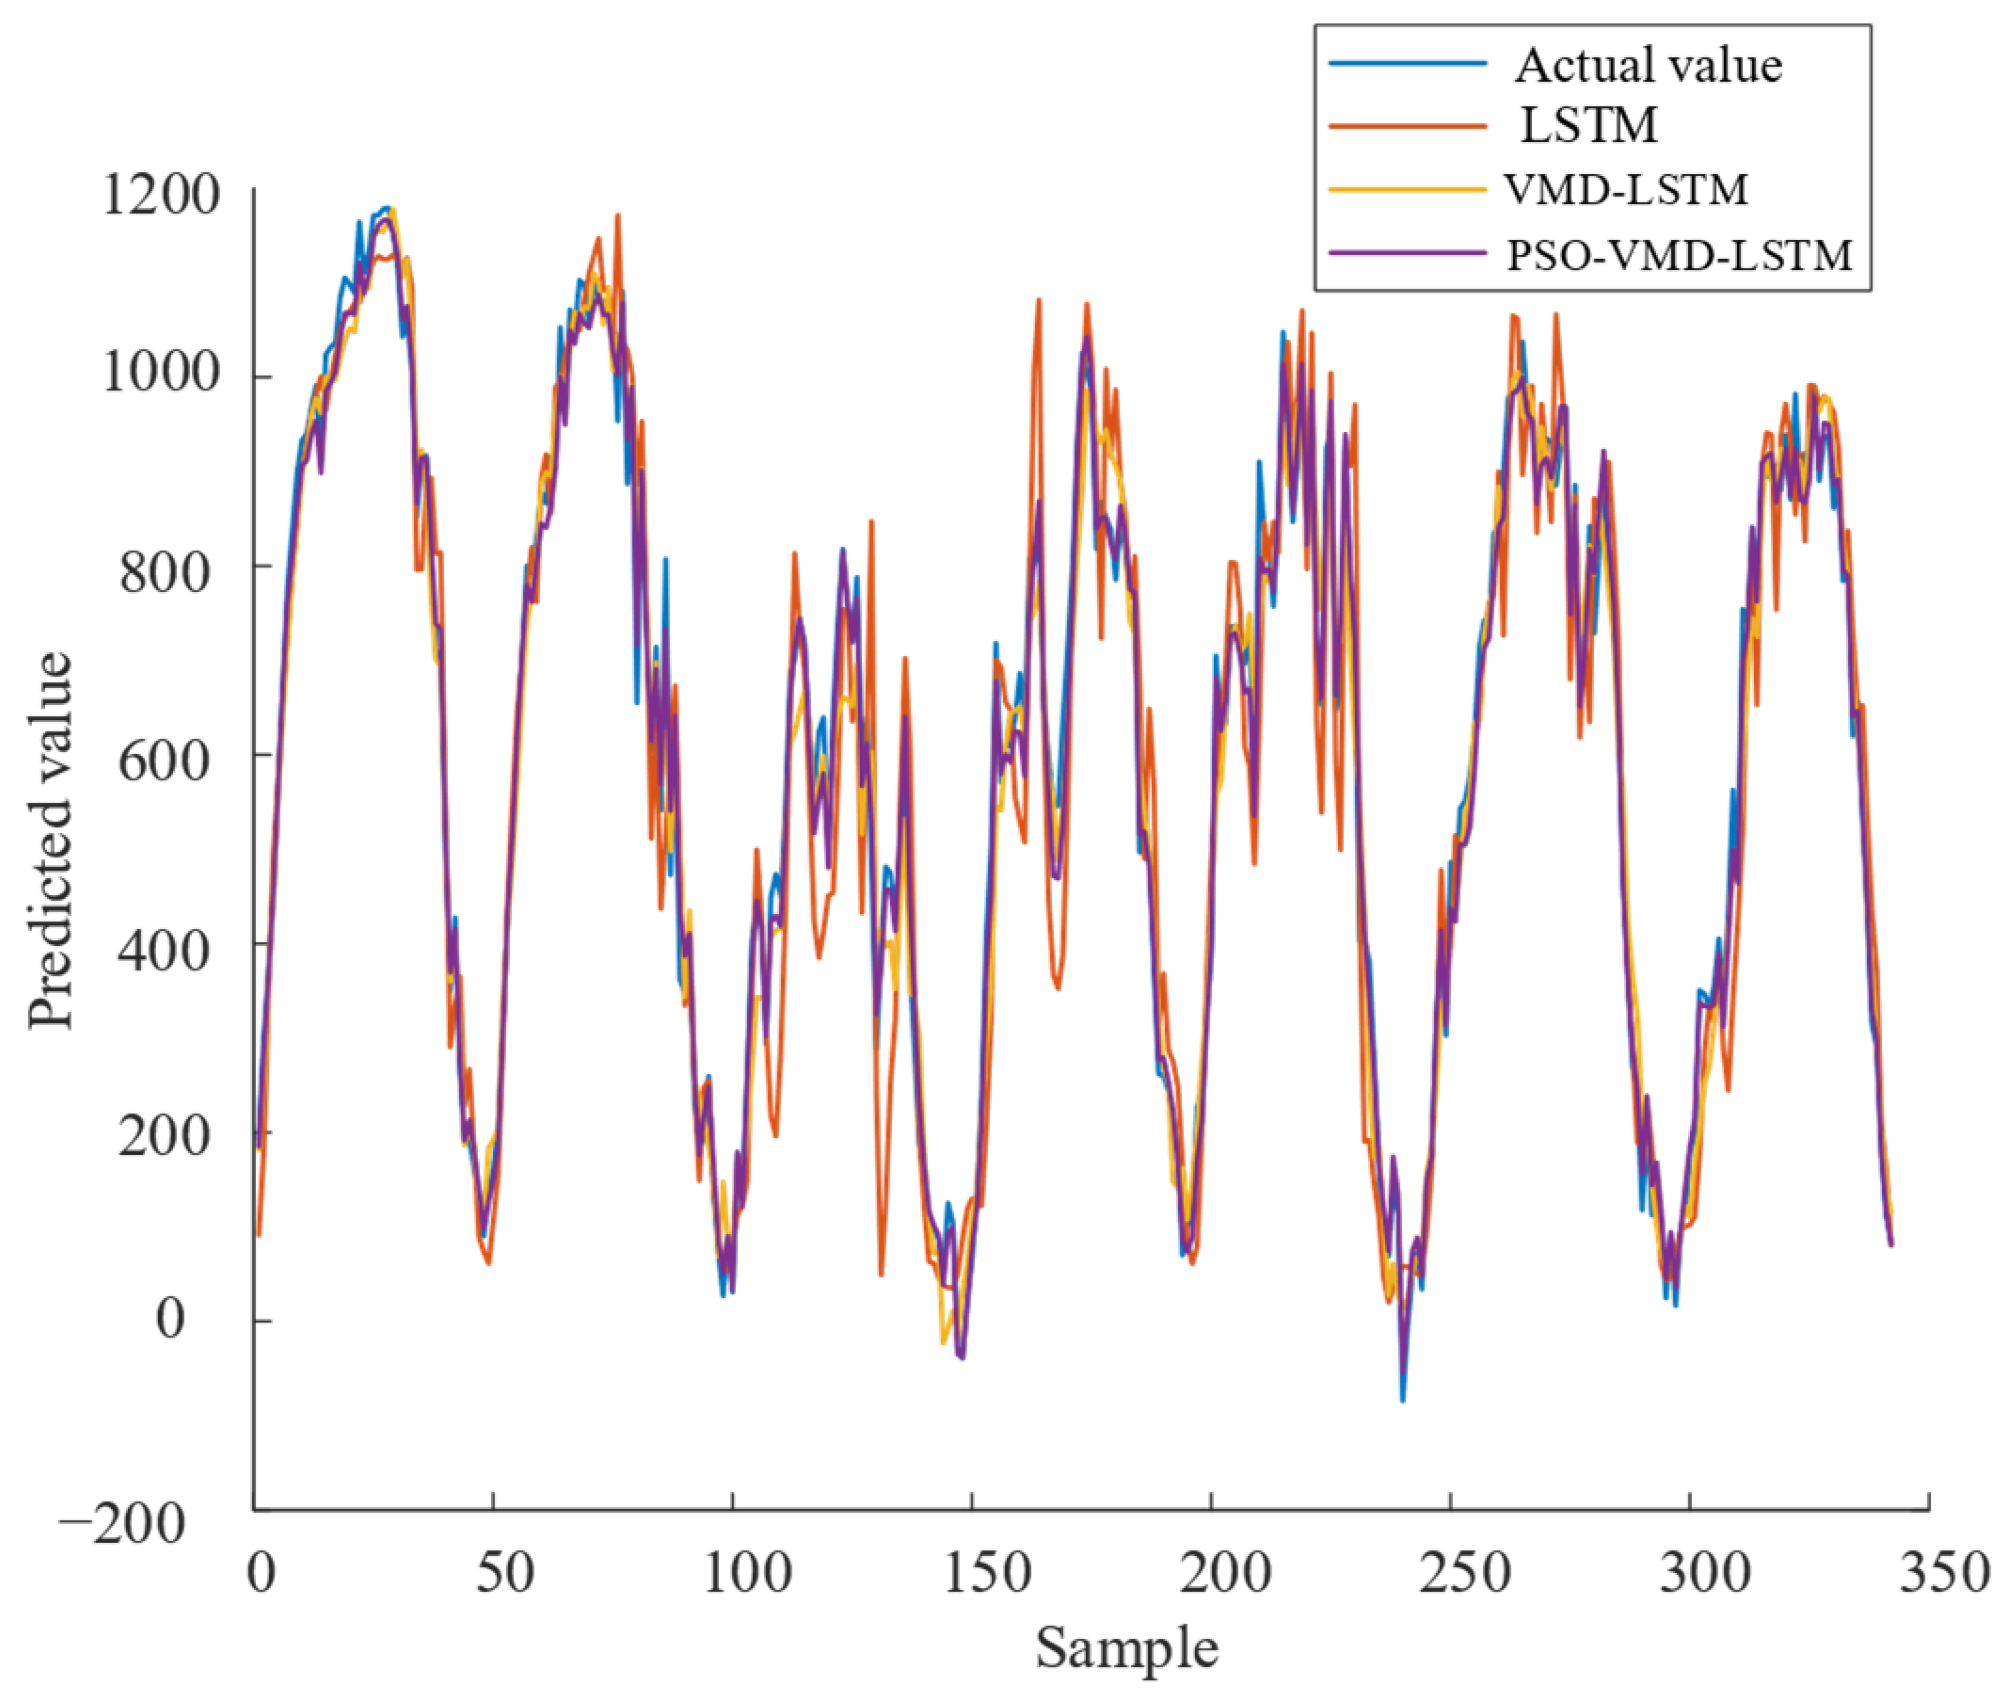
To further validate the optimization effectiveness of the proposed model on prediction results, a comparative analysis was conducted between the proposed model and the LSTM and VMD-LSTM models. All models were trained and tested using the same datasets, with identical hyperparameter settings for the LSTM model. The prediction results of the three models are presented in Figure 7.
As observed from Figure 7, the photovoltaic output power curve exhibits a regular variation trend, and all three models are generally capable of accurately tracking and predicting the power output. However, the standalone LSTM model shows larger prediction errors, particularly when there are significant fluctuations in the photovoltaic power, resulting in poor prediction performance. In contrast, models incorporating VMD demonstrate improved capability in capturing sudden changes in power and exhibit better fitting performance. Among them, the PSO-VMD-LSTM model achieves more accurate prediction curves compared to the unoptimized VMD-LSTM model.
To quantitatively analyze the effectiveness of the proposed model, the performance metrics of each model are compared, as summarized in Table 2.
As shown in the table, the PSO-VMD-LSTM model outperforms the other two models across all evaluation metrics, indicating that the proposed model achieves higher prediction accuracy.

4.4. Power Correction Considering Photovoltaic Converter Efficiency

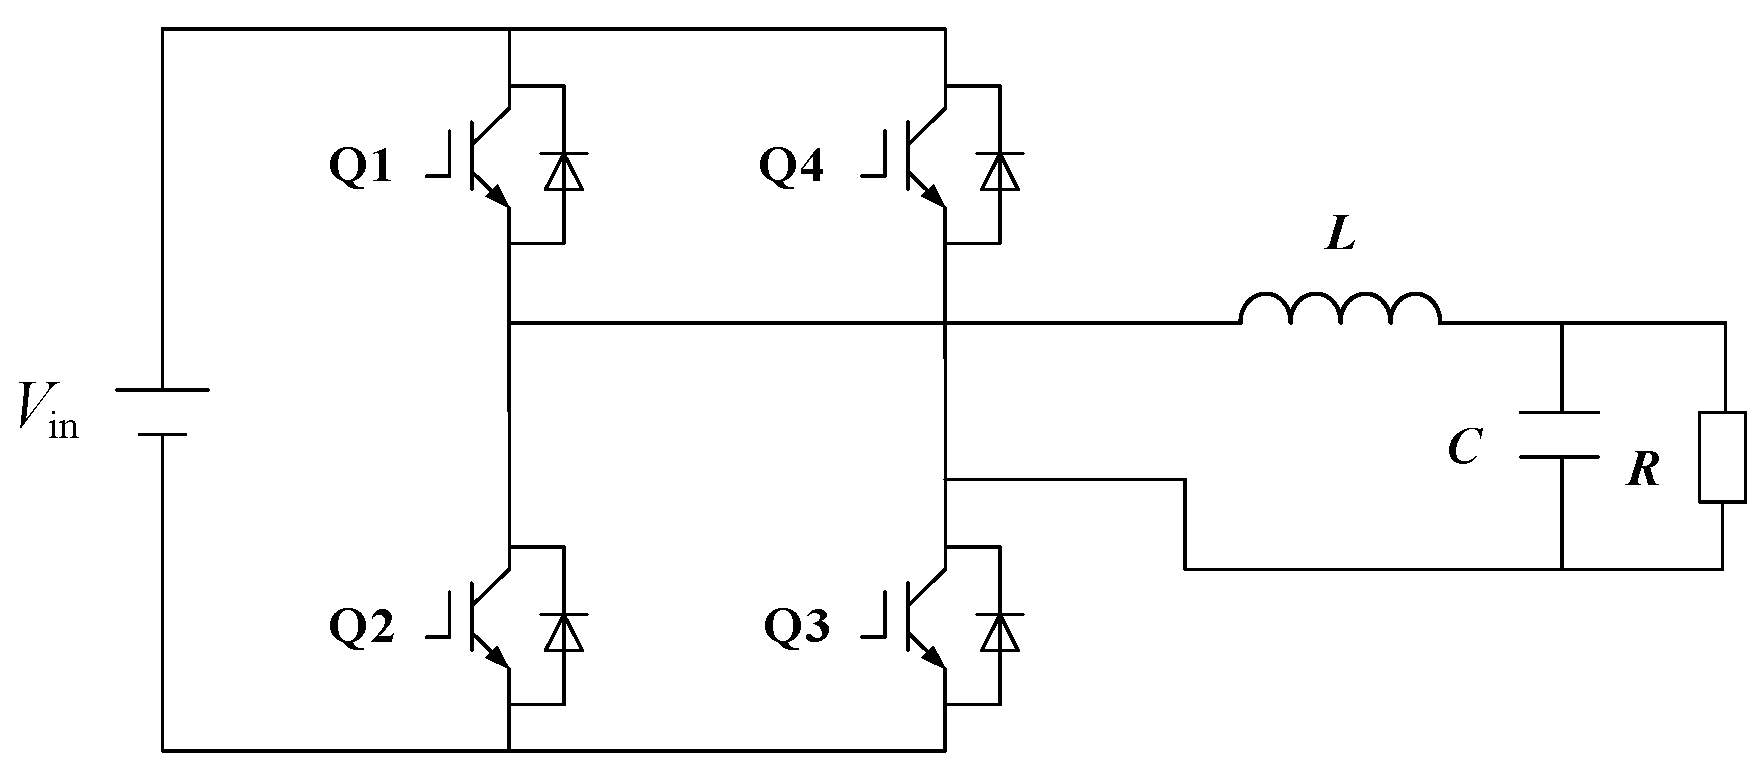
Based on the predictions from the aforementioned model, the photovoltaic generation power can be obtained. However, since the power must be converted by the PV converter thereafter, it is necessary to develop an efficiency model for the PV converter. In this study, a PV converter is constructed in the Simulink module of MATLAB. Taking a 1000 W single-phase full-bridge PV converter as an example, its topology is illustrated in Figure 8.
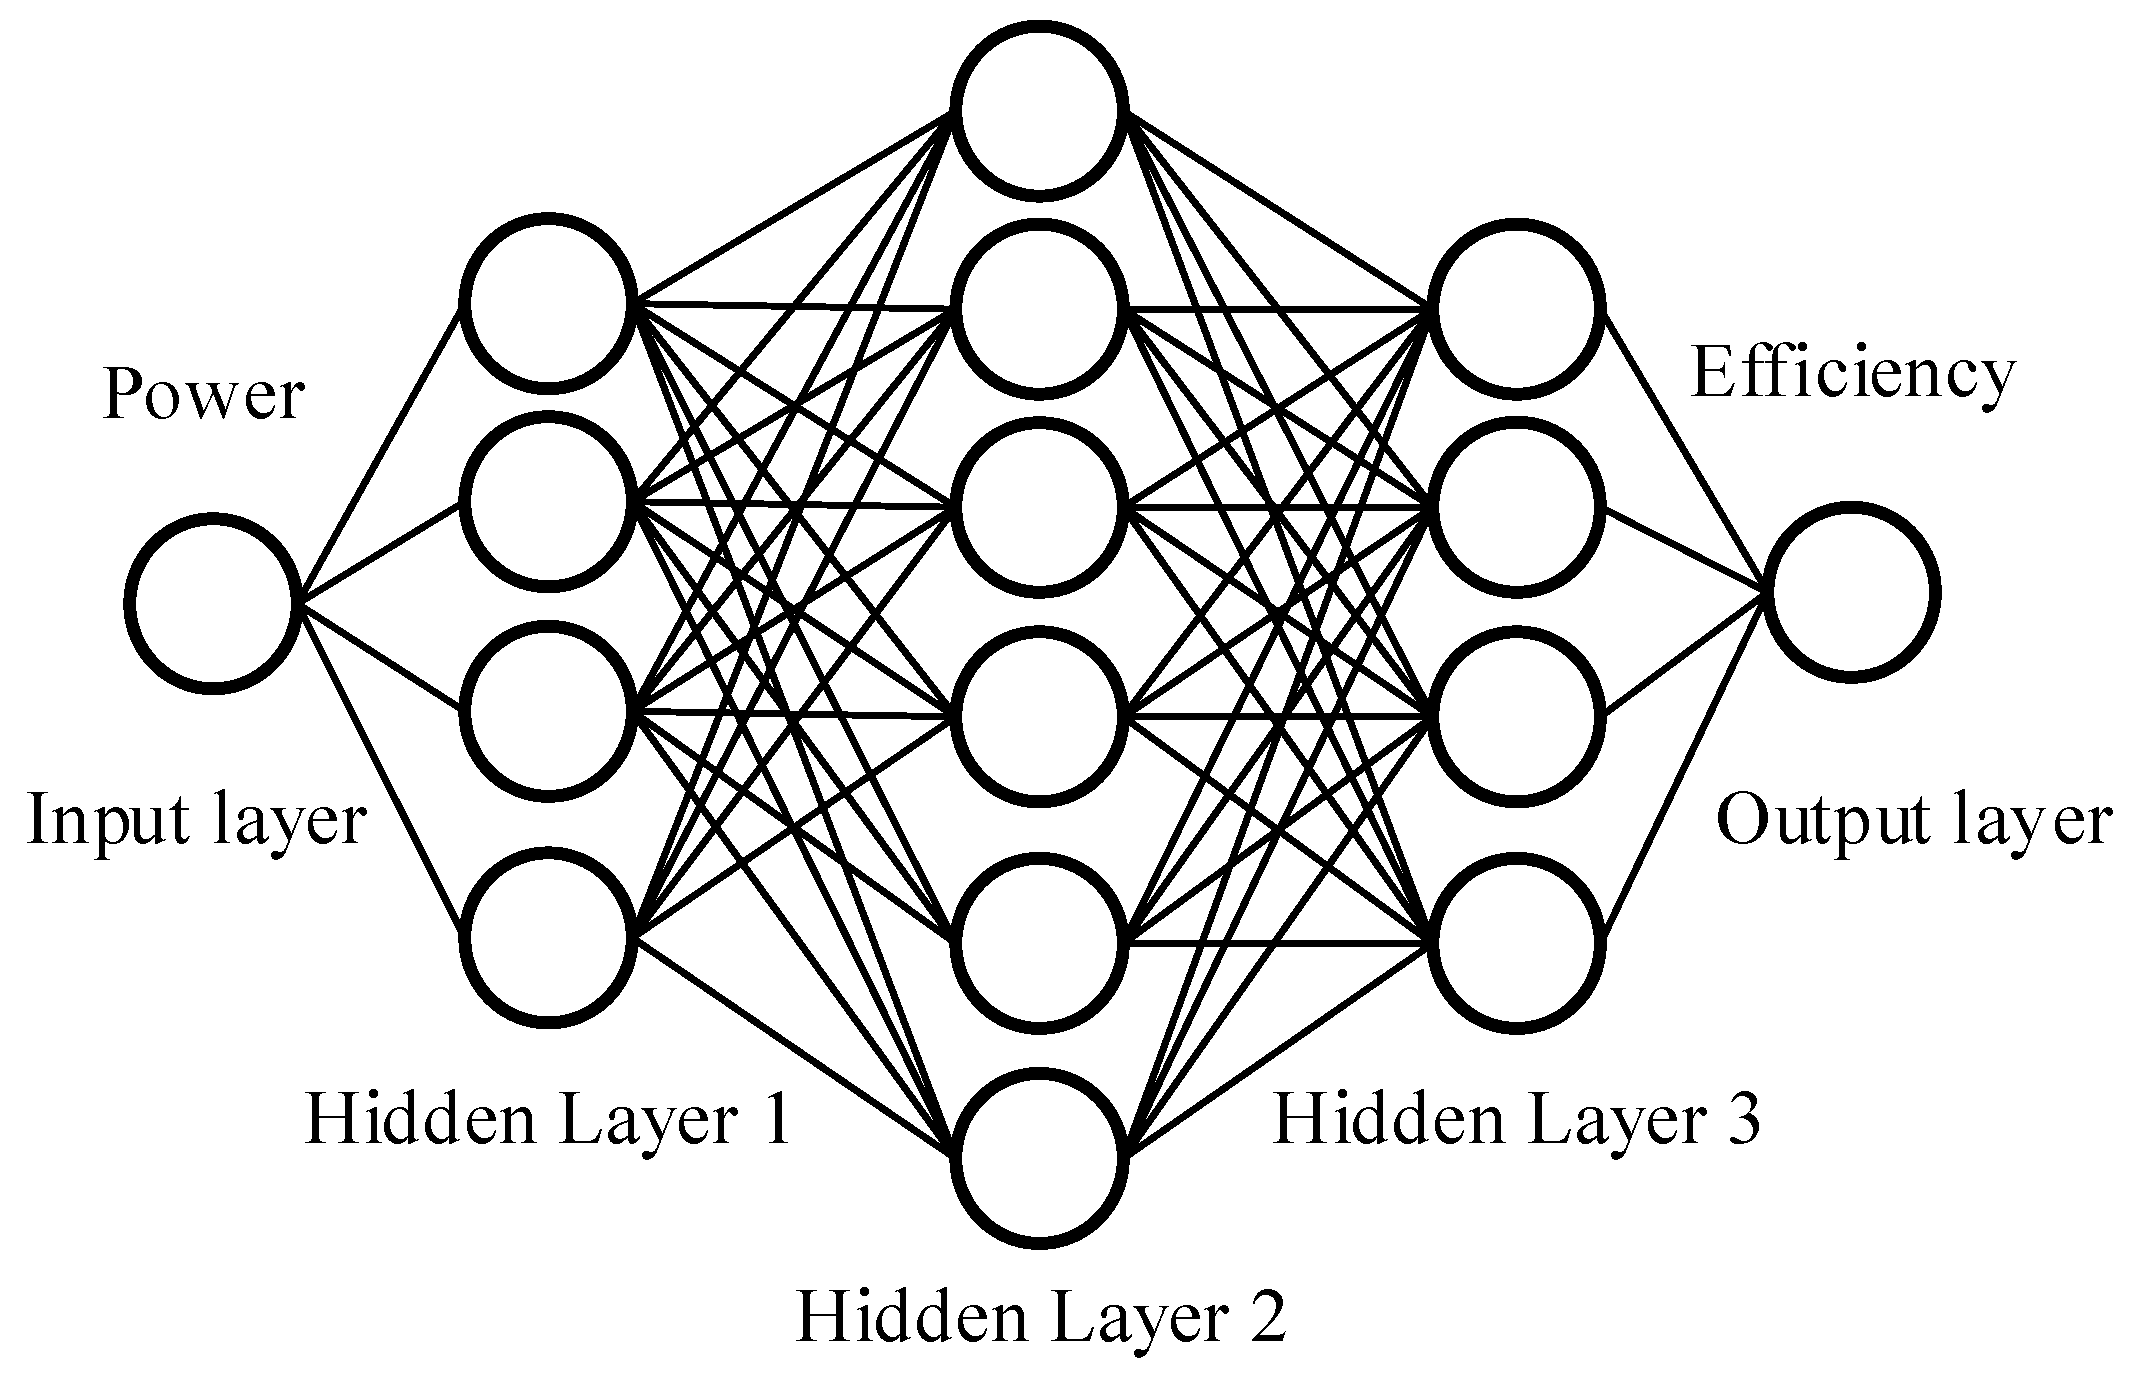
The iteration parameters were set with specified ranges and step sizes as follows: the input voltage Vin varied from 200 V to 400 V in steps of 10 V, the output voltage Vo ranged from 190 V to 250 V in steps of 10 V, the switching frequency f ranged from 10 kHz to 50 kHz in steps of 10 kHz, and the output load R ranged from 50 Ω to 500 Ω in steps of 50 Ω. This resulted in a total of 21 × 7 × 5 × 10 = 7350 samples. Power and efficiency data were obtained through simulation and used to train the backpropagation neural network, whose architecture is illustrated in Figure 9.
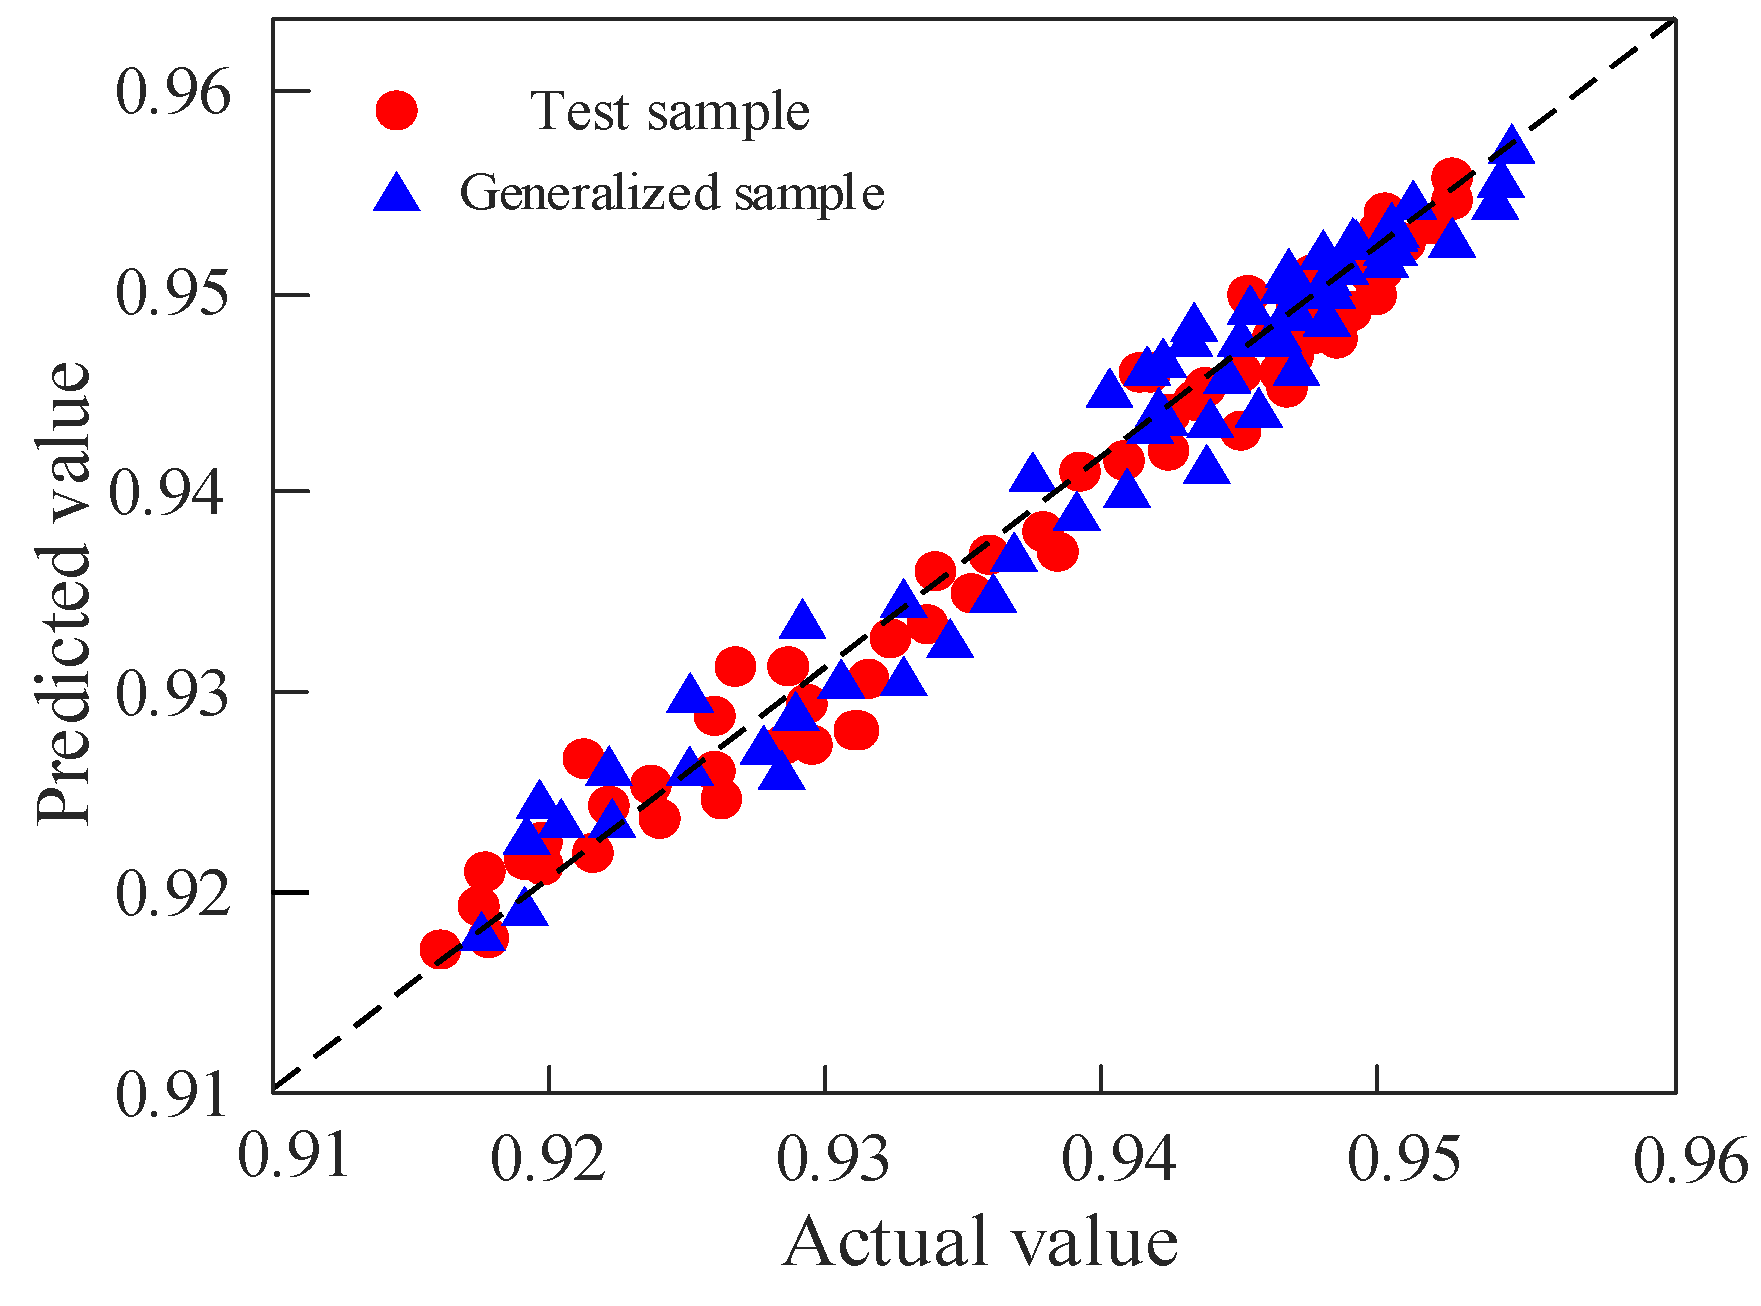
The initial learning rate was set to 0.01, and the training was conducted for 1000 epochs using a variable learning rate schedule. Specifically, the learning rate was reduced to 10% of its previous value every 500 epochs. The training results are shown in Figure 10.
As shown in Figure 10, the prediction results for both the test samples and generalization samples demonstrate satisfactory performance. Using the aforementioned evaluation metrics, the model achieved a MAPE of 0.0149%, an RMSE of 0.0005, and an R2 of 0.9817. These results indicate that the model possesses high prediction accuracy and can accurately map the relationship between the photovoltaic inverter’s power and efficiency.
By coupling the PSO-VMD-LSTM model with the photovoltaic inverter efficiency model, real-time correction of the photovoltaic power was achieved, as shown in Figure 11. Ultimately, an integrated photovoltaic power generation system encompassing both the PV modules and the inverter was constructed, which enhances the accuracy of the photovoltaic prediction model and provides more precise results for subsequent system optimization and configuration.

5. Discussion and Conclusions

High-accuracy photovoltaic power forecasting models enable power system decision-makers to formulate more detailed optimization strategies, thereby enhancing grid stability and security. This paper proposes a PV power prediction method based on a PSO-VMD-LSTM framework integrated with a photovoltaic converter efficiency model, which features the following characteristics:
(1)
To address the power losses in the PV inverter following the PV panel, the system is divided into two separate modules for modeling: the PV panel power unit and the PV inverter unit. These modules are interconnected through a power-based interface.
(2)
Pearson correlation analysis was employed to select highly relevant PV influencing factors, facilitating effective data preprocessing and mitigating the computational complexity arising from high-dimensional data. The VMD method is employed to decompose the fluctuating photovoltaic power signals, effectively reducing the complexity of the PV power data. Furthermore, the PSO algorithm is used to determine the optimal number of decomposition components, which helps prevent over-decomposition and significantly improve prediction performance.
(3)
The neural network is trained by establishing a simulation model to obtain the power loss data of the PV inverter under different operating conditions, thereby constructing its equivalent model. Using the output power of the PV panel as the input power of the inverter enables real-time correction of the PV panel’s output power, providing more accurate support for subsequent system optimization.

Author Contributions

Conceptualization, B.Z.; Methodology, C.L., F.X., H.Z. and B.Z.; Software, H.P., C.L., F.X. and H.Z.; Validation, H.P., H.Z. and B.Z.; Formal analysis, H.P.; Investigation, B.Z.; Resources, H.P. and F.X.; Data curation, H.P. and F.X.; Writing—original draft, H.P.; Writing—review & editing, C.L., H.Z. and B.Z.; Visualization, F.X. and H.Z.; Supervision, F.X. and B.Z.; Project administration, B.Z. All authors have read and agreed to the published version of the manuscript.

Funding

This work was supported in part by the Science and Technology Project of State Grid Jiangxi Electric Power Co.Ltd (5218M0250002).

Data Availability Statement

The original contributions presented in this study are included in the article. Further inquiries can be directed to the corresponding author.

Conflicts of Interest

Authors H.P., C.L., F.X. were employed by the China State Grid Yichun Electric Power Supply Company. The remaining authors declare that the research was conducted in the absence of any commercial or financial relationships that could be construed as a potential conflict of interest.

References

  1. Bae, K.Y.; Jang, H.S.; Sung, D.K. Hourly solar irradiance prediction based on support vector machine and its error analysis. IEEE Trans. Power Syst. 2017, 32, 935–945. [Google Scholar] [CrossRef]
  2. Ceci, M.; Corizzo, R.; Fumarola, F.; Malerba, D.; Rashkovska, A. Predictive modeling of PV energy production: How to set up the learning task for a better prediction? IEEE Trans. Ind. Inform. 2017, 13, 956–966. [Google Scholar] [CrossRef]
  3. Ospina, J.; Newaz, A.; Faruque, M.O. Forecasting of PV plant output using hybrid wavelet-based LSTM-DNN structure model. IET Renew. Power Gener. 2019, 13, 1087–1095. [Google Scholar] [CrossRef]
  4. Sheng, H.; Xiao, J.; Cheng, Y.; Ni, Q.; Wang, S. Short term solar power forecasting based on weighted gaussian process regression. IEEE Trans. Ind. Electron. 2018, 65, 300–308. [Google Scholar] [CrossRef]
  5. Sanjari, M.J.; Gooi, H.B. Probabilistic forecast of PV power generation based on higher order Markov chain. IEEE Trans. Power Syst. 2017, 32, 2942–2952. [Google Scholar] [CrossRef]
  6. Sharadga, H.; Hajimirza, S.; Balog, R.S. Time series forecasting of solar power generation for large-scale photovoltaic plants. Renew. Energy 2019, 150, 797–807. [Google Scholar] [CrossRef]
  7. Das, U.K.; Tey, K.S.; Seyedmahmoudian, M.; Mekhilef, S.; Idris, M.Y.; Van Deventer, W.; Horan, B.; Stojcevski, A. Forecasting of photovoltaic power generation and model optimization: A review. Renew. Sustain. Energy Rev. 2018, 81, 912–928. [Google Scholar] [CrossRef]
  8. Masseran, N.; Razali, A.; Ibrahim, K.; Latif, M. Fitting a mixture of von Mises distributions in order to model data on wind direction in Peninsular Malaysia. Energy Convers. Manag. 2013, 72, 94–102. [Google Scholar] [CrossRef]
  9. Ahmad, A.; Javaid, N.; Mateen, A.; Awais, M.; Khan, Z.A. Short-term load forecasting in smart grids: An intelligent modular approach. Energies 2019, 12, 164. [Google Scholar] [CrossRef]
  10. Kermia, M.H.; Abbes, D.; Bosche, J. Photovoltaic power prediction using a recurrent neural network RNN. In Proceedings of the 2020 6th IEEE International Energy Conference (ENERGYCon), Gammarth, Tunisia, 28 September–1 October 2020; pp. 545–549. [Google Scholar]
  11. Wang, F.; Zhen, Z.; Wang, B.; Mi, Z. Comparative Study on KNN and SVM Based Weather Classification Models for Day Ahead Short Term Solar PV Power Forecasting. Appl. Sci. 2018, 8, 28. [Google Scholar] [CrossRef]
  12. Liao, Z.; Min, W.; Li, C.; Wang, B. Photovoltaic Power Prediction Based on Irradiation Interval Distribution and Transformer-LSTM. Energies 2024, 17, 2969. [Google Scholar] [CrossRef]
  13. Wang, K.; Qi, X.; Liu, H. A comparison of day-ahead photo-voliaic power forecasting models based on deep learning neural network. Appl. Energy 2019, 251, 113315. [Google Scholar] [CrossRef]
  14. Wang, X.; Dai, J.; Liang, Y. Ultra-short-term photovoltaic power prediction model based on EMD-BiGRU. In Proceedings of the 2024 5th International Conference on Computer Engineering and Application (ICCEA), Hangzhou, China, 12–14 April 2024. [Google Scholar]
  15. Zhang, J.L.; Wang, S.Y.; Tan, Z.F.; Sun, A.L. An improved hybrid model for short term power load prediction. Energy 2023, 268, 126561. [Google Scholar] [CrossRef]
  16. Fan, X.; Wang, R.; Yang, Y.; Wang, J. Transformer–BiLSTM Fusion Neural Network for Short-Term PV Output Prediction Based on NRBO Algorithm and VMD. Appl. Sci. 2024, 14, 11991. [Google Scholar] [CrossRef]
  17. Huang, W.; Song, Q.; Huang, Y. Two-Stage Short-Term Power Load Forecasting Based on SSA–VMD and Feature Selection. Appl. Sci. 2023, 13, 6845. [Google Scholar] [CrossRef]
  18. Xiong, S.; Nie, C.; Lu, Y.; Zheng, J. Research on Price Prediction of Construction Materials Based on VMD-SSA-LSTM. Appl. Sci. 2025, 15, 2005. [Google Scholar] [CrossRef]
  19. Soltani, N.Y.; Nasiri, A. Chance-Constrained Optimization of Energy Storage Capacity for Microgrids. IEEE Trans. Smart Grid 2020, 11, 2760–2770. [Google Scholar] [CrossRef]
  20. Carrasco, J.M.; Franquelo, L.G.; Bialasiewicz, J.T.; Galvan, E.; PortilloGuisado, R.; Prats, M.A.M.; Leon, J.I.; Moreno-Alfonso, N. Power-Electronic Systems for the Grid Integration of Renewable Energy Sources: A Survey. IEEE Trans. Ind. Electron. 2006, 53, 1002–1016. [Google Scholar] [CrossRef]
  21. Agrawal, M.; Mishra, M.; Kushwah, S.P.S. Association rules optimization using improved PSO algorithm. In Proceedings of the 2015 International Conference on Communication Networks (ICCN), Gwalior, India, 19–21 November 2015; pp. 395–398. [Google Scholar]
  22. Zhu, B.; Wang, H.; Zhang, Y.; Chen, S. Buck-Based Active-Clamp Circuit for Current-Fed Isolated DC–DC Converters. IEEE Trans. Power Electron. 2022, 37, 4337–4345. [Google Scholar] [CrossRef]
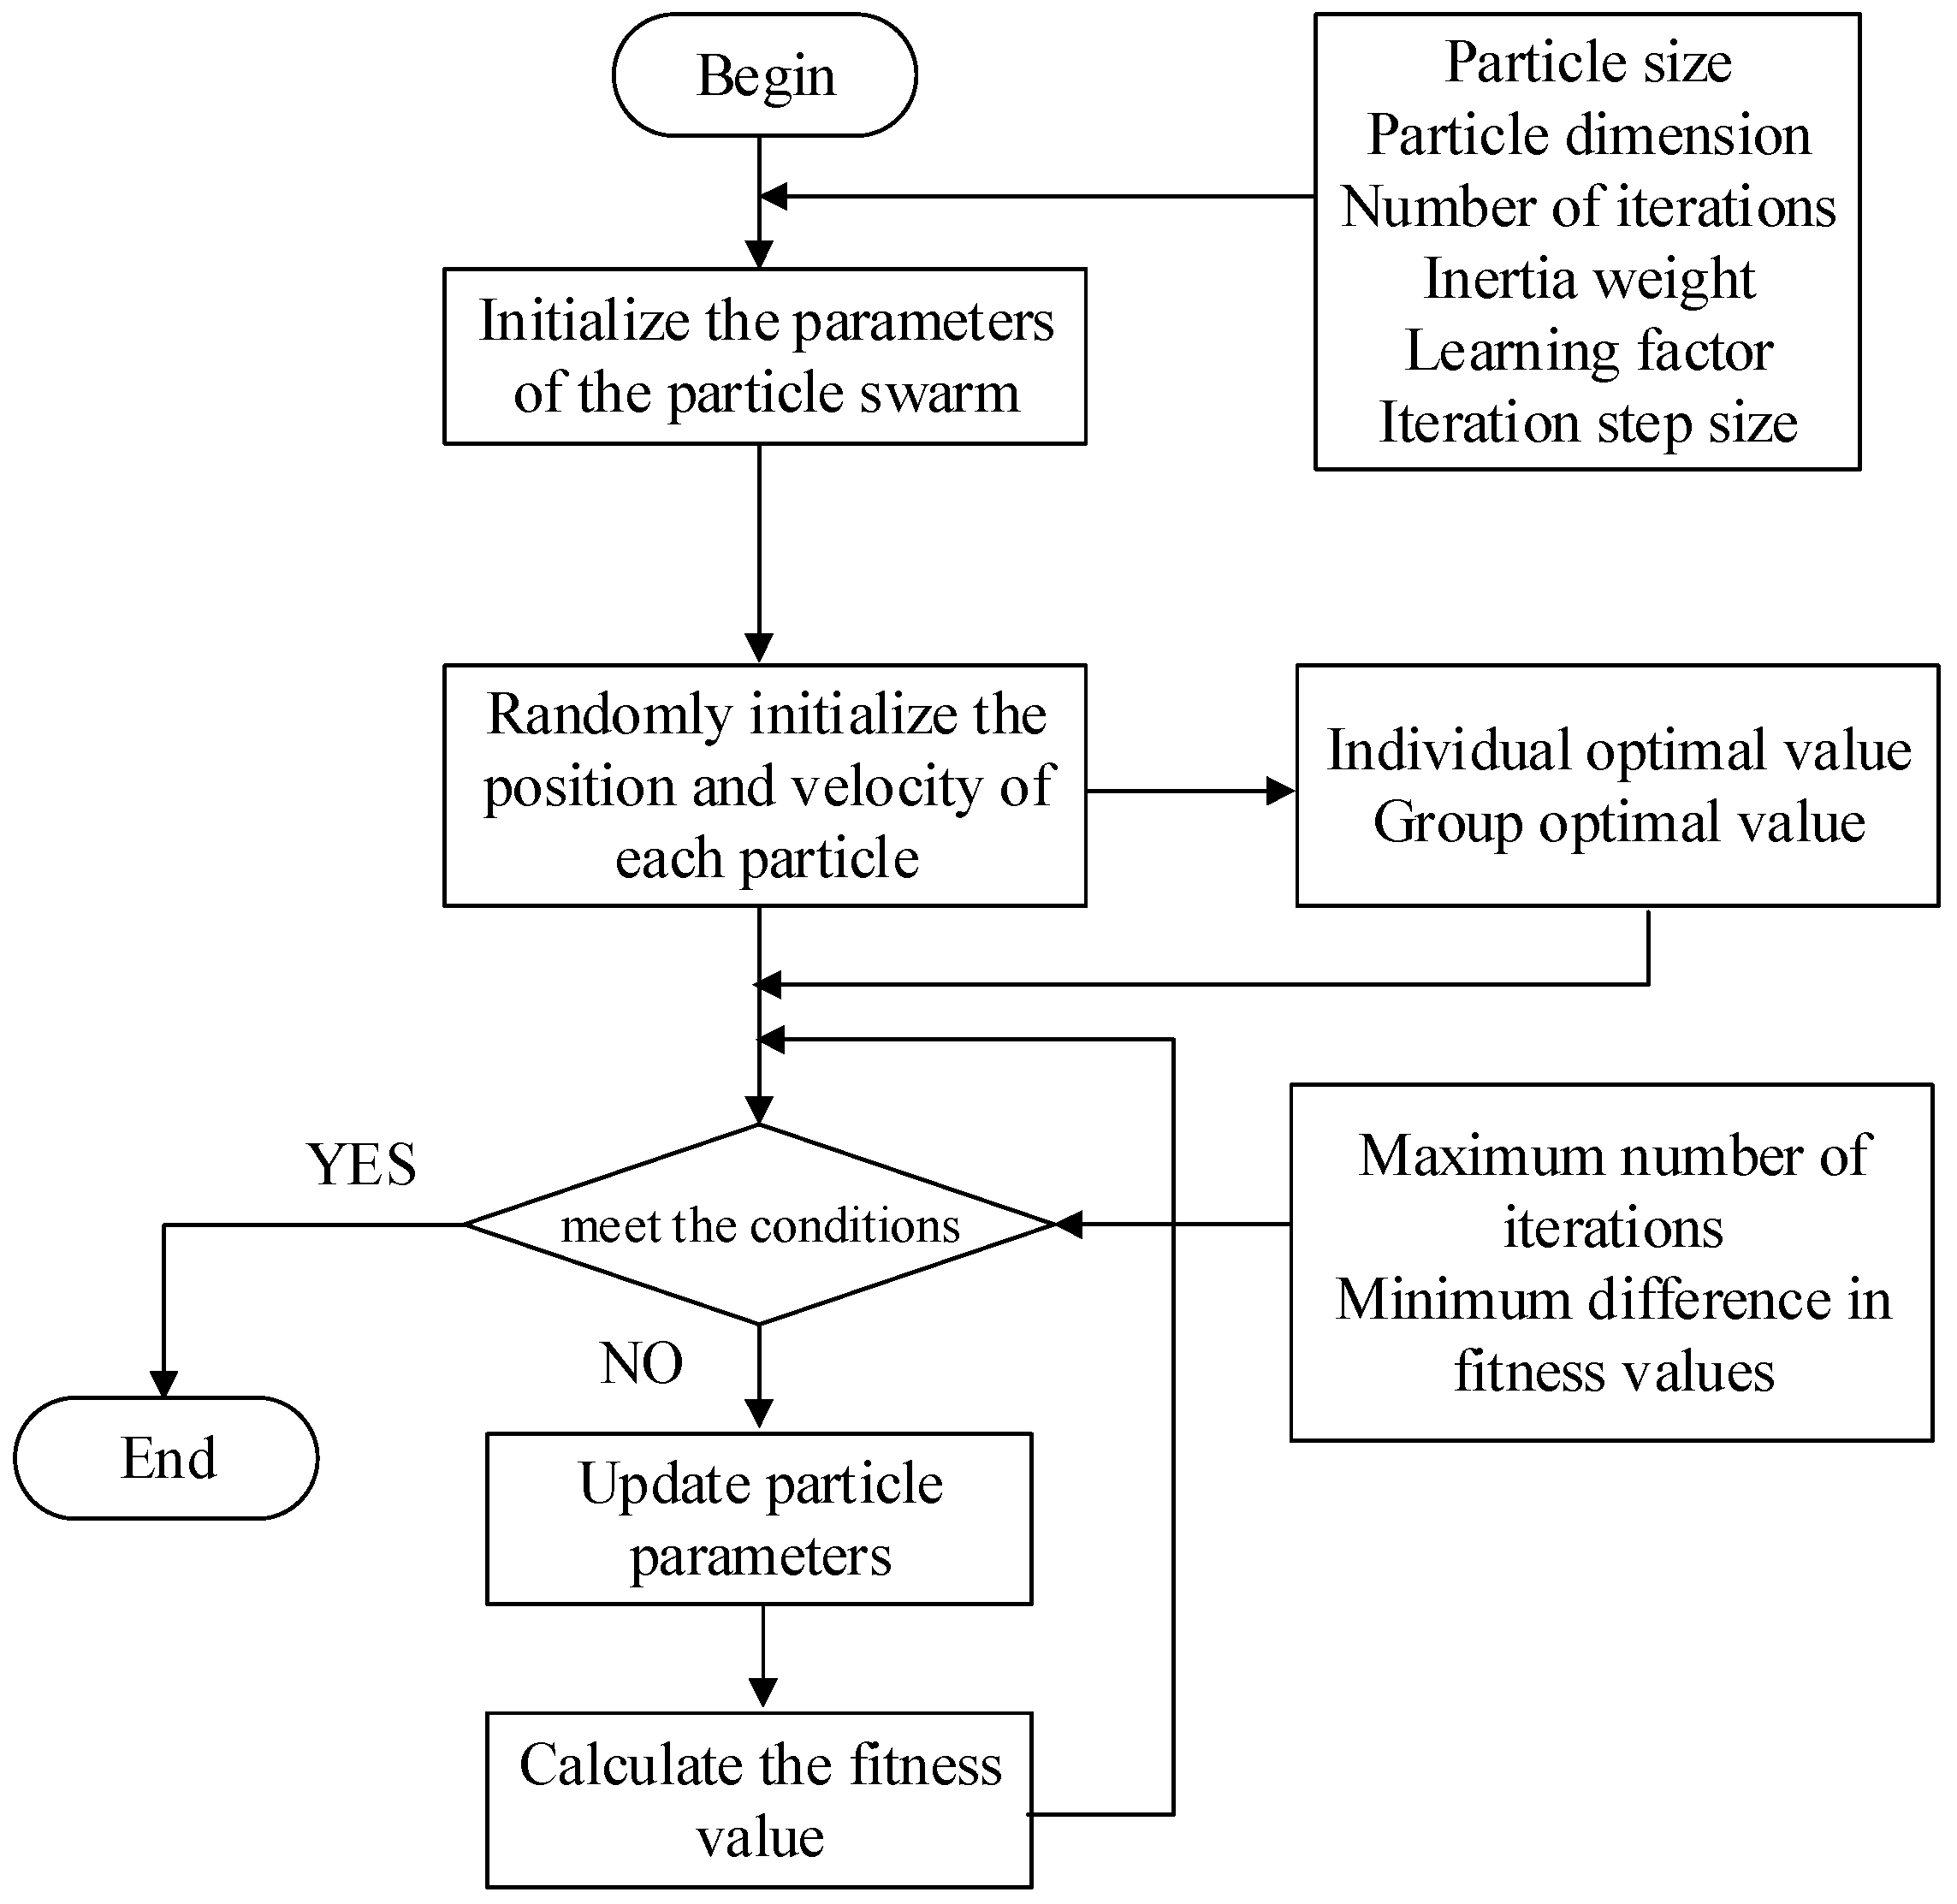
Figure 1. Optimization process of the PSO algorithm.
Applsci 15 10612 g001
Figure 2. LSTM structure.
Applsci 15 10612 g002
Figure 3. Development framework for photovoltaic converter efficiency modeling.
Applsci 15 10612 g003
Figure 4. The construction process of the photovoltaic power prediction model.
Applsci 15 10612 g004
Figure 5. The VMD result of photovoltaic power.
Applsci 15 10612 g005
Figure 6. The prediction results of the PSO-VMD-LSTM model.
Applsci 15 10612 g006
Figure 7. The prediction results of the three models.
Applsci 15 10612 g007
Figure 8. Single-phase full-bridge inverter circuit.
Applsci 15 10612 g008
Figure 9. BP neural network structure.
Applsci 15 10612 g009
Figure 10. Efficiency prediction results.
Applsci 15 10612 g010
Figure 11. Photovoltaic power correction result.
Applsci 15 10612 g011
Table 1. Correlation coefficient of meteorological characteristics.
Meteorological
Characteristics
Correlation Coefficient
Temperature0.25
Wind speed−0.18
Wind direction−0.07
Pressure−0.04
Irradiance0.96
Humidity−0.52
Table 2. Three model performance indicators.
MAPERMSER2
LSTM27.36%99.330.9222
VMD-LSTM9.80%34.090.9891
PSO-VMD-LSTM7.55%29.280.9919
Disclaimer/Publisher’s Note: The statements, opinions and data contained in all publications are solely those of the individual author(s) and contributor(s) and not of MDPI and/or the editor(s). MDPI and/or the editor(s) disclaim responsibility for any injury to people or property resulting from any ideas, methods, instructions or products referred to in the content.