Article

Hydrocarbon-Bearing Hydrothermal Fluid Migration Adjacent to the Top of the Overpressure Zone in the Qiongdongnan Basin, South China Sea

1
CNOOC Energy Technology & Services Oil Field Engineering Research institute, Drilling & Production Zhanjiang, Zhanjiang 524057, China
2
Guangdong Province Key Laboratory of Exploration and Development of the South China Sea Complex Oil and Gas Reservoirs, Zhanjiang 524057, China
3
School of Geosciences, Yangtze University, Wuhan 430100, China
*
Author to whom correspondence should be addressed.
Appl. Sci. 2025, 15(19), 10587; https://doi.org/10.3390/app151910587
Submission received: 17 August 2025 / Revised: 20 September 2025 / Accepted: 21 September 2025 / Published: 30 September 2025
(This article belongs to the Special Issue Advances in Petroleum Exploration and Application)

Abstract

The Qiongdongnan Basin constitutes a sedimentary basin characterized by elevated temperatures, significant overpressures, and abundant hydrocarbons. Investigations within this basin have identified hydrothermal fluid movements linked to overpressure conditions, comprising two vertically separated overpressured intervals. The shallow overpressure compartment is principally caused by a combination of undercompaction and clay diagenesis. In contrast, the deeper high-pressure compartment results from hydrocarbon gas generation. Numerical pressure modeling indicates late-stage (post-5 Ma) development of significant overpressure within the deep compartment. It is proposed that accelerated subsidence in the Pliocene-Quaternary initiated substantial gas generation, thereby promoting the formation of the deep overpressured system. Multiple organic maturation parameters, combined with fluid inclusion microthermometry, reveal a thermal anomaly adjacent to the upper boundary of the deep overpressured zone. This anomaly indicates vertical transport of hydrothermal fluids ascending from the underlying high-pressure zone. Laser Raman spectroscopy confirms the presence of both hydrocarbons and carbon dioxide within these migrating fluids. Integration of fluid inclusion thermometry with burial history modeling constrains the timing of hydrocarbon-carrying fluid charge to the interval from 4.2 Ma onward, synchronous with modeled peak gas generation and a phase of pronounced overpressure buildup. We propose that upon exceeding the fracture gradient threshold, fluid pressure triggered upward migration of deeply sourced, hydrocarbon-enriched fluids through hydrofracturing pathways. This process led to localized dissolution and fracturing near the top of the deep overpressured system, while simultaneously facilitating significant hydrocarbon accumulation and forming preferential accumulation zones. These findings provide critical insights into petroleum exploration in overpressured sedimentary basins.

1. Introduction

Geofluids are dynamic and distinct components within the crustal medium. They play a critical role as transport agents for a wide range of elements, materials, and energy during diagenesis and mineralization processes [1]. In sedimentary basins, hydrothermal fluids—comprising magmatic waters, hot brines, hydrocarbons, and CO2—are prevalent. These fluids convey anomalous heat and undergo large-scale migration, convergence, and circulation via pre-existing or tectonically generated permeable conduits, primarily fault systems and highly permeable strata [2]. Such hydrothermal activity significantly influences the thermal evolution of source rocks in hydrocarbon-bearing basins [3]. Notably, pronounced thermal anomalies are often linked to active magmatism [4]. Hydrothermal fluids are especially active in rift basins, where tectonic extension drives extensive convective heat circulation. Certain hot fluid flow regimes also manifest distinctive modes, such as salt or mud diapirism [5]. These structures typically penetrate overlying strata, facilitating substantial vertical fluid migration; such diapir-associated flow is readily identifiable on seismic profiles.
In petroleum systems, hydrocarbon migration and accumulation mechanisms differ substantially between overpressured and normally pressured regimes [6]. In hydrostatically pressured basins, hydrocarbons migrate upward primarily by buoyancy through connected pore spaces and fracture networks, eventually accumulating in traps. In contrast, overpressured systems exhibit more complex fluid dynamic behaviors. Overpressure not only drives fluid flow but also promotes the development of conductive pathways—such as hydraulic fractures and reactivated faults—thereby enabling cross-stratal hydrocarbon migration [7]. Extreme overpressure may additionally cause seal failure, resulting in fracture propagation and even surface seepage. As a consequence, migration pathways in overpressured conditions are often highly heterogeneous and challenging to predict. Moreover, during drilling operations, encountering unexpected overpressured zones increases the risk of incidents, such as kicks and blowouts.
Understanding overpressured fluid flow behaviors is critical for hydrocarbon exploration strategy, as well as for ensuring drilling safety and reducing exploration risks. This study presents a novel case exemplifying a hydrocarbon-bearing hydrothermal fluid flow pattern driven by overpressure release. The Qiongdongnan Basin, located in the South China Sea, is characterized by high temperature and high pressure. Under such a unique thermobaric environment, the basin exhibits highly complex reservoir development. We document a specific case within this basin, illustrating the upward expulsion of hydrothermal fluids triggered by the rupture of a deeply buried overpressured compartment. Crucially, this flow pattern is distinct from conventional mechanisms associated with tectonic activity or diapirism. Instead, it is initiated by overpressure, which reduces effective stress, thus leading to shear or tensile fracturing of caprocks. These expelled hydrothermal fluids also carry hydrocarbons, offering significant insights into hydrocarbon migration and accumulation processes. The proposed model may be applicable to other regions within the South China Sea and similar overpressured petroliferous basins worldwide.

2. Geological Setting

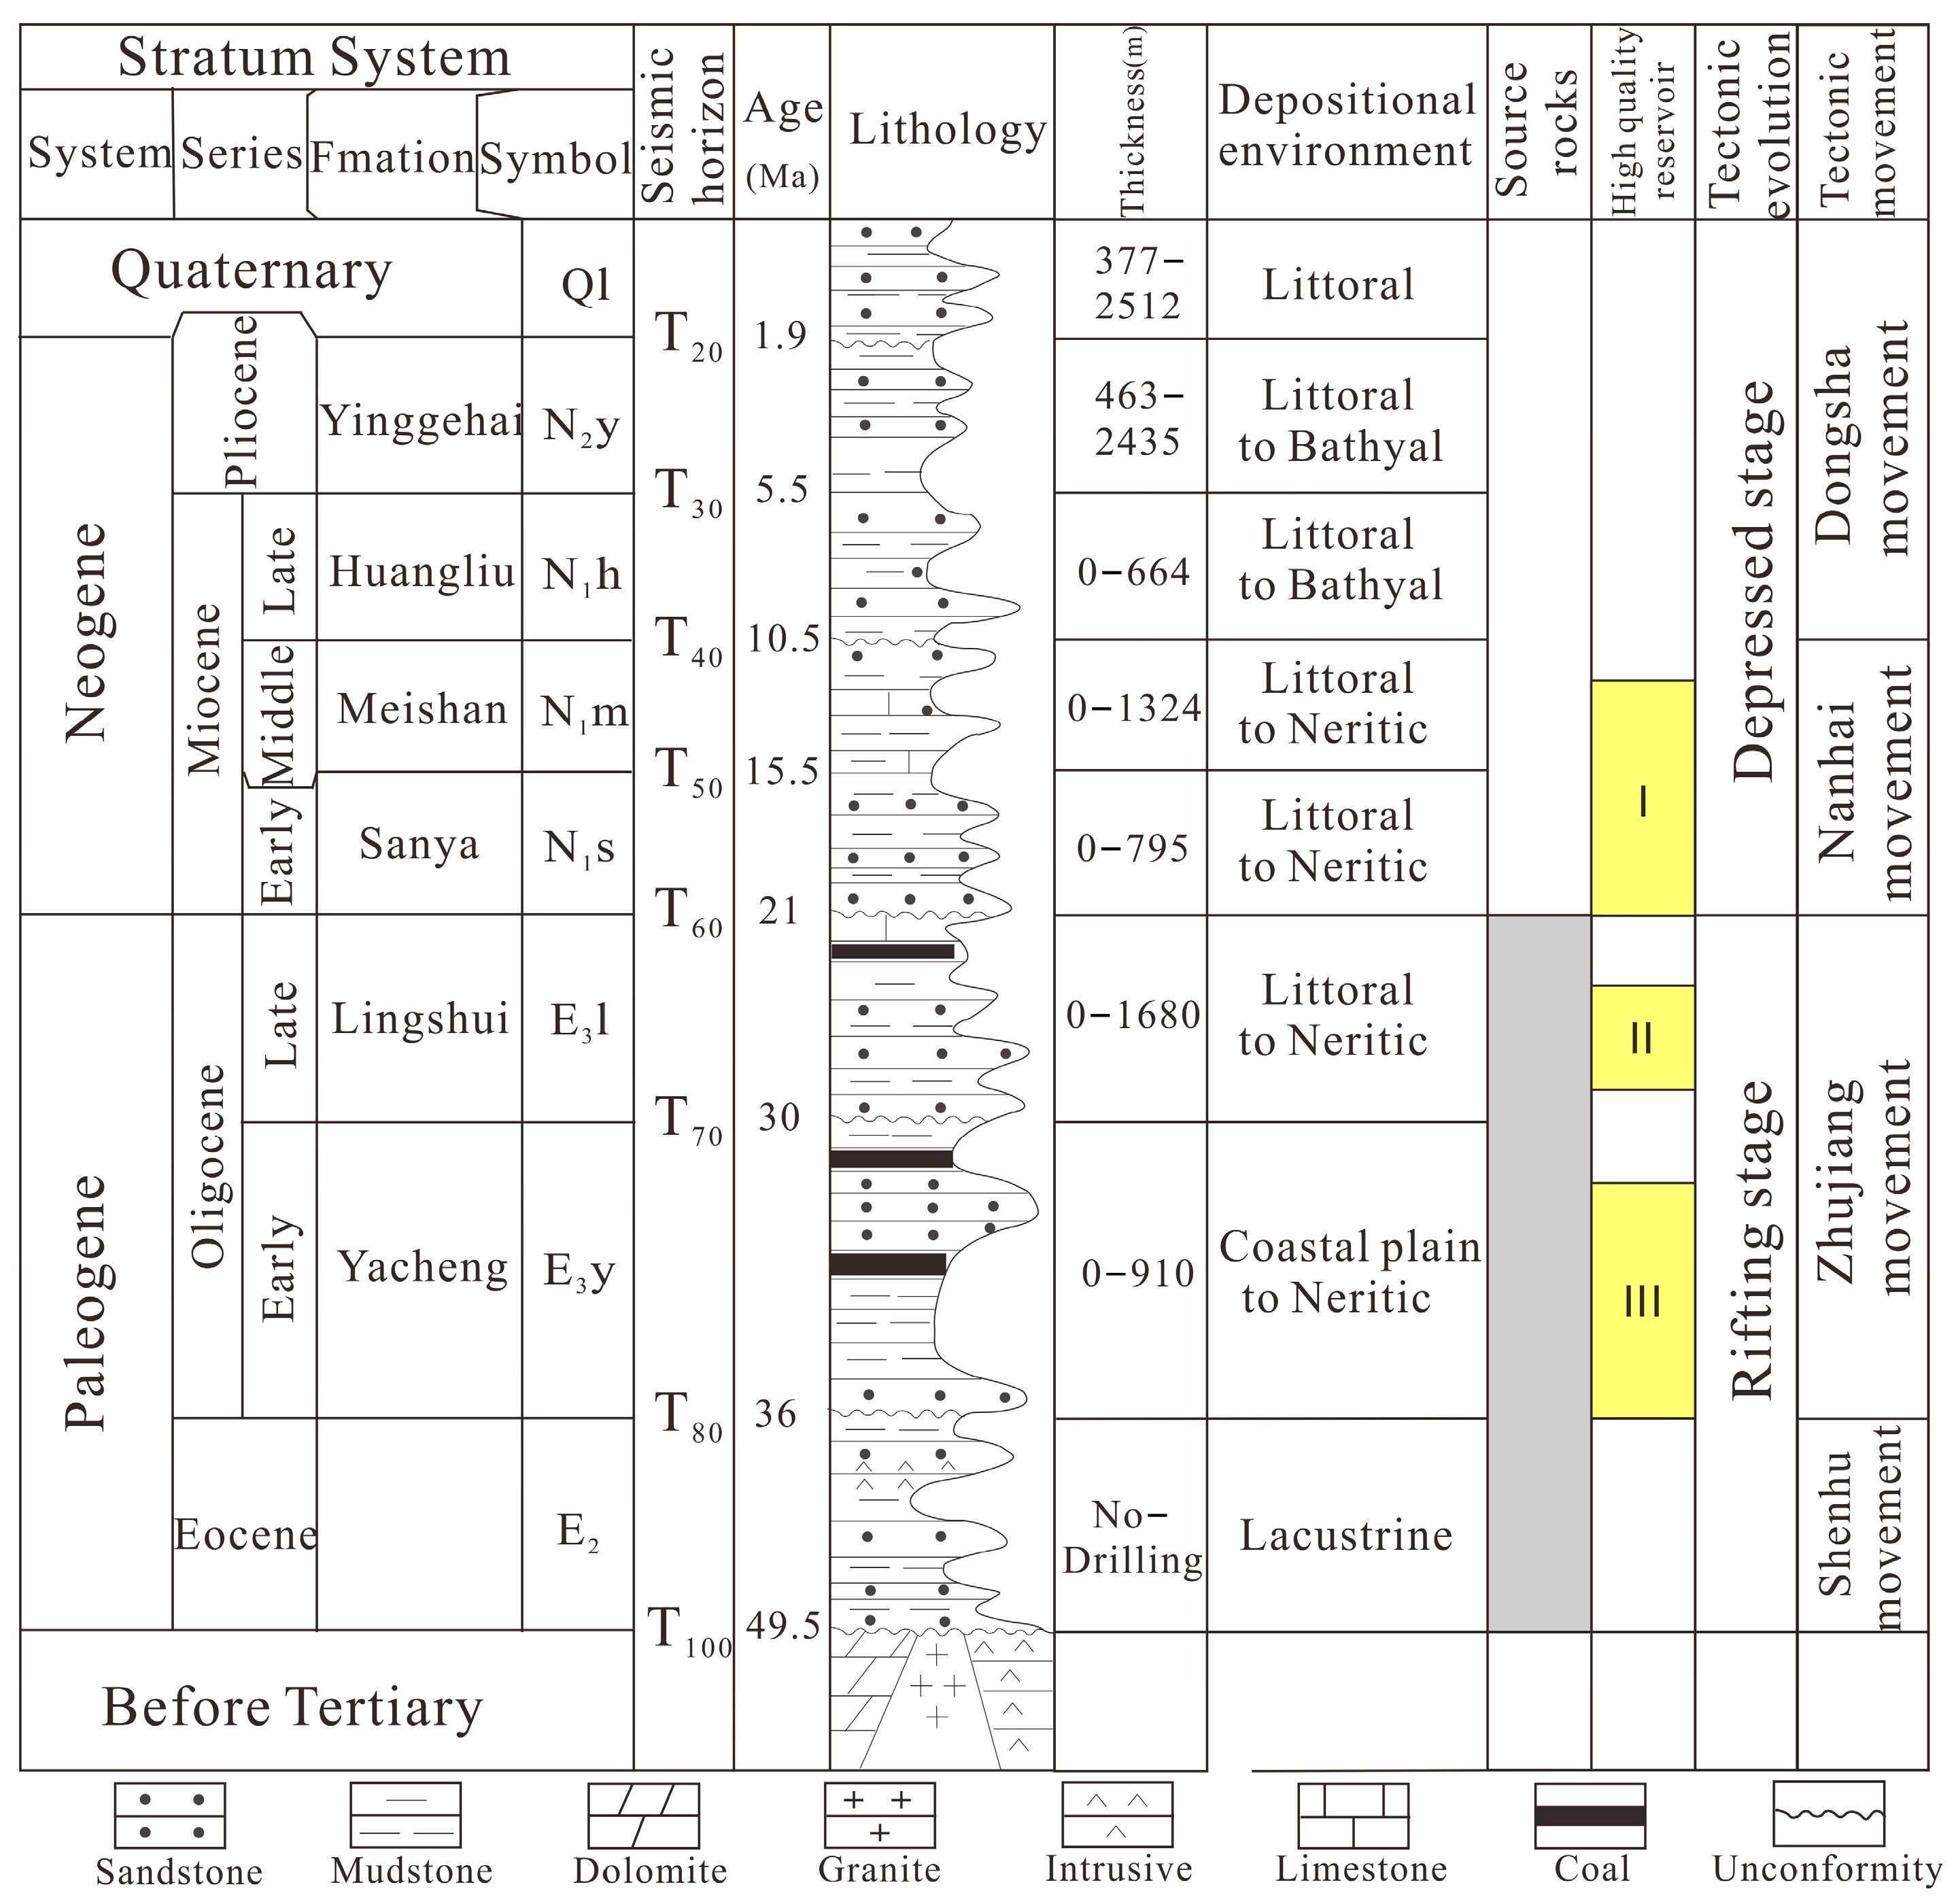
Located along the northwestern continental margin of the South China Sea (Figure 1A,B), the Qiongdongnan Basin ranks among China’s most promising offshore basins hosting significant gas reserves [8]. It is geographically bounded by the Shenhu Uplift to the east, which separates it from the Pearl River Mouth Basin. To the west, it is adjacent to the Yinggehai Basin along the No. 1 Fault. Hainan Island lies to the north, and the Xisha Islands are located to the south. Encompassing approximately 6.3 × 10⁴ km2, the basin’s depocenter occupies continental slope to deep-water settings. Water depths gradually increase from west-northwest (WNW) to east-southeast (ESE). Multiple regional events occurred, including the Shenhu, Zhujiang, Nanhai, and Dongsha movements (Figure 2). This evolutionary history comprises three distinct stages [9,10]: (1) the Late Cretaceous-Paleocene rifting characterized by extensional faulting and graben development; (2) the Eocene-Middle Miocene post-rift thermal subsidence marked by regional subsidence and marine deposition; and (3) the Late Miocene-Quaternary neotectonics featuring differential subsidence, fault reactivation, and localized inversion structures. Neotectonic activity critically controls hydrocarbon accumulation through two principal mechanisms. First, accelerated subsidence facilitated the thermal maturation of Eocene-Oligocene source rocks (Yacheng and Lingshui formations) to peak hydrocarbon generation thresholds. Second, the consequent deposition of thick marine mudstones (Yinggehai Formation) established effective regional seals for underlying reservoirs.
The basin’s stratigraphic succession is mainly composed of Cenozoic siliciclastic rocks (Figure 2). The Yacheng Formation was deposited in a marine-continental transitional setting during late rifting stage. It consists predominantly of conglomerate-bearing coarse sandstone, coarse sandstone, medium sandstone, mudstone, carbonaceous mudstone, and coal measures. The coal seams and carbonaceous mudstones—formed in tidal flat peat flats, braided river delta plain peat swamps, and fan delta plain peat swamps—constitute the primary gas source rocks. These coal-measure source rocks exhibit high organic matter abundance (mudstone: TOC 0.8–1.2%, S1 + S2 ~9 mg/g; coal seams: TOC ~42.62%, S1 + S2 ~87.56 mg/g). They are dominated by Type III kerogens [11] and have reached high to post-maturity stages. The Lingshui Formation contains thin, spatially restricted coal-bearing strata representing secondary source rocks. These strata were deposited primarily in littoral-shallow marine environments, with local transitional facies. They contain Type III gas-prone kerogen, with TOC values ranging from 0.5 to 1.0% and S1 + S2 values between 1.6 and 11 mg/g. Miocene marine mudstones (Sanya, Meishan, Huangliu Formations) generally show low organic matter abundance, indicating limited gas-generative potential. The Yacheng Formation hosts braided river delta and fan delta sand bodies as its dominant reservoir facies. Delta-front subaqueous distributary channel sandstones characterize the third member of the Lingshui Formation, while littoral-shallow marine sand bars and beach-bar sandstones typify the Sanya Formation. Collectively, these sandstone units constitute effective hydrocarbon gas reservoirs. The study primarily focuses on the peripheral structural area of the Yanan Sag in the western basin (Figure 1C).

3. Materials and Methods

Well logs, lithology, and measured pore pressure and temperature data as well as organic geochemical data including TOC content, vitrinite reflectance (%Ro), Rock-Eval pyrolysis data were provided by the CNOOC.
We analyzed fluid inclusions in polished thin sections derived from periclinal Yanan Sag sandstones. Inclusion petrography was conducted using a Nikon 80I dual-channel fluorescence microscope (Nikon Corporation, Tokyo, Japan). Microthermometry was performed on a Linkam TH600 heating-cooling stage (Linkam Scientific Instruments, Redhill, UK). The stage was calibrated against the following standards the melting point of carbon dioxide (−56.6 °C), the melting point of ice (0 °C), and the critical homogenization temperature of pure water (374.1 °C). The thermal cycling method was used to determine the homogenization (Th) and final ice melting (Tm) temperatures of fluid inclusions. The measurement precision is ±1 °C for Th and ±0.1 °C for Tm. Inclusions that show textural indications of poor sealing or necking down were excluded from microthermometric measurements. To avoid freezing-induced leakage, Th measurements were conducted prior to Tm in each measurement cycle. Salinities were calculated from Tm values using the equation of Bodnar (1993) [12].
Compositional analysis of fluid inclusions was conducted using a Renishaw InVia Qontor laser Raman spectrometer (Renishaw plc, New Mills, UK) equipped with a 532 nm Ar+ ion laser source. The vapour bubble within the aqueous inclusions and vapour phase in gas inclusions were focused by the Laser beam to obtain Raman spectra that can determine various components on the basis of Raman symmetric stretching peak position.
Using PetroMod 1-D software (Version 2012), a one-dimensional burial history-thermal history simulation was conducted. The burial history model was constructed using the backstripping method. Input parameters included the stratigraphic age framework, stratigraphic thickness, erosion thickness, and lithology. Two pseudo-wells (Figure 1C) have been established in the slope zone of the Yanan Sag to simulate the hydrocarbon generation history for the Yacheng Formation source rocks. The maturity evolution history was modeled using the Easy%Ro method. The hydrocarbon generation history was simulated using the in-built chemical kinetics model combined with measured geochemical parameters of the source rocks (kerogen type, TOC content, and HI index). Additionally, a one-dimensional pressure evolution history was constructed for the study area. This model utilized the established geological model and integrated measured pore pressure data for calibration.

4. Results

4.1. Two Overpressure Zones

In an open geological system, fluid pressure typically equilibrates with ambient hydrostatic pressure at a given depth. However, when fluid pressure exceeds hydrostatic pressure, the system enters an overpressured condition. Industrially, pressure magnitude is commonly quantified using the pressure coefficient [13]. This coefficient is defined as the ratio of measured pore pressure to theoretical hydrostatic pressure at a specific depth.
The pressure coefficient Cp is defined by the following formula:
Cp = P/(ρw · g · z)
where P is the measured pore pressure at depth *z* (in Pa), ρw is the density of formation water (1050 kg/m3), g is the acceleration of gravity (9.81 m/s2), z is the depth below the water surface (in m). A formation is considered overpressured when the pressure coefficient (Cp) exceeds a value of 1.2.
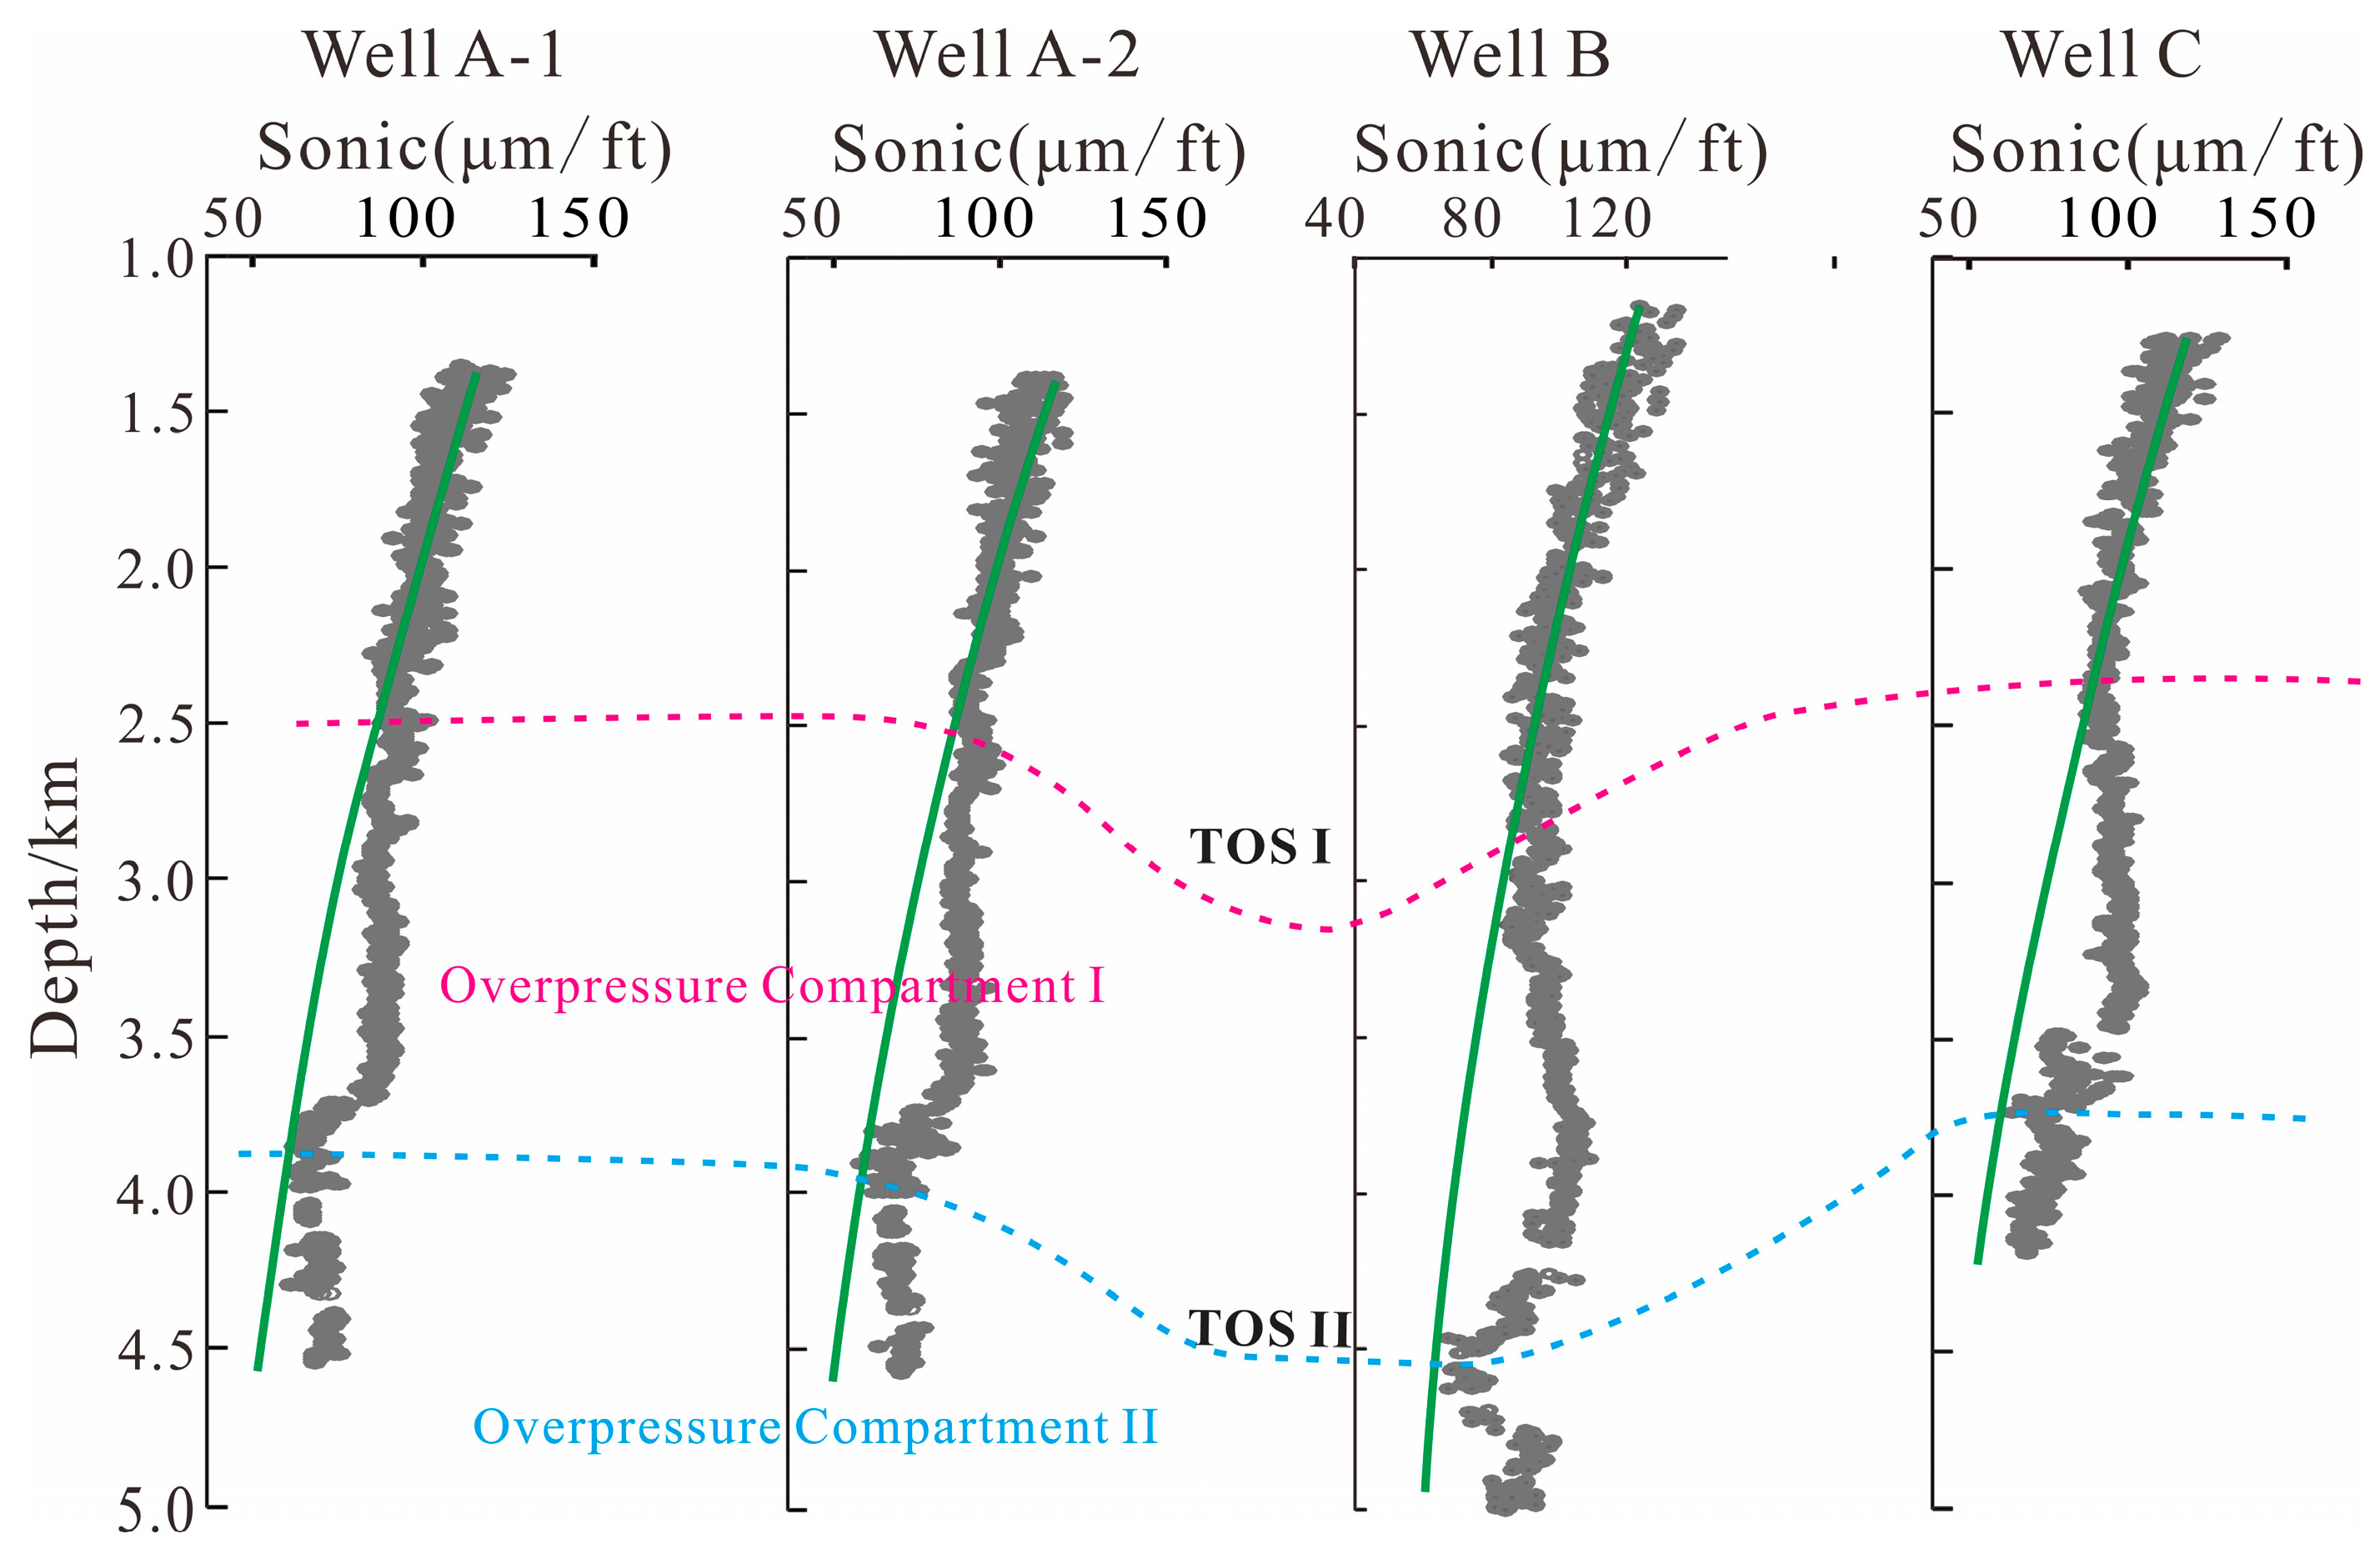
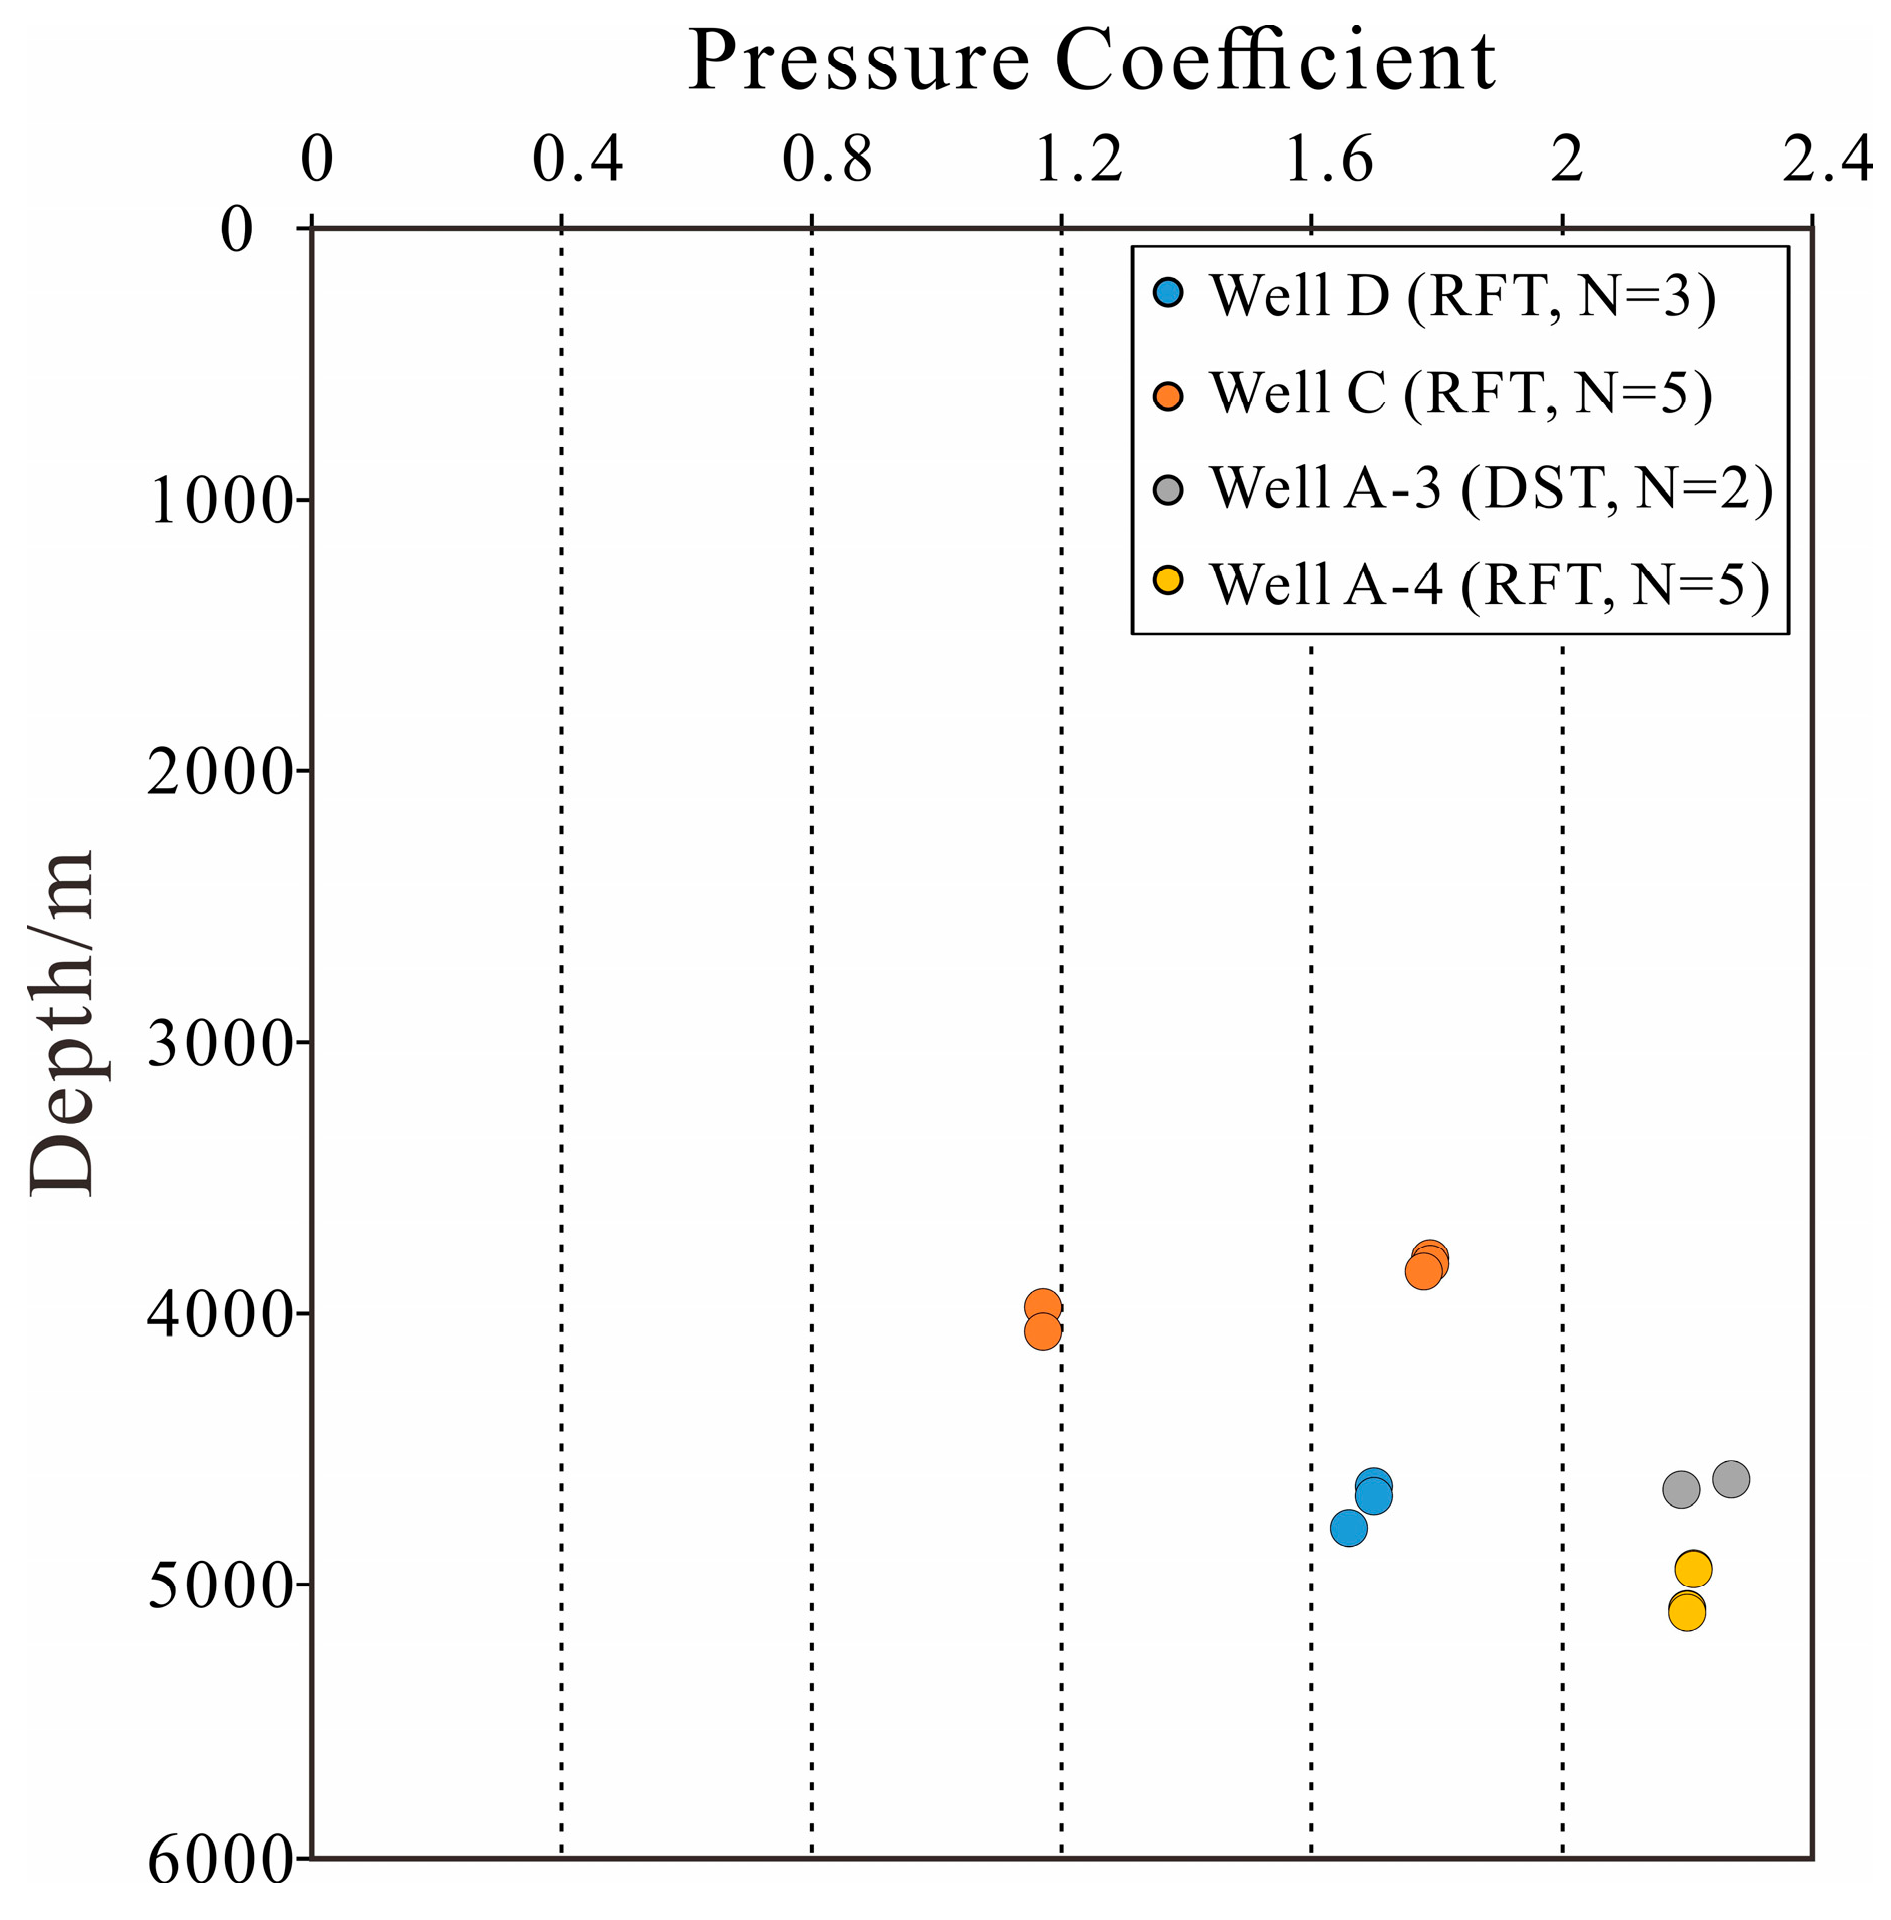
Well-logging curves provide diagnostic responses to overpressure generation, and sonic velocity logs exhibit high sensitivity [14]. The GH line—a sonic profile connecting representative wells (Figure 3)—reveals a dual-overpressure system. The upper section of the sonic profile displays hydrostatic conditions. Below it, two overpressured compartments are separated by a seal unit. The top overpressure surface (TOS) of the first compartment occurs at the base of the hydrostatic regime (burial depth: 2500–3000 m). The second TOS is located at greater depths, approximately 3800 m to 4500 m. Although limited in quantity, direct pressure measurements from drill-stem tests (DST) and repeat formation tests (RFT) provide high-accuracy validation (Figure 4, Table 1). These data confirm that the second overpressure compartment, within the Lingshui and Yacheng Formations, exhibits significantly elevated pressures that surpass hydrostatic magnitudes. Notably, some measured pressure coefficients exceed 2.0.

4.2. Fluid Inclusions

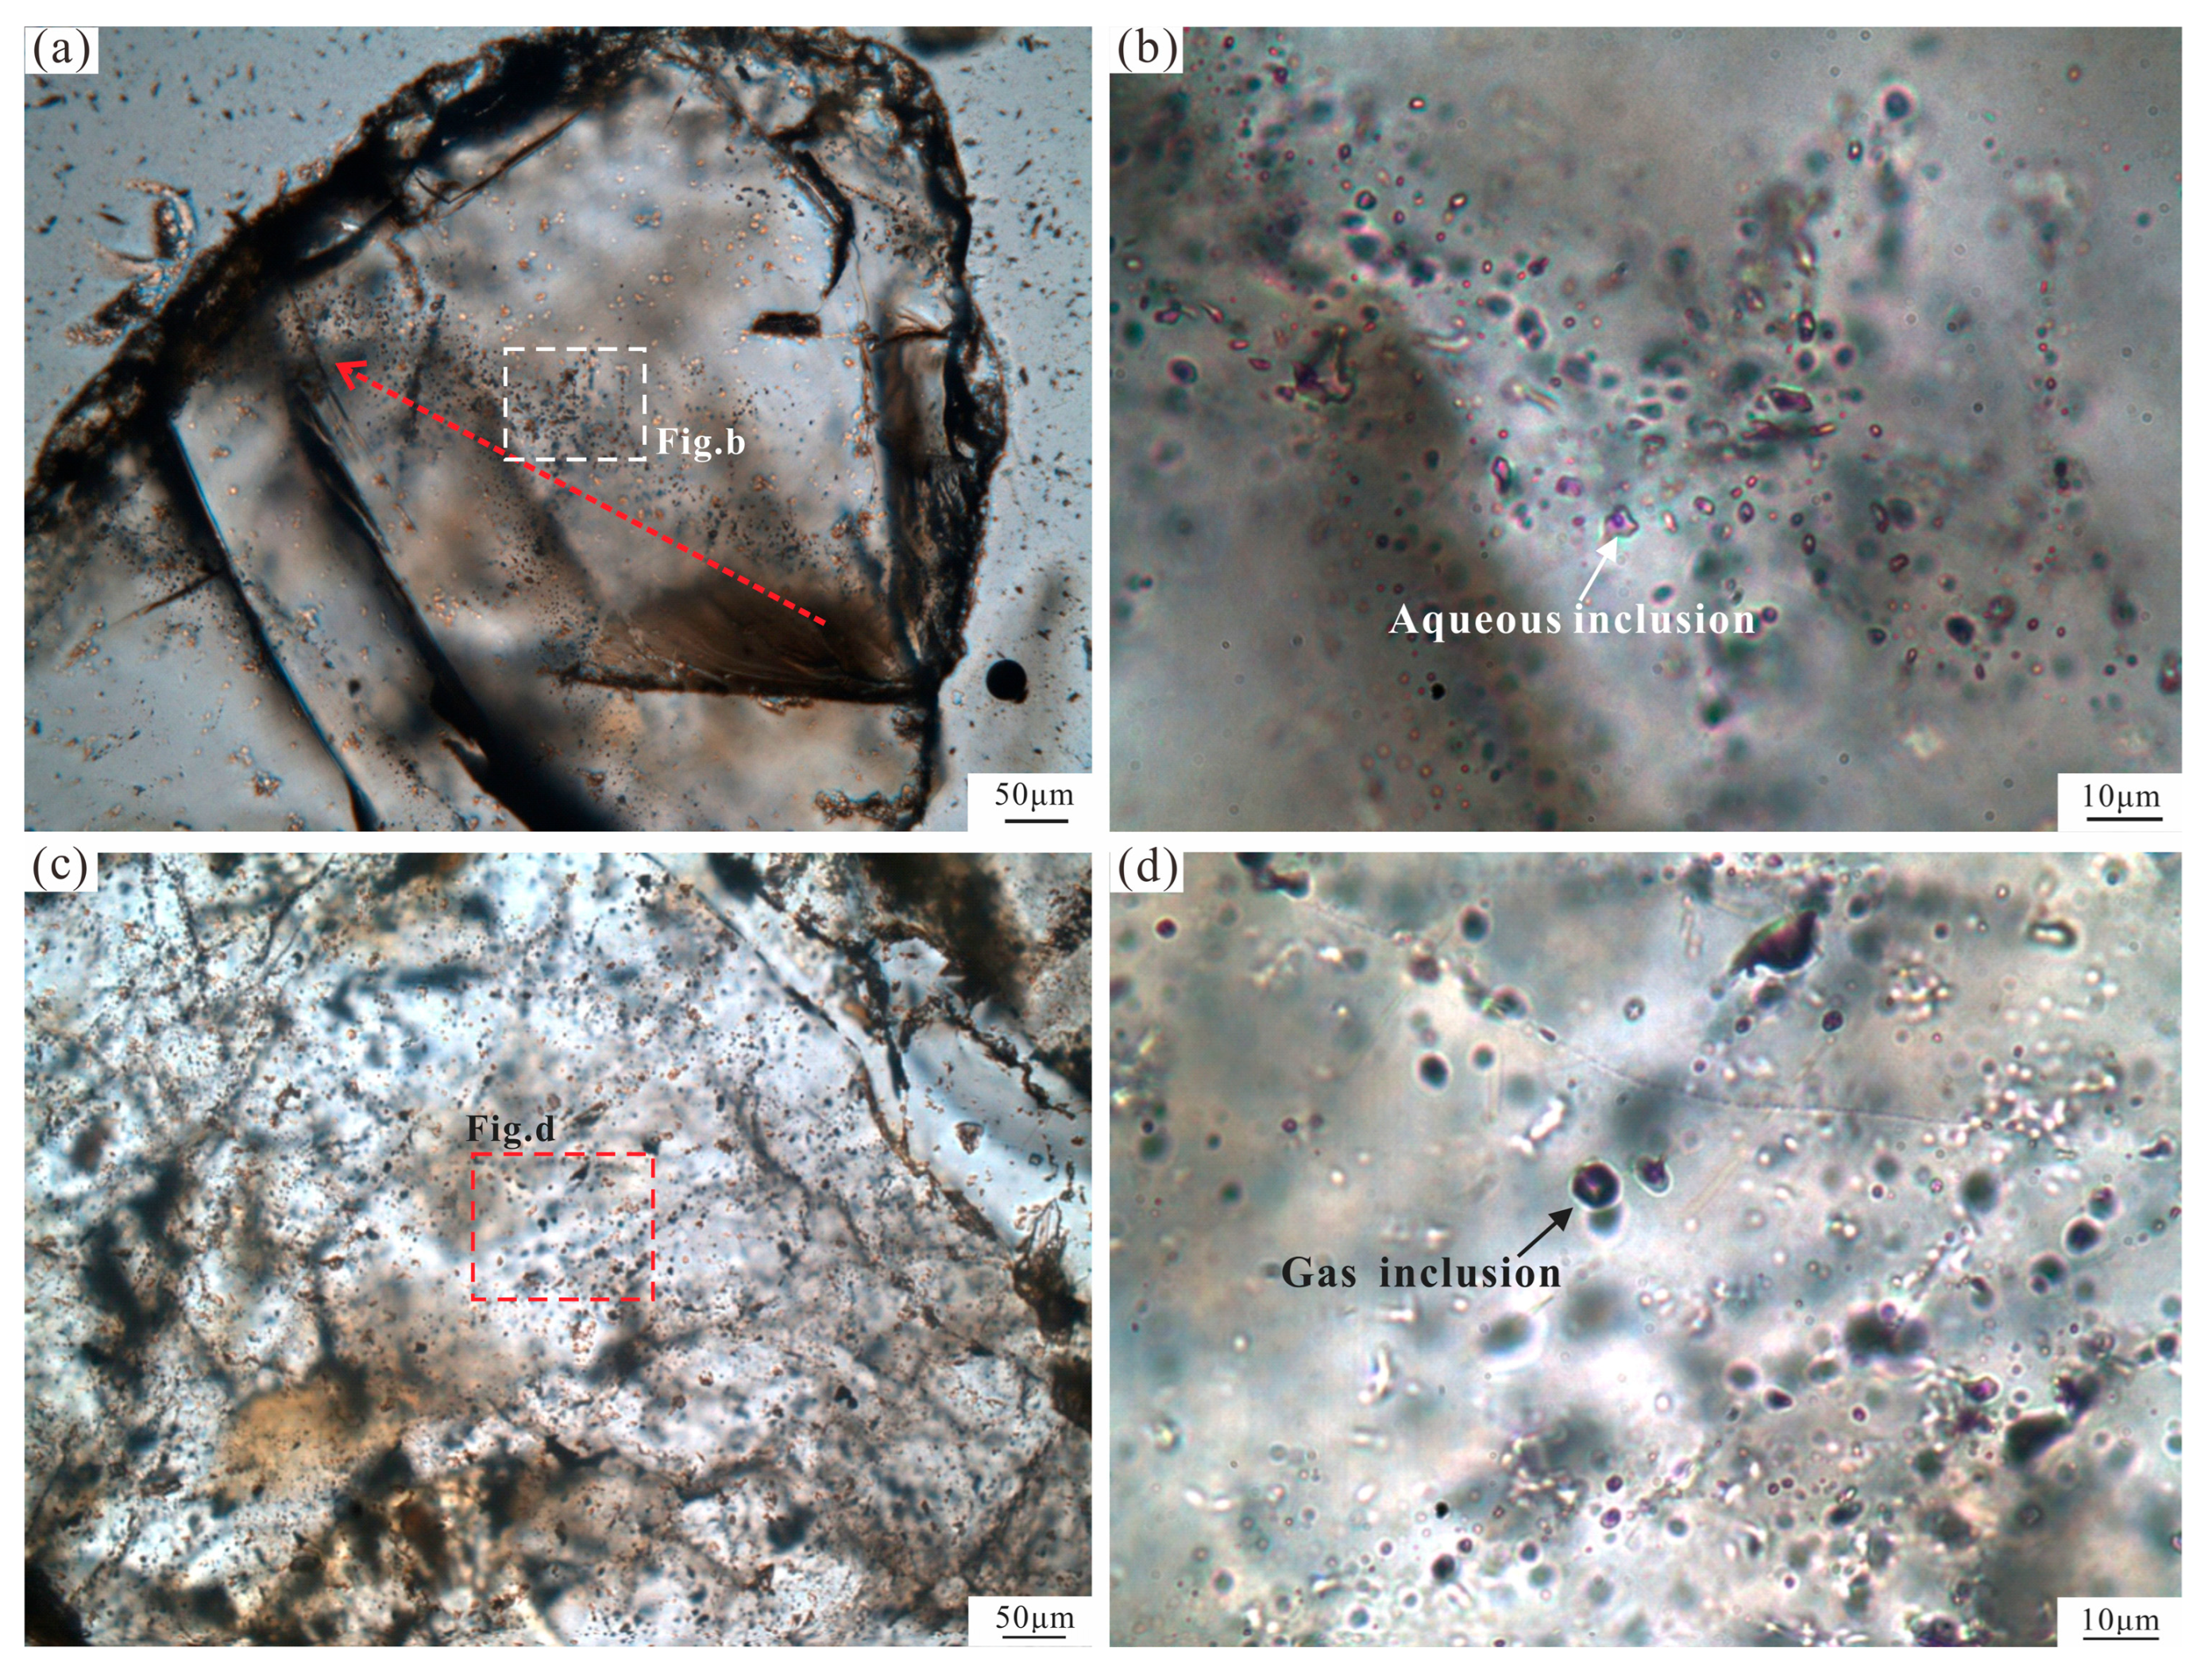
Fluid inclusions contain valuable and abundant paleo-fluid information, including temperature, composition, and salinity [15,16,17]. The sandstone samples within the reservoir intervals in the study area show a rich diversity of inclusion types. These can be classified into seven categories: aqueous inclusions (Figure 5a,b), hydrocarbon-bearing aqueous inclusions, gas-rich inclusions, pure gaseous hydrocarbon inclusions (Figure 5c,d), and vapor-liquid-liquid (V-L-L) triple-phase CO2 inclusions. No oil inclusions were observed.
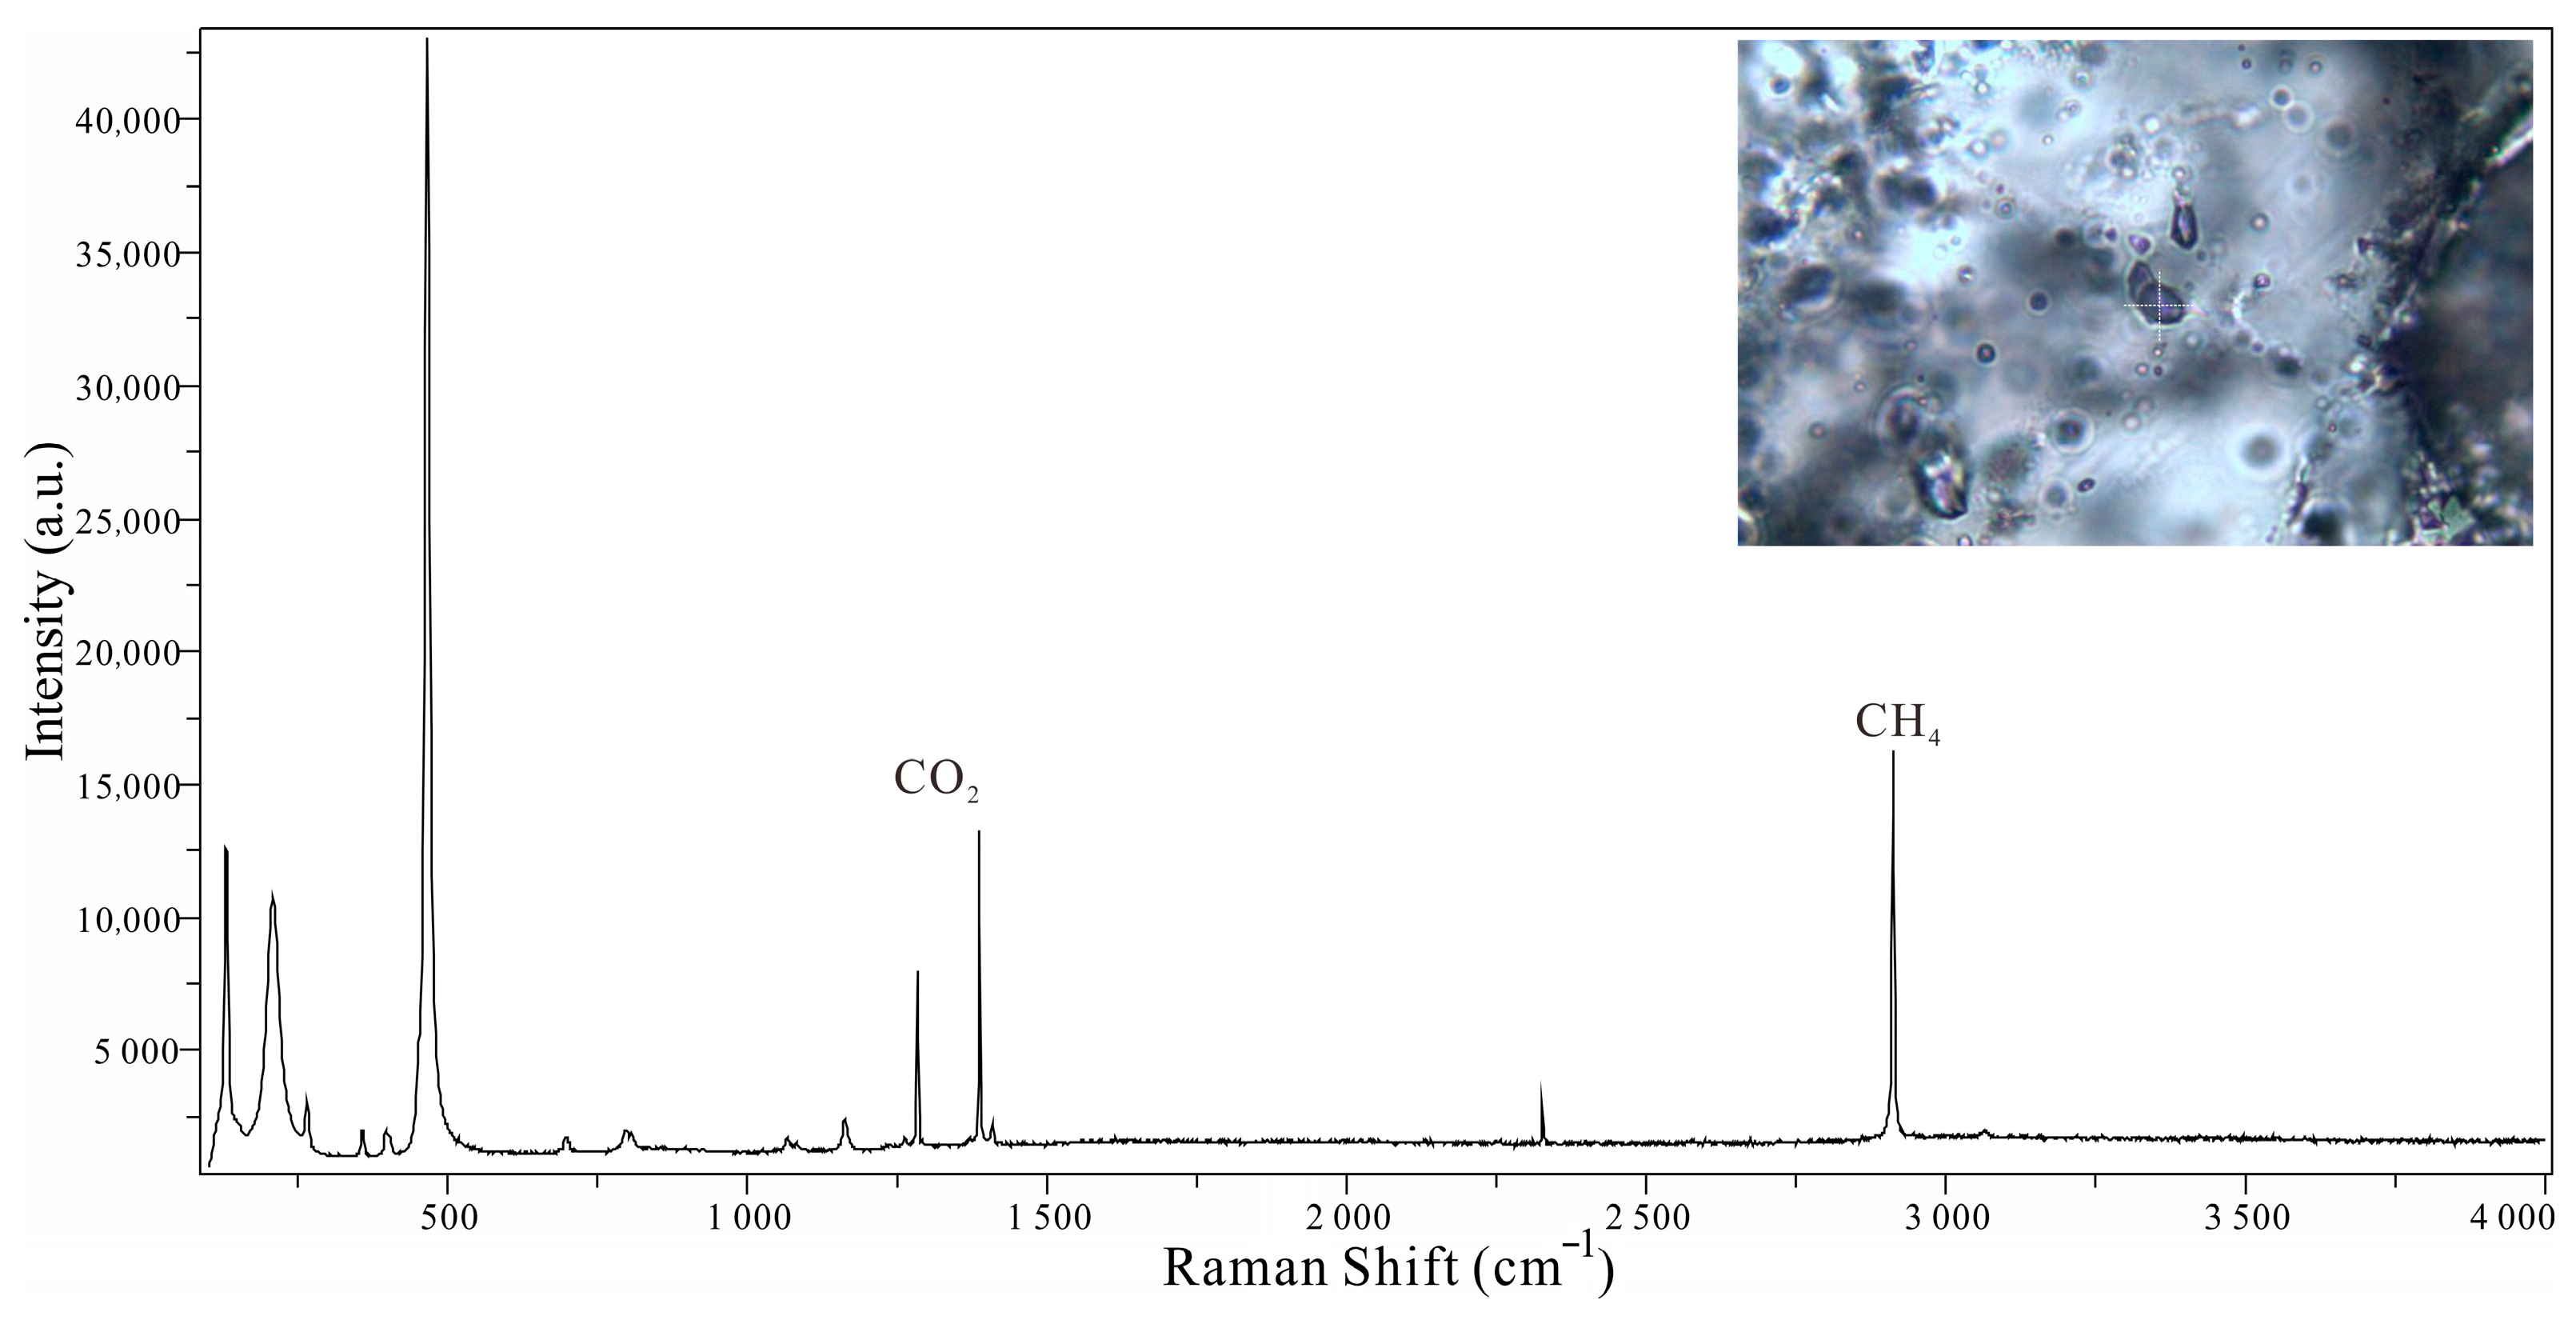
Gas inclusions, mainly elliptical or irregular in shape, are often localized along healed micro-fractures of quartz grains. These inclusions exhibit a black appearance under transmitted light (TR) and show no fluorescence under ultraviolet (UV) light. Raman spectroscopic analysis of pure gas-phase inclusions detects methane and CO2 (Figure 6). Associated aqueous inclusions, containing coexisting vapour and liquid phases and formed during the same fluid event, are widespread. Their sizes range from 2 to 20 μm across, with geometries encompassing elliptical, flattened, triangular, and irregular configurations. Raman spectroscopy of bubbles within aqueous inclusions indicates methane as the primary component.
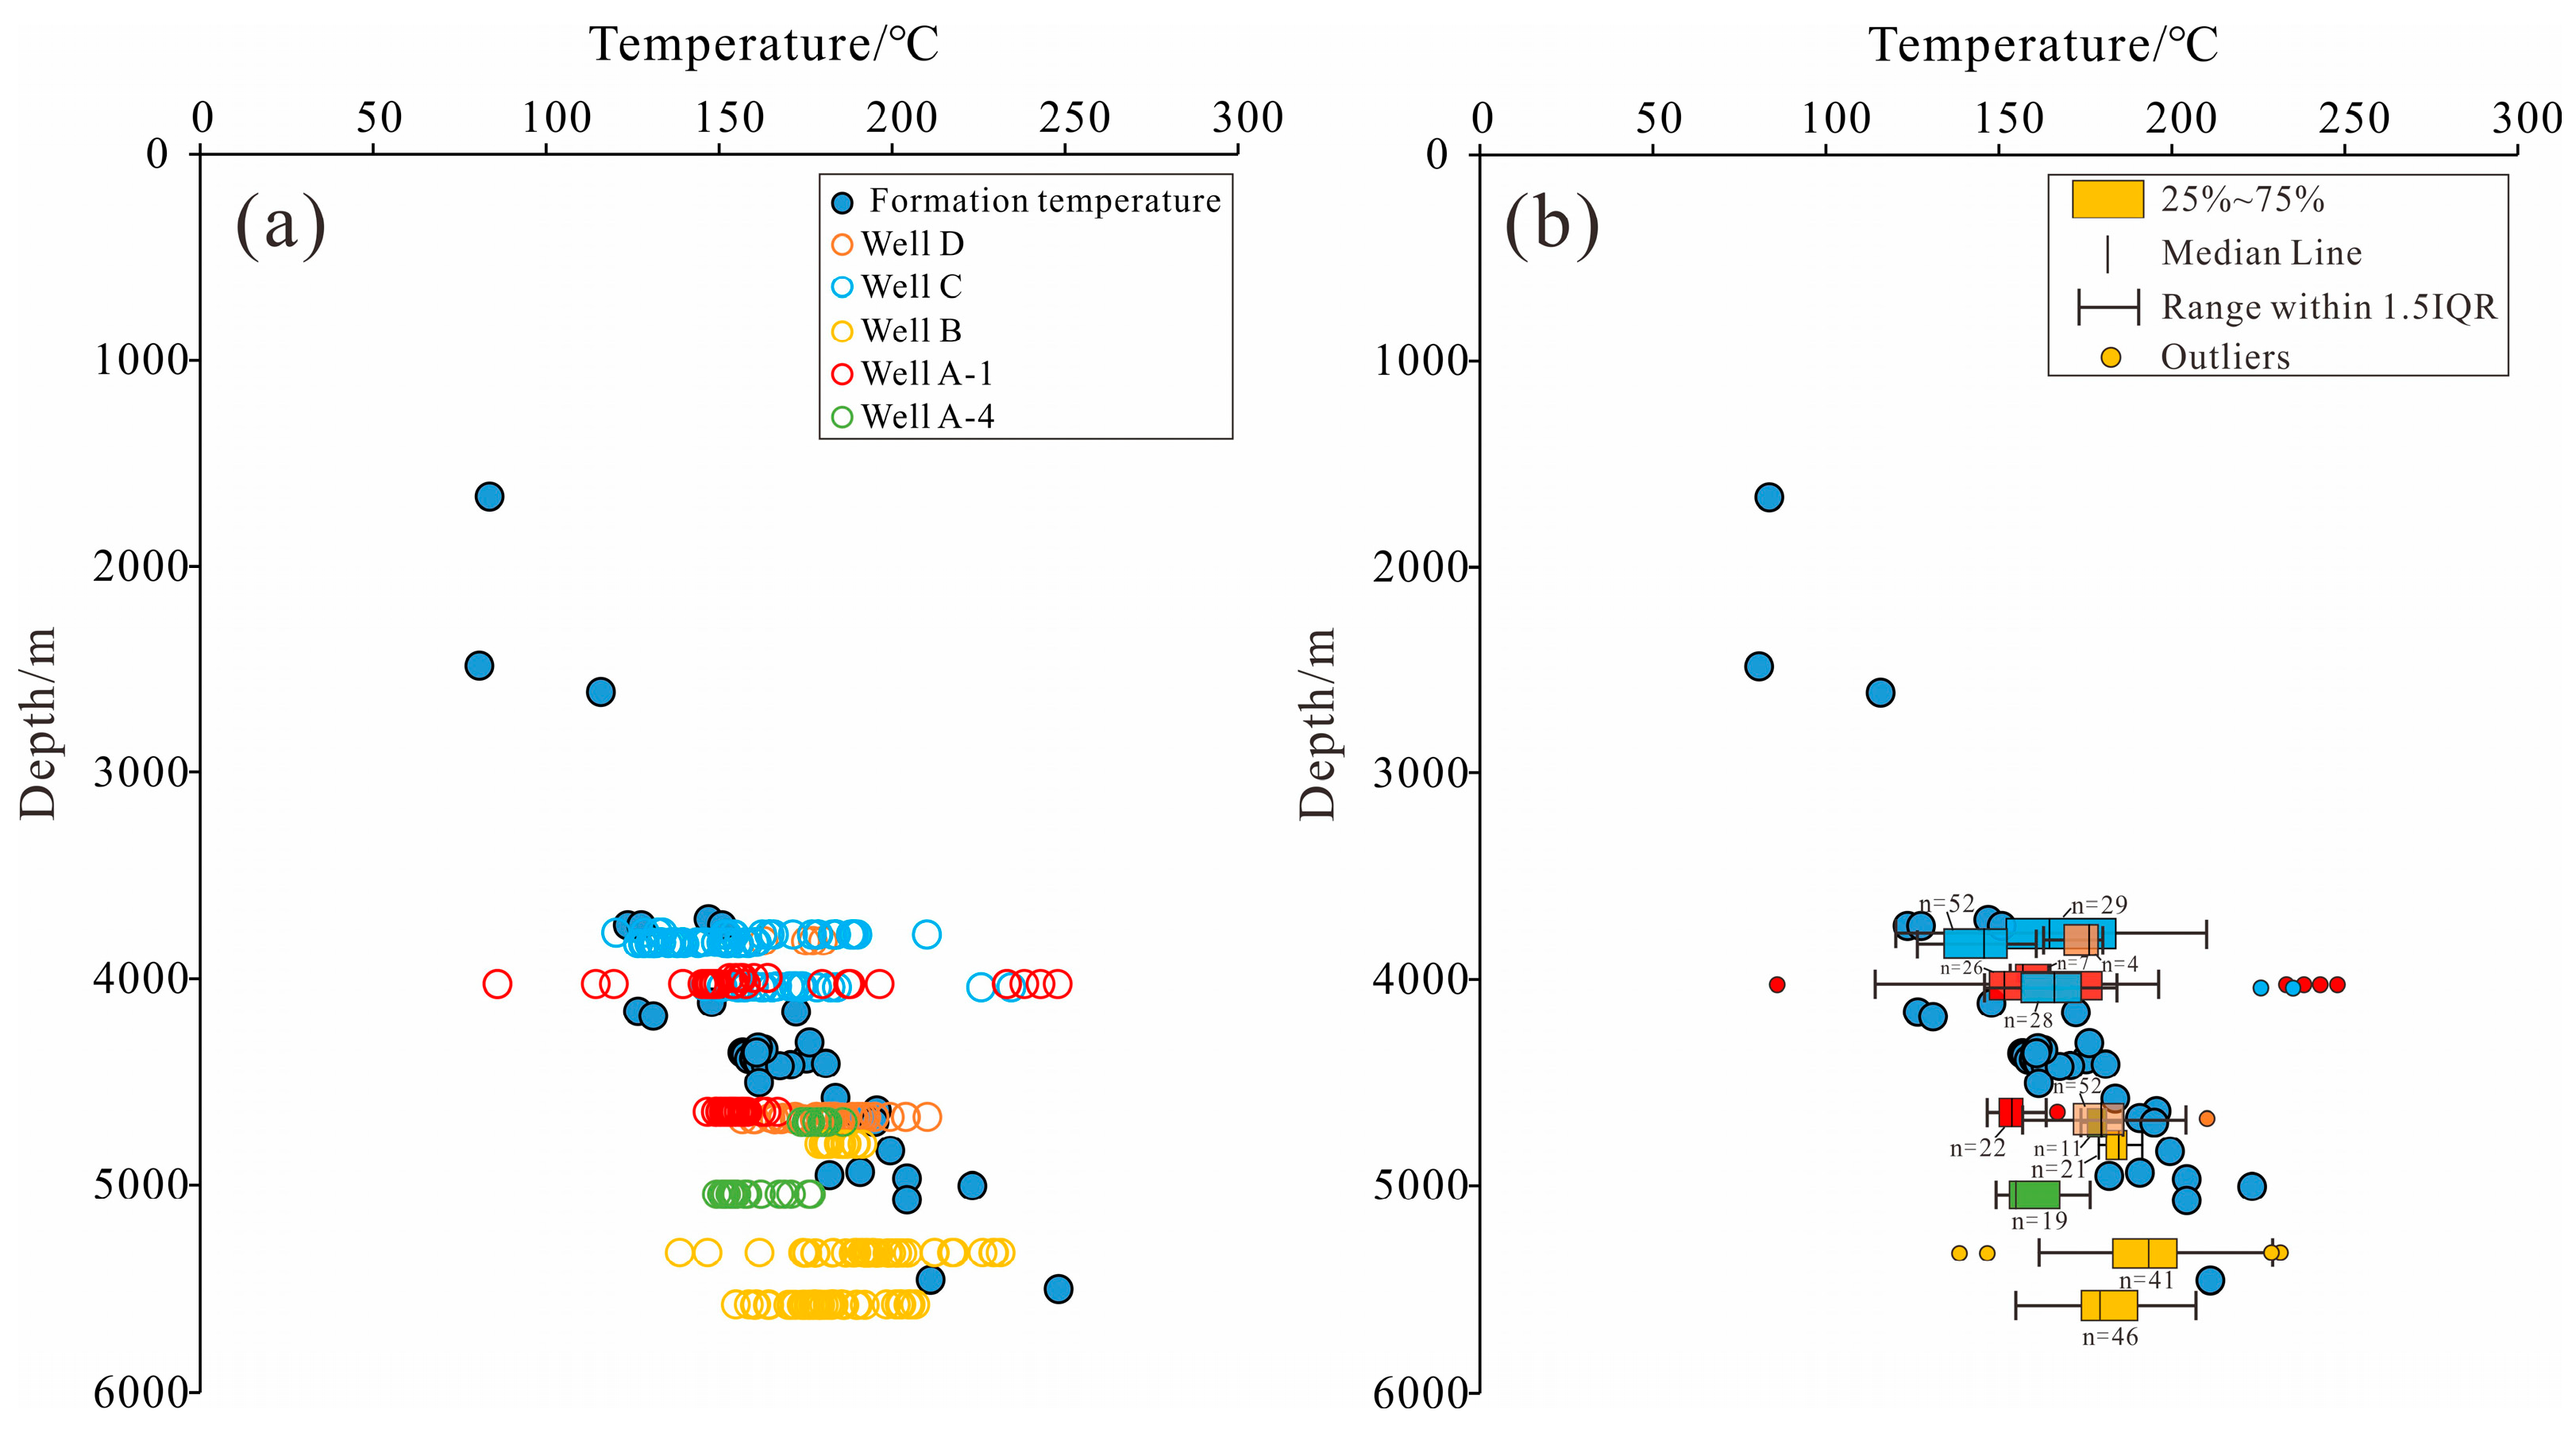
Homogenization temperatures (Th) of methane-bearing aqueous inclusions (abbreviated as Th-aqu herein) from seven representative wells in the study area predominantly range from 125 °C to 240 °C, with rare values below 100 °C. Detailed Th measurements from sandstone samples for individual wells are presented in Figure 7a, alongside comparative modern formation temperature data. Notably, these samples are distributed across two domains: within the lower overpressured compartment and near the TOS II. The box plot clearly illustrates that Th values exhibit considerable scatter at equivalent depths (Figure 7b). Samples from the lower overpressured compartment generally record Th values not exceeding present-day geo-temperatures at corresponding depths. In contrast, fluid-inclusion Th values in many reservoir samples adjacent to TOS II exceed present-day geothermal temperatures at corresponding depths. Notably, the magnitude of this excess locally surpasses 50 °C.
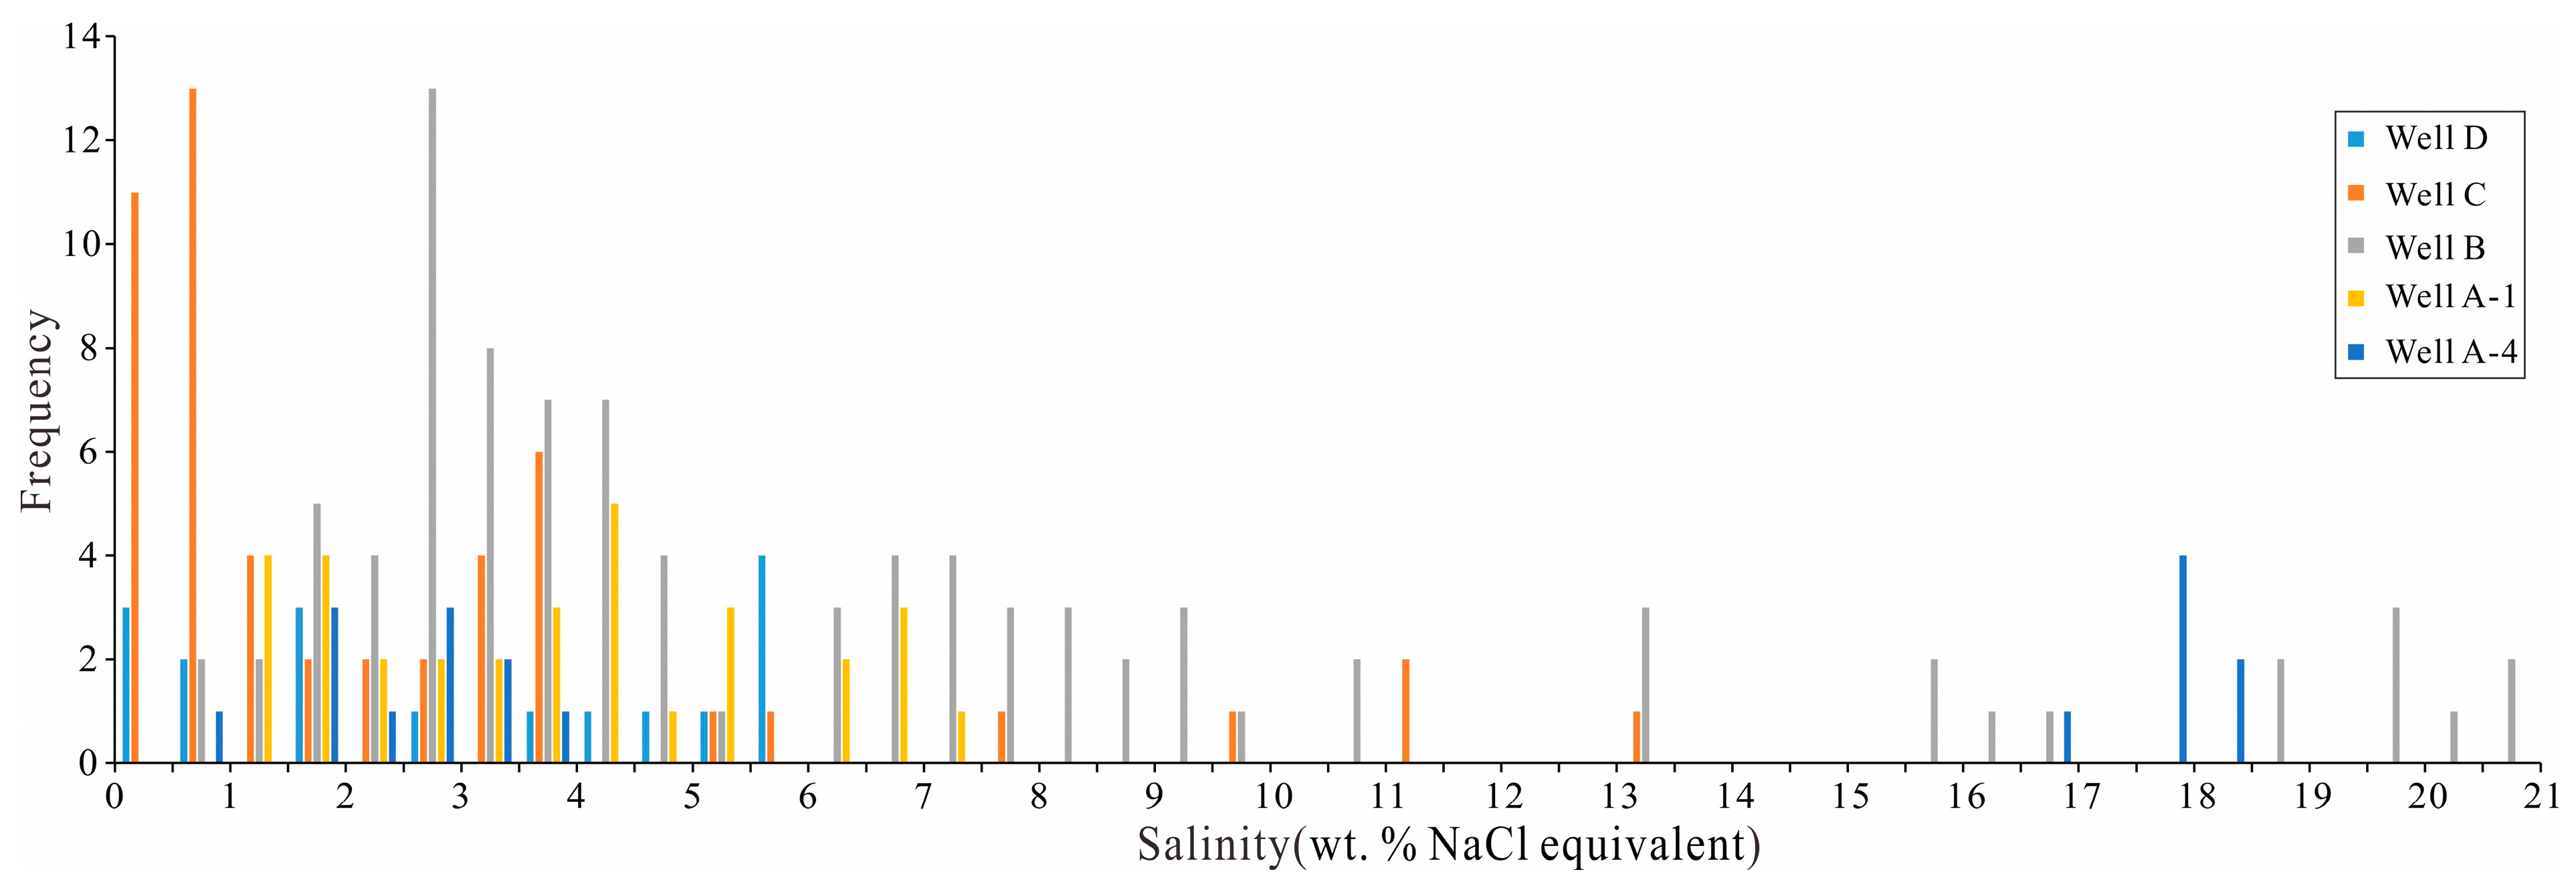
Salinity values derived from ice-point measurements of fluid inclusions are presented as a histogram in Figure 8. The salinity varies among samples from different wells, showing substantial overall heterogeneity. Most values are below 10 wt% NaCl eq, with a minor subset showing anomalously elevated salinities exceeding 15 wt%.

4.3. Burial and Hydrocarbon Generation History

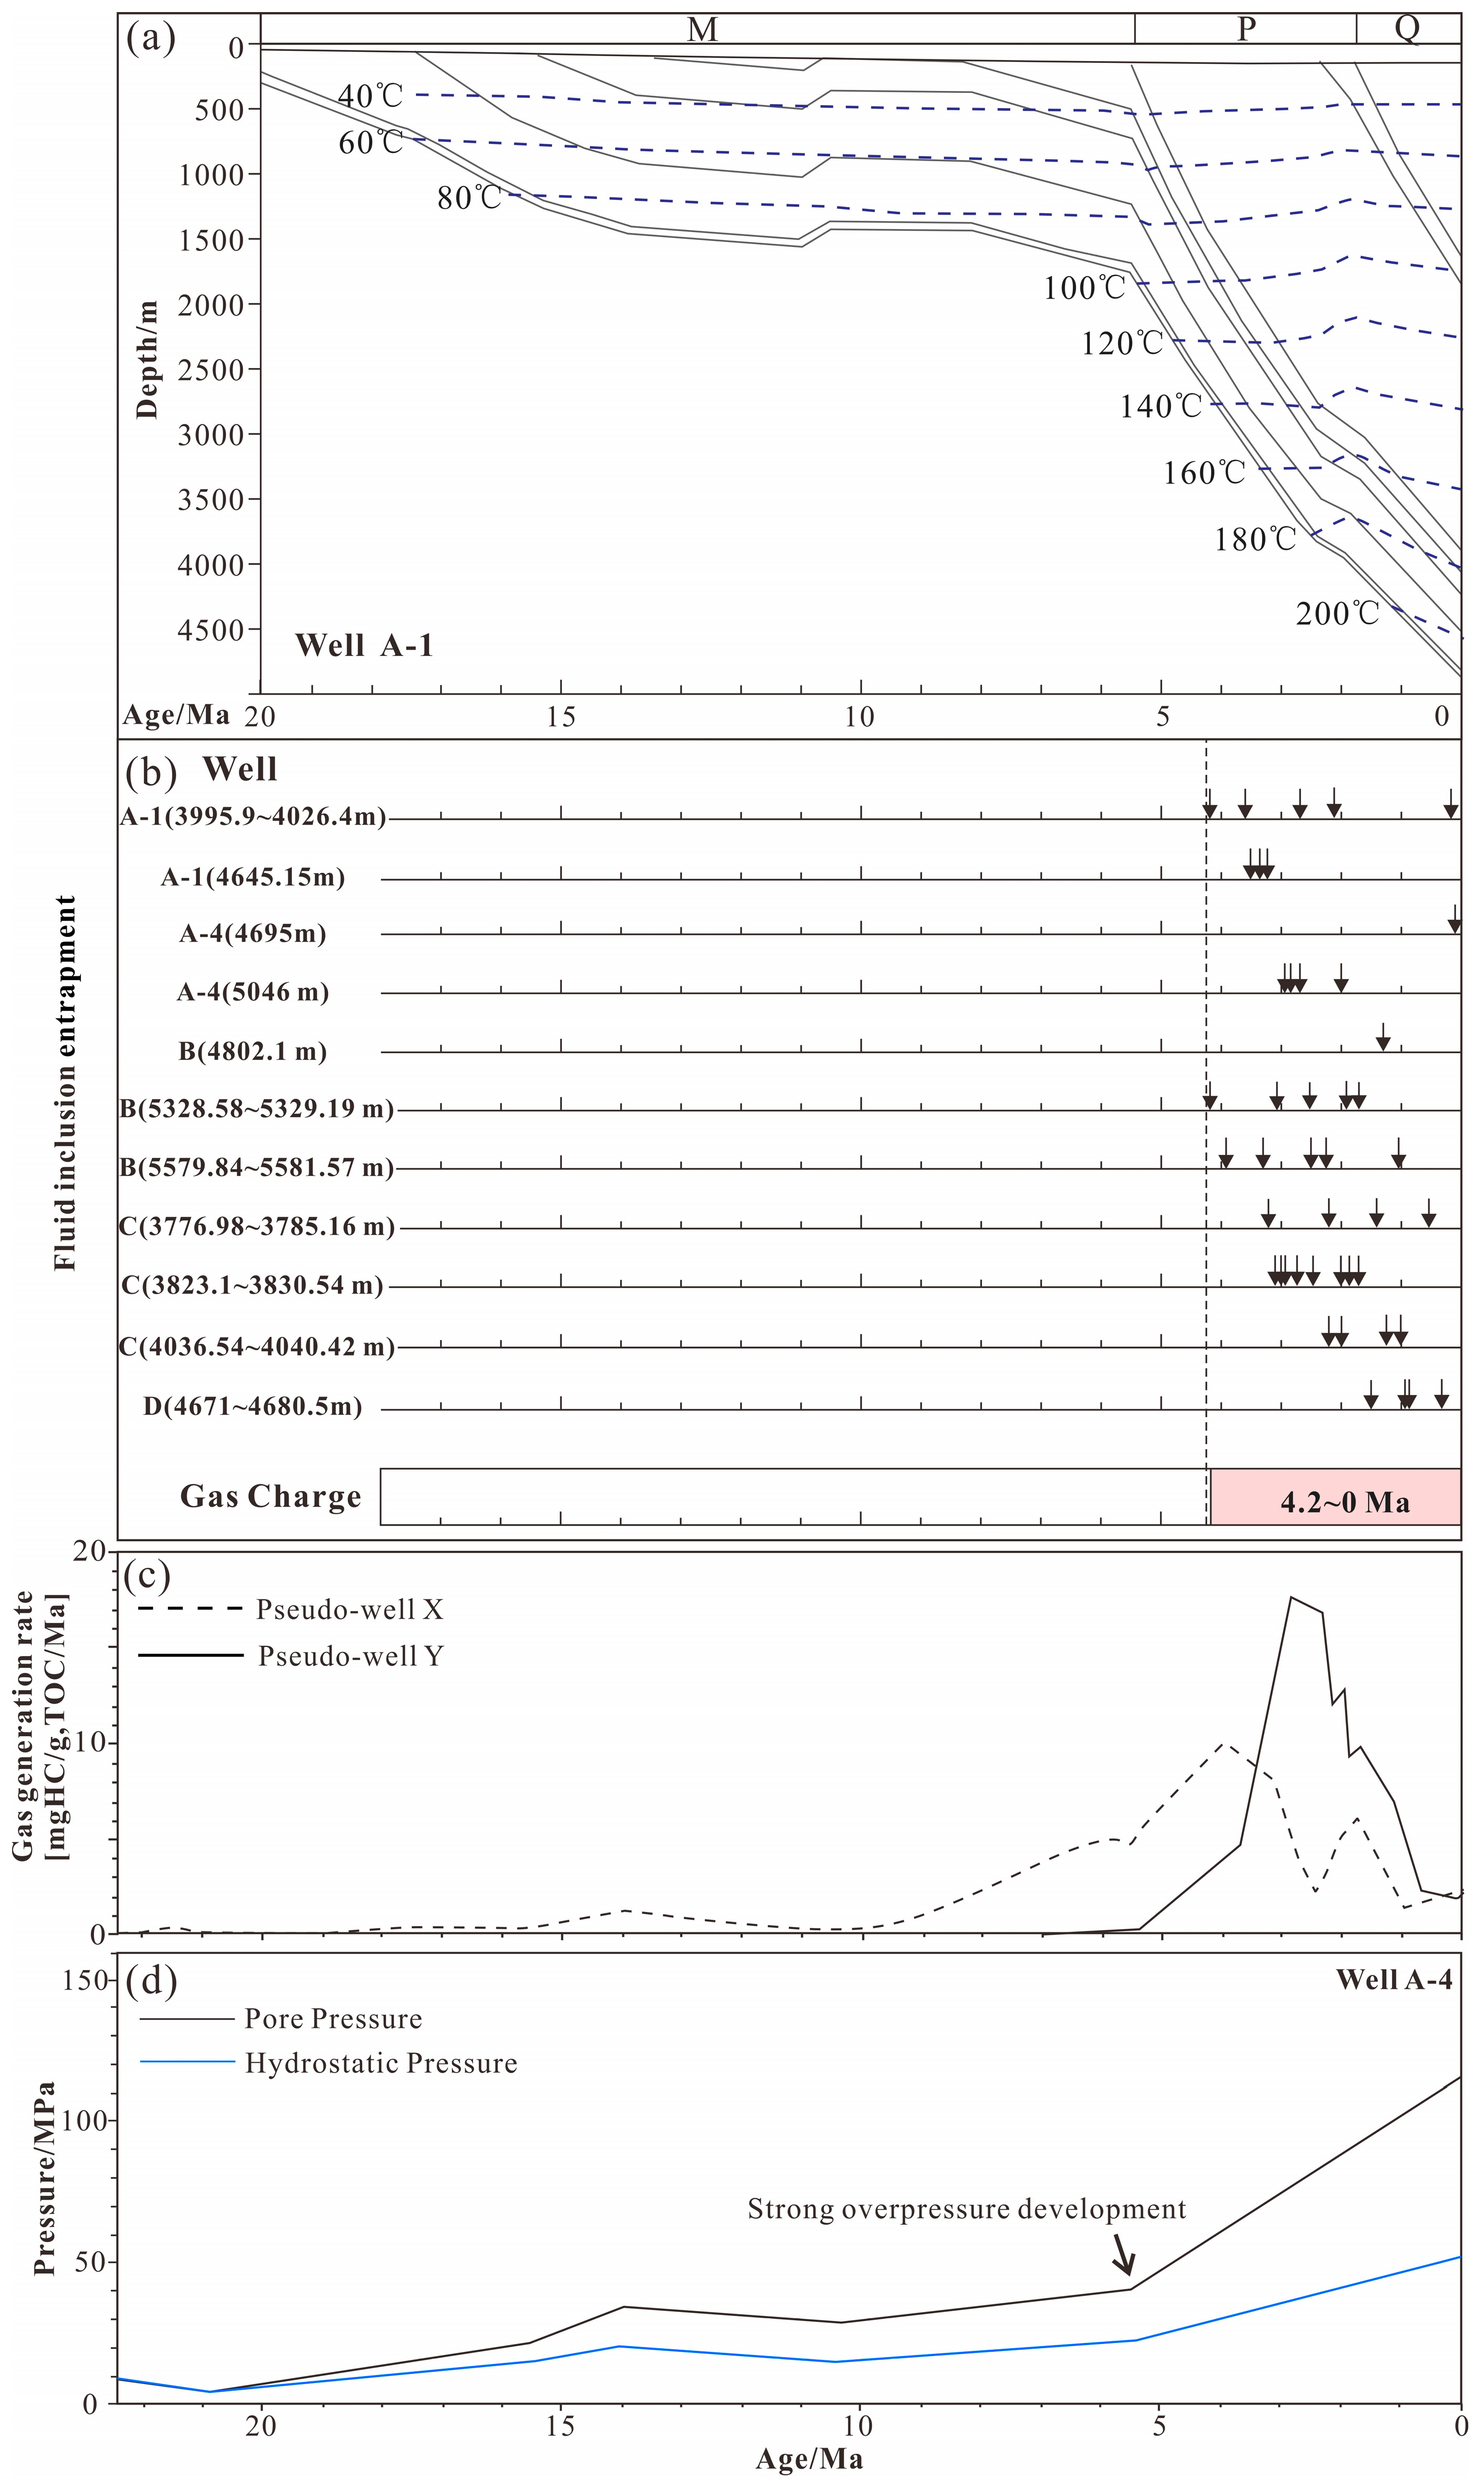
An excellent correlation between modeled and measured temperatures and Ro values in Well A-1 validates the reliability of the reconstructed thermal histories, confirming their suitability for this study area. Burial history modeling reveals that the studied region underwent relatively slow subsidence during the Oligocene to Miocene. This was followed by rapid deposition of the Yinggehai Formation at rates exceeding 500 m/Myr. Subsequent rapid burial of the Oligocene reservoir intervals to present-day depths induced a pronounced temperature increase within these strata during this phase (Figure 9a).
Based on previous assessments of gas maturity [18], natural gas in the Yanan Sag was thought to have originated primarily from coal-measure source rocks and terrigenous-marine source rocks in the slope facies. To simulate the gas generation history in this region, we established two pseudo-wells at different locations along the slope belt of the Yanan Sag (Figure 1C). Simulation results indicate that the Middle Yacheng Formation source rocks at pseudo-well X on the slope belt began generating hydrocarbons at 15 Ma, albeit at a very low rate (Figure 9c). Significant and rapid gas generation commenced at 10 Ma, reaching its peak around 4 Ma, followed by an overall decline in generation rate. Some localized fluctuations in the gas generation rate were also observed. At the pseudo-well Y on the shallower slope belt, the Middle Yacheng Formation source rocks began generating hydrocarbons later. The generation rate increased only between 6 and 5 Ma, peaked around 4–3 Ma, and then declined rapidly. Therefore, the peak period of large-scale gas generation in this area occurred between 10 Ma and the present. Burial history simulations reveal that after 10 Ma, particularly since 5 Ma, rapid subsidence of the Qiongdongnan Basin due to neotectonic movements led to a sharp increase in temperature. This accelerated the maturation of the source rocks and promoted extensive hydrocarbon gas generation.

4.4. Paleo Pressure Evolution

Hydrostatic and pore pressure evolution curves with time for the Yacheng reservoirs in the study area were computed using a 1D model (Figure 9d). Paleo-pressure evolution results indicate that the middle section of the Yacheng Formation for the Well A-4 began to develop overpressure over 20 Ma. By 23.8 Ma, the pressure coefficient had reached approximately 1.3. Undercompaction is considered the primary mechanism for this initial pressure build-up. Subsequently, the overpressure magnitude exhibited an overall increasing trend over time. Notably, starting around 5 Ma, the overpressure intensified significantly. By about 4.7 Ma, it had reached a moderate to strong overpressure stage, with a pressure coefficient of ~1.6.
The studied Yacheng reservoir exhibits no significant or frequent facies changes, suggesting that it is likely hydraulically connected laterally. Fault compartmentalization is unlikely to be prevalent, as few large faults are developed. Furthermore, the absence of salt structures implies a lack of significant lateral pressure anomalies. Therefore, the 1D pressure model constructed at the well location can be reliably extrapolated to represent the overpressure evolution throughout the study area.

5. Discussions

5.1. Hydrocarbon Generation and Filling Time

Hydrocarbon generation modeling at two pseudo-wells on the slope belt of the Yanan Sag indicates that intense gas generation occurred primarily between 10 Ma and the present. Burial-thermal analysis shows that the peak gas generation was driven by significantly enhanced maturation during a phase of accelerated subsidence.
Fluid-inclusion analysis constrains gas charge timing in the mid-deep reservoirs of the western Qiongdongnan Basin. Entrapment ages of fluid inclusions were determined through comparation between measured homogenization temperatures (Th) and reconstructed burial-thermal history [19,20]. The Yacheng Formation’s coal-measure strata contain predominantly Type III kerogen with a high gas-generation potential. As a result, aqueous inclusions coeval with gas inclusions are methane-saturated. Thus, Th values of coexisting aqueous inclusions reliably record entrapment temperatures. Using minimum Th values of associated aqueous inclusions combined with burial-thermal histories (accounting for potential hydrothermal effects), chronological integration from multiple wells indicates gas charge occurred from circa 4.2 to the present (Figure 9b), demonstrating late-stage migration and accumulation. The timing of this gas charging phase broadly aligns with the simulated hydrocarbon generation peak.

5.2. Causes of Overpressure

Mud weight data indicate that two overpressure compartments are developed vertically. The relatively shallow overpressure compartment occurs within the Huangliu and Yinggehai Formations and exhibits moderate overpressure magnitude. In contrast, the underlying strong overpressure is primarily developed within the Yacheng, Lingshui, and Sanya Formations. This deep overpressure compartment exhibits high magnitude, with most pressure coefficients exceeding 2.0 (Figure 10).
The Qiongdongnan Basin exhibits a high geothermal gradient, making the consideration of aquathermal pressuring essential. In a completely sealed, constant-volume water-bearing system, a temperature change of approximately 0.56 °C leads to a pressure variation of about 0.76 to 0.86 MPa [21]. This pressure increase is also influenced by the salinity of the formation water. However, previous studies have indicated that the contribution of aquathermal pressuring is generally negligible [22]. Such pressurization effects are likely to occur only in unconsolidated sediments.
We propose that the first overpressure compartment, primarily observed in the Huangliu and Yinggehai Formations, is mainly due to undercompaction and illitization. Hydrocarbon generation is a secondary factor. Although burial temperatures are elevated, the generally low organic matter abundance within the Yinggehai, Huangliu and Meishan Formations results in poor hydrocarbon generation potential. Consequently, it is unlikely that hydrocarbon generation significantly contributed to the increase in pore pressure.
1D numerical pressure simulations indicate that strong overpressure in the Yanan Sag formed late (Figure 9d). Following the Late Miocene, the basin underwent extensive and rapid subsidence (Figure 9a). Sedimentation rates exceeded 200 m/Ma across most areas, reaching over 500 m/Ma in some regions. During this period, the Huangliu Formation, composed of limestones, argillaceous rocks, and some fine-grained sandstones, was deposited. The overlying Yinggehai Formation consists predominantly of mudstones interbedded with thin siltstone layers. This rapid subsidence prevented the efficient expulsion of pore fluids from the thick mudstones in the Huangliu and Yinggehai Formations. This pore water retention led to undercompaction and a consequent increase in pore fluid pressure [23].
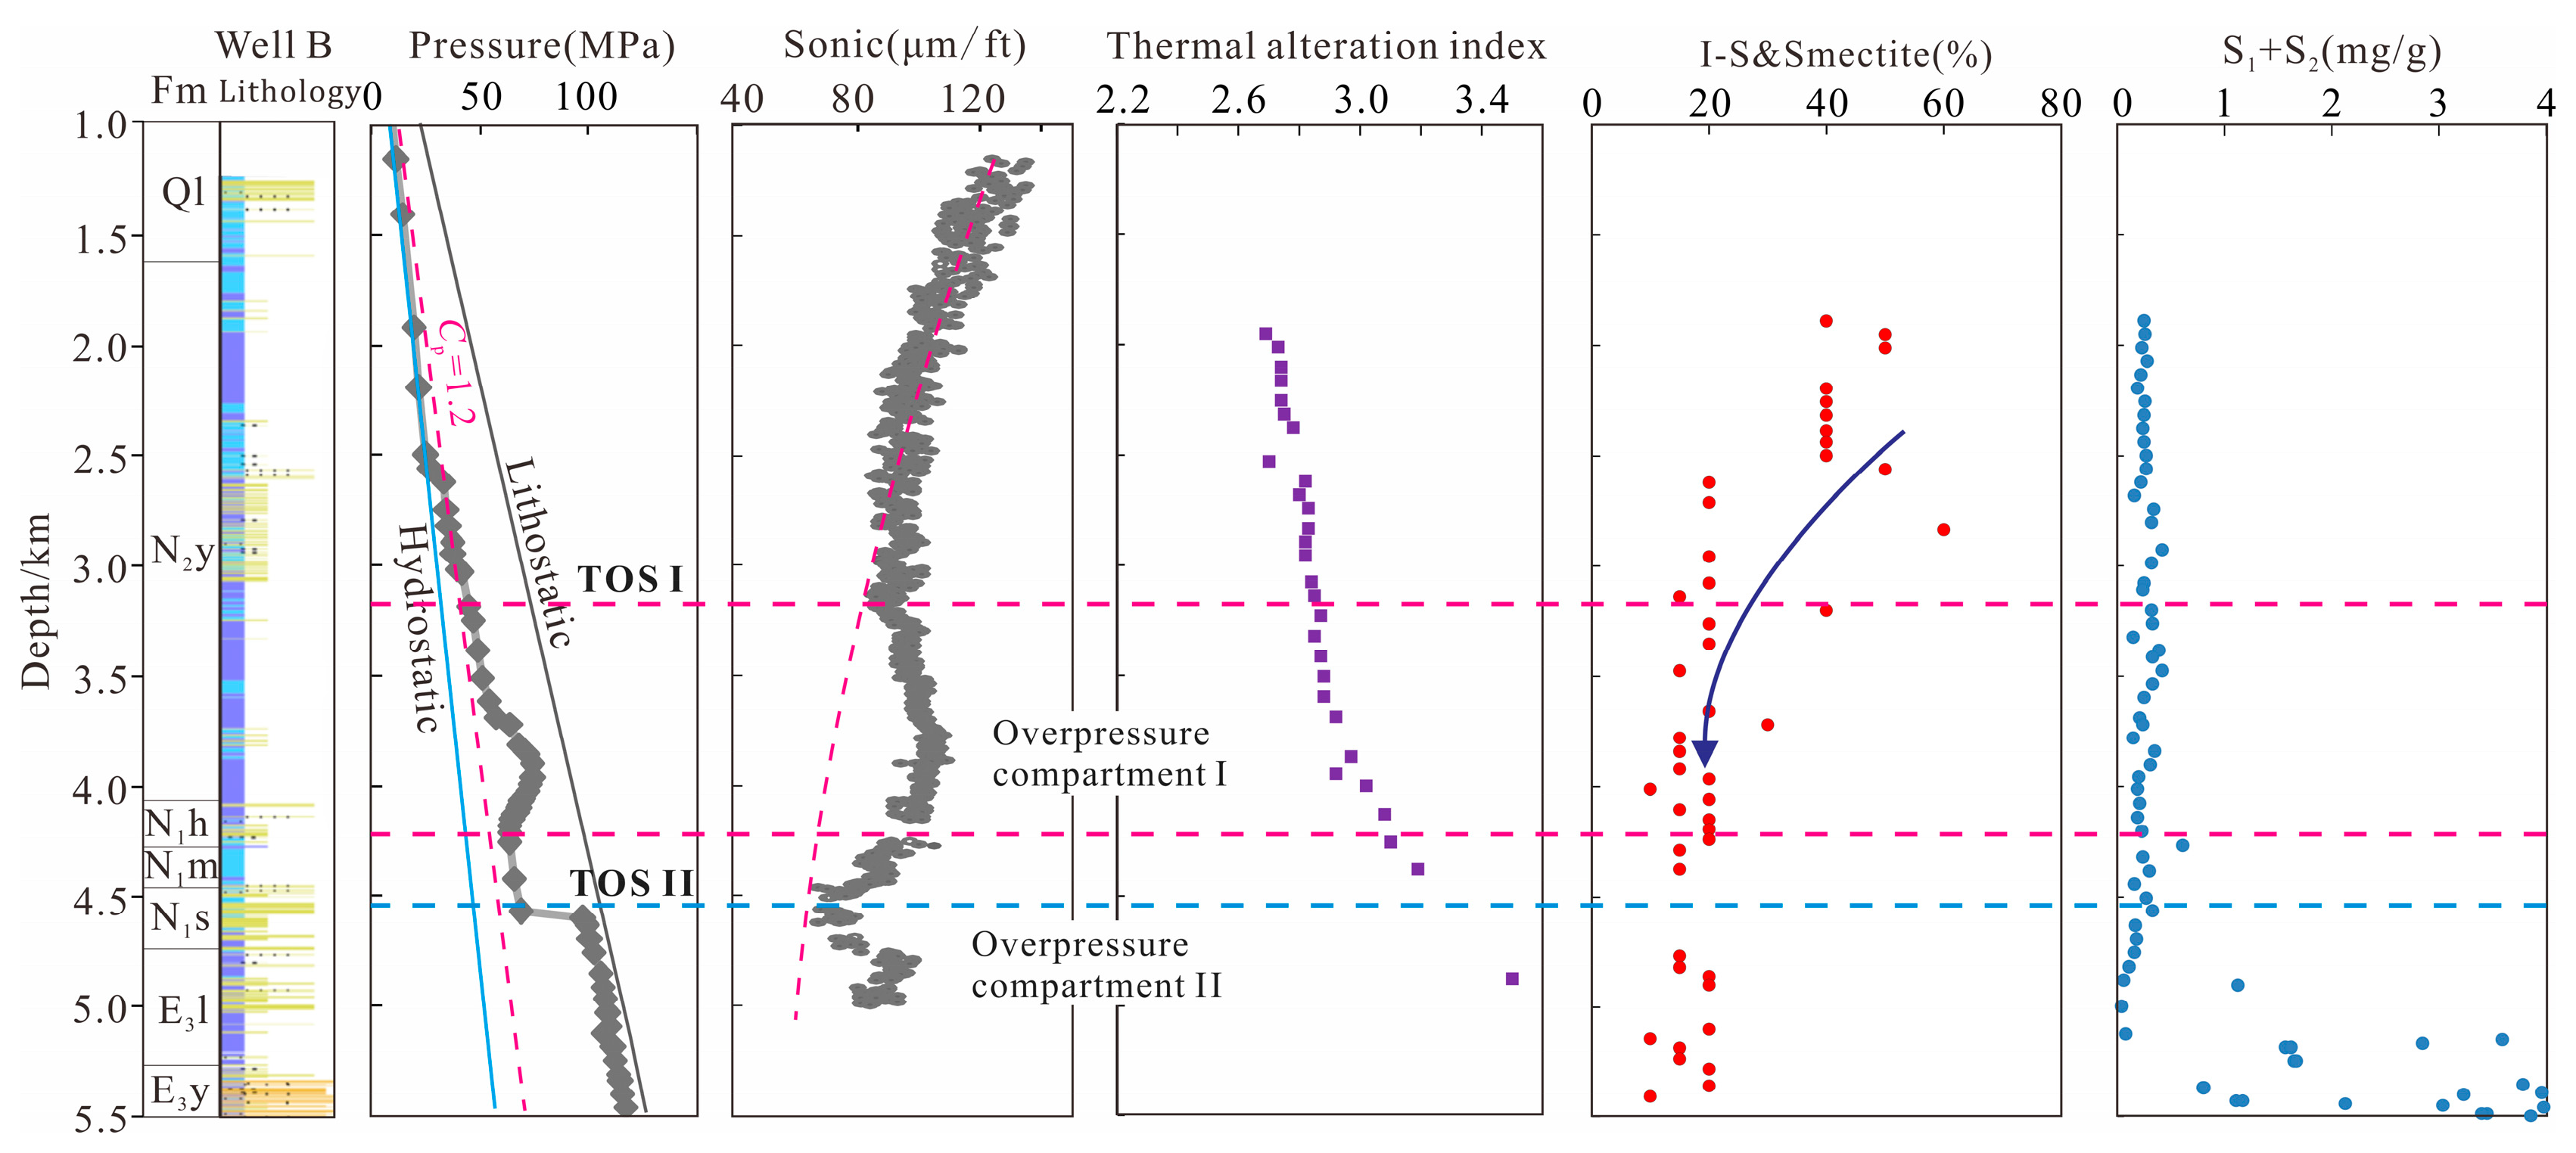
Clay mineral transformation also contributed to overpressure in this section. Dehydration during illitization leads to fluid expansion and overpressure [24]. During the transformation of smectite to illite, clay particles tend to become more aligned, transferring part of the load originally borne by the rock framework to the pore fluids [25]. Within the first overpressure compartment, a major decrease in illite-smectite mixed-layer (I-S) & Smectite indicates substantial smectite-to-illite transformation (Figure 10). This likely played a critical role in the development of overpressure in this interval.
The lower overpressure compartment II represents a strong overpressure system. Aquathermal expansion can hardly give rise to strong overpressure. The I-S & Smectite is nearly unchanged in this zone, meaning that the illitization has ceased. We propose that hydrocarbon generation contributes to overpressure within the central sag of the western Qiongdongnan Basin. The Yacheng and Lingshui Formations in the central Yanan Sag are rich in Type III kerogen, which is prone to generating substantial amounts of gas. Rapid subsidence during the Pliocene and Quaternary induced a sharp increase in temperature, triggering intense gas generation within these formations. This gas generation process resulted in significant volume expansion, leading to the development of considerable overpressure [26].
The timing of overpressure development aligns closely with the timing of gas generation and accumulation, as indicated by both hydrocarbon generation modeling and fluid inclusion analyses. This correlation supports a genetic link between gas generation and overpressure. Moreover, elevated Rock-Eval (S1 + S2) values, which quantify hydrocarbon generation potential [27], align closely with the depth of overpressure compartment II (Figure 10). Notably, large-scale thermal cracking of oil to gas is considered unlikely due to the inherently poor oil-generating potential of Type III kerogen.

5.3. Hot Fluid Flow near TOS II

Overpressure is an ephemeral phenomenon; even with effective sealing layers, anomalous pore pressure will gradually dissipate in the absence of ongoing pressurization processes. The persistence of strong overpressure in the deep successions can be explained by continuing hydrocarbon generation. The thick mudstone sequences of the overlying Meishan Formation can act as a seal for the underlying overpressured compartment. However, paleo-thermal indicators suggest that this pressure seal may have experienced, or is currently experiencing, failure. This allows upward migration of deeper, higher-temperature fluids. Above TOS II, thermal anomalies are evident in several temperature-sensitive parameters, including fluid-inclusion homogenization temperatures, clay mineral assemblages, thermal alteration index (TAI), and %Ro.
Our reconstructed burial-thermal history shows that the present-day formation temperature represents the maximum temperature experienced by the formation. Comparisons between homogenization temperatures and present-day formation temperatures reveal that a significant proportion of aqueous inclusions near the TOS II exhibit anomalously high Th values (Figure 7a). Locally, Th exceeds the corresponding present-day temperatures by more than 50 °C. The aqueous inclusions measured within the same fluid inclusion assemblage typically exhibit consistent Th values and vapor-liquid ratios. This uniformity precludes heterogeneous trapping and re-equilibration as causes for the elevated Th values near the TOS II. The most probable explanation is that ascending hot hydrocarbon-bearing fluids induced a transient thermal disequilibrium between the fluids and the adjacent strata near the TOS II during migration.
The degree of clay mineral transformation is a temperature-sensitive indicator. An accelerated illitization process is observed within the depth interval above TOS II (Figure 10). This acceleration, along with a rapid and pronounced increase in the TAI, suggests significant thermal influence from anomalously hot fluids within these strata.
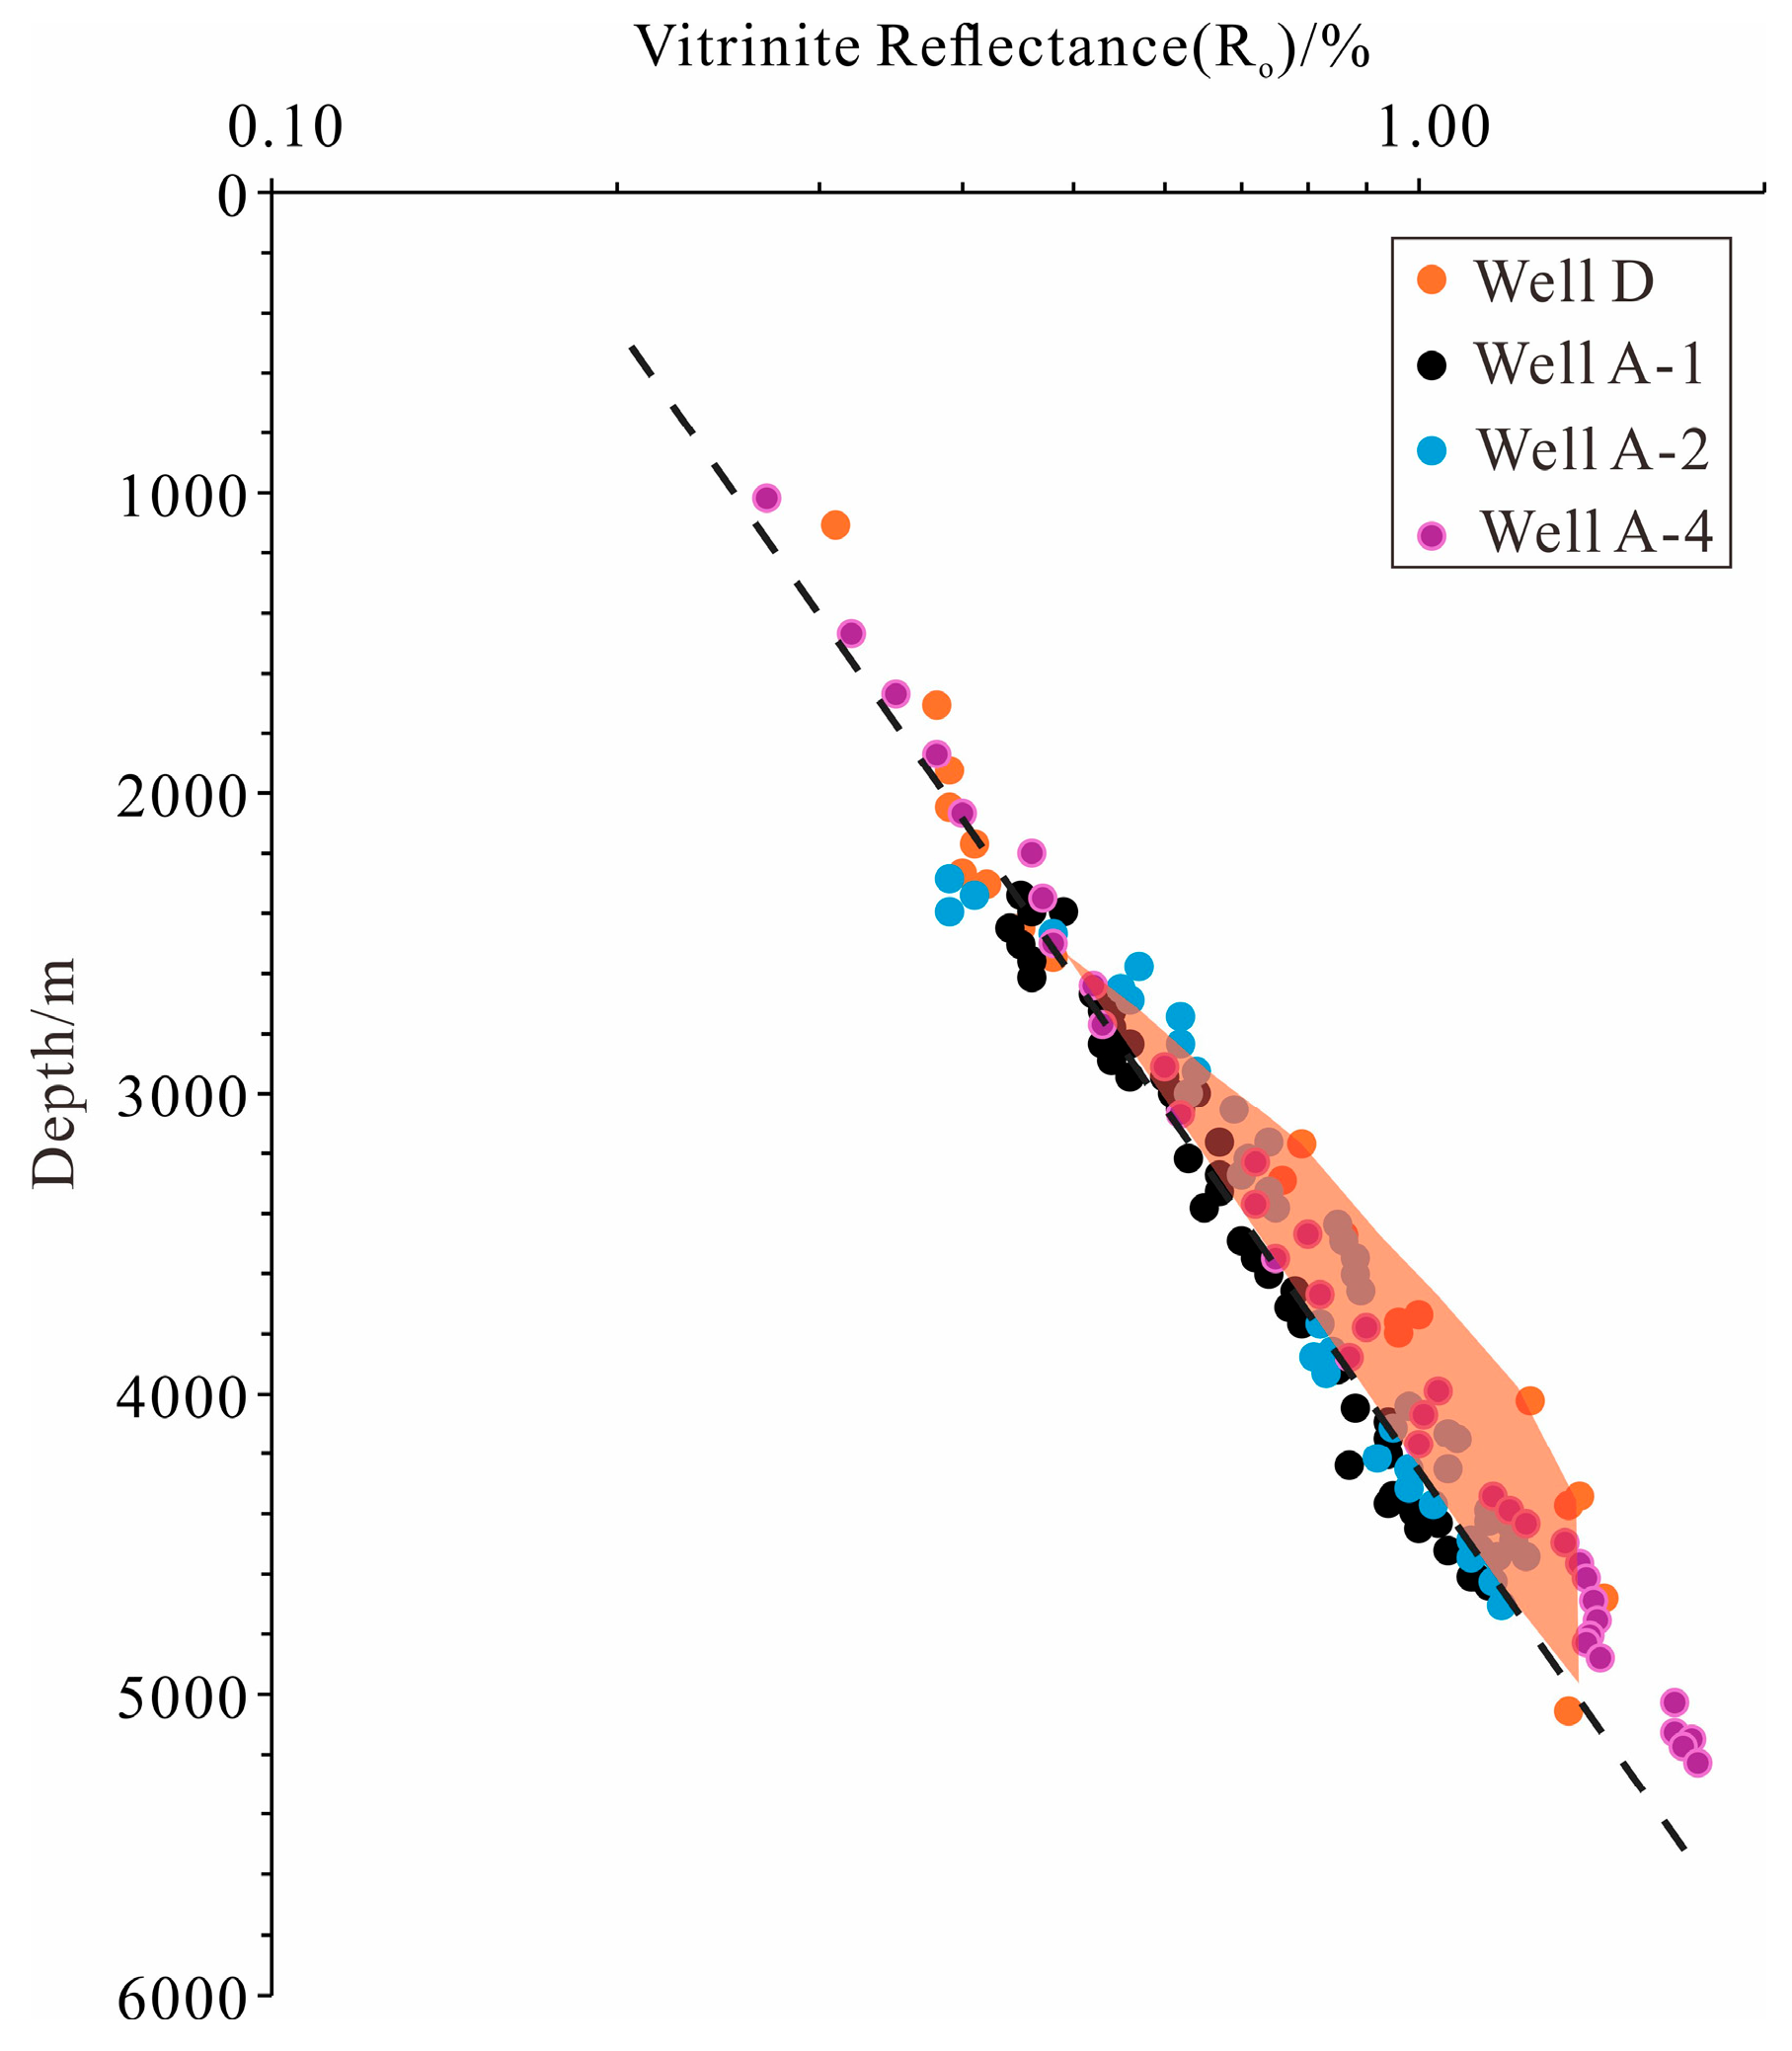
Ro of kerogen is one of the most widely utilized paleogeothermometers. It irreversibly records the maximum temperature attained during geological history. During the thermal maturation of organic matter, the logarithm of Ro usually correlates linearly with depth. The measured Ro values deviate from the expected linear trend, displaying a distinct rightward deviation (Figure 11). The injection of anomalously hot fluids can accelerate organic matter maturation. This indicates the superimposition of an anomalous thermal regime onto the normal background geothermal gradient at these depths. This is interpreted as resulting from the vertical upward migration of hot fluids [28]. Similar occurrences have been documented in the Rocky Mountain Foreland Basin [29].
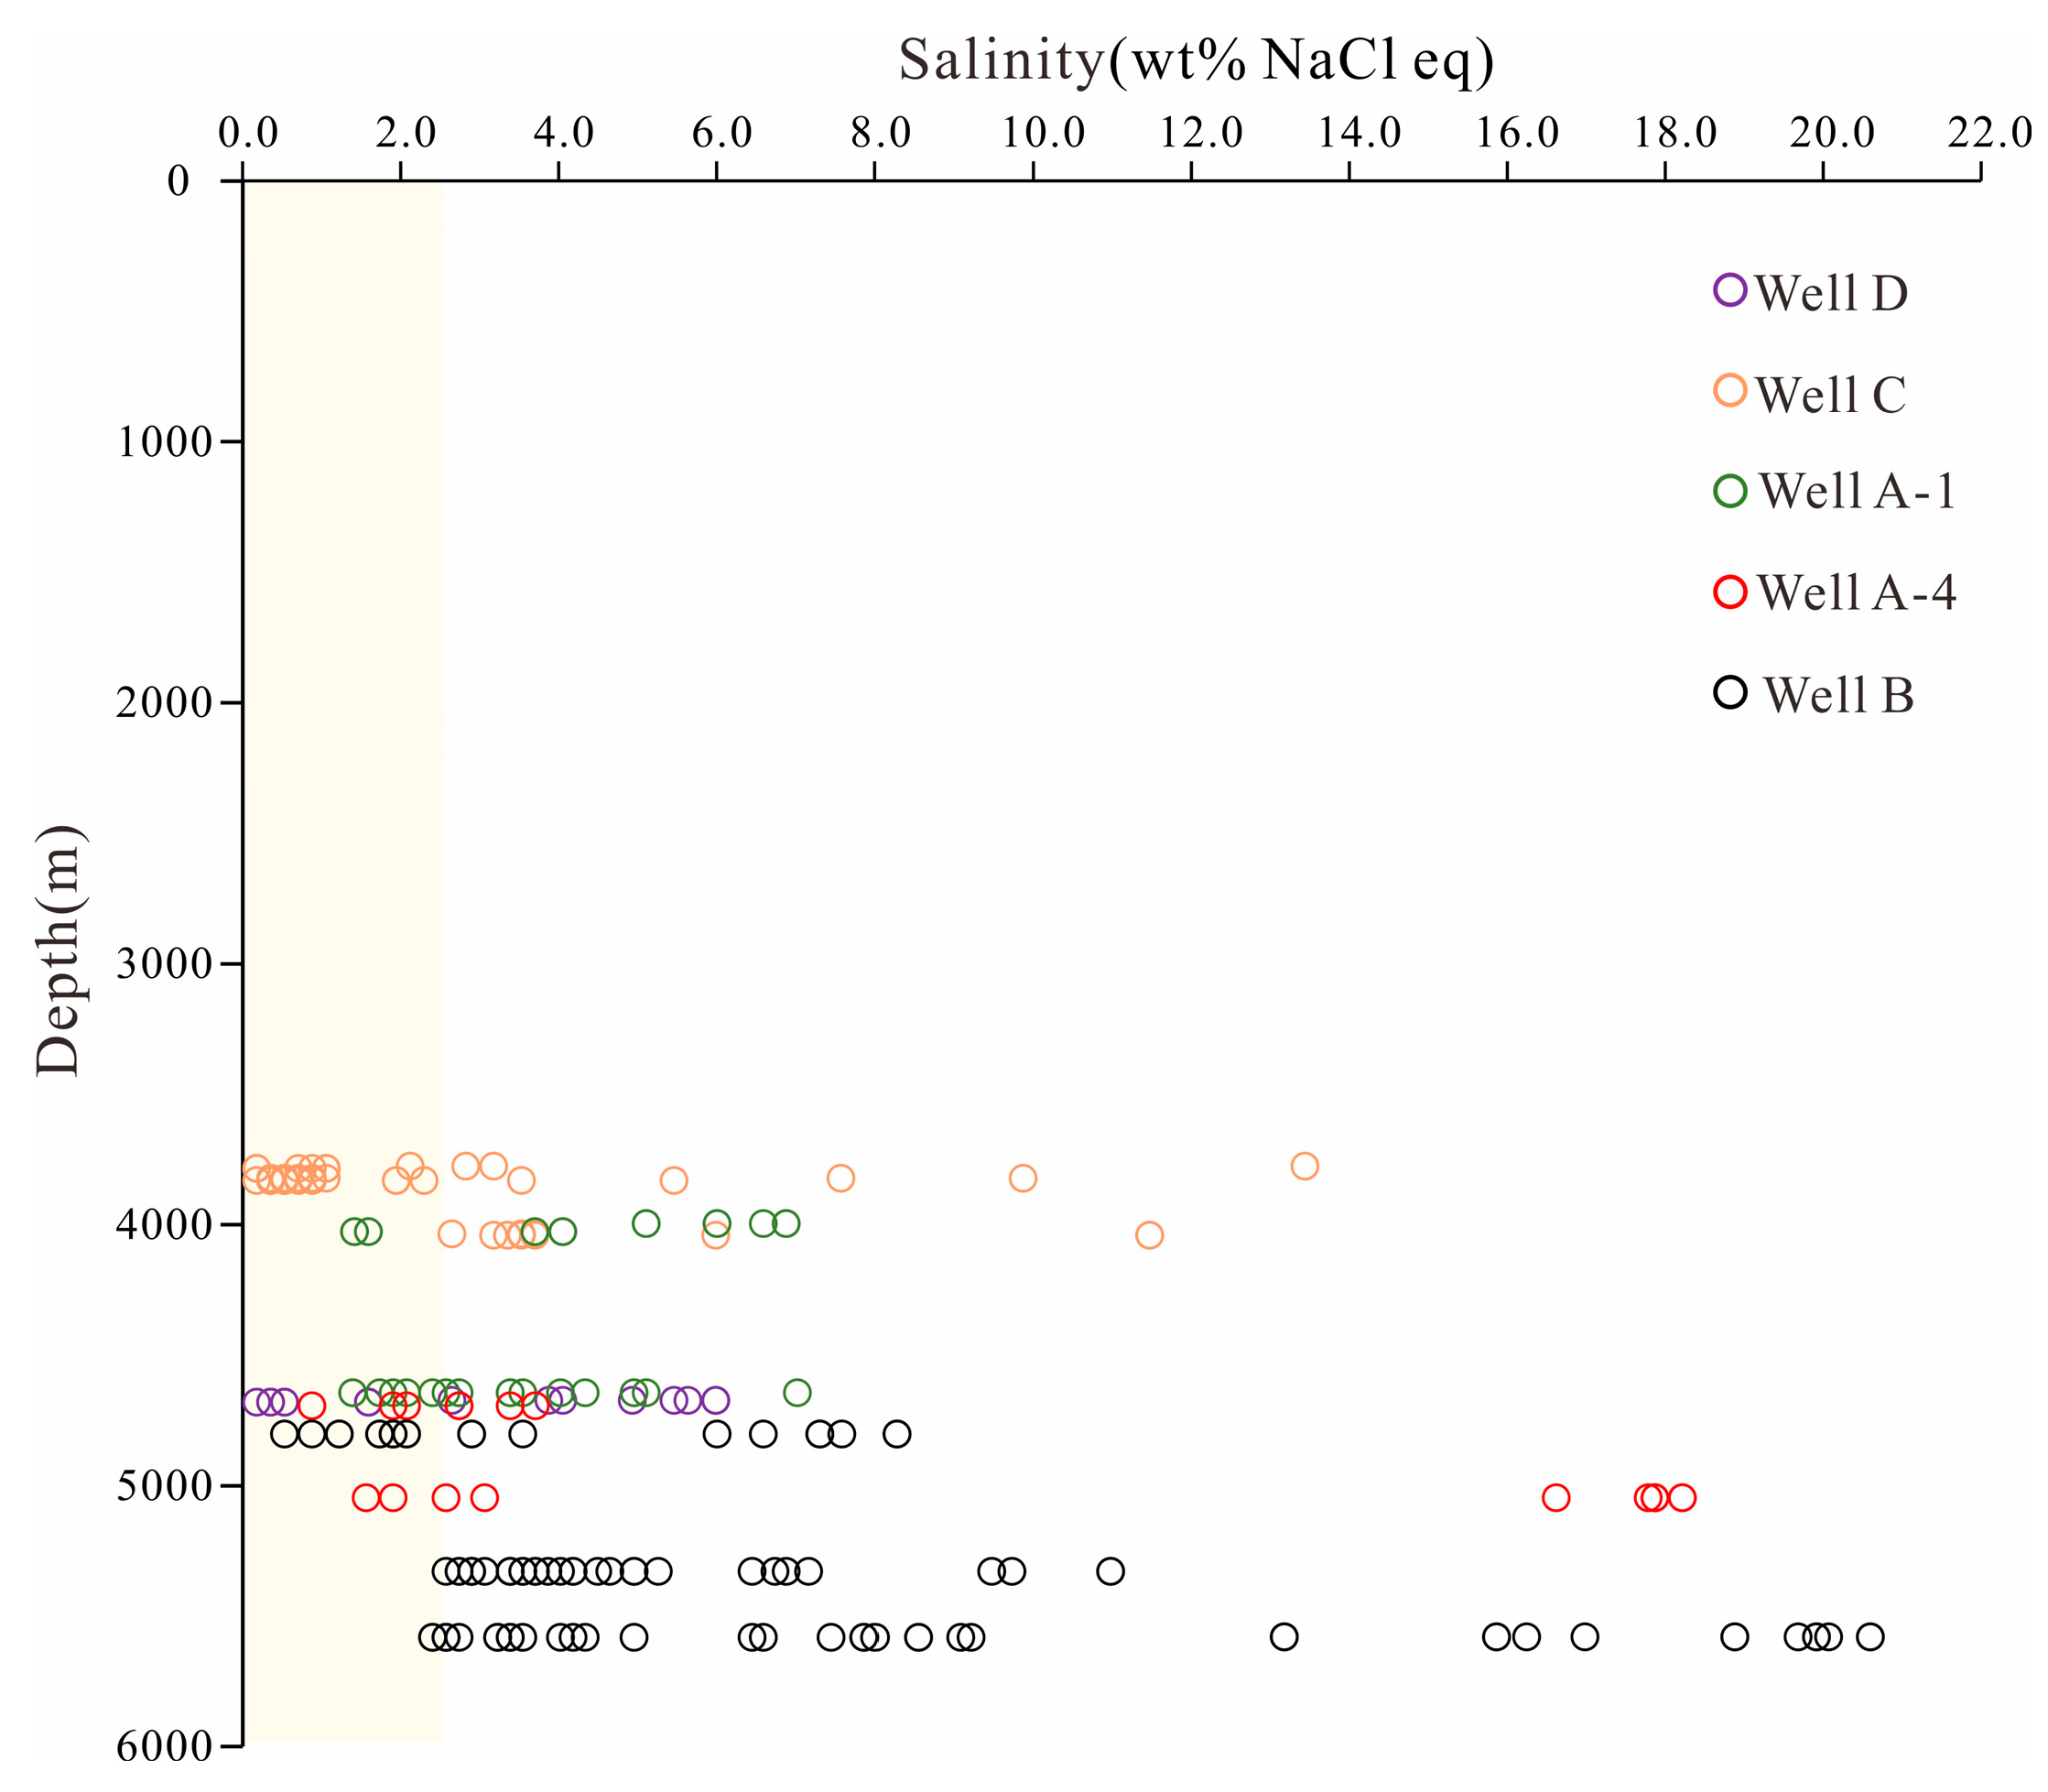
The wide range of water salinities suggests the presence of fluid systems with heterogeneous chemistry. This variability indicates potential mixing between pore waters of different salinities. In generally closed fluid systems, salinity tends to increase with burial depth due to intensified water–rock interactions. The salinity profile shows broadly distributed values. Fluid inclusions from shallower depths include both relatively high-salinity assemblages and low-salinity ranges. In contrast, inclusions from deeper strata exhibit no low-salinity records (Figure 12). This pattern implies that the relatively low salinities may represent local pore water compositions. The higher values likely reflect the contribution of more saline formation waters derived from deeper layers. These deeper highly saline fluids may have migrated upward. Episodic hot pulses, combined with varying degrees of mixing with local pore waters, could account for the broad salinity distribution observed within and near the top of the overpressured compartment.
Hydrothermal fluids within sedimentary basins can originate from multiple sources [30,31], including: (1) brines released by magmatic or metamorphic processes (e.g., magmatic fluids exsolved from cooling magma or metamorphic fluids generated during dehydration reactions); (2) interlayer water heated by magmatic intrusions (e.g., groundwater within sediments warmed by adjacent magmatic bodies); (3) deep-circulating meteoric water via fault systems (i.e., atmospheric precipitation descending along fractures and heated by the geothermal gradient); and (4) ascending deep-seated pore fluids, including deeper connate waters or potentially mantle-derived fluids migrating upward through crustal pathways.
In the study area of the western Qiongdongnan Basin, seismic reflection indicates an absence of significant volcanic activity or mud diapirism. Large fault systems are also relatively sparse. Notably, hydrothermal fluid activity is predominantly concentrated near the top surface of the deep-seated, high-pressure compartment. This spatial association suggests that the thermal pulses were likely triggered by pressure release. Measured pore pressure values confirm the development of high pressures in deep strata. The fracture pressure gradient for the study area cannot be directly determined due to the absence of leak-off test data in this well. However, using an average density of 2.54 g/cm3 derived from log data, the lithostatic pressure gradient is estimated to be approximately 2.49 MPa/100 m. The pore pressure gradient in the underlying overpressured compartment thus approaches the lithostatic gradient, indicating a potential risk of reservoir fracturing. Rapid expulsion of overpressured fluids from lower compartments can occur when pore pressure reaches the rock fracture pressure. This process facilitates upward fluid migration through the strata via hydraulic fracturing. Analogous cases of natural hydraulic fracturing driven by overpressure are widely documented in sedimentary basins globally, such as the Wessex Basin, England, and the Neuquén Basin, Argentina [32,33]. The hydrothermal fluid activity directly above the deep overpressure zone may be episodic. There is potential for numerous discrete hot pulses, each associated with cyclical phases of pressure accumulation and subsequent release.

5.4. Implications for Hydrocarbon Accumulation

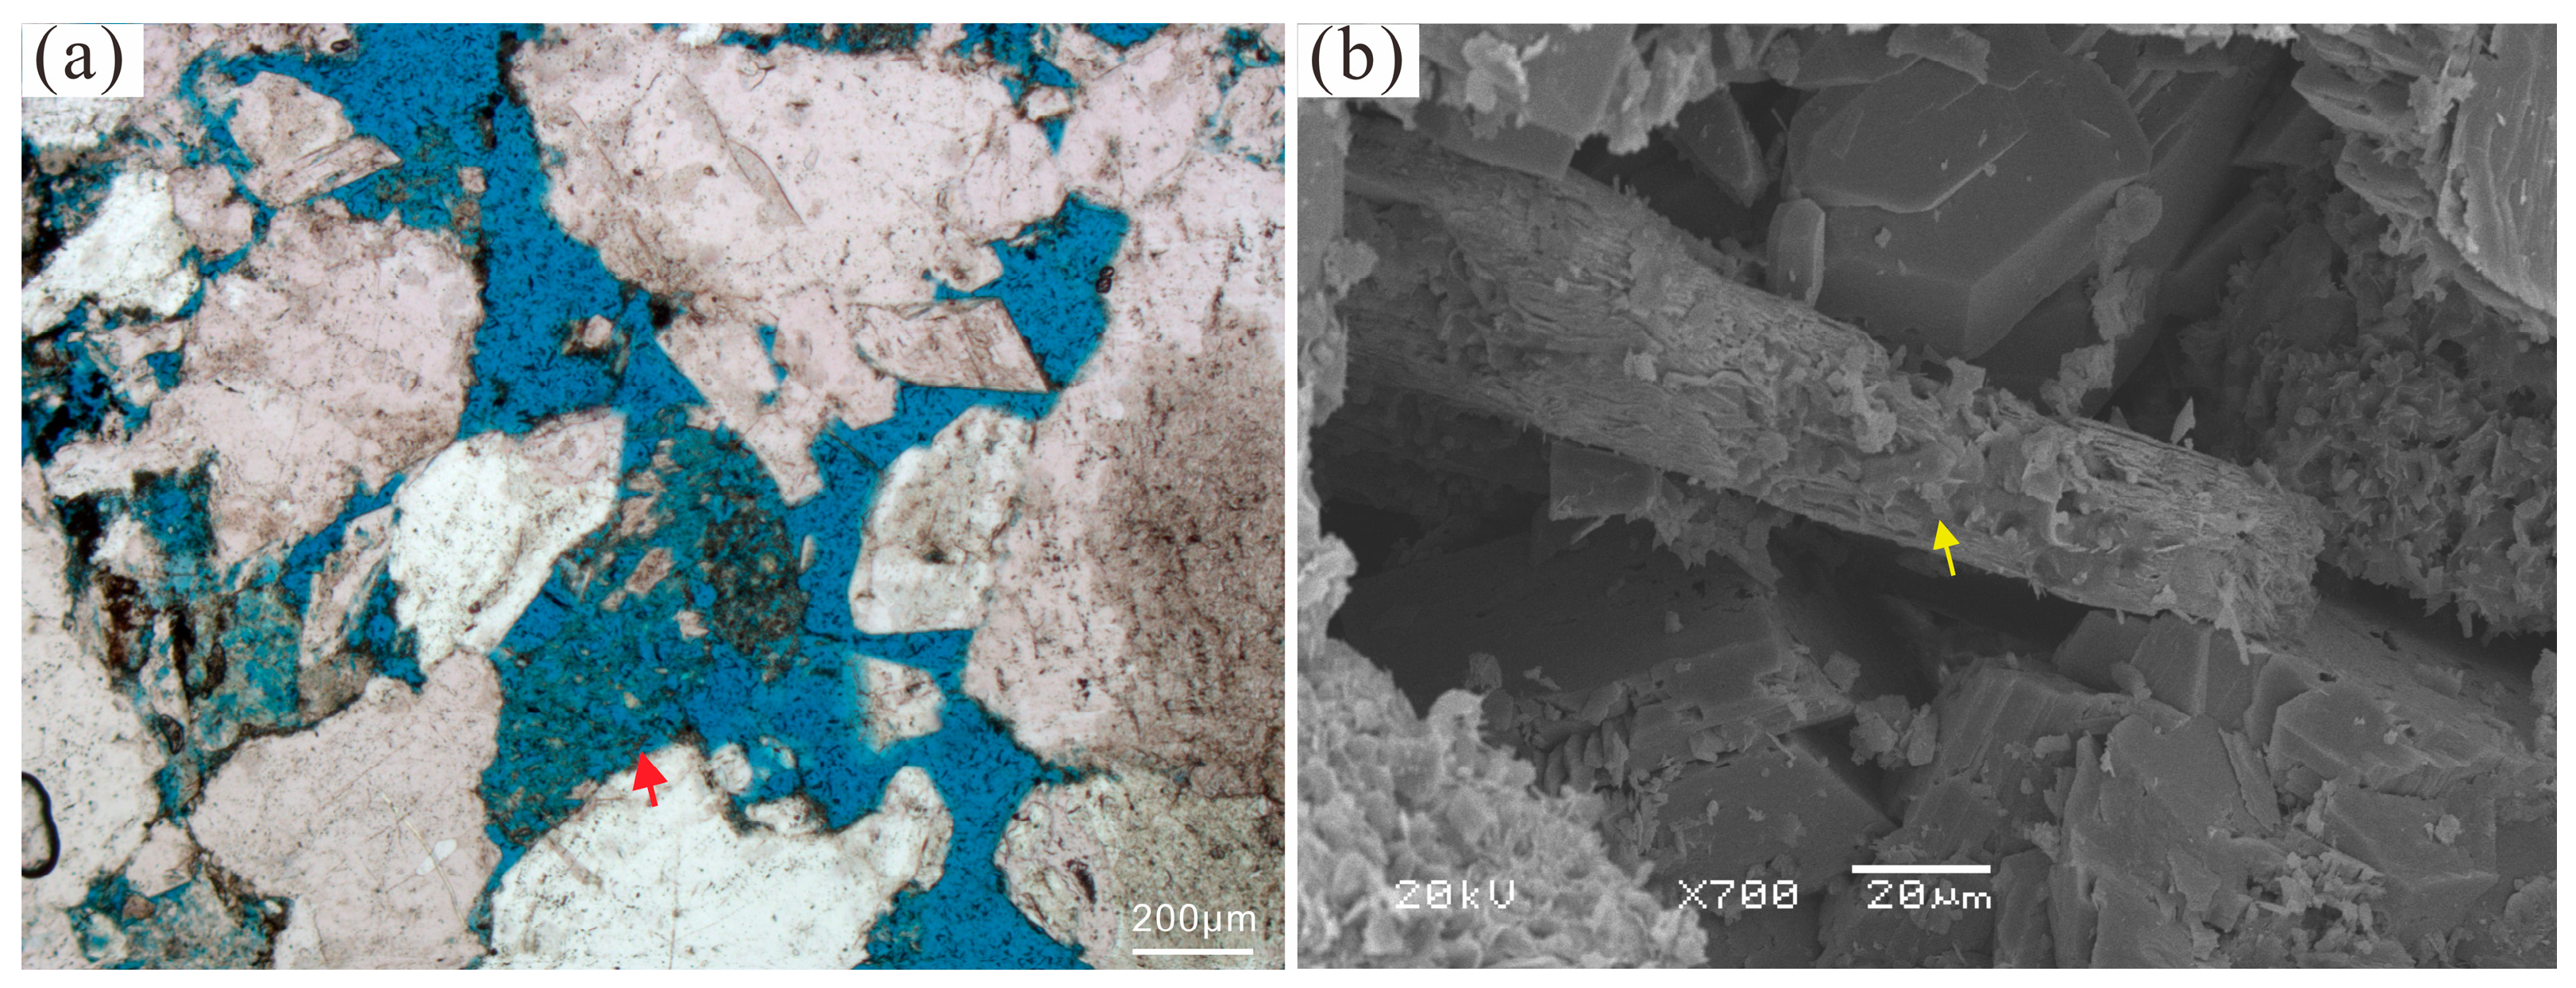
Laser Raman spectroscopy analyses of gas-bearing aqueous inclusions and gas-rich inclusions in intervals overlying the TOS II confirm the presence of hydrocarbon gases (dominantly methane) and acid gases (CO2). This indicates that ascending hydrothermal fluids above TOS II carry both hydrocarbons and acidic components. Given the critical role of hydrocarbon generation in deep overpressure development, substantial volumes of hydrocarbons have migrated into TOS II-proximal strata. This establishes this zone as a high-priority exploration target. Significantly, the top of the deep overpressure compartment coincides with preferential reservoir development zones. Fluids expelled from this overpressured system exhibit three key characteristics: (1) elevated acidity (notably CO2 enrichment), (2) elevated temperatures, and (3) high flow velocities. These properties collectively enhance fluid corrosiveness. The anomalous thermal regime accelerates smectite-to-illite transformation, releasing additional H+ that further increases acidity. Concurrently, elevated temperature and pressure conditions promote dissolution reactions while increasing mineral solubility. Rapid fluid flow enhances physical leaching and dissolution efficacy. Cast thin sections show that the reservoirs near TOS II exhibit dissolution textures, such as lithic fragments being almost completely dissolved (Figure 13a). During feldspar dissolution, the migration rate of Al3+ shows a positive correlation with pore-water velocity; high flow rates accelerate the export of Al3+, thereby amplifying secondary porosity generation [34,35]. Scanning electron microscope examinations have frequently identified signs of intensive feldspar dissolution in the reservoirs near TOS II (Figure 13b). Conversely, overpressured fluids that migrate above the TOS I contain negligible hydrocarbons, as overpressure primarily derives from disequilibrium compaction and clay diagenesis rather than hydrocarbon generation. Consequently, TOS I-adjacent intervals represent high-risk drilling targets with limited potential for hydrocarbon accumulation.

6. Conclusions

(1) Vertically, the overpressured formations are compartmentalized into two distinct units: overpressure compartment I and II. Shallow overpressures primarily originate from disequilibrium compaction and illitization. Numerical pressure modeling reveals that paleo-overpressure within the deeper compartment II developed during the late stage (post–5 Ma). This timing correlates with both: (i) gas-charging events constrained by fluid inclusions (4.2–0 Ma), and (ii) the simulated period of peak gas generation in the Yanan Sag. Such synchronicity establishes a direct genetic linkage between deep overpressure development and thermogenic gas generation.
(2) When fluid pressure in the lower overpressure compartment approaches or exceeds fracture pressure, episodic pressure release triggers rapid fluid expulsion. The subsequent upward migration of hot fluids creates a distinct thermal anomaly near TOS II. This thermal anomaly is evidenced by elevated fluid-inclusion Th data, increased Ro, accelerated illitization, and significantly enhanced TAI values.
(3) Hydrocarbon-bearing acidic hot fluids migrated into strata adjacent to the TOS II, triggering secondary dissolution and fracture formation in reservoirs and thereby establishing preferential zones for hydrocarbon accumulation.

Author Contributions

Conceptualization, D.Z. and H.L.; methodology, H.H.; software, X.H. and L.Z.; formal analysis, H.H.; investigation, H.H.; data curation, H.H. and X.H.; writing—original draft preparation, D.Z.; writing—review and editing, H.L., X.H. and L.Z.; visualization, L.Z.; supervision, R.W. and H.L.; project administration, R.W. and H.H.; funding acquisition, R.W. All authors have read and agreed to the published version of the manuscript.

Funding

This research was supported by the Soft Science Research Program of Guangdong Province (Grant No. 2018B 030323028) and the Research Project of CNOOC (China) Company Limited (Grant No. YXKY0ZX03-2021).

Data Availability Statement

If readers want to access the data, they can obtain the original data by contacting the corresponding author.

Conflicts of Interest

Authors Dongfeng Zhang, Ren Wang, Heting Huang, Xiangsheng Huang and Lei Zheng were employed by CNOOC Energy Technology & Services Oil Field Engineering Research Institute. The remaining authors declare that the research was conducted in the absence of any commercial or financial relationships that could be construed as a potential conflict of interest.

References

  1. Hu, B.; Wang, L.; Yan, W.; Liu, S.; Cai, D.; Zhang, G.; Sun, B. The tectonic evolution of the Qiongdongnan Basin in the northern margin of the South China Sea. J. Asian Earth Sci. 2013, 77, 163–182. [Google Scholar] [CrossRef]
  2. Zhao, Z.; Sun, Z.; Sun, L.; Wang, Z.; Sun, Z. Cenozoic tectonic subsidence in the Qiongdongnan basin, northern South China Sea. Basin Res. 2018, 30, 269–288. [Google Scholar] [CrossRef]
  3. Wei, X.; Liu, K.; Yuan, W.; Yang, P.; Zhou, L.; Liu, J.; Yang, H.; Ding, X. Direct evidence of gas flushing oil in deep reservoirs: Insight from integrated fluid inclusion analyses. Org. Geochem. 2024, 192, 104778. [Google Scholar] [CrossRef]
  4. Yang, P.; Liu, K.; Evans, N.J.; Zhang, S.; Li, Z.; Su, J.; Rankenburg, K.; Liu, J.; McInnes, B.I.A. Petroleum accumulation history of deeply buried carbonate reservoirs in the northern Tarim Basin, northwestern China. AAPG Bull. 2024, 108, 1193–1229. [Google Scholar] [CrossRef]
  5. Su, A.; Chen, H.; Zhao, J.X.; Feng, Y.X. Integrated fluid inclusion analysis and petrography constraints on the petroleum system evolution of the central and southern Biyang Sag, Nanxiang Basin, Eastern China. Mar. Pet. Geol. 2020, 118, 104437. [Google Scholar] [CrossRef]
  6. Liu, K.; Bourdet, J.; Zhang, B.; Zhang, N.; Lu, X.; Liu, S.; Pang, H.; Li, Z.; Guo, X. Hydrocarbon charge history of the Tazhong Ordovician reservoirs, Tarim Basin as revealed from an integrated fluid inclusion study. Pet. Explor. Dev. 2013, 40, 183–193. [Google Scholar] [CrossRef]
  7. Guo, X.; Liu, K.; Jia, C.; Song, Y.; Zhao, M.; Lu, X. Effects of early petroleum charge and overpressure on reservoir porosity preservation in the giant Kela-2 gas field, Kuqa depression, Tarim Basin, northwest China. AAPG Bull. 2016, 100, 191–212. [Google Scholar] [CrossRef]
  8. Su, A.; Chen, H.; Feng, Y.X.; Zhao, J.X.; Wang, Z.; Hu, M.; Jiang, H.; Nguyen, A.D. In situ U-Pb dating and geochemical characterization of multi-stage dolomite cementation in the Ediacaran Dengying Formation, Central Sichuan Basin, China: Constraints on diagenetic, hydrothermal and paleo-oil filling events. Precambrian Res. 2022, 368, 106481. [Google Scholar] [CrossRef]
  9. Su, A.; Chen, H.; Feng, Y.X.; Zhao, J.X.; Nguyen, A.D.; Wang, Z.; Long, X. Dating and characterizing primary gas accumulation in Precambrian dolomite reservoirs, Central Sichuan Basin, China: Insights from pyrobitumen Re-Os and dolomite U-Pb geochronology. Precambrian Res. 2020, 350, 105897. [Google Scholar] [CrossRef]
  10. Zanella, A.; Cobbold, P.R. Influence of fluid overpressure, maturation of organic matter, and tectonic context during the development of ‘beef’: Physical modelling and comparison with the Wessex Basin, SW England. In Proceedings of the EGU General Assembly, Vienna, Austria, 3–8 April 2011; Geophysical Research Abstracts. Volume 13. [Google Scholar]
  11. Rodrigues, N.; Cobbold, P.R.; Løseth, H.; Ruffet, G. Widespread bedding-parallel veins of fibrous calcite (“beef”) in a mature source rock (Vaca Muerta Fm, Neuquén Basin, Argentina): Evidence for overpressure and horizontal compression. J. Geol. Soc. Lond. 2009, 166, 695–709. [Google Scholar] [CrossRef]
  12. Bodnar, R.J. Revised equation and table for determining the freezing point depression of H2O-NaCl solutions. Geochim. Cosmochim. Acta 1993, 57, 683–684. [Google Scholar] [CrossRef]
  13. Wilkinson, M.; Darby, D.; Haszeldine, R.S.; Couples, G.D. Secondary porosity generation during deep burial associated with overpressure leak-off: Fulmar formation, United Kingdom central graben. AAPG Bull. 1997, 81, 803–813. [Google Scholar] [CrossRef]
  14. Parnell, J. Geofluids: Origin, Migration and Evolution of Fluids in Sedimentary Basins; Geological Society: London, UK, 1994. [Google Scholar]
  15. Su, A.; Wang, Z.; Chen, H.; Feng, Y.X.; Zhao, J.X.; Jiang, H.; Sun, P. Temporal constraints on hydrothermal circulation associated with strike-slip faulting in the Permian Maokou carbonates, central Sichuan Basin (SW China). Mar. Pet. Geol. 2024, 160, 106643. [Google Scholar] [CrossRef]
  16. Smith, L.B.; Davies, G.R. Structurally controlled hydrothermal alteration of carbonate reservoirs: Introduction. AAPG Bull. 2006, 90, 1635–1640. [Google Scholar] [CrossRef]
  17. Su, A.; Chen, H.; Feng, Y.X.; Zhao, J.X.; Liu, Q. Igneous intrusion drives in-reservoir oil thermal cracking: A case from the Subei Basin, eastern China. AAPG Bull. 2024, 108, 2045–2072. [Google Scholar] [CrossRef]
  18. Xie, X.; Li, S.; Dong, W.; Hu, Z. Evidence for episodic expulsion of hot fluids along faults near diapiric structures of the Yinggehai Basin, South China Sea. Mar. Pet. Geol. 2001, 18, 715–728. [Google Scholar] [CrossRef]
  19. Tingay, M.R.; Hillis, R.R.; Swarbrick, R.E.; Morley, C.K.; Damit, A.R. ‘Vertically transferred’ overpressures in Brunei: Evidence for a new mechanism for the formation of high-magnitude overpressure. Geology 2007, 35, 1023–1026. [Google Scholar] [CrossRef]
  20. Gudmundsson, A. Fluid overpressure and flow in fault zones: Field measurements and models. Tectonophysics 2001, 336, 183–197. [Google Scholar] [CrossRef]
  21. Su, A.; Chen, H.; Chen, X.; Liu, H.; Liu, Y.; Lei, M. New insight into origin, accumulation and escape of natural gas in the Songdong and Baodao regions in the eastern Qiongdongnan basin, South China Sea. J. Nat. Gas Sci. Eng. 2018, 52, 467–483. [Google Scholar] [CrossRef]
  22. Zhu, W.; Huang, B.; Mi, L.; Wilkins, R.W.; Fu, N.; Xiao, X. Geochemistry, origin, and deep-water exploration potential of natural gases in the Pearl River Mouth and Qiongdongnan basins, South China Sea. AAPG Bull. 2009, 93, 741–761. [Google Scholar] [CrossRef]
  23. Hantschel, T.; Kauerauf, A.I. Fundamentals of Basin and Petroleum Systems Modeling; Springer: Berlin/Heidelberg, Germany, 2009; pp. 1–476. [Google Scholar]
  24. Su, A.; Chen, H.; Lei, M.; Li, Q.; Wang, C. Paleo-pressure evolution and its origin in the Xihu slope belt of the Xihu Depression, East China Sea Basin. Mar. Pet. Geol. 2019, 107, 198–213. [Google Scholar] [CrossRef]
  25. van Ruth, P.; Hillis, R. Estimating pore pressure in the Cooper Basin, South Australia: Sonic log method in an uplifted basin. Explor. Geophys. 2000, 31, 441–447. [Google Scholar] [CrossRef]
  26. Hu, Z. Study on Petroleum Generation Kinetics of Source Rocks and Gas Pool Formation in Yanan Depression of the Qiongdongnan Basin. Ph.D. Thesis, Guangzhou Institute of Geochemistry, Chinese Academy of Sciences, Guangzhou, China, 2005. (In Chinese). [Google Scholar]
  27. Barker, C. Development of abnormal and subnormal pressures in reservoirs containing bacterially generated gas. AAPG Bull. 1987, 71, 1404–1413. [Google Scholar] [CrossRef]
  28. Luo, X.; Vasseur, G. Contributions of compaction and aquathermal pressuring to geopressure and the influence of environmental conditions. AAPG Bull. 1992, 76, 1550–1559. [Google Scholar] [CrossRef]
  29. Su, A.; Chen, H.; He, C.; Lei, M.; Liu, Y. Complex accumulation and leakage of YC21-1 gas bearing structure in Yanan sag, Qiongdongnan basin, South China Sea. Mar. Pet. Geol. 2017, 88, 798–813. [Google Scholar] [CrossRef]
  30. Colten-Bradley, V.A. Role of pressure in smectite dehydration—Effects on geopressure and smectite-to-illite transformation. AAPG Bull. 1987, 71, 1414–1427. [Google Scholar]
  31. Lahann, R.W.; Swarbrick, R.E. Overpressure generation by load transfer following shale framework weakening due to smectite diagenesis. Geofluids 2011, 11, 362–375. [Google Scholar] [CrossRef]
  32. Carcione, J.M.; Gangi, A.F. Gas generation and overpressure: Effects on seismic attributes. Geophysics 2000, 65, 1769–1779. [Google Scholar] [CrossRef]
  33. Tissot, B.P.; Welte, D.H. Petroleum Formation and Occurrence; Springer: Berlin/Heidelberg, Germany, 2013. [Google Scholar]
  34. Su, A.; Chen, H.; Yang, W.; Feng, Y.X.; Zhao, J.X.; Lei, M. Hydrocarbon gas leakage from high-pressure system in the Yanan Sag, Qiongdongnan Basin, South China Sea. Geol. J. 2021, 56, 5094–5108. [Google Scholar] [CrossRef]
  35. Law, B.E.; Nuccio, V.F.; Barker, C.E. Kinky vitrinite reflectance well profiles: Evidence of paleopore pressure in low-permeability, gas-bearing sequences in Rocky Mountain foreland basins. AAPG Bull. 1989, 73, 999–1010. [Google Scholar]
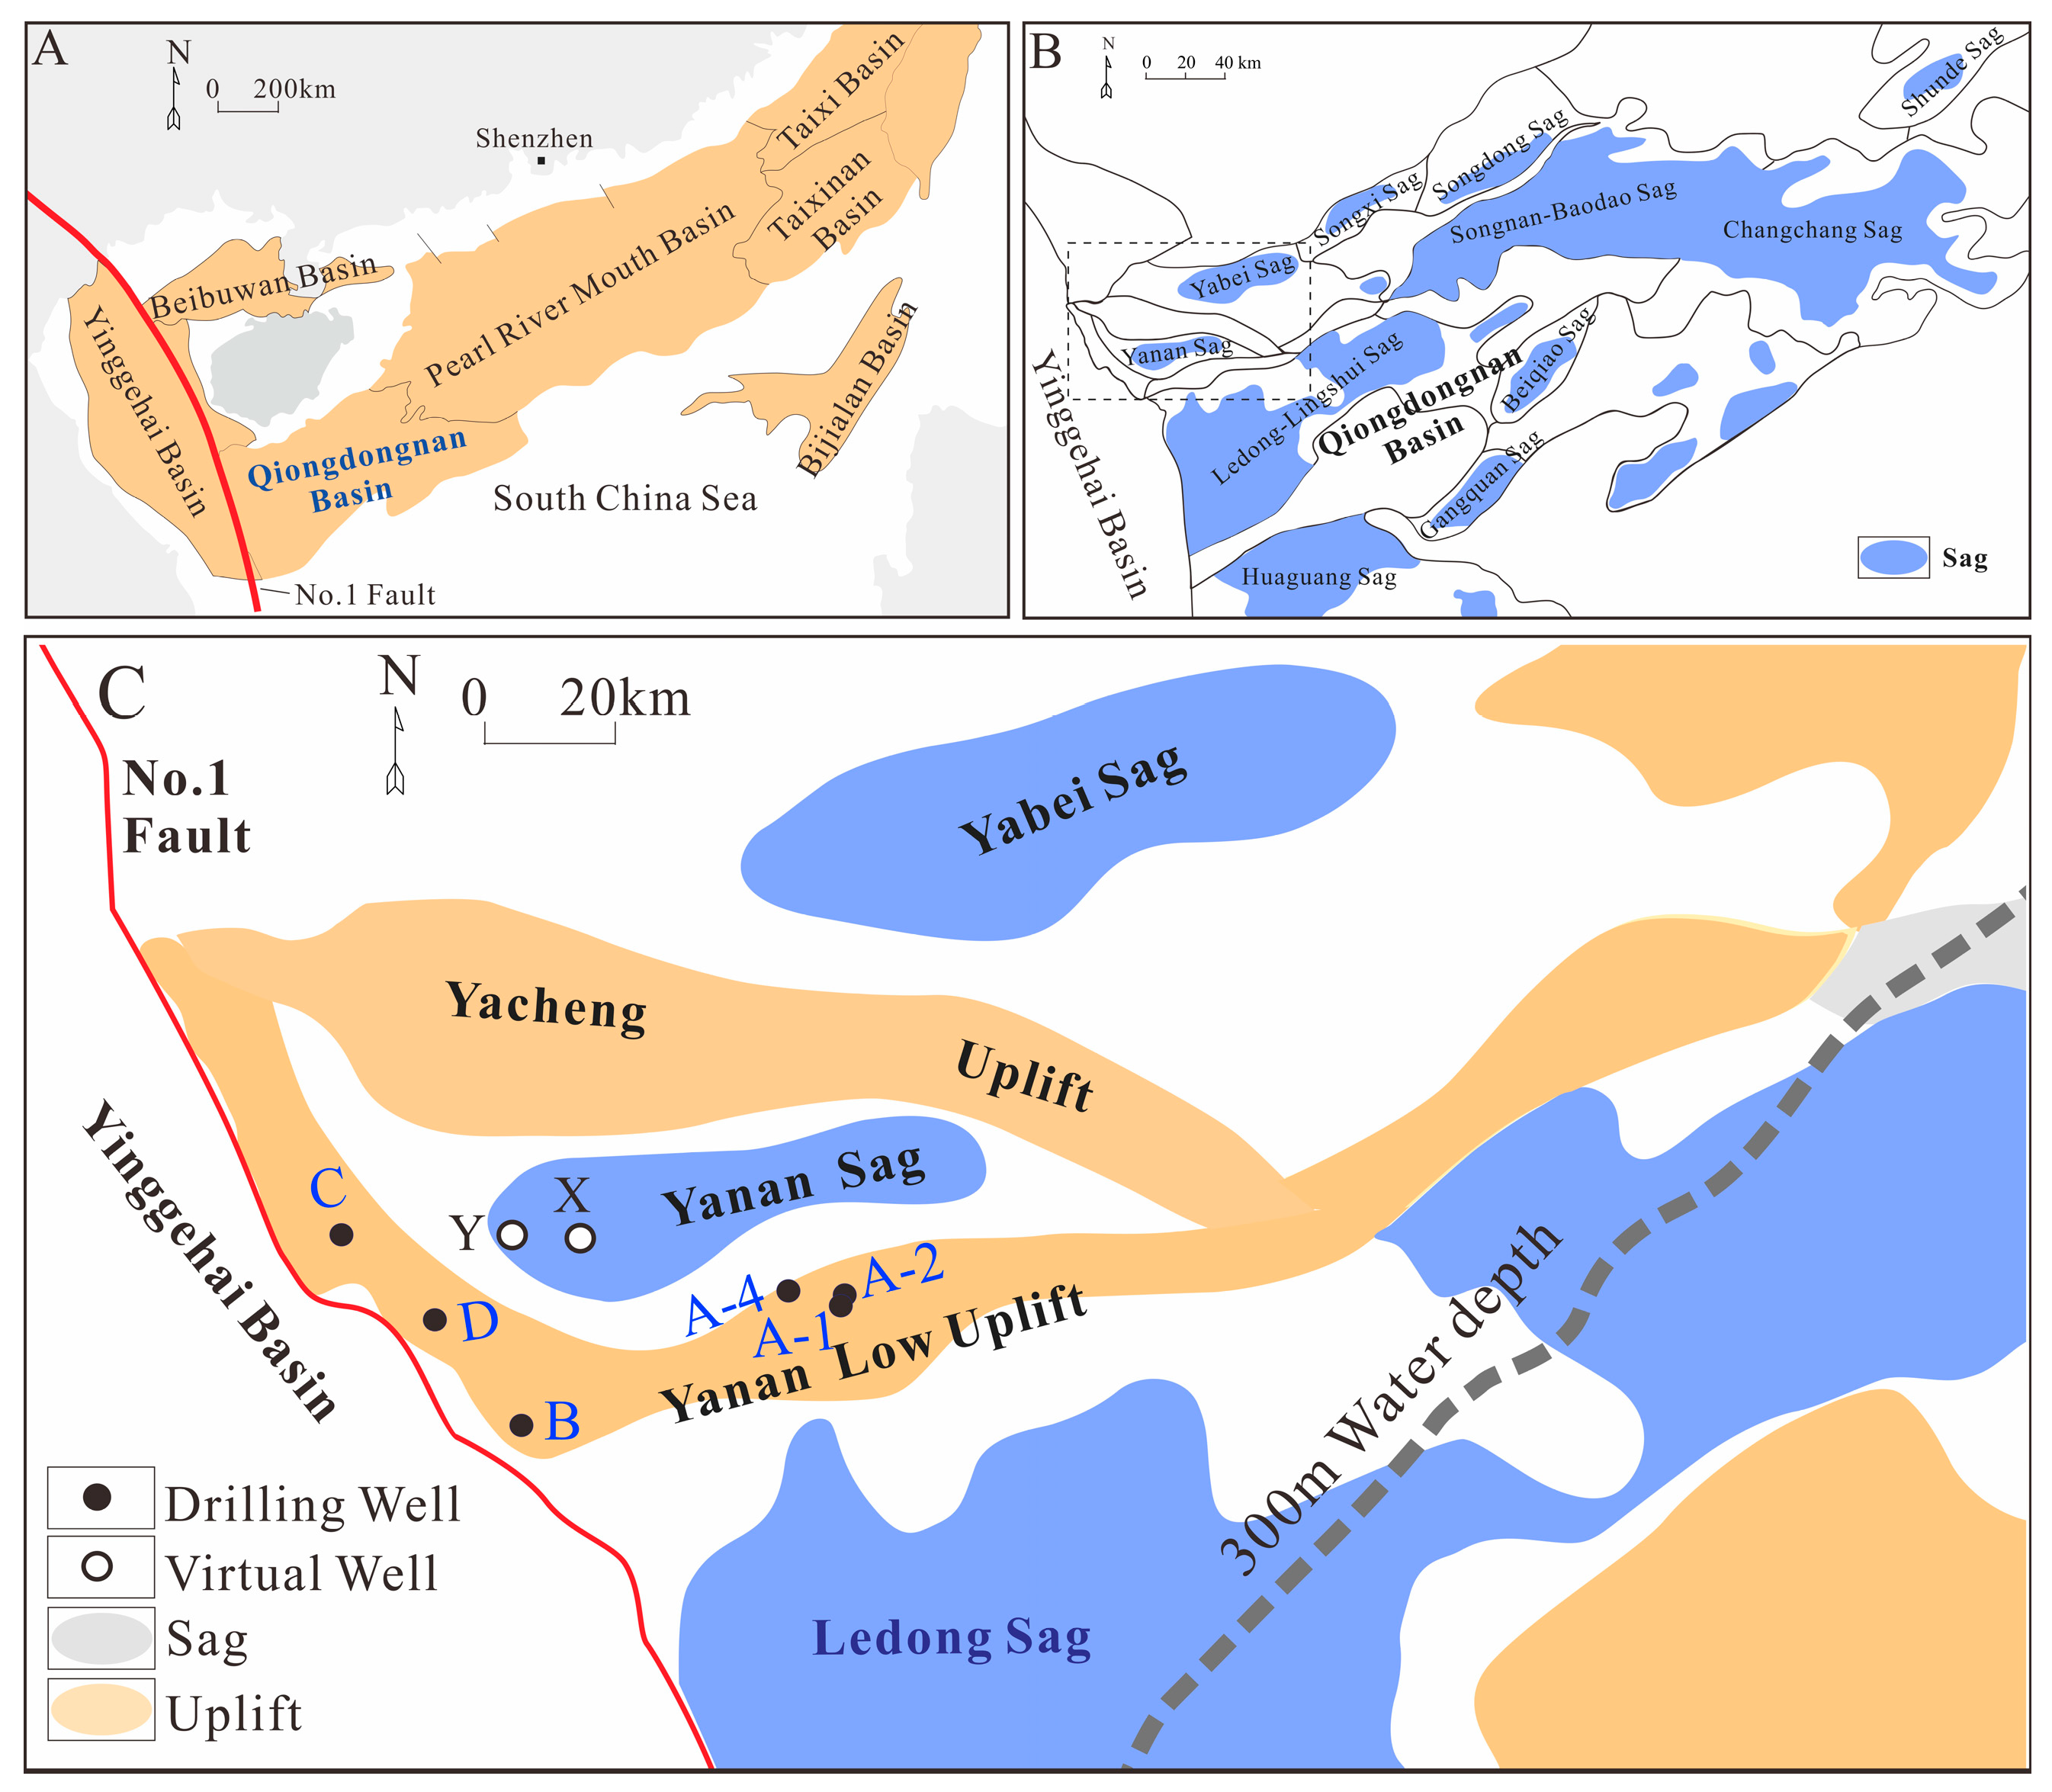
Figure 1. Structural and geological characteristics of the Qiongdongnan Basin. (A) Regional location map of the Qiongdongnan Basin. (B) Structural subdivision map of the Qiongdongnan Basin. (C) Structural units and partial well locations in the periclinal periphery of the Yanan Sag.
Applsci 15 10587 g001
Figure 2. Stratigraphic, sedimentary facies, and major tectonic events in the Yanan Sag.
Applsci 15 10587 g002
Figure 3. Sonic profile of connecting representative wells, showing the presence of two vertical overpressure compartments.
Applsci 15 10587 g003
Figure 4. Measured pore pressure coefficients of representative wells, showing the development of high pressure.
Applsci 15 10587 g004
Figure 5. Representative photomicrographs of fluid inclusions in the study area. (a) Fluid inclusions hosted in healed fractures transecting quartz grains. (b) Transparent, vapor-liquid two-phase aqueous fluid inclusions. (c) Gas inclusions in internal fractures of quartz grains. (d) Pure gas inclusions.
Applsci 15 10587 g005
Figure 6. Raman spectra of gas inclusions showing CO2 and methane as the major components.
Applsci 15 10587 g006
Figure 7. (a) Comparison between measured formation temperatures and homogenization temperatures of fluid inclusions. (b) Box plot showing the distribution of homogenization temperatures.
Applsci 15 10587 g007
Figure 8. Histogram of salinity for measured fluid inclusions.
Applsci 15 10587 g008
Figure 9. (a) Burial-thermal history of representative well Well A-1; (b) gas charge timing determined by homogenization temperatures of fluid inclusions from multiple single-well samples, with the corresponding data points indicated by black arrows; (c) hydrocarbon generation history of source rocks in the Middle Yacheng Formation penetrated by two pseudo-wells in the Yanan Sag; (d) simulated palaeo-pressure evolution history for the Yacheng Formation in Well A-4.
Applsci 15 10587 g009
Figure 10. Depth profiles of lithology, sonic, mud weight, thermal alteration index, I-S & Smectite, and S1 + S2 for Well B.
Applsci 15 10587 g010
Figure 11. Cross-plot of measured Ro and depth.
Applsci 15 10587 g011
Figure 12. Cross-plot of measured fluid-inclusion salinity versus depth.
Applsci 15 10587 g012
Figure 13. Dissolution characteristics of the reservoirs near TOS II in the study area; (a) Cast thin section photograph showing intense dissolution of debris (red arrow), Well A-3, 4635.17 m; (b) Scanning electron microscope photograph showing dissolution of feldspar (yellow arrow), Well A-3, 4632 m.
Applsci 15 10587 g013
Table 1. Measured pore pressure data in the study area.
WellPressure Test TypeDepth/mMeasured Pore Pressure/MPaPressure
Coefficient
Well DRFT463981.2 1.7
467381.8 1.7
479081.9 1.66
Well CRFT379770.0 1.79
381770.4 1.79
384570.5 1.78
397747.9 1.17
406749.0 1.17
Well A-3DST4612107.8 2.27
4650104.9 2.19
Well A-4RFT4939112.4 2.21
4943112.5 2.21
5089.5115.3 2.2
5092.5115.4 2.2
5103115.6 2.2
Disclaimer/Publisher’s Note: The statements, opinions and data contained in all publications are solely those of the individual author(s) and contributor(s) and not of MDPI and/or the editor(s). MDPI and/or the editor(s) disclaim responsibility for any injury to people or property resulting from any ideas, methods, instructions or products referred to in the content.