Article

Ensemble-IDS: An Ensemble Learning Framework for Enhancing AI-Based Network Intrusion Detection Tasks

1
Computer and Information Technology Department, Purdue University, Indianapolis, IN 46202, USA
2
Electrical and Computer Engineering Department, Purdue University, Indianapolis, IN 46202, USA
3
Department of Information Technology, College of Computer and Information Sciences, Princess Nourah bint Abdulrahman University, Riyadh 11671, Saudi Arabia
*
Author to whom correspondence should be addressed.
Appl. Sci. 2025, 15(19), 10579; https://doi.org/10.3390/app151910579
Submission received: 6 September 2025 / Revised: 25 September 2025 / Accepted: 26 September 2025 / Published: 30 September 2025

Abstract

Modern cybersecurity threats continue to evolve in both complexity and prevalence, demanding advanced solutions for intrusion detection. Traditional AI-based detection systems face significant challenges in model selection, as performance varies considerably across different network environments and attack scenarios. To overcome these limitations, we propose a comprehensive ensemble learning approach that systematically integrates feature selection, model optimization, and rigorous evaluation components. Our framework evaluates fourteen distinct machine learning approaches, ranging from individual classifiers to sophisticated ensemble methods including bagging, boosting, and hybrid stacking/blending architectures. These techniques are applied to multiple base algorithms such as neural networks and tree-based models. Extensive testing was conducted on two complementary benchmark datasets (RoEduNet-SIMARGL2021 and CICIDS-2017) to assess detection capabilities across varied threat landscapes. Our experimental results revealed several key findings. Ensemble techniques universally surpass standalone models in detection accuracy, with random forest achieving the best performance on RoEduNet-SIMARGL2021, while the blending and bagging methods approach yielded perfect scores (F1 > 0.996) on CICIDS-2017. Feature selection via information gain demonstrated particular value, reducing model training times by 94% while maintaining detection accuracy. Among ensemble methods, XGBoost showed exceptional computational efficiency, whereas stacking and blending architectures delivered maximum accuracy at the expense of greater resource requirements. This research provides practical guidance for security professionals in model selection based on specific operational constraints and threat profiles. To support community advancement, we have made our complete framework publicly available, facilitating reproducibility and future innovation in intrusion detection systems.

Graphical Abstract

1. Introduction

Intrusion detection systems (IDSs) are fundamentally designed to identify unauthorized access, misuse, and attacks on networked systems, whether initiated by external attackers or insider threats [1,2,3]. Conventional IDS approaches often rely on the premise that malicious activities exhibit distinct patterns compared to normal user behavior and that such anomalies can be reliably detected. Recent advancements in artificial intelligence (AI) have driven the development of autonomous intrusion detection solutions [4,5]. To automate threat detection, researchers have employed diverse AI techniques, such as deep learning models [6,7], tree-based classifiers [8,9], regression-based methods [10,11], and ensemble learning algorithms [12,13].
Most AI-driven intrusion detection techniques, apart from random forest, function as independent models without integrating their outputs [14,15]. These models exhibit distinct limitations, including elevated false alarm rates (e.g., some enterprises grapple with over 10,000 daily alerts from AI-powered security tools [16]) or significant missed detections (a critical concern in high-stakes network environments [17]).
Earlier research on AI-based IDS primarily prioritized individual algorithm accuracy rather than leveraging synergistic combinations of multiple techniques. This gap has underscored the necessity of adopting ensemble learning to improve detection robustness [18,19]. Recent efforts have increasingly explored ensemble-based IDS solutions, as seen in studies such as [20,21,22,23,24,25,26,27,28,29,30,31]. Some frameworks target anomaly detection by distinguishing malicious from benign traffic [21,22,24,26,27,29,32], while others classify specific attack types (e.g., DoS, port scans) alongside normal traffic [20,25,28,30,31,33].
Common ensemble strategies include boosting, stacking, and bagging, applied to base models such as decision trees, K-nearest neighbors (KNN), and neural networks. Performance is typically assessed using metrics such as precision, recall, and F1-score, with evaluations conducted on benchmark datasets (e.g., NSL-KDD) or real-world networks (e.g., Palo Alto [29] or real-time systems such as Kitsune [22]).
Notable contributions include dataset generation and benchmarking via ensemble methods [20] and AI model selection through ensemble optimization [24]. However, existing studies often narrow their focus to specific ensemble techniques applied to a small subset of models, leaving broader comparisons across diverse datasets and methodologies unexplored—a limitation that may restrict their wider adoption.
This study sought to bridge the identified research gap by systematically evaluating a range of ensemble learning techniques for network intrusion detection systems (NIDS). We implemented multiple standalone AI models alongside both basic and advanced ensemble learning frameworks to assess their effectiveness in the NIDS context. Building upon previous studies such as [20,21,22,23,24,25,26,27,28,29,30,31,32,33], which have explored a variety of ensemble strategies, we categorized our proposed framework accordingly to facilitate a structured analysis.
  • Dataset Preparation: This initial step included importing relevant intrusion detection datasets such as CICIDS-2017 [34] and RoEduNet-SIMARGL2021 [35] for subsequent analysis.
  • Feature Reduction: Prior to model development, we employed feature selection techniques to enhance detection accuracy and decrease computational load. Specifically, we utilized information gain (IG) and K-best algorithms to extract the most informative attributes. From these, we generated multiple feature subsets—namely All_features, IG Top-5, IG Top-10, K-best Top-5, and K-best Top-10—which were then consistently applied across all model training pipelines.
  • Training Individual Models: With the selected features, we developed baseline models including decision trees [8,9], logistic regression [10,11], neural networks [6,7], and K-nearest neighbors. Each model’s performance was measured using standard classification metrics such as accuracy, precision, recall, and F1-score.
  • Basic Ensemble Strategies: We then incorporate simple ensemble techniques, including majority voting, weighted averaging, and mean prediction aggregation. The same evaluation metrics are used to assess their effectiveness in comparison to individual models.
  • Sophisticated Ensemble Techniques: This phase integrated more advanced ensemble learning methods, such as bagging, boosting, stacking, and blending. Random forest [12,13], which relies on aggregating multiple decision trees, is categorized here under bagging-based methods. Again, model evaluation was conducted using accuracy, precision, recall, and F1-score.
  • Model Comparison and Insights: In the final step, we performed a comprehensive comparison of all individual and ensemble models to determine the most efficient configurations for intrusion detection. We also examined how different feature subsets influenced model performance, helping identify the most effective feature selection approaches for IDS optimization.
Our study introduces a diverse range of ensemble configurations, including techniques such as bagging, stacking, and boosting, applied across various foundational learners such as decision trees, logistic regression, neural networks, random forests, and others. These methodological variations emphasize the uniqueness of our contribution in comparison to earlier works, as elaborated in Section 2.
To assess the robustness and adaptability of our ensemble framework, we utilized two widely recognized intrusion detection datasets, each offering distinct characteristics. The first is the RoEduNet-SIMARGL2021 dataset [35], compiled under the European Union’s SIMARGL project. This dataset contains live traffic features and simulates real-world network activity, making it particularly appropriate for intrusion detection applications. Notably, few studies have employed ensemble learning extensively on this dataset, highlighting a gap our work aimed to address. The second dataset is CICIDS-2017 [34], developed by the Canadian Institute for Cybersecurity. This benchmark dataset encompasses a range of intrusion types and remains a staple in IDS research.
We systematically examined different ensemble strategies across both datasets, incorporating a wide selection of machine learning algorithms. These included logistic regression (LR), decision tree (DT), K-nearest Neighbors (KNN), multi-layer perceptron (MLP), adaptive boosting (ADA), extreme gradient boosting (XGB), CatBoost (CAT), gradient boosting (GB), averaging (Avg), max voting, weighted averaging, and random forest (RF). For each method, we computed a comprehensive set of evaluation metrics across both datasets to measure detection performance. Our analysis covered not only raw metric values but also a comparative ranking of the methods based on F1-score, enabling clearer identification of high-performing models. We further categorized the algorithms by their effectiveness in detecting network intrusions under different scenarios, offering an organized view of their relative strengths.We performed pairwise statistical significance tests with paired t-tests on the F1-scores of all models across multiple feature selection settings. These tests were conducted for both datasets—RoEduNet-SIMARGL2021 and CICIDS-2017—to evaluate whether observed performance differences between models were statistically meaningful.
This evaluation framework empowers researchers and practitioners to make data-driven choices when selecting ensemble methods for IDS. Our study significantly contributes to closing the methodological gap in ensemble-based IDS research by offering a detailed comparative analysis. Our assessment included vital performance indicators such as accuracy, precision, recall, and F1=score, along with runtime analysis. to evaluate operational efficiency. By doing so, we provide a holistic view of each method’s viability in real-world deployment. Our contributions not only benchmark current ensemble approaches but also lay a foundation for future developments in secure and intelligent network defense systems. The selected metrics—accuracy, precision, recall, and F1-score—offer a comprehensive view of model performance, especially in the context of imbalanced datasets common in intrusion detection. Accuracy provides an overall correctness measure, while precision and recall capture the model’s ability to correctly identify attacks without excessive false alarms. The F1 score balances precision and recall, making it ideal for evaluating detection reliability. Runtime analysis complements these metrics by assessing the operational efficiency and scalability of each model, which is critical for real-time deployment scenarios.
  • Summary of Key Contributions: This paper presents a number of core contributions, outlined as follows:
  • In-depth Comparison of Learning Approaches: We performed an extensive comparative study involving a variety of standalone machine learning models and both basic and advanced ensemble strategies applied to intrusion detection tasks.
  • Multi-Metric Evaluation: The proposed framework was benchmarked using critical performance indicators relevant to cybersecurity, including classification metrics such as accuracy, precision, recall, and F1-score, alongside execution time, to assess efficiency of different learning methods when applied to IDS.
  • Cross-Dataset Analysis: Our experiments utilized two widely recognized and contrasting IDS datasets—RoEduNet-SIMARGL2021 and CICIDS-2017—to ensure a thorough and diversified performance evaluation in multiple intrusion contexts.
  • Model Effectiveness Ranking: We present a performance-based ranking of individual and ensemble models, organized in descending order of F1-score, highlighting the comparative strengths and weaknesses of each method.
  • Advancing Ensemble Learning in IDS Research: By validating the success of various ensemble approaches, our work broadens the scope of ensemble learning techniques in intrusion detection systems and sets the stage for future explorations in the domain.
  • Open-Source Implementation: To support transparency and reproducibility, we provide public access to our implementation, enabling the research community to extend our framework with additional models or datasets. (The GitHub repository for the complete source code is available at https://github.com/sm3a96/A-Comprehensive-Comparative-Study-of-Individual-ML-Models-and-Ensemble-Strategies-for-IDS.git, accessed on 30 August 2025).

2. Related Work

2.1. Overview of Prior Ensemble Learning Approaches for IDS

Prior studies have extensively explored the role of ensemble learning in improving IDS. A notable survey [23] systematically reviewed developments in ensemble-based IDS from 2009 to 2020. The work examined classical ensemble strategies—such as bagging, boosting, stacking, and majority voting—applied across datasets including KDD’99, NSL-KDD, Kyoto 2006+, and AWID. It also covered a diverse set of learning algorithms, such as neural networks (NNs), support vector machines (SVMs), decision trees (DTs), fuzzy clustering, and radial basis functions (RBFs). This extensive review underscored both existing strengths and limitations of current ensemble methodologies, providing future directions for innovation.
Binary Classification Approaches in Anomaly Detection: For two-class intrusion detection, an IDS architecture was proposed in [21] that integrates various classifiers including Gaussian Naive Bayes, logistic regression, and decision trees. These models were combined using stochastic gradient descent on the CICIDS-2017, UNSW-NB15, and KDD’99 datasets. Chi-square-based feature selection was applied to refine the input space. Despite its effectiveness, the model suffered from imbalanced data, and the authors suggest exploring data augmentation and alternative ensemble methods for performance improvement.
Another contribution was a binary anomaly detection pipeline with ensemble learners such as random forest, AdaBoost, and gradient boosting, aggregated via soft voting developed by [26]. Similarly, in [27], classifiers such as LR, DT, NB, NN, and SVM were utilized within an ensemble setup to enhance detection accuracy on the NSL-KDD and UNSW-NB15 datasets. This study also experimented with feature selection, emphasizing the need for more realistic datasets and the potential of unsupervised learning. Another study [29] incorporated real-world data, such as Palo Alto logs, into its IDS ensemble framework using weighted voting across SVM, autoencoder, and random forest. Although effective in reducing false positives, its limitations in scalability and voting mechanism diversity were noted.
In the context of IoT security, one work [32] introduced an ensemble IDS based on the TON-IoT dataset. The method involved stacking and voting over base models such as random forest, KNN, DT, and LR. While the framework was successful, it lacked evaluation on additional datasets and excluded other ensemble techniques such as bagging.
In contrast, another work [22] focused on real-time detection via an ensemble of autoencoders, offering a unique approach suited for streaming data. Meanwhile, ref. [24] explored ensemble model selection to minimize overfitting in small binary datasets using random forest, Naive Bayes, and logistic regression. However, its reliance on non-IDS datasets and computationally intensive validation procedures were significant drawbacks.
Multiclass Classification with Ensemble Learning: Several works extended ensemble learning for multiclass IDS classification [16,20,33]. In [33], stacking was applied over DNN, CNN, RNN, and LSTM to classify traffic from the CICIDS-2017 and ToN_IoT datasets. Although this method enhanced accuracy, it faced constraints due to computational costs and the absence of experimentation in real IoT contexts. In [20], the GTCS dataset was introduced and adaptive ensemble learning used (via J48, MLP, and IBK) with majority voting, although the work lacked real-world testing and model diversity. The work in [25] addressed class imbalance by incorporating random forest into a framework combining LGP, ANFIS, and weighted voting. Nevertheless, challenges in assigning optimal weights and generalizability remained. Ref. [30] utilized bagging over NB, PART, and AdaBoost for the KDD’99 dataset but was limited in terms of dataset breadth and learner variety.
Recent advancements in resilience modeling have also contributed to the broader understanding of network security. For instance, the work in [36] introduced a resilience recovery method for complex traffic networks using trend forecasting, which models fault propagation and recovery dynamics through a modified SIRD-R framework [36]. Such approaches offer complementary perspectives to intrusion detection by emphasizing proactive recovery and adaptive system behavior, which can be integrated with ensemble-based IDS frameworks to enhance robustness against evolving threats.

2.2. Our Contributions

We present a comprehensive IDS classification framework leveraging both standalone AI models and a range of ensemble learning approaches. Using two contrasting datasets—RoEduNet-SIMARGL2021 and CICIDS-2017—we evaluated models based on accuracy, precision, recall, and F1-score. Our process began with complete feature utilization and dataset preparation. We trained baseline classifiers including logistic regression (LR), decision tree (DT), random forest (RF), multilayer perceptron (MLP), and K-nearest neighbors (KNN). Subsequently, we applied simple ensemble strategies including averaging, max voting, and weighted averaging. Advanced ensemble approaches—including bagging, boosting (e.g., ADA, GB, XGB, CAT), stacking, and blending—were also integrated. Comprehensive benchmarking was conducted across all configurations to identify optimal combinations. A major strength of our work is the inclusion and detailed evaluation of the underexplored RoEduNet-SIMARGL2021 dataset, providing fresh insights into ensemble IDS performance. This detailed analysis offers a solid foundation for future enhancements in ensemble-based intrusion detection. Table 1 shows the differences between our work and prior related ones.

3. Background and Problem Statement

This section lays the foundation for understanding the landscape of network intrusion detection, the limitations posed by individual AI models, the motivation for using ensemble methods, and the associated evaluation challenges within this domain.

3.1. Categories of Network Intrusions

Network intrusions can be classified using the MITRE ATT&CK framework [37], which provides a comprehensive taxonomy of adversarial tactics and techniques. In our evaluation, we focused on key attack types from this framework:
Normal Traffic: This category represents standard, legitimate network operations without any malicious activity.
Malware/Malware Repository Intelligence [MITRE ATT&CK ID: DS0004]: This category involves analysis of software designed with malicious intent. Identifying characteristics such as code signatures, debugging metadata, and code reuse patterns helps trace malware origin or link it to known threat actors. Shared features may reveal malware sourced from common platforms or providers [38].
PortScan (PS)/Network Service Discovery [MITRE ATT&CK ID: T1046]: Port scanning is a reconnaissance activity used to identify open ports and services. It acts as a precursor to full-scale attacks by revealing vulnerable points in the target system [39].
Denial of Service (DoS)/Network Denial of Service [MITRE ATT&CK ID: T1498]: The approach aims to render services inaccessible by overwhelming the target with traffic or connection requests, ultimately exhausting server resources and causing downtime [40].
Brute Force [MITRE ATT&CK ID: T1110]: This method involves repeated attempts to guess authentication credentials, exploiting weak or common passwords to gain unauthorized access [40].
Web Attack/Initial Access [MITRE ATT&CK ID: TA0001, T1659, T1189]: This technique targets vulnerabilities in web applications to gain unauthorized entry. These attacks exploit misconfigurations, software flaws, or exposed services to infiltrate systems [37,41].
Infiltration/Initial Access [MITRE ATT&CK ID: TA0001]: This category refers to attempts to gain unauthorized entry into systems, typically via phishing or by exploiting exposed services, potentially leading to persistent access.
Botnet/Compromise Infrastructure [MITRE ATT&CK ID: T1584.005, T1059, T1036, T1070]: Botnets consist of compromised devices controlled remotely via scripts, often used for scalable and automated attacks across multiple vectors.
Probe Attack/Surveillance [MITRE ATT&CK ID: T1595]: These intrusions gather intelligence on network topologies and exposed services. Tactics include ping sweeps, DNS zone transfers, and other scanning methods [42,43,44].

3.2. Intrusion Detection Systems

The sophistication of modern cyber threats requires resilient monitoring systems. IDSs serve as the primary line of defense against malicious actors attempting unauthorized access [45,46]. Traditional IDS solutions detect anomalies by observing deviations from normal user behavior [47]. The incorporation of AI models into IDSs over the last decade has substantially improved detection capabilities [48], yet significant gaps remain in achieving trustworthy, explainable, and generalizable solutions.

3.3. Limitations of Individual AI Models

Although machine learning models have demonstrated strong performance in IDS, their individual limitations hinder their broader applicability. These models—such as decision trees (DTs), K-nearest neighbors (KNN), support vector machines (SVMs), and deep neural networks (DNNs)—struggle with dataset complexity and often fail to generalize across different types of intrusions. They may exhibit elevated false positive [6] or false negative rates [17], making them unreliable for mission-critical tasks such as real-time intrusion prevention. In addition, base models vary in their computational needs and transparency in decision-making. KNN requires significant memory and can be misled by noise and outliers. Neural networks demand large datasets and may suffer from poor interpretability. Logistic regression offers simplicity but is limited in modeling complex relationships. Decision trees are easy to train and interpret but may overfit the data. These disparities emphasize the difficulty of relying on a single AI model for IDS.

3.4. Need for Ensemble Learning in IDS

To overcome these challenges, ensemble learning methods—such as bagging, boosting, and stacking—combine the strengths of multiple models to enhance overall accuracy and robustness [18,19]. Ensembles help mitigate individual weaknesses by integrating diverse learners, thereby reducing bias, variance, and overfitting risks.
These ensemble strategies are especially beneficial in intrusion detection, where one-size-fits-all models rarely succeed. Through model diversity and collaborative voting or aggregation, ensemble methods provide more resilient and adaptable detection mechanisms, leading to improved identification of sophisticated and evolving cyber threats.

3.5. Key Advantages of Ensemble Methods

Ensemble learning is an evolving discipline in machine learning that focuses on combining multiple learning models to improve overall prediction accuracy and model stability. This approach leverages the diversity of various base models to counteract individual weaknesses, resulting in a more robust predictive system. The most widely adopted ensemble strategies include bagging, boosting, and stacking.
Bagging (Bootstrap Aggregating): This technique involves generating multiple versions of a training dataset by sampling with replacement. Each variant is used to train an independent model instance. The predictions from these models are then aggregated—commonly via majority voting for classification or averaging for regression—to produce a final output. Bagging primarily aims to reduce variance and prevent overfitting by promoting model diversity.
Boosting: Unlike bagging, boosting adopts a sequential training approach where each subsequent model is trained to focus on the errors made by the previous ones. Misclassified samples are assigned greater importance in the training of subsequent models. This progressive correction of mistakes leads to a more accurate final ensemble by minimizing both bias and variance.
Stacking: This method introduces a hierarchical learning process where multiple heterogeneous base models are first trained independently. Their predictions are then fed into a higher-level model, known as a meta-learner or meta-model. The meta-learner synthesizes the outputs of base models to make the final prediction, thereby capturing intricate dependencies among features and predictions.
Together, these ensemble methodologies offer powerful mechanisms for enhancing the predictive strength of machine learning models. By aggregating insights from diverse learners, they not only improve performance metrics but also increase model robustness across different tasks and datasets.
Application of Ensemble Learning in Our Framework: In this study, we systematically explored several ensemble learning techniques within the scope of network intrusion detection. Our framework exclusively focused on leveraging ensemble strategies—built upon foundational base models—for detecting anomalous network activities. To thoroughly assess the efficacy and generalizability of these ensemble approaches, we performed a detailed comparative analysis on two heterogeneous datasets, each characterized by unique traffic patterns and attack profiles.
This evaluation allowed us to investigate how different ensemble learning schemes impact detection accuracy, generalization capability, and computational efficiency. The resulting insights contribute to refining intrusion detection systems and guiding future applications of ensemble learning in cybersecurity.

4. Framework

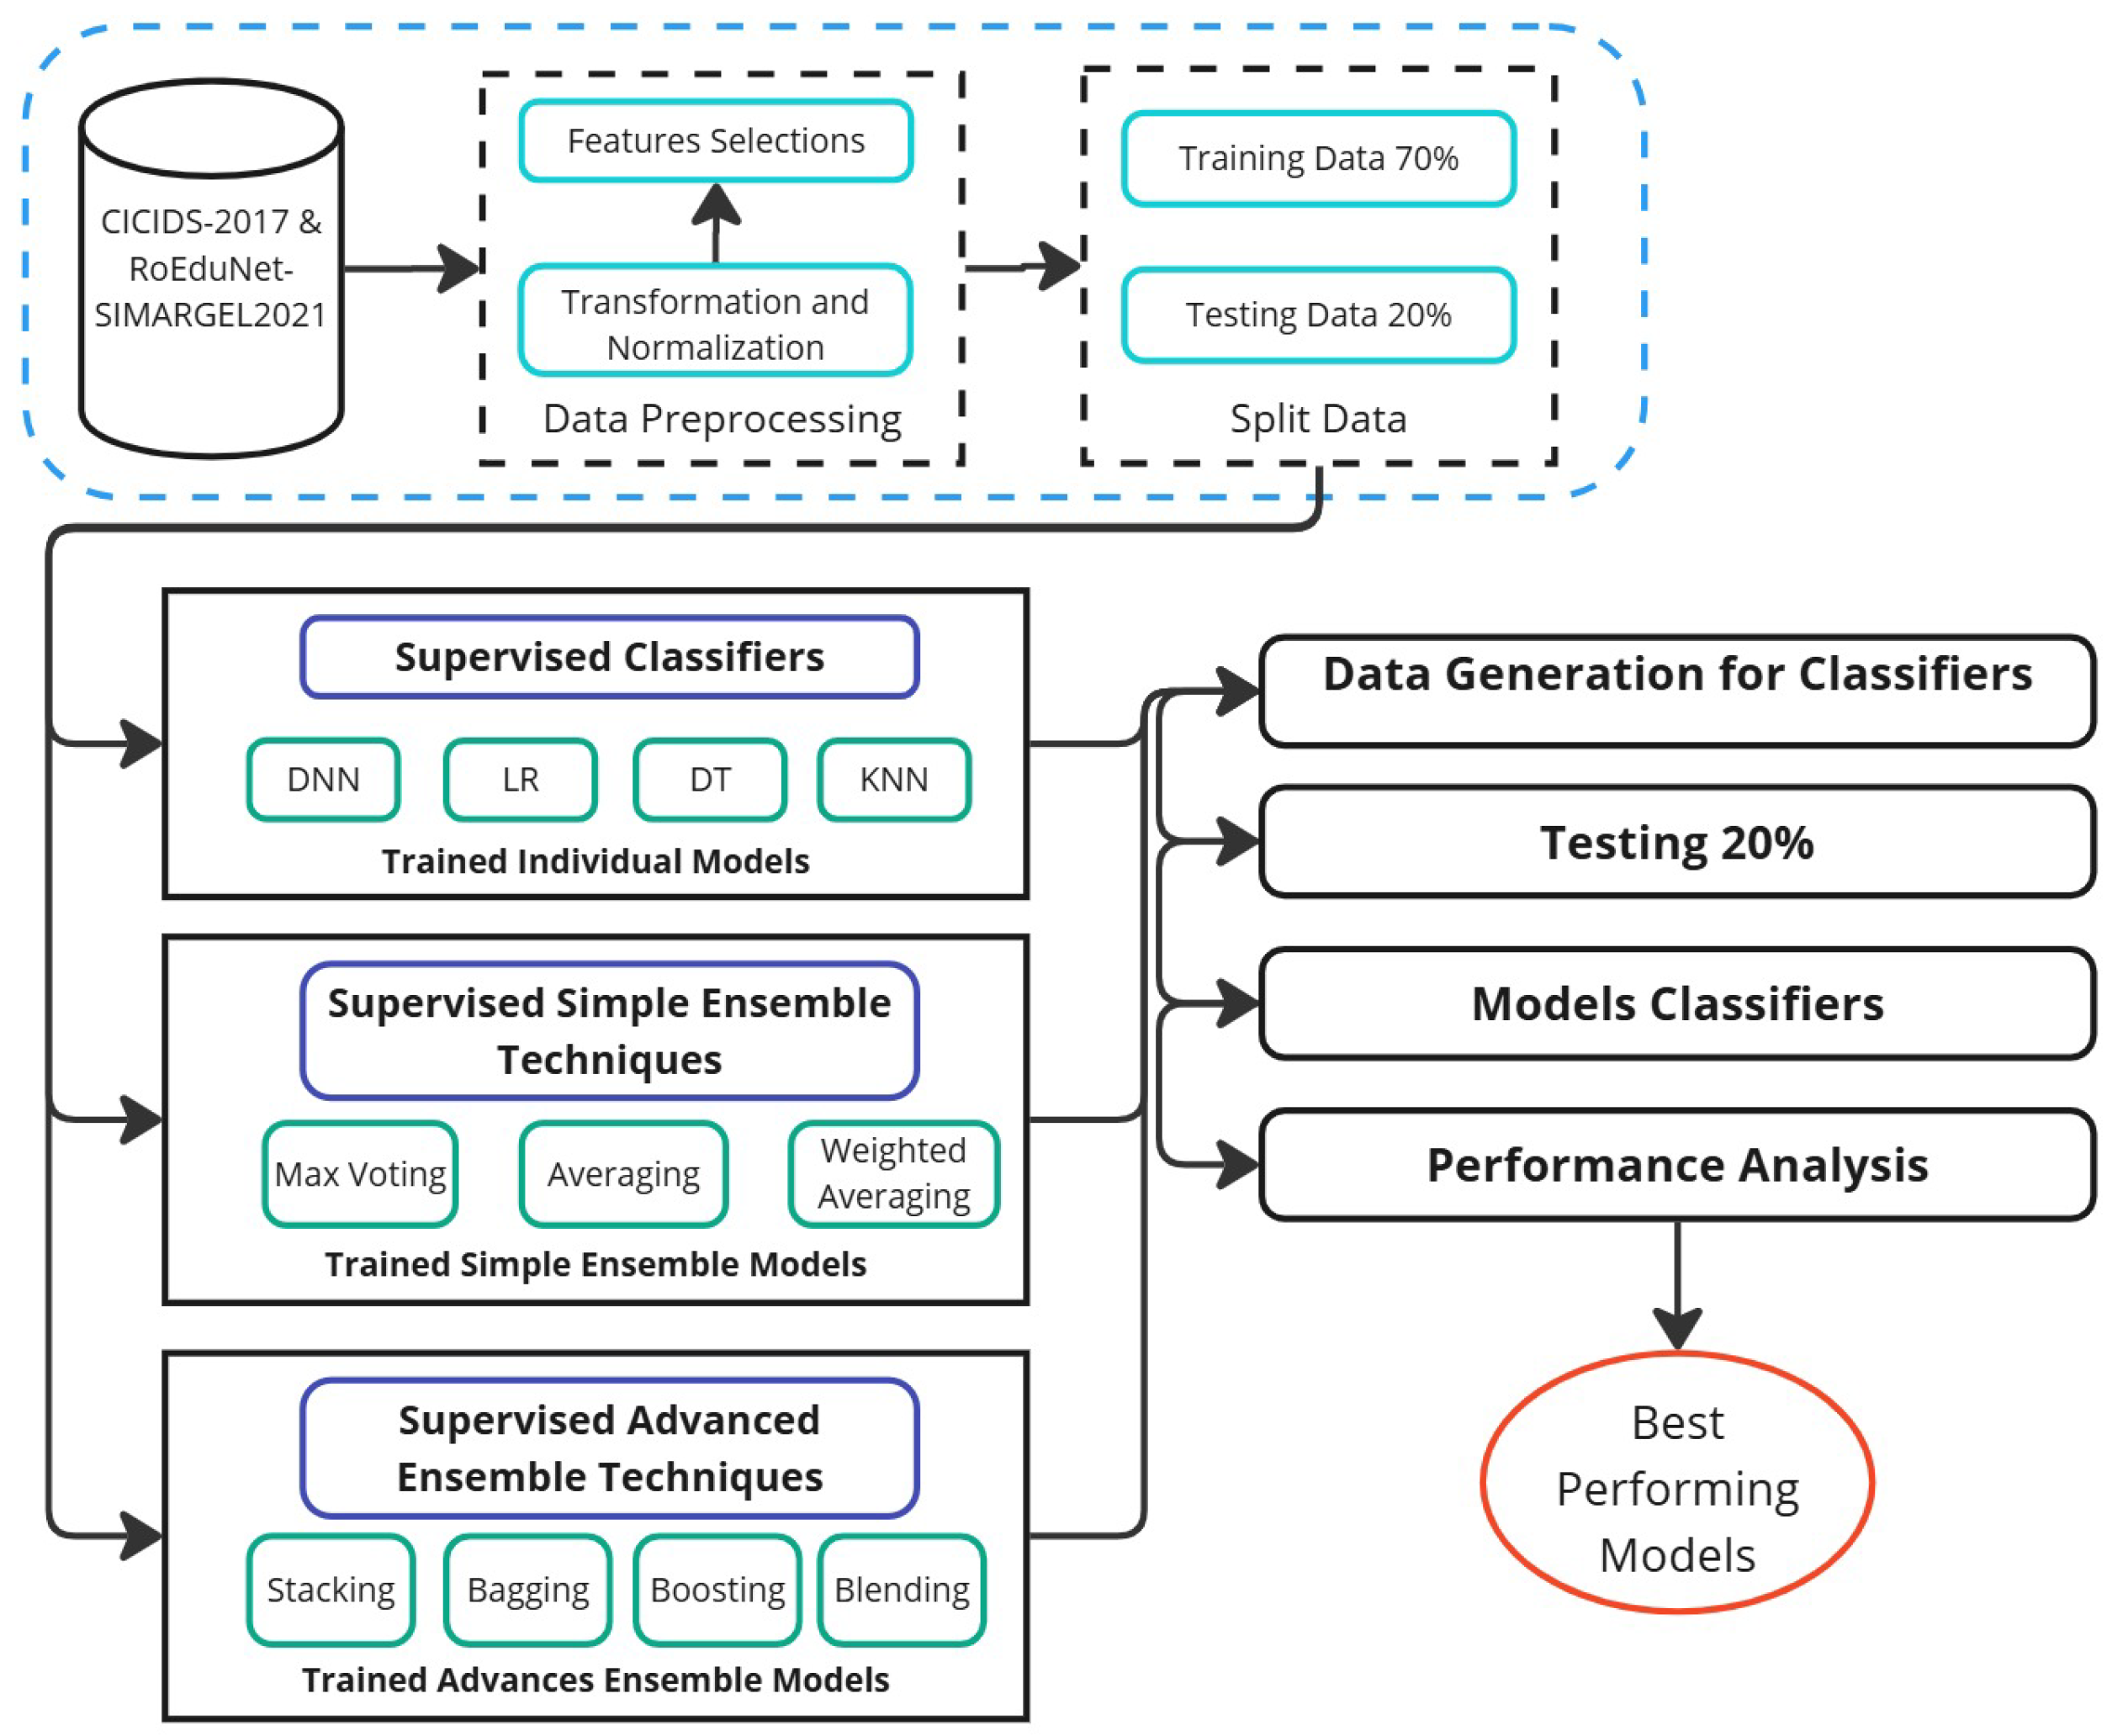
This research introduces a novel ensemble learning approach designed to enhance detection performance across multiple network security applications. The proposed system provides security professionals with a structured methodology for optimizing threat identification and attack classification processes, ultimately strengthening organizational cyber defense capabilities. As illustrated in Figure 1, our comprehensive methodology evaluates multiple ensemble strategies to determine their effectiveness for modern intrusion detection systems.

4.1. Data Preparation

Both the CICIDS-2017 and RoEduNet-SIMARGL2021 datasets were carefully processed to ensure optimal compatibility with intrusion detection algorithms. The CICIDS-2017 dataset required several cleaning operations: elimination of redundant entries, mean-value imputation for missing data in the “Flow Bytes/s” attribute (or feature), standardization of feature naming conventions, and numerical conversion of categorical labels through encoding techniques.
The RoEduNet-SIMARGL2021 dataset underwent comparable refinement procedures, including removal of duplicate entries, elimination of non-varying attributes, mean-based imputation for incomplete values, and numerical transformation of categorical variables using ordinal encoding. These preparatory measures significantly enhanced data integrity for machine learning applications.

4.2. Feature Optimization

To maximize detection accuracy while minimizing computational overhead, we implemented rigorous feature selection protocols. Our approach leveraged two distinct statistical methods: information gain (measuring uncertainty reduction) and K-Best ANOVA F-score (evaluating inter-class variance). Each technique independently identified the 10 most discriminative features, with both methods offering unique perspectives on feature relevance. The finalized feature sets were uniformly applied across all experimental models to maintain evaluation consistency. By evaluating models across multiple feature subsets (e.g., IG Top-5, K-Best Top-10), we demonstrated that certain configurations maintain high detection performance even with reduced or abstracted feature sets. This suggests resilience to feature drift and adaptability to unseen attack vectors.

4.2.1. CICIDS-2017 Feature Analysis

The feature selection process for CICIDS-2017 employed both information gain and ANOVA F-score methodologies. Table 2 displays the highest-ranked features identified by each approach.

4.2.2. RoEduNet-SIMARGL2021 Feature Analysis

The identical feature selection methodology was employed for the RoEduNet- SIMARGL2021 dataset, with both the information gain and ANOVA F-score approaches being used. Table 3 summarizes the ten most significant features identified by each selection criterion, demonstrating their discriminative capabilities for attack classification.

4.3. Algorithm Selection and Methodology

This section outlines our approach to selecting both core machine learning algorithms and their ensemble combinations for enhanced intrusion detection performance.

4.3.1. Core Single Classification Algorithms

We considered four fundamentally different machine learning approaches to ensure diverse modeling capabilities:
  • Decision Tree Classifiers: These hierarchical models offer transparent decision pathways through recursive data partitioning, making them valuable for interpretable security analytics.
  • K-Nearest Neighbors: This distance-based algorithm classifies network events by comparing them to the most similar historical instances, effectively capturing complex attack patterns through local approximations.
  • Multilayer Perceptrons: Our neural network implementation utilizes multiple hidden layers to learn sophisticated nonlinear relationships in network traffic data.
  • Logistic Regression: Serving as our baseline linear model, this algorithm establishes fundamental discriminative boundaries between attack and normal traffic patterns.

4.3.2. Basic Ensemble Strategies

To combine the strengths of individual models, we use three fundamental aggregation approaches:
  • Prediction Averaging: This technique synthesizes outputs from multiple classifiers through arithmetic mean computation, effectively smoothing out individual model biases.
  • Plurality (Majority) Voting: Our voting system determines final classifications by selecting the most frequently predicted class among all constituent models.
  • Performance-Weighted Combinations: More accurate models were assigned greater influence through empirically determined weighting coefficients, as detailed in Section 5.

4.3.3. Advanced Ensemble Methods

To enhance model performance, we employ several advanced ensemble techniques:
  • Bagging: This method generates multiple bootstrapped datasets, training base learners independently on each. Aggregating their predictions reduces variance and boosts robustness. Random forest, an example of bagging, combines many decision trees to prevent overfitting and maintain consistent performance.
  • Blending: Blending combines outputs from various base learners as input features to a meta-learner, improving generalization by leveraging model diversity.
  • Boosting: Boosting sequentially trains models that focus on correcting previous errors, placing higher weights on misclassified samples to iteratively refine prediction accuracy.
  • Stacking: This hierarchical technique trains multiple base learners and feeds their predictions into a meta-model, which learns the optimal way to combine them, capturing complex relationships among predictions.

4.4. Model Development and Training

Our implementation uses Python 3.13, beginning with individual base models, advancing to simple ensemble methods, and culminating in advanced ensemble techniques. Prior to training, feature selection via information gain and K-Best methods identifies the most informative attributes, reducing complexity and improving performance. We also evaluate models trained on all features. To utilize computational resources efficiently, TensorFlow’s tf.distribute. MirroredStrategy() enables synchronous multi-GPU training by replicating models across GPUs, aggregating gradients to maximize throughput and consistency. For individual models, each base learner—decision trees, random forests, neural networks (MLP), and logistic regression—is implemented and trained separately using libraries including scikit-learn, TensorFlow, and Keras. For simple ensemble methods, we combine individual model predictions using averaging, max voting, and weighted averaging ensembles. Training leverages GPU acceleration. For advanced ensemble methods, advanced techniques including Bagging, Blending, Boosting (AdaBoost, CatBoost, Gradient Boosting, XGBoost), and stacking are implemented using scikit-learn and TensorFlow with multi-GPU support. Bagging uses random forest as a base; blending and stacking train meta-models (typically decision trees) on base learner predictions. Boosting methods follow standard iterative procedures.

4.5. Evaluation Metrics and Model Selection

We assessed models based on accuracy, precision, recall, F1-score, and runtime to balance effectiveness with computational efficiency. Models were chosen for their proven utility in IDS literature and diversity in learning principles, enabling robust comparative analysis. The chosen models encompassed a diverse range of learning paradigms—linear (LR), tree-based (DT, RF, GB variants), instance-based (KNN), and neural networks (MLP)—ensuring broad coverage of algorithmic behavior under different intrusion scenarios. Baseline aggregation is provided by ensemble strategies including Avg, Max Voting, and Weighted Avg, while advanced techniques including ADA, XGB, and CAT offer improved performance through feature sensitivity and iterative refinement.

4.6. Key Network Intrusion Features

Table 4 and Table 5 list and describe important features from the RoEduNet-SIMARGL2021 and CICIDS-2017 datasets, essential for understanding model inputs and their relevance. Table 6 presents a comparative overview of the two network intrusion datasets used in this study. CICIDS-2017 includes 7 attack categories and 78 features across approximately 2.78 million samples, while RoEduNet-SIMARGL2021 offers a significantly larger scale with over 31 million samples, 3 attack labels, and 29 features. This contrast highlights the diversity in dataset complexity and volume, supporting robust evaluation across varied threat landscapes. While all features listed in Table 7 were used in initial experiments, highlighting these key characteristics helps to interpretability and understanding. We emphasize that we also used feature selection methods to choose the best features in order to test the performance (both accuracy-related and efficiency-related ones) of both ensemble and single methods under this selection.

5. Foundations of Evaluation

Our experimental evaluation focused on answering the following research questions:
  • Which individual machine learning models demonstrate optimal performance for specific network intrusion detection datasets?
  • Among various ensemble techniques, which approach yields the most effective detection capabilities for given cybersecurity scenarios?
  • How do evaluated methods compare across performance indicators, including
    • Detection precision, attack identification sensitivity, and accuracy?
    • Computational efficiency and runtime?
  • To what extent does feature selection influence:
    • Model detection performance?
    • Computational resource requirements?
  • What are the practical benefits and limitations of applying ensemble learning methods in real-world intrusion detection systems?

5.1. Experimental Datasets

RoEduNet-SIMARGL2021 Dataset [35]: Developed through the EU-funded SIMARGL project in partnership with Romania’s national research network, this collection contains genuine network traffic captures with comprehensive flow-level attributes. The data organization follows the Netflow [51] paradigm, mirroring the industry-standard format for network monitoring established by Cisco Systems.
CICIDS-2017 Dataset [34]: Created by the University of New Brunswick’s cybersecurity research team, this reference dataset includes six categories of modern network attacks: credential brute-forcing, heartbleed exploits, botnet communications, DoS floods, port-scanning activities, and web application attacks. The traffic patterns incorporate realistic user behavior simulations through the B-Profile methodology [52], ensuring authentic network conditions.
Dataset Characteristics: Key attributes including volume, attack diversity (class distribution), and feature dimensionality are quantitatively compared in Table 6.

5.2. Computational Environment

Hardware Configuration: All experiments were executed on a state-of-the-art computing cluster designed for machine learning workloads. The system features dual NVIDIA A100 accelerators across 64 compute nodes, with each node containing 256 GB RAM and a 64-core AMD EPYC 7713 CPU operating at 2.0 GHz (225W TDP). This configuration delivers up to 7 petaFLOPs of theoretical performance, providing ample resources for demanding AI workloads [53].
Software Stack: Our implementation leverages Python’s scientific computing ecosystem, utilizing specialized machine learning frameworks (Keras, Scikit-learn) alongside essential data processing and visualization libraries (Pandas 2.3.1, Matplotlib 3.10.3). This ensured both methodological transparency and experimental reproducibility.

5.3. Performance Assessment Criteria

To rigorously evaluate IDS effectiveness, we employed four standard classification metrics derived from confusion matrix analysis:
  • Classification Accuracy  [ ( T P + T N ) / T o t a l ] : Overall correct prediction rate across all traffic classes.
  • Attack Precision  [ T P / ( F P + T P ) ] : Proportion of correctly identified attacks among all positive predictions.
  • Threat Detection Rate  [ T P / ( F N + T P ) ] : Percentage of actual attacks successfully detected (also known as sensitivity).
  • F1-Measure  [ 2 T P / ( 2 T P + F P + F N ) ] : Balanced metric combining precision and recall performance.
We additionally measure computational efficiency through execution time analysis, providing practical insights into real-world deployment feasibility for each approach.

5.4. Machine Learning Methodology

Our evaluation framework incorporates both fundamental classifiers and their ensemble combinations:
  • (A) Core Classification Models:
  • Neural Networks: MLP architecture [54] for learning complex traffic patterns.
  • Decision Trees: Rule-based classifier [55] offering interpretable decisions.
  • Logistic Regression: Linear probabilistic model [56] serving as baseline
  • KNN Algorithm: Instance-based learner [57] for local pattern recognition.
  • (B) Ensemble Strategies:
  • Boosting Variants: CAT [58], LGBM [59], ADA [60], GB [61], and XGBoost [62].
  • Composite Methods: Stacking, blending, and random forest implementations.
  • Basic Aggregators: Majority voting [63], prediction averaging, and performance-weighted combinations.
Complete hyperparameter configurations for all models are documented in Appendix A.1 (we refer to Table A1 for all configurations for different models considered in our work). The subsequent section presents detailed evaluation outcomes from this comprehensive experimental framework.  
  • (C) Potential of Our Framework to Capture Zero-day Attacks: We would like to emphasize that several components of our framework indirectly support zero-day detection due to the following reasons:
  • Model Diversity: Our ensemble configurations—particularly bagging, boosting, and stacking—combine heterogeneous base learners (e.g., decision trees, KNN, MLP, logistic regression). This diversity enhances generalization and robustness, which are essential for identifying anomalous patterns not seen during training.
  • Anomaly Detection Potential: Some of the base models used (e.g., KNN, decision trees) are inherently capable of identifying outliers or deviations from learned patterns. When integrated into ensemble strategies, these models contribute to the detection of atypical traffic, which may include zero-day attacks. 

6. In-Depth Evaluation Results

We now detail the main results and insights found from our evaluation experiments on the two datasets considered in this work.

6.1. RoEduNet-SIMARGL2021 Evaluation

6.1.1. Performance Analysis

Our evaluation of the RoEduNet-SIMARGL2021 dataset (Table 8 and Table 9) revealed notable differences in model effectiveness across various configurations.
  • Flawless Detection:
    -
    Individual Models: The decision tree algorithm achieved ideal metrics (all scores = 1.0) regardless of feature selection approach, including complete feature sets and reduced subsets (Table 8). This result answers the first research question.
    -
    Ensemble Approaches: Multiple ensemble strategies (random forest, voting, stacking, AdaBoost) similarly achieved perfect detection when using comprehensive or IG-selected features (Table 9), demonstrating their capacity to effectively combine feature information. We emphasize that the random forest model used in Table 9 was configured with n_estimators=100. This is also explicitly stated in Appendix A.1. This experiment answers the second research question.
  • Feature Selection Observations:
    -
    Comparison of Methods: Information Gain proved superior to ANOVA F-score selection, particularly for Logistic Regression (F1 = 0.994 vs. 0.988 with top 10 features; Table 8). This experiment answers the fourth research question.
    -
    Minimal Feature Performance: Remarkably, decision trees and CatBoost maintained flawless detection even with only 5 IG-selected features, indicating exceptional tolerance to feature reduction (Table 8 and Table 9). This experiment answers the fourth research question.
    -
    Blending Method: While achieving near-perfect detection (F1 ≈ 0.9999), the blending technique showed marginally lower performance compared to simpler ensembles, potentially due to its complex architecture (Table 9).
Table 8. Comparative analysis of intrusion detection performance across machine learning approaches using RoEduNet-SIMARGL2021 demonstrating the impact of different feature selection configurations (full/5/10 features) with models ordered by F1 performance.
ModelAccuracyPrecisionRecallF1 ScoreTraining Time (s)Prediction Time (s)Total Time (s)
All Features
Decision Tree1.01.01.01.058.520.1458.66
MLP0.9999790.9999790.9999790.9999797722.657.097729.74
Logistic Regression0.9994940.9994940.9994940.99949448.070.1948.27
IG Top 5 Features
Decision Tree1.01.01.01.016.530.0716.59
MLP0.9986990.9987020.9986990.99869913460.163.9113464.07
Logistic Regression0.9042280.9181020.9042280.90342763.020.1363.15
IG Top 10 Features
Decision Tree1.01.01.01.029.220.0829.31
MLP0.9992770.9992780.9992770.9992773109.694.323114.01
Logistic Regression0.9941430.9941710.9941430.99414334.840.1034.94
K-Best Top 5 Features
Decision Tree0.9999810.9999800.9999810.99997910.290.0810.37
MLP0.9948680.9948300.9948680.9948405623.413.545626.95
Logistic Regression0.9884240.9885420.9884240.98839626.640.1026.74
K-Best Top 10 Features
Decision Tree0.9999980.9999980.9999980.99999867.020.1167.13
MLP0.9987720.9987750.9987720.9987724630.494.394634.89
Logistic Regression0.9881800.9883650.9881800.98817934.830.1634.99
Table 9. Comparison of the ensemble method performance on the RoEduNet-SIMARGL2021 dataset. Results are organized by feature selection strategy (All Features, Top 5, and Top 10) and ranked by F1-score within each category.
ModelAccuracyPrecisionRecallF1 ScoreTraining Time (s)Prediction Time (s)Total Time (s)
All Features
Random Forest1.01.01.01.02607.5210.872618.39
Soft Voting Ens.1.01.01.01.04901.1119.584920.69
Weighted Avg.1.01.01.01.05364.2613.085377.33
Bagging1.01.01.01.012820.919.1112830.02
Stacking1.01.01.01.023951.5326.5723978.10
Adaptive Boosting1.01.01.01.01366.736.731373.46
CatBoost1.01.01.01.0681.300.83682.13
Gradient Boosting1.01.01.01.022567.7116.5322584.24
XGBoost1.01.01.01.0172.570.60173.18
Blending0.9999450.9998890.9999450.9999173929.996.503936.49
IG Top 5 Features
Random Forest1.01.01.01.01230.878.641239.52
Soft Voting1.01.01.01.02593.6711.192604.87
Weighted Avg.1.01.01.01.03228.5012.063240.55
Bagging1.01.01.01.07273.267.937281.19
Stacking1.01.01.01.011928.3114.9411943.26
Adaptive Boosting1.01.01.01.0419.213.25422.46
CatBoost1.01.01.01.0513.040.78513.82
Gradient Boosting1.01.01.01.06429.5010.616440.11
XGBoost1.01.01.01.0283.730.92284.65
Blending0.9999450.9998890.9999450.999917952.846.44959.27
IG Top 10 Features
Random Forest1.01.01.01.01707.369.521716.88
Soft Voting1.01.01.01.03731.0211.783742.80
Weighted Avg.1.01.01.01.03804.8010.063814.86
Bagging1.01.01.01.09598.8910.949609.83
Stacking1.01.01.01.010935.139.7210944.85
Adaptive Boosting1.01.01.01.0682.053.90685.96
Cat Boosting1.01.01.01.0526.960.76527.71
Gradient Boosting1.01.01.01.09667.2610.259677.51
XGBoost1.01.01.01.0290.790.70291.49
Blending0.9999450.9998890.9999450.9999171482.829.271492.08
K-Best Top 5 Features
Random Forest0.9999810.9999810.9999810.999980831.599.10840.69
Soft Voting0.9999810.9999810.9999810.9999802367.9711.902379.87
Weighted Avg.0.9999810.9999810.9999810.9999801861.4210.551871.97
Bagging0.9999490.9999450.9999490.9999337134.749.887144.62
Stacking0.9999810.9999800.9999810.9999794752.1710.464762.63
Adaptive Boosting0.9988820.9988290.9988820.998854220.773.63224.40
CatBoost0.9999490.9999450.9999490.999933549.960.74550.71
Gradient Boosting0.9999690.9999690.9999690.9999664357.269.284366.54
XGBoost0.9999300.9998750.9999300.999902278.540.98279.52
Blending0.9999410.9998850.9999410.9999131029.726.521036.23
K-Best Top 10 Features
Random Forest0.9999990.9999990.9999990.9999993029.8513.423043.27
Soft Voting0.9999980.9999980.9999980.9999984245.9012.154258.04
Weighted Avg.0.9999980.9999980.9999980.9999984330.3612.674343.03
Bagging0.9999950.9999950.9999950.9999957777.497.797785.28
Stacking0.9999990.9999990.9999990.9999999358.0611.359369.40
Adaptive Boosting0.9999270.9999270.9999270.999927884.349.58893.91
CatBoost0.9999960.9999960.9999960.999996615.900.77616.66
Gradient Boosting0.9999950.9999950.9999950.9999958690.5510.118700.66
XGBoost0.9999850.9999850.9999850.999985288.110.95289.06
Blending0.9999420.9998870.9999420.9999141997.9813.452011.43

6.1.2. Computational Efficiency

This experiment answers the third research question. Execution times varied substantially between algorithms, highlighting important accuracy–efficiency tradeoffs:
  • Individual Models:
    -
    Decision Trees demonstrated the fastest training (e.g., 10.29 s with minimal features), contrasting with neural networks which required extensive computation (7722 s with full features; Table 8).
    -
    Logistic regression provided an effective balance, maintaining consistent sub-minute training durations (Table 8).
  • Ensemble Efficiency:
    -
    Lightweight Options: XGBoost (173 s) and CatBoost (682 s) significantly outperformed the computationally intensive methods including stacking (23,978 s) in total runtime (Table 9).
    -
    Real-Time Viability: Methods including AdaBoost and Blending offered rapid inference (6.44–9.58 s), suggesting practical deployment potential (Table 9).
  • Feature Reduction Benefits: Using IG Top 5 features decreased decision tree training duration by 70%+ and Random Forest by 50%+, confirming the value of feature selection for efficient implementations.

6.1.3. Classification Visualization

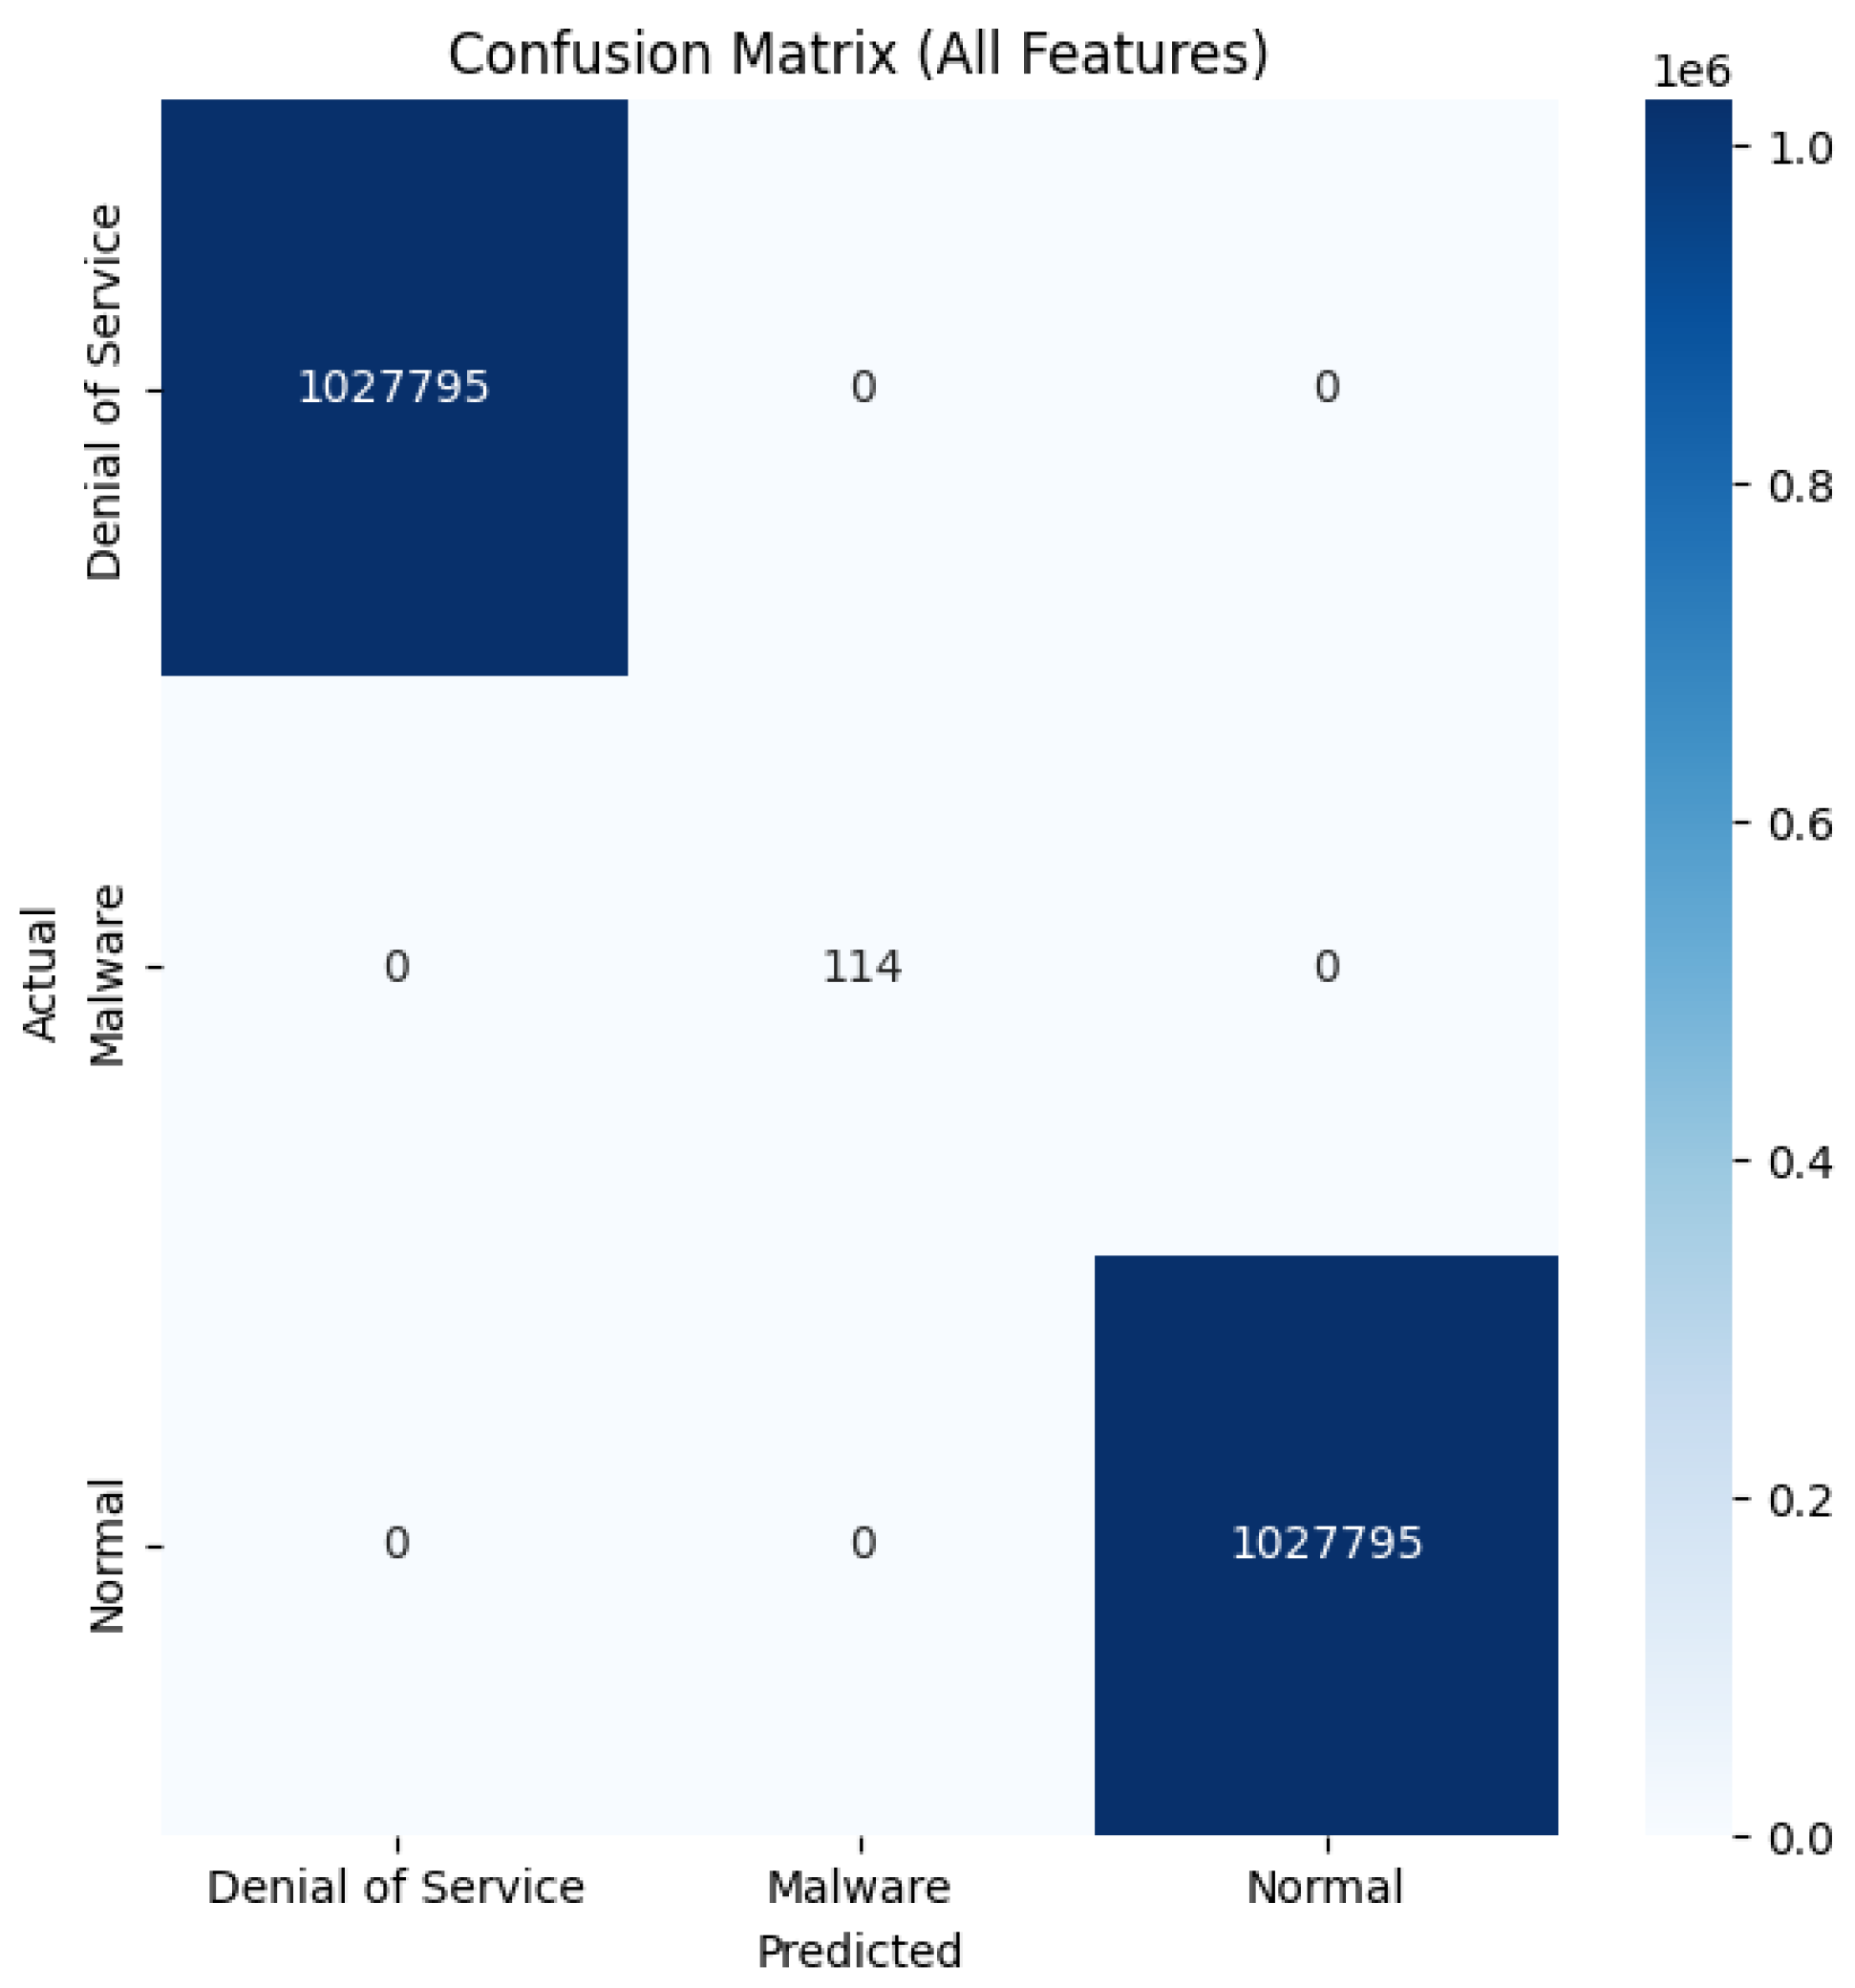
The detection accuracy is further illustrated through heatmap-based confusion matrices (Figure 2), evaluating all methods against attacks in RoEduNet-SIMARGL2021 dataset. This experiment answers the fifth research question.
Perfect Classification Models: Multiple approaches including random forest, decision trees, voting ensembles, and boosting methods (XGBoost, CatBoost) achieved flawless classification across all traffic types—normal, DoS, malware, and port scanning—when utilizing complete feature sets.

6.1.4. Performance Evaluation of RF and DT Under Adversarial Conditions

This subsection presents a comprehensive evaluation of the proposed intrusion detection models, addressing potential concerns regarding perfect performance scores through rigorous statistical testing and adversarial validation. We compared the performance of decision tree (DT) and random forest (RF) classifiers across multiple feature subsets.
Evaluation Protocol and Statistical Rigor: To ensure the validity and reliability of our results, we implemented a strict evaluation protocol designed to address common methodological pitfalls.
  • Strict Data Separation: We trained and evaluated the models using a hold-out test set strategy. All hyperparameter tuning and cross-validation ( k = 3 stratified folds) were performed exclusively on the training portion of the data, preventing any information leakage from the test set.
  • Adversarial Robustness Testing: To assess model stability and generalization under realistic conditions, we created an adversarial test set by injecting Gaussian noise (magnitude of 20% of each feature’s standard deviation) into 30% of the test instances.
  • Statistical Significance Testing: We employed robust statistical methods:
    -
    Confidence Intervals (CIs): Cross-validation results are reported as the mean macro-F1 with 95% t-distribution CIs. Held-out test results are reported as non-parametric 95% bootstrap CI ( B = 150 resamples).
    -
    Model Comparison: Paired statistical tests (Wilcoxon signed-rank and paired t-tests) were conducted on performance metrics across CV folds.
    -
    Adversarial Effect: Significance of performance degradation was tested using Wilcoxon tests on paired bootstrap samples.
    We emphasize that this testing was for DT and RF only for the RoEduNet-SIMARGL2021 dataset. The full statistical significance analysis is provided in Section 6.4.
Overall Performance and Adversarial Robustness: The macro F1-scores for both models under original and adversarial conditions are summarized in Table 10. The results revealed the following:
Perfectly Separable Feature Sets: For several feature subsets (All Features, IG Top-5/10, K-Best Top-10), both DT and RF classifiers achieved perfect F1-scores (1.000) with degenerate confidence intervals. This confirms that perfect scores are genuine characteristics of the dataset with these discriminative features, not evaluation artifacts.
Challenging Feature Sets: The K-Best Top-5 subset presented a more challenging task, showing performance degradation even on clean data (e.g., DT CV F1 = 0.9542, CI = [0.9359, 0.9725]), demonstrating our pipeline’s sensitivity to reduced separability.
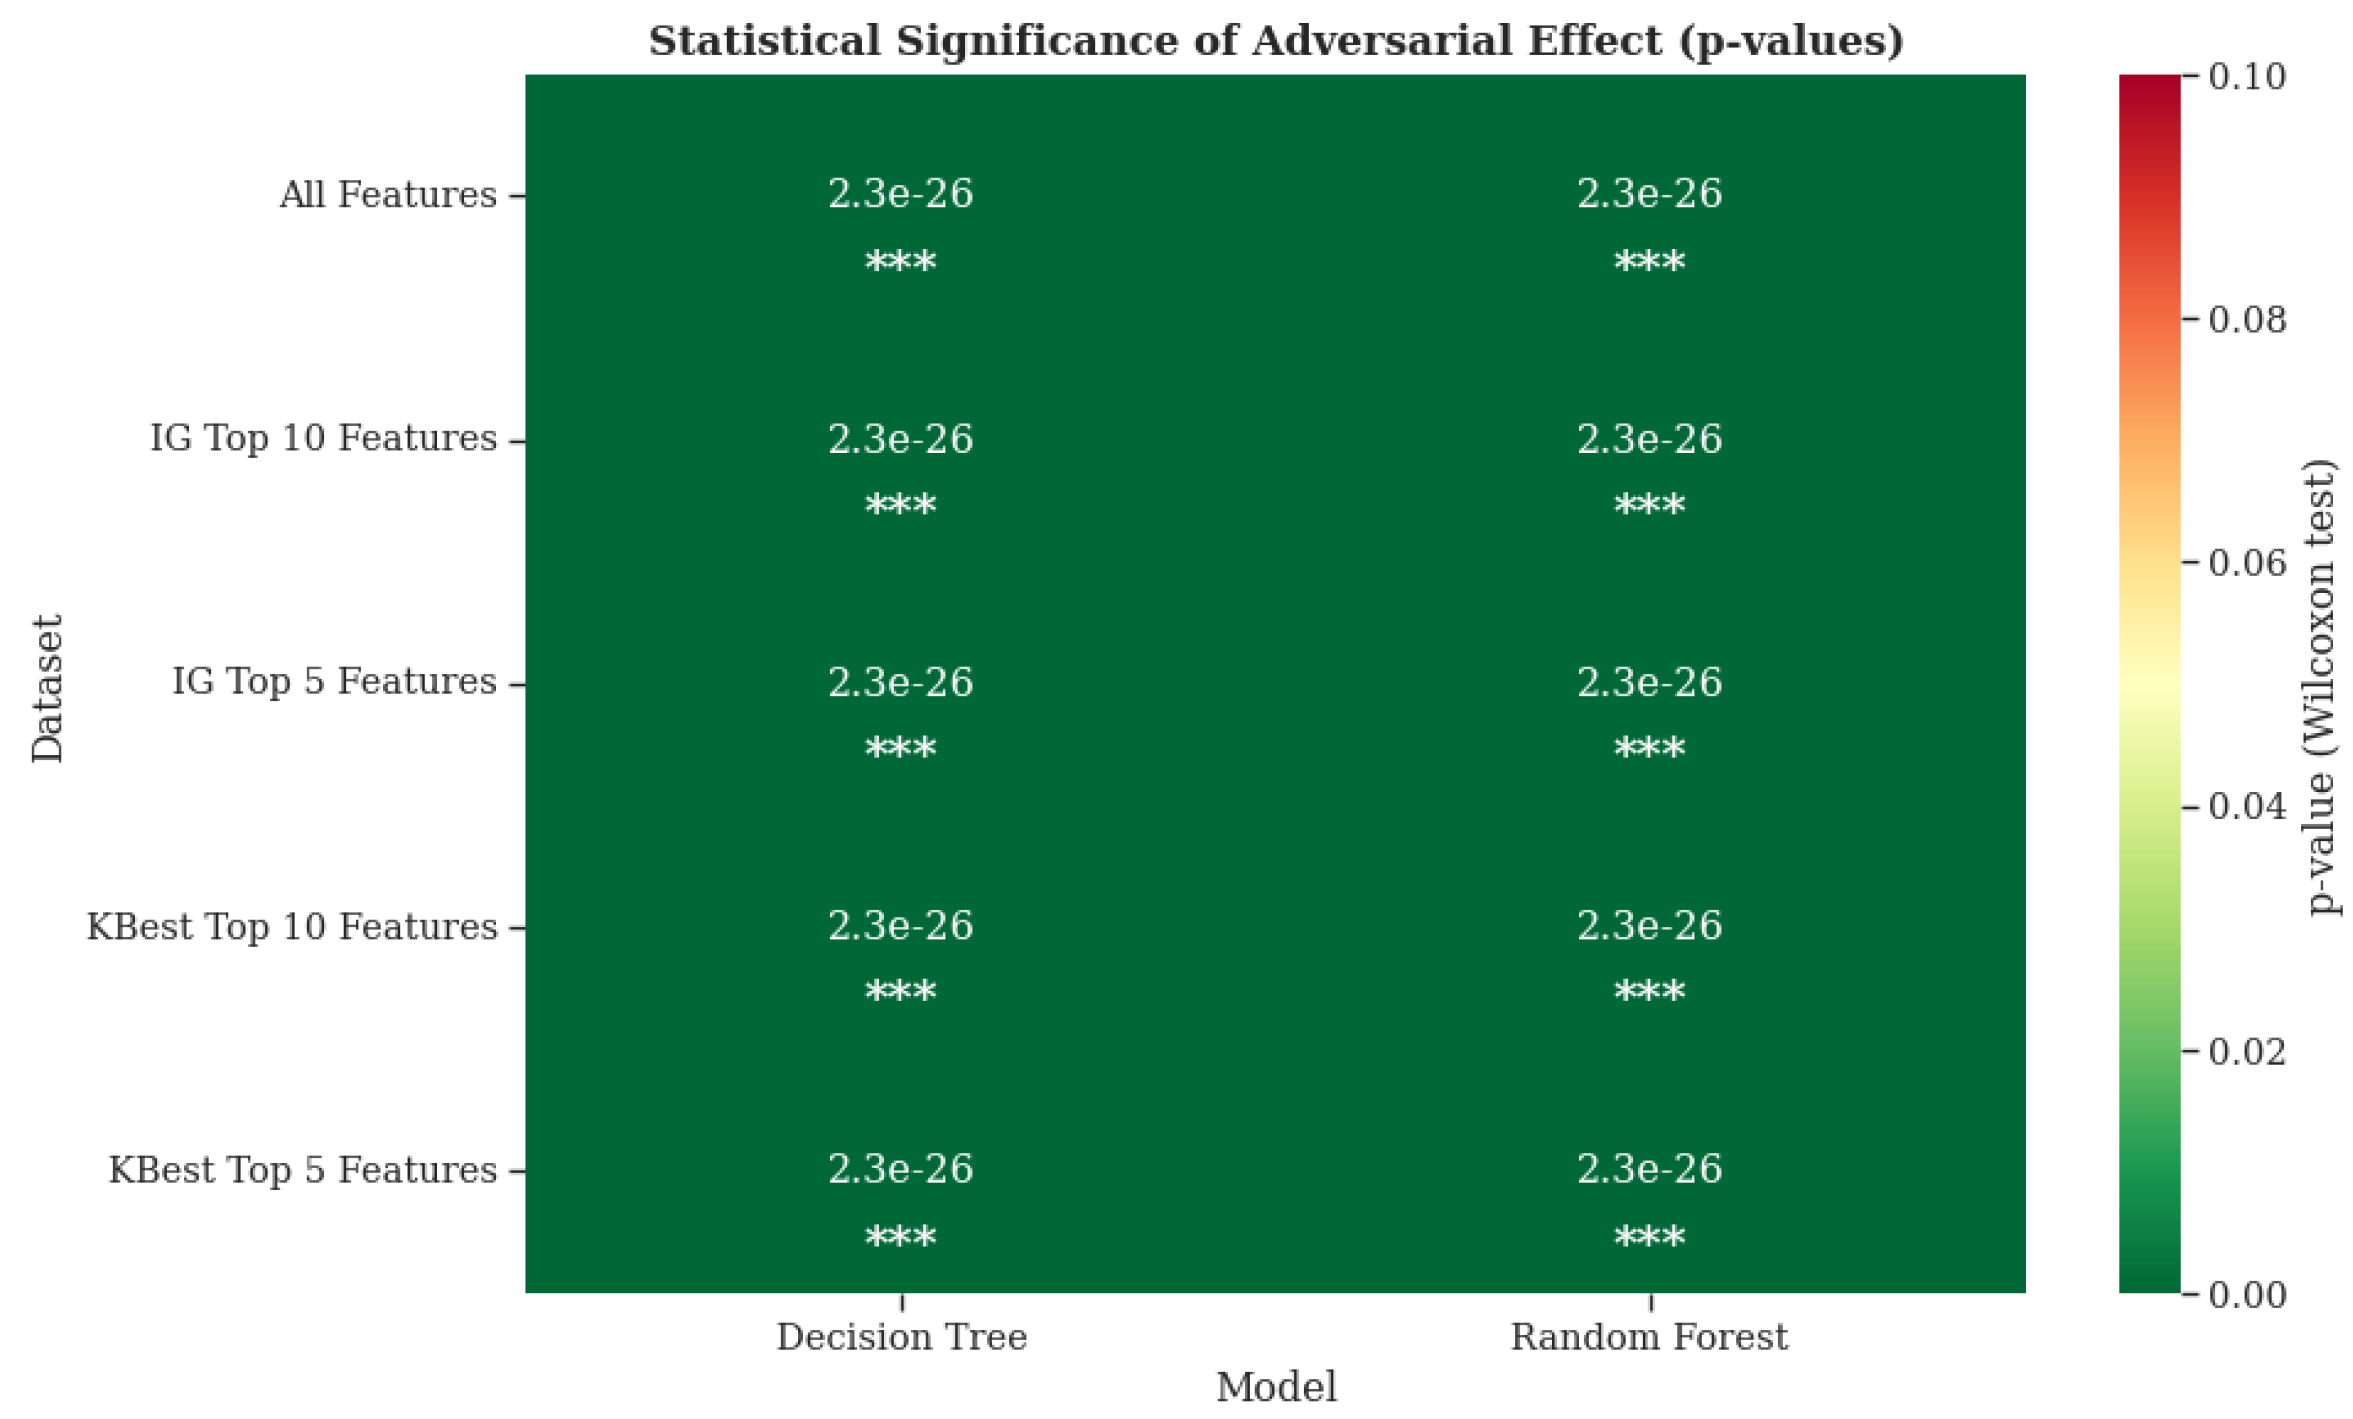
Adversarial Robustness: Adversarial noise caused significant performance degradation across all scenarios. The degradation was most severe for DT on K-Best Top-5 ( Δ = 0.3772 ), while RF showed greater resilience ( Δ = 0.1505 ). All adversarial degradations were highly significant (Wilcoxon p < 10 25 ), as visualized in Figure 3.
Comparative Analysis of Model Performance for DT and RF: A key objective was to determine if the increased complexity of the random forest model provides a significant advantage over a single decision tree.
Performance on Clean Data: Statistical comparisons revealed no significant difference between DT and RF models for any feature subset. This was true for both perfectly separable cases and the challenging K-Best Top-5 scenario (Wilcoxon p = 0.6547 ). This indicates that for this intrusion detection task on clean data, the ensemble method does not yield meaningful improvement in classification accuracy.
Robustness as a Key Differentiator: The primary distinction emerged under adversarial conditions. While both models degraded, RF demonstrated superior robustness, particularly on the K-Best Top-5 subset ( Δ of −0.1505 vs. −0.3772). This suggests that RF’s advantage lies not in raw accuracy but in resilience to noise, a critical property for real-world security applications.
Table 10. Decision tree (DT) and random forest (RF) performance with cross-validation (CV) and held-out test results (original and adversarial). CIs are 95% intervals. Δ = F 1 Adv F 1 Orig .
Feature SetModelCV F1 (CI)Test F1 (CI)Adv. F1 (CI) Δ
All FeaturesDT1.0000 [1.0000,1.0000]1.0000 [1.0000,1.0000]0.8979 [0.8976,0.8982]− 0.1021
All FeaturesRF1.0000 [1.0000,1.0000]1.0000 [1.0000,1.0000]0.8979 [0.8976,0.8982]−0.1021
IG Top-5DT1.0000 [1.0000,1.0000]1.0000 [1.0000,1.0000]0.8979 [0.8976,0.8982]−0.1021
IG Top-5RF1.0000 [1.0000,1.0000]1.0000 [1.0000,1.0000]0.8964 [0.8937,0.8982]−0.1034
K-Best Top-5DT0.9542 [0.9359,0.9725]0.9467 [0.9272,0.9618]0.5696 [0.5684,0.5710]−0.3772
K-Best Top-5RF0.9547 [0.9325,0.9769]0.9481 [0.9275,0.9636]0.7977 [0.7709,0.8202]−0.1505
K-Best Top-10DT1.0000 [1.0000,1.0000]1.0000 [1.0000,1.0000]0.8979 [0.8976,0.8982]−0.1021
K-Best Top-10RF1.0000 [1.0000,1.0000]1.0000 [1.0000,1.0000]0.8979 [0.8976,0.8982]−0.1021
Computational Performance: The tradeoff for improved robustness is computational cost. Figure 4 illustrates the computational time for training and inference. As expected, the random forest model incurs higher training and prediction times compared to the single decision tree. This cost must be weighed against the robustness requirements of the target deployment environment.
Having provided main results and insights for the RoEduNet-SIMARGL2021 dataset, we next show main results for the CICIDS-2017 dataset.

6.2. CICIDS-2017 Evaluation Findings

6.2.1. Detection Performance

Analysis of the CICIDS-2017 dataset (Table 11 and Table 12) demonstrated markedly different behavior patterns compared to analysis of RoEduNet-SIMARGL2021, particularly regarding model consistency and feature selection efficacy. We now show the main insights from these patterns.
  • Leading Algorithms:
    -
    Individual Models: Decision trees maintained strong performance with complete features (F1 = 0.998126) but proved vulnerable to K-Best selection (F1 = 0.961301 for Top 5 features). Logistic regression showed particular sensitivity, with F1 plummeting to 0.557483 for K-Best Top 5 (Table 11). This result answers the first research question.
    -
    Ensemble Approaches: CatBoost (F1 = 0.998865) and blending (F1 = 0.998720) delivered superior detection with full features, while gradient boosting failed dramatically (F1 = 0.510177) with K-Best Top 10 features (Table 12). This result answers the second research question.
  • Feature Selection Effects:
    -
    Method Comparison: Information gain consistently surpassed K-Best, evidenced by the decision tree performance (F1 = 0.988682 vs. 0.961301 for Top 5 features) and logistic regression results (F1 = 0.864057 vs. 0.692819 for Top 10 features) in Table 11. This experiment answers the fourth research question.
    -
    Efficiency–Accuracy Balance: While IG Top 5 slashed decision tree training time by 94%, K-Best Top 5 compromised MLP effectiveness (F1 = 0.782772 vs. 0.804494), indicating feature loss critical for neural networks. This experiment answers the fourth research question. 
  • Performance Irregularities:
    -
    Gradient Boosting Degradation: Our analysis revealed a significant performance collapse with gradient boosting when using K-Best Top 10 features (F1 = 0.510177). To investigate this anomaly, we conducted a detailed posthoc analysis comparing model metrics across feature sets. The high precision (0.871) paired with low recall (0.371) and accuracy (0.371) pointed to a classification bias problem. We examined the feature importance values extracted from the trained model and analyzed correlations between the K-Best features, revealing that the timing-related metrics (Idle Min/Mean/Max, Flow IAT Max) created harmful interactions when combined. Further validation through cross-fold performance analysis confirmed that this was not a random fluctuation but a consistent weakness when these specific features were combined. Conversely, packet-size metrics selected by information gain produced excellent results (F1 = 0.987800), highlighting how feature selection methods can dramatically impact ensemble performance.
    -
    Stacking Inconsistency: Stacking demonstrated unpredictable behavior, with performance unexpectedly dropping from F1 = 0.998758 to 0.933565 when moving from all features to IG Top 10. Through component-wise ablation testing of the meta-learner, we determined that this counterintuitive result stems from the learning layer struggling to generalize when base models are trained on a reduced feature set. Our analysis of intermediate predictions from base classifiers showed diminished diversity in their output patterns, reducing the information available to the meta-learner despite these features being individually informative.

6.2.2. Computational Characteristics

This experiment answers the third research question. Execution times revealed significant efficiency variations across methods:
  • Individual Models:
    -
    Decision trees remained fastest (9.05 s training for IG Top 5), while MLPs required substantial computation (greater than 1148 s for full features) sd per Table 11.
    -
    KNN’s excessive prediction delay (611.05 s) rendered it unsuitable for real-time applications despite reasonable accuracy.
  • Ensemble Methods:
    -
    Blending demanded extensive training (5150 s) but provided quick inference (16.83 s). CatBoost offered a favorable balance (3,935 s training, 0.61 s prediction).
    -
    Bagging suffered from prohibitive prediction latency (9,444 s) due to its parallel aggregation design (Table 12).
    -
    XGBoost proved to be the most time-efficient (1305 s total), significantly outperforming complex methods such as stacking (12,304 s).
  • Feature Reduction Benefits: IG Top 5 features enhanced random forest efficiency by 62% (736.57 s to 280.61 s) with negligible F1 impact (0.998290 to 0.988724), demonstrating its value for time-sensitive deployments (Table 12).

6.2.3. Classification Performance Visualization

We now provide the main insights from confusion matrices for different top methods (both individual and ensemble ones) for the CICIDS-2017 dataset. These insights show the main confusion between different attack types and between benign and attack classes. We provide below the main insights for each one of these models.   
  • (1) DT Qualitative Errors (Figure 5): The key misclassifications were as follow:
  • Attacks → Benign (FN): PortScan 278; Bot 64; DoS-Hulk 53; DoS-GoldenEye 6; DoS-Slowhttptest 6; DoS-slowloris 1; Web: XSS 3, BruteForce 2, SQLi 2; Infiltration 1.
  • Benign → attacks (FP): mainly PortScan 181, Bot 65, DoS-Hulk 47; others are single-digit.
The likely causes for such confusion is feature overlap with normal bursts (PortScan/Bot), and flow-level features. The main insight here is that DoS/DDoS attacks are detected well while stealthy classes (Bot/Web/Infiltration) show a higher number of FNs.
Figure 5. Confusion matrix for decision tree (DT) on the CICIDS-2017 dataset.
Applsci 15 10579 g005
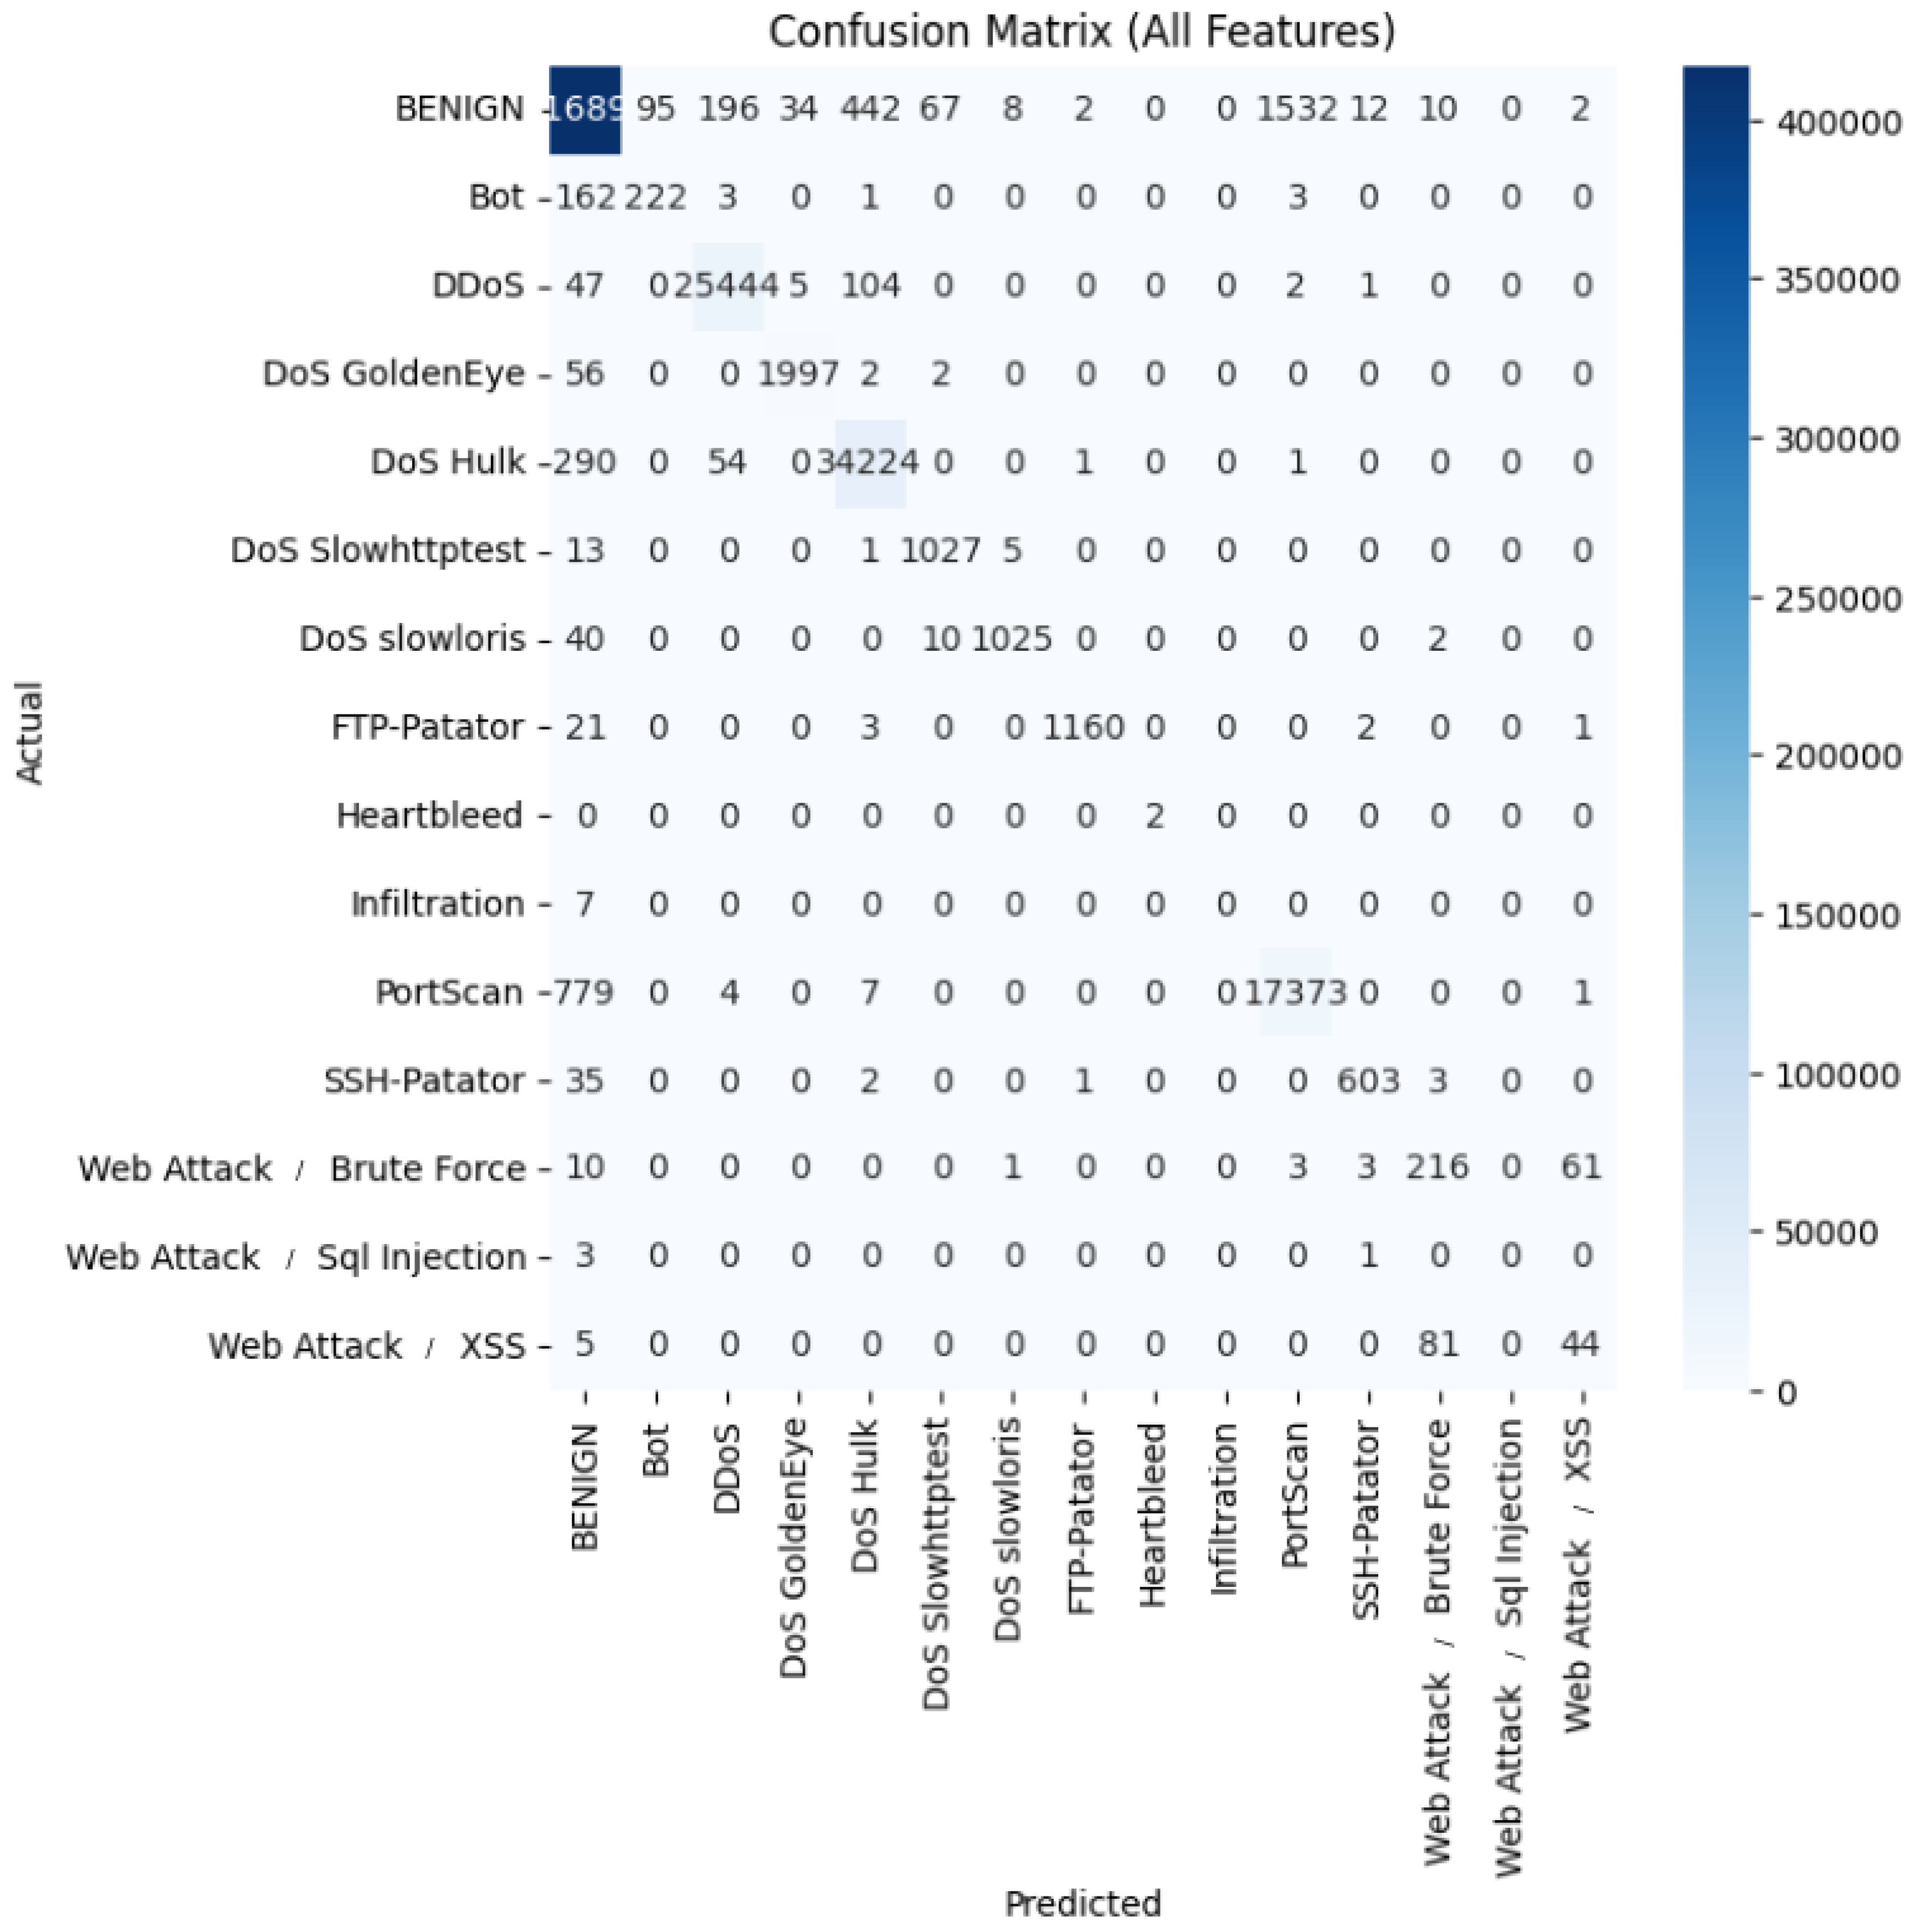
  • (2) KNN Qualitative Errors (Figure 6): The confusion matrix shows the following:
  • Attacks → Benign (FN): PortScan 779; DoS-Hulk 290; Bot 162; DoS-GoldenEye 56; DDoS 47; DoS-slowloris 40; DoS-Slowhttptest 13; FTP-Patator 21; SSH-Patator 35; Infiltration 7; Web: Brute Force 10, SQLi 3 (0 correct), XSS 5.
  • Benign → Attacks (FP): mainly PortScan 1,532; DoS-Hulk 442; DDoS 196; Bot 95; smaller spillover to Slowhttptest 67, SSH-Patator 12, Brute Force 10.
The likely causes for this confusion are that KNN’s distance-based decisions are without feature scaling, and thus local density may overlap with normal traffic (PortScan/Bot) and very small classes (Web/Infiltration).  
Figure 6. Confusion matrix for the K-nearest neighbors (KNN) classifieron the CICIDS-2017 dataset.
Applsci 15 10579 g006
  • (3) RF Qualitative Errors (Figure 7): The major patterns were as follows:
  • Attacks → Benign (FN): PortScan 193, DoS-Hulk 84, Bot 83; smaller: GoldenEye 12, DDoS 6, Slowhttptest 5, SSH-Patator 3, Infiltration 3, Web (XSS 6, BruteForce 3, SQLi 2), slowloris 1, FTP-Patator 1.
  • Benign → Attacks (FP): mainly PortScan 176, DoS-Hulk 64, Bot 44; minor to Slowhttptest 9 and GoldenEye 2.
  • Cross-attack confusions: Web BruteForce < > XSS (55, 73); slight Slowloris < > Slowhttptest (3, 2).
The main interpretation is that RF detects volumetric DoS/DDoS well but retains BENIGN <-> PortScan/Bot overlap; rare Web/Infiltration classes remain brittle. 
Figure 7. Confusion matrix for random forest (RF) on the CICIDS-2017 dataset.
Applsci 15 10579 g007
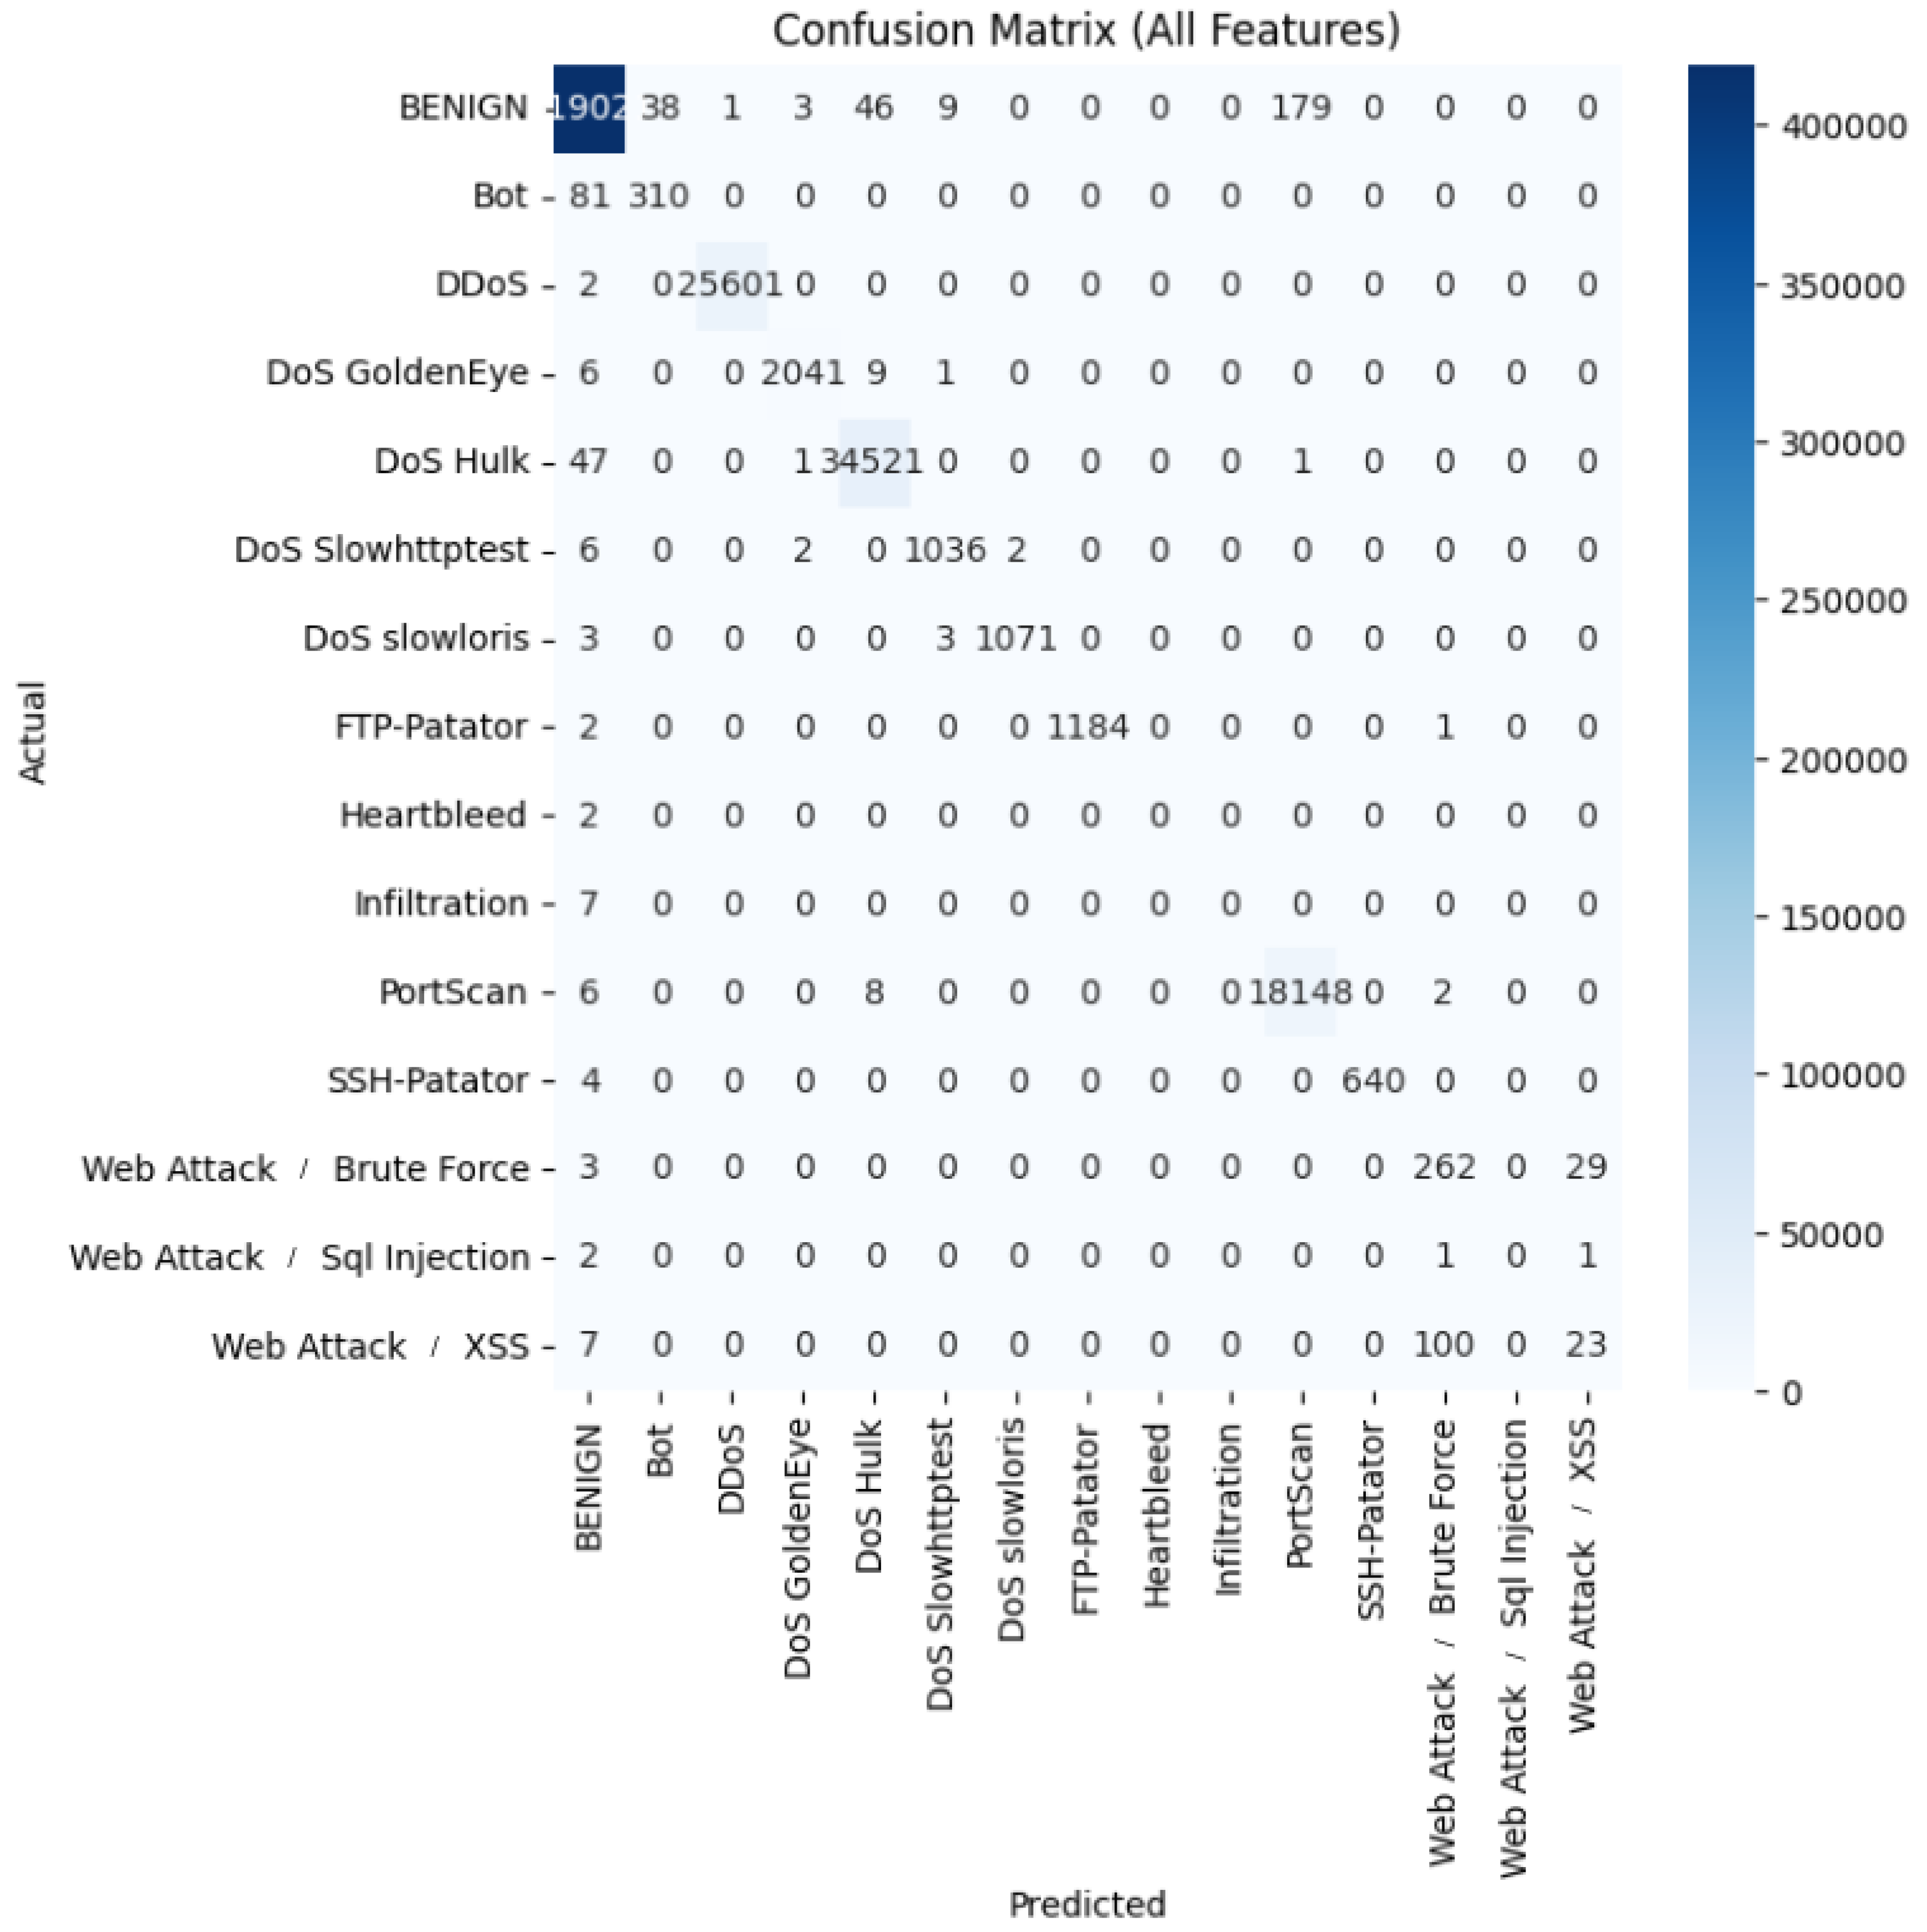
  • (4) Blending Qualitative Errors (Figure 8): The blending technique ensemble confusion matrix (Figure 8) shows significant improvement in classification accuracy across most attack types. Notable improvements included reduced misclassification of benign traffic as attacks, with only 179 instances labeled as PortScan compared to higher rates in individual models. The ensemble demonstrated substantially improved performance in classifying PortScan attacks, with only 6 misclassified as benign compared to 193 in random forest and 779 in KNN. Web Attack misclassifications persisted but at reduced rates, with 29 brute force and 23 XSS attacks misidentified. The ensemble approach showed particular effectiveness in reducing false negatives for critical attack types, with only 47 DoS Hulk attacks misclassified as benign (compared to 84 in RF and 290 in KNN). These improvements highlight the value of combining multiple classifiers to mitigate individual model weaknesses when distinguishing between similar traffic patterns.
    Figure 8. Confusion matrix for the blending technique ensemble on the CICIDS-2017 dataset.
    Figure 8. Confusion matrix for the blending technique ensemble on the CICIDS-2017 dataset.
    Applsci 15 10579 g008
  • (5) CatBoost Qualitative Errors (Figure 9): The CatBoost ensemble confusion matrix (Figure 9) demonstrated superior performance in reducing misclassifications across nearly all attack categories. Most remarkably, the model drastically reduced DoS Hulk misclassifications to only 1 instance labeled as Benign (compared to 47 in blending and 84 in random forest), indicating an exceptional ability in detecting this attack type. The model maintained high accuracy with Web Attack classifications, although it still showing some confusion between Web Attack Brute Force (8 instances) and XSS (18 instances). CatBoost’s gradient boosting approach particularly excelled in classifying PortScan attacks with only 3 misclassifications as BENIGN, compared with higher error rates in the other models. Additionally, the model showed marked improvement in correctly identifying DoS GoldenEye attacks with only 1 instance misclassified as Benign. These results demonstrate CatBoost’s effectiveness in learning complex decision boundaries that better distinguish between attack signatures with similar characteristics.
    Figure 9. Confusion matrix for cat boosting ensemble on the CICIDS-2017 dataset.
    Figure 9. Confusion matrix for cat boosting ensemble on the CICIDS-2017 dataset.
    Applsci 15 10579 g009
  • (6) Bagging Qualitative Errors (Figure 10): The bagging confusion matrix (Figure 10) revealed both strengths and persistent challenges in network traffic classification. Unlike CatBoost, the nagging approach struggled more with DoS Hulk attacks, with 293 instances misclassified as Benign traffic—the highest misclassification rate among all ensemble methods and posing a significant security risk. The model also demonstrated substantial misclassification of PortScan attacks, with 809 instances incorrectly labeled as Benign. Web Attack classification remained problematic, with 57 Brute Force attacks misidentified as XSS and 43 XSS attacks misclassified as Brute Force. Additionally, the model incorrectly classified 1462 BENIGN instances as PortScan attacks, which could generate excessive false alarms in operational environments. These patterns suggest that while bagging improves upon some individual classifiers, it does not match the performance of CatBoost or Blending techniques in distinguishing between attacks with similar network patterns, particularly for stealthy attacks that mimic normal traffic.
Optimal Classifiers Using Complete Feature Sets: Six approaches demonstrated superior detection capabilities when utilizing all available features:
  • Decision tree (DT) classifier.
  • K-nearest neighbors (KNN) algorithm.
  • Random forest (RF) ensemble.
  • Blending composite model.
  • CatBoost gradient boosting.
  • Bagging meta-estimator.
Figure 10. Confusion matrix for bagging on the CICIDS-2017 dataset.
Applsci 15 10579 g010

6.3. Cross-Dataset Performance Improvements

CICIDS-2017 Results: The evaluation framework demonstrated substantial detection enhancements on the CICIDS-2017 benchmark. Both decision tree and KNN classifiers achieved exceptional performance levels, reaching near-perfect scores (up to 0.998) across all evaluation metrics. When integrated with advanced ensemble techniques—particularly random forest, bagging, blending, and CatBoost—these base learners maintained consistently high detection rates while preserving perfect sensitivity and F1-scores.
RoEduNet-SIMARGL2021 Findings: The framework proved even more effective on the RoEduNet dataset, with multiple ensemble configurations achieving flawless classification performance (all metrics = 1.000). This demonstrates the method’s adaptability to different network environments and attack profiles.
The systematic assessment highlights three key advantages of our ensemble learning approach:
  • Ensemble learning yields consistent accuracy improvements across heterogeneous datasets (here CICIDS-2017 and RoEduNet-SIMARGL2021).
  • Our approach has robust performance regardless of feature selection method (IG/K-Best).
  • Our work provides balanced computational efficiency and detection reliability.
A particularly valuable aspect of our analysis involved the comparative examination of confusion matrices across models. These visualizations revealed the following:
  • Model-specific strengths against particular attack categories.
  • The existence of several opportunities for creating specialized ensemble combinations.
  • Potential for developing meta-ensembles tailored to specific threat landscapes (as shown in the class-based performance in the confusion matrices).
This granular understanding enables security teams to do the following:
  • Select optimal detectors based on their network’s threat profile.
  • Combine complementary models for comprehensive protection.
  • Develop adaptive defense systems that evolve with emerging threats.

6.4. Statistical Significance Analysis

We now present our statistical significance testing results for both datasets.

6.4.1. Statistical Significance Setup

We generated a table (Table 13) for such results. The table was generated by conducting pairwise statistical significance tests using the paired t-test on the F1-scores of different machine learning models. For each dataset—RoEduNet-SIMARGL2021 and CICIDS-2017—models were evaluated across multiple feature selection settings. Their performance vectors were compared in pairs, and the resulting t-statistics and p-values indicate whether the differences in performance are statistically significant. A p-value below 0.05 suggests a significant difference, and the better-performing method is highlighted in bold. If the difference is not significant, both methods are marked in bold to indicate statistical equivalence.
The F1-score vectors used in these tests were extracted directly from the performance tables (Table 8, Table 9, Table 11 and Table 12). These scores represent model effectiveness across different feature subsets. The statistical tests were implemented in Python using scipy.stats.ttest_rel. This approach ensured a rigorous and reproducible comparison of model performance, helping identify which methods consistently outperform others across different datasets and configurations.

6.4.2. Main Insights

For the RoEduNet-SIMARGL2021 dataset, the pairwise t-test results in Table 13 reveal that most ensemble methods perform comparably, with no statistically significant differences among the top-performing models such as random forest, soft voting, and weighted averaging. These methods consistently achieve near-perfect F1-scores across all feature subsets, and their comparisons yield high p-values, indicating statistical equivalence. However, blending stands out with significantly different performance when compared to nearly all other methods, including bagging, CatBoost, and gradient boosting, suggesting that its architecture may be more sensitive to feature selection or model diversity. Additionally, adaptive boosting shows statistically significant differences when compared to several methods, including blending and bagging, highlighting its distinct behavior in this dataset.
In contrast, the CICIDS-2017 dataset presents more pronounced statistical differences between models (as shown in Table 13). Decision tree and KNN outperform logistic regression and MLP in several pairwise comparisons, with p-values below the 0.05 threshold, indicating statistically significant superiority. Ensemble methods such as blending, CatBoost, and stacking also show significant improvements over weaker models such as adaptive boosting and bagging. Notably, blending and CatBoost consistently outperform others, with strong statistical evidence supporting their effectiveness. These results suggest that CICIDS-2017, with its more complex and diverse attack types, benefits more from sophisticated ensemble architectures, whereas simpler models struggle to maintain competitive performance.
Following this complete performance evaluation, we now examine the broader implications and conclusions of our approach in the subsequent section.

7. Conclusions

The fundamental purpose of an intrusion detection tool is to provide a strong safeguard against security threats, and leveraging AI can greatly improve its automation and effectiveness. With the rising frequency of network attacks, significant research has been dedicated to creating AI-based IDS. However, the variety of AI models used for this task, each with unique advantages and limitations, complicates the selection of an optimal model for any specific dataset.
To overcome this issue, hybridizing multiple AI models can lead to substantial gains in overall performance for network intrusion detection. This work addresses this need by assessing a wide array of ensemble techniques for IDS. We conducted an in-depth comparative analysis of standalone models against both simple and advanced ensemble learning architectures. Our methodology included selecting key features, training the base and ensemble models, and then generating performance metrics to offer crucial findings on their effectiveness.
Our findings are based on fourteen different combinations of individual and ensemble models, which utilized techniques such as boosting, stacking, and blending across various base learners. The analysis classified these AI models according to key performance indicators (accuracy, precision, recall, F1-score) and processing time, revealing the strengths of different learning approaches on these datasets. Furthermore, our research offers detailed guidance on selecting the best individual or ensemble ML models for network intrusion detection, tailored to the characteristics of different datasets. Our evaluation was performed on two widely used network intrusion benchmarks, each possessing unique properties.
In particular, our framework was tested on the RoEduNet-SIMARGL2021 and CICIDS-2017 datasets and revealed several important findings:
  • Ensemble Methods Improve Performance: Combining multiple models consistently outperformed single models. For example, random forest and decision trees achieved perfect scores (F1 = 1.0) on RoEduNet-SIMARGL2021, while blending and bagging techniques performed exceptionally well on CICIDS-2017 (F1 > 0.996).
  • Feature Selection Enhances Computational Efficiency: Using information gain (IG) reduced training time by 70%–94% without sacrificing accuracy. However, ANOVA-based K-best selection sometimes removed critical features, negatively impacting performance.
  • Speed vs. Accuracy Tradeoffs: Some ensemble methods, such as XGBoost, offered both speed and accuracy, making them ideal for real-time applications. In contrast, others such as stacking and blending were slower but provided higher robustness and accuracy.
  • Dataset-Specific Performance Variations: The performance of the model varied according to the dataset. For example, logistic regression struggled with complex attacks in CICIDS-2017 but performed well on simpler tasks with lower labels in RoEduNet-SIMARGL2021.
We further supported the research community by releasing our source code, establishing a versatile ensemble learning framework tailored for network intrusion detection. This framework can be extended with additional models and datasets. Our analysis also identified top-performing models per dataset and revealed shared and unique behavior patterns among models using confusion matrices that helped explain performance outcomes. This work marks a meaningful step forward in applying ensemble learning to intrusion detection systems. Our thorough experimentation and comparative analysis validate the strength of these methods, offering practical direction for both academic research and real-world cybersecurity applications.
  • Main Limitations and Future Work Avenues:
  • Concept Drift: In dynamic network environments, the statistical properties of traffic data can change over time due to evolving attack strategies and legitimate usage patterns. This phenomenon, known as concept drift, poses a significant challenge to maintaining model accuracy. We acknowledge that periodic retraining or online learning mechanisms may be necessary to adapt to such changes. Future work will explore drift detection techniques and incremental learning strategies to enhance model resilience.
  • Retraining Costs of Complex Models: As noted in Table 9, advanced ensemble methods such as stacking require substantial computational resources (e.g., over 23,000 s of training time on RoEduNet-SIMARGL2021). While these models offer high accuracy, their retraining cost may be prohibitive in real-time or resource-constrained environments. We suggest that lightweight models such as XGBoost or CatBoost may be more suitable for frequent updates in production settings.
  • Scalability in High-Throughput Networks: Enterprise networks often generate millions of flows per hour, demanding intrusion detection systems that can scale efficiently. Our framework demonstrates that certain models (e.g., decision trees, logistic regression) offer fast inference times and can be deployed in high-throughput scenarios. However, they have lower performance capabilities. Thus, future works can build on our insights for exploring the importance of balancing detection accuracy with inference latency and memory footprint, especially for real-time applications.
  • Integration of Unsupervised Learning: We emphasize that our work has exclusive focus on supervised learning methods with the main focus being on comparative analysis of different ensemble methods. Indeed, while supervised approaches offer strong performance when labeled data is available, they may fall short in detecting novel or zero-day attacks, which are not represented in the training data. Thus, we highlight the importance of integrating unsupervised and semi-supervised techniques in future work. These approaches—such as clustering, anomaly detection, and self-training—can enhance the system’s ability to identify previously unseen threats and adapt to evolving attack patterns.

Author Contributions

Conceptualization, I.B., O.A., and M.A.; methodology, I.B.; software, I.B.; validation, M.A. and W.A.; formal analysis, I.B.; investigation, M.A. and W.A.; resources, M.A.; data curation, I.B.; writing—original draft preparation, I.B.; writing—review and editing, M.A., O.A., and W.A.; visualization, I.B.; supervision, M.A. and W.A.; project administration, M.A.; funding acquisition, W.A. and M.A. All authors have read and agreed to the published version of the manuscript.

Funding

This work was supported in part by Lilly Endowment (AnalytixIN) and an Enhanced Mentoring Program with Opportunities for Ways to Excel in Research (EMPOWER) Grant from the Office of the Vice Chancellor for Research at IUPUI. The APC was covered by Princess Nourah bint Abdulrahman University Researchers Supporting Project (project number PNURSP2025R500), Princess Nourah bint Abdulrahman University, Riyadh, Saudi Arabia.

Institutional Review Board Statement

Not applicable.

Informed Consent Statement

Not applicable.

Data Availability Statement

We adhere to the data availability policy outlined by MDPI journals. The data supporting the findings of this study are available in the public repository at the following URL. The used datasets are available at https://github.com/sm3a96/A-Comprehensive-Comparative-Study-of-Individual-ML-Models-and-Ensemble-Strategies-for-IDS.git, accessed on 30 August 2025.

Conflicts of Interest

The authors declare no conflicts of interest. The funders had no role in the design of the study; in the collection, analyses, or interpretation of data; in the writing of the manuscript; or in the decision to publish the results.

Abbreviations

    The following abbreviations are used in this manuscript:
IDSintrusion detection system
KNNK-nearest neighbors
RFrandom forest
ADAadaptive boosting
CATcategorical boosting
LGBMlight gradient-boosting machine
MLPmultilayer perceptron
XGBextreme gradient boosting
SVMsupport vector machine
DTdecision tree
Avgaveraging
LRlogistic regression

Appendix A

This appendix provides the detailed technical specifications and implementation settings for all machine learning models evaluated in this study. Table A1 summarizes the model configurations, hyperparameters, learning rates, and stopping conditions used for the CICIDS-2017 and RoEduNet-SIMARGL2021 datasets. By including these details, we ensure the reproducibility of our experiments and maintain transparency with respect to the setup that produced the results reported in the main paper.

Appendix A.1. Model Architectures and Parameter Configurations

This appendix documents the complete implementation details for all machine learning models employed in our experimental framework. Table A1 summarizes the model configurations, hyperparameters, learning rates, and stopping conditions used for both the CICIDS-2017and SIMARGL datasets.

Appendix A.2. Base Classifier Specifications

The logistic regression (LR) model was implemented using scikit-learn’s default parameter settings without modification. Similarly, the decision tree (DT) classifier utilized standard scikit-learn parameters with the Gini impurity criterion for node splitting decisions. The decision tree model used in Section 4.3.1 employed default scikit-learn settings, with max_depth=None and min_samples_leaf=1, as clarified in Table A1.
The multilayer perceptron (MLP) classifier was configured with a two-layer architecture containing 50 neurons per hidden layer, employing ReLU activation functions. The optimization process used the Adam algorithm with a fixed learning rate of 0.001 and L2 regularization ( α = 0.0001). Training proceeded for a maximum of 1000 iterations with dynamic batch sizing, with a fixed random seed of 42 for reproducible results.
Table A1. Model configurations, hyperparameters, learning rates, and stopping conditions used in the experiments.
ModelDatasetKey HyperparametersLearning RateEpochs/IterationsStopping Condition
Decision TreeCICIDS-2017/ SIMARGLmax_depth=None, min_samples_leaf=1, criterion=giniFixed split criteria
KNNCICIDS-2017/ SIMARGLn_neighbors=5, weights=uniformDistance-based, no early stop
Logistic RegressionCICIDS-2017/ SIMARGLsolver=lbfgs, C=1.0, penalty=L2max_iter=100Convergence tolerance (default 10 4 )
MLPCICIDS-2017hidden_layers=(25), solver=adam0.0011000Early stop via tolerance
MLPSIMARGLhidden_layers=(100,50), activation=relu, solver=adam0.001500Early stop via tolerance
Random ForestCICIDS-2017/ SIMARGLn_estimators=100, criterion=gini, max_depth=None100 treesFixed number of trees
BaggingCICIDS-2017base=KNN, n_estimators=1010Fixed number of estimators
BaggingSIMARGLbase=CatBoost, n_estimators=1010Fixed number of estimators
BlendingCICIDS-2017DT + CatBoost + RF, meta=LogRegMeta-model training
BlendingSIMARGLDT + CatBoost + RF, meta=LogRegMeta-model training
StackingCICIDS-2017DT + KNN + RF, meta=KNN, cv=5Cross-validation
StackingSIMARGLDT + CatBoost + RF, meta=CatBoost, cv=5Cross-validation
AdaBoostCICIDS-2017/ SIMARGLn_estimators=50 (default), learning_rate=1.01.050Fixed number of learners
CatBoostCICIDS-2017/ SIMARGLverbose=0, default params0.03 (default)Built-in convergence criteria
Gradient BoostingCICIDS-2017/ SIMARGLn_estimators=100 (default), learning_rate=0.10.1100Fixed boosting rounds
XGBoostCICIDS-2017/ SIMARGLobjective=multi:softmax, random_state=42, max_depth=60.01500Early stopping after 20 rounds without improvement
AveragingCICIDS-2017DT + KNN( k = 5 ) + RF( n = 100 )Equal probability averaging
AveragingSIMARGLDT + CatBoost + RF( n = 100 )Equal probability averaging
Max VotingCICIDS-2017DT + KNN( k = 5 ) + RF( n = 100 )Hard voting (majority rule)
Max VotingSIMARGLDT + KNN + RF( n = 100 ), with StandardScalerHard voting (majority rule)
Weighted AveragingCICIDS-2017DT(0.4) + KNN( k = 5 , 0.3) + RF( n = 100 , 0.3)Weighted probability averaging
Weighted AveragingSIMARGLDT(0.4) + CatBoost(0.3) + RF( n = 100 , 0.3)Weighted probability averaging

Appendix A.3. Ensemble Method Implementations

The adaptive boosting (ADA) classifier maintained scikit-learn’s default configuration throughout our experiments. For the XGBoost (XGB) implementation, we specified a learning rate of 0.1 and set the objective function to multi:softmax for multiclass classification. The CatBoost (CAT) algorithm was employed with its standard parameter settings.
Our voting ensemble implementations included three variants: a majority voting approach combining LR and DT predictions through hard voting; a simple averaging method aggregating outputs from the DT, KNN, and RF models with equal weighting; and a weighted averaging scheme assigning differential importance (0.4 for DT, 0.3 for KNN, and 0.3 for RF).
The bootstrap aggregating (nagging) implementation utilized four base estimators (RF, MLP, LR, and DT), with the ensemble size matching the number of base models. Sampling was performed with replacement during the aggregation process. The random forest (RF) configuration included 100 trees with a maximum depth of 10 and required a minimum of 2 samples for node splitting.
For the blending method, we trained four base models (RF, MLP, LR, and DT) on a holdout validation set, with predictions from these models serving as inputs to the meta-learner. The stacked generalization approach followed a similar architecture, using the same base models (RF, MLP, LR, and DT) with their predictions combined through a meta-classifier trained on the stacked outputs.

References

  1. Northcutt, S.; Novak, J. Network Intrusion Detection; Sams Publishing: Indianapolis, IN, USA, 2002. [Google Scholar]
  2. Mukherjee, B.; Heberlein, L.T.; Levitt, K.N. Network Intrusion Detection. IEEE Netw. 1994, 8, 26–41. [Google Scholar] [CrossRef]
  3. Apruzzese, G.; Andreolini, M.; Ferretti, L.; Marchetti, M.; Colajanni, M. Modeling Realistic Adversarial Attacks against Network Intrusion Detection Systems. Digit. Threat. Res. Pract. Dtrap 2022, 3, 1–19. [Google Scholar] [CrossRef]
  4. Buczak, A.L.; Guven, E. A Survey of Data Mining and Machine Learning Methods for Cyber Security Intrusion Detection. IEEE Commun. Surv. Tutorials 2015, 18, 1153–1176. [Google Scholar] [CrossRef]
  5. Dina, A.S.; Manivannan, D. Intrusion Detection based on Machine Learning Techniques in Computer Networks. Internet Things 2021, 16, 100462. [Google Scholar] [CrossRef]
  6. Kim, J.; Shin, N.; Jo, S.Y.; Kim, S.H. Method of Intrusion Detection Using Deep Neural Network. In Proceedings of the 2017 IEEE International Conference on Big Data and Smart Computing (BIGCOMP), Jeju, South Korea, 13–16 February 2017; IEEE: New York, NY, USA, 2017; pp. 313–316. [Google Scholar]
  7. Tang, C.; Luktarhan, N.; Zhao, Y. SAAE-DNN: Deep learning method on intrusion detection. Symmetry 2020, 12, 1695. [Google Scholar] [CrossRef]
  8. Ferrag, M.A.; Maglaras, L.; Ahmim, A.; Derdour, M.; Janicke, H. RDTIDS: Rules and decision tree-based intrusion detection system for internet-of-things networks. Future Internet 2020, 12, 44. [Google Scholar] [CrossRef]
  9. Al-Omari, M.; Rawashdeh, M.; Qutaishat, F.; Alshira’h, M.; Ababneh, N. An intelligent tree-based intrusion detection model for cyber security. J. Netw. Syst. Manag. 2021, 29, 1–18. [Google Scholar] [CrossRef]
  10. Nick, T.G.; Campbell, K.M. Logistic regression. In Topics in Biostatistics. Methods in Molecular Biology; Humana Press: Totowa, NJ, USA, 2007; Volume 404, pp. 273–301. [Google Scholar]
  11. Panigrahi, R.; Borah, S.; Pramanik, M.; Bhoi, A.K.; Barsocchi, P.; Nayak, S.R.; Alnumay, W. Intrusion detection in cyber–physical environment using hybrid naïve bayes—Decision table and multi-objective evolutionary feature selection. Comput. Commun. 2022, 188, 133–144. [Google Scholar] [CrossRef]
  12. Balyan, A.K.; Ahuja, S.; Lilhore, U.K.; Sharma, S.K.; Manoharan, P.; Algarni, A.D.; Elmannai, H.; Raahemifar, K. A hybrid intrusion detection model using ega-pso and improved random forest method. Sensors 2022, 22, 5986. [Google Scholar] [CrossRef]
  13. Waskle, S.; Parashar, L.; Singh, U. Intrusion detection system using pca with random forest approach. In Proceedings of the 2020 International Conference on Electronics and Sustainable Communication Systems (ICESC), Coimbatore, India, 2–4 July 2020; IEEE: New York, NY, USA, 2020; pp. 803–808. [Google Scholar]
  14. Arisdakessian, S.; Wahab, O.A.; Mourad, A.; Otrok, H.; Guizani, M. A survey on IoT intrusion detection: Federated learning, game theory, social psychology and explainable ai as future directions. IEEE Internet Things J. 2023, 10, 4059–4092. [Google Scholar] [CrossRef]
  15. Sabev, S.I. Integrated approach to cyber defence: Human in the loop. Technical Evaluation Report. Inf. Secur. Int. J. 2020, 44, 76–92. [Google Scholar]
  16. Arreche, O.; Bibers, I.; Abdallah, M. A two-level ensemble learning framework for enhancing network intrusion detection systems. IEEE Access 2024, 12, 83830–83857. [Google Scholar] [CrossRef]
  17. Mijalkovic, J.; Spognardi, A. Reducing the false negative rate in deep learning based network intrusion detection systems. Algorithms 2022, 15, 258. [Google Scholar] [CrossRef]
  18. Aburomman, A.A.; Reaz, M.B.I. A survey of intrusion detection systems based on ensemble and hybrid classifiers. Comput. Secur. 2017, 65, 135–152. [Google Scholar] [CrossRef]
  19. Tama, B.A.; Lim, S. Ensemble learning for intrusion detection systems: A systematic mapping study and cross-benchmark evaluation. Comput. Sci. Rev. 2021, 39, 100357. [Google Scholar] [CrossRef]
  20. Mahfouz, A.; Abuhussein, A.; Venugopal, D.; Shiva, S. Ensemble classifiers for network intrusion detection using a novel network attack dataset. Future Internet 2020, 12, 180. [Google Scholar] [CrossRef]
  21. Thockchom, N.; Singh, M.; Nandi, U. A novel ensemble learning-based model for network intrusion detection. Complex Intell. Syst. 2023, 9, 5693–5714. [Google Scholar] [CrossRef]
  22. Mirsky, Y.; Doitshman, T.; Elovici, Y.; Shabtai, A. Kitsune: An ensemble of autoencoders for online network intrusion detection. arXiv 2018, arXiv:1802.09089. [Google Scholar] [CrossRef]
  23. Al-A’araji, N.H.; Al-Mamory, S.O.; Al-Shakarchi, A.H. Classification and clustering based ensemble techniques for intrusion detection systems: A survey. J. Physics Conf. Ser. 2021, 1818, 012106. [Google Scholar] [CrossRef]
  24. Caruana, R.; Niculescu-Mizil, A.; Crew, G.; Ksikes, A. Ensemble selection from libraries of models. In Proceedings of the Twenty-first International Conference on Machine Learning ICML’04, New York, NY, USA, 4–8 July 2004; p. 18. [Google Scholar] [CrossRef]
  25. Zainal, A.; Maarof, M.; Shamsuddin, S.M. Ensemble classifiers for network intrusion detection system. J. Inf. Assur. Secur. 2009, 4, 217–225. [Google Scholar]
  26. Kiflay, A.Z.; Tsokanos, A.; Kirner, R. A network intrusion detection system using ensemble machine learning. In Proceedings of the 2021 International Carnahan Conference on Security Technology (ICCST), Hatfield, UK, 1–15 October 2021; pp. 1–6. [Google Scholar] [CrossRef]
  27. Das, S.; Saha, S.; Priyoti, A.T.; Roy, E.K.; Sheldon, F.T.; Haque, A.; Shiva, S. Network intrusion detection and comparative analysis using ensemble machine learning and feature selection. IEEE Trans. Netw. Serv. Manag. 2022, 19, 4821–4833. [Google Scholar] [CrossRef]
  28. Zhang, H.; Li, J.L.; Liu, X.M.; Dong, C. Multi-dimensional feature fusion and stacking ensemble mechanism for network intrusion detection. Future Gener. Comput. Syst. 2021, 122, 130–143. [Google Scholar] [CrossRef]
  29. Hsu, Y.F.; He, Z.; Tarutani, Y.; Matsuoka, M. Toward an online network intrusion detection system based on ensemble learning. In Proceedings of the 2019 IEEE 12th International Conference on Cloud Computing (Cloud), Milan, Italy, 8–13 July 2019; pp. 174–178. [Google Scholar]
  30. Kumar Singh Gautam, R.; Doegar, E.A. An ensemble approach for intrusion detection system using machine learning algorithms. In Proceedings of the 2018 8th International Conference on Cloud Computing, Data Science & Engineering (Confluence), Noida, India, 11–12 January 2018; pp. 14–15. [Google Scholar] [CrossRef]
  31. Divyasree, T.; Sherly, K. A network intrusion detection system based on ensemble cvm using efficient feature selection approach. Procedia Comput. Sci. 2018, 143, 442–449. [Google Scholar] [CrossRef]
  32. Alotaibi, Y.; Ilyas, M. Ensemble-learning framework for intrusion detection to enhance internet of things’ devices security. Sensors 2023, 23, 5568. [Google Scholar] [CrossRef] [PubMed]
  33. Lazzarini, R.; Tianfield, H.; Charissis, V. A stacking ensemble of deep learning models for iot intrusion detection. Knowl.-Based Syst. 2023, 279, 110941. [Google Scholar] [CrossRef]
  34. Panigrahi, R.; Borah, S. A detailed analysis of cicids2017 dataset for designing intrusion detection systems. Int. J. Eng. Technol. 2017, 7, 479–482. [Google Scholar]
  35. Mihailescu, M.E.; Mihai, D.; Carabas, M.; Komisarek, M.; Pawlicki, M.; Hołubowicz, W.; Kozik, R. The proposition and evaluation of the roedunet-simargl2021 network intrusion detection dataset. Sensors 2021, 21, 4319. [Google Scholar] [CrossRef]
  36. Hong, S.; Yue, T.; You, Y.; Lv, Z.; Tang, X.; Hu, J.; Yin, H. A resilience recovery method for complex traffic network security based on trend forecasting. Int. J. Intell. Syst. 2025, 2025, 3715086. [Google Scholar] [CrossRef]
  37. Strom, B.E.; Applebaum, A.; Miller, D.P.; Nickels, K.C.; Pennington, A.G.; Thomas, C.B. Mitre Att&ck: Design and Philosophy; Technical Report; The Mitre Corporation: McLean, VA, USA, 2018. [Google Scholar]
  38. Malware Repository. 2021. Available online: https://attack.mitre.org/datasources/DS0004/ (accessed on 30 April 2024).
  39. Lee, C.B.; Roedel, C.; Silenok, E. Detection and characterization of port scan attacks. Univeristy of California, Department of Computer Science and Engineering 2003. Available online: https://cseweb.ucsd.edu/~clbailey/PortScans.pdf (accessed on 15 May 2025).
  40. Kurniabudi; Stiawan, D.; Darmawijoyo; Bin Idris, M.Y.; Bamhdi, A.M.; Budiarto, R. CICIDS-2017 dataset feature analysis with information gain for anomaly detection. IEEE Access 2020, 8, 132911–132921. [Google Scholar] [CrossRef]
  41. Drive-by Compromise. 2023. Available online: https://attack.mitre.org/techniques/T1189/ (accessed on 21 October 2023).
  42. Chen, Y.; Lin, Q.; Wei, W.; Ji, J.; Wong, K.C.; Coello Coello, C.A. Intrusion detection using multi-objective evolutionary convolutional neural network for internet of things in fog computing. Knowl.-Based Syst. 2022, 244, 108505. [Google Scholar] [CrossRef]
  43. Gorodetski, V.; Kotenko, I. Attacks against computer network: Formal grammar-based framework and simulation tool. In Proceedings of the International Workshop on Recent Advances in Intrusion Detection, 5th International Symposium, RAID 2002, Zurich, Switzerland, 16–18 October 2002; Springer: Berlin/Heidelberg, Germany, 2002; pp. 219–238. [Google Scholar]
  44. Skwarek, M.; Korczynski, M.; Mazurczyk, W.; Duda, A. Characterizing vulnerability of dns axfr transfers with global-scale scanning. In Proceedings of the 2019 IEEE Security and Privacy Workshops (SPW), San Francisco, CA, USA, 19–23 May 2019; IEEE: New York, NY, USA, 2019; pp. 193–198. [Google Scholar]
  45. Mirzaei, O.; Vasilenko, R.; Kirda, E.; Lu, L.; Kharraz, A. SCRUTINIZER: Detecting code reuse in malware via decompilation and machine learning. In Proceedings of the Detection of Intrusions and Malware, and Vulnerability Assessment: 18th International Conference, DIMVA 2021, Virtual Event, 14–16 July 2021; Springer: Berlin/Heidelberg, Germany, 2021; pp. 130–150. [Google Scholar]
  46. Khan, A.; Kim, H.; Lee, B. M2MON: Building an mmio-based security reference monitor for unmanned vehicles. In Proceedings of the 30th USENIX Security Symposium, Virtual, 11–13 August 2021. [Google Scholar]
  47. Lukacs, S.; Sirb, C.B.; Lutas, D.H.; Colesa, A.V. Strongly Isolated Malware Scanning Using Secure Virtual Containers. U.S. Patent 9117081B2, 25 August 2015. [Google Scholar]
  48. Kim, A.; Park, M.; Lee, D.H. AI-IDS: Application of deep learning to real-time web intrusion detection. IEEE Access 2020, 8, 70245–70261. [Google Scholar] [CrossRef]
  49. Flow Information Elements-Nprobe 10.1 Documentation. Available online: https://www.ntop.org/guides/nprobe/flow_information_elements.html (accessed on 1 April 2025).
  50. Ahlashkari. Master ahlashkari/cicflowmeter. cicflowmeter/readme.txt. 2021. Available online: https://github.com/ahlashkari/CICFlowMeter (accessed on 1 May 2025).
  51. Claise, B. CISCO Systems Netflow Services Export Version 9; Technical Report; Cisco Systems: San Jose, CA, USA, 2004. [Google Scholar]
  52. Sharafaldin, I.; Gharib, A.; Lashkari, A.H.; Ghorbani, A.A. Towards a reliable intrusion detection benchmark dataset. Softw. Netw. 2018, 2018, 177–200. [Google Scholar] [CrossRef]
  53. Stewart, C.A.; Welch, V.; Plale, B.; Fox, G.C.; Pierce, M.; Sterling, T. Indiana University Pervasive Technology Institute: Technical Report; Indiana University Pervasive Technology Institute: Bloomington, IN, USA, 2017. [Google Scholar]
  54. Mebawondu, J.O.; Alowolodu, O.D.; Mebawondu, J.O.; Adetunmbi, A.O. Network intrusion detection system using supervised learning paradigm. Sci. Afr. 2020, 9, e00497. [Google Scholar] [CrossRef]
  55. Song, Y.Y.; Ying, L. Decision tree methods: Applications for classification and prediction. Shanghai Arch. Psychiatry 2015, 27, 130. [Google Scholar] [PubMed]
  56. Dreiseitl, S.; Ohno-Machado, L. Logistic regression and artificial neural network classification models: A methodology review. J. Biomed. Inform. 2002, 35, 352–359. [Google Scholar] [CrossRef] [PubMed]
  57. Li, W.; Yi, P.; Wu, Y.; Pan, L.; Li, J. A new intrusion detection system based on knn classification algorithm in wireless sensor network. J. Electr. Comput. Eng. 2014, 2014, 40217. [Google Scholar] [CrossRef]
  58. Dorogush, A.V.; Ershov, V.; Gulin, A. CatBoost: Gradient boosting with categorical features support. arXiv 2018, arXiv:1810.11363. [Google Scholar] [CrossRef]
  59. Jin, D.; Lu, Y.; Qin, J.; Cheng, Z.; Mao, Z. SwiftIDS: Real-time intrusion detection system based on lightgbm and parallel intrusion detection mechanism. Comput. Secur. 2020, 97, 101984. [Google Scholar] [CrossRef]
  60. Yulianto, A.; Sukarno, P.; Suwastika, N.A. Improving adaboost-based intrusion detection system (ids) performance on cic ids 2017 dataset. J. Phys. Conf. Ser. 2019, 1192, 012018. [Google Scholar] [CrossRef]
  61. Natekin, A.; Knoll, A. Gradient boosting machines, a tutorial. Front. Neurorobotics 2013, 7, 21. [Google Scholar] [CrossRef]
  62. Dhaliwal, S.S.; Nahid, A.A.; Abbas, R. Effective intrusion detection system using xgboost. Information 2018, 9, 149. [Google Scholar] [CrossRef]
  63. Dietterich, T.G. Ensemble methods in machine learning. In Proceedings of the International Workshop on Multiple Classifier Systems, Cagliari, Italy, 21–23 June 2000; Springer: Berlin/Heidelberg, Germany, 2000; pp. 1–15. [Google Scholar]
Figure 1. An illustration of our proposed framework. It presents a comprehensive approach to intrusion detection through ensemble learning, incorporating three key components: a diverse collection of machine learning algorithms (individual classifiers, simple ensemble methods, and advanced ensemble techniques), multiple network intrusion datasets (CICIDS-2017 and RoEduNet-SIMARGL2021) representing varied attack scenarios, and optimized feature selection methodologies to improve both detection accuracy and computational efficiency.
Applsci 15 10579 g001
Figure 2. Confusion matrices for DT, RF, soft voting ensemble, weighted averaging, bagging, and Catboost. All of these models have perfect performance on the RoEduNet-SIMARGL2021 dataset.
Applsci 15 10579 g002
Figure 3. Heatmap of Wilcoxon p-values for adversarial effect, confirming statistically significant degradation (all p-values < 10 25 ).
Applsci 15 10579 g003
Figure 4. Computational cost (log-scale) for training, testing, and cross-validation. RF incurs higher computational overhead than does DT.
Applsci 15 10579 g004
Table 1. Comparison between our work and prior ensemble learning approaches for intrusion detection systems.
StudyDataset(s)Ensemble Method(s)Base ClassifiersClassification TypeLimitations
Al-a’araji et al. [23]KDD’99, NSL-KDD, Kyoto 2006+, AWIDBagging, boosting, stacking, votingNN, SVM, DT, RBFBinaryBroad survey
Thockom et al. [21]CICIDS-2017, UNSW-NB15, KDD’99SGD-based ensembleGNB, LR, DTBinaryImbalanced data
Alotaibi et al. [32]TON-IoTStacking, votingRF, KNN, DT, LRBinaryNo other datasets
Mirsky et al. [22]Custom streaming dataAutoencoder ensembleAutoencodersBinaryStreaming-focused
Caruana et al. [24]Custom binary datasetsEnsemble selectionRF, NB, LRBinaryNon-IDS datasets
Lazzarini et al. [33]CICIDS-2017, ToN-IoTStackingDNN, CNN, RNN, LSTMMulticlassHigh computational cost
Mahfouz et al. [20]GTCSMajority votingJ48, MLP, IBKMulticlassLimited model diversity
Our WorkSIMARGL2021, CICIDS-2017Bagging, boosting, stacking, blending, votingLR, DT, RF, MLP, KNNBinary, MulticlassLimited datasets
Table 2. Top 10 features selected for the CICIDS-2017 Dataset.
Information GainK-Best (ANOVA F-Score)
Average Packet SizeFwd IAT Std
Packet Length MeanBwd Packet Length Std
Packet Length StdBwd Packet Length Mean
Packet Length VarianceAvg Bwd Segment Size
Total Length of Bwd PacketsBwd Packet Length Max
Subflow Bwd BytesIdle Min
Bwd Packet Length MeanIdle Mean
Avg Bwd Segment SizePacket Length Std
Subflow Fwd BytesIdle Max
Total Length of Fwd PacketsFlow IAT Max
Table 3. Top 10 Features selected for the RoEduNet-SIMARGL2021 Dataset.
Information GainK-Best (ANOVA F-Score)
IPV4_SRC_ADDRTCP_WIN_MIN_IN
TCP_FLAGSTCP_WIN_MAX_IN
IPV4_DST_ADDRTCP_WIN_MSS_IN
IN_BYTESTCP_WIN_SCALE_IN
FLOW_IDIPV4_DST_ADDR
TOTAL_FLOWS_EXPPROTOCOL
TCP_WIN_MAX_INTOTAL_FLOWS_EXP
TCP_WIN_SCALE_INFLOW_ID
TCP_WIN_MIN_INANALYSIS_TIMESTAMP
FLOW_DURATION_MILLISECONDSFIRST_SWI
Table 4. Description of main features for the RoEduNet-SIMARGL2021 dataset [49]. The feature name is given on the left and the explanation on the right.
Main FeaturesExplanation
FLOW_DURATION_MSTotal elapsed time of the flow in milliseconds
PROTOCOL_MAPType of network protocol used (e.g., TCP, UDP, ICMP, IPv6)
TCP_FLAGSAggregated flags recorded across the TCP flow
TCP_WIN_MAX_INMax. observed TCP window size from source to destination
TCP_WIN_MAX_OUTMaximum observed TCP window size from destination to source
TCP_WIN_MIN_INSmallest TCP window value from source to destination
TCP_WIN_MIN_OUTSmallest TCP window value from destination to source
TCP_WIN_SCALE_INScaling factor used for TCP window from source to destination
TCP_WIN_MSS_INMaximum segment size for TCP from source to destination
TCP_WIN_SCALE_OUTScaling value for TCP window size from destination to source
SRC_TOSType of Service or DSCP value for source to destination traffic
DST_TOSType of Service or DSCP value for destination to source traffic
FIRST_SWITCHEDTimestamp of the first packet in the flow (based on uptime)
LAST_SWITCHEDTimestamp of the final packet in the flow (based on uptime)
TOTAL_FLOWS_EXPCount of all exported flows for the observed connection
Table 5. Description of the main features for the CICIDS-2017 dataset [50]. The feature name is given on the left and the explanation on the right.
CICIDS-2017 FeaturesExplanation
Packet Length StdStandard deviation of packet lengths within a flow
Total Length of Bwd PacketsCumulative size of all packets sent in the reverse direction
Subflow Bwd BytesAverage byte count per backward subflow
Destination PortTarget port identifier for the network traffic
Packet Length VarianceStatistical variance of packet lengths in the connection
Bwd Packet Length MeanAverage packet size in the backward stream
Avg Bwd Segment SizeMean segment size in the reverse flow
Bwd Packet Length MaxLargest observed packet size in the backward direction
Init_Win_Bytes_BackwardInitial byte window size from receiver to sender
Total Length of Fwd PacketsAggregate length of packets transmitted in forward direction
Subflow Fwd BytesMean byte count per forward subflow
Init_Win_Bytes_ForwardInitial size of the byte window from sender to receiver
Average Packet SizeMean packet size calculated across the entire flow
Packet Length MeanAverage value of all packet lengths in the flow
Max Packet LengthHighest packet length observed in the connection
Table 6. Overview and key metrics of the three network intrusion datasets utilized in this study [16], detailing dataset size, count of attack labels, and number of features used for intrusion detection.
DatasetNo. of LabelsNo. of FeaturesNo. of Samples
CICIDS-20177782,775,364
RoEduNet-SIMARGL202132931,433,875
Table 7. Distribution of samples among different attack (intrusion) types for the datasets [16].
DatasetNormalDoSPortScanBrute ForceWeb AttackBotInfiltration
CICIDS-201784.442%9.104%5.726%0.498%0.157%0.071%0.001%
RoEduNet202162.20%24.53%13.27%----
Table 11. Performance comparison of various base learners on the CICIDS-2017 dataset. Results are categorized by feature selection method (All Features, Top 5, and Top 10) and ordered by F1-score within each category.
ModelAccuracyPrecisionRecallF1-ScoreTraining Time (s)Prediction Time (s)Total Time (s)
All Features
Decision Tree0.9981170.9981380.9981170.998126164.570.20164.76
K-Neighbors Classifier0.9915970.9916460.9915970.9915971.34611.05612.39
Logistic Regression0.8884240.8579270.8884240.870850103.300.16103.46
MLP0.8659390.7523180.8659390.8044941147.630.521148.15
IG Top 5 Features
Decision Tree0.9895360.9893460.9895360.9886829.050.049.09
K-Neighbors Classifier0.9880750.9875840.9880750.9870303.08505.94509.03
Logistic Regression0.8713410.8124070.8713410.83753767.540.0467.58
MLP0.9302880.9448720.9302880.925675286.530.23286.76
IG Top 10 Features
Decision Tree0.9896110.9894800.9896110.98876616.960.0417.01
K-Neighbors Classifier0.9886750.9884950.9886750.9876775.46732.40737.86
Logistic Regression0.8951560.8493130.8951560.86405784.080.0584.13
MLP0.8826000.8564910.8826000.847658343.170.28343.46
K-Best Top 10 Features
Decision Tree0.9962380.9961700.9962380.99617125.050.0625.10
K-Neighbors Classifier0.9898830.9898360.9898830.9898175.6534.1739.82
Logistic Regression0.6536170.7629230.6536170.69281968.250.0568.30
MLP0.8670830.8116380.8670830.806455309.980.29310.28
K-Best Top 5 Features
Decision Tree0.9621920.9607520.9621920.9613019.580.059.64
K-Neighbors Classifier0.9522910.9496860.9522910.9507232.8238.9641.78
Logistic Regression0.4895050.7402030.4895050.55748368.260.0568.31
MLP0.8386360.8262210.8386360.782772407.300.23407.53
Table 12. Performance Comparison of Ensemble Learning Methods on the CICIDS-2017 dataset. Results are grouped by feature selection approach (All Features, Top 5, and Top 10) and ranked by F1-Score within each group.
ModelAccuracyPrecisionRecallF1-ScoreTraining Time (s)Prediction Time (s)Total Time (s)
All Features
Blending0.9987810.9987030.9987810.9987205150.2116.835167.04
CatBoost0.9989340.9989180.9989340.9988653934.980.613935.58
Stacking0.9987650.9987550.9987650.99875811133.671170.5312304.20
Soft Voting0.9984360.9984330.9984360.9984331302.17516.761818.92
Random Forest0.9983090.9982810.9983090.998290736.578.20744.77
Weighted Avg.0.9984220.9984270.9984220.9984231885.231362.133247.35
Max Voting0.9983530.9983250.9983530.9983331706.851261.392968.24
XGBoost0.9960850.9960660.9960850.9955321303.621.721305.34
Gradient Boosting0.9668660.9904610.9668660.97728745650.3722.6245672.98
Bagging0.9916980.9917160.9916980.99168225.089444.059469.14
>Adaptive Boosting>0.842079>0.872464>0.842079>0.848721>948.01>5.49>953.50
IG Top 5 Features
CatBoost0.9886400.9883830.9886400.987672865.110.45865.57
Random Forest0.9895910.9896350.9895910.988724280.613.67284.28
Soft Voting0.9896030.9896450.9896030.988739392.43487.84880.27
Max Voting0.9895930.9896340.9895930.9887281080.281139.732220.01
Weighted Avg.0.9896050.9896380.9896050.988744909.751119.272029.02
Stacking0.9894700.9894420.9894700.9886523443.691125.454569.14
Gradient Boosting0.9717630.9866970.9717630.9787204143.049.814152.85
XGBoost0.9871310.9868390.9871310.9858011130.701.091131.80
Bagging0.9881960.9879530.9881960.98715240.245392.055432.29
Adaptive Boosting0.8913260.8072780.8913260.846459102.432.25104.68
IG Top 10 Features
CatBoost0.9894090.9893880.9894090.988506729.290.48729.76
Random Forest0.9896900.9897410.9896900.988842363.053.62366.67
Soft Voting0.9897020.9897470.9897020.988855597.98736.071334.05
Max Voting0.9896920.9897410.9896920.9888451349.141544.592893.72
Weighted Avg.0.9896940.9897340.9896940.9888481318.021420.762738.78
Gradient Boosting0.9888220.9879580.9888220.9878006510.8210.586521.40
Stacking0.8870460.9921050.8870460.9335654843.961288.306132.26
XGBoost Ensemble0.9878350.9878350.9878350.9866641125.950.841126.79
Bagging0.9884750.9882510.9884750.98750368.617674.607743.21
Adaptive Boosting0.8915260.8257440.8915260.846705173.902.44176.34
K-Best Top 10 Features
Random Forest0.9966200.9965450.9966200.996540419.214.71423.92
Blending0.9965770.9964400.9965770.9963861305.545.561311.11
Stacking0.9966840.9965770.9966840.9965872714.78465.173179.94
Soft Voting0.9965710.9964900.9965710.996496647.8824.93672.81
Max Voting0.9966100.9965300.9966100.996527936.3146.24982.54
Weighted Avg.0.9964890.9964030.9964890.996415884.3029.12913.42
CatBoost0.9956810.9955910.9956810.995306743.920.48744.40
XGBoost Ensemble0.9924890.9916180.9924890.991906468.790.64469.43
Bagging0.9899380.9898860.9899380.98986577.63223.84301.47
Gradient Boosting0.3706580.8712870.3706580.5101777158.5910.637169.22
Adaptive Boosting0.9026190.8528330.9026190.869632194.432.48196.91
K-Best Top 5 Features
Random Forest0.9629200.9614580.9629200.961999278.495.04283.53
Blending Ensemble0.9626880.9607940.9626880.9615041056.766.461063.22
Soft Voting0.9620970.9610910.9620970.961452427.2832.37459.65
Max Voting0.9629160.9615990.9629160.962075615.5663.65679.21
Weighted Avg.0.9619380.9609240.9619380.961294606.8347.02653.85
CatBoost0.9579700.9559430.9579700.956140685.860.45686.30
Stacking0.9566480.9592690.9566480.9577081694.01470.522164.53
Gradient Boosting0.9464690.9469400.9464690.9462883980.769.793990.55
XGBoost0.9500630.9440170.9500630.944816578.480.68579.16
Bagging0.9537910.9538410.9537910.95368939.51326.80366.31
Adaptive Boosting0.9055890.8598250.9055890.874778110.292.31112.60
Table 13. Pairwise statistical test results between every pair of methods by t-test. The statistically better method ( p = 0.05 ) is shown in bold (both marked bold if no significance). In the left, the RoEduNet-SIMARGL2021 dataset is shown. In the right, the CICIDS-2017 dataset is shown.
Method 1Method 2t-Statisticp-ValueMethod 1Method 2t-Statisticp-Value
DTMLP1.88160.1330DTKNN2.9884 0.0404
DTLR1.40780.2319DTLR3.9523 0.0168
MLPLogistic Regression1.31070.2601DTMLP6.2830 0.0033
Random ForestSoft Voting1.00000.3739KNNLR3.9585 0.0167
Random ForestWeighted Avg.1.00000.3739KNNMLP6.3823 0.0031
Random ForestBagging1.10480.3312LRMLP−1.3453 0.2497
Random ForestStacking1.00000.3739BlendingCatBoost1.2573 0.3356
Random ForestAdaptive Boosting1.07910.3413BlendingStacking0.90790.4598
Random ForestCatBoost1.07900.3413BlendingSoft Voting0.66230.5759
Random ForestGradient Boosting1.32700.2552BlendingRandom Forest−0.27030.8123
Random ForestXGBoost1.21500.2912BlendingWeighted Avg.1.63490.2437
Random ForestBlending24.13740.0000BlendingMax Voting−0.3910.7335
Soft VotingBagging1.07900.3413BlendingXGBoost1.88770.1997
Soft VotingStacking0.00001.0000BlendingGradient Boosting1.11740.38
Soft VotingAdaptive Boosting1.07800.3417BlendingBagging18.9460.0028
Soft VotingCatBoost1.05290.3518BlendingAdaptive Boosting6.55690.0225
Soft VotingGradient Boosting1.25330.2784CatBoostStacking−1.76730.2192
Soft VotingXGBoost1.20050.2962CatBoostSoft Voting−1.18340.3582
Soft VotingBlending24.57180.0000CatBoostRandom Forest−1.13410.3744
Weighted Avg.Bagging1.07900.3413CatBoostWeighted Avg.−1.16320.3648
Weighted Avg.Stacking0.00001.0000CatBoostMax Voting−1.14350.3713
Weighted Avg.Adaptive Boosting1.07800.3417CatBoostXGBoost2.26910.1513
Weighted Avg.CatBoost1.05290.3518CatBoostGradient Boosting1.10020.386
Weighted Avg.Gradient Boosting1.25330.2784CatBoostBagging3.63670.068
Weighted Avg.XGBoost1.20050.2962CatBoostAdaptive Boosting5.91480.0274
Weighted Avg.Blending24.57180.0000StackingSoft Voting−0.8410.4889
BaggingStacking−1.10700.3304StackingRandom Forest−0.82750.495
BaggingAdaptive Boosting1.07800.3417StackingWeighted Avg.−0.80140.507
BaggingCatBoost−1.00000.3739StackingMax Voting−0.84020.4892
BaggingGradient Boosting−1.00000.3739StackingXGBoost2.30410.1477
BaggingXGBoost1.36210.2448StackingGradient Boosting1.10480.3844
BaggingBlending5.59730.0050StackingBagging6.15170.0254
StackingAdaptive Boosting1.07920.3412StackingAdaptive Boosting6.0950.0259
StackingCatBoost1.08060.3407Soft VotingRandom Forest−0.72480.5439
StackingGradient Boosting1.34820.2489Soft VotingWeighted Avg.1.94220.1916
StackingXGBoost1.21760.2903Soft VotingMax Voting−0.83030.4937
StackingBlending22.71850.0000Soft VotingXGBoost1.85980.204
Adaptive BoostingCatBoost−1.07910.3413Soft VotingGradient Boosting1.11630.3804
Adaptive BoostingGradient Boosting−1.07570.3426Soft VotingBagging19.63280.0026
Adaptive BoostingXGBoost−1.06860.3455Soft VotingAdaptive Boosting6.57150.0224
Adaptive BoostingBlending−0.70750.5183Random ForestWeighted Avg.0.93760.4474
CatBoostGradient Boosting−0.96200.3905Random ForestMax Voting−1.36020.3068
CatBoostXGBoost1.39110.2366Random ForestXGBoost1.8090.2122
CatBoostBlending5.59300.0050Random ForestGradient Boosting1.11760.38
Gradient BoostingXGBoost1.18860.3003Random ForestBagging12.93370.0059
Gradient BoostingBlending12.95520.0002Random ForestAdaptive Boosting6.65360.0219
XGBoostBlending3.36830.0281Weighted Avg.Max Voting−1.01690.4162
Random ForestDT1.50000.2080Weighted Avg.XGBoost1.85750.2043
Random ForestMLP1.88150.1331Weighted Avg.Gradient Boosting1.11570.3806
Soft VotingDT1.00000.3739Weighted Avg.Bagging21.46140.0022
Soft VotingMLP1.88120.1331Weighted Avg.Adaptive Boosting6.55190.0225
Weighted Avg.DT1.00000.3739Max VotingXGBoost1.80950.2121
Weighted Avg.MLP1.88120.1331Max VotingGradient Boosting1.1180.3798
BaggingDecision Tree−1.26060.2760Max VotingBagging12.54620.0063
BaggingMLP−1.18740.3008Max VotingAdaptive Boosting6.66030.0218
StackingDecision Tree−1.10070.3328XGBoostGradient Boosting1.05250.403
StackingMLP−1.00290.3726XGBoostBagging−0.25010.8258
Adaptive BoostingDecision Tree−3.92030.0172XGBoostAdaptive Boosting4.99340.0378
Adaptive BoostingMLP−3.89970.0175Gradient BoostingBagging−1.06970.3968
CatBoostDecision Tree−1.88330.1328Gradient BoostingAdaptive Boosting−0.34490.7631
CatBoostMLP−1.87610.1339BaggingAdaptive Boosting6.08270.026
Gradient BoostingDecision Tree−1.22730.2870CatBoostDT1.29790.2641
Gradient BoostingMLP−1.20900.2933CatBoostKNN2.92000.0432
XGBoostDT−2.07630.1065BlendingDT0.61460.5720
XGBoostMLP6.21950.0034BlendingKNN0.22510.8330
BlendingMLP5.06650.0071
Disclaimer/Publisher’s Note: The statements, opinions and data contained in all publications are solely those of the individual author(s) and contributor(s) and not of MDPI and/or the editor(s). MDPI and/or the editor(s) disclaim responsibility for any injury to people or property resulting from any ideas, methods, instructions or products referred to in the content.