Article

True Triaxial Investigation of the Effects of Principal Stresses and Injection Pressure on Induced Seismicity Behavior in Geothermal Reservoirs

1
Institute of Future Civil Engineering Science and Technology, Chongqing Jiaotong University, Chongqing 400074, China
2
High Performance Computing Department, National Supercomputing Center in Shenzhen, Shenzhen 518055, China
3
State Key Laboratory of Coal Mine Disaster Dynamics and Control, School of Resources and Safety Engineering, Chongqing University, Chongqing 400044, China
4
China Coal Technology and Engineering Group, Chongqing Research Institute, Chongqing 400037, China
*
Author to whom correspondence should be addressed.
Appl. Sci. 2025, 15(19), 10545; https://doi.org/10.3390/app151910545
Submission received: 25 August 2025 / Revised: 22 September 2025 / Accepted: 25 September 2025 / Published: 29 September 2025
(This article belongs to the Special Issue Engineering Groundwater and Groundwater Engineering—2nd Edition)

Abstract

Understanding the mechanisms of injection-induced fault slip is critical for managing subsurface energy technologies. This study experimentally investigates the influences of the intermediate principal stress (σy), minimum principal stress (σx), and injection pressure (P) on fault slip initiation stress and velocity. Experiments were conducted on pre-faulted granite specimens (100 mm cubes) using a true triaxial apparatus, simulating in situ stress conditions. The results reveal a two-stage slip process: an initial stable stage dominated by elastic energy accumulation, followed by a slip stage characterized by rapid energy release and stick–slip oscillations. We found that slip initiation stress increases linearly with both σy and σx, but decreases linearly with increasing P. A higher σy delays slip initiation but can lead to larger stress drops and higher slip velocities upon failure. Conversely, fluid injection weakens the fault by reducing effective normal stress, exhibiting a dual effect: it lowers the stress required for slip and enhances the instantaneous slip velocity after initiation. Our findings provide quantitative, mechanistic insights into fault slip behavior, serving as a critical benchmark for numerical simulations and contributing to improved assessment and mitigation of injection-induced seismicity across various engineering applications.

1. Introduction

Geothermal energy, characterized by its renewability, low carbon emissions, and stable availability, is recognized as a critical element in the global energy transition [1,2,3,4]. This energy originates from heat stored within the Earth, primarily sourced from primordial heat retained since planetary formation, the decay of radioactive isotopes, and mantle convection [5,6]. Within the shallow crust (typically several kilometers depth), geothermal gradients of 25–30 °C/km create exploitable thermal differentials. Globally, geothermal resources support significant economic value through power generation, heating, agricultural applications and energy storage [7,8]. In geothermal engineering, Enhanced Geothermal Systems (EGS) employ high-pressure fluid injection into hot dry rock (predominantly granite) to induce hydraulic fracturing [9]. This process stimulates rapid fracture network development, enabling efficient heat absorption and fluid migration through permeable pathways, significantly enhancing thermal exchange efficiency and total energy extraction [10,11].
However, while improving reservoir permeability and thermal recovery, EGS operations introduce substantial geomechanical risks [12,13]. Fracture generation and interconnectivity establish complex stress–fluid–solid coupling within the reservoir rock mass [14]. Geological processes including fracture propagation, pressurized fluid stimulation, and active tectonic compression drive complex three-dimensional geo-stress redistribution in fault zones [15]. This geo-stress redistribution can alter fault stability and induce slip events, as evidenced by field observations documenting sustained seismic activity from microseismicity to moderate earthquakes at multiple EGS sites [16,17,18,19]. Under specific conditions, damaging seismic events may occur, presenting challenges to both engineering integrity and public acceptance [20]. Therefore, driven by global decarbonization and the promotion of renewable energy, research on injection-induced seismicity has surged in recent years [21].
Several real-world cases have highlighted the complexity and potential risks associated with this issue. The 2017 Mw 5.5 Pohang earthquake in South Korea exemplifies these risks, occurring proximate to an active EGS operation [22]. Post-event analyses demonstrated that high-pressure fluid injection into a critically stressed preexisting fault initiated a seismic cascade culminating in the mainshock [23,24,25]. This event resulted in substantial property damage and economic losses while contradicting key operational concepts, notably the volume hypothesis, which posits that maximum induced earthquake magnitude is limited by injected fluid volume. The Pohang case instead established that preexisting tectonic conditions, fault geometry, and in situ stress regime are primary controls governing rupture potential. Critically, it revealed that fluid injections can trigger runaway slip events exceeding predictive models.
Injection-induced fault slip mechanics are governed by complex stress evolution, fluid flow, and solid deformation interactions within a stress–fluid–solid coupled framework [26]. Elevated pore pressures from high-pressure injections reduce normal effective stresses along faults, promoting shear slip via the Mohr-Coulomb failure criterion [26]. Global case studies (e.g., Basel, Switzerland; Pohang, Republic of Korea) demonstrate that fault reactivation predominantly occurs in critically stressed regimes, where minimum principal stress perturbations can trigger runaway ruptures beyond the stimulated volume [27,28]. Furthermore, seismicity rates and magnitudes depend critically on stimulation techniques: hydraulic fracturing may mitigate or amplify risks depending on tectonic context and operational parameters [29].
Despite advances in numerical modeling [30,31], quantitative understanding of key stress parameters’ effects on slip dynamics remains limited. While poroelastic stress changes and fault reactivation have been studied in CO2 storage and hydrocarbon depletion scenarios [32], the specific controls of intermediate principal stress, minimum principal stress, and injection pressure on slip initiation/velocity in geothermal systems are poorly constrained. Controlled laboratory experiments under true triaxial conditions are essential to bridge this gap, permitting isolation of variables to replicate in situ stress states more accurately than field observations allow [33,34].
The aim of this study is to quantitatively investigate the individual and coupled influences of the intermediate principal stress (σy), minimum principal stress (σx), and fluid injection pressure (P) on the initiation stress and slip velocity of faults. To achieve this, we employ a true triaxial hydro-mechanical coupling apparatus to simulate the stress–fluid–solid coupled environments under controlled laboratory conditions. The scientific novelty of this work lies in the systematic isolation and quantification of these three key governing parameters, which has rarely been achieved in previous experimental studies. Specifically, we provide first-hand experimental evidence and quantitative relationships revealing: (1) the dual role of the intermediate principal stress in both stabilizing faults pre-slip and amplifying energy release post-slip; (2) the distinct, linear control of the minimum principal stress on the slip initiation threshold; and (3) the dual effect of injection pressure in significantly lowering the slip initiation stress while simultaneously increasing the peak slip velocity. These findings deliver fundamental, quantitative insights into the stress controls governing injection-induced seismicity, moving beyond qualitative descriptions towards predictive mechanical understanding.
The remainder of this paper is structured as follows. Section 2 describes the true triaxial hydro-mechanical coupling apparatus and the preparation method of the granite specimens with prefabricated faults. The experimental design and stress loading procedures for the three parameter groups (σy, σx, and P) are also included. Section 3 presents the experimental results and provides a systematic analysis of the σy, σx, and P on fault slip initiation stress and slip velocity. The mechanisms underlying the observed slip behaviors and the broader implications of the results for understanding injection-induced seismicity are discussed in Section 4. Finally, the main conclusions of this study are summarized in Section 5.

2. Materials and Methods

2.1. Apparatus and Specimen

A schematic diagram of the experimental setups is presented in Figure 1. The system enables independent servo-controlled loading along three orthogonal axes on the 100 mm cubic specimens. The maximum achievable loads are 600 MPa in the maximum (σz) and intermediate (σy) principal stress directions, and 400 MPa in the minimum principal stress (σx) direction. The loading accuracy of ±0.01% of the full-scale capacity as confirmed by calibration against a deadweight tester and reference transducer. Each loading platen is equipped with two linear variable differential transformers (LVDTs) to measure deformation of the specimen. The LVDTs were calibrated against a certified micrometer, demonstrating a linear measurement accuracy of ±0.5 μm. To minimize measurement errors, all deformation data presented herein are averaged from the two LVDTs in each direction. In this work, high-pressure water was injected along the vertical direction using a high-precision syringe pump (accuracy of ±0.01 MPa) capable of maintaining pressure, as shown in Figure 1b. The loading platens are internally designed with fluid channels and externally with guiding grooves, as illustrated in Figure 1c. More technical details can be found in pervious publications [35,36].
Granite was selected as the experimental material to simulate the hot dry rock (HDR) reservoirs encountered in geothermal energy engineering [37]. The granite exhibited a uniaxial compressive strength of 159 MPa and an elastic modulus of 19.8 GPa, as determined by mechanical tests. Cubic specimens with dimensions of 100 mm × 100 mm × 100 mm were prepared from the granite blocks by cutting and polishing. The SEM image (Figure 1f) reveals the rough microstructure of the granite material used, characterized by granular and porous features, primarily composed of minerals such as quartz, feldspar, and mica.
An inclined fault surface, simulating a natural fault in the reservoir rock mass, was then introduced into the specimens using a diamond wire cutter. This surface, which possessed a specific roughness, was oriented at 44° from the vertical central axis (Figure 1d). The three-dimensional in situ stress field and fluid injection configuration simulated in the experiment are illustrated in Figure 2. Here, σx, σy, σz, and P represent the minimum, intermediate, maximum principal stresses, and the fluid injection pressure, respectively. Accordingly, the experimental setup represents a simulation of a reverse fault, with the fault movement primarily oriented along the vertical direction (σz-direction).

2.2. Stress Loading Setups

Three sets of experiments were performed, systematically varying three key parameters: the σx, σy, and P, as detailed in Table 1. The influence of the stress parameters on injection-induced fault slip behavior was comprehensively analyzed based on two quantitative indicators: the fault slip initiation stress and the fault slip velocity. The specific loading procedures applied to each experimental group are described below.
Group I: This group investigates the influence of varying σy on fault slip behavior. First, the σx and σy were applied to their pre-set values (loading rate: 0.01 MPa/s), followed by the injection of high-pressure water at a constant pressure of 3 MPa. Then, the system was maintained until all stress components reached a steady state. Finally, displacement-controlled loading rate at 0.001 mm/s in the σz was applied until fault slip occurred. Experiments of Group I-1 through Group I-5 represent different σy, namely σy = 5 MPa, 10 MPa, 15 MPa, 20 MPa and 25 MPa, respectively.
Group II: This group investigates the influence of varying σx on fault slip behavior. The same loading sequence was adopted as in Group I. Experiments of Group II-1 through Group II-4 represent different σx, namely σx = 5 MPa, 10 MPa, 15 MPa and 20 MPa, respectively.
Group III: This group investigates the influence of varying P on fault slip behavior. The same loading sequence was adopted as in Group I and II. Experiments of Group III-1 through Group III-4 represent P, namely P = 1 MPa, 2 MPa, 3 MPa and 4 MPa, respectively.

2.3. Data Processing and Analytical Framework

The 3D stresses (σx, σy and σz) are acquired from the stress sensors in three loading directions. The fluid injection P is servo-controlled by the built-in fluid pressure regulator of the experimental system. All the raw data that described above were processed and analyzed using a combination of custom scripts developed in MATLAB R2023a and standard geomechanical principles. The analytical approach is based on the classical Mohr-Coulomb failure criterion and the concept of effective stress to interpret the fault slip behavior under fluid injection.
The normal stress (σn) and shear stress (τ) acting on the inclined fault plane were calculated from the applied principal stresses (σx, σy and σz) using the following Equations (1) and (2).
σ n = σ x + ( σ z σ x ) sin 2 θ
τ = ( σ z σ x ) sin θ cos θ
where σn and τ denote the normal stress and shear stress, respectively; σx and σz denote the minimum and maximum principal stresses, respectively (units: MPa); and θ represents the angle between the fault plane and the σz-direction.
Considering both the pre-slip and post-slip stages, the shear displacement St along the fault plane can be expressed by Equation (3). And the fault slip velocity (v) in each direction can be calculated by the shear displacement and loading time.
s t = s z σ z K b cos θ
where Sz is the displacement in the direction of the maximum principal stress during fault slip, which is measured by the LVDTs (unit: mm); σz is the maximum principal stress (unit: MPa); Kb represents the elastic stiffness of the granite (unit: kN/mm); and θ is the angle between the fault plane and the σz-direction (unit: °).
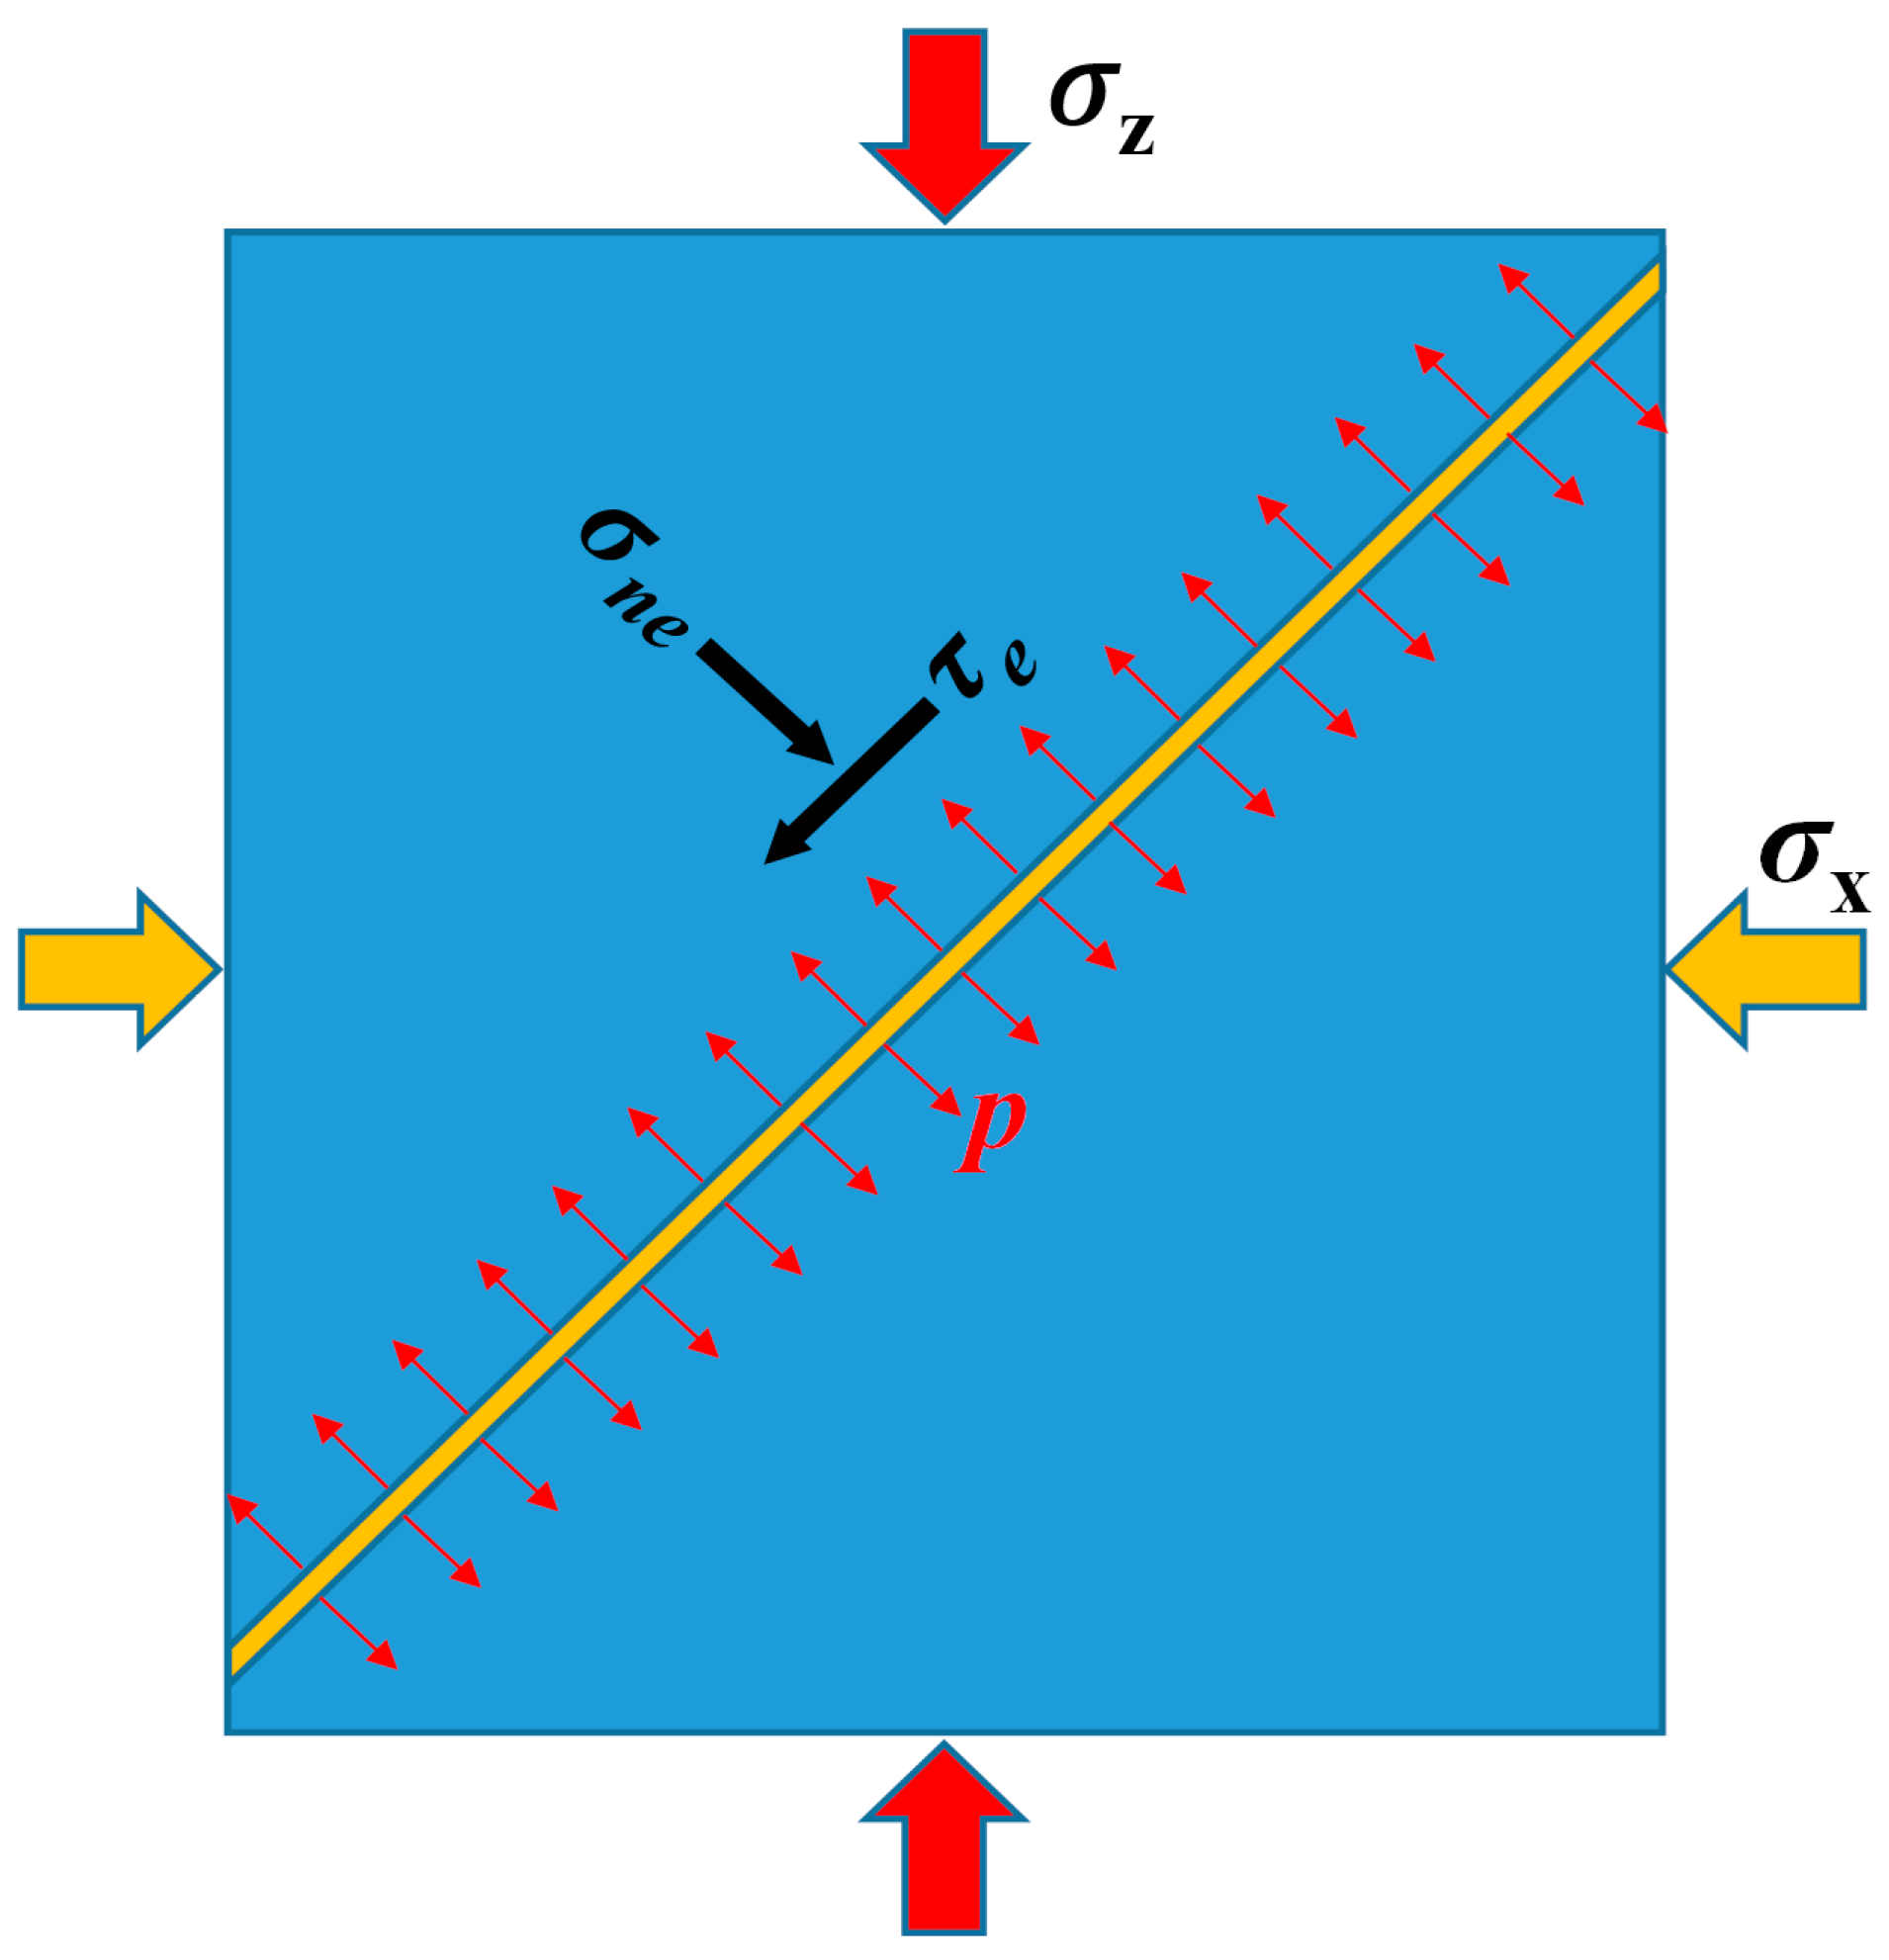
Moreover, in the presence of injection pressure, the effective σne and τe on the fault plane can be expressed by Equations (4) and (5):
σ n e = σ x + ( σ z σ x ) sin 2 θ P
τ e = 1 2 ( σ z σ x ) sin 2 θ
where σne and τe are the effective normal stress and effective shear stress, respectively (unit: MPa), and θ is the angle between the fault plane and the σz-direction.
Based on these formulations, the initiation stress, slip velocity, and underlying mechanical processes of fault slip can be effectively quantified and characterized in this study.

3. Results and Analysis

3.1. Influence of Intermediate Principal Stress on Fault Slip Behavior

3.1.1. Fault Slip Initiation Stress Under Different Intermediate Principal Stresses

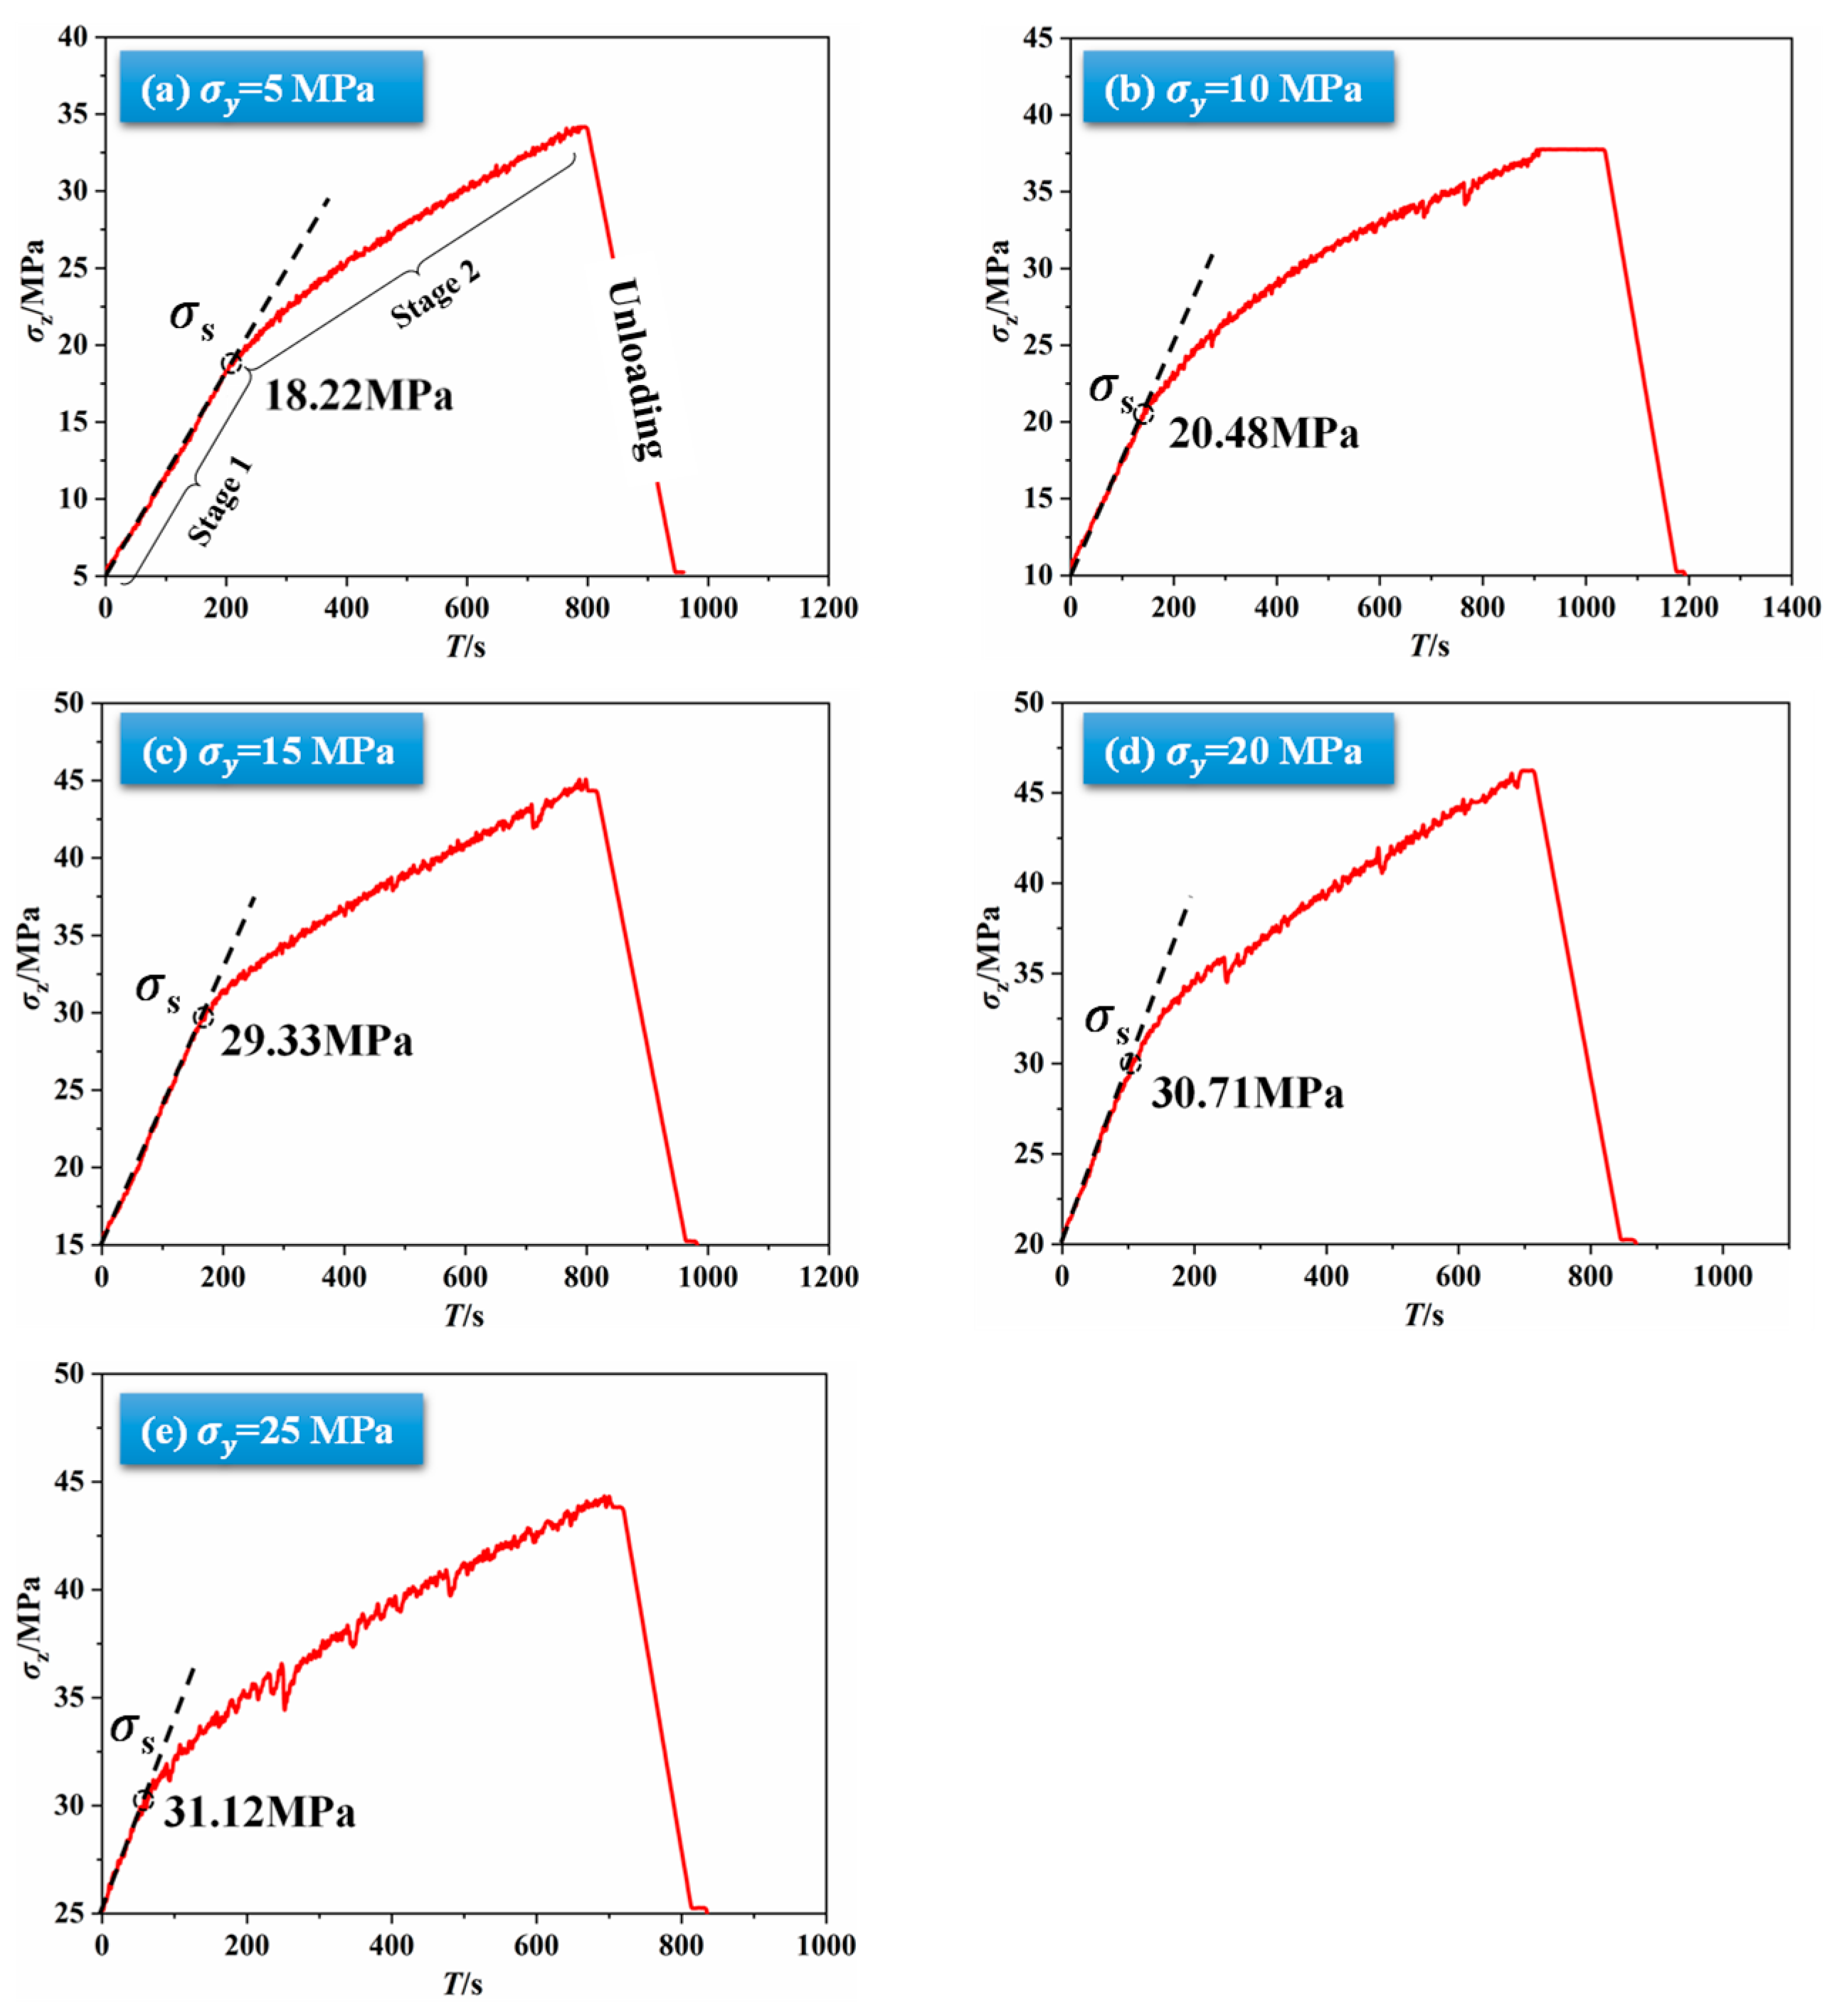
Figure 3 presents the relationship between the σz and loading time under constant conditions of σx = 5 MPa, P = 3 MPa, and σz_r = 0.001 mm/s (displacement-controlled loading rate in the σz-direction). Each subplot corresponds to different σy, representing Groups I-1 through I-5 in Table 1. As shown in Figure 3, the σz loading curves under different σy conditions exhibit a distinct inflection point, dividing the entire loading process into two stages: the fault-stable stage (Stage 1) and the fault-slip stage (Stage 2).
The distinct two-stage behavior observed in all experiments: a linear elastic compression followed by a stick–slip oscillation. It is a direct manifestation of the fault’s frictional stability transition. Stage 1 represents the accumulation of elastic strain energy within the rock mass, while the onset of Stage 2 marks the overcoming of static frictional resistance and the initiation of unstable slip, analogous to the nucleation of natural and induced earthquakes.
Taking Group I-1 as an example (Figure 3a). During the fault-stable stage (Stage 1), the whole fault plane remains in a stable state. At this stage, the σz is relatively low, which is reflected in the figure as a relatively smooth, linear increase. This observation implies that the magnitude of the resolved shear stress parallel to the fault plane is limited. Owing to the heterogeneity in elastic modulus among the constituent mineral grains of the granite fault surface, the application of external stress induces heterogeneous microscopic deformation. This, in turn, leads to the formation of continuous asperity structures along the fault plane. These interlocking asperities create localized zones of high friction, thereby conferring a characteristic frictional strength to the fault interface. Consequently, as long as the applied shear stress remains below the frictional strength provided by these asperities, the fault remains locked, preventing relative displacement (slip) between the hanging wall and the footwall. Consequently, the fault plane of specimen remains in a state of progressive compression, and the specimen can sustain a certain load. Therefore, the increase rate (slope) of σz in Stage 1 is greater than that observed in Stage 2.
During the fault-slip stage (Stage 2), with the continued increase of σz, the shear stress parallel to the fault plane exceeds the frictional strength, breaking the interlocking state of the asperities. This stress condition initiates relative displacement between the hanging wall and the footwall, marking the onset of fault slip. As slip proceeds, the specimen’s load-bearing capacity diminishes, which is reflected in a noticeable reduction in the loading rate of σz. Moreover, σz in Stage 2 exhibits pronounced serrated oscillations, representing a typical stick–slip behavior. This behavior is consistent with the classical Mohr-Coulomb fault friction model. The model describes an initial phase of frictional locking due to high static friction. When the shear stress exceeds the static friction threshold, abrupt slip nucleation occurs, and the fault transitions to a state of lower dynamic friction [38]. This transition causes rapid stress–strain release accompanied by oscillations.
Similarly, in real injection-induced earthquake processes, deep faults subjected to stress accumulation from fluid injection may also undergo a prolonged period of stress loading, until the shear stress surpasses the frictional strength and sudden slip occurs. This process is analogous to the nucleation process of actual induced earthquakes. Therefore, the inflection point between Stage 1 and Stage 2 corresponds to the fault slip initiation stress, denoted as σs. Following a sustained period at Stage 2, the experiment was terminated by unloading the specimen. The data recorded during this unloading phase are not considered in the analysis, as they do not represent the physical processes under investigation.
Within this experimental framework of this study, all experimental groups exhibited these two-stage characteristics, indicating that the employed testing method can simulate the full process of fault slip in laboratory. Based on the obtained data, Stage 1 primarily represents the accumulation of elastic energy in the rock mass prior to fault slip, while Stage 2 corresponds to the stick–slip release of energy, consistent with the stress-release process in the physics of earthquake sources for induced seismicity.
The experimental results further indicate that the “locking-slipping” behavior of fault planes under complex three-dimensional stress states constitutes the microscopic mechanism of induced earthquakes: increasing shear stress during the Stage 1 is primarily used to overcome the static friction of asperities, and once σs is reached, the fault begins to slip, producing stress drops and fluctuations. The observed data patterns reveal that the mechanical response to fluid injection involves fault slip under sustained shear stress, which is a characteristic manifestation of stick–slip seismic mechanisms.
Based on these observations, the fault slip initiation stress σs was measured as 18.22, 20.48, 29.33, 30.71 and 31.12 MPa under σy = 5, 10, 15, 20 and 25 MPa, respectively. Moreover, fluctuations analogous to stress drops in seismology can be observed during Stage 2 [39,40]. When σy is relatively low, the σz fluctuations in Stage 2 are small; conversely, when σy is relatively high, the σz fluctuations in Stage 2 are considerably larger. This indicates that although a higher σy can significantly increase the slip initiation stress σs. With the sustained loading of the σz, higher σy may amplify the stress drop during induced slip, which corresponds to an increase in the magnitude of injection-induced earthquakes.
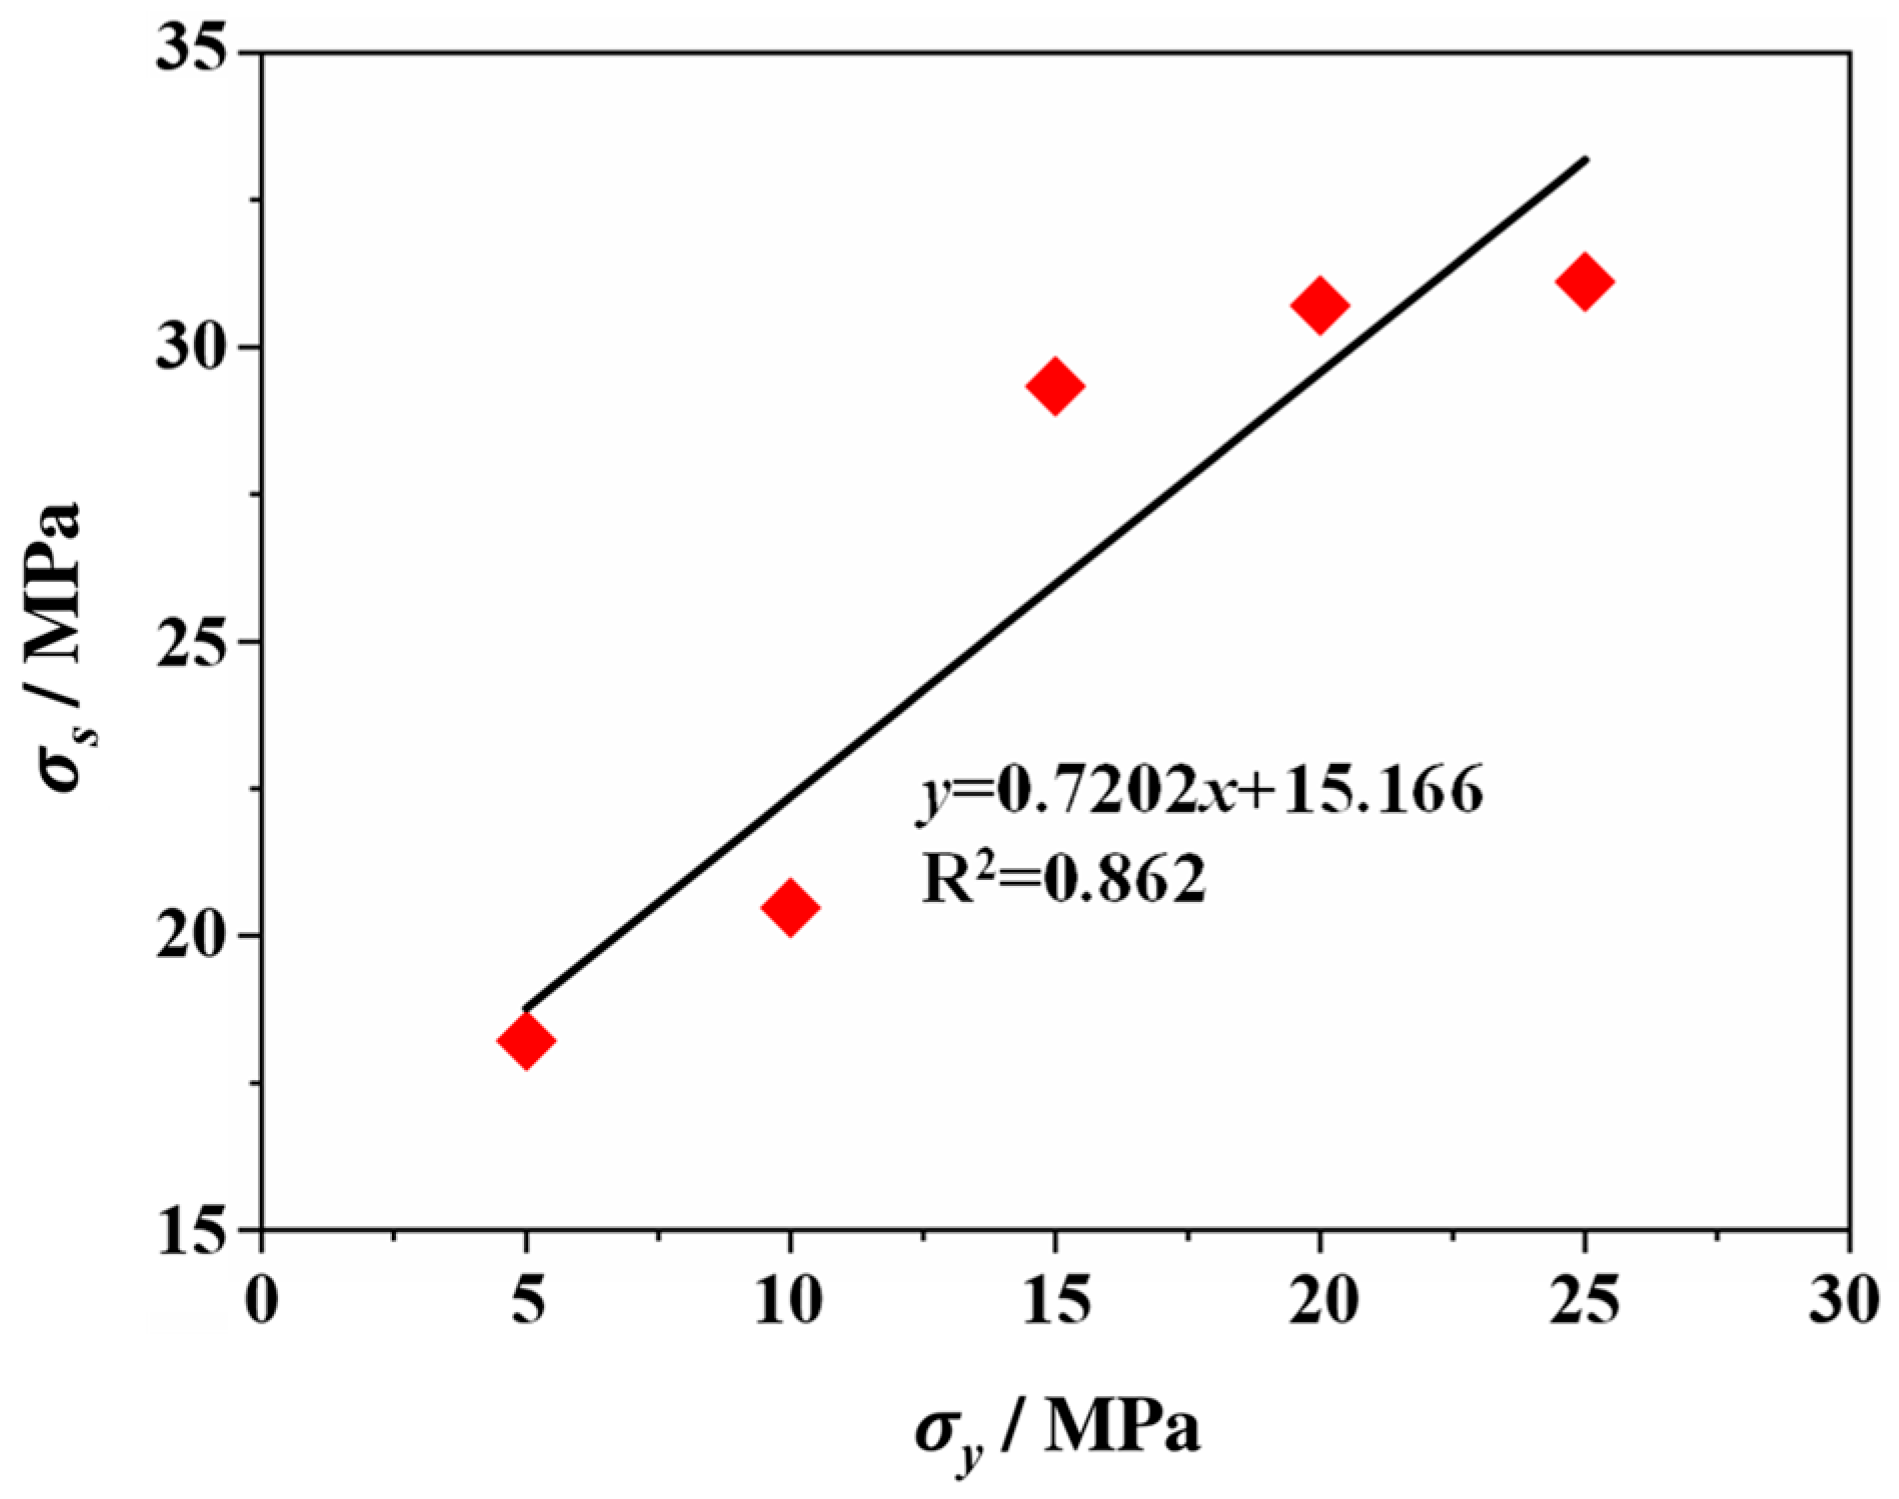
Figure 4 further illustrates the quantitative relationship between σz and σy during the fault-slip stage. As shown, σs exhibits a roughly linear increase with increasing σy. This relationship indicates that, under our experimental conditions, the σy is proportional to the fault slip initiation stress, which can be interpreted as the requirement of a higher driving shear stress for the fault plane to slip under higher σy. The linear increase of σs with σy is a fundamental mechanical response predicted by the Mohr-Coulomb failure criterion. According to the Mohr-Coulomb criterion, this trend is an expected physical outcome: increasing σy enhances the normal stress (σn) component on the fault plane, thereby raising the shear stress (τ) threshold necessary for slip (see Equations (1) and (2)). This provides quantitative, experimental validation that the intermediate principal stress is a first-order controller of fault stability. In addition, the slope of the σy-σz can be regarded as an effective measure of the friction coefficient or friction angle. In our experiments, the approximate constancy of this slope suggests that the frictional properties of the system remain largely unchanged within this stress range.
These results also indicate that a higher σy can substantially enhance the shear resistance of the fault plane, requiring a higher σz to slip. Moreover, it can be observed that this result obeys the Mohr-Coulomb failure criterion, providing a quantitative basis for inferring fault frictional properties from laboratory measurements. It is noteworthy that minor deviations occur in certain data points (e.g., at σy = 15 MPa), likely due to heterogeneities or fine-scale structures on the fault surface; nevertheless, the overall linear trend is pronounced. This observation is also consistent with previous studies, which indicate that rock failure strength significantly increases under elevated principal stress conditions [41,42]. Therefore, it can be inferred that, in rock masses containing faults, adjusting the intermediate principal stress can enhance fault stability.
In summary, this study highlights that the evolution of the σy near faults must be accounted for during hydraulic stimulation in geothermal projects. An elevated σy increases the fault slip initiation stress, consequently reducing the risk of injection-induced fault slip. However, for a critically stressed fault where the σz maintains compression, a higher σy at the onset of slip may promote larger-magnitude seismic events due to the release of greater accumulated strain energy.

3.1.2. Fault Slip Velocity Under Different Intermediate Principal Stresses

The fault slip velocity is a key parameter as it governs the instantaneous stress release rate and the amount of seismic radiated energy, thereby directly influencing both the earthquake magnitude and the characteristics of the source. Generally, a higher slip velocity corresponds to a greater energy release rate, which generates stronger seismic waves and, consequently, higher ground-motion intensity. In this study, the shear displacement along the fault is denoted as St. Prior to the onset of slip, the observed deformation is primarily attributable to elastic compression of the rock matrix, and shear displacement occurs only when the shear stress equals or exceeds the frictional strength of the fault plane.
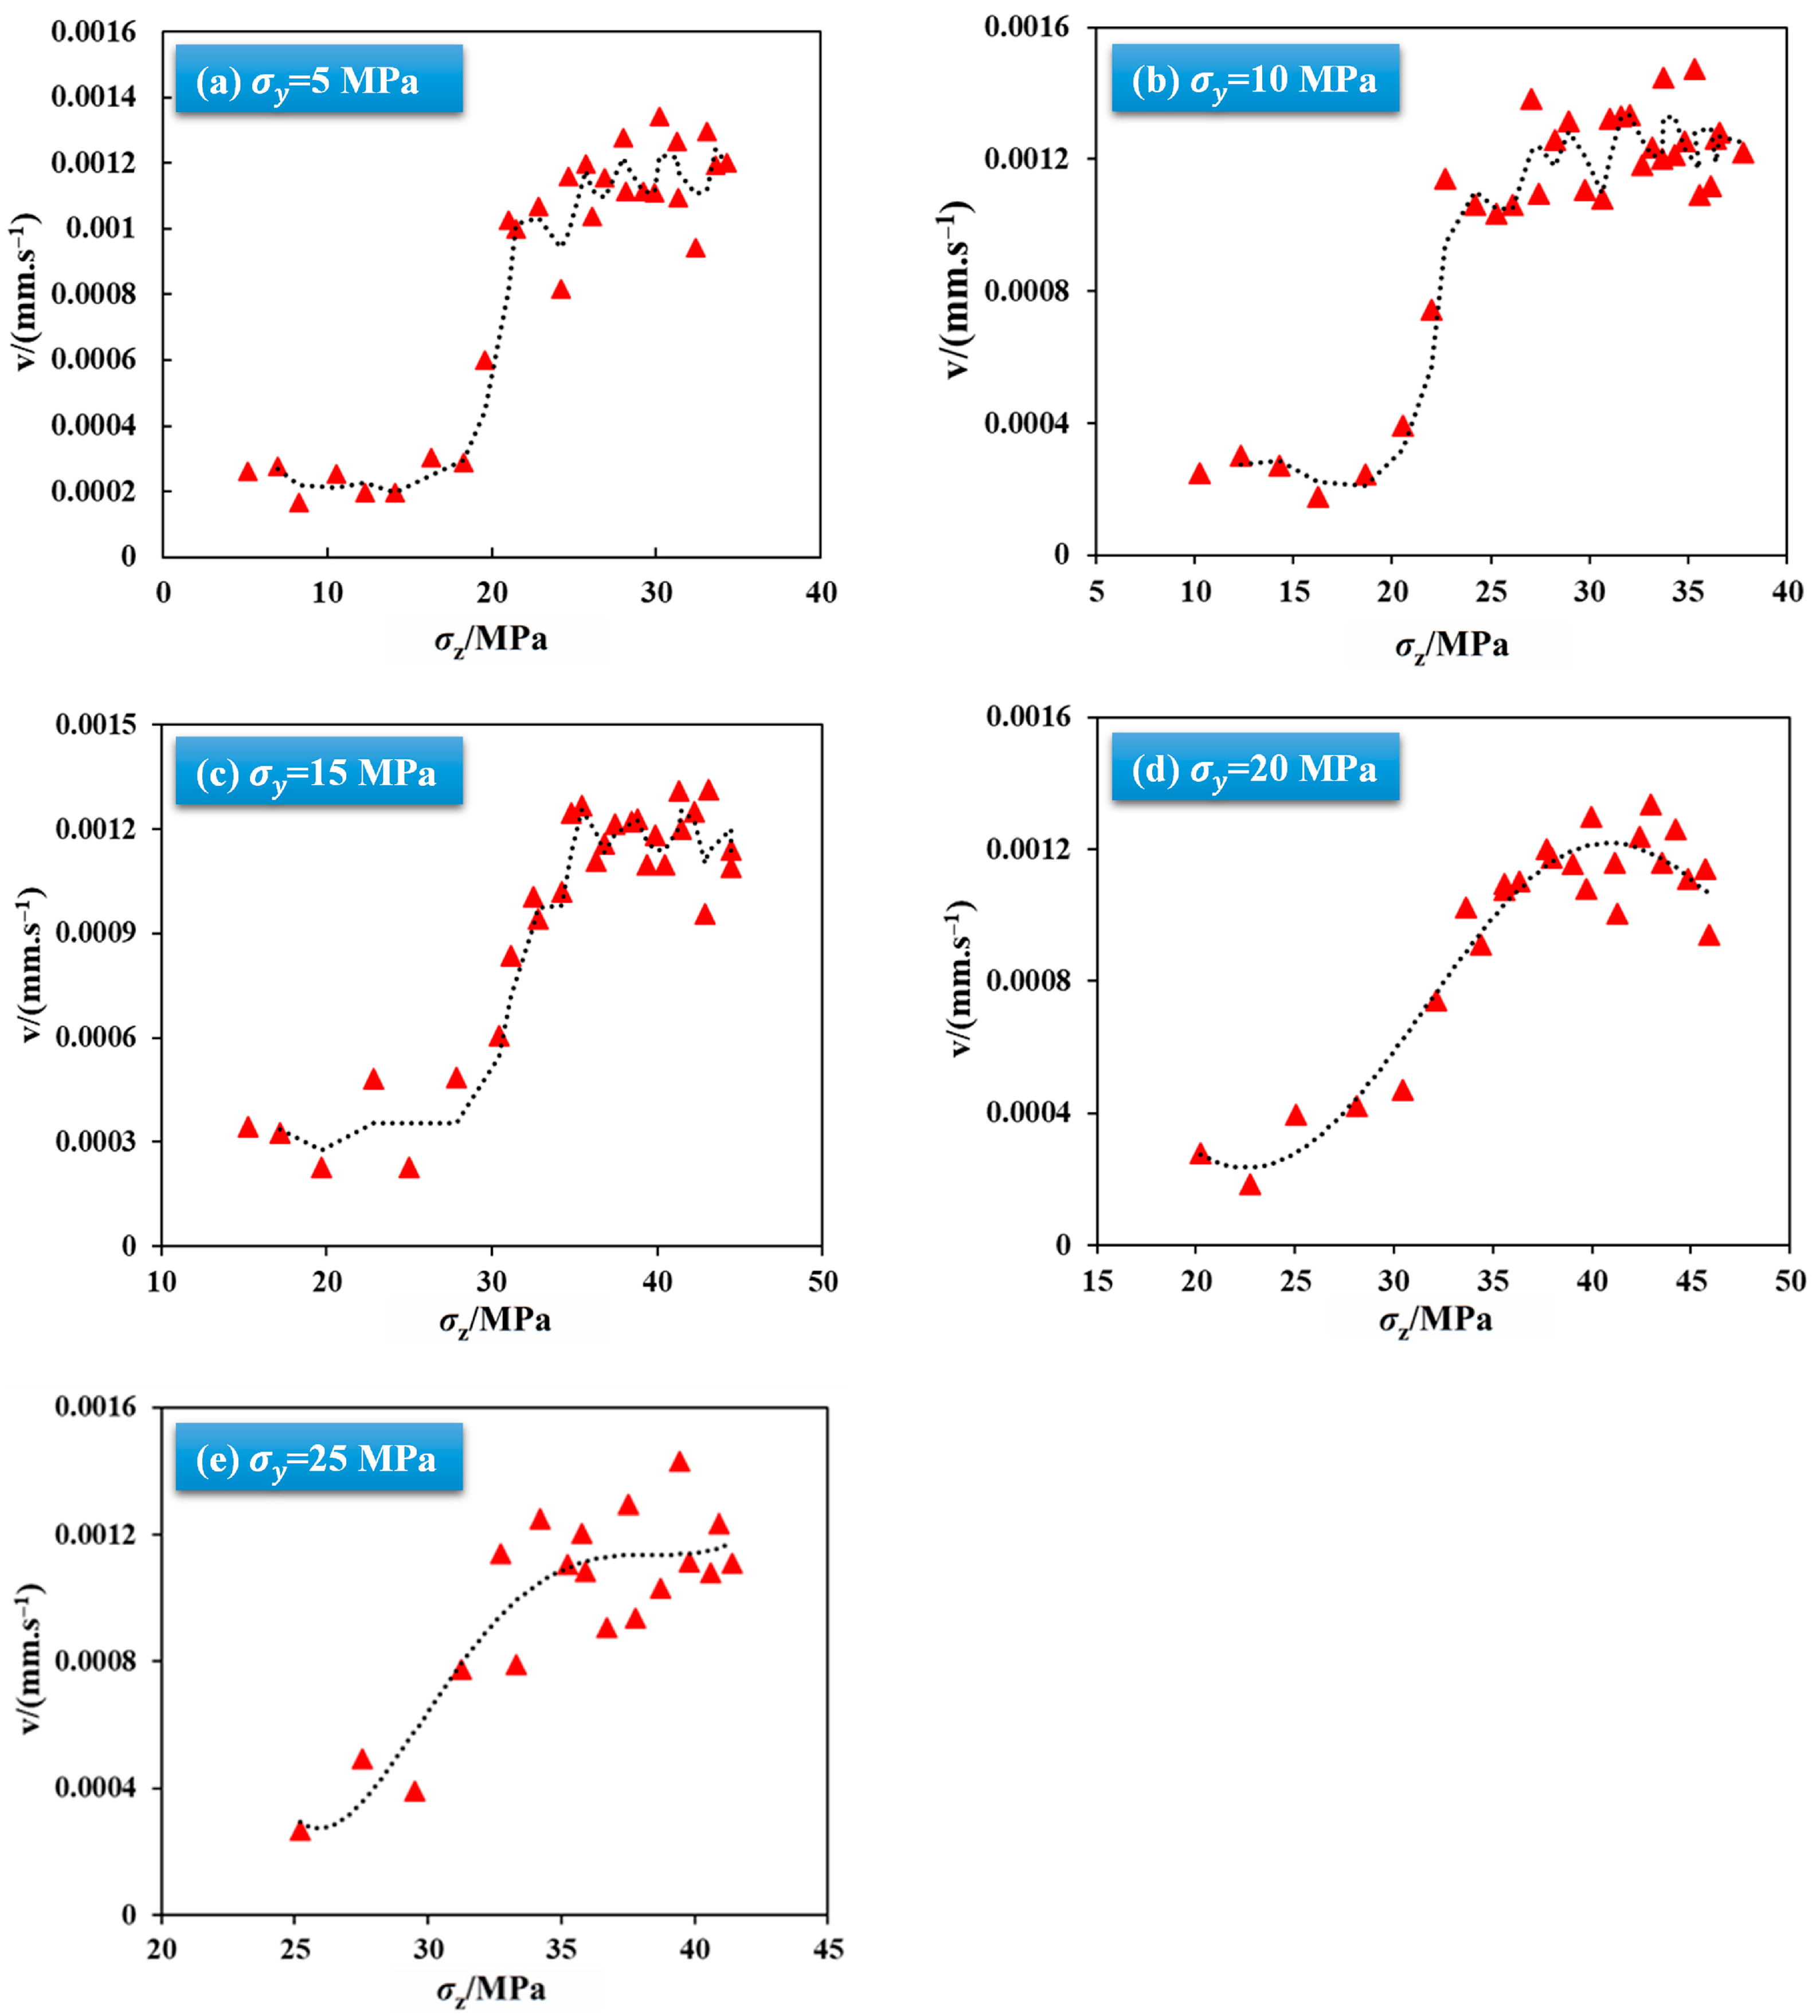
Figure 5 illustrates the evolution of fault slip velocity during the σz loading process. In the early stage of σz loading, the slip velocity (described as v-σz curve) remains at a low and essentially stable level (corresponding to Stage 1). This indicates that, during Stage 1, the shear stress on the fault plane is insufficient to exceed the frictional strength, resulting in negligible measurable shear displacement; the energy is primarily stored elastically within the rock mass. As σz continues to increase and the shear stress reaches and slightly exceeds the frictional strength, the slip velocity begins to rise rapidly. This abrupt change marks the transition of the fault from a locking state to dynamic slip state: once the shear stress surpasses the frictional resistance, the microscopic asperity interlocking on the fault surface collapses, producing shear slip and causing a sudden jump in v-σz curve. The slip velocity is a critical parameter as it scales with the seismic moment rate and radiated energy. The observed sawtooth oscillations in velocity are the kinematic expression of the stick–slip stress drops (as shown in Figure 3), representing repeated cycles of energy accumulation and release. Higher σy conditions not only delay slip initiation but also lead to higher slip velocity, indicating the potential for stronger seismic radiation upon failure, which has direct implications for forecasting the magnitude of injection induced seismicity. The velocity surge recorded in the experiment can be regarded as an indicator of instantaneous stress release during fault slip, corresponding to the rapid energy release phase. Notably, the slip velocity curve during the sliding stage exhibits periodic sawtooth-like oscillations, which correspond to the serrated stress pattern of σz shown in Figure 3. This observation indicates that the fault slip does not occur as a single, abrupt release event, but rather as a series of minor re-locking and re-slipping episodes within a stick–slip cycle. Such stick–slip instabilities are commonly interpreted as laboratory-scale analogs of the repeated small earthquakes or aftershocks observed in nature. This behavior signifies that the fault slip process is characterized by a discrete, episodic release of energy [43].
Figure 5 further elucidates the velocity dynamics during fault slip: during the Stable 1, the slip velocity remains extremely low; once slip is triggered, the velocity increases sharply and exhibits oscillatory behavior. This finding underscores the direct coupling between displacement and stress variation: slip velocity serves as an immediate indicator of abrupt shear stress surges on the fault plane. This observation aligns with fault slip theory, postulating that slip shear stress approaches the fault’s load-bearing capacity limit at critical state, showing significant stored energy release. In induced seismicity field, this implies that once critical slip is initiated, fault movement occurs suddenly at high velocity, resulting in a sharp stress drop and intense ground shaking.

3.2. Influence of Minimum Principal Stress on Fault Slip Behavior

3.2.1. Fault Slip Initiation Stress Under Different Minimum Principal Stresses

Figure 6 presents the relationship between the σz and loading time under constant conditions of σy = 30 MPa, P = 3 MPa, and σz_r = 0.001 mm/s (displacement-controlled loading rate in the σz-direction). Each subplot corresponds to different σx, representing Groups II -1 through II-4 in Table 1. Like the previously discussed variation of σy, the data curves under each experimental condition can also be divided into a fault-stable stage and a fault-slip stage. The σs for each σx can be identified from the inflection point where the slope of the curve sharply decreases.
Based on these observations, the fault slip initiation stress σs was measured as 38.74, 64.34, 59.29, and 69.13 MPa under σx = 5 MPa, 10 MPa,15 MPa and 20 MPa, respectively. This result indicates that the σx has a significant impact on the fault slip initiation stress. Increasing the σx significantly enhances the fault’s load-bearing capacity, requiring greater shear stress to induce slip. The observed increase of σs with σx can be explained by physical mechanisms: an increase in σx raises the normal stress component σn on the fault plane, while maintaining constant σy, resulting in a relative decrease in shear stress τ (see Equations (2) and (3)). Consequently, a higher σz is needed to generate sufficient τ to overcome frictional strength, causing σs to increase with σx. This can also be interpreted as the effect of applying greater stress in the vertical direction of fault plane, which enhances frictional resistance on the fault plane and raises the σs.
In practical engineering contexts, this implies that elevated σx can enhance fault stability. Combined with the analysis of Figure 3, it is evident that σx and σy are the critical factors of fault’s stable state: increasing either σx or σy requires a higher σz to trigger slip. Therefore, in fluid injection and drilling operations, the three-dimensional stress state must be comprehensively considered, particularly since elevated σx or σy can significantly raise the slip initiation threshold. This finding provides a theoretical basis for assessing the slip risk of deep faults under varying principal stress conditions.
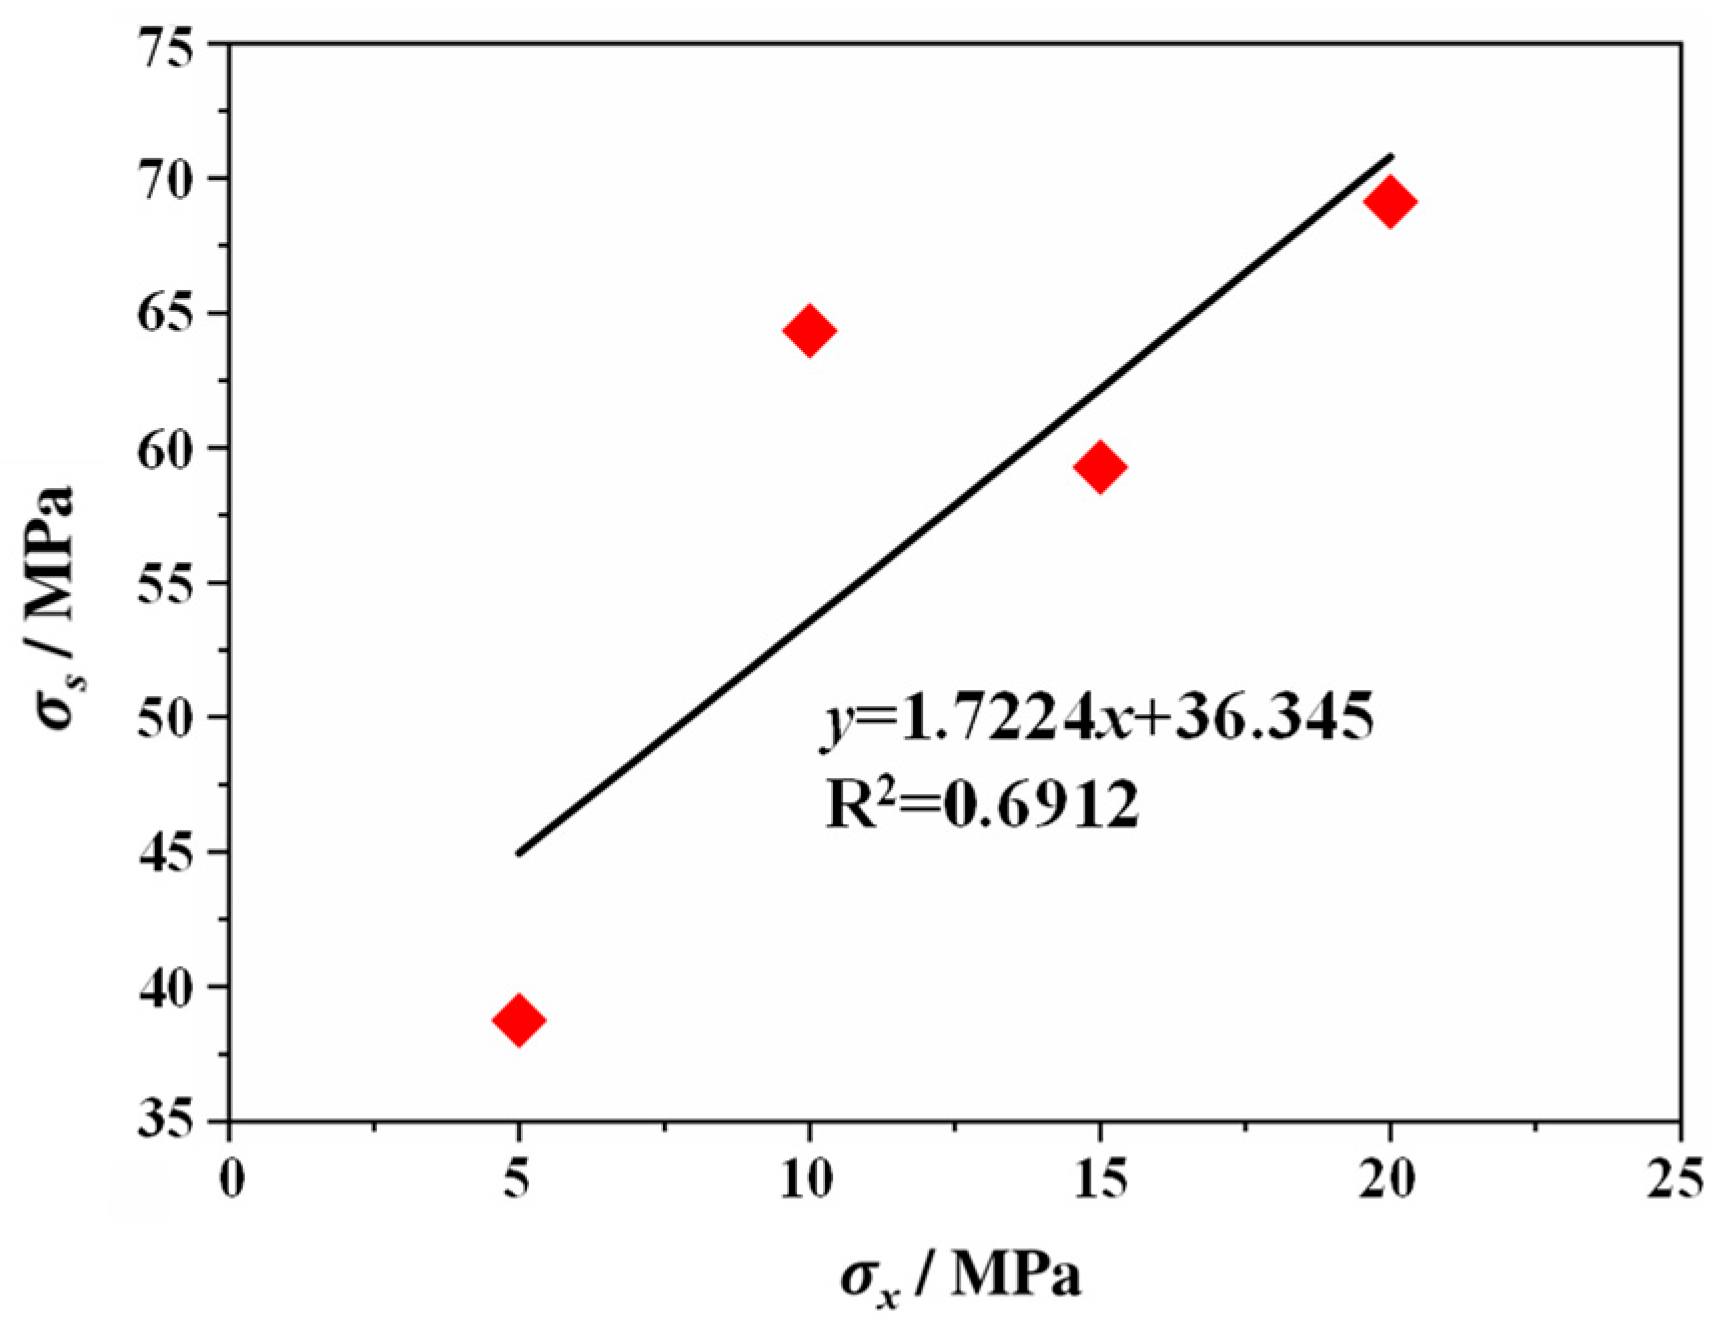
Figure 7 quantitatively illustrates the relationship between the fault slip initiation stress σs and the minimum principal stress σx. The figure shows that σs increases approximately linearly with σx, indicating that, under the present experimental conditions, an increase in σx corresponds to a proportional rise in σs. This linear relationship further validates the applicability of the Mohr-Coulomb failure criterion: assuming a constant friction coefficient, the linear response of σs to σx corresponds to a constant friction angle. In other words, as σx increases, a higher σz is required to generate sufficient shear stress to overcome frictional resistance, resulting in a corresponding increase in σs.
Specifically, as σx increases from 5 MPa to 20 MPa, σs rises from approximately 38.7 MPa to 69.1 MPa, showing a substantial increase. This indicates that the minimum principal stress is one of the important control parameters for the slip threshold. The derivation of Equations (2) and (3) further supports this result: with increasing σx, the normal stress σn on the fault plane increases, and only a higher σz can restore the balance between shear stress and friction, thereby causing the slip threshold to increase linearly. Minor deviations observed in some experimental points (e.g., σx = 15 MPa) may be attributed to heterogeneities in sample deformation or experimental uncertainties, but the overall trend is clear. In summary, Figure 7 highlights the quantitative influence of σx on σs. Based on the experimental data and analysis from Figure 4 and Figure 7, σx and σy can provide useful reference indicators for roughly estimating the slip initiation stress σs in practical engineering applications.

3.2.2. Fault Slip Velocity Under Different Minimum Principal Stresses

Figure 8 presents the evolution of fault slip velocity (v-σz curve) during the loading process under different σx. Under all test conditions, the velocity curves exhibit a similar pattern: in the early stage of σz loading, the fault remains locked, and v-curve fluctuates only at very low levels; as the loading approaches the slip initiation stress σs, v-curve begins to increase rapidly; and during the slip stage, it reaches a higher level and eventually stabilizes. It can be observed that increasing σx prolongs the locked stage, meaning that, for the same increment in σz, slip requires a longer loading duration. This can be interpreted as higher σx effectively imposing greater confining pressure on the fault, requiring the accumulation of higher stress to trigger slip.
However, higher σx affects the peak slip velocity: as σx increases, the magnitude of the velocity surge during slip also increases. For example, under σx = 20 MPa condition, when σz reaches the slip threshold (σs = 69.13 MPa), v exhibits the largest jump. This indicates that higher σx allows the fault to accumulate more elastic energy prior to slip, which is then released through a more pronounced velocity change once slip is initiated. Therefore, although σx has limited influence on the slip rate during the triggering process, it plays a critical role in the peak dynamics of slip: faults under higher σx exhibit faster instantaneous velocities and correspondingly stronger energy release during sudden slip events.
Overall, the results in Figure 8 indicate a dual role of σx on slip mechanics: on one hand, increasing σx raises the slip threshold, rendering the fault more stable during the loading stage; on the other hand, higher σx leads to greater instantaneous slip velocity once slip is triggered. In practical engineering terms, this implies that elevated σx may delay the onset of slip. However, once slip occurs, its impulsive characteristics (velocity and acceleration) are amplified. This behavior aligns with the understanding of injection-induced seismicity: faults under higher σx are less prone to slip, but when slip does occur, it can produce higher slip velocities, potentially resulting in larger seismic magnitudes.

3.3. Influence of Injection Pressure on Fault Slip Behavior

3.3.1. Fault Slip Initiation Stress Under Different Injection Pressures

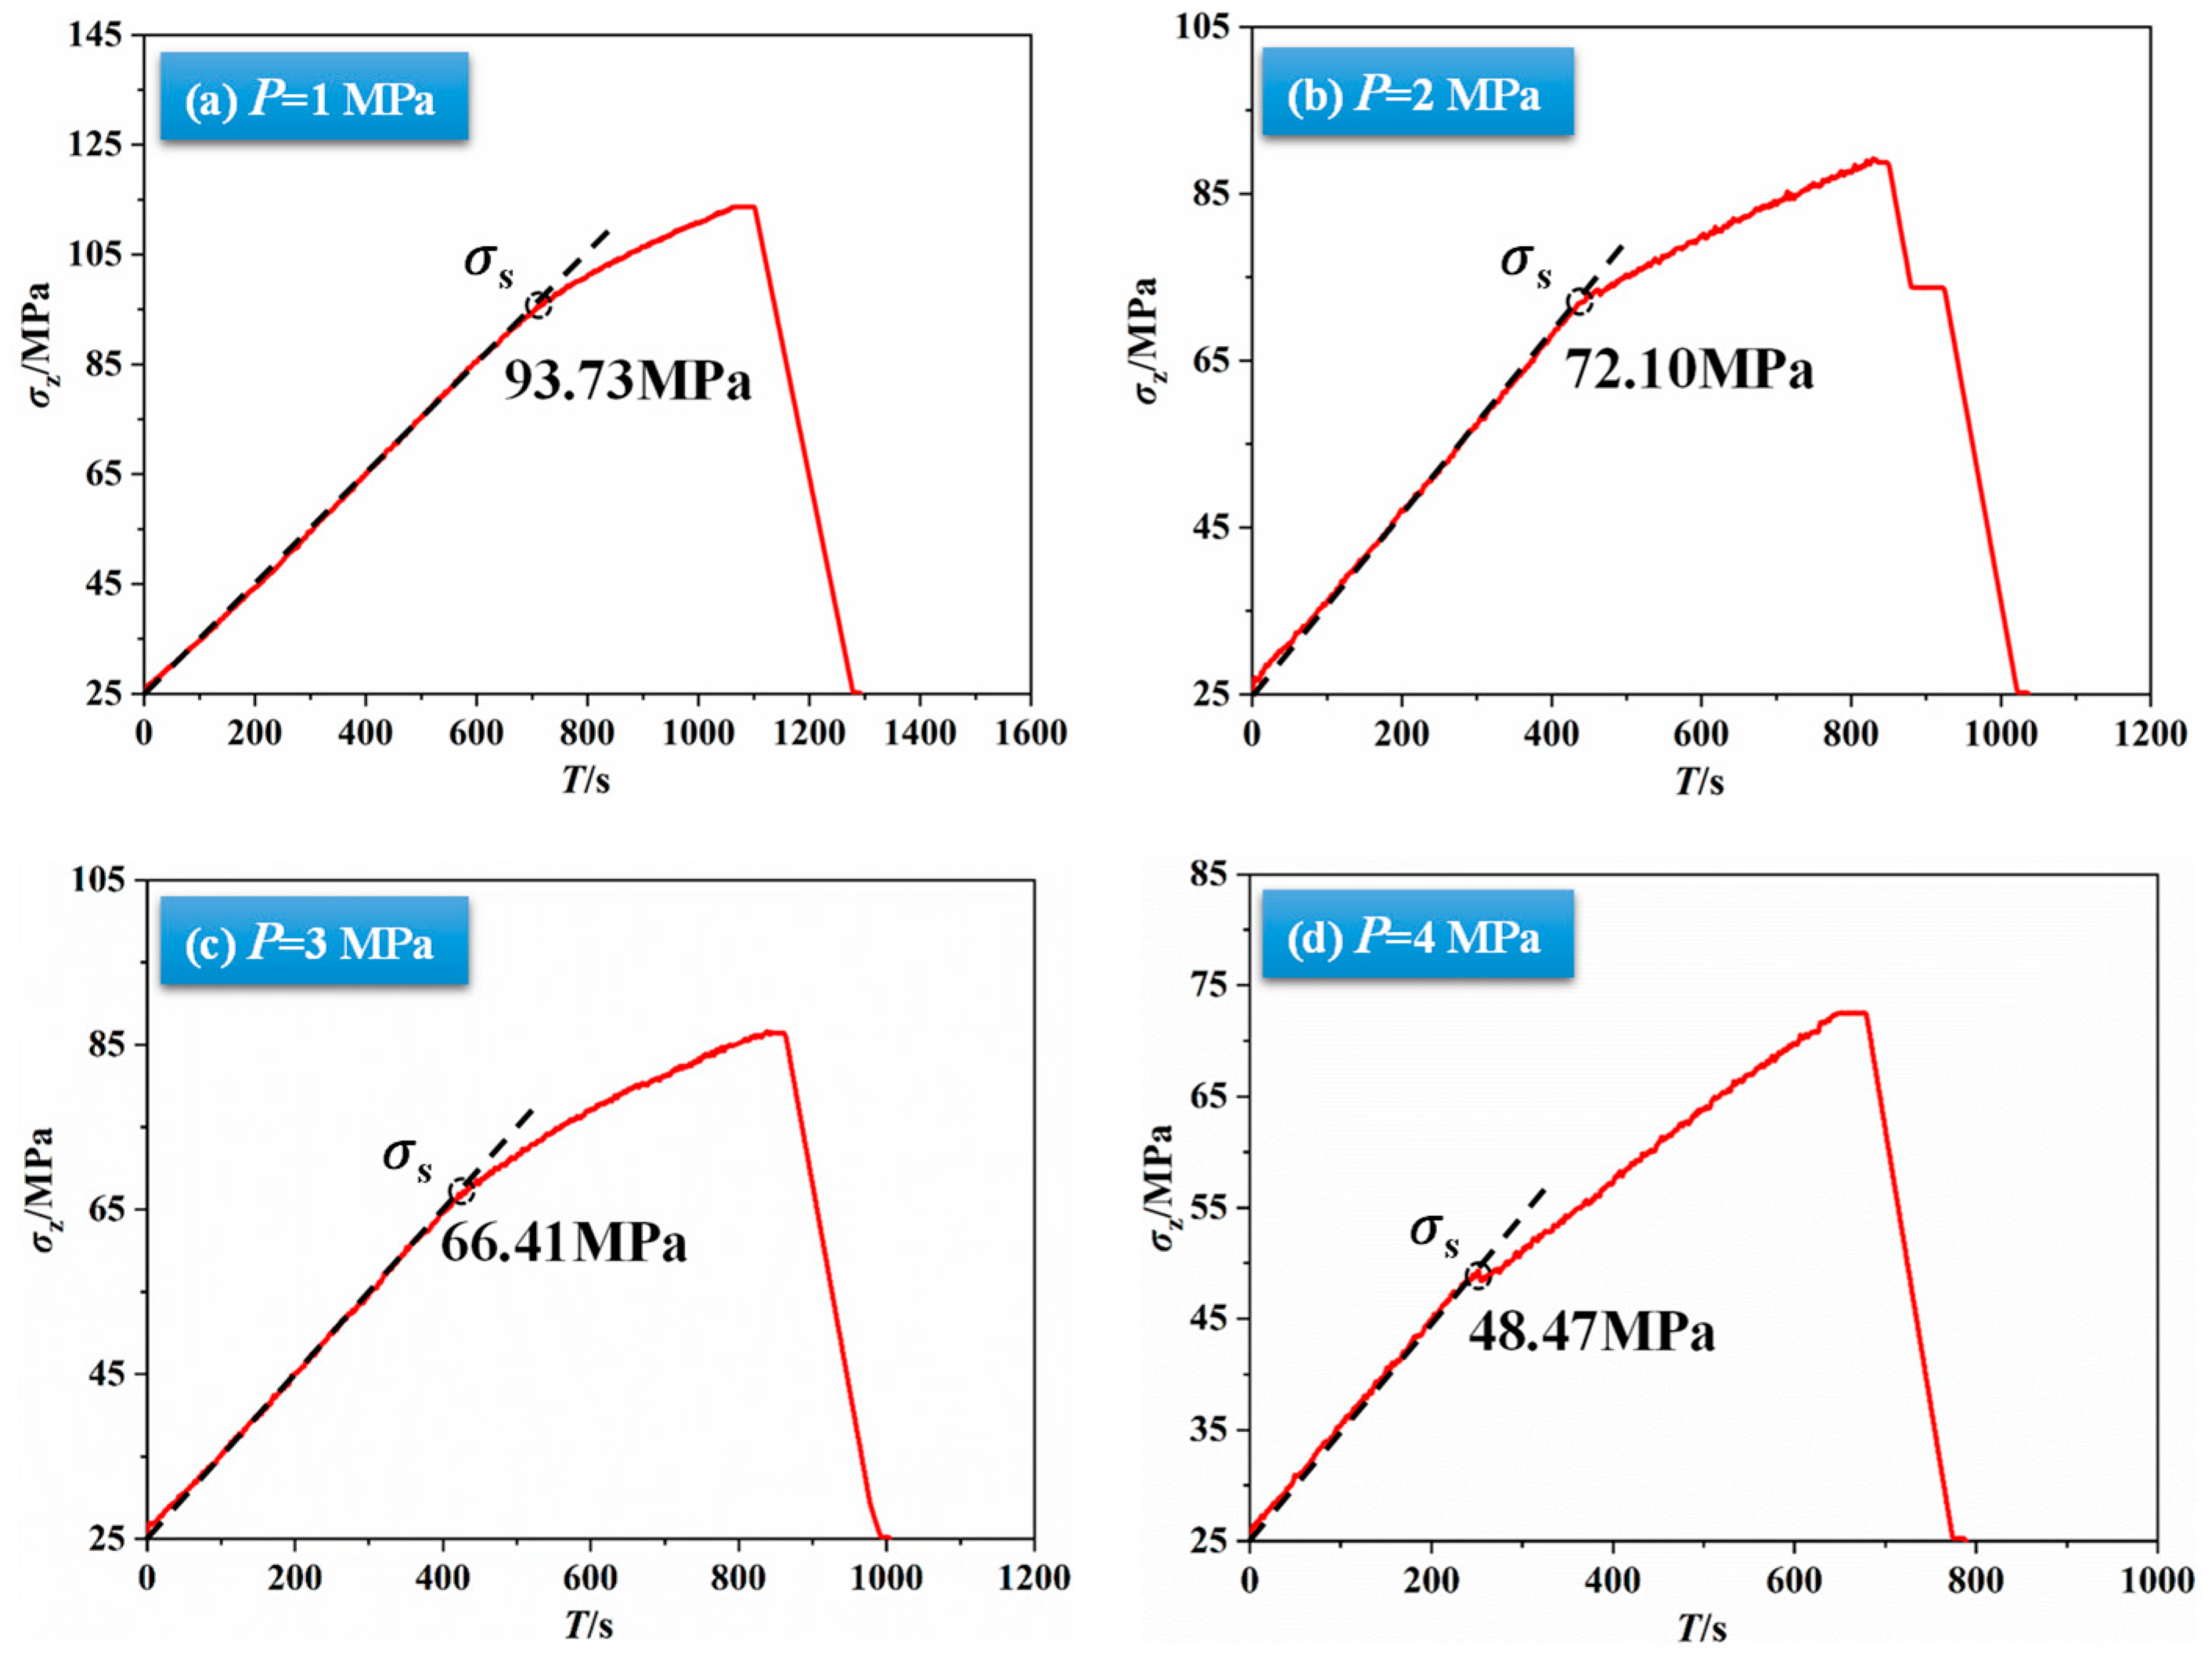
Figure 9 illustrates the evolution of the maximum principal stress σz and loading time under constant σy = 30 MPa, σy = 25 MPa, and σz_r = 0.001 mm/s (displacement-controlled loading rate in the σz-direction). Different subplots correspond to varying P, as listed in Table 1 (Groups III-1 to III-4). Like the data curve trends observed under varying principal stresses, the σz evolution curves under different P conditions also exhibit pronounced inflection points, indicating distinct fault-stable and fault-slip stages. More importantly, the slip initiation stress σs decreases markedly with increasing injection pressure: as P rises from 1 MPa to 4 MPa, σs drops from 93.73 MPa to 48.47 MPa, a reduction of 48.29%. This demonstrates that elevated injection pressures significantly destabilize fault planes, increasing slip susceptibility. The underlying physical mechanism involves the reduction in the effective normal stress acting on the fault plane due to high-pressure fluid injection, which in turn decreases the shear stress required for slip initiation. From an engineering standpoint, this implies that for a given in situ stress state, faults encountering elevated fluid pressures exhibit a significantly higher propensity to slip, thereby elevating the risk of inducing seismicity. In geothermal operations, high injection pressure is widely recognized as a primary trigger for fault activation. Our experimental results provide quantitative validation for this long-held hypothesis.
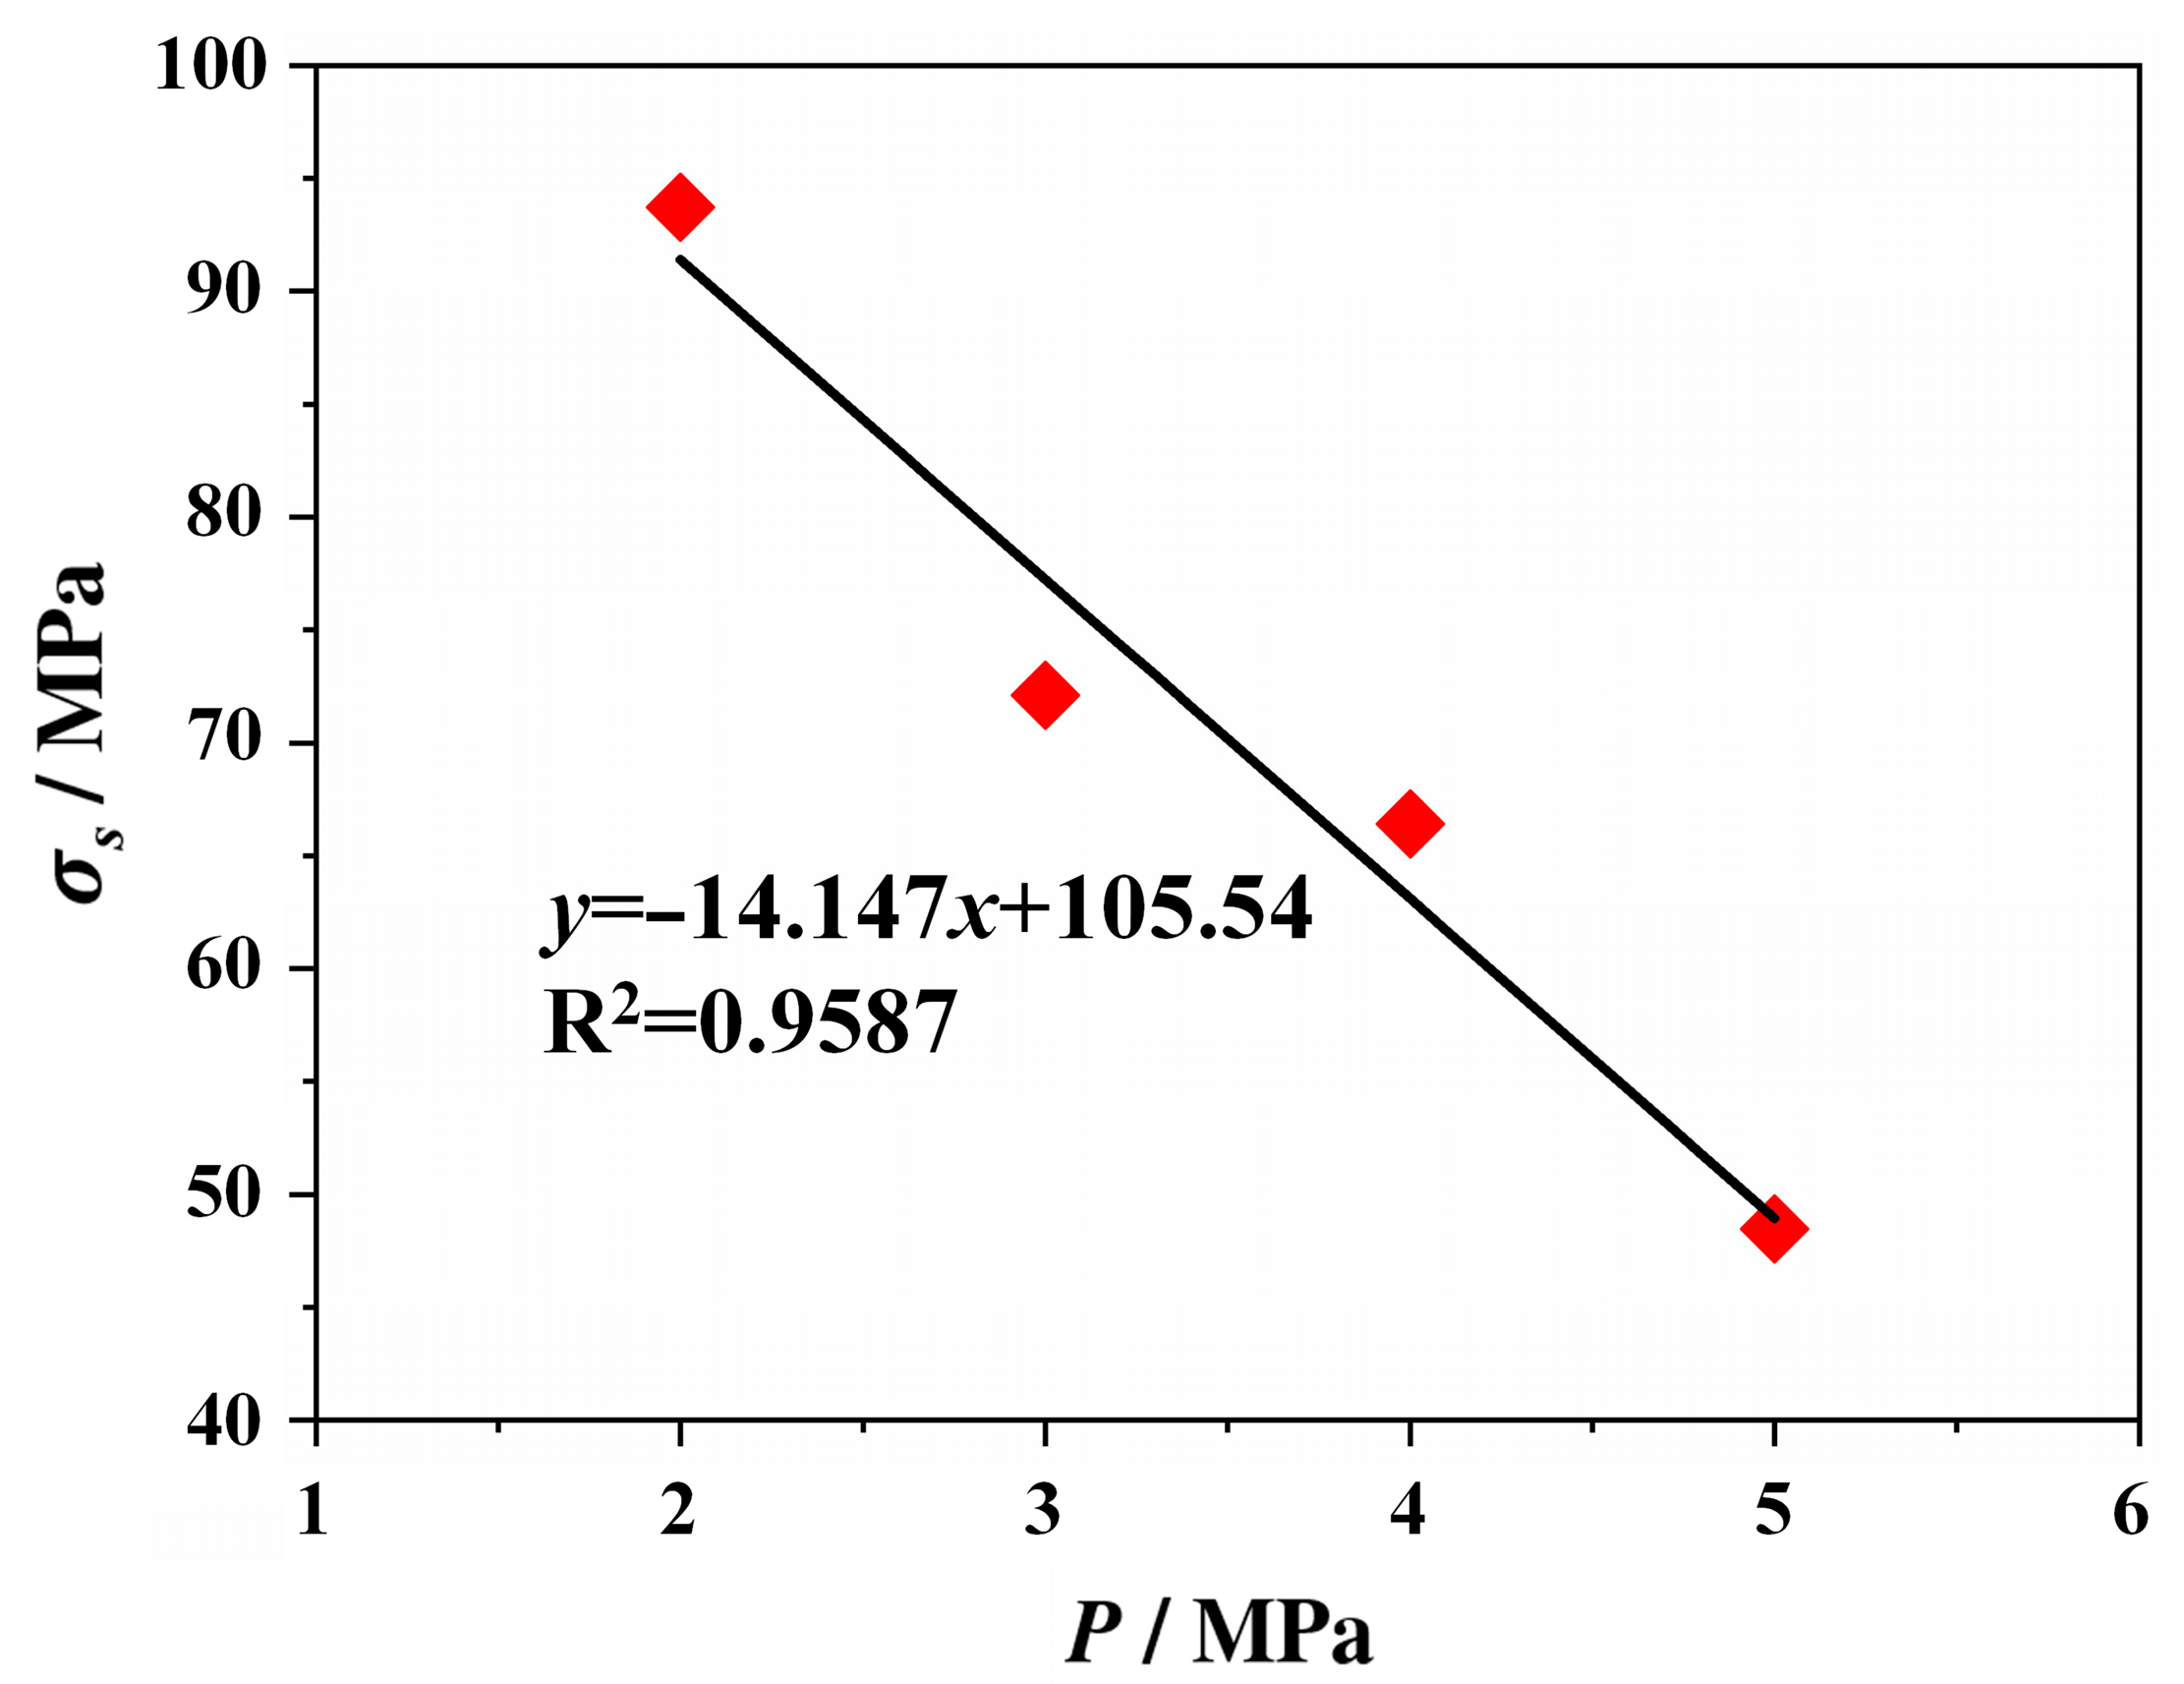
Figure 10 presents a clearer quantitative relationship between the slip initiation stress and fault water pressure. As shown, σs decreases almost linearly with increasing P, indicating a pronounced regulating effect of injection pressure on the slip initiation stress. The linear reduction of σs with increasing P unequivocally demonstrates the effectiveness of injection-induced pore pressure in reducing the effective normal stress, which weakens the fault according to the principle of effective stress. This is the primary mechanism for fluid-induced fault activation in geothermal systems.
As shown in Figure 11, increasing the P leads to a substantial reduction in the effective σne on the fault plane. A decrease in σne implies a corresponding reduction in frictional resistance. Consequently, a high-pressure injection lowers the effective frictional strength of the fault, allowing slip to occur under a lower τe. Moreover, in practical engineering conditions, high-pressure water penetrating into a fault can dissolve soluble minerals within the fault zone, thereby reducing the surface roughness of the fault plane and further decreasing its frictional strength. These combined effects account for the linear decrease of σs with increasing P observed in Figure 10: elevated injection pressure directly weakens the fault’s ability to sustain shear forces, making slip more likely to occur.
In summary, the experimental results demonstrate that the injection pressure is a predominant factor governing the magnitude of the fault slip initiation stress. An increase in injection pressure not only lowers the critical stress required for slip but also promotes an earlier, and potentially more energetic, slip nucleation. These findings underscore the critical importance of stringent injection pressure management in geothermal development to mitigate the risks of premature fault activation and induced seismicity.

3.3.2. Fault Slip Velocity Under Different Injection Pressures

Figure 12 shows the evolution of fault slip velocity (v-σz curve) under different injection pressure P. It can be observed that, under the same σx and σy, an increase in P gradually reduces the σz required to initiate slip and markedly shortens the duration of the low-velocity slip stage. Once σz reaches σs, all curves exhibit a rapid surge in slip velocity v. This indicates that high-pressure injections not only lower the slip threshold but also accelerate the progression of fault slip. More specifically, higher P results in an earlier onset of the velocity surge and a greater magnitude of the increase. This is because higher injection pressure further reduces the effective normal stress on the fault plane, allowing more instantaneous energy release during slip, which produces a higher peak slip velocity. Experimental results demonstrate that when σz reaches σs, v exhibits a stronger pulse response under higher P conditions, consistent with the mechanism of injection pressure reducing frictional strength. Therefore, an increase in injection pressure shortens the time from slip initiation to complete slip, and induces a more rapid acceleration at the onset of slip.
The slop of the velocity rise trend line is a proxy for the slip acceleration. Figure 12 shows that the slop of velocity rise trend line becomes bigger as P increases. This indicates more impulsive (faster accelerating) slip events under higher injection pressures. In seismology, higher acceleration at the source is a key generator of high-frequency seismic waves. Therefore, our results suggest that faults activated under high injection pressure are likely to produce seismic signals richer in high-frequency content, which is a critical parameter for seismic hazard assessment as high-frequency waves can cause more significant shaking to engineered structures.
The results confirm that injection pressure exerts two contrasting effects on fault dynamics: it significantly reduces the slip threshold, promoting premature slip, yet it also facilitates higher instantaneous slip velocities upon rupture. From the perspective of induced seismicity, high-pressure injection not only advances the onset of slip but may also generate a stronger dynamic response (i.e., higher slip velocities). Therefore, to reduce the risk of violent fault slip induced by geothermal injection or other engineering activities, it is essential to strictly control the injection pressure during operations, thereby preventing excessive fault activation and strong seismic events.

4. Discussion

4.1. Engineering Implications for Geothermal Energy Development

For easier comparison, the relationship between geo-stress parameters and slip initiation stress is statistically analyzed in Table 2. The quantitative relationships established in this study provide an ideal benchmark for validating numerical models. Future work should employ Finite Element (FEM) or Discrete Element Method (DEM) simulations, specifically calibrated with the rate-and-state friction parameters derived from experiments like those presented here, to extrapolate these findings to larger spatial and temporal scales and more complex fault geometries.
The slip initiation stresses (σs) measured in our experiments (ranging from ~18 MPa to ~93 MPa) can be directly correlated with in situ stress conditions in deep geo-energy reservoirs. For a typical crustal stress gradient, a laboratory σs of 18 MPa and 93 MPa would correspond to conditions at approximately 0.5 km and 4 km depth [44], respectively. This scaling implies that our results are directly relevant to geo-energy projects operating at depths ranging from shallow hydrothermal systems to deep enhanced geothermal reservoirs (typically 3–5 km). The linear relationships we established between the slip initiation stress (σs) and the governing parameters (σx, σy, P) are particularly valuable for field application. For instance, the derived sensitivity of σs to injection pressure (ΔσsP ≈ −14 from Figure 10) provides a quantitative guideline for managing injection operations. This underscores the necessity of implementing real-time, adaptive injection pressure management strategies to operate within a safe window, thereby mitigating the risk of inducing significant seismic events.
The quantitative relationships established in this study provide critical insights for predicting and managing injection-induced seismicity in EGS. The linear reduction in slip initiation stress with increasing injection pressure underscores the necessity of implementing real-time, adaptive injection pressure management strategies, where operating within a site-specific pressure window can significantly delay or prevent fault reactivation. Furthermore, the positive linear correlation between slip initiation stress and both intermediate and minimum principal stresses indicates that EGS development should prioritize target zones characterized by higher tectonic confinement, highlighting the importance of comprehensive pre-drilling stress measurement and fault mapping. By raising the slip threshold yet amplifying energy release and that high confining pressures may accumulate greater elastic energy.
This can ultimately lead to larger-magnitude seismic events. These findings collectively offer a practical framework for designing safer injection operations by optimizing stimulation parameters and leveraging in situ stress conditions to minimize both the likelihood and potential magnitude of induced seismic events.

4.2. Influence of 3-D Stress and Injection Pressure on Fault Slip Behavior

The experimental data in this study generally exhibit two stages of fault slip, showing a “locking-slipping” process. In the first stage, elastic energy accumulates to overcome static friction, while the second stage is characterized by rapid energy release and pulsating slip. This behavior is consistent with the nucleation and source dynamics described by the rate-and-state friction (RSF) theory [45,46]. The rate-and-state framework explains how variations in injection rate or pressure govern the timing of slip initiation and the resultant peak slip velocity. Furthermore, it accounts for the variability in slip dynamics under a given shear stress by incorporating the influences of frictional parameters, slip-weakening mechanisms, and the spatiotemporal distribution of pore pressure. Mechanistic studies and numerical implementations based on the rate-and-state framework have been widely used to simulate the time sensitivity and sequential evolution of injection-induced earthquakes, demonstrating the link between experimental observations and theoretical predictions.
Further analysis of the quantitative experimental results allows several mechanistic insights and engineering implications to be drawn. (1) Dual effect of the intermediate principal stress. The experiments indicate that increasing σy raises the slip initiation stress σs, thereby reducing the likelihood of slip. However, once slip is triggered, both the stress drop in the second stage and the amplitude of σz increase, implying that under high lateral confinement, the fault can accumulate more elastic energy. This leads to more concentrated energy release and higher peak instantaneous slip velocities, which may correspond to larger magnitudes or stronger dynamic responses; (2) Role of the minimum principal stress as a local locking control. Increasing minimum principal stress also elevates fault slip initiation stress, but it has little effect on post-slip steady-state velocity, indicating that minimum principal stress primarily controls the triggering threshold rather than the frictional dissipation mechanism during slip. From an engineering perspective, this suggests that increasing local confinement (e.g., selecting injection well sites in regions with higher minimum principal stress) can reduce the probability of slip occurrence, but cannot alone ensure control over the post-slip magnitude; (3) Strong weakening effect of injection pressure on fault friction. The experimental results show that injection pressure has a substantial impact on fault slip initiation stress, and higher injection pressure also triggers earlier slip onset and steeper velocity surges. Physically, this directly reflects the reduction in effective normal stress [47]. Moreover, literature suggests that fluid can also alter fault interface conditions (e.g., flushing, dissolution, or lubrication), potentially producing long-term or semi-permanent changes in the friction coefficient [48]. Therefore, controlling injection pressure remains the primary engineering measure for disaster prevention and mitigation.

4.3. Pore Pressure Diffusion and Delayed Triggering Mechanisms Under Scale Effects

Although the physical processes observed in these laboratory experiments are similar to those occurring in engineering settings, significant scale effects exist. This implies that while extrapolating experimental results to field applications is feasible, it also has inherent limitations. Although academic community has emphasized the significant implications of scale differences for research and discussion outcomes [49,50,51], we consider that the following two aspects still require careful attention.
Far-field diffusion mechanism of pore pressure. In laboratory experiments, fluid is directly injected into the specimen and rapidly affects the fault plane, resulting in an almost instantaneous reduction in effective stress. In contrast, in the field, pore pressure propagates through the formation via flow diffusion, with the diffusion rate controlled by the permeability of the formation/fault and the reservoir volume. Keranen et al. (2014) demonstrated that large-volume wastewater injection can induce pore pressure perturbations that migrate tens of kilometers and trigger widespread earthquake sequences (e.g., the Oklahoma case) [49]. It indicates that, in highly permeable pathways or connected fault systems, the triggering volume extends far beyond the near-field region surrounding the injection well. The spatiotemporal characteristics of pore pressure diffusion (such as the diffusion front, gradient, and duration) can significantly determine the time delay and spatial distribution of induced seismicity. Injection not only reduces effective stress directly via pore pressure, but also redistributes the far-field stress through poroelastic effects, potentially triggering faults even without direct hydraulic connection to the well. Certain models suggest that thermally induced expansion/contraction or long-term elastic deformation triggered by injection can continue to drive slip or induce cascading responses even after injection has ceased [52,53]. Such mechanisms provide a plausible explanation for why some large earthquakes occur after a considerable delay following the termination of fluid injection.
The role of poroelastic effects in triggering distant faults. Beyond the direct diffusion of pore pressure, the poroelastic effect represents a critical and distinct mechanism for altering stresses at a distance. Injection-induced volume expansion of the rock matrix (or contraction during extraction) generates stress perturbations that propagate rapidly (at the speed of seismic waves) through the surrounding elastic medium. This poroelastic stress transfer can change the Coulomb failure stress on faults without requiring a direct hydraulic connection or fluid pressure change within the fault zone itself [20,52]. A fault located kilometers away from the injection well can be brought closer to failure due to this stress redistribution, even if the pore pressure front has not yet reached it. This mechanism is particularly effective in extensive, continuous formations and can explain seismic events that occur laterally or vertically away from the injection point, forming a halo of seismicity that extends beyond the pressure plume.
Slow slip and stress transfer pathways. Rate-and-state friction theory and recent multi-mechanism reviews indicate that fluid injection can initially induce slow slip or aseismic creep, which, through static stress transfer, can trigger microseismicity or larger events on nearby brittle faults. The propagation velocity of the slow-slip front often differs from the pore pressure diffusion rate, implying that the microseismic front is not a simple proxy for pressure diffusion. The case of Pohang 2017 case, in which a delayed Mw 5.5 earthquake occurred several weeks after the termination of injection/stimulation [54]. This event reflects the complex consequences of multi-mechanism coupling, including fluid pressure, poroelastic stress changes, mechanical triggering, and fault network interactions, highlighting that large triggered events cannot be fully predicted solely based on injection parameters and initial geological conditions. Therefore, numerical simulations incorporating the rate-and-state friction framework and slow-slip modeling are recommended to reproduce the temporal evolution of microseismic sequences and the potential for delayed large events. The rate-and-state model can capture both injection-rate sensitivity and delayed triggering phenomena, providing a mechanistic basis for understanding such field observations.
This study provides valuable insights into the mechanics of injection-induced seismicity from laboratory experiments. Importantly, field-scale factors like far-field diffusion, poroelastic coupling, chemical effects, and fault complexity can significantly modulate the seismic outcome. Consequently, a multidisciplinary approach combining laboratory data, field-scale pressure monitoring, and seismological inversion is paramount for effective seismic hazard assessment in engineering applications.

5. Conclusions

This study employed true triaxial hydro-mechanical experiments to quantitatively investigate the control of stress parameters and fluid injection on fault slip behavior. The main scientific contributions and implications are summarized as follows:
(1) This research provides the first experimental evidence elucidating the dual role of the intermediate principal stress σy under true triaxial conditions. While elevated σy significantly increases the fault slip initiation stress by enhancing normal stress on the fault plane, it subsequently promotes larger stress drops and higher peak slip velocities upon failure. This finding implies that zones of higher confinement stress may exhibit greater stability against initial slip but possess the potential for more energetic seismic events upon reactivation.
(2) The definitive quantitative relationships between governing parameters and slip behavior have been represented. The slip initiation stress increases linearly with both σx and σy, while decreasing linearly with injection pressure. These relationships provide crucial calibration data for numerical frameworks, enabling more accurate prediction of fault reactivation thresholds in field-scale simulations.
(3) The strong linear reduction in slip initiation stress with injection pressure underscores the necessity of implementing real-time adaptive pressure management strategies. The stabilizing effect of σx and σy supports their use as key criteria for site selection. This underscores the importance of not only site selection based on in situ stress conditions but also the implementation of real-time adaptive injection protocols that operate within a calculated safe pressure window to avoid breaching this heightened instability threshold.

Author Contributions

Conceptualization, Z.S. and J.H.; methodology, J.H. and Z.S.; software, Z.S.; validation, J.H. and H.Z.; investigation, J.H., Q.L. and H.Z.; resources, Z.S. and C.H.; data curation, J.H.; writing—original draft preparation, J.H.; writing—review and editing, Z.S. and C.H.; visualization, Z.S., Q.L. and J.H.; supervision, Z.S. and J.H.; project administration, Z.S. and J.H.; funding acquisition, Z.S. and J.H. All authors have read and agreed to the published version of the manuscript.

Funding

This research was funded by the National Natural Science Foundation of China (U21A2030, 52104075), the Brain-Gain Plan of New Chongqing—Young Elite Program (Grant No. CSTB2024YCJH-KYXM0046), the Postdoctoral Fellowship Program of CPSF (Grant No. GZC20242132), 75th China Postdoctoral Science Foundation Funded Project (Grant No. 2024MD754008), the Open Funding of State Key Laboratory of Coal Mine Disaster Prevention and Control (Grant No. 2024SKLKF08) and the Key Project for Technological Innovation and Application Development in Chongqing (CSTB2025TIAD-KPX0029).

Institutional Review Board Statement

Not applicable.

Informed Consent Statement

Not applicable.

Data Availability Statement

The data and material to support the findings of this study are available from the corresponding author upon reasonable request.

Conflicts of Interest

The authors declare no conflicts of interest.

References

  1. Shi, H.L.; Wang, G.L.; Lu, C.; Wang, W.L.; Liu, L.; Wei, Y.J. Enhancing geothermal energy recovery in Yangbajing: The role of natural and artificial fracture connectivity in EGS performance. Geothermics 2025, 132, 103438. [Google Scholar] [CrossRef]
  2. Wu, Z.Q.; Zhang, D.M.; Liang, Y.J.; He, S.F.; Xie, H.P.; Li, M.H. Mechanical and microstructural properties of Gonghe granite for enhanced geothermal systems: Thermal effects and energy evolution. J. Rock Mech. Geotech. Eng. 2025. [Google Scholar] [CrossRef]
  3. Zheng, J.X.; Sun, L.C.; Xu, X.; Long, X.T.; Gao, T.Y.; Xia, E.T.; Li, B.; Li, S.H.; Wang, J.; Mao, Z.Y.; et al. Feasibility of shallow geothermal energy for industrial heating using high-temperature heat pumps in Sichuan Province, China. Energy Sustain. Dev. 2025, 88, 101785. [Google Scholar] [CrossRef]
  4. Kalsariya, M.; Shah, A.; Patel, S.; Mandlik, S.; Raulji, R.; Shah, D.; Prajapati, M.; Shah, M. A Systematic Study on geothermal energy integrated water desalination: Challenges and opportunities. Unconv. Resour. 2025, 8, 100226. [Google Scholar] [CrossRef]
  5. Memon, A.R.; Makauskas, P.; Kaminskaitė-Baranauskienė, I.; Pal, M. Repurposing depleted hydrocarbon reservoirs for geothermal energy: A case study of the Vilkyčiai Cambrian sandstone in Lithuania. Energy Rep. 2025, 14, 243–253. [Google Scholar] [CrossRef]
  6. Slimene, M.B.; Khlifi, M.A.; Soliman, N.F.; Osman, H.; Amari, A.; Sabirov, S.; Mavlonov, A.; Safarova, L. Transient modeling and data-driven optimization of a hybrid geothermal–solar energy system for eco-friendly multigeneration: A case study approach to sustainable urban development. Process Saf. Environ. Prot. 2025, 202, 107717. [Google Scholar] [CrossRef]
  7. Feng, K.H.; Zhang, S.M. Integration of Electrolyser with Hybrid Renewable Energy System (Hydropower, Geothermal and Biomass) for Green Hydrogen in China. Energy 2025, 8, 137881. [Google Scholar] [CrossRef]
  8. Azzola, J.; Bremer, J. Applied geophysics in schools to raise knowledge and awareness about geothermal energy and seismology. Soc. Impacts 2025, 5, 100116. [Google Scholar] [CrossRef]
  9. Hu, Z.W.; Wang, H.Y. Feasibility study of geothermal assisted energy storage using hydraulic fracturing. Geoenergy Sci. Eng. 2024, 242, 213220. [Google Scholar] [CrossRef]
  10. Akdas, S.B.; Onur, M. Analytical solutions for predicting and optimizing geothermal energy extraction from an enhanced geothermal system with a multiple hydraulically fractured horizontal-well doublet. Renew. Energy 2022, 181, 567–580. [Google Scholar] [CrossRef]
  11. Aydın, H.; Camcı, U.; Akın, S. An experimental investigation of hydraulic fracturing mechanisms in menderes metamorphic rocks: Prospects for enhanced geothermal systems. Geothermics 2025, 130, 103328. [Google Scholar] [CrossRef]
  12. Li, M.Y.; Li, M.L.; Zhang, F.S.; Wu, Z.J.; Zhou, Y.; Zhang, X.F. Assessing the contribution of mineral composition to meso-macro progressive failure in granite under thermo-hydro-mechanical (THM) conditions: Inspiration for hydraulic fracturing in Enhanced Geothermal Systems (EGS). Int. J. Rock Mech. Min. Sci. 2025, 194, 106238. [Google Scholar] [CrossRef]
  13. Dai, H.; Yin, T.B.; Wu, Y.; Ma, J.X.; Guo, W.X.; Li, X.B. Characterization of fracture extension and damage evolution in hot dry rock by cycle hydraulic fracturing (CHF): Application of CHF in enhanced geothermal systems. Energy 2025, 330, 137007. [Google Scholar] [CrossRef]
  14. Zhang, Y.Y.; Li, Y.Y.; Zheng, H.; Fan, B.H. A novel fully coupled thermo-hydro-mechanical-damage model for hydraulic fracture propagation in fractured geothermal reservoirs. Comput. Geotech. 2025, 185, 107364. [Google Scholar] [CrossRef]
  15. An, M.K.; Huang, R.; Elsworth, D.; Zhang, F.S.; Dontsov, E. Thermoporoelastic stress perturbations from hydraulic fracturing and thermal depletion in enhanced geothermal systems (EGS) and implications for fault reactivation and seismicity. J. Rock Mech. Geotech. Eng. 2025, 17, 2893–2903. [Google Scholar] [CrossRef]
  16. Cao, W.Z.; Durucan, S.; Shi, J.Q.; Korre, A.; Ratouis, T.; Hjörleifsdóttir, V. Geothermal fluid extraction and injection-related fracture slip susceptibility and seismicity in naturally fractured rocks. Int. J. Rock Mech. Min. Sci. 2024, 183, 105939. [Google Scholar] [CrossRef]
  17. Park, S.; Kim, K.; Yoo, H.; Yim, J.H.; Min, K.B. Comprehensive in-situ stress estimation in a fractured geothermal reservoir in Pohang, South Korea using drilling data, hydraulic stimulations, and induced seismicity. Int. J. Rock Mech. Min. Sci. 2025, 186, 105978. [Google Scholar] [CrossRef]
  18. Xu, C.; Li, J.; Yang, R.Z.; Chen, J.R.; Tan, H. An Improved Fracture Seismic Method for identifying the drilling targets of medium-deep geothermal resources: A case study on heishan geothermal area. Geothermics 2024, 120, 103019. [Google Scholar] [CrossRef]
  19. Cao, R.; Cai, Y.Q.; Dor, J.; Liu, Q.J.; Poliakova, M.; Chen, D.; Wan, S.S.; Yan, Y.Y. Distribution and genesis of geothermal waters in the Xianshuihe fault zone, Western Sichuan plateau, China: Constraints on fracture system and regional seismic activities. Geothermics 2025, 125, 103150. [Google Scholar] [CrossRef]
  20. Kivi, I.R.; Vilarrasa, V.; Kim, K.; Yoo, H.J.; Min, K.B. On the role of poroelastic stressing and pore pressure diffusion in discrete fracture and fault system in triggering post-injection seismicity in enhanced geothermal systems. Int. J. Rock Mech. Min. Sci. 2024, 175, 105673. [Google Scholar] [CrossRef]
  21. Zhou, W.; Lanza, F.; Grigoratos, I.; Schultz, R.; Cousse, J.; Trutnevyte, E.; Muntendam-Bos, A.; Wiemer, S. Managing Induced Seismicity Risks From Enhanced Geothermal Systems: A Good Practice Guideline. Rev. Geophys. 2024, 62, e2024RG000849. [Google Scholar] [CrossRef]
  22. Lee, K.K.; Ellsworth, W.L.; Giardini, D.; Townend, J.; Ge, S.; Shimamoto, T.; Yeo, I.W.; Kang, T.S.; Rhie, J.; Sheen, D.H.; et al. Managing injection-induced seismic risks. Science 2019, 364, 730–732. [Google Scholar] [CrossRef]
  23. Ryu, H.S.; Kim, H.; Lee, J.Y.; Kaown, D.; Lee, K.K. Abnormal groundwater levels and microbial communities in the Pohang Enhanced Geothermal System site wells pre- and post-Mw 5.5 earthquake in Korea. Sci. Total Environ. 2022, 810, 152305. [Google Scholar] [CrossRef]
  24. Hong, T.K.; Lee, J.; Park, S.; Kim, W. Major influencing factors for the nucleation of the 15 November 2017 Mw 5.5 Pohang earthquake. Phys. Earth Planet. Inter. 2022, 323, 106833. [Google Scholar] [CrossRef]
  25. Choi, D.H.; Kwon, T.H.; Ko, K.W. Centrifuge Modeling of Soil Liquefaction Triggering: 2017 Pohang Earthquake. KSCE J. Civ. Eng. 2024, 28, 3176–3191. [Google Scholar] [CrossRef]
  26. Lv, Y.X.; Yuan, C.; Zhu, X.H.; Gan, Q.; Li, H.B. THMD analysis of fluid injection-induced fault reactivation and slip in EGS. Geothermics 2022, 99, 102303. [Google Scholar] [CrossRef]
  27. Yang, J.J.; Wang, J.G.; Li, P.; Leung, C. A study on pore-scale fracture deformation induced by the CO2-H2O-minerals reactions in CO2-based Enhanced Geothermal Systems. Geoenergy Sci. Eng. 2025, 250, 213840. [Google Scholar] [CrossRef]
  28. Ree, J.H.; Kim, K.H.; Lim, H.B.; Seo, W.; Kim, S.S.; An, X.Y.; Kim, Y.H. Fault reactivation and propagation during the 2017 Pohang earthquake sequence. Geothermics 2021, 92, 102048. [Google Scholar] [CrossRef]
  29. Zhou, L.; Ren, X.Y.; Zhou, J.P.; Li, H.L.; Gan, Q. Numerical study on the induced seismicity through hydraulic fracturing in the deep heat mining project in Basel, Switzerland using a pseudo dynamic model and considering fully hydro-mechanical coupling. Geothermics 2022, 105, 102538. [Google Scholar] [CrossRef]
  30. Okoroafor, E.R.; Co, C.; Horne, R.N. Numerical investigation of the impact of fracture aperture anisotropy on EGS thermal performance. Geothermics 2022, 100, 102354. [Google Scholar] [CrossRef]
  31. Liao, J.X.; Hu, K.; Mehmood, F.; Xu, B.; Teng, Y.H.; Wang, H.; Hou, Z.M.; Xie, Y.C. Embedded discrete fracture network method for numerical estimation of long-term performance of CO2-EGS under THM coupled framework. Energy 2024, 285, 128734. [Google Scholar] [CrossRef]
  32. Sabah, M.; Ameri, M.J.; Hofmann, H.; Ebrahimi, M. Numerical modeling of injection-induced earthquakes based on fully coupled thermo-poroelastic boundary element method. Geothermics 2022, 105, 102481. [Google Scholar] [CrossRef]
  33. Yang, Y.; Hu, D.W.; Wang, H.Z.; Wang, Y.T.; Guo, D.B.; Zhou, H. Experimental study on Sc-CO2 fracturing of granite under real-time high temperature and true triaxial stress. Int. J. Rock Mech. Min. Sci. 2024, 183, 105889. [Google Scholar] [CrossRef]
  34. Tan, P.; Pang, H.; Jin, Y.; Zhou, Z. Experiments and analysis of hydraulic fracturing in hot dry rock geothermal reservoirs using an improved large-size high-temperature true triaxial apparatus. Nat. Gas Ind. B 2024, 11, 83–94. [Google Scholar] [CrossRef]
  35. Huang, J.; Qin, C.Z.; Niu, Y.; Li, R.; Song, Z.L.; Wang, X.D. A method for monitoring acoustic emissions in geological media under coupled 3-D stress and fluid flow. J. Pet. Sci. Eng. 2022, 211, 110227. [Google Scholar] [CrossRef]
  36. Li, M.H.; Yin, G.Z.; Xu, J.; Li, W.P.; Song, Z.L.; Jiang, C.B. A Novel True Triaxial Apparatus to Study the Geomechanical and Fluid Flow Aspects of Energy Exploitations in Geological Formations. Rock Mech. Rock Eng. 2016, 49, 4647–4659. [Google Scholar] [CrossRef]
  37. He, Y.T.; Guo, Y.T.; Bi, Z.H.; Guo, W.H.; Chang, X. Study of field-scale carbon dioxide fracturing in hot dry rock reservoir based on a new 3D-THM coupled discrete block model. Geoenergy Sci. Eng. 2025, 247, 213675. [Google Scholar] [CrossRef]
  38. Reutz, E.H.; Galland, O. The effect of weak Mohr-Coulomb layers on the onset of caldera collapse-A limit analysis modelling approach. J. Volcanol. Geotherm. Res. 2023, 433, 107727. [Google Scholar] [CrossRef]
  39. Fagereng, Å.; Remitti, F.; Sibson, R.H. Incrementally developed slickenfibers—Geological record of repeating low stress-drop seismic events? Tectonophysics 2011, 510, 381–386. [Google Scholar] [CrossRef]
  40. Caporali, A.; Bruyninx, C.; Fernandes, R.; Ganas, A.; Kenyeres, A.; Lidberg, M.; Stangl, G.; Steffen, H.; Zurutuza, J. Stress drop at the Kephalonia Transform Zone estimated from the 2014 seismic sequence. Tectonophysics 2016, 666, 164–172. [Google Scholar] [CrossRef]
  41. Song, Z.L.; Yin, G.Z.; Ranjith, P.G.; Li, M.H.; Huang, J.; Liu, C. Influence of the intermediate principal stress on sandstone failure. Rock Mech. Rock Eng. 2019, 52, 3033–3046. [Google Scholar] [CrossRef]
  42. Wu, Z.R.; Zheng, Y.L.; Deng, B.Z.; Deng, S.X. Influence of intermediate principal stress on rock strength: Insights from closed crack evolution under true triaxial compression. Theor. Appl. Fract. Mech. 2025, 136, 104786. [Google Scholar] [CrossRef]
  43. Zhang, J.J.; Guo, L.L.; Li, S.Z.; Tao, W.; Ji, W.T.; Guo, Y.S.; Zhao, S.J.; Zhang, J.X.; Wang, G.Z. Deformation mechanisms of compressional overlapping area in strike-slip fault zone: Insights from experimental simulation. J. Struct. Geol. 2025, 199, 105503. [Google Scholar] [CrossRef]
  44. Zhang, J.C.; Zheng, H.R.; Wang, G.L.; Liu, Z.Q.; Qi, Y.C.; Huang, Z.W.; Fan, X. In-situ stresses, abnormal pore pressures and their impacts on the Triassic Xujiahe reservoirs in tectonically active western Sichuan basin. Mar. Pet. Geol. 2020, 122, 104708. [Google Scholar] [CrossRef]
  45. Rucker, C.; Erickson, B.A. Physics-informed deep learning of rate-and-state fault friction. Comput. Methods Appl. Mech. Eng. 2024, 430, 117211. [Google Scholar] [CrossRef]
  46. An, M.K.; Yin, Z.Y.; Zhang, F.S.; Huang, R.; Elsworth, D. Rate-and-state friction of epidote gouge under hydrothermal conditions and implications for the stability of subducting faults under greenschist metamorphic conditions. Tectonophysics 2024, 890, 230497. [Google Scholar] [CrossRef]
  47. Rutter, E.; Hackston, A. On the effective stress law for rock-on-rock frictional sliding, and fault slip triggered by means of fluid injection. Philos. Trans. R. Soc. A 2017, 375, 20160001. [Google Scholar] [CrossRef]
  48. Rattez, H.; Disidoro, F.; Sulem, J.; Veveakis, M. Influence of dissolution on long-term frictional properties of carbonate fault gouge. Geomech. Energy Environ. 2021, 26, 100234. [Google Scholar] [CrossRef]
  49. Keranen, K.M.; Weingarten, M.; Abers, G.A.; Bekins, A.; Ge, S. Induced earthquakes. Sharp increase in central Oklahoma seismicity since 2008 induced by massive wastewater injection. Science 2014, 345, 448–451. [Google Scholar] [CrossRef]
  50. Weingarten, M.; Ge, S.; Godt, J.W.; Bekins, B.A.; Rubinstein, J.L. High-rate injection is associated with the increase in U.S. mid-continent seismicity. Science 2015, 348, 1336–1340. [Google Scholar] [CrossRef] [PubMed]
  51. Ellsworth, W.L. Injection-Induced Earthquakes. Science 2013, 341, 1225942. [Google Scholar] [CrossRef] [PubMed]
  52. Jiang, G.Y.; Barbour, A.J.; Skoumal, R.J.; Materna, K.; Taron, J.; Crandall-Bear, A. Relatively stable pressure effects and time-increasing thermal contraction control Heber geothermal field deformation. Nat. Commun. 2024, 15, 5159. [Google Scholar] [CrossRef] [PubMed]
  53. Koirala, R.; Kwiatek, G.; Shirzaei, M.; Brodsky, E.; Cladouhos, T.; Swyer, M.; Goebel, T. Induced seismicity and surface deformation associated with long-term and abrupt geothermal operations in Blue Mountain, Nevada. Earth Planet. Sci. Lett. 2024, 643, 118883. [Google Scholar] [CrossRef]
  54. Yeo, I.W.; Brown, M.R.M.; Ge, S.; Lee, K.K. Causal mechanism of injection-induced earthquakes through the Mw 5.5 Pohang earthquake case study. Nat. Commun. 2020, 11, 2614. [Google Scholar] [CrossRef]
Figure 1. The experimental apparatus and specimen. (a) True triaxial hydro-mechanical coupling apparatus; (b) loading chamber; (c) arrangement of loading and fluid injection in the vertical direction; (d) loading platen; (e) granite specimen and pre-set fault plane; (f) SEM image of the granite.
Applsci 15 10545 g001
Figure 2. Schematic diagram of stress–fluid–solid coupling environment. (a) Three-dimensional stress and fluid injection around the fault; (b) the cross-section of stress distribution.
Applsci 15 10545 g002
Figure 3. Evolution of maximum principal stress against loading time under different intermediate principal stress; (ae) correspond to Groups I-1 through I-5, respectively.
Applsci 15 10545 g003
Figure 4. Quantitative relationship between the intermediate principal stress and the fault slip initiation stress.
Applsci 15 10545 g004
Figure 5. Evolution of fault slip velocity against maximum principal stress loading. (ae) correspond to Groups I-1 through I-5, respectively.
Applsci 15 10545 g005
Figure 6. Evolution of maximum principal stress against loading time under different minimum principal stress: (ad) correspond to Groups II-1 through Groups II-4, respectively.
Applsci 15 10545 g006
Figure 7. Quantitative relationship between the minimum principal stress and fault slip initiation stress.
Applsci 15 10545 g007
Figure 8. Evolution of fault slip velocity against different minimum principal stress. (ad) correspond to Groups II-1 through II-4, respectively.
Applsci 15 10545 g008
Figure 9. Evolution of maximum principal stress against loading time under different injection pressures; (ad) correspond to Groups III-1 through III-4, respectively.
Applsci 15 10545 g009
Figure 10. Quantitative relationship between injection pressure and fault slip initiation stress.
Applsci 15 10545 g010
Figure 11. Schematic illustration of the regional stress field distribution of a fault subjected to high-pressure water injection.
Applsci 15 10545 g011
Figure 12. Evolution of fault slip velocity against different injection pressures; (ad) correspond to Groups III-1 to III-4, respectively.
Applsci 15 10545 g012
Table 1. Stress loading setups.
GroupNo.σx (MPa)σy (MPa)P (MPa)σz_r (mm/s)
I15530.001
2510
3515
4520
5525
II153030.001
21030
31530
42030
III1202510.001
220252
320253
420254
Table 2. Quantitative relationships between geo-stress parameters and slip initiation stress.
σx (MPa)σy (MPa)P (MPa)σz_r (mm/s)σs (MPa)
5530.00118.22
51020.48
51529.33
52030.71
52531.12
53030.00138.74
103064.34
153059.29
203069.13
202510.00193.73
2025272.10
2025366.41
2025448.47
Disclaimer/Publisher’s Note: The statements, opinions and data contained in all publications are solely those of the individual author(s) and contributor(s) and not of MDPI and/or the editor(s). MDPI and/or the editor(s) disclaim responsibility for any injury to people or property resulting from any ideas, methods, instructions or products referred to in the content.