Article

Effects of Microscopic Properties and Calibration on the Mechanical Behavior of Cohesive Soil-Rock Mixtures Based on Discrete Element Method

1
Jiangxi Port and Navigation Construction Investment Group Co., Ltd., Nanchang 330008, China
2
School of Civil Engineering, Central South University, Changsha 410075, China
3
School of Civil Engineering and Architecture, East China Jiaotong University, Nanchang 330013, China
*
Author to whom correspondence should be addressed.
Appl. Sci. 2025, 15(19), 10529; https://doi.org/10.3390/app151910529
Submission received: 9 July 2025 / Revised: 29 August 2025 / Accepted: 2 September 2025 / Published: 29 September 2025
(This article belongs to the Special Issue Mechanical Behaviour of Unsaturated Soil)

Abstract

Selecting a reasonable mesoscopic contact model and corresponding contact parameters is a key problem in discrete element simulation. In order to characterize the mesoscopic contact characteristics between particles in cohesive soil–rock mixture (CSRM), a set of laboratory consolidated and undrained triaxial tests were conducted on remolded samples of clay and CSRM collected in situ. Based on the experiments, 2D discrete element models of clay and CSRM were established, respectively. Considering the difference in the mechanical characteristics between soil particles and between soil and rock particles, different types of contact model were applied. The effects of the contact stiffness, bond strength, and friction coefficient between soil particles and between soil and rock particles on the stress–strain curves of both clay and CSRM numerical samples were sequentially studied by parameter sensitivity analysis. Results show that the contact stiffness and friction coefficient between soil particles affect the initial tangent modulus, the peak stress and the post-peak residual stress of the clay sample, while the bonding strength only affects its peak stress and residual stress. However, the mesoscopic contact parameters between soil and rock particles have little effect on the initial tangent modulus of CSRM sample but have a certain impact on the development of stress in the plastic stage, among which the influences of normal bonding strength and friction coefficient between soil and rock particles are more obvious. Finally, according to the comparison between the laboratory test results and the corresponding numerical simulation results in both clay and CSRM samples, mesoscopic contact parameters in CSRM were calibrated.

1. Introduction

Soil–rock mixture (SRM) is a complex geomaterial widely distributed in nature, characterized by larger rock blocks embedded within a matrix of finer-grained soil, forming a heterogeneous geomaterial with mechanical properties significantly distinct from more homogeneous materials like sand or clay. If the matrix includes cohesive soils like clay, the mechanical behavior will become more complicated, and this type of SRM could be called “cohesive soil–rock mixture (CSRM)”. Due to their unique composition and structural complexity, SRMs frequently constitute geological hazards, including landslides and slope failures, especially under adverse environmental conditions such as seismic activities [1,2,3].
To investigate the mechanical behavior of SRMs, researchers have traditionally relied on laboratory testing methods [4,5,6,7,8,9], and the influences of rock content, rock size, and rock spatial distribution were widely demonstrated. For instance, Xu and Zhang [4] performed a series of triaxial tests on SRM and pointed out that the deviator stress ratio and frictional strength typically increase with rock content, though influenced by confining pressure and sample scale. Zhao and Liu [5] investigated the effects of rock content, rock size, and rock block distribution on the mechanical behavior of SRM through medium-scale triaxial tests and found that cohesion and internal friction angles are significantly influenced by rock particle sizes and their random spatial distributions. Qian et al. [6] revealed that the resilient modulus of SRM increases with bulk stress and rock content while decreasing with octahedral shear stress, emphasizing the role of meso-structural interactions.
It is well known that the presence of large rock blocks introduces considerable complexity and uncertainty into conventional laboratory test, significantly influencing the stress–strain behavior and dilatancy through factors such as rock block content, distribution, shape, and meso-structure [7,8,9]. However, the inherent limitations associated with laboratory testing methods lie in their incompetence of revealing the evolution of the grain skeleton within a particle assembly during loading, which underscores the necessity and advantage of numerical simulation techniques. The discrete element method (DEM), first proposed by Cundall and Strack [10], provides a powerful tool to model the mechanical behavior of varying discontinuous geomaterials, such as clays, clean sands, gravels, ballasts, or some complicated mixtures [11,12,13,14,15]. More specifically, DEM modeling has excellent advantages in providing insights into the particle arrangement, fabric, contact forces, movements, and particle interactions [16,17,18,19,20]. Nevertheless, there is a general issue in DEM simulations where the mesoscopic contact parameters between particles are fundamentally distinct from macroscopic parameters and hence difficult to determine directly. To ensure the rationality of numerical simulation results, a trial-and-error method is generally applied to calibrate the mesoscopic contact parameters in the DEM model by comparing the macroscopic stress–strain curves derived from DEM simulations and that obtained from laboratory tests [21,22,23]. It is convenient for specimens containing only one type of material, and the effect of contact parameters on the mechanical behavior are widely investigated in the previous literature [24,25,26,27].
However, due to the presence of two distinct phases—“soil” and “rock blocks”—within SRMs, which exhibit significant differences in mechanical properties, the contacts between soil particles, between rock blocks, and between soil particles and rock blocks must be separately considered in DEM simulations. This necessitates implementing a group contact setting, i.e., different contact models or properties for different types of contacts, to better reflect realistic conditions. However, current DEM research primarily focuses on analyzing and calibrating mesoscopic parameters for homogeneous soils like sand or clay [28,29]. With regard to soil–rock mixtures, some researchers still used a single contact type between soil particles and between soil and rock particles. For instance, Wu et al. [30] conducted a series of uniaxial compression simulations on SRM with unified contact parameters between both soil–soil and soil–rock contacts and found a good comparison with previous experimental results regarding the strength and elastic modulus. As mentioned, it is not a good method, especially when the soils are cohesive and the bonding between particles have to be considered. More rationally, some other studies applied the group contact setting for SRMs and separated the contacts between soil particles, between rock particles, and between soil–rock particles [31,32]. However, they always focus on SRMs containing non-cohesive fine-grained soils and lack detailed exploration on the influence of bonding between particles on the macroscopic stress–strain curves of the specimen.
This study aims to address this gap by explicitly implementing group contact settings within DEM simulations for soil–rock mixtures containing cohesive soils, specifically considering the bonding features between soil particles, and between soil particles and rock blocks. Utilizing laboratory data from consolidated undrained triaxial tests on clay and SRM, this research proposes a framework to calibrate mesoscopic contact parameters systematically. The influence of each contact parameters on macroscopic stress–strain behavior is thoroughly analyzed, providing practical guidance for future researchers to rationally select mesoscopic parameters in DEM modeling of SRMs.

2. Laboratory Undrained Triaxial Tests

2.1. Test Materials

The cohesive soil–rock mixtures (CSRM) used in this study were sourced from a hillslope in Western China. The fine-grained fraction consisted of silty clay, while the rock blocks were primarily composed of granite, exhibiting angular particles. As the field-retrieved soil samples contained a certain amount of oversized rock blocks, and considering the limitation imposed by the maximum particle size to specimen diameter ratio in laboratory triaxial testing, the parallel gradation method was employed to scale these oversized rock blocks [33]. A cylindrical specimen with size of 100 × 200 mm was used in this study, and hence the particle size distribution of the processed CSRM after scaling is shown in Figure 1. As mentioned by Xu et al. [34], the soil–rock threshold that separates the soils and rock blocks should depend on the study scale and was suggested as 0.05   L c , where L c represents the characteristic scale of SRM and is equal to the diameter in triaxial samples. In this case, L c =   100   m m and the soil–rock threshold is 5 mm in this study. Therefore, it can be seen from the grading curve that the rock content of the extracted CSRM is 30%, where rock particles almost floated in fine-grained particles and the load-bearing force chains primarily originated from soil–soil contacts [32]. This type of SRM with lower rock content is the representative object in this study for investigating the influence of mesoscopic contact parameters and calibration. Additionally, Atterberg limits test were performed on the fine-grained soil fraction (<0.075 mm) within the CSRM material. The Atterberg limits of the fine-grained soil are presented in Table 1.

2.2. Test Method

The tests were conducted using an advanced triaxial testing system. Conventional saturated consolidated undrained (CU) triaxial tests were performed separately on remolded specimens of the CSRM and its fine-grained soil component (clay). The specimens were prepared using the layered compaction method, with both types compacted in five layers. Following compaction, specimens were first placed in a vacuum chamber for de-airing saturation with 24 h. Subsequently, they were transferred to the triaxial apparatus for de-aired water saturation followed by back-pressure saturation. The back pressure was increased to 300 kPa to produce a B-value greater than 95%. Upon completion of saturation, both specimens underwent isotropic consolidation under a confining pressure ( p 0 ) of 200 kPa. The drainage valves were then closed, and undrained static loading was applied under strain-controlled conditions at an axial strain rate of 0.1%/min (i.e., 0.00167%/s).

3. DEM Simulations

3.1. Contact Model

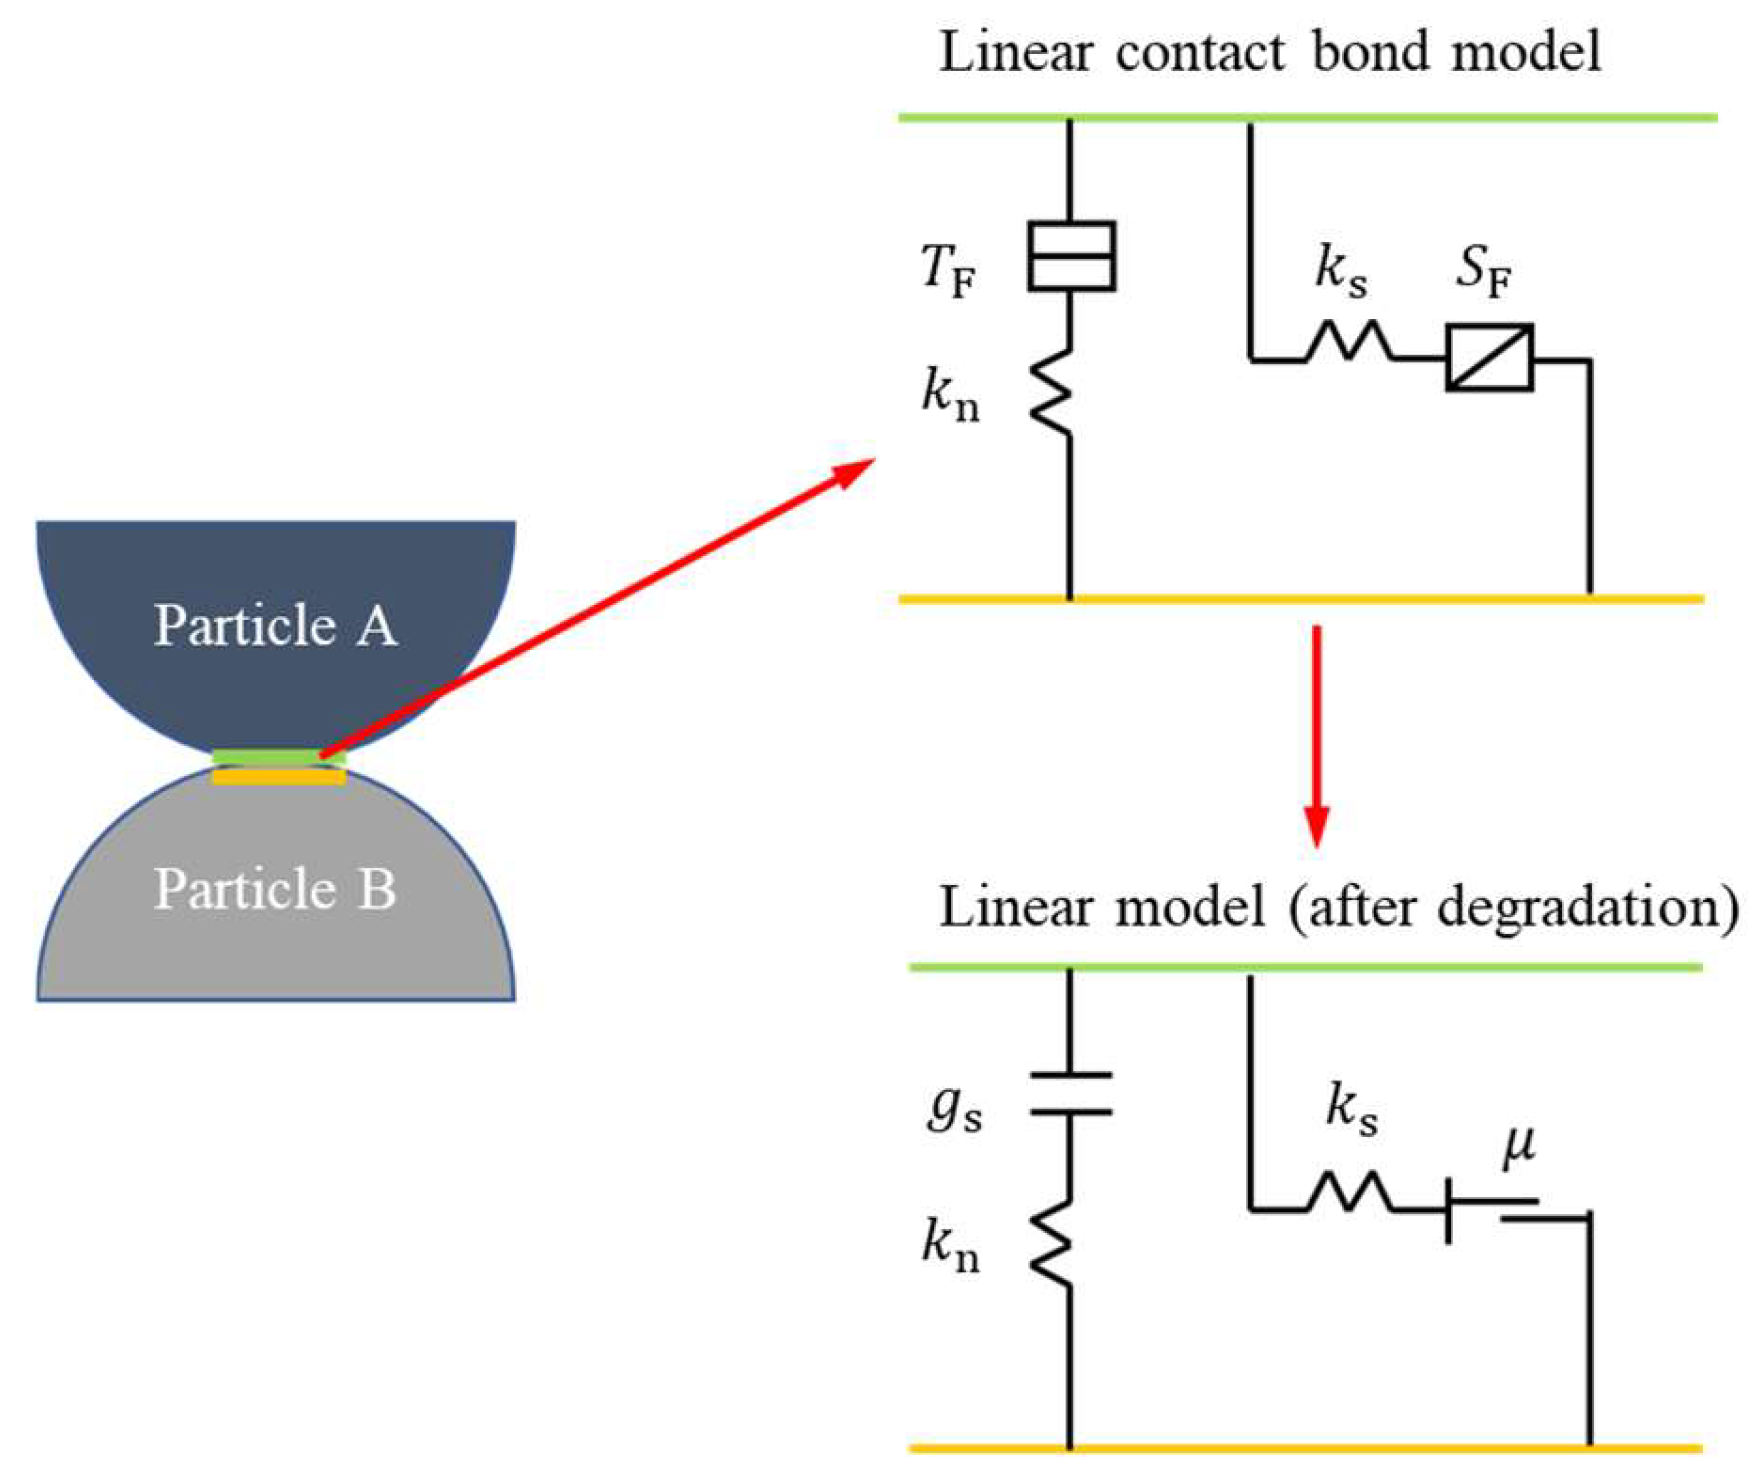
In discrete element method (DEM) simulations, a numerical model is composed of a finite number of particles, and particles interact with each other through contacts. The contact behavior between particles directly contributes to the macroscopic behavior of the model. Therefore, it is crucial to assign suitable contact models in DEM modeling. In order to reflect different stress–strain behavior between particles, there are several types of contact models in the literature, such as the linear contact model, hertz contact model, linear contact bond model, rolling resistance model, etc. Among these contact models, the linear contact bond model is generally used to characterize the contact behavior between cohesive particles. The fundamental principle of this model is illustrated in Figure 2. Considering a contact between the particle A and B, the linear contact bond model essentially adds a bond with specific tensile and shear resistance capabilities to the linear contact model. When the contact force exceeds the specified tensile strength or shear strength, the bond breaks. Consequently, the linear contact bond model reverts to a standard linear contact model. Considering the physical and mechanical properties of the CSRM material used in the laboratory tests, the linear contact bond model was selected as the primary inter-particle contact model in this numerical simulation. The key parameters of this contact model include the normal contact stiffness k n , tangential contact stiffness k s , normal tensile bond strength T F , tangential shear bond strength S F , and the friction coefficient μ . k n and k s denote the spring constant within the linear force–displacement relationship from the normal and tangential direction, respectively. T F and S F indicate the maximum force in the normal and tangential direction, respectively. If the normal force exceeds its maximum value T F , the bond breaks and both the normal and shear forces are set to zero; if the shear force exceeds its maximum value S F , the bond breaks, but the contact forces are not altered, provided that the shear force does not exceed the product of the friction coefficient and normal force, and provided that the normal force is compressive. The friction coefficient μ specifies the conditions of the contact to slide, i.e., if the ratio of normal force to shear force exceeds μ , the contact will slide. Additionally, the parameter g s in Figure 2 denotes surface gap, and the contact is active if and only if the surface gap is less than or equal to zero.

3.2. Acquisition of 2D Realistic Rock Block Contours

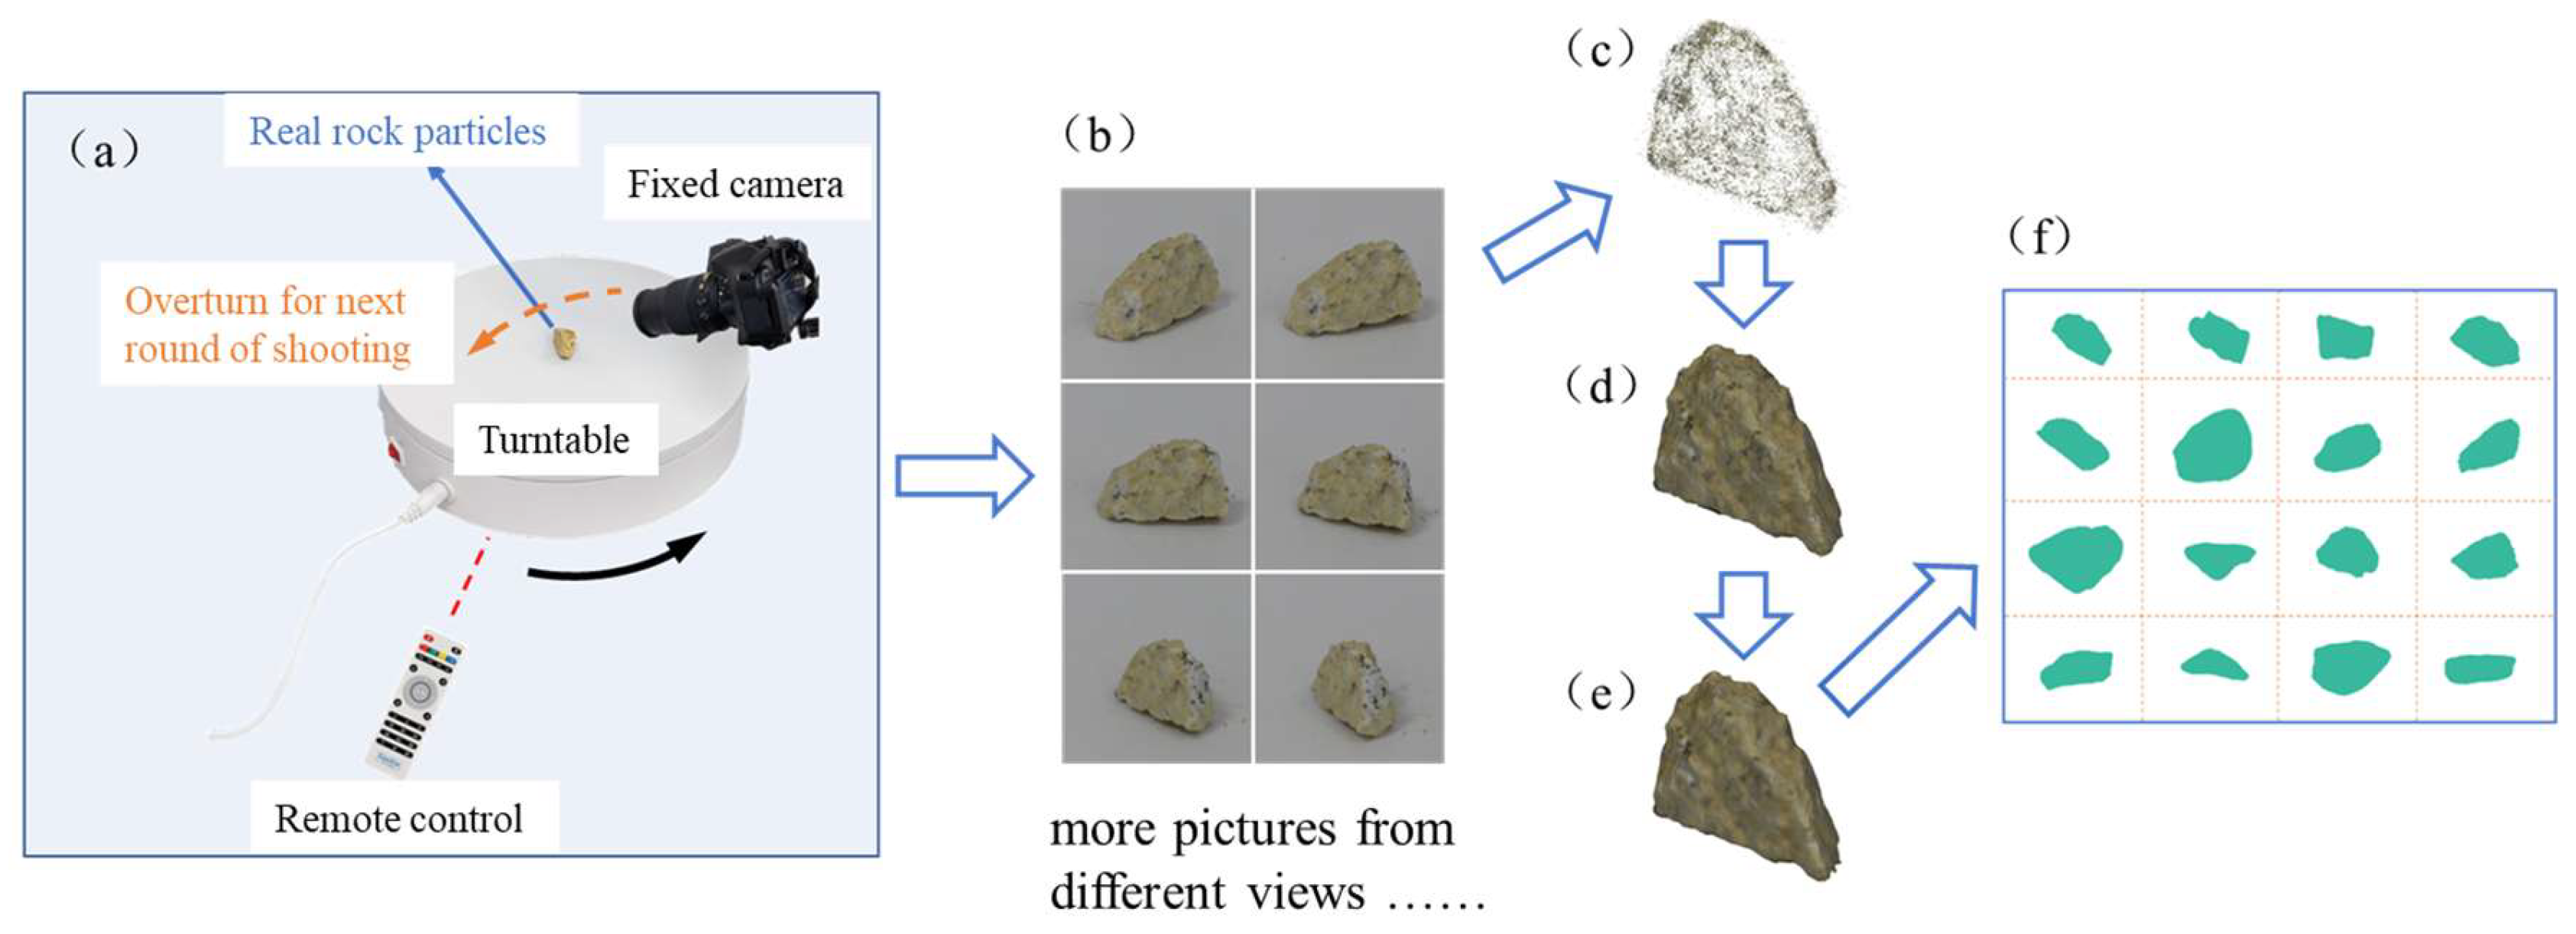
Photogrammetry provides an effective technique for capturing the true morphology of large-sized particles such as ballast [35,36], which is more convenient and cost-efficient compared to high-resolution laser scanning technique [37] or μCT method [38]. This method starts with photographing a 3D physical object from all-round perspectives. The captured images are then matched and solved to generate a point cloud model of the 3D entity. This point cloud model is further processed to obtain a surface mesh model of the object. To more realistically represent the morphology of rock blocks within CSRM, this study employed a close-range photogrammetry framework to reconstruct 3D digital models of actual rock blocks through only a remote-controlled turntable and a camera as shown in Figure 3a. The rock particle was placed on the turntable in a stable manner. Then, the turntable rotated 10° at a time (36 times per cycle) and the fixed camera would take a picture. Note that the rotation angle of the turntable should be small enough each time to ensure overlaps between adjacent pictures. After reconstructing 3D digital models, a series of 2D contours of these realistic rock blocks were obtained using a custom MATLAB (version R2021b) projection routine. The overall workflow is illustrated in Figure 3.

3.3. Numerical Model

Given the distinct mechanical properties between soils and rock block particles within the CSRM, it is necessary in DEM simulations to assign contact parameters separately for the contacts between soil particles, between soil particles and rock blocks, and between rock blocks—that is, to establish a group contact model. However, in this study, the rock content in the in situ CSRM was relatively low (30%), which forms a rock-floating skeleton and hence allows the contacts between rock blocks to be neglected. Therefore, a set of numerical simulations matching the laboratory triaxial tests on clay were firstly conducted to analyze and calibrate the contact parameters between soil particles. Subsequently, another set of numerical models matching the laboratory triaxial tests on CSRM were established. The calibrated soil–soil contact parameters from clay models were assigned, and the contact parameters between soil particles and rock blocks were then further analyzed and calibrated.
The DEM simulations were implemented in the commercial software Particle Flow Code in Two Dimensions (PFC2D) version 5.0 [39], which is widely used in geotechnical engineering ranging from soil and rock behavior at the micro scale to engineering applications at the large scale such as slope stability, soil–structure interaction, pavement design, etc. Using PFC’s embedded Fish language, programs can be written to generate particle assemblies with dimensions and particle size distributions identical to the laboratory specimens based on the size and gradation of the clay or CSRM. However, it may introduce an excessively large number of particles if considering accurately the small particle size and high content of fine particles in the laboratory, which imposes significant computational cost and resource burdens. According to previous research findings [40], the influence of particle size in DEM simulations can be neglected when the ratio of the numerical specimen diameter to the internal particle diameter exceeds a certain value (typically 30–50). Consequently, this study adopted a simplified approach for the fine particles within the numerical model: the particle size range in the clay model was set to 0.5–1 mm, and particles smaller than 1 mm in the CSRM model were uniformly assigned to the 1–2 mm range. Additionally, a threshold diameter of 5 mm was used to distinguish soil particles from rock block particles as mentioned previously in Section 2.1. Following the determination of particle sizes and gradation, separate numerical models for clay and CSRM were established. The sample preparation procedure began with the generation of four rigid walls to form a rectangular boundary with a length 1.5 times its width. The contacts between walls and particles were initially set to a linear contact model with both normal and tangential contact stiffness equal to 1 × 10⁸ N/m and no friction. Subsequently, particles were randomly distributed without overlaps within the enclosed rectangular space. For the clay model, only disk-shaped soil particles were distributed, while for the CSRM model, disk-shaped soil particles and realistic rock particles were generated in the same manner. The contacts between soil particles, as well as between soil and rock particles, were set to the linear contact bond model, but with a different set of contact parameters. Finally, the rigid wall boundary moved inwards, and a servo-controlled mechanism was adopted on these walls to reach an initial confining pressure p 0 of 200 kPa.
The clay and CSRM specimens generated after consolidation are shown in Figure 4.

3.4. Constant-Volume Method

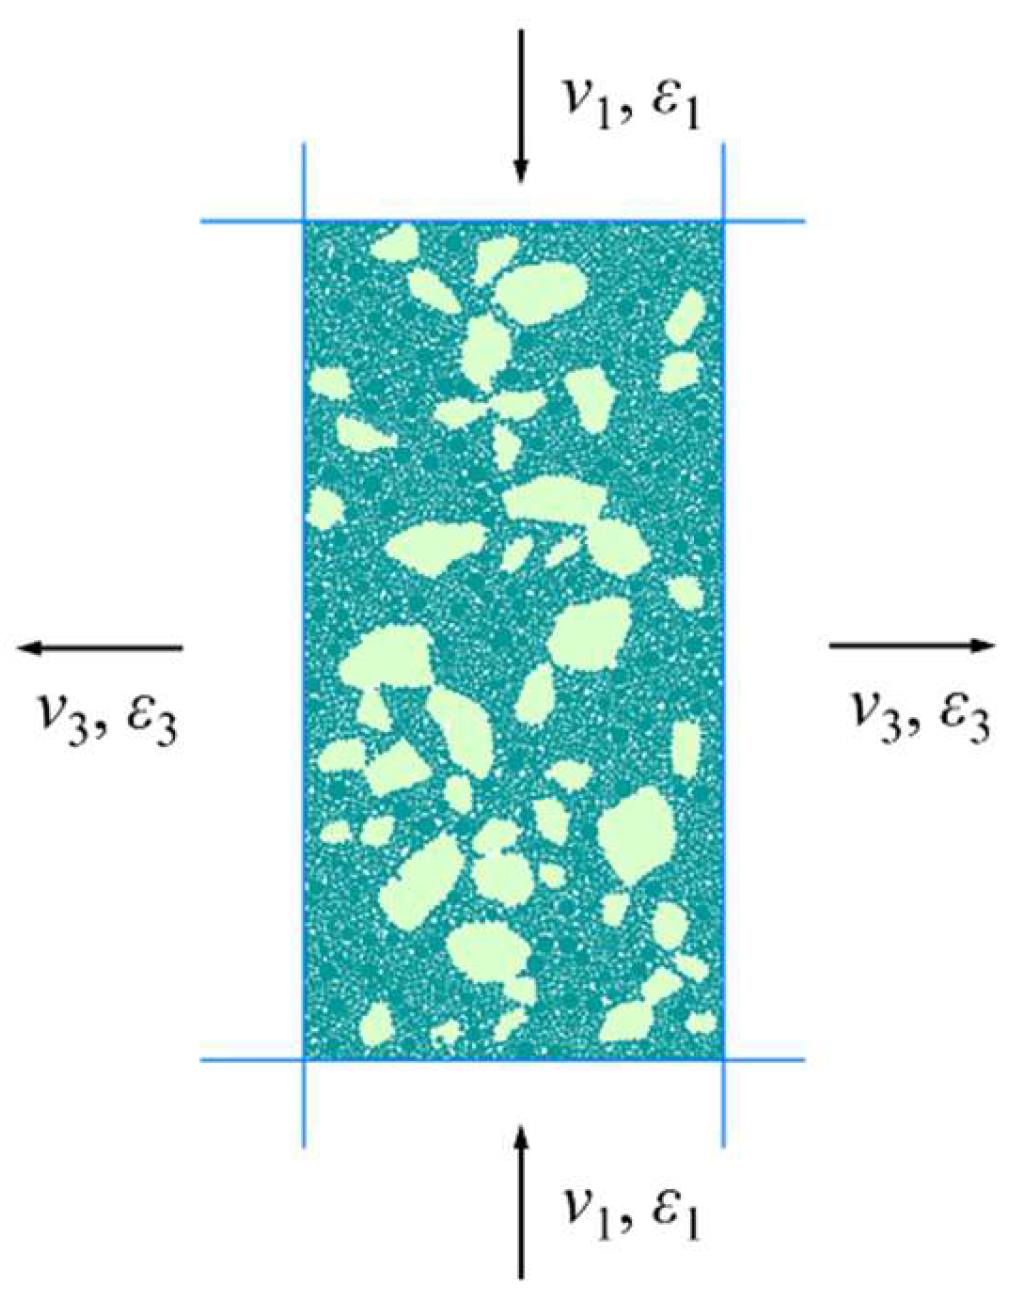
During the loading stage, constant velocities were applied to the top and bottom walls to achieve strain-controlled loading. The strain rate was maintained identical to that used in the laboratory tests, namely 0.1%/min. Simultaneously, the constant volume method [41,42] was employed throughout the loading stage to simulate undrained conditions. A schematic diagram illustrating the fundamental principle of the constant volume method is shown in Figure 5, where CSRM specimen were taken for display. Based on the constant velocity applied to the axial walls and the constraint of zero volumetric strain within the specimen, the velocity of the lateral walls is given by the following:
v 3 = v 1 A / l y 2
where v 1 and v 3 are the velocity of the axial walls and lateral walls, respectively. A is the initial area of the sample. l y is the height of the sample.

4. Results and Discussion

4.1. Parameters Between Soil Particles

4.1.1. Effect of Contact Stiffness Between Soil Particles

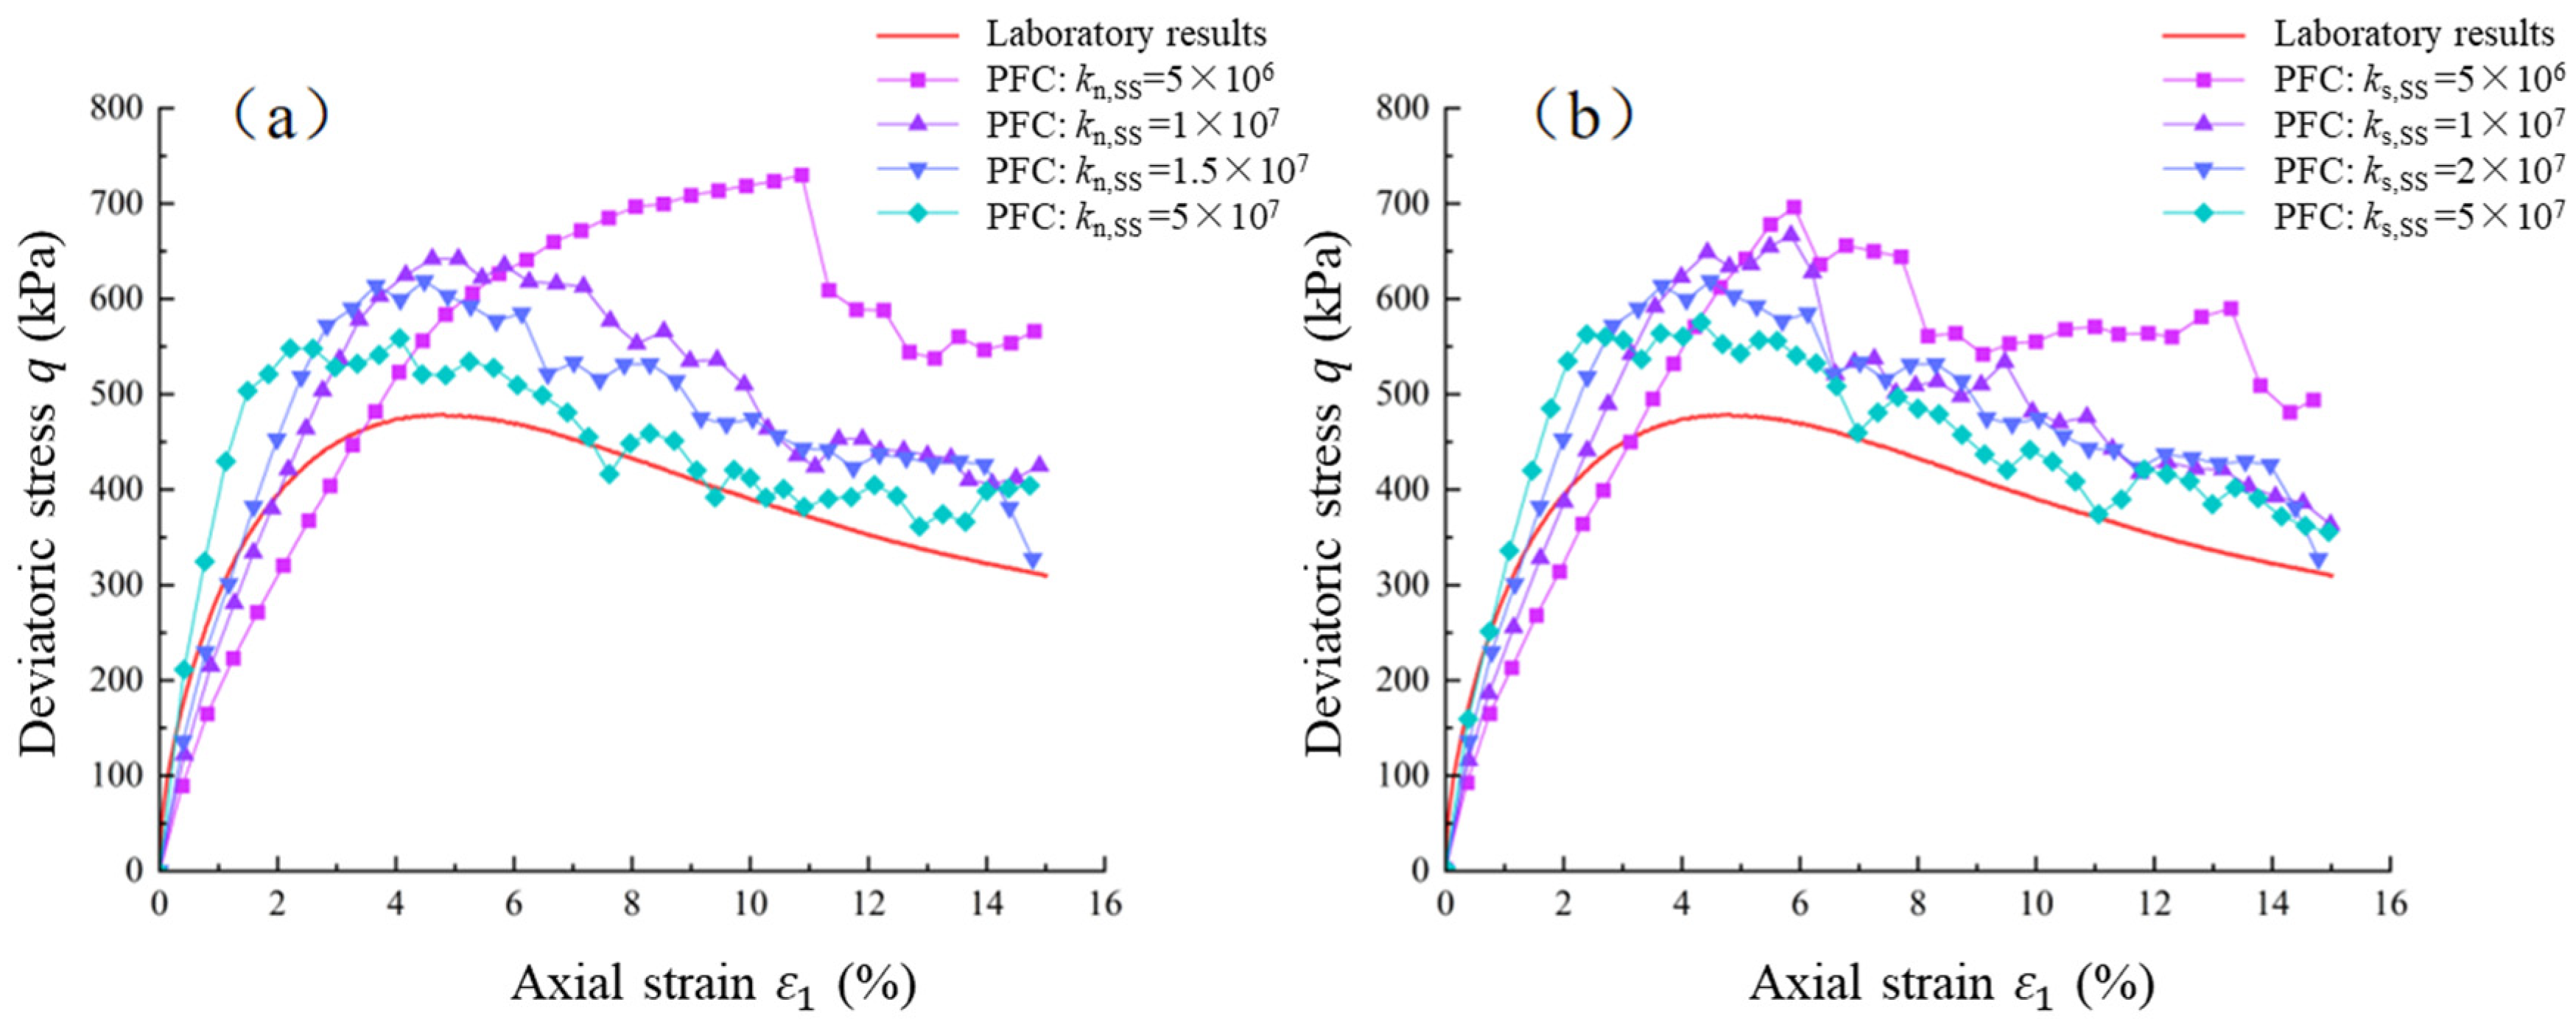
The inter-particle contact stiffness includes the normal contact stiffness and the tangential contact stiffness. In order to investigate the effect of contact stiffness, other mesoscopic contact parameters were kept constant. The initial values of both normal and shear bond strength between soil particles were set to zero, while the friction coefficient was 0.5. Then, the following analyses on the effect of contact stiffness on stress–strain behavior of clay samples were performed. Firstly, the normal contact stiffness between cohesive soil particles ( k n , S S ) was set to values of 5 × 10⁶ N/m, 1 × 10⁷ N/m, 1.5 × 10⁷ N/m, and 5 × 10⁷ N/m, respectively. The resulting stress–strain curves for the clay specimens are shown in Figure 6a. Then, the tangential contact stiffness between soil particles ( k s , S S ) was set to values of 5 × 10⁶ N/m, 1 × 10⁷ N/m, 1.5 × 10⁷ N/m, and 5 × 10⁷ N/m, respectively. The resulting stress–strain curves are shown in Figure 6b. It can be observed that as the normal contact stiffness or tangential contact stiffness increases, the initial tangent modulus of the specimen increases. This indicates that the contact stiffness directly contributes to the elastic deformation of the specimen. However, the corresponding peak stress and the strain at peak stress decrease. Following the peak, the softening trend becomes less pronounced, and the residual strength exhibits a slight reduction. Comparison between the influence of normal and tangential contact stiffness reveals that, at equivalent magnitudes, normal contact stiffness has a more dominant influence on the specimen’s stress–strain behavior than tangential contact stiffness, especially during the initial elastic stages. This is reasonable as, in the initial loading stages, the macro strain mainly originates from particle normal deformation (or overlaps) and the normal contact force contributes to the force chain inside the specimen, while the tangential contact stiffness relates to the tangential deformation before sliding.

4.1.2. Effect of Inter-Particle Bond Strength Between Soil Particles

The inter-particle bond strength comprises the normal bond strength and the shear bond strength. To investigate the influence of bond strength between fine particles on the mechanical behavior of clay, the following analyses were conducted while keeping all other mesoscopic parameters constant. Firstly, the normal tensile bond strength between soil particles ( T F , S S ) was set to values of 50 N, 100 N, 300 N, 500 N, and 800 N, respectively. The resulting stress–strain curves for the clay specimens are shown in Figure 7a. Then, the shear bond strength between soil particles ( S F , S S ) was set to values of 50 N, 100 N, 330 N, 500 N, and 800 N, respectively. The resulting stress–strain curves for the clay specimens are shown in Figure 7b. It can be observed that the initial tangent modulus of the specimen is almost unaffected by the bond strength. This is because during the initial loading stage, the contact force between particles is far below the bond strength and no bond breaks. In this case, the bond strength only serves as a deactivated “threshold” and makes no contribution to elastic resistance. However, during later loading stages, as the normal bond strength or shear bond strength between particles increases, both the peak stress and the corresponding strain at peak stress of the specimen increase. Following the peak, all curves exhibit a softening trend, but the rate of softening remains nearly consistent. Consequently, the residual strength increases with higher bond strength. These all imply that the bond strength makes significant contributions to the shear strength. Comparing the influence of normal bond strength and shear bond strength reveals that, at equivalent magnitudes, shear bond strength has a more pronounced effect on the specimen’s strength than normal bond strength. This is reasonable as the shear bond strength becomes the main source of resistance against particle sliding during shearing and hence makes greater contributions to the overall shear strength of the specimen.

4.1.3. Effect of Inter-Particle Friction Between Soil Particles

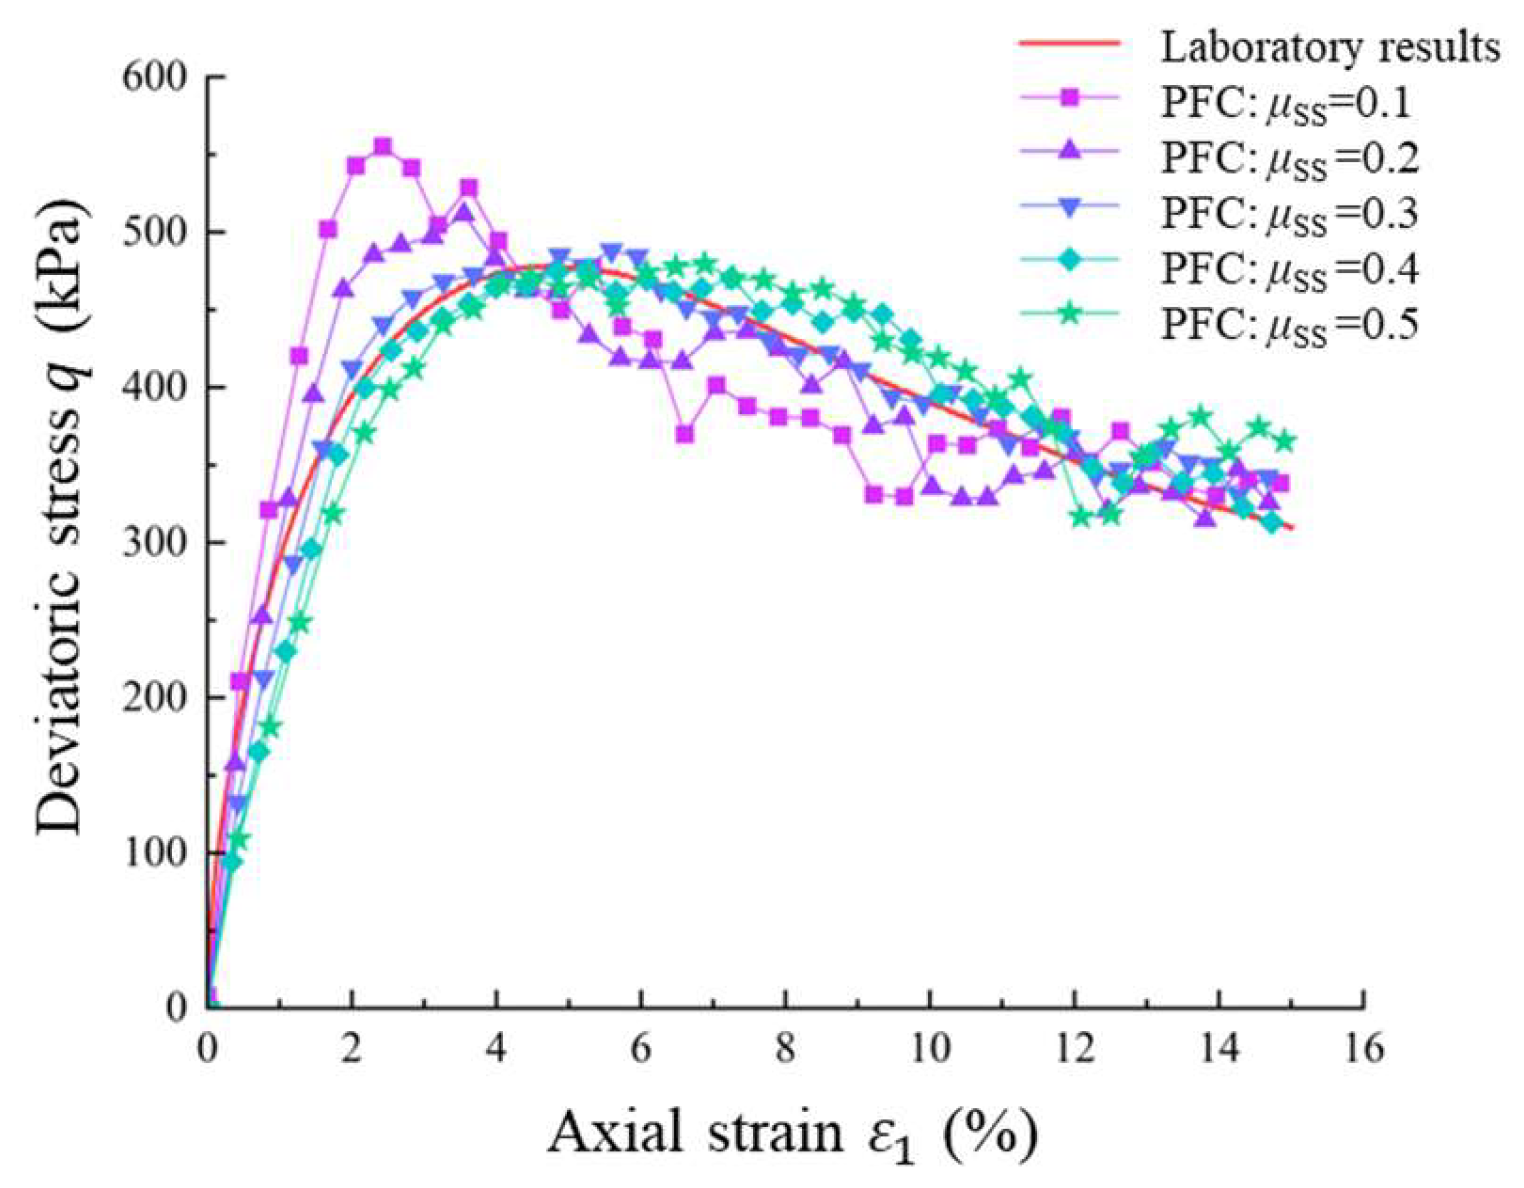
While keeping all other parameters constant, the inter-particle friction coefficient between soil particles ( μ S S ) was set to values of 0.1, 0.2, 0.3, 0.4, and 0.5, respectively. The resulting stress–strain curves for the clay specimens are shown in Figure 8. It can be observed that the inter-particle friction coefficient has a relatively minor influence on the stress–strain behavior of the clay specimen compared to other parameters. This indicates that with the introduction of bond strength, the effect of inter-particle friction on resisting particle sliding or contact loss becomes smaller. In spite of this, it could still be observed that, as the friction coefficient increases, the initial tangent modulus and peak stress decreases while the residual strength increases, and the post-peak softening trend becomes less pronounced.

4.1.4. Calibration of Contact Parameters Between Soil Particles

Through analyzing the influence of various mesoscopic parameters between soil particles on the stress–strain curves obtained from the numerical simulations of clay and comparing these results with the laboratory triaxial test data for clay, a reasonable set of inter-particle contact parameters can be calibrated. The calibration results are presented in Figure 9, where the maximum deviation of DEM results from laboratory results is 12.1%. The corresponding calibrated mesoscopic contact parameters are summarized in Table 2.

4.2. Parameters Between Soil and Rock Particles

4.2.1. Effect of Contact Stiffness Between Soil and Rock Particles

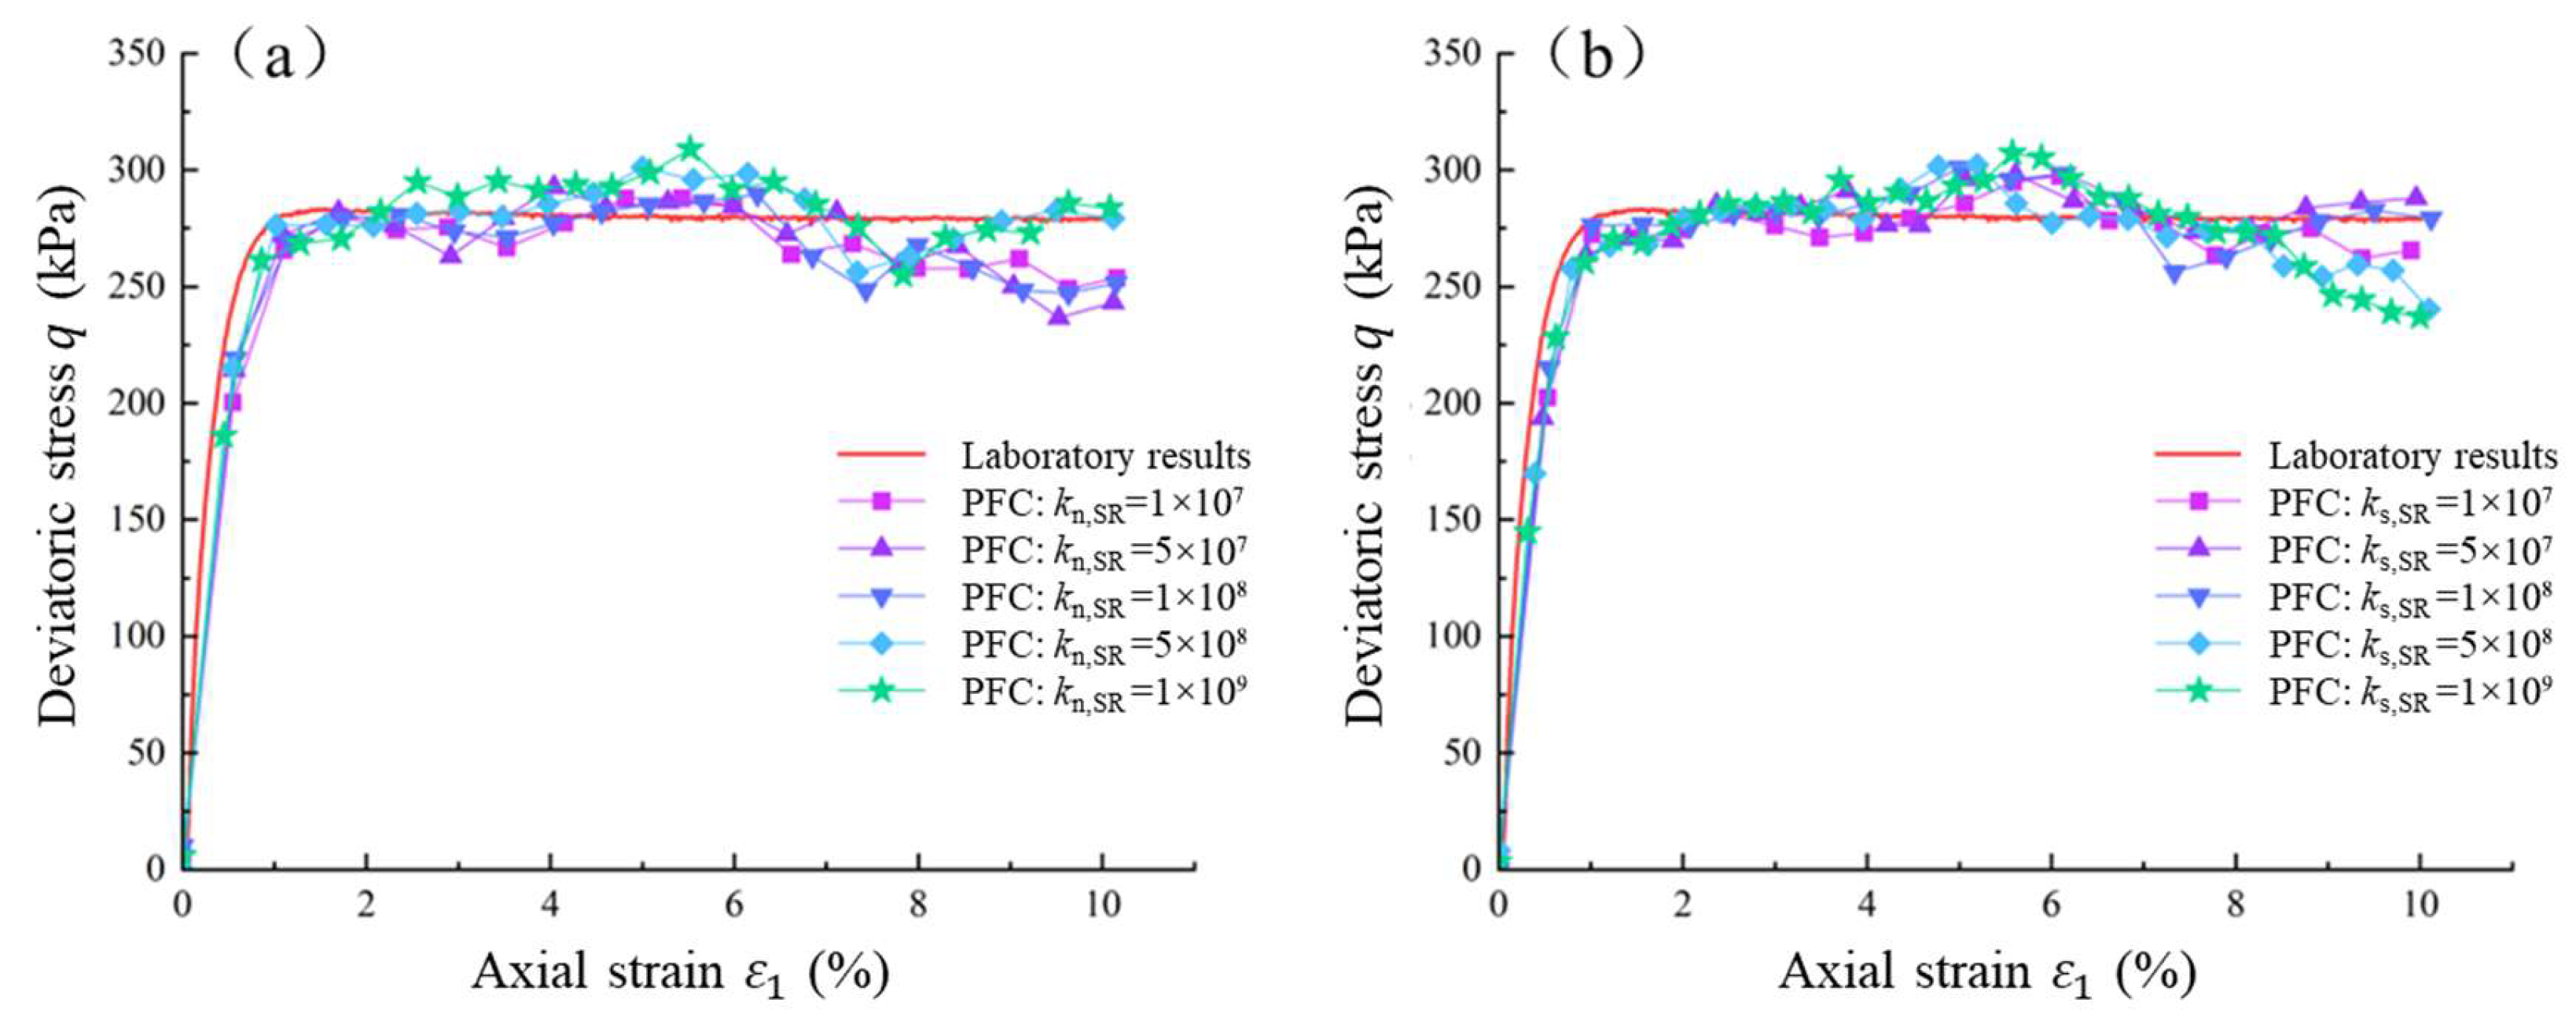
After obtaining the calibrated inter-particle contact parameters for the soil matrix, these parameters were assigned to the CSRM numerical specimen. Subsequently, the influences of contact stiffness, bond strength, and friction coefficient between soil particles and rock blocks on the macroscopic stress–strain behavior were systematically analyzed. Before investigating the effect of contact stiffness between soil and rock particles, all other mesoscopic contact parameters were kept constant. The initial values of both normal and shear bond strength between soil and rock particles were zero, while the friction coefficient was 0.5. Then the normal contact stiffness between soil and rock particles ( k n , S R ) was varied through values of 1 × 10⁷ N/m, 5 × 10⁷ N/m, 1 × 10⁸ N/m, 5 × 10⁸ N/m, and 1 × 10⁹ N/m, with the resulting stress–strain curves of the CSRM specimens presented in Figure 10a. Similarly, while keeping other parameters unchanged, the tangential contact stiffness between soil and rock particles ( k s , S R ) was adjusted to 1 × 10⁷ N/m, 5 × 10⁷ N/m, 1 × 10⁸ N/m, 5 × 10⁸ N/m, and 1 × 10⁹ N/m, yielding the corresponding stress–strain curves shown in Figure 10b. The analysis reveals that the contact stiffness between soil and rock particles exhibits relatively minor influence on the overall stress–strain response of CSRM specimens. Notably, these stiffness parameters demonstrate negligible effects on the initial tangent modulus, though they moderately affect stress development during the plastic phase. This minor effect is due to the lower rock content and the rock-floating skeleton structure. The contacts between soil particles are the primary component of the force chain within the CSRM specimen. Comparative evaluation indicates that the normal contact stiffness exerts slightly more pronounced influence than its shear counterpart under equivalent parameter magnitudes.

4.2.2. Effect of Inter-Particle Bond Strength Between Soil and Rock Particles

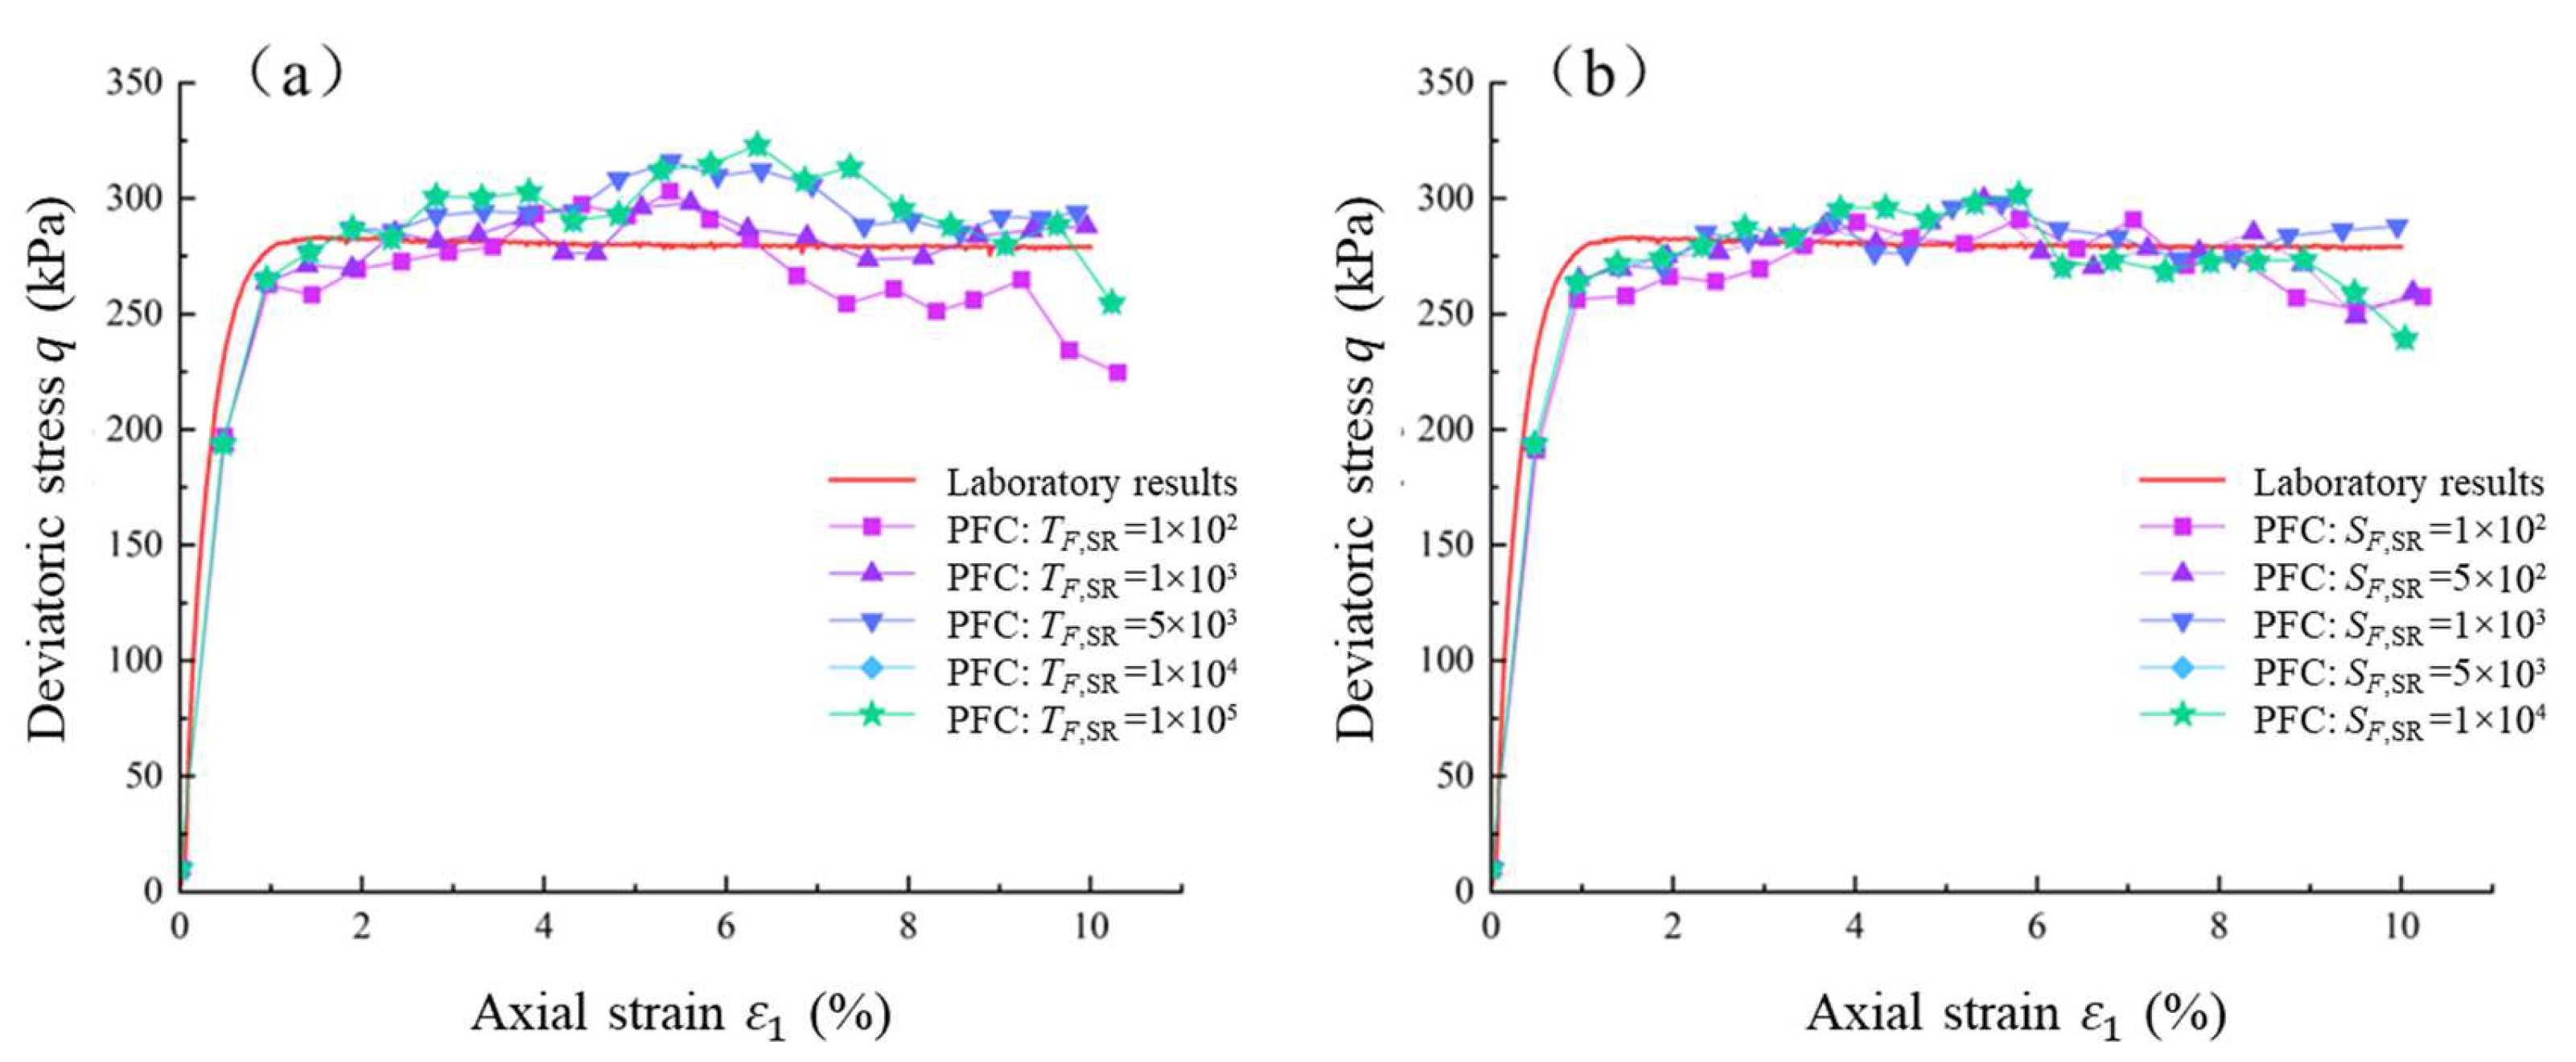
Maintaining all other mesoscopic parameters constant, the normal tensile bond strength between soil and rock particles ( T F , S R ) was systematically varied through values of 1 × 10² N, 1 × 10³ N, 5 × 10³ N, 1 × 10⁴ N, and 1 × 10⁵ N, with the resulting stress–strain curves of the CSRM specimens presented in Figure 11a. Similarly, while keeping other parameters unchanged, the shear bond strength between soil and rock particles ( S F , S R ) was adjusted to 1 × 10² N, 5 × 10² N, 1 × 10³ N, 5 × 10³ N, and 1 × 10⁴ N, yielding the corresponding stress–strain curves shown in Figure 11b. The analysis demonstrates that the bond strength between soil and rock particles exhibits negligible influence on the initial tangent modulus of CSRM specimens, though it significantly affects stress development during the plastic phase. The minor effect of the bond strength of soil–rock contact compared to that of soil–soil contact could also be attributed to the rock-floating skeleton structure. Specifically, both normal and shear bond strength enhancements lead to increased stress levels in the plastic deformation stage. However, when either normal or shear bond strength exceeds certain threshold values (1 × 10⁴ N for normal bond strength and 5 × 10³ N for shear bond strength), the stress–strain curves become insensitive to further bond strength increases, as evidenced by identical curves obtained at 1 × 10⁴ N and 1 × 10⁵ N normal bond strength, and at 5 × 10³ N and 1 × 10⁴ N shear bond strength. Comparative evaluation reveals that at equivalent parameter magnitudes, normal bond strength exerts more substantial influence on the stress–strain behavior of CSRM specimens than shear bond strength.

4.2.3. Effect of Inter-Particle Friction Between Soil and Rock Particles

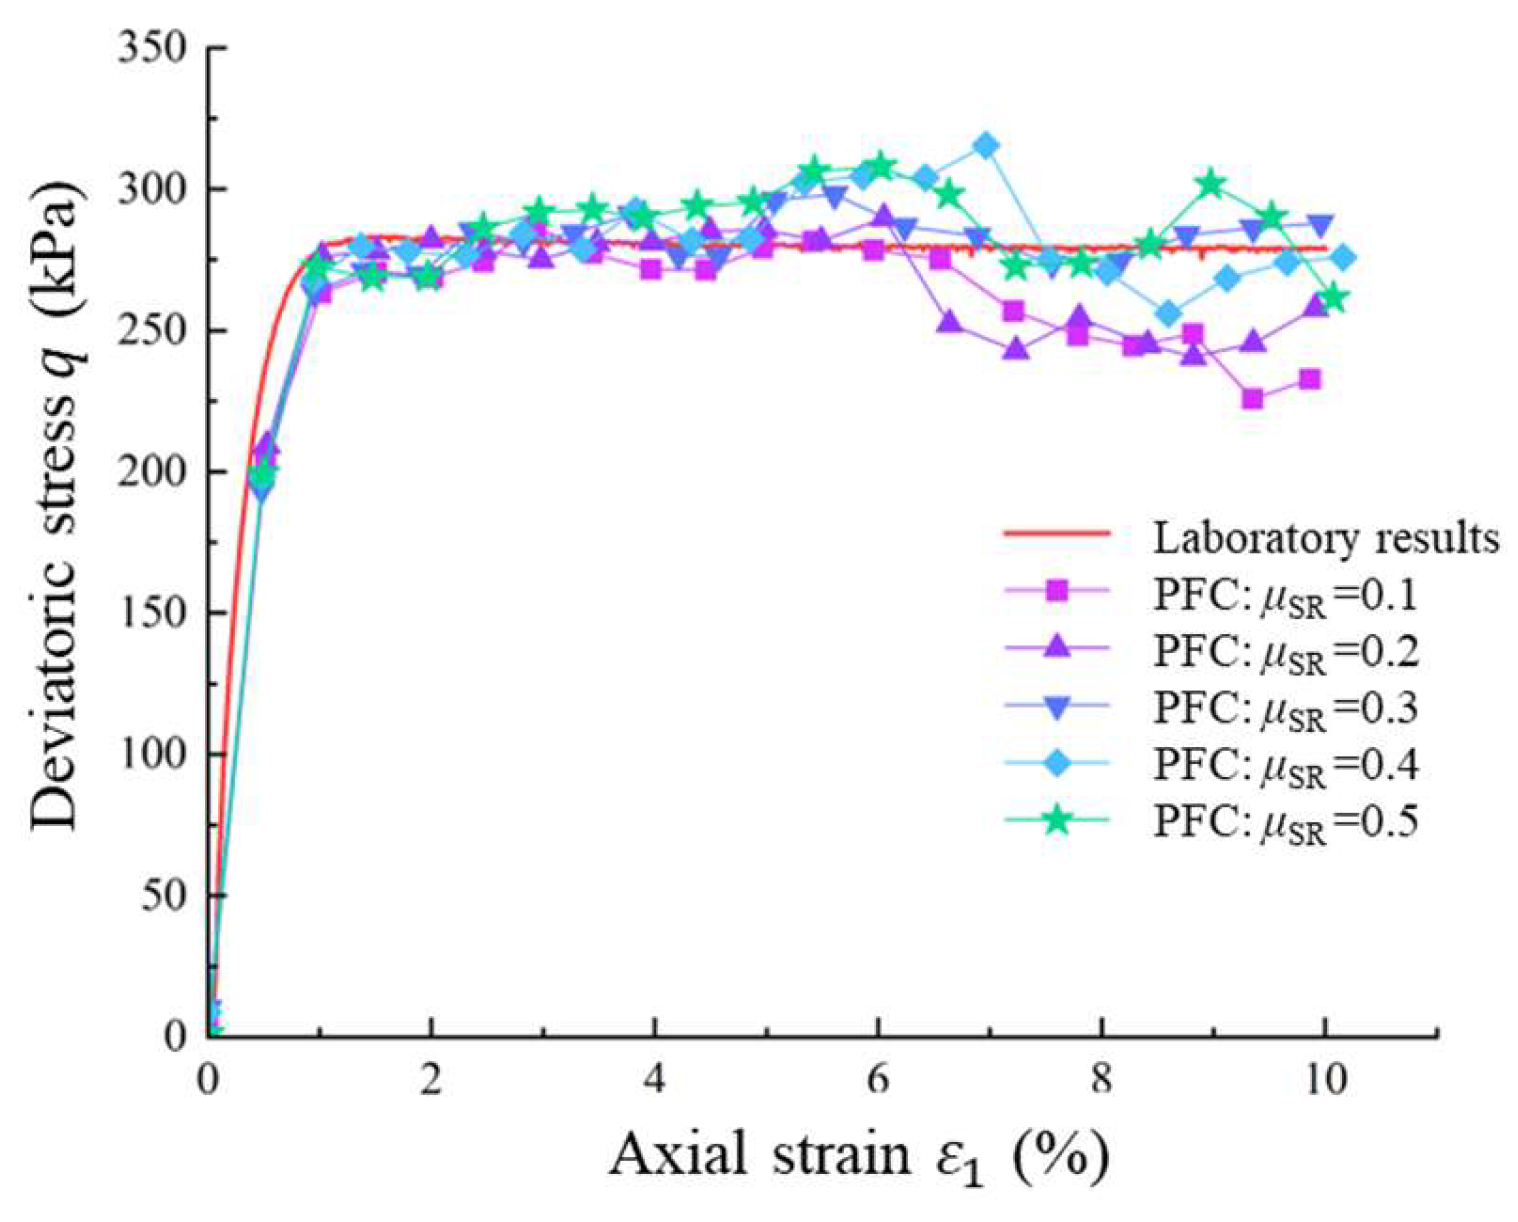
With all other parameters held constant, the friction coefficient between soil and rock particles ( μ S R ) was systematically varied through values of 0.1, 0.2, 0.3, 0.4, and 0.5, yielding the stress–strain curves of the CSRM specimens presented in Figure 12. The analysis reveals that the friction coefficient between soil and rock particles essentially does not affect the initial tangent modulus of CSRM specimens yet significantly influences stress development during the plastic phase, with increasing friction coefficients leading to progressively higher stress levels in the plastic deformation stage.
In summary, for the investigated CSRM specimens with predetermined soil–soil contact parameters, none of the soil–rock contact parameters significantly alter the initial tangent modulus, confirming that this modulus is predominantly governed by inter-soil particle contacts. However, the bond strength between soil and rock particles demonstrably affects plastic phase stress development, where increasing either normal bond strength or friction coefficient enhances stress levels during plastic deformation. Notably, when either normal or shear bond strength exceeds certain threshold values, the stress–strain curves become insensitive to further bond strength increases, indicating that the bond strength between soil and rock particles ceases to contribute to stress enhancement in the plastic phase beyond these critical values.

4.2.4. Calibration of Contact Parameters Between Soil and Rock Particles

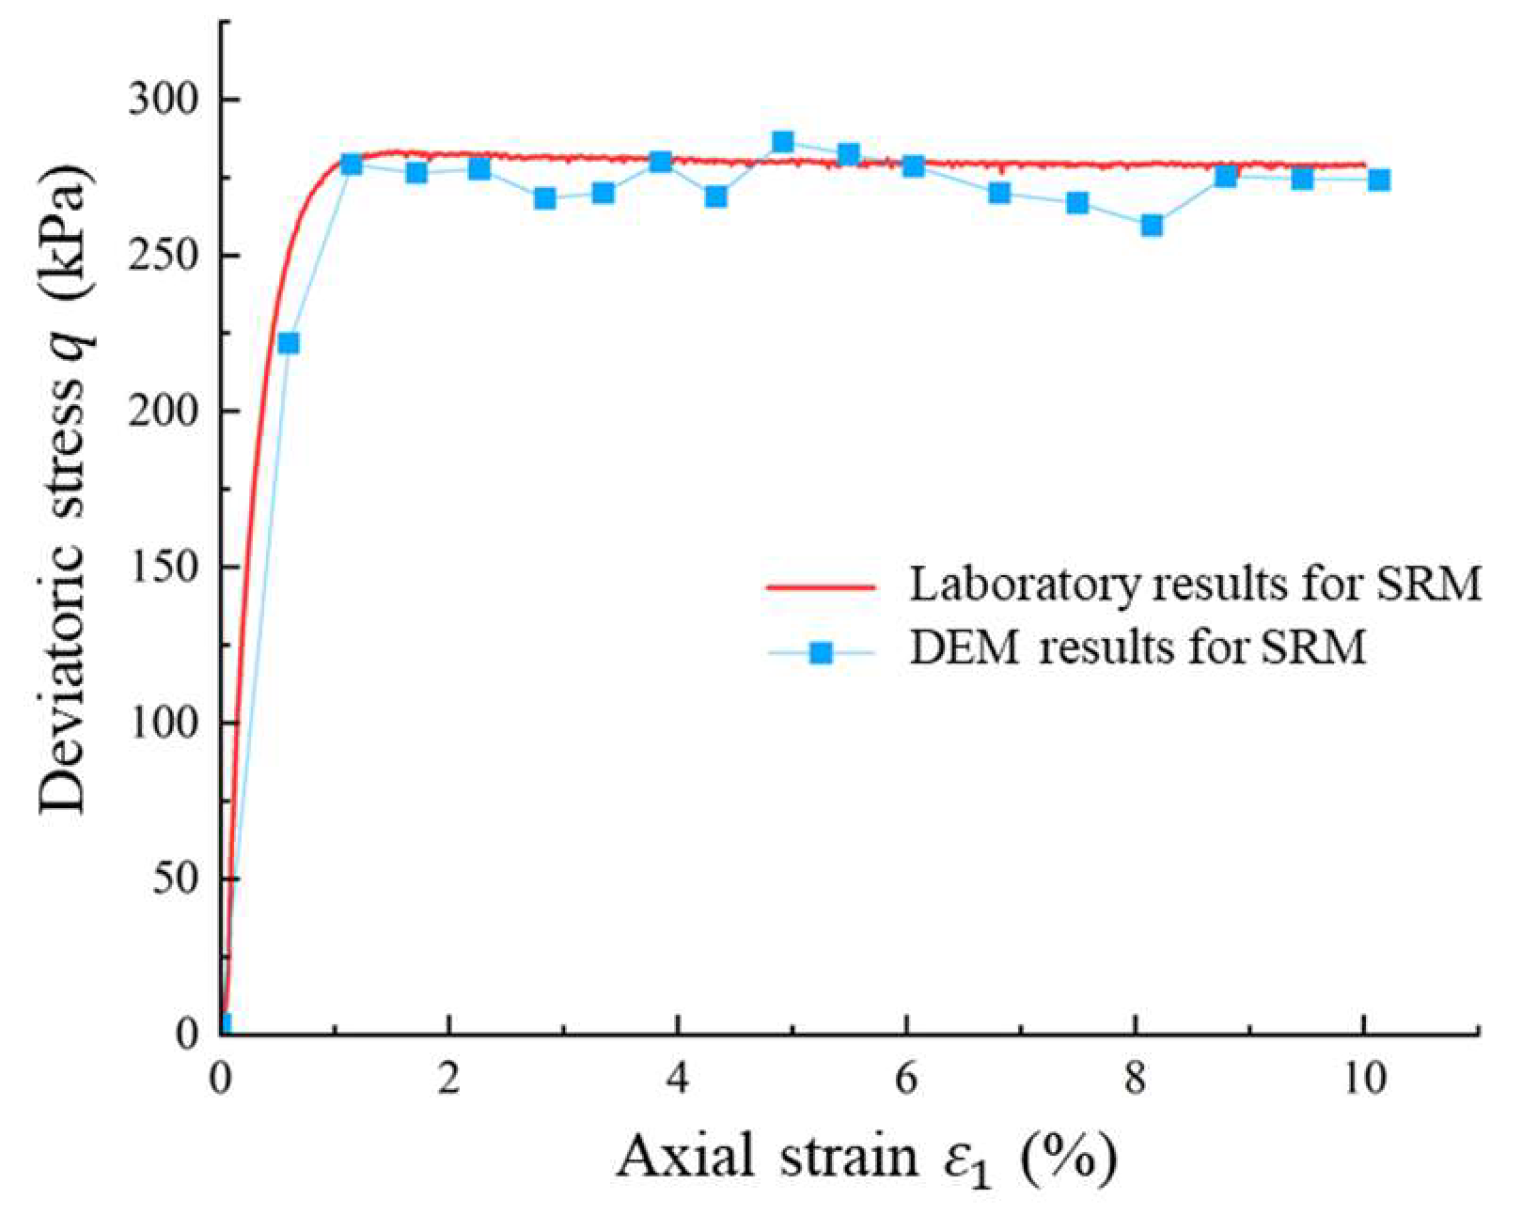
Through systematic analysis of how various mesoscopic parameters at soil–rock interfaces influence the stress–strain curves in numerical simulations of CSRM, coupled with comparative validation against laboratory triaxial test results for CSRM, a set of optimized contact parameters between soil and rock particles can be calibrated. The calibration outcomes are presented in Figure 13, where the maximum deviation of DEM results from laboratory results is 7.2%. By integrating these with the previously calibrated soil–soil contact parameters obtained from DEM simulations of the clay sample, we ultimately established a complete set of mesoscopic parameters for the contact models in CSRM numerical specimens. The calibrated parameters for soil and rock particles are summarized in Table 3.

4.3. Discussion

This study presents a detailed calibration framework for cohesive soil–rock mixtures (CSRM) and systematically analyzes the influence of mesoscopic contact parameters on the macroscopic stress–strain behavior of both pure clay and the composite material. Parametric analyses provide valuable insights into the distinct roles of different contact types. For the CSRM specimen with a 30% rock content, which forms a “rock-floating” skeleton, the initial tangent modulus is almost exclusively governed by the properties of the soil–soil contacts. This finding underscores the dominant role of the fine-grained matrix in controlling the initial elastic deformation of such mixtures. In contrast, the parameters of the soil–rock contacts, particularly the normal bond strength and friction coefficient, become influential during the plastic deformation stage, affecting the development of shear strength. This highlights a critical mechanical transition where the load-bearing structure evolves to more significantly engage the rock inclusions as strain accumulates.
However, it is important to acknowledge the limitations of the current study, which also pave the way for future research. Firstly, the DEM simulations were conducted in two dimensions for computational efficiency. While 2D models provide valuable qualitative trends and mechanistic insights, they cannot fully capture complex 3D phenomena such as intricate particle interlocking, out-of-plane force chain buckling, and tortuous failure surfaces. Secondly, the findings are based on a single rock content of 30%. As demonstrated by previous research [32], the internal granular structure of SRMs—and consequently the dominant contact types—evolves significantly with rock content. When the rock content is below 30%, the contacts between fined-grained soil particles play a dominant role. As rock content increases up to 70%, the granular structure is mainly composed of interactions between soil and rock particles. And after the rock content exceeds 70%, the contacts between rock particles become the main parts. The calibrated parameters herein are most applicable to CSRM with a rock-floating skeleton (typically lower than 30% rock content). Further investigation is required to validate the results for higher rock contents, where rock–rock contacts can no longer be neglected.
Furthermore, it should also be pointed out that the laboratory undrained triaxial tests only focus on a single confining pressure of 200 kPa for both clay and CSRM samples. Therefore, the direct transferability of the calibrated parameters to different stress states requires further verification through additional laboratory tests under a range of confining pressures. Despite these limitations, the qualitative analysis, especially regarding the influence of bonding strength at cohesive contacts, provides a robust foundation for modeling CSRM across various conditions.
Despite the limitations above, the parametric analyses and calibration on the mesoscopic contact parameters effect within CSRM in this study provide valuable insights into the meso-structure characteristics governing the macroscopic mechanical behavior, which can be extended to complex loading conditions. This may also help researchers to further model large-scale in situ cases and understand the mesoscopic mechanism of some geological disasters relating to CSRM, such as landslides, dam failure, or foundation damage.
Future work should aim to extend this parametric analysis to 3D simulations and incorporate a wider range of rock contents, confining pressures, or rock spatial distribution. Moreover, it would be beneficial to conduct a robust calibration on the mesoscopic parameters not only by means of trial-and-error method, but also through more efficient methods such as the cross-entropy method (CEM), differential evolution (DE), moth–flame optimization (MFO) and salp swarm optimization (SSO) algorithm [43].

5. Conclusions

Based on laboratory consolidated undrained triaxial tests of cohesive soil–rock mixtures (CSRM) and their fine-grained clay components, this study utilized 2D discrete elements to investigate the influence of contact parameters between soil particles and between soil and rock particles on the stress–strain curves of clay and CSRM specimens. Subsequently, the mesoscopic parameters for CSRM were further calibrated. The concluding marks are as follows:
(1)
A different set of contact models, which assign separate mechanical properties to soil–soil and soil–rock contacts, is essential for realistically capturing the complex behavior of CSRM in DEM simulations.
(2)
For the pure clay matrix, contact stiffness and the friction coefficient were found to govern the initial tangent modulus, peak stress, and residual strength. In contrast, the bond strength parameters (normal and shear) primarily influenced the peak and residual strengths without affecting the initial stiffness, confirming their role in defining the material’s cohesive strength. A reliable set of mesoscopic parameters for the clay matrix was successfully calibrated against experimental data.
(3)
In the CSRM model with a 30% rock content, the initial tangent modulus was predominantly controlled by the pre-calibrated soil–soil contact parameters. The soil–rock contact parameters had a negligible effect on the initial elastic response but became significant in the plastic stage. Specifically, the normal bond strength and friction coefficient at the soil–rock interface played a crucial role in the development of shear stress post-yield. An interesting threshold effect was observed where, beyond a certain value, further increases in soil–rock bond strength did not alter the stress–strain curve, indicating a limit to its contribution in this particular granular structure.
By successfully calibrating the grouped contact model, this research provides a validated set of mesoscopic parameters and a systematic framework for future DEM simulations of CSRM, thereby enhancing the capability of numerical methods to analyze and predict the behavior of these complex geomaterials in engineering practice.

Author Contributions

Software, M.D.; Investigation, Y.H. and F.Y.; Writing—original draft, Y.H. and M.D.; Supervision, W.L. and L.Z. All authors have read and agreed to the published version of the manuscript.

Funding

This research was funded by the National Natural Science Foundation of China (Grant Number: 51878668) and the Science and Technology Project of Jiangxi Provincial Department of Transportation (Grant Number: 2019C0011). The APC was funded by the Science and Technology Project of Jiangxi Provincial Department of Transportation (Grant Number: 2019C0011).

Institutional Review Board Statement

Not applicable.

Informed Consent Statement

Not applicable.

Data Availability Statement

The original contributions presented in this study are included in the article. Further inquiries can be directed to the corresponding author.

Conflicts of Interest

Authors Yong Huang and Fei Yao were employed by the company Jiangxi Port and Navigation Construction Investment Group Co., Ltd. The remaining authors declare that the research was conducted in the absence of any commercial or financial relationships that could be construed as a potential conflict of interest.

References

  1. Xu, W.J.; Hu, R.L.; Yue, Z.Q.; Tan, R.J. Genesis and stability of the Zhoujiawan landslide, Three Gorges, China. Bull. Eng. Geol. Environ. 2009, 68, 47–54. [Google Scholar] [CrossRef]
  2. Geertsema, M.; Clague, J.J.; Schwab, J.W.; Evans, S.G. An overview of recent large catastrophic landslides in northern British Columbia, Canada. Eng. Geol. 2006, 83, 120–143. [Google Scholar] [CrossRef]
  3. Gao, W.; Hu, R.; Oyediran, I.A.; Li, Z.; Zhang, X. Geomechanical characterization of Zhangmu soil-rock mixture deposit. Geotech. Geol. Eng. 2014, 32, 1329–1338. [Google Scholar] [CrossRef]
  4. Xu, W.J.; Zhang, H.Y. Research on the effect of rock content and sample size on the strength behavior of soil-rock mixture. Bull. Eng. Geol. Environ. 2021, 80, 2715–2726. [Google Scholar] [CrossRef]
  5. Zhao, Y.; Liu, Z. Study of Material Composition Effects on the Mechanical Properties of Soil-Rock Mixtures. Adv. Civ. Eng. 2018, 2018, 3854727. [Google Scholar] [CrossRef]
  6. Qian, J.; Yao, Y.; Li, J.; Xiao, H.; Luo, S. Resilient properties of soil-rock mixture materials: Preliminary investigation of the effect of composition and structure. Materials 2020, 13, 1658. [Google Scholar] [CrossRef]
  7. Zhang, H.Y.; Xu, W.J.; Yu, Y.Z. Triaxial tests of soil–rock mixtures with different rock block distributions. Soils Found. 2016, 56, 44–56. [Google Scholar] [CrossRef]
  8. Zhong, W.; Liu, H.; Gu, D.; Zhang, W.; Yang, C.; Gao, X. Development of a preparation method of transparent soil-rock mixture for geotechnical laboratory modeling. Eng. Geol. 2022, 301, 106622. [Google Scholar] [CrossRef]
  9. Wang, Y.; Li, X.; Zheng, B.; Li, S.D.; Duan, Y.T. A laboratory study of the effect of confining pressure on permeable property in soil-rock mixture. Environ. Earth Sci. 2016, 75, 284. [Google Scholar] [CrossRef]
  10. Cundall, P.A.; Strack, O.D.L. A discrete numerical model for granular assemblies. Géotechnique 1979, 29, 47–65. [Google Scholar] [CrossRef]
  11. Thornton, C. Numerical simulations of deviatoric shear deformation of granular media. Géotechnique 2000, 50, 43–53. [Google Scholar] [CrossRef]
  12. Sitharam, T.G.; Dinesh, S.V.; Shimizu, N. Micromechanical modelling of monotonic drained and undrained shear behaviour of granular media using three-dimensional DEM. Int. J. Numer. Anal. Methods Geomech. 2002, 26, 1167–1189. [Google Scholar] [CrossRef]
  13. Gu, X.; Huang, M.; Qian, J. DEM investigation on the evolution of microstructure in granular soils under shearing. Granul. Matter 2014, 16, 91–106. [Google Scholar] [CrossRef]
  14. Gong, J.; Nie, Z.; Zhu, Y.; Liang, Z.; Wang, X. Exploring the effects of particle shape and content of fines on the shear behavior of sand-fines mixtures via the DEM. Comput. Geotech. 2019, 106, 161–176. [Google Scholar] [CrossRef]
  15. Zhao, L.; Deng, M.; Zhang, S.; Huang, D.; Qiao, N.; Gong, J. Effects of particle shape on triaxial compression behaviours of realistic ballast particles based on MAVL particle shape evaluation system. Granul. Matter 2023, 25, 4. [Google Scholar] [CrossRef]
  16. Wang, Y.; Zhao, M.; Li, S.; Wang, J.G. Stochastic structural model of rock and soil aggregates by continuum-based discrete element method. Sci. China Ser. E Eng. Mater. Sci. 2005, 48, 95–106. [Google Scholar] [CrossRef]
  17. Liu, Z.; Zhou, N.; Zhang, J. Random gravel model and particle flow based numerical biaxial test of solid backfill materials. Int. J. Min. Sci. Technol. 2013, 23, 463–467. [Google Scholar] [CrossRef]
  18. Yao, Y.; Li, J.; Ni, J.; Liang, C.; Zhang, A. Effects of gravel content and shape on shear behaviour of soil-rock mixture: Experiment and DEM modelling. Comput. Geotech. 2022, 141, 104476. [Google Scholar] [CrossRef]
  19. Chen, L.; Yang, Y.T.; Zheng, H. Numerical study of soil-rock mixture: Generation of random aggregate structure. Sci. China Technol. Sci. 2018, 61, 359–369. [Google Scholar] [CrossRef]
  20. Jin, L.; Zeng, Y.; Xia, L.; Ye, Y. Experimental and numerical investigation of mechanical behaviors of cemented soil–rock mixture. Geotech. Geol. Eng. 2017, 35, 337–354. [Google Scholar] [CrossRef]
  21. Potyondy, D.O.; Cundall, P.A. A bonded-particle model for rock. Int. J. Rock Mech. Min. Sci. 2004, 41, 1329–1364. [Google Scholar] [CrossRef]
  22. Belheine, N.; Plassiard, J.P.; Donzé, F.V.; Darve, F.; Seridi, A. Numerical simulation of drained triaxial test using 3D discrete element modeling. Comput. Geotech. 2009, 36, 320–331. [Google Scholar] [CrossRef]
  23. Fakhimi, A. Application of slightly overlapped circular particles assembly in numerical simulation of rocks with high friction angles. Eng. Geol. 2004, 74, 129–138. [Google Scholar] [CrossRef]
  24. Salazar, A.; Sáez, E.; Pardo, G. Modeling the direct shear test of a coarse sand using the 3D Discrete Element Method with a rolling friction model. Comput. Geotech. 2015, 67, 83–93. [Google Scholar] [CrossRef]
  25. Nguyen, D.; Chen, Y.; Martinez, A. A DEM sensitivity study on the effects of contact parameters on triaxial response for the development of a calibration method. Comput. Geotech. 2025, 184, 107241. [Google Scholar] [CrossRef]
  26. Momeni, A.; Eshiet, K.I.-I.I.; Sheng, Y. The sensitivity of micro—Macro mechanical behaviour of sand to the inter-particle properties. Geotechnics 2023, 3, 416–445. [Google Scholar] [CrossRef]
  27. Hazzar, L.; Nuth, M.; Chekired, M. DEM simulation of drained triaxial tests for glass-beads. Powder Technol. 2020, 364, 123–134. [Google Scholar] [CrossRef]
  28. Cheng, K.; Wang, Y.; Yang, Q.; Mo, Y.; Guo, Y. Determination of microscopic parameters of quartz sand through tri-axial test using the discrete element method. Comput. Geotech. 2017, 92, 22–40. [Google Scholar] [CrossRef]
  29. Yan, Y.; Chang, D.; Liu, J.; Xu, A.; Feng, L. Multiscale mechanical analysis of Frozen Clay: Triaxial testing and discrete element modeling. Cold Reg. Sci. Technol. 2024, 224, 104250. [Google Scholar] [CrossRef]
  30. Wu, M.; Zhou, F.; Wang, J. DEM modeling of mini-triaxial test on soil-rock mixture considering particle shape effect. Comput. Geotech. 2023, 153, 105110. [Google Scholar] [CrossRef]
  31. Hu, Y.; Lu, Y. A novel framework for calibrating DEM parameters: A case study of sand and soil-rock mixture. Comput. Geotech. 2024, 174, 106619. [Google Scholar] [CrossRef]
  32. Jiang, C.; Zeng, L.; Liu, Y.; Mu, Y.; Dong, W. A DEM Study on the Macro-and Micro-Mechanical Characteristics of an Irregularly Shaped Soil–Rock Mixture Based on the Analysis of the Contact Force Skeleton. Appl. Sci. 2025, 15, 7978. [Google Scholar] [CrossRef]
  33. Ovalle, C.; Dano, C. Effects of particle size–strength and size–shape correlations on parallel grading scaling. Géotech. Lett. 2020, 10, 191–197. [Google Scholar] [CrossRef]
  34. Xu, W.J.; Xu, Q.; Hu, R.L. Study on the shear strength of soil–rock mixture by large scale direct shear test. Int. J. Rock Mech. Min. Sci. 2011, 48, 1235–1247. [Google Scholar] [CrossRef]
  35. Paixão, A.; Resende, R.; Fortunato, E. Photogrammetry for digital reconstruction of railway ballast particles–A cost-efficient method. Constr. Build. Mater. 2018, 191, 963–976. [Google Scholar] [CrossRef]
  36. Zhao, L.; Zhang, S.; Deng, M.; Wang, X. Statistical analysis and comparative study of multi-scale 2D and 3D shape features for unbound granular geomaterials. Transp. Geotech. 2021, 26, 100377. [Google Scholar] [CrossRef]
  37. Asahina, D.; Taylor, M.A. Geometry of irregular particles: Direct surface measurements by 3-D laser scanner. Powder Technol. 2011, 213, 70–78. [Google Scholar] [CrossRef]
  38. Zhou, B.; Wang, J.; Zhao, B. Micromorphology characterization and reconstruction of sand particles using micro X-Ray tomography and spherical harmonics. Eng. Geol. 2015, 184, 126–137. [Google Scholar] [CrossRef]
  39. Itasca Consulting Group. Particle Flow Code in Two Dimensions: User’s Manual; Version 5.0; Itasca Consulting Group: Minneapolis, MN, USA, 2015. [Google Scholar]
  40. Jensen, R.P.; Bosscher, P.J.; Plesha, M.E.; Edil, T.B. DEM simulation of granular media—Structure interface: Effects of surface roughness and particle shape. Int. J. Numer. Anal. Methods Geomech. 1999, 23, 531–547. [Google Scholar] [CrossRef]
  41. Shafipour, R.; Soroush, A. Fluid coupled-DEM modelling of undrained behavior of granular media. Comput. Geotech. 2008, 35, 673–685. [Google Scholar] [CrossRef]
  42. Keishing, J.; Hanley, K.J. Improving constant-volume simulations of undrained behaviour in DEM. Acta Geotech. 2020, 15, 2545–2558. [Google Scholar] [CrossRef]
  43. Wang, M.; Lu, Z.; Zhao, Y.; Wan, W. Calibrating microparameters of DEM models by using CEM, DE, EFO, MFO, SSO algorithms and the optimal hyperparameters. Comput. Part. Mech. 2024, 11, 839–852. [Google Scholar] [CrossRef]
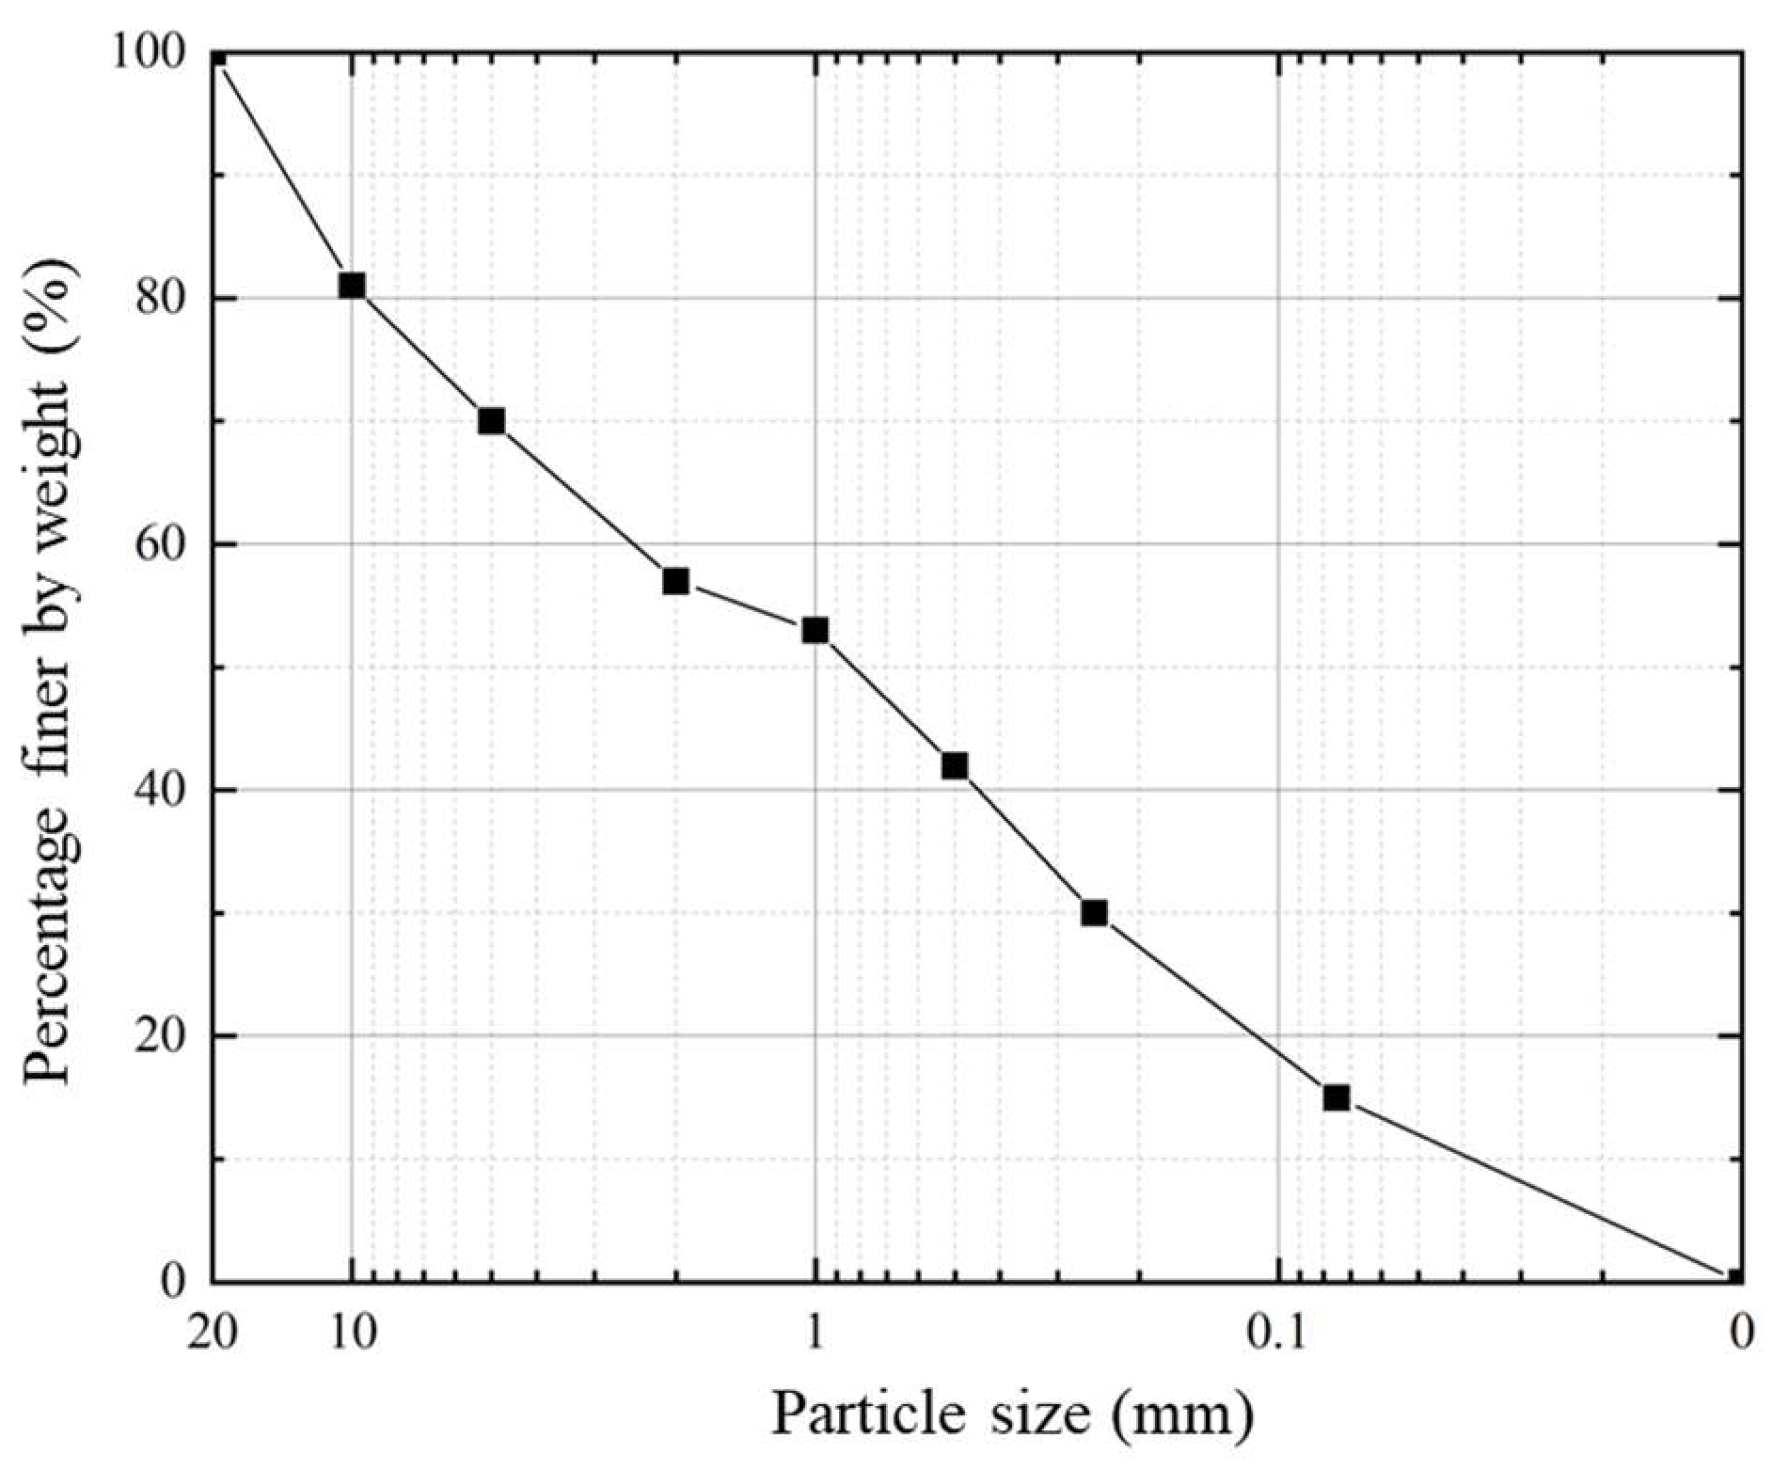
Figure 1. Grain gradation curve of soil–rock mixture.
Applsci 15 10529 g001
Figure 2. Basic theory of the linear contact bond model.
Applsci 15 10529 g002
Figure 3. Schematic diagram of the workflow obtaining the realistic 2D contour of the rock block: (a) the photogrammetry framework; (b) camera photos; (c) sparse point cloud; (d) dense point cloud; (e) triangular mesh; (f) projected 2D contours of the realistic rock blocks.
Applsci 15 10529 g003
Figure 4. Numerical model for (a) clay; (b) cohesive soil–rock mixture.
Applsci 15 10529 g004
Figure 5. Schematic diagram of the basic theory of the constant volume method.
Applsci 15 10529 g005
Figure 6. The stress–strain curve of clay samples with different contact stiffness between soil particles: (a) normal contact stiffness; (b) tangential contact stiffness.
Applsci 15 10529 g006
Figure 7. The stress–strain curve of clay samples with different bond strength between soil particles: (a) normal bond strength; (b) tangential bond strength.
Applsci 15 10529 g007
Figure 8. The stress–strain curve of clay samples with different friction coefficients between soil particles.
Applsci 15 10529 g008
Figure 9. Comparison between laboratory results and DEM results for silty clay.
Applsci 15 10529 g009
Figure 10. The stress–strain curve of soil–rock mixture samples with different contact stiffness between soil and rock particles: (a) normal contact stiffness; (b) tangential contact stiffness.
Applsci 15 10529 g010
Figure 11. The stress–strain curve of soil–rock mixture samples with different bond strength between soil and rock particles: (a) normal bond strength; (b) tangential bond strength.
Applsci 15 10529 g011
Figure 12. The stress–strain curve of soil–rock mixture samples with different friction coefficient between soil and rock particles.
Applsci 15 10529 g012
Figure 13. Comparison between laboratory results and DEM results for CSRM.
Applsci 15 10529 g013
Table 1. Basic soil properties of fine grain in soil–rock mixture.
Parameter NameValue
Specific gravity, G s 2.61
Liquid limit, ω L (%)24.87
Plastic limit, ω P (%)13.70
Plastic index, I P (%)11.17
Table 2. The calibration values of mesoscopic contact parameters between soil particles.
Parameter NameValue
Normal contact stiffness, k n , S S (N/m)1.5 × 107
Tangential contact stiffness, k s , S S (N/m)2 × 107
Normal tensile bond strength, T F , S S (N)5 × 10²
Shear bond strength, S F , S S (N)3.3 × 10²
Friction coefficient, μ S S 0.3
Table 3. The calibration values of contact parameters for soil and rock particles.
Parameter NameValue
Normal contact stiffness, k n , S R (N/m)5 × 108
Tangential contact stiffness, k s , S R (N/m)5 × 107
Normal tensile bond strength, T F , S R (N)8 × 10³
Shear bond strength, S F , S R (N)5 × 10³
Friction coefficient, μ S R 0.3
Disclaimer/Publisher’s Note: The statements, opinions and data contained in all publications are solely those of the individual author(s) and contributor(s) and not of MDPI and/or the editor(s). MDPI and/or the editor(s) disclaim responsibility for any injury to people or property resulting from any ideas, methods, instructions or products referred to in the content.