Abstract
This study aimed to develop a non-contact, marker-less machine learning model to estimate forearm pronation–supination angles using 2D hand landmarks derived from MediaPipe Hands, with inertial measurement unit sensor angles used as reference values. Twenty healthy adults were recorded under two camera conditions: medial (in-camera) and lateral (out-camera) viewpoints. Five regression models were trained and evaluated: Linear Regression, ElasticNet, Support Vector machine (SVM), Random Forest, and Light Gradient Boosting Machine (LightGBM). Among them, LightGBM achieved the highest accuracy, with a mean absolute error of 5.61° in the in-camera setting and 4.65° in the out-camera setting. The corresponding R2 values were 0.973 and 0.976, respectively. The SHAP analysis identified geometric variations in the palmar triangle as the primary contributors, whereas elbow joint landmarks had a limited effect on model predictions. These results suggest that forearm rotational angles can be reliably estimated from 2D images, with an accuracy comparable to that of conventional goniometers. This technique offers a promising alternative for functional evaluation in clinical settings without requiring physical contact or markers and may facilitate real-time assessment in remote rehabilitation or outpatient care.
1. Introduction
Forearm pronation and supination are essential movements required for various activities of daily living, including hygiene, writing, dressing, surgery, and sports-specific actions [1,2]. Distal radius fractures are among the most common upper extremity injuries, and postoperative limitations in forearm rotation can significantly hinder daily functions, further emphasizing the importance of accurate functional assessment [3]. Accordingly, the clinical evaluation of forearm rotational capacity is of great significance.
Forearm rotation is a complex motion involving the relative movement of the radius around the ulna, mediated by the coordinated actions of the proximal radioulnar joint (PRUJ) and distal radioulnar joint (DRUJ). Although the radius rotates around the ulna, wrist movement is involved in the process [4,5,6]. Recent studies have shown that the rotational center of the DRUJ shifts during motion [7], and the radial head changes its position within the PRUJ [8], indicating that forearm rotation is not a simple axial movement. Furthermore, two evaluation concepts exist: “functional rotation,” which considers wrist contribution, and “anatomical rotation,” which isolates rotation at the DRUJ [9]. Although the functional rotation is more practical, the wrist can contribute up to 40° of rotation [10], making anatomical assessment more appropriate when evaluating pure forearm rotation.
Traditionally, forearm rotation angles have been assessed via visual inspection [11] or use of universal goniometers [12]. Although universal goniometers are simple and cost-effective, they are prone to inter-rater variability and are affected by posture, which limits their reliability, especially for complex rotational movements such as pronation and supination [13]. Modified finger goniometers have demonstrated higher reliability [14] but real-time dynamic assessment remains difficult. Recently, inertial measurement units (IMUs), comprising accelerometers, gyroscopes, and magnetometers, have gained attention for quantifying joint motion in three-dimensional space [15]. IMUs have proven useful for evaluating the range of motion (ROM) in joints such as the knee [16] and shoulder [17,18,19]. However, accurate placement requires anatomical referencing and the setup can be time-consuming, limiting its daily clinical use [20]. Furthermore, measurement errors can result from environmental factors such as magnetic interference and surrounding metallic objects [21].
Therefore, MediaPipe Hands, developed by Google, has emerged as a promising framework that detects 21 hand landmarks in real-time using only RGB camera inputs [22]. This technology is accessible via smartphones or laptop cameras and enables joint position estimation without requiring specialized hardware. However, studies have shown that the accuracy of ROM assessments remains suboptimal [23]. Additionally, the z-axis output of MediaPipe only approximates the relative depth from the camera and does not provide absolute 3D positional data [24,25], thus limiting its utility for precise motion analysis.
To address these limitations, recent studies have used MediaPipe and machine learning to estimate the shoulder and thumb radial abduction angles, yielding promising results [26,27]. However, this modality relies on static goniometric measurements, and its application to dynamic or rotational motions such as forearm pronation and supination remains scarce. One study by Ehara et al. [28] demonstrated a machine learning-based approach using MediaPipe and IMU sensors to estimate thumb motion, suggesting that similar methods may be effective for forearm rotation.
Therefore, we hypothesized that a noncontact, markerless AI model that synchronizes 2D hand landmarks obtained from MediaPipe with IMU-based reference angles can accurately estimate the forearm pronation–supination angles in real time. The present study aimed to develop and validate this model for the continuous assessment of forearm rotation. This approach seeks to enable the quantitative assessment of complex rotational motion in a simple and contactless manner, potentially offering wide applicability in clinical practice and remote rehabilitation.
2. Materials and Methods
2.1. Participants
The inclusion criteria were healthy adults with no history of elbow or wrist-joint trauma. The exclusion criteria were individuals with a history of trauma or surgery, deformity, or limited ROM due to rheumatism or other causes, and those who refused to participate. Participants were recruited at Kobe University Hospital and related laboratory settings between February and June 2025. Based on previous in vivo studies on forearm pronation and supination, sample sizes of 10–18 participants have commonly been used [6,7,10,14]. Ehara et al. [28], whose study design closely resembled the present study, reported a correlation coefficient of r = 0.85 using 18 participants in a machine learning-based angle estimation study. Considering these precedents and to account for potential bias and variability in measurement conditions, we conservatively set the effect size to r = 0.70 and conducted an a priori power analysis using G*Power 3.1 (two-tailed correlation, α = 0.05, power = 0.95), which indicated a required sample size of 20 participants.
To minimize bias due to physical constitution and sex, we stratified the participants along two axes: sex (male/female) and body mass index (BMI), according to the Japan Society for the Study of Obesity classification [29] (normal: BMI < 25, elevated: BMI ≥ 25). Five participants were recruited from each of the four strata (2 sexes × 2 BMI categories), yielding a total of 20 participants. All the participants were right-handed. The age range of the participants was 30–55 years. The mean body weight and age of the 10 male participants were 69.7 ± 7.76 kg and 39.2 ± 6.42 years, respectively. For the 10 female participants, these values were 59.1 ± 8.13 kg and 38.5 ± 7.13 years, respectively. Sex, age, and hand dominance were recorded for all participants who fully understood the study protocol and were actively engaged in performing the required gestures. Detailed demographic characteristics are summarized in Table 1.

Table 1.
Participant demographics.
This study was approved by the Institutional Review Board of Kobe University (approval no. B210009), and written informed consent was obtained from all the participants.
2.2. IMU Sensor
To provide reference angles (“ground truth”) for forearm pronation and supination, we used a nine-axis IMU sensor (WT901BLECL, WitMotion, Shenzhen, China) equipped with Bluetooth 5.0. This device includes a Kalman-filtered dynamic calibration system and offers high precision in angular measurements, with accuracies of ±0.2° for the X and Y axes and ±1.0° for the Z axis (heading). Additionally, it includes accelerometers (±16 g), gyroscopes (±2000°/s), and magnetometers (±2 Gauss), and supports real-time transmission at up to 200 Hz via Bluetooth.
In this study, we used the roll angle (x-axis rotation), which corresponds to forearm pronation–supination, as the reference value. Data were sampled at 100 Hz and transmitted via Bluetooth to a laptop (Surface Pro 8; Microsoft Corporation, Redmond, WA, USA) synchronized with RGB video recordings from a webcam. Before data collection, magnetic field calibration and zero-point adjustments were performed according to the manufacturer’s protocol. Under dynamic conditions, this configuration allowed for a rotational measurement accuracy within ±0.2° for the d-axis (roll) direction.
A static validation study was conducted to validate the accuracy of the IMU sensor (WT901BLECL). The IMU was affixed to the movable arm of a commercial goniometer (±1° accuracy), and roll angles were recorded at 0°, 15°, 30°, 60°, and 90°. Three measurements were taken at each angle, and the mean absolute error (MAE) across all angles was 0.62 ± 0.43°, thus confirming the reliability of the IMU output.
Furthermore, to verify the suitability of the IMU data as the ground truth for machine learning, we conducted an additional validation experiment including four healthy adult participants. Four participants were selected from the original 20 study participants, with one individual randomly chosen from each of the four strata defined by sex (male/female) and BMI (<25/≥25) to maintain balance. The participants held static forearm positions at 0°, 30°, 60°, and 90° in pronation and supination, and the corresponding roll angles were recorded using an IMU. Simultaneously, two orthopedic surgeons independently measured the angles using a universal goniometer following the method of Colaris et al. [12]. Thereafter, we calculated the MAE and standard deviation between the IMU and goniometer readings to confirm the validity of the IMU as a ground-truth measurement.
2.3. Measurement Protocol
The IMU sensor (WitMotion WT901BLECL) was affixed to a relatively flat skin surface located radially to the ulnar styloid on the dorsal aspect of the wrist. To ensure firm attachment and minimize motion artifacts, the sensor was applied using strong double-sided tape and further reinforced with additional fixation tape (Figure 1).
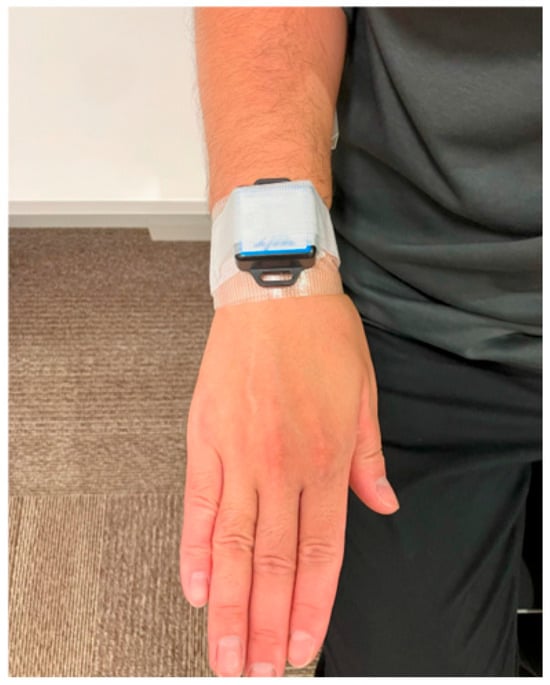
Figure 1.
Placement of the IMU sensor on the distal forearm. The IMU sensor was affixed to the relatively flat skin surface radial to the ulnar styloid using double-sided tape and reinforced with a fixation tape to minimize movement artifacts.
The participants were seated comfortably with both upper limbs relaxed on their sides. The right elbow was flexed to 90°, and the distal forearm was supported on an adjustable platform to maintain a stable and consistent elbow angle. The platform height was customized for each individual to ensure consistent positioning. Participants were instructed to perform forearm rotations while keeping their upper arm in contact with the torso throughout the movement.
Measurements were focused on the right forearm. The participants were asked to perform active forearm pronation and supination from a neutral position to maximal pronation, then to maximal supination, and back to a neutral position (Figure 2).
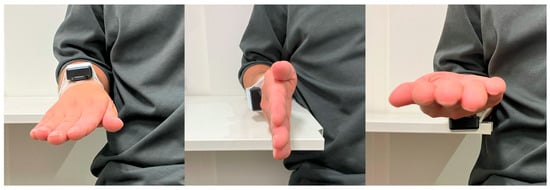
Figure 2.
Measurement posture and forearm pronation/supination task. Participants sat with the right elbow flexed to 90°, resting on an adjustable support platform to stabilize the distal forearm. Active forearm pronation and supination were performed from the neutral position.
A tablet device (Surface Pro 8; Microsoft Corporation, Redmond, WA, USA) with a built-in webcam was used to record hand movements. The videos were captured at 1080p resolution and 30 frames per second (fps) by a designated operator. Two camera settings were used for each participant (Figure 3):
- In-camera: Positioned 30° to the participant’s left front side, 100 cm from the body, and 50 cm above the floor
- Out-camera: Positioned 30° to the participant’s right front side, under the same distance and height conditions
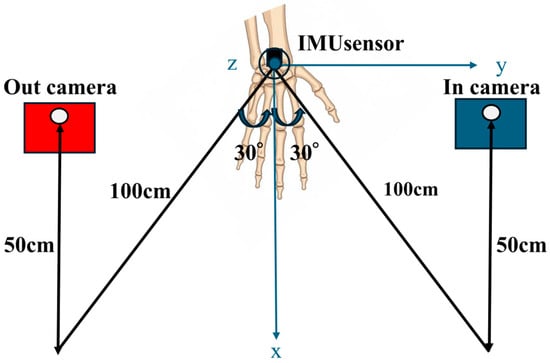
Figure 3.
Camera setup during video capture. Two cameras were positioned at 30° angles in front of the participant: (1) in-camera: left front side, 100 cm distance, 50 cm height and (2) out-camera: right front side, same conditions. Both angles were recorded to capture hand motion from multiple perspectives.
Each participant performed a complete motion cycle consisting of neutral → maximal pronation → neutral → maximal supination → neutral, synchronized with a metronome. This cycle lasted 10 s and was repeated three times. Both the video and IMU data were synchronously recorded on the same laptop. The synchronization was achieved by using the internal clock of the computer, which recorded the timestamp when the IMU sensor data were received and when the webcam captured each video frame. Data with identical timestamps were paired and used for subsequent analyses.
2.4. MediaPipe-Based Data Acquisition and Image Processing
Using the MediaPipe Hands library (Google, v0.10.21) [22], the x, y, and z coordinates of the hand and elbow joint landmarks were extracted from the recorded videos. The x and y values represent the horizontal and vertical screen positions, respectively, whereas the z value approximates the depth (i.e., distance from the camera). Smaller z values indicate proximity to the camera. In this study, z values were not used directly as features but were normalized against hand size in the x–y plane to obtain relative, scale-invariant indicators.
Of the 22 landmarks detected by MediaPipe, we selected the following for analysis: elbow, index fingertip, index metacarpophalangeal (MCP) joint, thumb carpometacarpal (CMC) joint, and little finger MCP joint. These landmarks were used to compute the derived parameters such as distances, angles, and triangular areas using vector-based geometric calculations. An overview of the selected landmarks and coordinate extraction is presented in Figure 4.
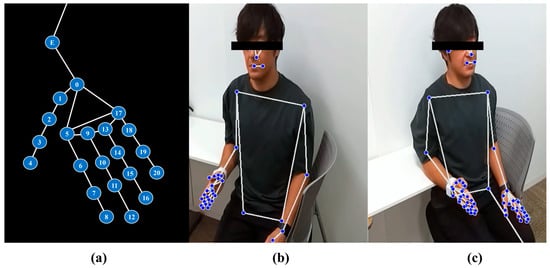
Figure 4.
Overview of landmark detection using the MediaPipe framework. (a) Schematic illustration of the 22 key landmarks used in this study. In addition to the 21 hand landmarks defined in the MediaPipe Hands model, we manually annotated the elbow joint (E) to serve as a proximal reference for forearm-related angle calculations. The hand landmarks correspond to the following anatomical locations: point 0 = wrist; points 1–4 = thumb joints (CMC, MCP, IP, and tip); points 5–8 = index finger joints; points 9–12 = middle finger joints; points 13–16 = ring finger joints; and points 17–20 = little finger joints. Each finger includes four landmarks representing MCP, PIP, DIP, and fingertip positions. Point E denotes the elbow joint. (b) In-camera view showing the participant’s upper body and right hand with MediaPipe Holistic landmark overlay. (c) Out-camera view displaying bilateral hand and upper-body landmarks extracted with the same framework.
2.5. Parameters
Using the joint coordinates extracted from MediaPipe, we defined several geometric parameters for use as input features in model training. These parameters include the distances between specific landmarks, angles formed by the vectors connecting them, and areas of defined triangular regions. A summary of all the parameters used in the machine learning models is provided in Table 2.

Table 2.
Parameters used for training of the machine learning models.
True angle: the value of the rotation angle measured using an IMU sensor. norm_palm_width: the value of the distance from point ⑤ to point ⑰ divided by the distance from point ⑤ to point ⑧. norm_palm_dist: the value of the distance from point ⑤ to point ⓪ divided by the distance from point ⑤ to point ⑧. forarm_angle: the angle formed by points ⑤, ⓪, and E.
rad_palm_angle: the angle formed by points ⓪, ⑤, and ⑰. ulnar_palm_angle: the angle formed by points ⑰, ⓪, and ⑤.
palm_angle: the angle formed by points ⓪, ⑰, and ⑤. norm_rad_size: the magnitude of the cross product of the vector from point ⑤ to point ⑰ and the vector from point ⑤ to point ⓪, divided by the square of the distance from point ⑤ to point ⑧. norm_ulnar_size: the magnitude of the cross product of the vector from point ⑰ to point ⓪ and the vector from point ⑰ to point ⑤, divided by the square of the distance from point ⑤ to point ⑧. norm_palm_size: the magnitude of the cross product of the vector from point ⓪ to point ⑤ and the vector from point ⓪ to point ⑰, divided by the square of the distance from point ⑤ to point ⑧.
2.6. Machine Learning and Statistical Analysis
The machine learning analysis workflow used in this study is illustrated in Figure 5.
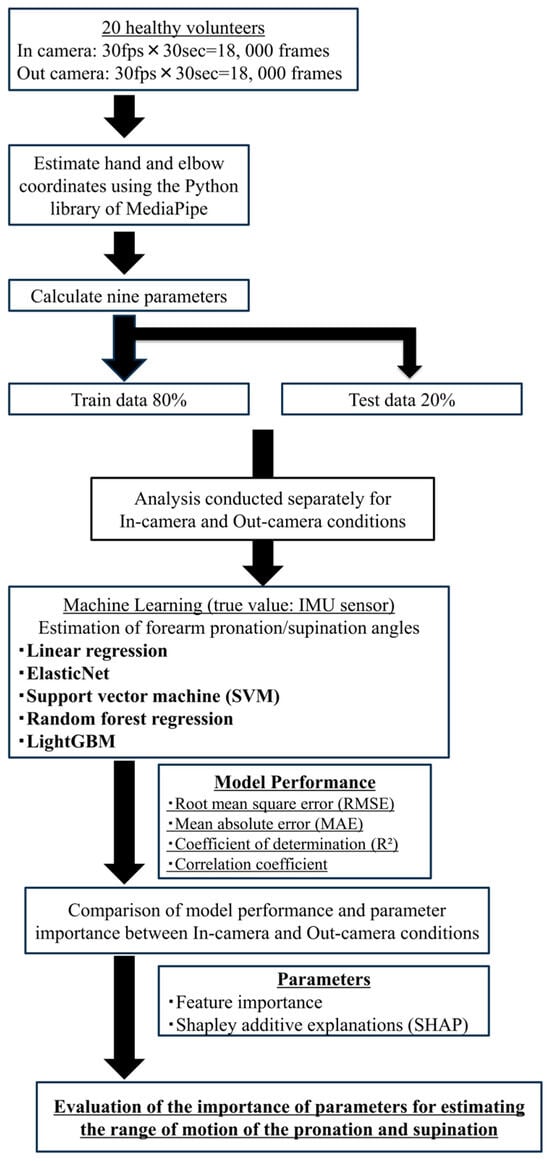
Figure 5.
Workflow of machine learning analysis. Image frames synchronized with IMU sensor data were processed to extract geometric features from hand landmarks using MediaPipe. These features were used to train and evaluate five regression models to estimate forearm rotation angles.
From video recordings of forearm pronation–supination movements in 20 healthy adults, a total of 36,000 frames were extracted. Each frame was synchronized with the IMU sensor data to capture real-time rotational angles, which served as the ground truth for training the regression models.
The dataset was randomly divided into 80% for training and 20% for testing. Based on the 21 hand landmarks extracted via MediaPipe, various image-derived features such as inter-joint distances, angles, and surface areas were computed and used as explanatory variables. The target variable was the rotational angle around the x-axis (roll) obtained from the IMU sensor. All features were standardized using Z-score normalization and frames with missing data were excluded from the analysis.
We implemented five types of regression algorithms to construct and evaluate predictive models, as summarized below [30,31,32]:
- Linear Regression:A fundamental model that assumes a linear relationship between predictors and the target variable. It estimates the coefficients by minimizing the residual sum of squares, offering simplicity and interpretability.
- ElasticNet Regression:A regularized linear regression technique combining L1 (Lasso) and L2 (Ridge) penalties. This allows automatic feature selection while addressing multicollinearity, making it robust in high-dimensional settings.
- Support Vector Machine (SVM):SVM constructs a regression model within a defined error margin and projects data into a higher-dimensional space to capture nonlinearities. It effectively balances complexity and predictive performance.
- Random Forest Regression:An ensemble learning method that aggregates predictions from multiple decision trees trained on bootstrapped datasets with random feature selection. It is robust against overfitting and suitable for nonlinear and hierarchical data patterns.
- LightGBM:Gradient-boosting framework optimized for speed and accuracy. It employs histogram-based learning and exclusive feature bundling, thereby enabling efficient training and high performance on complex large-scale datasets.
All models were developed using Python (v3.10) with the scikit-learn v1.0.2 and lightgbm libraries. Four evaluation metrics were used to assess the model performance:
- Coefficient of determination (R2): Indicates the proportion of variance in the dependent variable explained by the model. Values closer to 1.0 indicate a better fit.
- MAE: The average of absolute differences between predicted and actual values. It is an intuitive and interpretable error metric.
- Root Mean Square Error (RMSE): The square root of the mean of squared errors. It penalizes larger errors more heavily than MAE.
- Correlation coefficient (r): Measures the strength of the linear relationship between predicted and actual values.
Residual plots were generated to visually examine the distribution of prediction errors. The residuals were plotted with ground-truth angles on the x-axis and residuals (predicted–actual) on the y-axis. A residual distribution concentrated near zero was interpreted as evidence of a better model fit.
For the LightGBM model, we analyzed feature contributions using two techniques:
- Feature importance scores, computed from the average gain across all tree splits.
- SHAP (SHapley Additive exPlanations) values [33], a game-theoretic approach for quantifying the impact of each feature on individual predictions.
These analyses helped identify the key features that contributed the most to model accuracy, thereby improving model transparency and offering insights for potential clinical applications.
The overall machine-learning approach, including the use of LightGBM and evaluation metrics, followed the methodology established by Ehara et al. [28].
3. Results
3.1. Validation of Forearm Rotation Angle Using IMU Sensor
To verify the accuracy of the forearm pronation–supination angle measurements obtained using the IMU sensors, we conducted a comparison experiment with a goniometer in four healthy adult participants under static conditions. The overall MAE was 3.02 ± 3.28°, indicating moderate accuracy. By angular position, the smallest error was observed at 90° pronation (MAE = 1.29 ± 0.96°), whereas the error tended to increase in the supination direction, peaking at 90° supination (MAE = 7.13 ± 1.46°). The inter-rater reliability (ICC 2,1) was 0.826, indicating good reproducibility (Table 3).

Table 3.
Accuracy of IMU-based forearm rotation angle measurements compared with goniometer.
3.2. Estimation of Forearm Range of Motion
A total of 36,000 frames (18,000 each from the in-camera and out-camera perspectives) were used for model training, in which nine image-based features (Table 2) were employed to predict the IMU-recorded pronation/supination angles. Five regression models—Linear Regression, Elastic Net, SVM, Random Forest, and LightGBM—were trained using GridSearchCV with five-fold cross-validation; the hyperparameters are summarized in Table 4. The performance metrics for the test data, including the MAE, RMSE, R2, and correlation coefficient, are presented in Table 5 (in-camera) and Table 6 (out-camera).

Table 4.
Summary of Machine-Learning Models and Selected Hyperparameters.

Table 5.
Accuracy of pronation and supination estimation in the in-camera setting for each machine learning model.

Table 6.
Accuracy of pronation and supination estimation in the out-camera setting for each machine learning model.
To ensure alignment with video-derived angles, all IMU-based angle values were adjusted by adding −90° prior to training, thereby converting the IMU axis (defined as 0° at full pronation) into a shared scale of −90° (supination) to +90° (pronation).
Outlier frames were identified as those with residuals greater than the mean + 3SD; these comprised approximately 0.2% of the dataset. When excluded, all performance metrics changed by <0.1°; hence, the values reported in Table 5 and Table 6 include all data.
3.2.1. In-Camera Setting
Under the in-camera condition, LightGBM yielded the best performance, with an MAE of 5.61°, RMSE of 7.64°, and R2 of 0.973. SVM (MAE = 6.25°); Random Forest (MAE = 6.83°) demonstrated strong performance, whereas Linear Regression and ElasticNet underperformed, showing MAEs of approximately 14.25° and R2 values of approximately 0.85.
The residual plots in Figure 6, Figure 7, Figure 8, Figure 9 and Figure 10 illustrate minimal errors between −90° and 0° (i.e., from full pronation to neutral), especially when the hand was centered in the field of view. Feature importance and SHAP analyses (Figure 11) revealed that norm_rad_size and rad_palm_angle were the two most influential features, accounting for 25% and 11% of the overall contribution of the model, respectively.
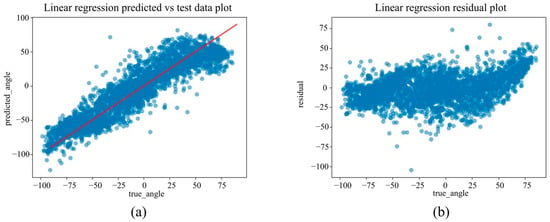
Figure 6.
(a) The actual angles from the test data for forearm pronation–supination in the in-camera setting, compared with their predicted angles obtained from the training data using the Linear Regression model. (b) The residuals (actual angles–predicted angles) of the Linear Regression model in the in-camera setting, plotted and compared against the actual angles in the test data.
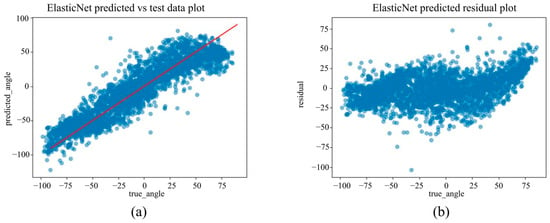
Figure 7.
(a) The actual angles from the test data for forearm pronation–supination in the in-camera setting, compared with their predicted angles obtained from the training data using the ElasticNet model. (b) The residuals (actual angles–predicted angles) of the ElasticNet model in the in-camera setting, plotted and compared against the actual angles in the test data.
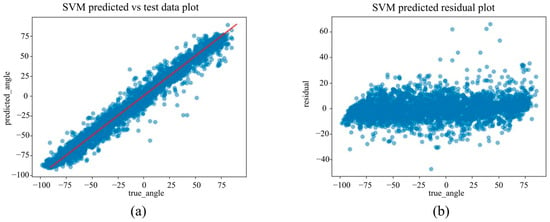
Figure 8.
(a) The actual angles from the test data for forearm pronation–supination in the in-camera setting, compared with their predicted angles obtained from the training data using the SVM model. (b) The residuals (actual angles–predicted angles) of the SVM model in the in-camera setting, plotted and compared against the actual angles in the test data.
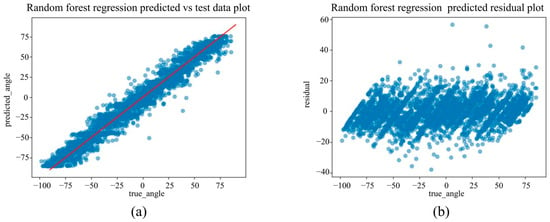
Figure 9.
(a) The actual angles from the test data for forearm pronation–supination in the in-camera setting, compared with their predicted angles obtained from the training data using the Random Forest Regression model. (b) The residuals (actual angles–predicted angles) of the Random Forest Regression model in the in-camera setting, plotted and compared against the actual angles in the test data.
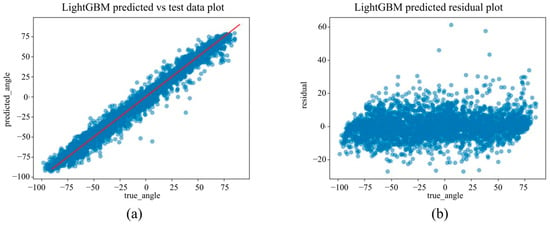
Figure 10.
(a) The actual angles from the test data for forearm pronation–supination in the in-camera setting, compared with their predicted angles obtained from the training data using the LightGBM model. (b) The residuals (actual angles–predicted angles) of the LightGBM model in the in-camera setting, plotted and compared against the actual angles in the test data.
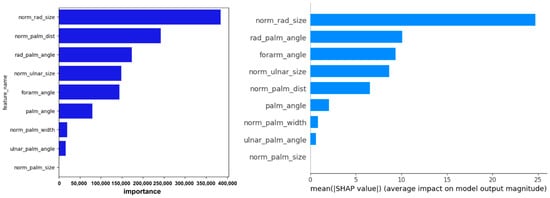
Figure 11.
Visualization of feature importance and SHAP values from the LightGBM model for predicting forearm pronation–supination angle under the in-camera condition. The figure highlights the key image-based features contributing to model performance.
3.2.2. Out-Camera Setting
Under the out-camera condition, LightGBM delivered the best results (MAE = 4.65°, RMSE = 7.30°, R2 = 0.976). Additionally, SVM (MAE = 5.44°) and Random Forest (MAE = 5.83°) performed well. In contrast, the linear models showed significantly reduced performance, with MAEs exceeding 21° and R2 values below 0.67.
Scatter plots in Figure 12, Figure 13, Figure 14, Figure 15 and Figure 16 show saturation effects around +25° supination and −90° pronation, indicating potential nonlinear prediction boundaries. Feature importance and SHAP values (Figure 17) identified norm_palm_size and rad_palm_angle as primary contributors, with an even stronger effect compared with the in-camera setting.
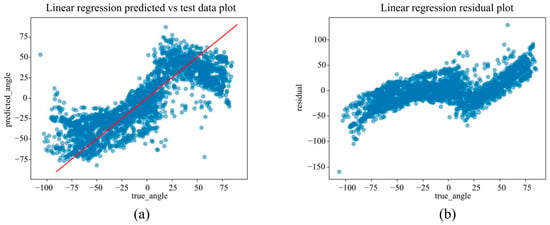
Figure 12.
(a) The actual angles from the test data for forearm pronation–supination in the out-camera setting, compared with their predicted angles obtained from the training data using the Linear Regression model. (b) The residuals (actual angles–predicted angles) of the Linear Regression model in the out-camera setting, plotted and compared against the actual angles in the test data.
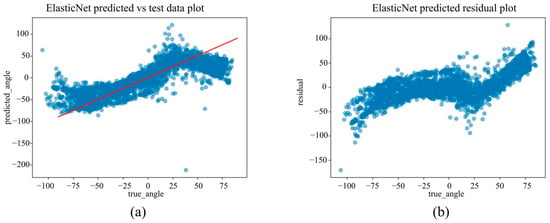
Figure 13.
(a) The actual angles from the test data for forearm pronation–supination in the out-camera setting, compared with their predicted angles obtained from the training data using the ElasticNet model. (b) The residuals (actual angles–predicted angles) of the ElasticNet model in the out-camera setting, plotted and compared against the actual angles in the test data.
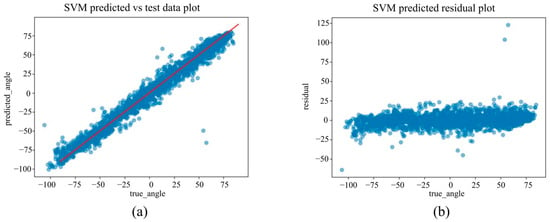
Figure 14.
(a) The actual angles from the test data for forearm pronation–supination in the out-camera setting, compared with their predicted angles obtained from the training data using the SVM model. (b) The residuals (actual angles–predicted angles) of the SVM model in the out-camera setting, plotted and compared against the actual angles in the test data.
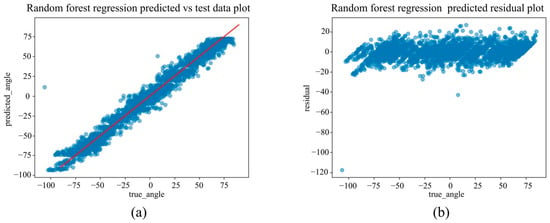
Figure 15.
(a) The actual angles from the test data for forearm pronation–supination in the out-camera setting, compared with their predicted angles obtained from the training data using the Random Forest Regression model. (b) The residuals (actual angles–predicted angles) of the Random Forest Regression model in the out-camera setting, plotted and compared against the actual angles in the test data.
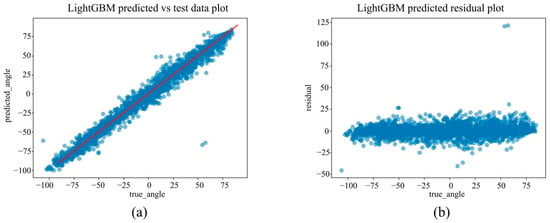
Figure 16.
(a) The actual angles from the test data for forearm pronation–supination in the out-camera setting, compared with their predicted angles obtained from the training data using the LightGBM model. (b) The residuals (actual angles–predicted angles) of the LightGBM model in the out-camera setting, plotted and compared against the actual angles in the test data.
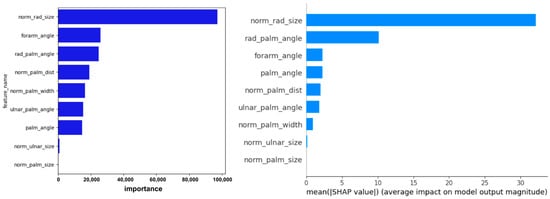
Figure 17.
Visualization of feature importance and SHAP values from the LightGBM model for predicting forearm pronation–supination angle under the out-camera condition. The contribution of each feature to individual predictions and the overall model is illustrated.
3.2.3. Comparison Between Viewpoints
Across the viewpoints, LightGBM and SVM consistently achieved high accuracy, with MAE differences of only 0.96° and 0.81° between the in-camera and out-camera settings, respectively. In contrast, the linear models showed pronounced viewpoint dependence, with an MAE difference of approximately 6.8°. Notably, the nonlinear error trends observed in the out-camera setting were not apparent in the in-camera results, indicating that the projection geometry significantly affected the estimation accuracy.
4. Discussion
To the best of our knowledge, this is the first study to develop and evaluate a machine learning model using only 2D landmarks obtained from MediaPipe Hands, with the rotation angle measured via a dorsally mounted IMU sensor as the ground truth. The best-performing model, LightGBM, achieved an MAE of 5.61°, RMSE of 7.64°, and R2 of 0.973 in the in-camera setting and an MAE of 4.65°, RMSE of 7.30°, and R2 of 0.976 in the out-camera setting.
In routine clinical practice, the forearm pronation–supination ROM is typically assessed using a goniometer or visual inspection. Armstrong et al. [13] reported that changes exceeding 8° for pronation/supination, 6° for elbow flexion, and 7° for extension were considered significant with moderate-to-high interrater reliability. For forearm rotation, changes greater than 10–11° must be reliably detected. Colaris et al. [12] reported the smallest detectable difference (SDD) in children to be 10–15° using goniometers and 16–24° with visual inspection, with an intra-rater SDD of 6–10°, even when using the same goniometer.
Additionally, Szekeres et al. [14] demonstrated that a modified finger goniometer provided extremely high reliability in patients with distal radial fractures, reporting minimal detectable changes of 5° in pronation and 3° in supination. However, these measurements were conducted by experienced hand therapists with >10 years of clinical experience, which may have significantly contributed to the high accuracy.
The MAE of 4.6–5.6° observed in this study was comparable to or better than that of conventional methods, even those performed by skilled professionals. Achieving this level of accuracy under a non-contact, markerless setup while minimizing inter-rater variability represents a significant advancement. Although very small changes, such as 2–3°, may fall within the range of measurement error, the accuracy remains comparable to goniometric assessments, as noted above in the report by Szekeres et al., and appears sufficient for routine clinical monitoring. Nonetheless, further methodological refinements may improve sensitivity for detecting smaller changes.
The camera angle in this study was limited to within ±30°, based on a prior experiment showing that medial angles beyond 45° often caused occlusion of the elbow joint by the torso, drastically lowering the landmark detection rates. Nevertheless, the SHAP analysis revealed that although the angle formed by the index MCP joint, wrist, and elbow joint contributed approximately 10% in the in-camera condition and minimally in the out-camera condition, it was not a dominant feature. This suggests that even without visible elbow landmarks, predictive accuracy can be maintained by leveraging features of palm morphology and internal hand angles. Future improvements in landmark detection algorithms capable of handling wider angles and novel feature engineering may further enhance real-world applicability.
LightGBM likely outperformed the other regression models owing to several factors. Our dataset consisted of 20 participants and 36,000 frames, introducing intersubject variability and localized nonlinearities. In such settings, tree-based algorithms, particularly LightGBM with its leafwise growth strategy, can effectively model complex relationships by fine-tuning the splits based on the gradient magnitudes. Furthermore, its histogram-based splitting enabled efficient handling of subtle variations in the feature space.
Furthermore, LightGBM supports MAE minimization as its objective function, making it well-suited to this angle-estimation task, where robust performance against outliers is essential. These advantages enabled LightGBM to capture the nonlinear, viewpoint-dependent relationship between image features and forearm rotation angle more accurately than other models. The MAE difference between the in-camera and out-camera settings was only 0.96°, indicating consistent performance regardless of the camera angle. In contrast, linear models such as Linear Regression and ElasticNet performed poorly, with MAEs exceeding 21° in the out-camera condition.
This may be because of the anatomical characteristics of the forearm, as reported by Matsuki et al. [34] and Akhbari et al. [7], in which the rotational axis extends from the radial head to the ulnar head. Because this axis lies ulnarly, the out-camera perspective, which is farther and more oblique to the rotation axis, may suffer more from parallax and lens distortion, thereby reducing the estimation accuracy.
SHAP analysis revealed that in both camera settings, the most influential predictors were radial-side palm features, specifically, the normalized area of the triangle formed by the wrist, index MCP joint, and pinky MCP joint and the angle at the index MCP within this triangle, indicating that the opening-and-closing motion anchored at the radial side of the wrist and spanning toward the pinky MCP is critical for angle estimation. In contrast, the angle formed by the index MCP joint, wrist, and elbow joint contributed only modestly in the in-camera setting and was not a dominant predictor in either view, highlighting the limited role of elbow joint data.
These features are more important than the ulnar-side parameters, possibly because the rotational motion is centered on the radius, which rotates structurally around the ulnar-based axis.
Ehara et al. [28] developed a machine learning model using 2D MediaPipe landmarks to estimate thumb pronation (internal rotation) and reported that the distance between fingertip landmarks was the most important feature in the SHAP analysis. In contrast, our study consistently highlighted the size and angular configuration of the triangular region spanning the radial wrist to the pinky MCP joint as key predictors across both the SHAP and feature importance metrics. This discrepancy likely reflects biomechanical differences in the target motion. Thumb pronation involves distal joint motion and finger rotation, making tip distance more influential, whereas forearm pronation–supination is driven by radial rotation around the ulna, emphasizing more proximal palm features. This suggests that feature selection should be tailored to the target joint or segment and that further optimization of feature engineering could improve model accuracy in our task.
The use of an IMU sensor as a quasi-ground truth offers the benefits of portability, real-time measurements, and cost-effectiveness. However, we observed increased errors during extreme supination owing to sensor slippage. Such inaccuracies may have partially propagated into the model, which should be recognized as a limitation. Optical motion capture can provide more reliable ground-truth data, thereby potentially improving the precision of clinical applications.
The limitations of this study include the use of a controlled environment with 20 healthy adult participants, and uniform lighting. Therefore, patients with fractures or joint stiffness may exhibit different movement patterns, and future studies are required to confirm the applicability of the model in clinical populations. In addition, previous studies have shown that factors such as frame imbalance, the absence of the head and shoulders in the frame, clothing similar in color to the background, and angular background objects can significantly affect the recognition accuracy of MediaPipe [35]. Therefore, further validation is necessary to ensure consistent performance in diverse environments. Another limitation is the dependency on Google’s MediaPipe Hands library. Although we fixed the library version to ensure reproducibility, the algorithm may change across releases or degrade under challenging conditions such as occlusion or cluttered backgrounds. Future studies should re-benchmark newer versions to confirm consistent performance. Moreover, we did not systematically analyze the influence of hand size or anatomical variations, which may have affected the estimation accuracy. Although the subjects were instructed to maintain a neutral forearm posture, differences in shoulder or elbow positioning could have influenced the landmark geometry and camera perspective. Therefore, future studies should include stricter postural control measures. Additionally, all data were collected from the right hand only, and further validation is required for the left hand and non-dominant limbs. Nevertheless, because MediaPipe Hands uses the same 21-landmark definition for both left and right hands and provides a handedness label, the same features can be applied regardless of laterality, suggesting that similar performance can also be expected for the left hand. Nonetheless, achieving an MAE of approximately 5° using only a single camera and a commercially available PC under noncontact and marker-less conditions has a significant clinical value. This method eliminates inter-rater variability while offering a reproducibility comparable to that of conventional techniques. Additionally, it holds strong potential for immediate feedback in clinical settings and tele-rehabilitation. With improved ground truth acquisition and extension to dynamic tasks, this approach can become a new standard for forearm functional assessment in daily clinical practice.
5. Conclusions
In this study, we developed and validated a machine learning model to estimate forearm pronation–supination angles in a noncontact, marker-less environment using 2D hand landmarks extracted from MediaPipe and rotational angles recorded by a dorsally mounted IMU sensor as the pseudo-ground truth. Among the five regression models tested, LightGBM demonstrated the highest accuracy, achieving a mean absolute error of 5.61° in the in-camera condition and 4.65° in the out-camera condition; both values approached the clinically acceptable error range for goniometric measurements. Future work should address challenges such as viewpoint dependency and occlusion of the elbow joint, as well as improve the accuracy of ground truth measurements to further enhance the clinical applicability of this method.
Author Contributions
Conceptualization, M.K. and A.I.; methodology, M.K., T.H. and Y.M.; software, A.I. and I.S.; validation, K.Y., Y.E. and S.T. (Shunsaku Takigami); formal analysis, M.K. and D.N.; investigation, S.T. (Shuya Tanaka) and S.O.; resources, T.H. and R.W.; data curation, M.K., T.H. and R.W.; writing—original draft preparation, M.K.; writing—review and editing, A.I., Y.M., S.H. and T.M.; Visualization, I.S. and K.Y.; Supervision, R.K.; Project Administration, A.I. All authors have read and agreed to the published version of the manuscript.
Funding
This research was funded by JSPS KAKENHI, grant number JP22K09399.
Institutional Review Board Statement
This study was conducted in accordance with the guidelines of the Declaration of Helsinki and was approved by the Kobe University Review Board (approval number: B210009; approval date: 21 April 2021).
Informed Consent Statement
Informed consent was obtained from all participants involved in this study. Written informed consent was obtained from all patients for the publication of this paper.
Data Availability Statement
The data presented in this study are available from the corresponding author upon request. The data are not publicly available due to confidentiality concerns.
Acknowledgments
The authors would like to thank an English language editing service for assistance with English editing.
Conflicts of Interest
The authors declare no conflict of interest. The sponsors had no role in the design, execution, interpretation, or writing of the study.
References
- LaStayo, P.C.; Lee, M.J. The forearm complex: Anatomy, biomechanics and clinical considerations. J. Hand Ther. 2006, 19, 137–145. [Google Scholar] [CrossRef]
- Adams, J.E.; Steimmann, S.P. Anatomy and kinesiology of the elbow. In Rehabilitation of the Hand and Upper Extremity, 6th ed.; Skirven, T.M., Osterman, A.L., Fedorczyk, J.M., Amadio, P.C., Eds.; Elsevier: Philadelphia, PA, USA, 2011; Chapter 3; p. 28. [Google Scholar]
- Shen, O.; Chen, C.T.; Jupiter, J.B.; Chen, N.C.; Liu, W.C. Functional outcomes and complications after treatment of distal radius fracture in patients sixty years and over: A systematic review and network meta-analysis. Injury 2023, 54, 110767. [Google Scholar] [CrossRef]
- Soubeyrand, M.; Assabah, B.; Bégin, M.; Laemmel, E.; Dos Santos, A.; Crézé, M. Pronation and supination of the hand: Anatomy and biomechanics. Hand Surg. Rehabil. 2017, 36, 2–11. [Google Scholar] [CrossRef]
- Kapandji, A. Biomechanics of pronation and supination of the forearm. Hand Clin. 2001, 17, 111–122. [Google Scholar] [CrossRef] [PubMed]
- Chen, Y.R.; Tang, J.B. Changes in contact site of the radiocarpal joint and lengths of the carpal ligaments in forearm rotation: An in vivo study. J. Hand Surg. Am. 2013, 38, 712–720. [Google Scholar] [CrossRef]
- Akhbari, B.; Shah, K.N.; Morton, A.M.; Moore, D.C.; Weiss, A.C.; Wolfe, S.W.; Crisco, J.J. Biomechanics of the Distal Radioulnar Joint During In Vivo Forearm Pronosupination. J. Wrist Surg. 2021, 10, 208–215. [Google Scholar] [CrossRef]
- Zhang, H.; Yang, G.; Lu, Y. The role of radial head morphology in proximal radioulnar joint congruency during forearm rotation. J. Exp. Orthop. 2024, 11, e70059. [Google Scholar] [CrossRef]
- Berger, R.; Dobyns, J. Physical examination and provocative maneuvers of the wrist. In Imaging of the Hand; Gilula, L., Ed.; Saunders: Philadelphia, PA, USA, 1996. [Google Scholar]
- Lowe, B.D. Accuracy and validity of observational estimates of wrist and forearm posture. Ergonomics 2004, 47, 527–554. [Google Scholar] [CrossRef]
- Pratt, A.L.; Burr, N.; Stott, D. An investigation into the degree of precision achieved by a team of hand therapists and surgeons using hand goniometry with a standardised protocol. Br. J. Hand Ther. 2004, 9, 116–121. [Google Scholar] [CrossRef]
- Colaris, J.; Van der Linden, M.; Selles, R.; Coene, N.; Allema, J.H.; Verhaar, J. Pronation and supination after forearm fractures in children: Reliability of visual estimation and conventional goniometry measurement. Injury 2010, 41, 643–646. [Google Scholar] [CrossRef] [PubMed]
- Armstrong, A.D.; MacDermid, J.C.; Chinchalkar, S.; Stevens, R.S.; King, G.J. Reliability of range-of-motion measurement in the elbow and forearm. J. Shoulder Elb. Surg. 1998, 7, 573–580. [Google Scholar] [CrossRef] [PubMed]
- Szekeres, M.; MacDermid, J.C.; Birmingham, T.; Grewal, R. The inter-rater reliability of the modified finger goniometer for measuring forearm rotation. J. Hand Ther. 2016, 29, 292–298. [Google Scholar] [CrossRef] [PubMed]
- Yun, X.; Bachmann, E.R.; McGhee, R.B. A simplified quaternion-based algorithm for orientation estimation from earth gravity and magnetic field measurements. IEEE Trans. Instrum. Meas. 2008, 57, 638–650. [Google Scholar] [CrossRef]
- Favre, J.; Aissaoui, R.; Jolles, B.M.; de Guise, J.A.; Aminian, K. A functional calibration procedure for 3D knee joint angle description using inertial sensors. J. Biomech. 2008, 42, 2330–2335. [Google Scholar] [CrossRef]
- Jordan, K.; Dziedzic, K.; Jones, P.W.; Ong, B.N.; Dawes, P.T. The reliability of the three-dimensional fastrak measurement system in measuring cervical spine and shoulder range of motion in healthy subjects. Rheumatology 2000, 39, 382–388. [Google Scholar] [CrossRef]
- Hsu, Y.L.; Wang, J.S.; Lin, Y.C.; Chen, S.M.; Tsai, Y.J.; Chu, C.L.; Chang, C.-W. A wearable inertial-sensing-based body sensor network for shoulder range of motion assessment. In Proceedings of the International Conference on Orange Technologies (ICOT), Tainan, Taiwan, 12–16 March 2013; pp. 328–331. [Google Scholar]
- Parel, I.A.B.; Cutti, A.G.A.; Fiumana, G.C.; Porcellini, G.C.; Verni, G.A.; Accardo, A.P.B. Ambulatory measurement of the scapulohumeral rhythm: Intra- and inter-operator agreement of a protocol based on inertial and magnetic sensors. Gait Posture 2012, 35, 636–640. [Google Scholar] [CrossRef]
- Tan, T.; Chiasson, D.P.; Hu, H.; Shull, P.B. Influence of IMU position and orientation placement errors on ground reaction force estimation. J. Biomech. 2019, 97, 109416. [Google Scholar] [CrossRef]
- Zabat, M.; Ababou, A.; Ababou, N.; Dumas, R. IMU-based sensor-to-segment multiple calibration for upper limb joint angle measurement—A proof of concept. Med. Biol. Eng. Comput. 2019, 57, 2449–2460. [Google Scholar] [CrossRef]
- Pérez-Chirinos Buxadé, C.; Fernández-Valdés, B.; Morral-Yepes, M.; Tuyà Viñas, S.; Padullés Riu, J.M.; Moras Feliu, G. Validity of a Magnet-Based Timing System Using the Magnetometer Built into an IMU. Sensors 2021, 21, 5773. [Google Scholar] [CrossRef]
- Lafayette, T.B.G.; Kunst, V.H.L.; Melo, P.V.S.; Guedes, P.O.; Teixeira, J.; Vasconcelos, C.R.; Teichrieb, V.; da Gama, A.E.F. Validation of Angle Estimation Based on Body Tracking Data from RGB-D and RGB Cameras for Biomechanical Assessment. Sensors 2022, 23, 3. [Google Scholar] [CrossRef] [PubMed]
- Amprimo, G.; Masi, G.; Desiano, M.; Spolaor, F.; De Berti, L.; De Cecco, M. Hand tracking for clinical applications: Validation of the Google MediaPipe Hand (GMH) and the depth-enhanced GMH-D frameworks. Sensors 2024, 24, 584. [Google Scholar] [CrossRef]
- Wagh, V.; Scott, M.W.; Kraeutner, S.N. Quantifying similarities between MediaPipe and a known standard to address issues in tracking 2D upper limb trajectories: Proof of concept study. JMIR Form. Res. 2024, 8, e56682. [Google Scholar] [CrossRef]
- Kusunose, M.; Inui, A.; Nishimoto, H.; Mifune, Y.; Yoshikawa, T.; Shinohara, I.; Furukawa, T.; Kato, T.; Tanaka, S.; Kuroda, R. Measurement of shoulder abduction angle with posture estimation artificial intelligence model. Sensors 2023, 23, 6445. [Google Scholar] [CrossRef] [PubMed]
- Shinohara, I.; Inui, A.; Mifune, Y.; Yamaura, K.; Kuroda, R. Posture Estimation Model Combined With Machine Learning Estimates the Radial Abduction Angle of the Thumb With High Accuracy. Cureus 2024, 16, e71034. [Google Scholar] [CrossRef]
- Ehara, Y.; Inui, A.; Mifune, Y.; Yamaura, K.; Kato, T.; Furukawa, T.; Tanaka, S.; Kusunose, M.; Takigami, S.; Osawa, S.; et al. The development and validation of an artificial intelligence model for estimating thumb range of motion using angle sensors and machine learning: Targeting radial abduction, palmar abduction, and pronation angles. Appl. Sci. 2025, 15, 1296. [Google Scholar] [CrossRef]
- Ogawa, W.; Hirota, Y.; Miyazaki, S.; Nakamura, T.; Ogawa, Y.; Shimomura, I. Definition, criteria, and core concepts of guidelines for the management of obesity disease in Japan (JASSO 2022 Guideline). Endocr. J. 2024, 71, 223–231. [Google Scholar] [CrossRef]
- Pakzad, S.S.; Ghalehnovi, M.; Ganjifar, A. A comprehensive comparison of various machine learning algorithms used for predicting the splitting tensile strength of steel fiber-reinforced concrete. Case Stud. Constr. Mater. 2024, 20, e03092. [Google Scholar] [CrossRef]
- Hassan, M.; Kaabouch, N. Impact of feature selection techniques on the performance of machine learning models for depression detection using EEG data. Appl. Sci. 2024, 14, 10532. [Google Scholar] [CrossRef]
- Enkhbayar, D.; Ko, J.; Oh, S.; Ferdushi, R.; Kim, J.; Key, J.; Urtnasan, E. Explainable artificial intelligence models for predicting depression based on polysomnographic phenotypes. Bioengineering 2025, 12, 186. [Google Scholar] [CrossRef]
- Lundberg, S.M.; Erion, G.; Chen, H.; DeGrave, A.; Prutkin, J.M.; Nair, B.; Katz, R.; Himmelfarb, J.; Bansal, N.; Lee, S.-I. From local explanations to global understanding with explainable AI for trees. Nat. Mach. Intell. 2020, 2, 56–57. [Google Scholar] [CrossRef] [PubMed]
- Matsuki, K.O.; Matsuki, K.; Mu, S.; Sasho, T.; Nakagawa, K.; Ochiai, N.; Takahashi, K.; Banks, S.A. In vivo 3D kinematics of normal forearms: Analysis of dynamic forearm rotation. Clin. Biomech. 2010, 25, 979–983. [Google Scholar] [CrossRef] [PubMed]
- Yoon, H.; Jo, E.; Ryu, S.; Yoo, J.; Kim, J.H. MediaPipe-based LSTM-autoencoder sarcopenia anomaly detection and requirements for improving detection accuracy. In Proceedings of the 1st International Workshop on Intelligent Software Engineering, CEUR Workshop Proceedings, Busan, Republic of Korea, 6 December 2022. [Google Scholar]
Disclaimer/Publisher’s Note: The statements, opinions and data contained in all publications are solely those of the individual author(s) and contributor(s) and not of MDPI and/or the editor(s). MDPI and/or the editor(s) disclaim responsibility for any injury to people or property resulting from any ideas, methods, instructions or products referred to in the content. |
© 2025 by the authors. Licensee MDPI, Basel, Switzerland. This article is an open access article distributed under the terms and conditions of the Creative Commons Attribution (CC BY) license (https://creativecommons.org/licenses/by/4.0/).