Article

Anti-Sliding Trenches to Enhance Slope Stability of Internal Dumps on Inclined Foundations in Open-Pit Coal Mines

1
School of Energy and Mining Engineering, China University of Mining and Technology (Beijing), Beijing 100083, China
2
School of New Energy, Longdong University, Qingyang 745000, China
3
Kunming Metallurgical Research Institute Co., Ltd., Kunming 650503, China
*
Authors to whom correspondence should be addressed.
Appl. Sci. 2025, 15(19), 10510; https://doi.org/10.3390/app151910510
Submission received: 19 August 2025 / Revised: 23 September 2025 / Accepted: 24 September 2025 / Published: 28 September 2025
(This article belongs to the Special Issue New Trends in Slope Stability)

Abstract

The stability of internal dumps in open-pit coal mines is critical for the safe production and economic performance of the entire mine. To further enhance slope stability and ensure safe production, a new method for constructing trenches (referred to as an anti-sliding trench) on the sloped basal bed of the dump slope in open-pit mines was proposed to improve slope stability. The internal dump slope at the Luzigou anticline of the Anjialing Open-Pit Mine was studied. The slope failure modes of the dumping steps were studied experimentally and by numerical simulations at different widths of anti-slide trenches at the slope’s toe in a staged loading state. Without anti-slide trenches, shear-layer and along-layer failure modes occurred, while the failure modes with anti-slide trenches included shear-layer, along-layer, and squeeze-out failure. Based on the limit equilibrium theory and the determined failure modes, the preset anti-slide trenches at the toe of the dumping steps were theoretically analyzed. The relationships between the slope stability coefficient and the width and depth of anti-slide trenches, as well as the physical and mechanical parameters of the slope body, were derived. Given the physical and mechanical parameters of the slope body and targeted improvement in the slope stability coefficient, the size parameters of anti-slide trenches were designed and optimized through the derived relationships. At the Anjialing Coal Mine, presetting anti-slide trenches with a depth of 1.5 m and a width of 22.68 m at the toe of the dumping steps increased the slope stability coefficient from 1.3095 to 1.6. The proposed method provides a guiding reference for designing similar internal dump slopes in open-pit coal mines and for disaster prevention.

1. Introduction

Open-pit coal mines are economically beneficial due to their high production capacity [1]; moreover, open-pit mining is generally safer than underground mining, and it is widely favored by the coal production industry, given that the required preconditions for open-pit mining are met. However, a large amount of soil and rock is extracted from open-pit mines alongside the coal, especially in later mining stages, and such a massive stockpiling of mined rock and soil forms an internal dump site with a considerable slope [2]. As the internal dump site is the primary repository for excavated waste material, its stability is critical for the safe production and economic performance of the entire mine [3,4,5]. The internal dump slope comprises a mining floor slope formed after coal extraction and stockpiled mixed waste rock and soil. When inclined coal seams occur (as is the case in some large and super-large open-pit coal mines in China), the dump foundation will be inclined, which not only reduces the slope stability but also increases the risk of landslides, ultimately affecting the production safety of open-pit coal mines as well as the safety of personnel and property [6,7].
Therefore, the deformation and failure mechanisms of dump slopes with foundations inclined at various angles have attracted global research attention. Consequently, various anti-sliding measures were proposed [8,9,10,11,12,13]. For example, Dong et al. studied the blasting charge structure during ore extraction, which resulted in the formation of small, uneven structural rock bodies on the base slope after mining, exhibiting anti-sliding effects. This technology was applied in the anti-slip engineering of the Haizhou open-pit mine in China [14]. Bi et al. found that inclined piles effectively reinforced the foundation beneath the inclined base and controlled pavement settlement [15]. Wang et al. analyzed the geometric size effects of supporting coal pillars from a mechanical perspective and applied it to the construction of internal dump slopes at the Shengli East 2 open-pit mine [16]. Mahanta et al. discovered five failure modes of landfills along inclined bases and proposed engineering measures involving embankments combined with a rough geomembrane for stability enhancement [17]. Kumar et al. investigated the role of plant roots in enhancing slope stability, while Bhowmik et al. explored the use of geomembrane materials to improve slope stability [18,19]. Thus, landslides in the dump slopes of open-pit coal mines are often related to the slope surface of the base foundation. Piled earth and rock exhibit large porosity, and water infiltrates the base through pores [20]. The majority of dump foundations in open-pit coal mines consist of relatively soft mudstones, which are prone to landslides and safety incidents [21]. Based on the research findings related to improving slope stability, most coal mining companies have adopted measures such as reducing the dump’s slope angle, lowering the height of long slopes, constructing anti-sliding piles and retaining walls, treating slope foundations, and leaving anti-slip coal pillars. Since the landslide mechanisms of internal dump slopes are complex and influenced by various factors, a combination of these measures may improve slope stability. Therefore, finding cost-effective methods to enhance the stability of internal dump slopes in open-pit coal mines is crucial for mine safety [22].
The research on the stability of the internal dump slope at the Anjialing coal mine identified that the slope stability factor is close to the standard limit, indicating low safety and reliability. The anti-sliding trench method was applied in road surface anti-skid measures and for enhancing the sliding resistance at a dam heel in hydraulic engineering [23,24,25]. However, no data exists on its application for improving the stability of open-pit mine slopes. In view of the complex geological and environmental conditions of internal dumps in open-pit coal mines, e.g., soft mudstone foundations of dump slopes and water seepage problems prone to disasters, more economical technical measures are needed for adequate prevention and control. Thus, an anti-sliding trench method was proposed to enhance the stability of internal dump slopes, involving trench construction (referred to as an anti-sliding trench in this paper) at the foundation of the internal dump slope. Additionally, a case study was conducted at the Anjialing open-pit mine to evaluate the method’s effectiveness. Indeed, the implementation of an anti-slide trench significantly enhanced slope stability, providing a useful reference for slope design and disaster prevention in inner dump areas of open-pit coal mines.

2. Engineering Background

The selected study location, the Anjialing open-pit coal mine, is located in the Pinglu District of Shuozhou City, with the minefield situated in the central-southern part of the Pingshuo mining area. The geographical coordinates of the mine are approximately 39°30′ N–39°35′ N latitude and 112°10′ E–112°15′ E longitude. The minefield covers an area of 28.8 km2, with an existing open-pit reserve of 684 million tons and an approved production capacity of 20 million tons per year (Mt/a), while the actual production capacity is 17 Mt/a. It is the second large-scale open-pit coal mine in the Pingshuo mining area, independently designed and constructed in China. The coal mining face of the Anjialing open-pit mine critically approached the Lutzigou anticline, a regional fold with a sharp change in the dip angle and a drop of approximately 270 m. Its surface is covered with mudstone, 0.2 to 4 m thick, underlain by sandstone layers. The dump of the Lutzigou anticline has bench heights of 20 m, with slope angles of 35 degrees and base dip angles of 18 degrees. When the dumping work line reaches the Lutzigou anticline, the internal dumping space sharply decreases, and the dumping slope angle approaches the repose angle of the waste material. To address this issue, improving the availability of internal dumping space by setting anti-sliding trenches at the bottom of the dump slopes was proposed. The physical and mechanical parameters of rock layers are shown in Table 1, according to literature data [26,27] and the actual conditions at the Anjialing open-pit coal mine.

3. Experiments and Methods

3.1. Simulation Experiments

3.1.1. Objectives

Simulation experiments were conducted to determine the location of the slip surface corresponding to slope failure in the internal waste dump of the open-pit coal mine, and the slope inclination of the waste dump was kept consistent with the dip of the underlying rock layers.

3.1.2. Experimental Setup

The simulation experiments were conducted in a model box independently developed by China University of Mining and Technology (Beijing) to simulate rock layers with different angles.. The model box is 1.6 m long, 0.8 m wide, and 1 m high, Figure 1. Two sides of the box were made of transparent glass panels to monitor the deformation and failure of the model slope. The hydraulic column on the right side of the model box’s bottom serves to rotate the box from the left side, adjusting the rotation angle. The spatial position of the model, when the box is in the horizontal position, was determined by the plane coordinate conversion. The model was constructed based on the coordinates of the spatial position. Afterward, the hydraulic column was activated to rotate the model box’s bottom to the predetermined position, simulating rock layers with different angles.

3.1.3. Experimental Design and Similarity Ratio

The model was designed according to the dumping steps of the coal mining working face in the Luzigou Anticline at the Anjialing open-pit mine. These dumping steps at the Luzigou Anticline waste dump have a height of 20 m, a slope angle of 35°, and a base inclination angle of 18°. The physical and mechanical parameters of the rocks are shown in Table 1.
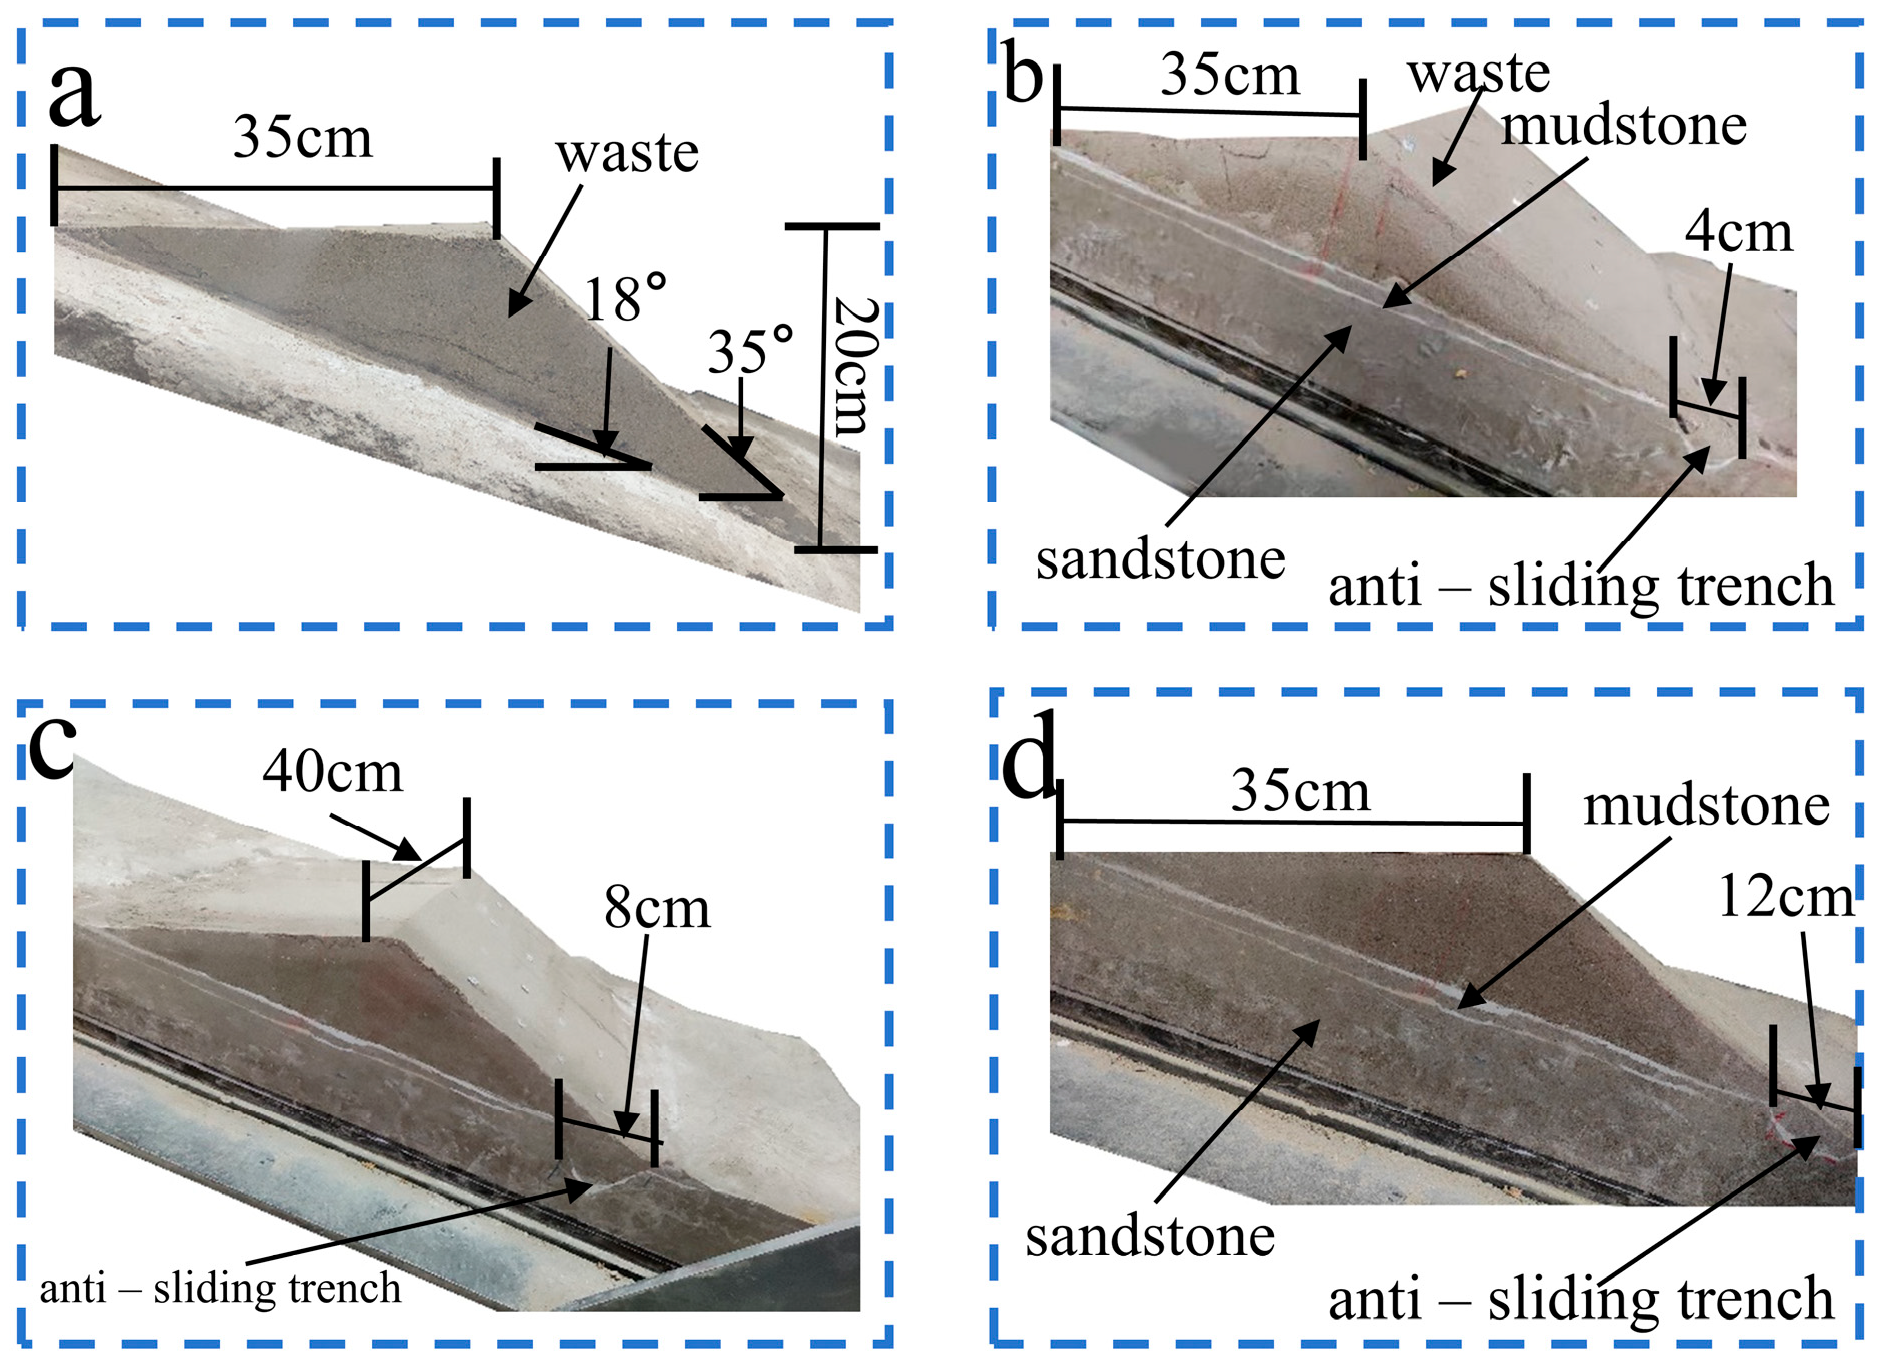
Based on the distribution of the surface mudstone thickness in the Luzigou anticline, a typical profile was selected according to the engineering conditions of the Anjialing coal mine, with the determined depth of the anti-sliding trench of 4 m (corresponding to 1 cm in the model). This was combined with the actual engineering activities of the Anjialing open-pit mine, and three width values were selected: 4 m (i.e., 4 cm in the model), 8 m (i.e., 8 cm in the model), and 12 m (i.e., 12 cm in the model). A control group with a width of 0 m was established for comparison, i.e., the dump is placed directly in the anticline area. This yields four similar material simulation experiments: control group ①, and experimental groups: ② 4 m, ③ 8 m, and ④ 12 m, Figure 2. To accommodate the box width and for the sake of straightforward operation, the base width was set to 50 cm. To avoid the influence of both base ends on the model slope, the model bench was recessed inward by 10 cm. Additionally, a distance of 0.5 mm was left on the other side of the model bench (this was achieved by inserting a 0.5 mm glass plate during model construction and then removing it afterward). Gypsum was sprinkled between each layer of the model to create distinct layers; monitoring points were arranged on the side of the model, and a total station was used to measure the displacement. The data from monitoring points should be recorded on time, before and after loading. The coordinates of each monitoring point were measured by a total station, and the coordinate data of the monitoring points are stored.
The similarity ratio refers to the ratio of corresponding physical quantities between the prototype (the real object corresponding to the actual engineering or physical phenomenon) and the established model (created to simulate the prototype according to certain scale and similarity conditions). Based on the characteristics of the model box and the geometric parameters of waste dumping steps, the determined geometric similarity ratio, Cl, is 100. According to the similarity principle [28,29], the density similarity ratio, Cρ, is 1.5, the stress similarity ratio, Cσ, is 150, the cohesion similarity ratio, Cc, is 150, the elastic modulus similarity ratio, CE, is 150, the internal friction angle similarity ratio, Cφ, is 1, and Poisson’s ratio similarity ratio, Cν, is 1. Once the similarity ratios are determined, the model’s physical quantities can be determined by referring to Table 1, followed by the corresponding scaling up. The model’s width is 50 m (the model scale: 50 cm). Relevant parameters and representative engineering dimensions are shown in Table 2. Referring to the existing research data, sand and lime were selected as filling materials, and gypsum was chosen as the binding material. The proportions of similar materials are shown in Table 3.
After the model was constructed, the box was rotated to the preset angle of 18°, and then the model was left to set for 14 days. Once the model was dried and the moisture content essentially stabilized, the loading tests were conducted. Partitions of 0.4 m × 0.2 m × 0.01 m (the plan dimensions of the steps are 0.4 m × 0.33 m) were placed on the dumping bench. The loading was performed by manually adding weight blocks, which were placed on the pressure plate. The loading sequence and the weight of each block were optimized through preloading tests. According to the on-site loading effect analysis, the model was subjected to four-stage loading, Figure 3. In the first stage, the load was uniformly distributed at 1592.5 Pa (cracks began to appear on the model’s side). In the second stage, the load was uniformly distributed at 2523.5 Pa (cracks began to appear on the slope surface). In the third stage, the load was applied until the slope displacement became noticeable. In the fourth stage, the load was applied until the slope was damaged. The loading intervals were repeated until no further change in the slope was noticed (i.e., until the displacement at each monitoring point on the slope was less than 0.1 mm).

3.1.4. Experimental Results and Analysis

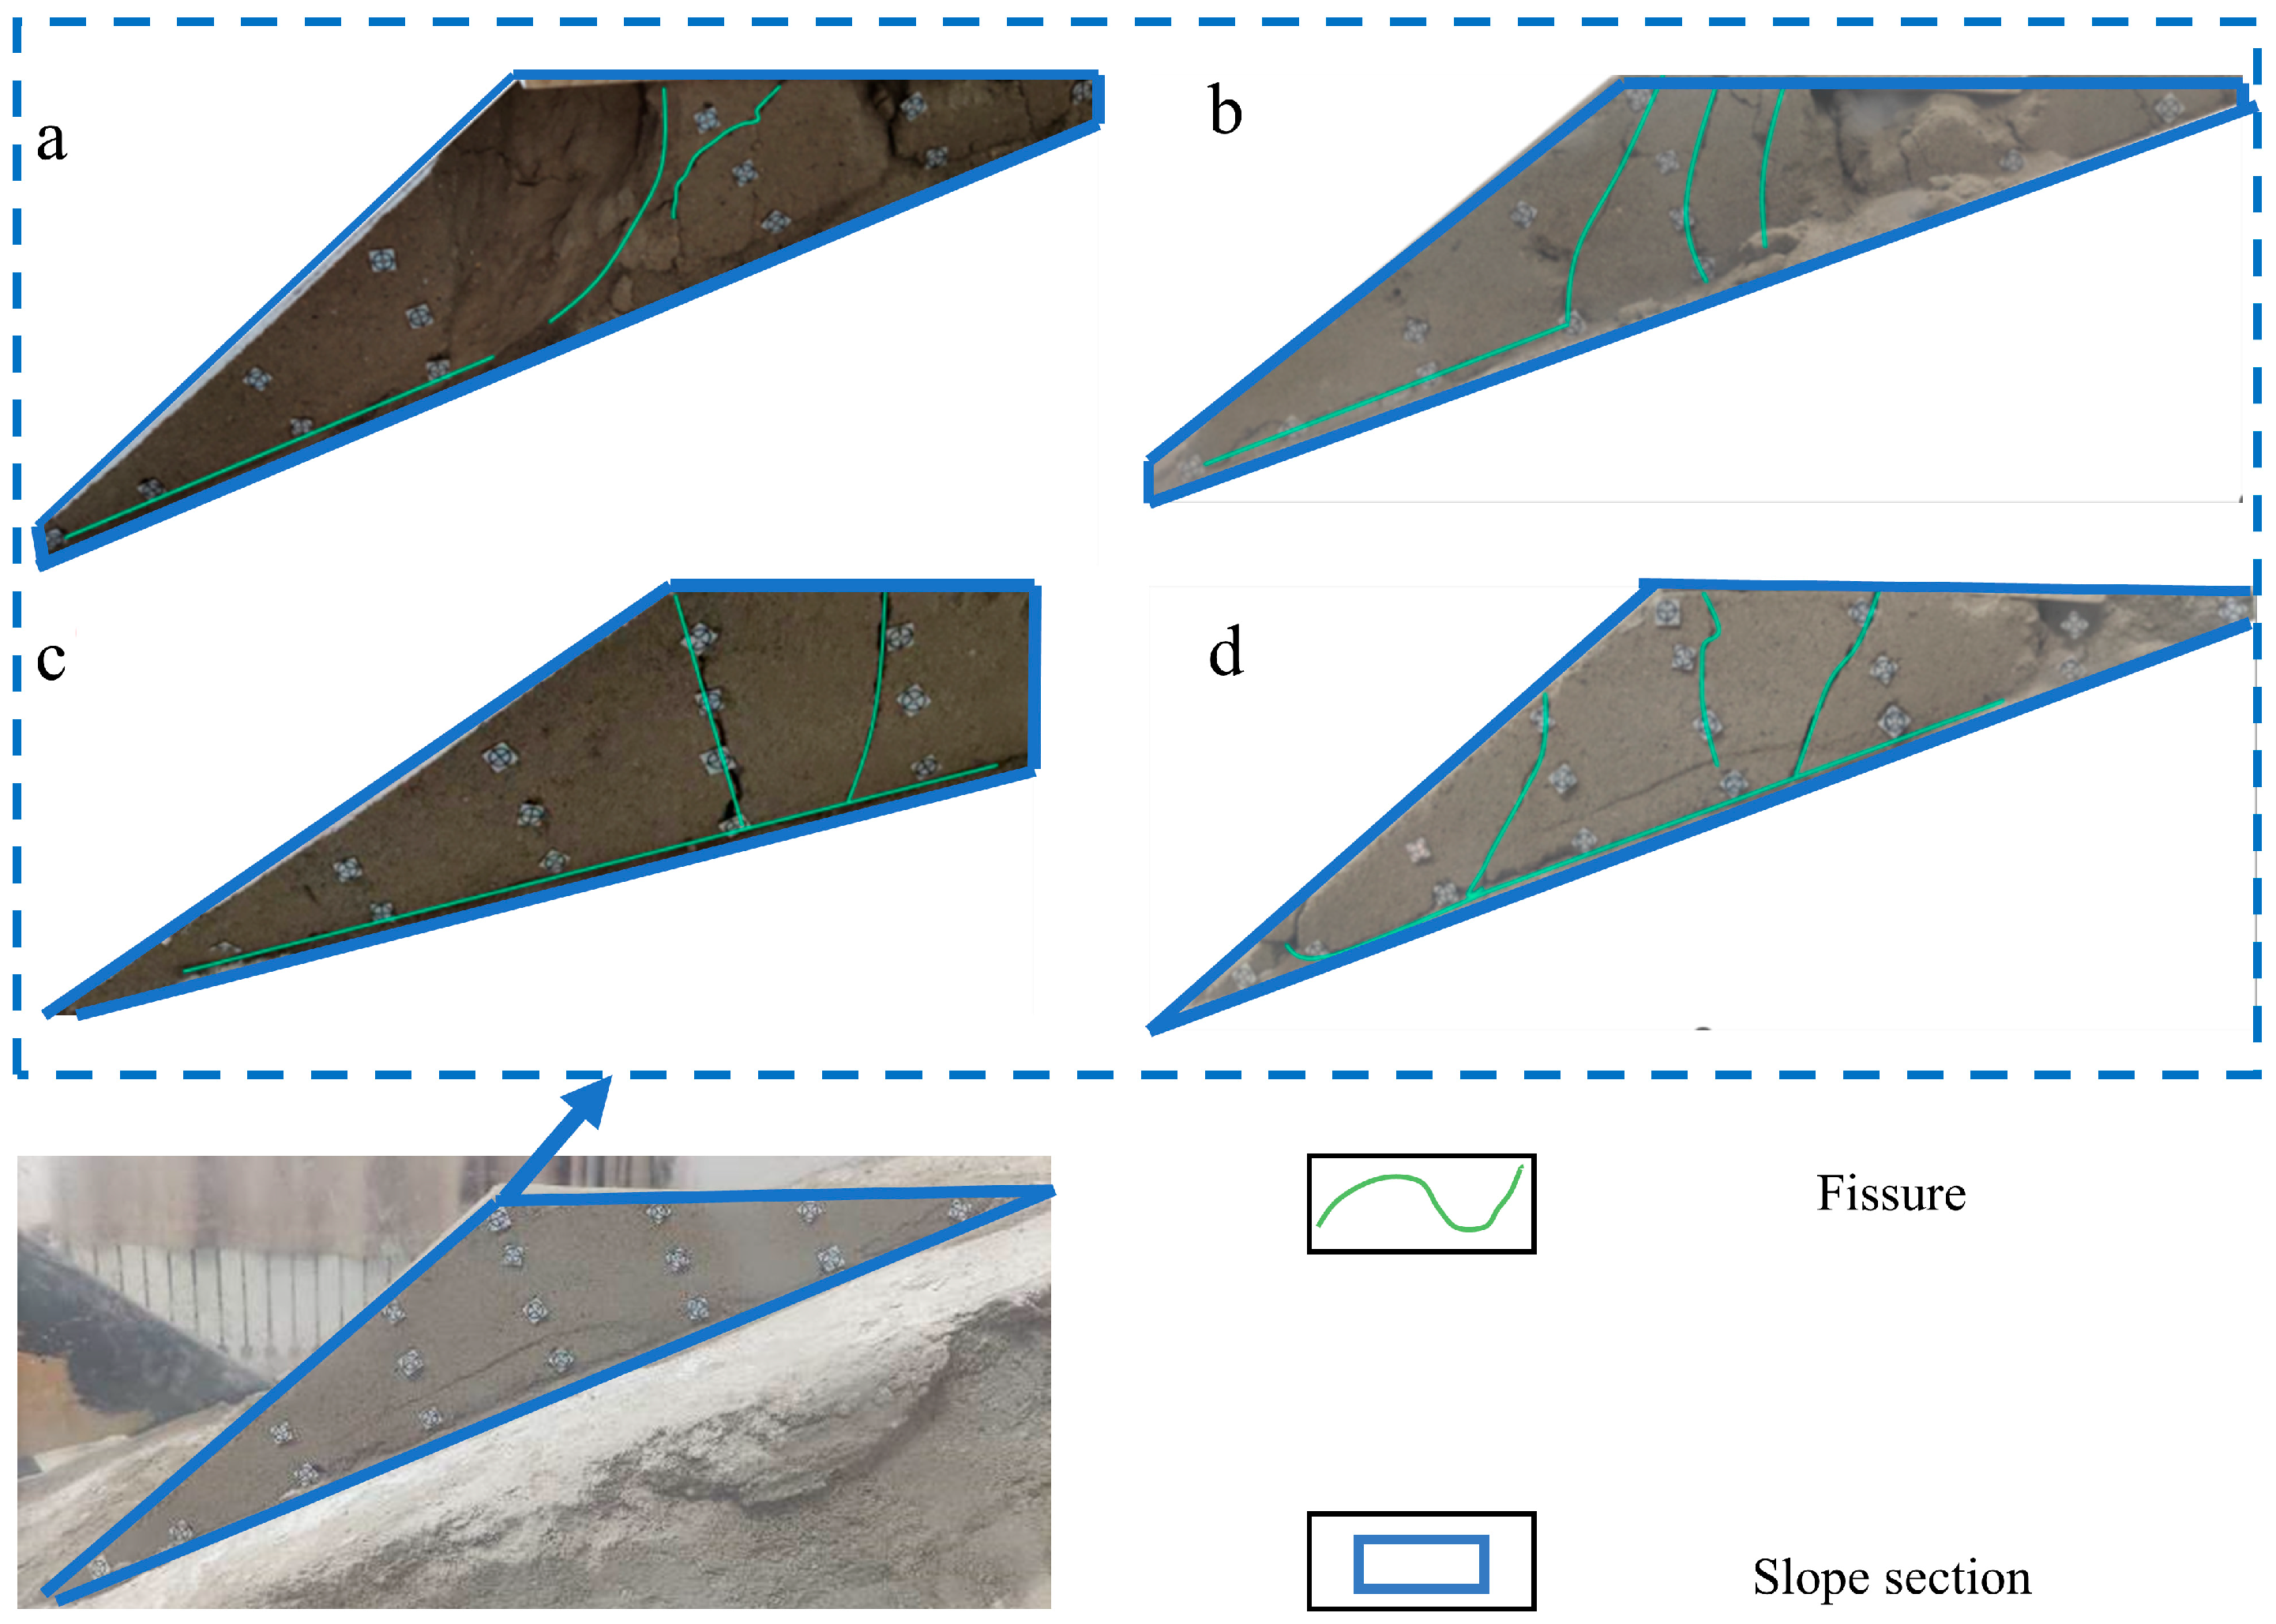
The front view of the complete loading test is shown in Figure 3. According to the number of loadings, the coordinates of the monitoring points were measured four times, and a total of four sets of coordinate data were recorded. By subtracting the coordinate data after loading from the initial coordinate data, the horizontal and vertical displacements of each measuring point at different levels of loading were calculated and plotted, as shown in Figure 4. The side failure after three stages of loading is shown in Figure 5. During the experiment, Figure 3, surface cracks gradually developed on the slope, which was gradually divided into multiple blocks along these cracks as the experiment progressed. Initially, the cracks were almost perpendicular to the bench edge. However, as the experiment continued, they also developed near the model’s edges on both sides and then deviated toward both sides, exhibiting an oblique intersection with the bench edge. The cracks essentially traversed the entire slope, dividing the model into multiple blocks and causing localized sliding. Cracks also appeared at the model’s bottom during the experiment, resulting in fragmentation and bulging at the slope’s base. When the cracks on the slope surface intersected with the cracks at the slope’s base, the entire model slid.
By comparing experiments ①, ②, ③, and ④, it can be observed that different widths of the reserved anti-sliding trenches result in different forms of cracks in the dumping bench area at the slope’s base. In experiment ①, dense small cracks were generated, forming a fragmented zone. In experiment ②, the cracks were smaller than in experiment ①, and they combined to form a transverse crack zone. In experiments ③ and ④, a clear crack parallel to the bench edge of the slope was formed. Comparing the positions of cracks in the slope area’s base (the range marked by red lines in Figure 3) indicates that the increase in the width of the anti-sliding trench causes the cracks to gradually move away from the slope’s base, especially in experiments ③ and ④, implying that the width of the anti-sliding trench can effectively change the location of the sliding outlet.
As can be seen from Figure 4, as the load increases, the displacements in the X and Z directions show an increasing trend. Due to the small load in the first-stage loading, the displacements in the X and Z directions are very small. Monitoring points 1–8 are located in the trailing edge area of the load and are hardly affected. The X displacement curve without an anti-sliding trench (Figure 4a) shows that the waste dump bench did not produce obvious sliding during the first-stage loading, and the displacement curve fluctuated around the zero point. During the second-stage loading, the waste dump bench produced a relatively large displacement, with the horizontal displacement being basically around 3 mm. The first row of monitoring points is close to the base surface, and the X displacement of the monitoring points indicates that the lower slider of the waste dump bench slides along the base as a whole.
The X displacement of the monitoring points located in the slope surface area is relatively large, while the displacement of the slider in the loading area is small. Among them, monitoring points 1–4 are located at the arc crack; they are affected by the blocks sliding down during the initial rib spalling, so their horizontal and vertical displacements are relatively large. During the third-stage loading, the displacement of the monitoring points in the slope surface area continues to increase, while the displacement change in the monitoring points in the upper loading area is not obvious, so the displacement trend is similar to that of the second-stage loading. The Z displacement indicates that the vertical displacement of the waste dump bench is much smaller than the horizontal displacement. Due to the small height of the waste dump bench model, the settlement is limited, and the base inclination angle of 18° makes the horizontal movement of the slider along the base larger than the vertical movement. Without an anti-sliding trench (Figure 4a), the monitoring point 1–1 is located at the foot of the slope, and its displacement in the Z direction is consistent with that of its adjacent monitoring points, indicating that the bench as a whole slides along the base direction without horizontal extrusion along the slope surface. The monitoring point 1–1 is located along the slope inclination direction, 6 m from the foot of the slope. The displacement occurs after the third-stage loading without an anti-sliding trench (Figure 4a) and with a 4 m-wide anti-sliding trench (Figure 4b). After setting an 8 m-wide anti-sliding trench (Figure 4c), the vertical Z displacement hardly changes, while the horizontal displacement changes significantly, indicating that the slider moves in a horizontal extrusion mode at the anti-sliding trench. After setting a 12 m-wide anti-sliding trench (Figure 4d), the monitoring point 1–1 shows almost no change in displacement, indicating that the slope slider is extruded and slipped out from the upper opening of the anti-sliding trench, while the slope’s foot is not affected. In general, except for monitoring points 1–1 and 1–8, the displacements of other monitoring points are relatively uniform, indicating similar slider failure types, which slide along the base direction and extrude out from the original upper opening of the anti-sliding trench. The side failure after the third-stage loading is shown in Figure 5.
Figure 5 illustrates the side view of the dumping bench after three loading stages for each scenario. The models from different groups developed cracks along the contact surface between the dumping bench and the underlying rock layer at the end of the experiment. Multiple vertical or inclined cracks formed at the slope’s rear edge, dividing it into multiple blocks on the side. The cracks at the rear edge became connected with those at the bottom to form a complete sliding surface, indicating that the failure mode of the dumping bench on the inclined base is rear edge fracturing, followed by layer sliding along the base contact surface. The morphology of the rear edge cracks in Control Group ① and the sliding mode are consistent with conclusions reported in Ref. [7]. The development of cracks at the slope’s foot varied among different experiments. From Control Group ① to Experimental Groups ②, ③, and ④, the developed end position of the crack gradually moved away from the slope’s foot, and the development pattern of side cracks altered the position of the sliding outlet.
These experiments demonstrated that the anti-sliding trench could alter the deformation failure mode of the dumping bench. The dumping bench, exposed to gravitation and loading, slowly deforms toward the open side of the slope along the base surface; lateral tensile stresses and multiple cracks were developed on the surface and sides of the slope, ultimately leading to its division. Upon the penetration of cracks at the rear edge, the model rapidly slides and collapses. In the experimental groups, the bottom of the anti-sliding trench at the slope’s foot weakens the locally concentrated stress. With the increase in the width of the anti-sliding trench, the affected area expanded, and the concentrated stress was alleviated. The deformation at the slope’s foot was further decreased, and the position of the sliding outlet gradually moved away from the slope’s foot. At the same time, this movement provided support to the dumping bench. The region close to the anti-sliding trench was squeezed out under the compressive force of the overlying model, forming lateral cracks on the slope surface, Figure 5, causing the overall sliding of the model. Its deformation failure mode comprised shear layer, along-layer, and squeeze-out failures. Additionally, the overlying loading force causing crack deformation also increased with the width of the anti-sliding trench.

3.2. Determination of the Anti-Sliding Trench Dimensions

3.2.1. Slope Stability of the Dumping Bench Without Anti-Sliding Trenches

A simplified bench model without anti-sliding trenches on the dump base is shown in Figure 6. Let the dump bench as a whole, denoted by ABC, undergo a gravitational force, W. The bench height is denoted as h, the dip angle of the base rock layer is α, and the slope angle of the dump bench is β (and it is lower than the repose angle). The slide block ABC does not rotate. The slope stability factor, F, is related to parameters h, β, and α. Assuming that the failure mode of the dump bench under the gravitational force spreads along the bedding plane at the base contact surface, the factor F is given by Equation (1) [30].
F = 2 c γ h sin 2 α cot α cot β + tan φ tan α
γ represents the bulk density of the dumped material, in kN/m3; α represents the angle of the base slope of the dump bench; β represents the slope angle of the dump bench, in degrees; φ represents the internal friction angle of the dumped material, in degrees; c represents the cohesive force on the AC plane, in kPa; h represents the height of the dump bench, in m.

3.2.2. The Slope Stability Relationship of a Dumping Bench with Anti-Sliding Trenches

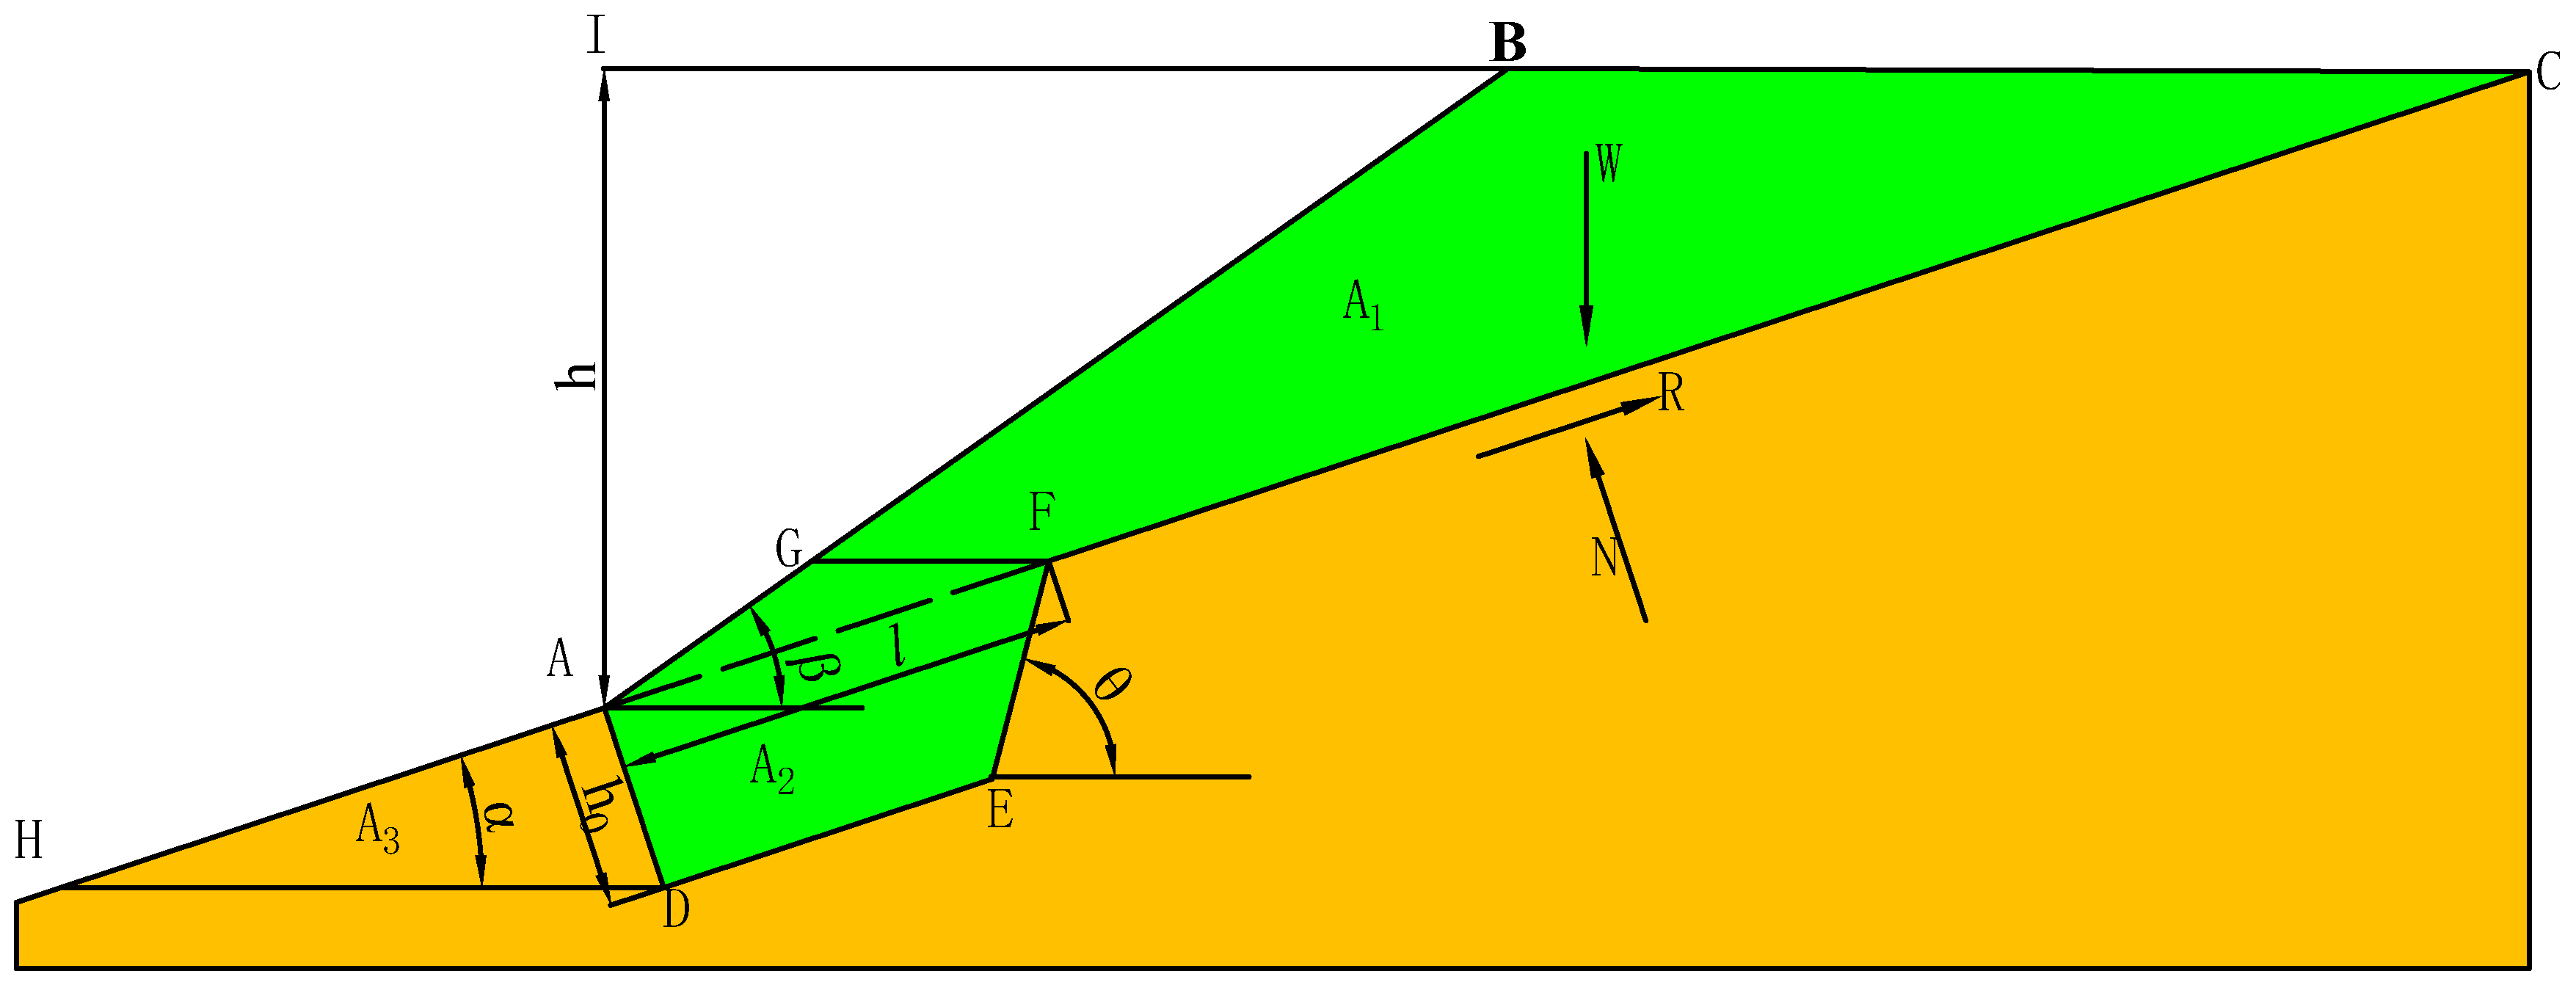
The simplified model of a dump bench with anti-sliding trenches for the inclined-base dump slope is illustrated in Figure 7.
In Figure 7, h represents the height of the dump trench, in m, α represents the dip angle of the base rock layer, in degrees, and β represents the slope angle of the dumped waste (it is lower than the repose angle), in degrees.
The anti-sliding trench, represented by the right-angled trapezoid (ADEF), was set. The width of the anti-sliding trench (the length of the trapezoidal upper bottom AF) is represented by l, in m. The depth of the anti-sliding trench (the trapezoidal height AD) is represented by h0. θ represents the inclination angle of the upper edge of the anti-sliding trench, in degrees. The overall model width is considered the unit width.
From the simulation experiments, it is evident that the deformation and failure modes of the dump site after presetting anti-sliding trenches are shear layer, along-layer, and squeeze-out failures. Accordingly, the slope stability factor was calculated using the limit equilibrium theory, assuming the sliding surface is CFG. The possible reason for the extrusion of the waste body along the GF surface in the simulation experiments is that FA1 < FA2+A3, where FA1 is the stability factor of region A1, and FA2+A3 is the combined stability factor of regions A1 and A3. Since both the cohesion and friction angles of the A3 rock block at the base are greater than those of A2, block A3 provides support to block A2. If FA1 > FA2+A3, the most likely sliding surface for the entire slope body is CFEDH. The following sections derive and analyze the formulas for calculating the slope stability factor based on different sliding surfaces. Two hypotheses are shown in Figure 8.
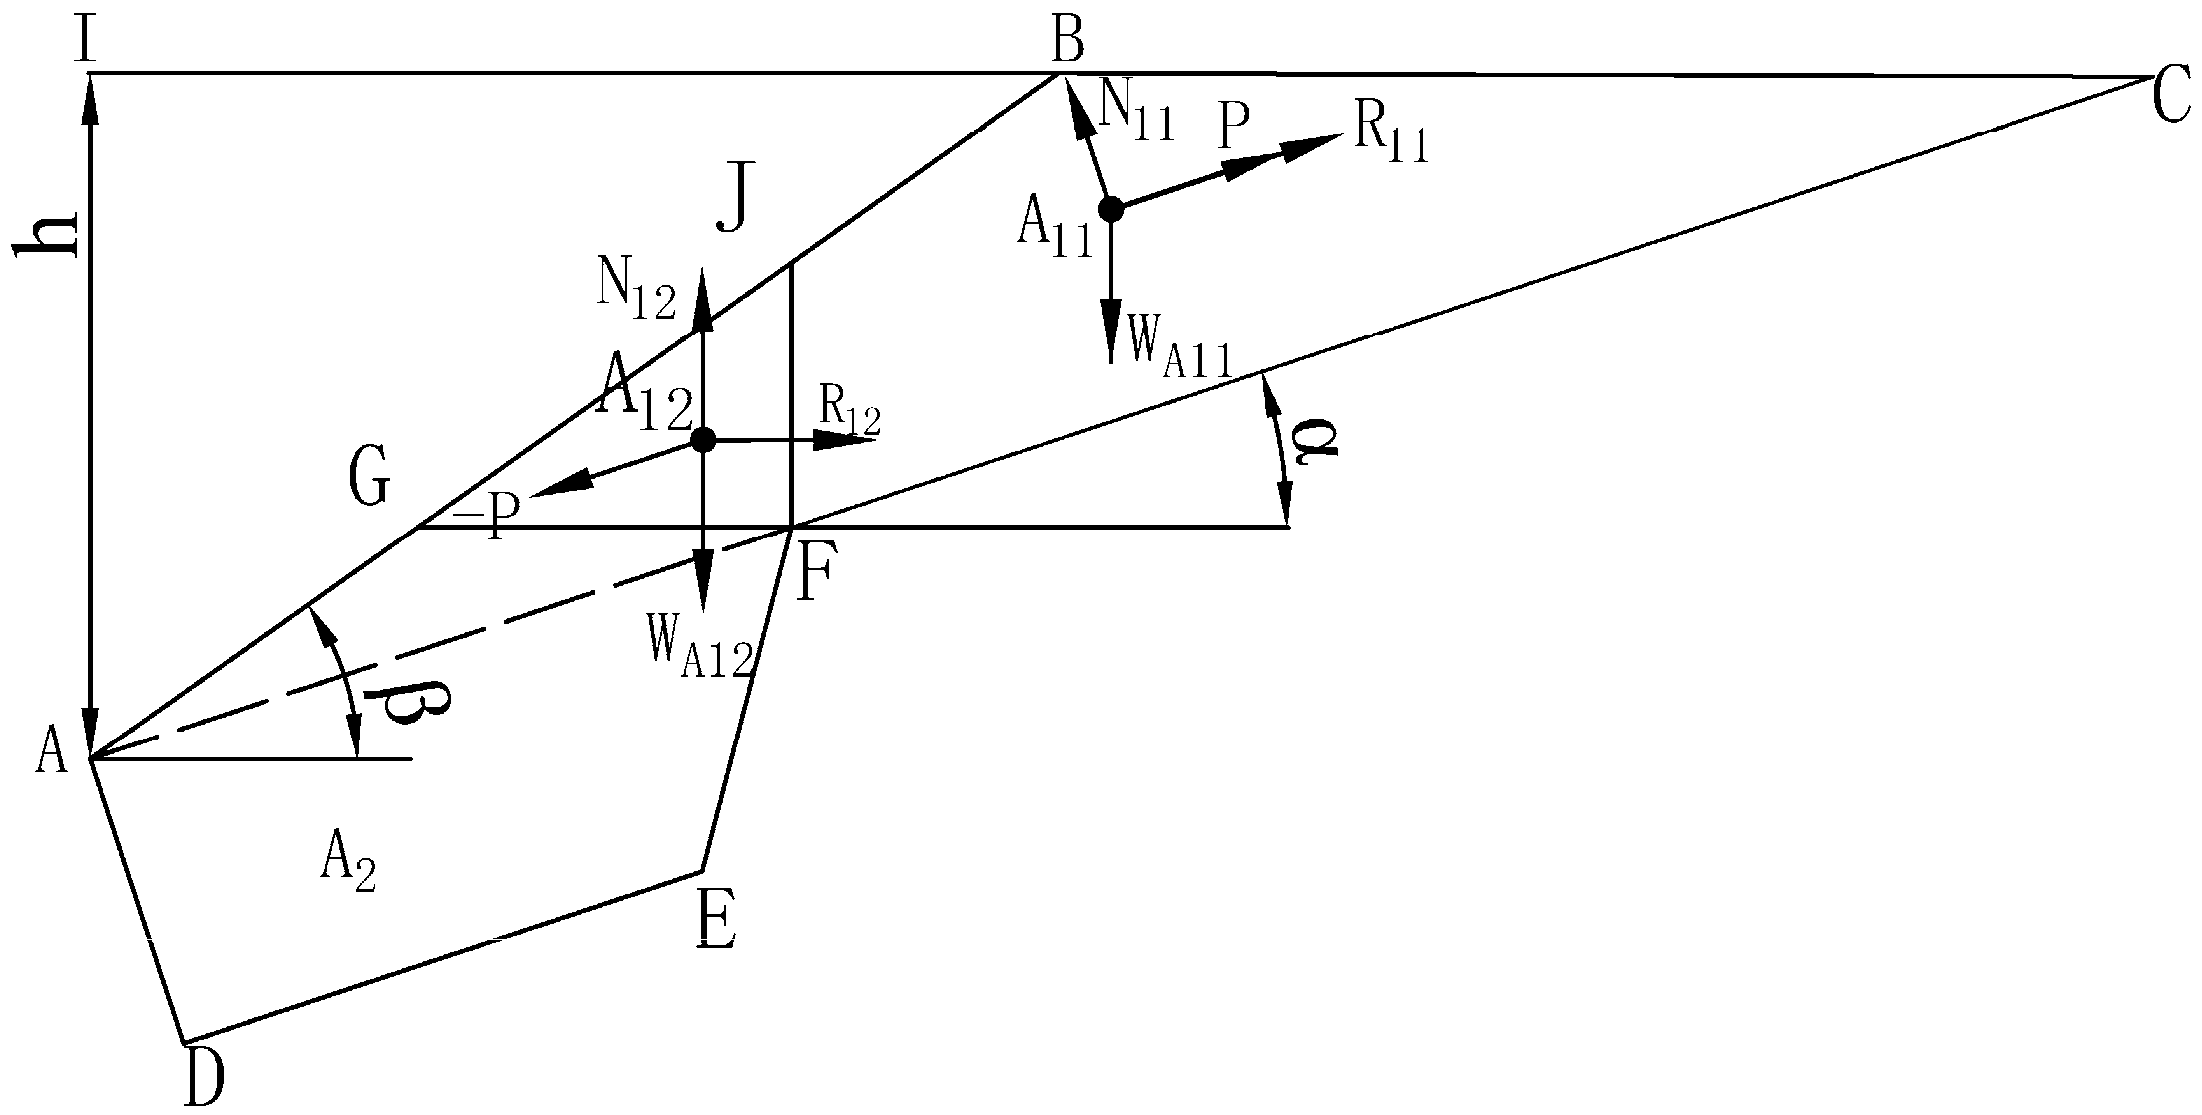
(1) FA2+A3 > FA1. A2 and A3 provide support to A1, making the sliding surface of the slope CFG. Since the stability of section A1 is primarily controlled by A11, the slope stability factor can be considered the stability factor of section A1. The following derives the relationship between the slope stability factor and the size of the anti-sliding trench based on the limit equilibrium theory and geometric relationships. To analyze the stability of the A1 slope, it can be divided into two parts along the vertical direction from the upper cut of the anti-sliding trench: A11 (quadrilateral BGFC) and A12 (right triangle JGF); then, force analysis can be performed, Figure 9. The stability factor of A1 is primarily controlled by A11, and the stability factor of A11 can be considered the stability factor of section A1, leading to the slope safety factor Fs = FA1 = FA11.
Based on the limit equilibrium theory and the above analysis, the slope stability factor Fs (i.e., FA1) is as follows:
F A1 = R 11 + P T 11
According to the Mohr-Coulomb criterion, the anti-slide force RA11 is:
R 11 = c CF · L CF + N 11 tan φ CF
where L C F =    L A I s i n α L A F
  • φ CF is the internal friction angle of the surface CF , in degrees (°).
  • c CF is the cohesion of the surface CF , in kPa.
  • L CF is the length of the CF surface, in m.
  • L AI is the height of the slope step, in m.
  • L AF is the width of the anti-slide trench, in m.
Let the stability factor A12 be 1 and ignore the vertical shear force between the A11 and A12 parts of the slope. Based on the limit equilibrium theory, the maximum thrust P from A11 to A12 can be derived as follows:
P = W A 12 tan φ GF + c GF L GF c o s α sin α tan φ GF
where L G F = L A F sin β α s i n β
In Equation (4):
  • φ G F is the internal friction angle of the GF surface, in degrees (°).
  • c G F is the cohesion of the GF surface, in kPa.
  • c G F is the length of the GF surface, in m.
Assuming that the slope body has a unit thickness, the expressions for the gravitational forces WA11 and WA12 of slope sections A11 and A12 can be derived from the geometric and physical relationships as follows:
W A 11   = γ A 11 L AF 2 [ ( c o t α c o t β ) 2   γ A 11 s i n α sin ( β α ) 2 s i n β   sin 2 ( β α ) t a n β 2 s i n 2 β ]
W A 12 = γ A 12 L AF 2 sin 2 β α t a n β 2 s i n 2 β
In Equation (5):
  • γ A 12 is the unit weight of the waste material in section A12, in kN/m3.
  • γ A 11 is the unit weight of the waste material in section A11, in kN/m3.
By substituting Equations (4)–(6) into Equation (2), the relationship for the stability factor FA11 with respect to the slope rock mass parameters (the step height, LAI, the base slope angle, α, the step slope angle, β, the internal friction angle of the contact sliding surface, ϕ, and the cohesion c of the contact sliding surface) and the anti-sliding trench parameters (anti-slide trench width LAF) can be expressed as follows:
F A 11 = cot α tan φ CF + sin 2 ( β α ) tan β tan φ GF γ A 12 L AF 2 2 sin 2 β cos α 2 sin 2 β sin α tan φ GF + 2 sin β c G F sin ( β α ) 2 sin 2 β cos α 2 sin 2 β sin α tan φ GF c C F L AF + c C F L AI sin α ( cot α cot β ) L AI 2 2 γ A 11 sin α γ A 11 sin α sin ( β α ) sin α L AF 2 2 sin β + sin ( β α ) tan β 2 sin 2 β L AF 2
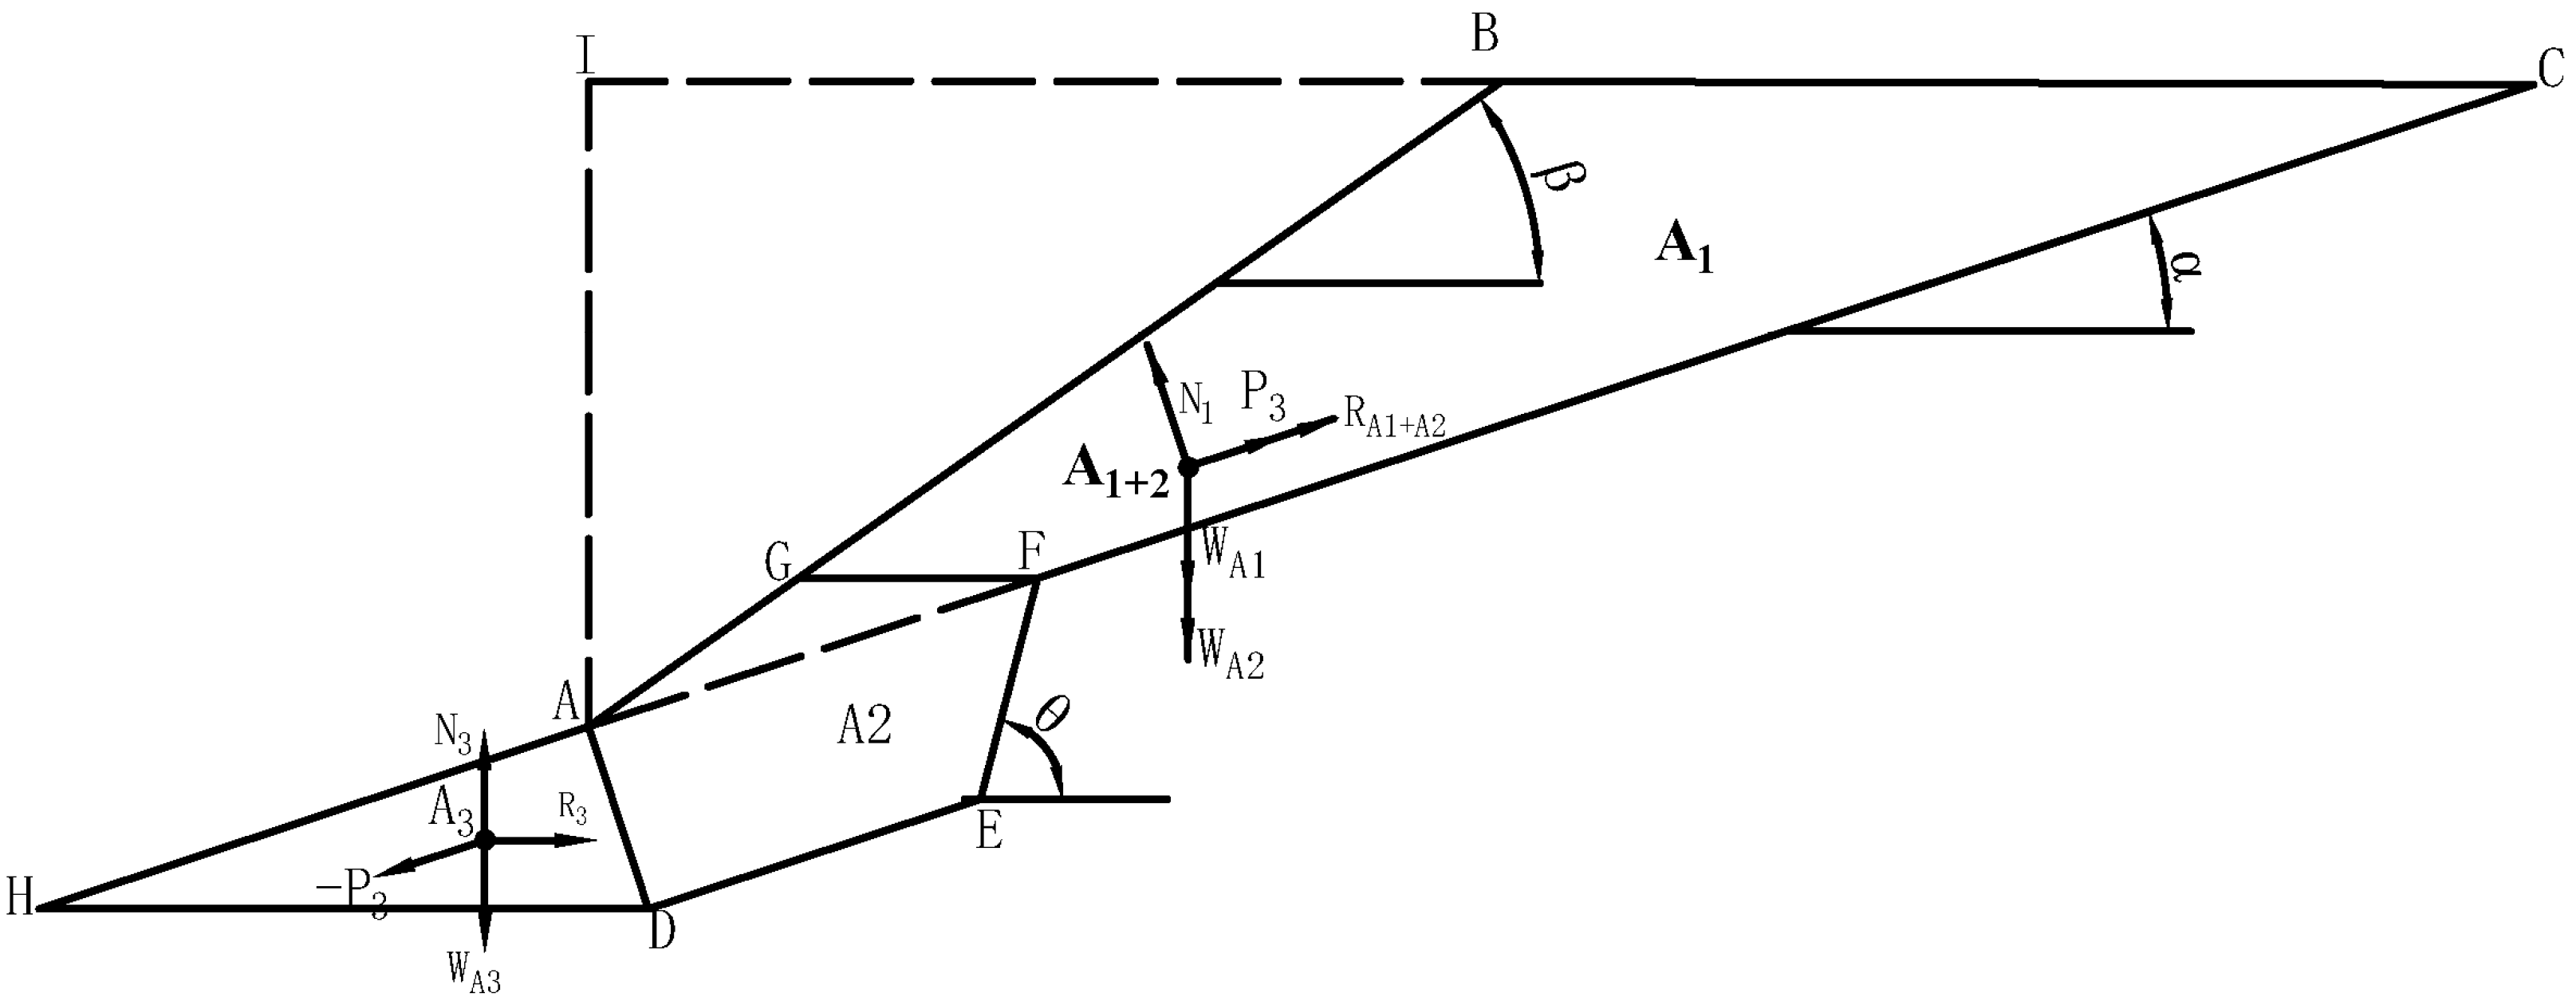
(2) FA2+A3 < FA1. This indicates a tendency of the overall slope to extrude along the bottom HD plane of the anti-sliding trench; then, the polygonal slope formed by ABCFED (A1, A2) can be regarded as a whole, while the slope formed by the triangle ADH (A3) constituting the anti-sliding trench can be treated as another whole unit. The force analysis is illustrated in Figure 10. The stability factor FS2 = FA1+A2 can be determined using the limit equilibrium method, as outlined below:
WA1 is the gravitational force of A1, in kN; WA2 is the gravitational force of A2, in kN; WA3 is the gravitational force of A3, in kN; RA1+A2 is the combined anti-sliding force of A1 + A2, in kN; R3 is the anti-sliding force of A3, in kN; P3 is the reaction force of A3 on the combined A1 + A2, representing the maximum thrust from A3 to A1 + A2, in kN; P is the maximum thrust from A1 + A2 to A3 (the reaction force of A3 on A1 + A2), in kN; α is the base slope angle of the waste dump, in degrees (°); β is the slope angle of the waste dump, in degrees (°); θ is the upper slope angle of the anti-slide trench, in degrees (°). N1 is the support force of the base on the combined A1 + A2, in kN, N1 = (WA1 + WA2) cosα. N3 is the support force of the HD based on A3, in kN; N3 = WA3 + P3sinα. AD is the depth of the anti-sliding trench, in m. AF is the width of the anti-sliding trench in the slope inclination direction, in m. Finally, AI is the vertical height of the slope, in m.
The analysis approach is similar to the previous one. Let the stability factor of the A3 slope, FA3, be equal to 1, and then the maximum thrust P3 from A3 to A1 and A2 was calculated. Then, the limit equilibrium method was applied to compute the slope stability factor, FA1+A2. It was assumed that when the upper slope angle θ of the anti-sliding trench is 90°, the anti-sliding force on the EF contact surface is minimized and can be ignored. In this case, FA1+A2 is minimal. The stability factor for the A1 + A2 combined slope, FA1+A2, is:
F A1 + A 2 = ( W A1 + W A 2 ) cos α tan φ CF + c CF ( L CF + L DE ) + P 3 ( W A1 + W A 2 ) sin α
where φ C F is the internal friction angle of the CF surface rock mass, in degrees (°). c C F is the internal cohesion of the CF surface rock mass, in kPa; L C F   is the length of the CF surface, in m, where L C F = L A I sin α L A F . LAF is the length of the AF surface, in m; L D E   is the length of the DE surface, in m, where L D E = L A F L A D cot θ α . LAD is the length of the AD surface, in m.
The maximum thrust P3 exerted by the A3 slope on A1 and A2 is:
P 3 = W A 3 tan φ HD + c HD L HD cos α sin α tan φ HD
φ H D is the internal friction angle of the HD surface rock mass, in degrees (°); c H D is the internal cohesion of the HD surface rock mass, in kPa; L H D is the length of the HD surface, in m, where L H D = L A D sin α .
Assuming the slope body has a unit thickness, the expressions for the gravitational forces, the WA11 and WA12, of slope sections A11 and A12 can be derived from the geometric and physical relationships as follows:
W A 3 = γ A 3 L AD 2 cot α 2
W A1 + W A 2 = ( cot α cot β ) L AI 2 2 + L AD L AF L A D cot θ α 2
γ A 3 is the unit weight of the material in the slope section A3, in N/m3; γ A 1 + A 2 is the unit weight of the combined material in slope sections A1 and A2, in N/m3.
Substituting Equations (9)–(11) into Equation (8) yields the relationship between the slope stability factor, slope parameters, and anti-sliding trench parameters (the width of the anti-sliding trench, LAF, the depth of the anti-sliding trench, LAD, and the inclination angle θ of the upper edge of the anti-sliding trench):
F A 1 + A 2 = cos α tan φ CF sin α + c CF L AI sin α + γ A 3 cot α tan φ HD L AD 2 2 ( cos α sin α tan φ HD ) + [ c HD sin α cos α sin 2 α tan φ HD c CF cot θ α ] L A D ( cot α cot β ) γ A1 + A2 sin α L AI 2 2 + γ A1 + A2 sin α L AD L A F cot θ α γ A1 + A2 sin α L AD 2
The final slope stability factor is the minimum value calculated from Equations (1) and (2), that is, the minimum value of Equations (7) and (12):
F = min (FA11, FA1+A2)

3.2.3. Analysis of the Anti-Sliding Trench Dimensions

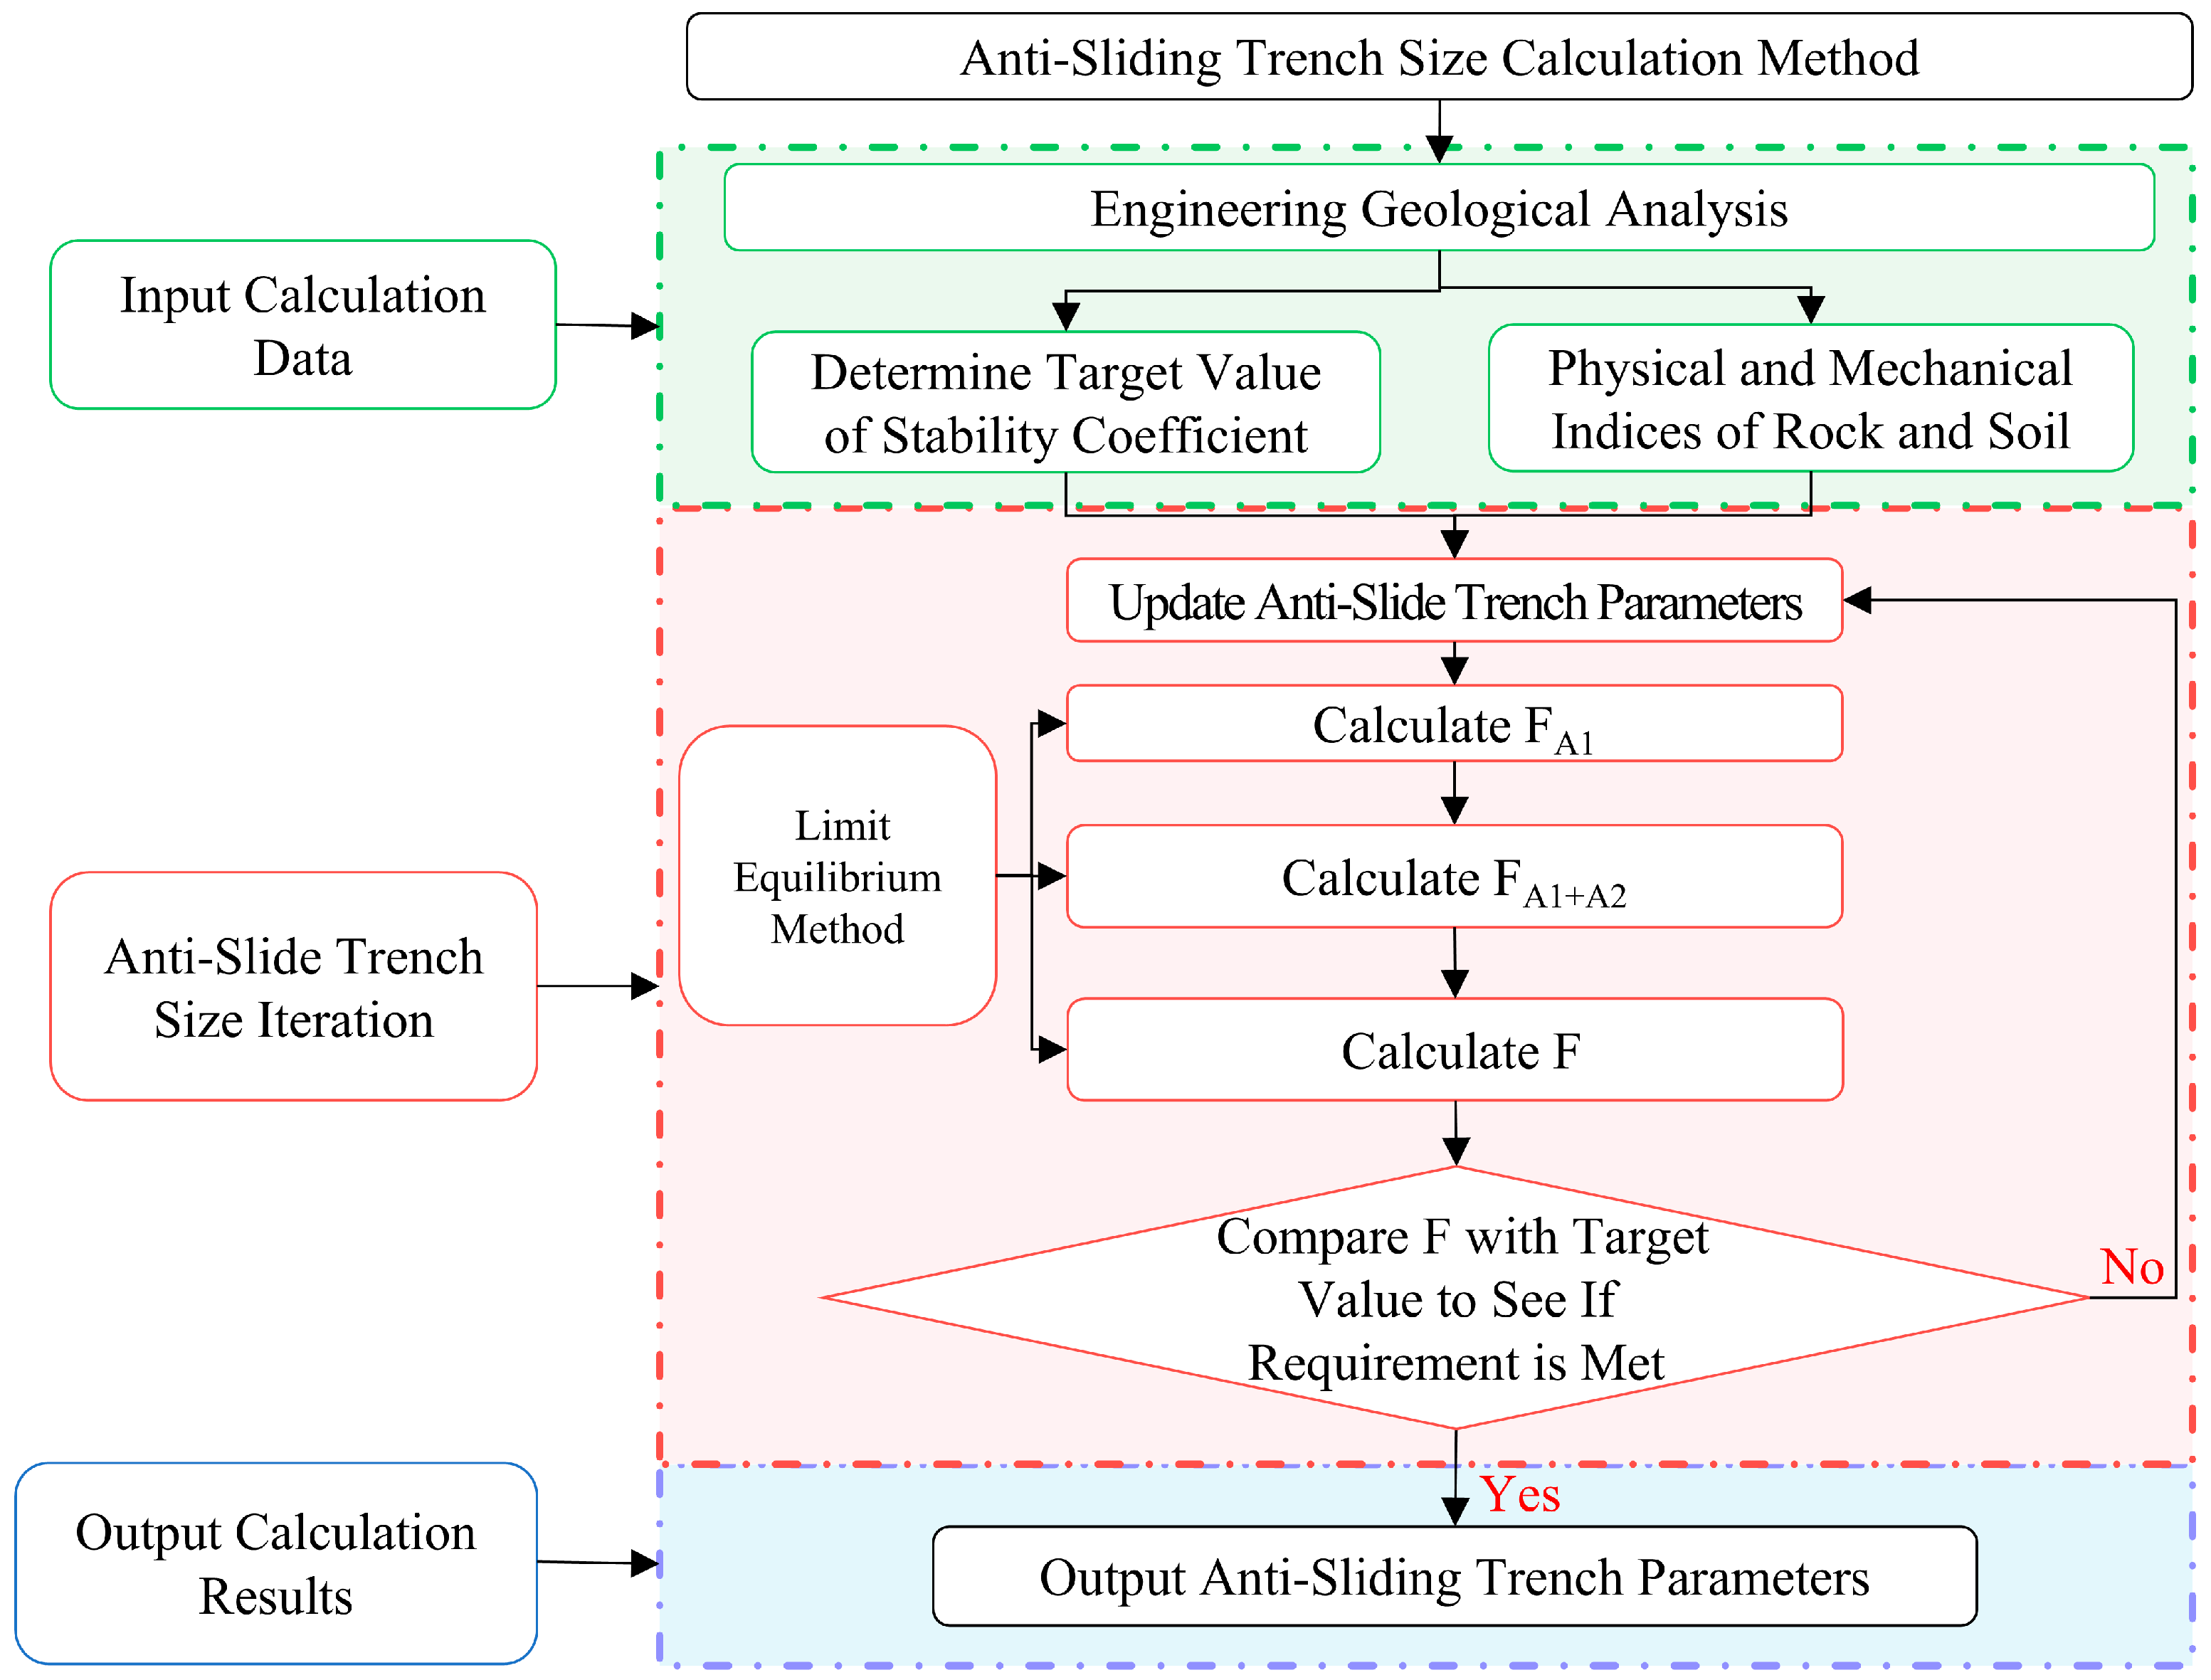
After determining the target value of slope stability, the relevant slope and rock mass parameters were substituted into Equations (7) and (12). The width and depth of the anti-sliding trench were gradually increased, and the F value was calculated using Equation (13). When the F value exceeded the desired slope stability, the calculation was terminated. The growth value of the anti-sliding trench was adjusted to make the calculated value approach the target value, thus obtaining the appropriate anti-sliding trench parameters (width and depth). The entire calculation process is shown in Figure 11.
The specific calculation steps are described as follows:
(1)
Analyze the engineering geological characteristics of the waste dump and determine the physical and mechanical parameters of each soil and rock layer.
(2)
Based on the sliding surface of the waste dump foundation and relevant standards, determine the target stability factor. Use the limit equilibrium method to calculate whether the slope stability factor of the waste dump meets the target value. If not, add an anti-sliding trench at the slope’s toe.
(3)
Determine the initial dimensions of the anti-sliding trench (width and depth).
(4)
Use the rock mechanics parameters and anti-sliding trench dimensions as input parameters and apply the limit equilibrium method to calculate the slope stability factor after adding the anti-sliding trench.
(5)
Compare the slope stability factor after adding the anti-sliding trench with the targeted slope stability factor. When the value reaches or exceeds the target value, stop further calculation. The corresponding anti-sliding trench parameters represent the designed anti-sliding trench parameters. If the slope stability factor does not meet the target value, continue to increase the dimensions of the anti-sliding trench by a certain increment until the value reaches or exceeds the target value.
(6)
Provide the final anti-sliding trench dimensions (width and depth).

3.2.4. Analysis of the Anti-Sliding Effect

Based on the actual situation of the dump benches, the physical and mechanical parameters of the rock strata at the Anjialing open-pit mine are as follows: (α: base slope angle 18°, β: bench slope angle 35°, φ, φGF, φCF: internal friction angle of waste rock 18°, φHD: the internal friction angle of shale bedrock 28.5°, c, cGF, cCF: the cohesive strength of waste rock 9.7 kPa, cHD: the cohesive strength of shale bedrock 154.4 kPa, γ, γA11, γA12: the unit weight of waste rock 19.9 kN/m3, γA3: the unit weight of the shale base 23.3 kN/m3, LAF: the width of the anti-sliding trench l, LAD: the depth of the anti-sliding trench h0, LAI, h: the height of waste rock benches (20 m), the inclination angle θ of the upper edge of the anti-slide trench 90°). Substituting these parameters into Equations (1), (7), and (12), the following equations are obtained:
The slope stability factor F without set anti-sliding trenches:
F = 1.3095;
The slope stability factor FS1 with set anti-sliding trenches under the aforementioned assumption 1 is:
F S 1 = F A 11 = 1.000 + 0.6915 l 2 3.8875 l + 627.7972 2028.7434 1.04372 l 2
where l represents the width of the anti-sliding trench, in m.
The stability factor FS2 of the set anti-slide trench, as assumed in assumption 2:
F S 2 = F A 1 + A 2 = 1.0000 + 24.8543 h 0 2 + 634.7643 h 0 + 627.7972 6.1494 l h 0 0.999 h 0 + 2028.7434
where l represents the width of the anti-sliding trench, in m, and h0 represents the depth of the anti-sliding trench, in m.
According to Equations (13) and (14), the slope stability factor FS1 is related to the width l of the anti-sliding trench, while FS2 is related to both the width l and the depth h0 of the anti-sliding trench. Since excessively large dimensions (width and depth) of the anti-sliding trench inevitably increase engineering costs, the design of the anti-sliding trench dimensions must be aligned with practical engineering needs. Without an anti-sliding trench, the slope stability factor is F = FS1 = FS2 = 1.3095, which is consistent with the stability calculation of the dump slope without a coal pillar, as established in Ref. [30]. To determine the optimal dimensions of the anti-sliding trench, this study considers the actual conditions of the dump slope at the Anjialing open-pit coal mine. The depth of the anti-sliding trench is set to h0 = 0.5, 1, 1.5, 2, 2.5, and 3, and the width l is analyzed within the range from 0 to 35 m. The function curves are plotted accordingly, Figure 12.
The final slope stability factor, F, is taken as the minimum value between FS1 and FS2. The stability factor FS1 increases with the width of the anti-sliding trench, l, Figure 11, while FS2 decreases with l. The intersection point of these two curves represents the maximum value of the stability factor, F, indicating the maximum width of the anti-sliding trench. Beyond F, the slope stability factor decreases with the width of the anti-sliding trench. For example, when h0 = 0.5, the intersection point of FS1 and FS2 is at A (17.739, 1.457), where 1.457 is the maximum slope stability factor at an anti-sliding trench depth of 0.5 m, while 17.739 is the maximum width of the anti-sliding trench that enhances slope stability.

3.2.5. Dimensions of the Anti-Sliding Trench in the Anjialing Open-Pit Mine

Once the target slope stability, F, is determined, the dimensions of the anti-sliding trench can be obtained from Figure 10. The slope stability factors for slopes with anti-sliding trenches of different sizes can be derived from Equations (14) and (15) and Figure 10, as shown in Table 4.
According to Ref. [31], the slope safety factor for an open-pit coal mine dump should be greater than 1.3. The slope stability factor, F, for the Anjialing open-pit coal mine dump without anti-sliding trenches, is 1.3095, indicating low reliability. Therefore, increasing the slope stability to 1.6 enhances the mine’s safety and reliability. The predetermined slope stability factor ranges between 1.595 and 1.723, Figure 9. Hence, with the anti-sliding trench depth set at 1.5 m, and aiming for a safety factor FS1 = 1.6, substituting this into Equation (14) yields an anti-sliding trench width l = 22.68 m. Therefore, under the current conditions of the Anjialing open-pit coal mine dump, to increase the stability factor from 1.3095 to 1.6, it is necessary to preset an anti-sliding trench at the slope’s toe, having a width of 22.68 m and a depth of 1.5 m.

4. Numerical Verification of Slope Stability

4.1. Establishment of the Numerical Model

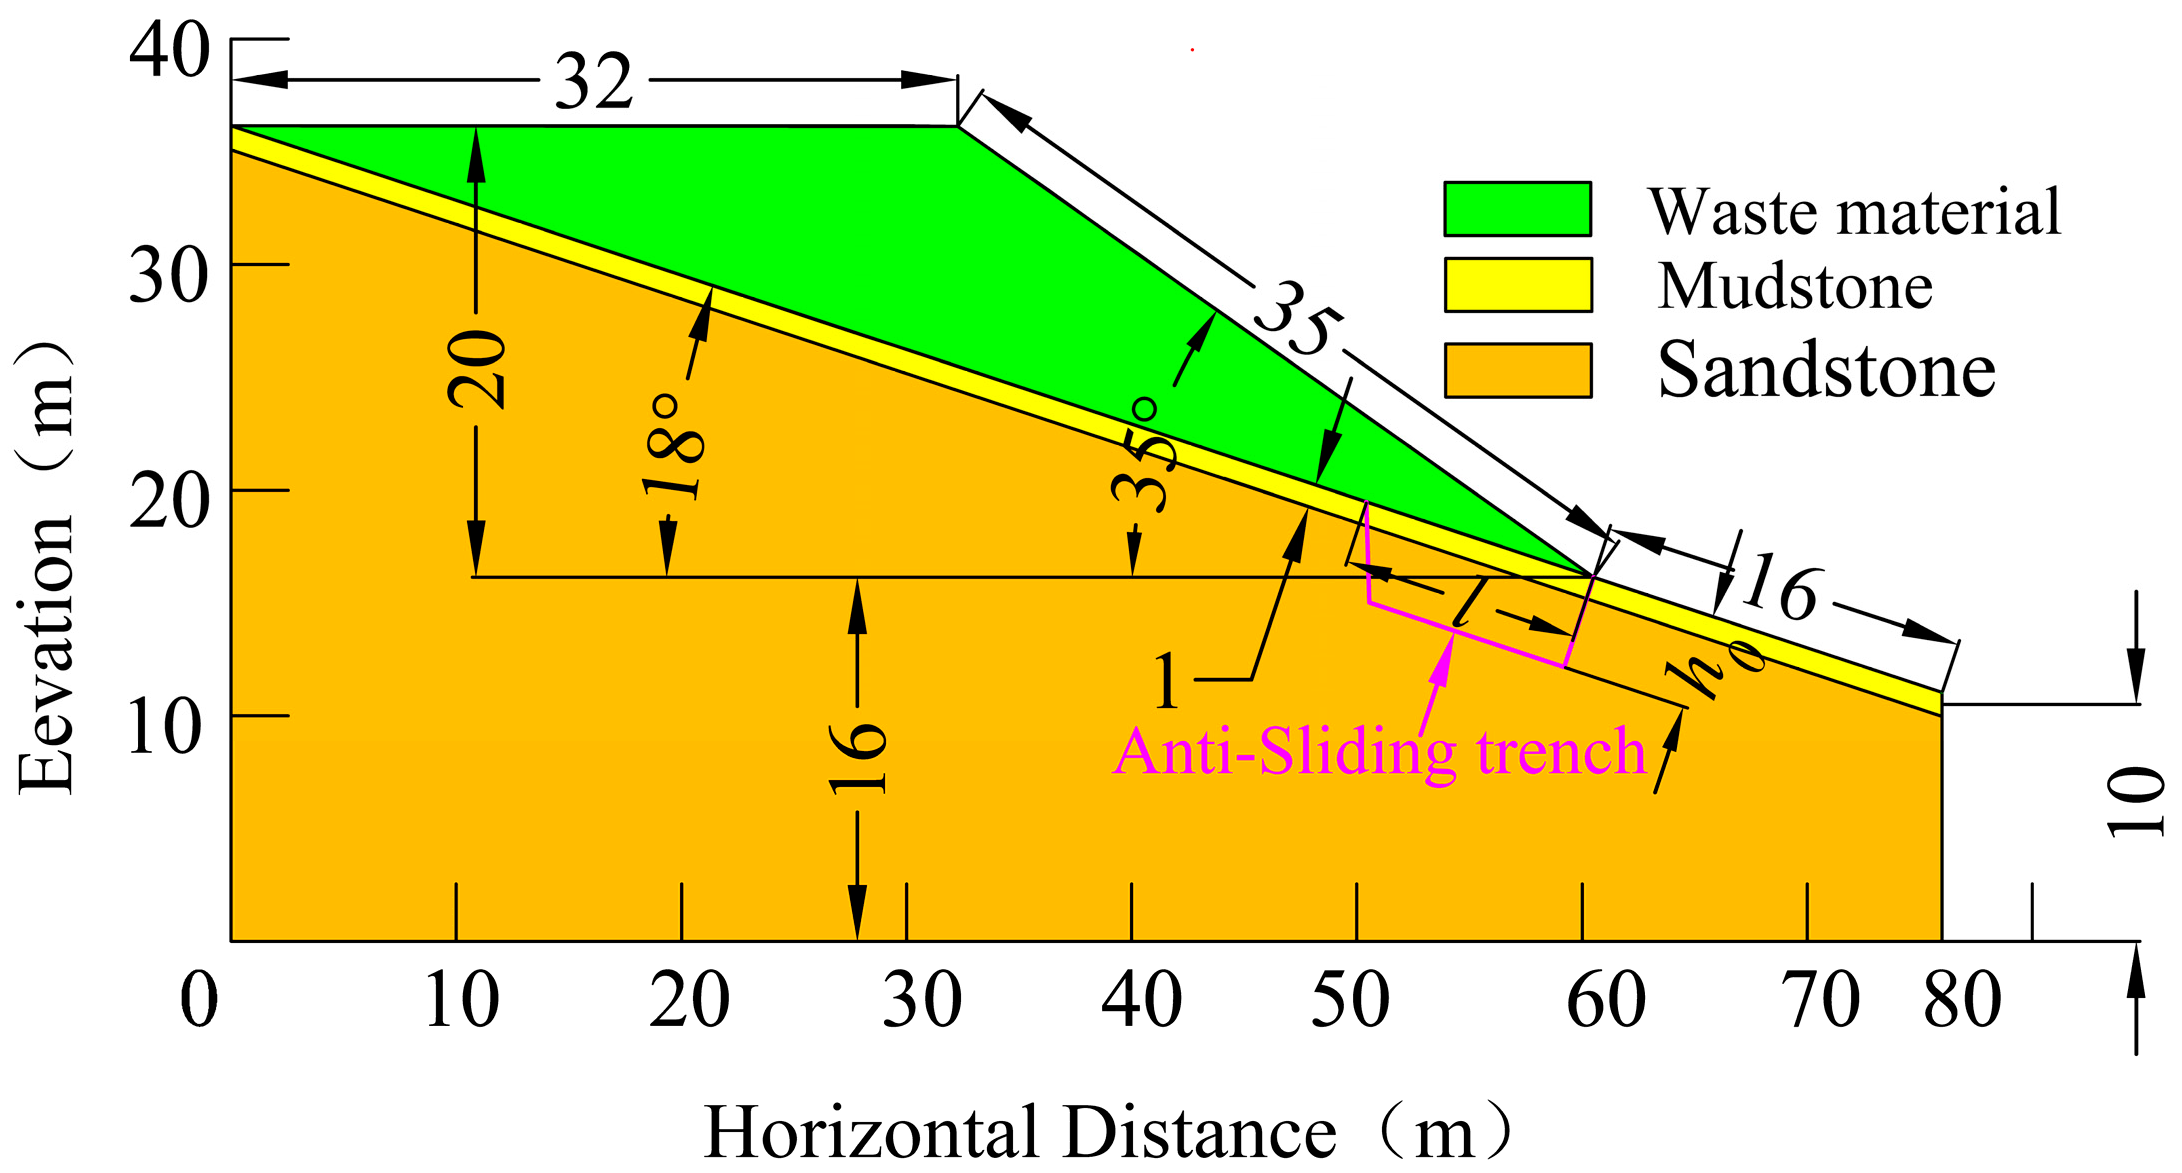
The numerical model of the slope is constructed based on the actual waste dump at the Anjialing coal mine. Due to the monocline geological structure with a dip slope, a two-dimensional model is sufficient to meet research requirements. To minimize the impact of the base on the calculation results, the two-dimensional profile of the numerical model was taken as larger than that of the stepped model. The profile of the computational model was polygonal, with the upper boundary comprising waste dump steps, the waste dump slope, and part of the base slope. The left boundary was a vertical profile at the rear edge of the waste dump steps, and the lower boundary was a vertical profile calculated downward from the slope’s toe. The slope model consisted of waste material, mudstone, and base sandstone, with the mudstone layer being 1 m thick. The model was 76 m long and 36 m high, with a base slope angle of 18°, a waste dump slope angle of 35°, and a vertical height of 20 m for the waste dump steps. The anti-sliding trench was located at the slope’s toe, Figure 13, and the physical and mechanical parameters of each layer are shown in Table 1. The material parameters of the anti-sliding trench are consistent with those of mudstone and sandstone.

4.2. Numerical Simulation and Experimental Comparison Analysis

To further validate the reliability of the theoretical analysis and experimental results mentioned above, numerical simulation analyses of each scenario model were conducted using FLAC3D7.0 software. In these simulations, the upper boundary was set as a free surface, while the other boundaries were constrained, and the loading position was consistent with that in the experiment. The overall failure criterion of the model was selected according to the Mohr-Coulomb criterion. The model was based on the structural characteristics and mechanical parameters of the dumping slope in the Anjialing open-pit mine and was analyzed using a classic section. The model section is shown in Figure 13.
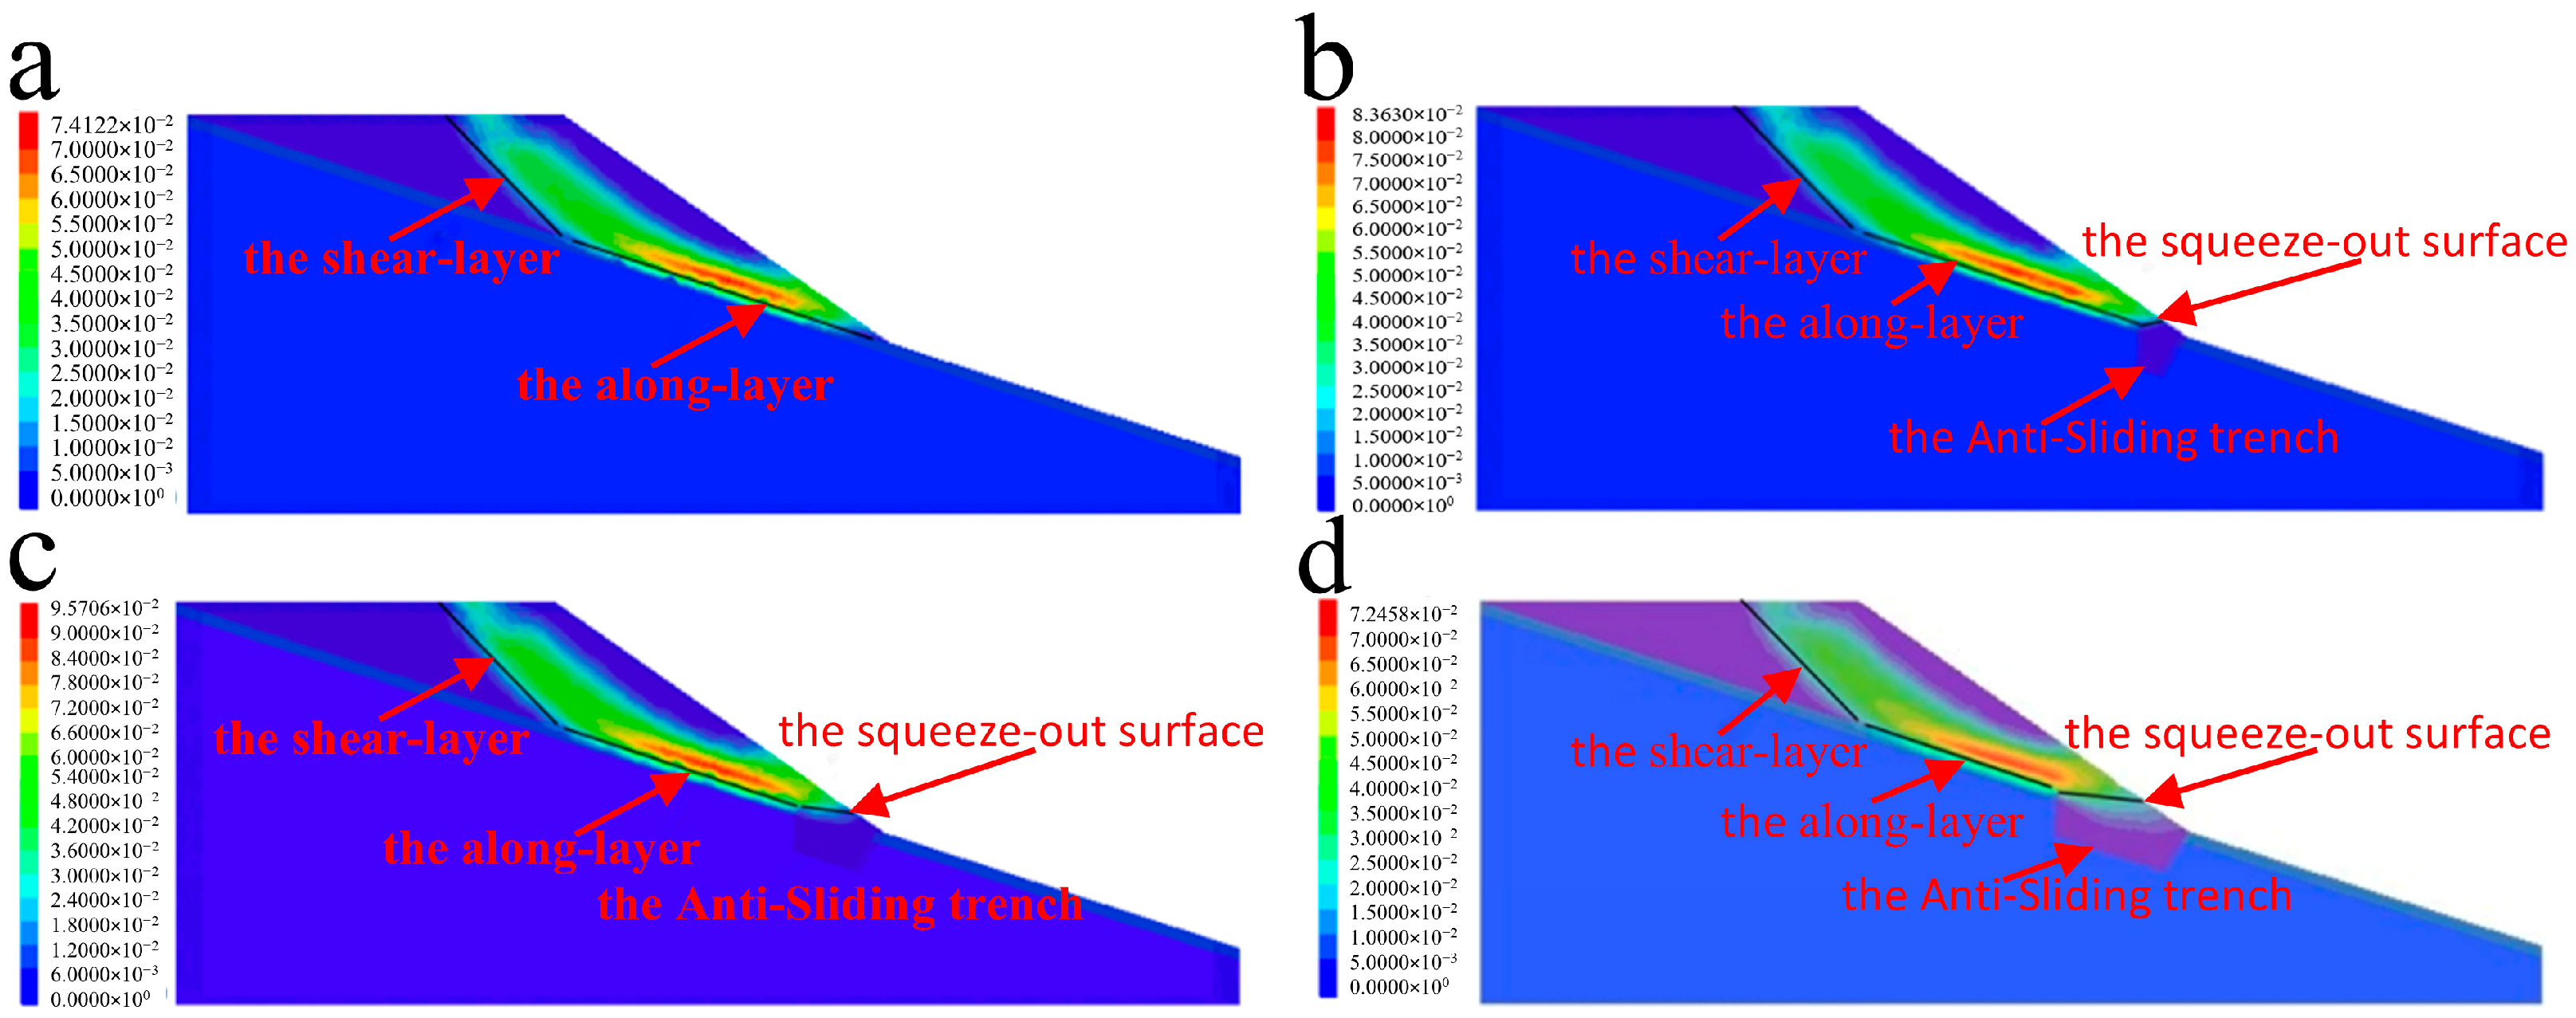
The maximum shear strain increment contour maps for each scenario are shown in Figure 14. It can be observed that the sliding mode of the dumping bench with the anti-slide trench is characterized by shear-layer, along-layer, and squeeze-out failure, with the step’s rear arcuate sliding surface as the shear layer, the base surface as the along-layer, and the location of the anti-sliding trench as the squeeze-out surface. This basically agrees with the similar simulated experiments. It can be concluded that the main effect of the anti-sliding trench is to influence the extrusion position of the upper dumping bench sliding, thereby altering the safety factor of the sliding mass.

4.3. Numerical Calculation of Slope Stability

4.3.1. Model Reliability Analysis

To verify the reliability of the established model, the pre-built numerical model and Geo-Slope/W module within GeoStudio 2024 software were used to calculate the slope stability factors for two scenarios, i.e., without and with a preset anti-sliding trench (22.68 m wide and 1.5 m deep), as derived from the theoretical analysis. The physical and mechanical parameters of the model are listed in Table 1. The stress–strain relationship of the rock mass in the model follows the Mohr-Coulomb yield criterion. The slope stability calculation was performed using the Morgenstern method, which takes into account all force and moment equilibrium conditions, providing a more accurate calculation and enabling handling of the sliding surfaces of any shape [32]. Based on the sliding surface assumptions from the theoretical analysis, the sliding surface was set as a complete calculation model, with the slip surface defined according to the conclusions from the theoretical analysis and physical model tests. The slope stability factor, F, without an anti-sliding trench is 1.290, as determined in numerical calculations. After introducing an anti-sliding trench with a depth of 1.5 m and a width of 22.68 m, the slope stability factor increases to 1.592. The calculation results, Figure 15, are consistent with the theoretical analysis, confirming that the numerical model is reliable.

4.3.2. Results and Analysis

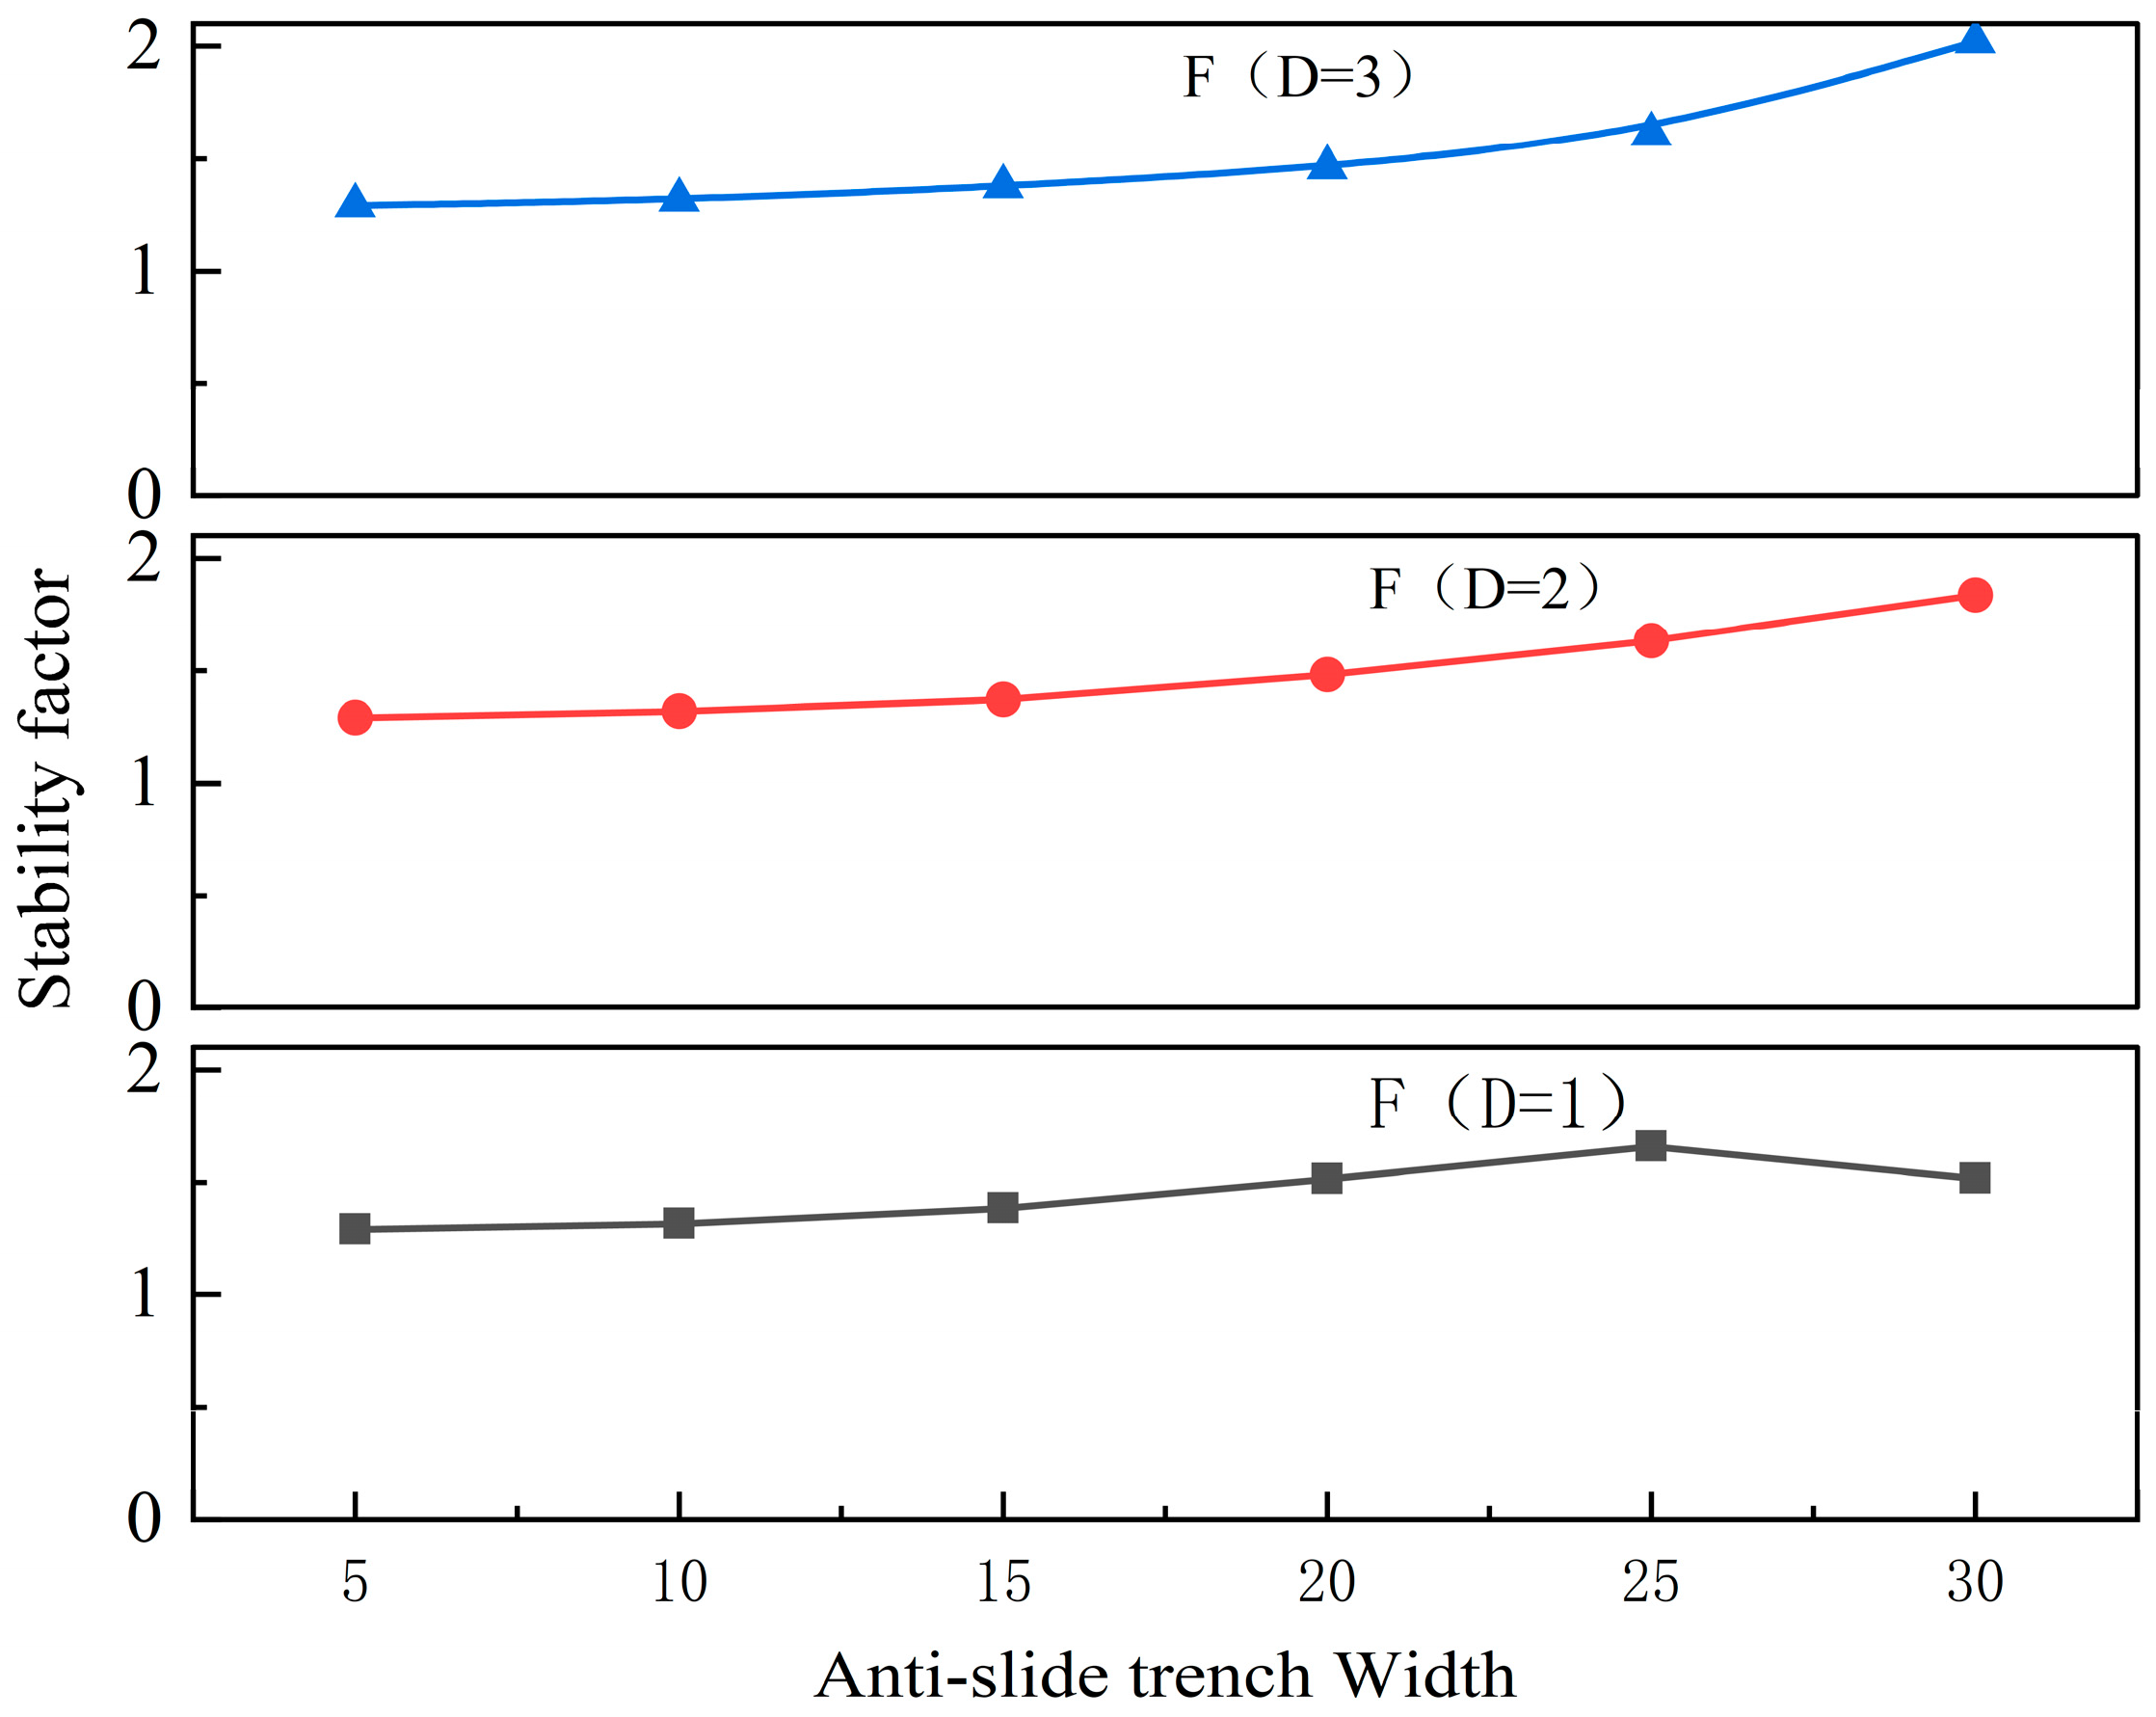
To investigate the effect of different dimensions of an anti-sliding trench on slope stability at the slope’s toe, various trench sizes were considered (trench depth, D: 1, 2, and 3 m; trench width, W: 5, 10, 15, 20, 25, and 30 m). The physical and mechanical parameters of the model are listed in Table 1. Based on the established model (Figure 10), the slope stability factors were calculated using Geo-Slope/W module within GeoStudio 2024software and the Morgenstern method, Table 5, with the sliding surface set according to the physical model tests and theoretical analysis. Figure 16 shows that, except for a depth of 1 m, the stability factor increases with the width of the anti-sliding trench at the same depth, which is consistent with the theoretical analysis, confirming that the anti-sliding trench effectively improves slope stability. The analysis shows that the length of the anti-sliding trench affects the position of the sliding surface, while the depth of the anti-sliding trench has almost no impact on the sliding surface. Consequently, the width of the anti-sliding trench exerts a significant influence on slope stability, whereas its depth has little to no effect. Such findings can be confirmed from Table 4 and Table 5.

5. Discussion

In the theoretical analysis of the effectiveness of using anti-sliding trenches for enhancing slope stability, the sliding surface used in the limit equilibrium theory was assumed based on the failure mode of waste dump steps observed in the conducted simulation experiments (along-layer and extrusion failures). For an anti-sliding trench to enhance the stability of the dump slope, the slope’s sliding surface must be either the contact surface between the waste and the base or a weak layer near the contact surface. Therefore, when the inclination of the waste dump’s base slope is relatively large or there is a weak layer at the base surface, the waste dump steps form a sequential layer failure mode along the base, and the preset anti-sliding trench then significantly improves the slope stability. When the inclination angle is small, the sliding surface of the waste dump steps can be curved, and further research and analysis are needed to determine whether preset anti-sliding trenches could have a stabilizing effect on the slope.
Common methods for improving the slope stability at waste dumps in open-pit coal mines include anti-sliding piles, basal roughening blasting, placing anti-sliding coal pillars, building anti-sliding retaining walls, and treating weak basal rock layers with replacement methods. In a complex geological environment of open-pit coal mines, the application of these methods often requires adaptation to site-specific conditions: for example, anti-sliding piles need to be designed with a strict consideration of geological complexity (e.g., weak strata) to ensure construction feasibility, while anti-sliding coal pillars are often constrained by resource conservation requirements in practical engineering. In comparison to these common measures, anti-sliding trenches exhibit distinct advantages in construction and cost-effectiveness for open-pit coal mine waste dumps. Their construction can be completed using blasting excavation, a technique widely applied in coal mining operations, making the process relatively straightforward and adaptable to the on-site construction conditions. Additionally, the slope stability factor can be effectively improved by adjusting the width and depth of anti-sliding trenches, though it should be noted that the project cost will increase accordingly with the expansion of reinforcement dimensions. Therefore, to optimize the application of anti-sliding trenches in engineering practice for slope stability enhancement, multiple factors must be comprehensively considered: the positive contribution of the trench width and depth to stability, the project’s stability improvement goals, the overall cost budget, as well as the correlation between the anti-sliding effect of trenches and their layout position along the slope and the slope’s inherent geological conditions. Furthermore, the combined use of anti-sliding trenches with other slope stability improvement methods (e.g., anti-sliding piles, basal roughening blasting) has shown promising potential in addressing the challenges of complex geological environments in coal mines, providing a more flexible and efficient solution for slope stability control. In summary, enhancing slope stability via anti-sliding trenches (either independently or in combination with other measures) is a practical and promising direction for engineering applications and research in open-pit coal mine waste dumps.
In case of a weak interlayer between the slope base of a coal mine dump and waste material, and when the internal friction angle and cohesion of the weak interlayer at the base are lower than those of the waste material, presetting anti-sliding trenches can be considered to replace the weak base rock mass with waste material that has a higher internal friction angle and cohesion, which will have a beneficial effect [33]. When the dump slope is subject to rainfall or surface water, water infiltrates the base rock layer through the waste slope, and the cohesion and friction angle of the base rock mass decrease after saturation, thus reducing the overall slope stability [34]. Under these conditions, preset anti-sliding trenches can discharge water, on one hand, and replace the saturated water-bearing rock mass, on the other hand, significantly improving slope stability. To prevent the negative effect of rainwater on the anti-sliding trench, highly permeable gravel should be prioritized for dumping at the trench during the waste disposal process. This helps increase the permeability of the waste material within the anti-sliding trench, enabling rainwater to flow out from both ends of the trench. In this way, the anti-sliding effect of the trench is not impaired by the prolonged influence of rainwater.

6. Conclusions

A technique for enhancing the slope stability of internal waste dumps with inclined bases in open-pit coal mines via pre-set anti-sliding trenches was proposed, and its effectiveness was verified through experiments and theoretical analysis. The main conclusions can be drawn as follows:
(1)
The failure modes of the slope in the internal dump with an inclined base of an open-pit coal mine are shear failure along the rear edge of the slope and failure along the base bedding plane. After presetting anti-sliding trenches at the toe of the inclined dump base in the open-pit coal mine, the failure mode is changed from “shear-layer and along-layer failure” to “shear-layer, along-layer, and squeeze-out failures”. The preset anti-sliding trenches alleviate the stress concentration at the slope toe by changing the position of the sliding surface.
(2)
After presetting anti-sliding trenches on the slope surface of the inclined base in the internal dump of an open-pit coal mine, the slope stability is not only related to the physical and mechanical parameters of the slope materials but also closely associated with the dimensions of the preset anti-sliding trenches. Within a certain range, the slope stability increases with the anti-sliding trench width, while it is less affected by the anti-sliding trench depth. By using the formula derived in this paper, an analysis was conducted on the dimensions of the preset anti-sliding trenches required to achieve the stability improvement goal for the waste dump steps at Anjialing Coal Mine: when the trench has a depth of 1.5 m and a width of 22.68 m, the stability factor of the step slope increases from 1.3095 to 1.6.
(3)
Presetting anti-sliding trenches at the slope toe on the inclined base surface of an open-pit coal mine dump not only alters the stress concentration at the slope toe to enhance slope stability but also effectively drains seepage water from the dump and replaces weak rock layers. This broadens the application spectra of anti-sliding trenches; additionally, it is also highly effective for slopes with larger gradients and weaker base surface layers.
(4)
In the design of anti-sliding trenches for the slope of an internal dump with an inclined base in an open-pit coal mine, multiple anti-sliding trenches can also be designed on the slope surface of the base to improve slope stability, besides arranging an anti-sliding trench at the base of the slope toe. The quantitative calculation of slope stability can be conducted using the method proposed in this paper. However, it should also be noted that although the installation of anti-sliding trenches can enhance slope stability, their application in engineering practice is relatively limited and has not been well verified in engineering practice. During the application process, it is essential to strengthen the monitoring and early warning mechanisms to prevent the occurrence of slope disasters.

Author Contributions

H.Z.: Writing—review and editing, Methodology, Supervision, Funding acquisition. H.W. and B.Q.: Writing—original draft. H.D.: Visualization, Validation, Investigation. Z.S.: Formal analysis. All authors have read and agreed to the published version of the manuscript.

Funding

This research was funded by the Key Science and Technology Project of the Ministry of Emergency Management of the People’s Republic of China, grant number 2024EMST080802; the National Key R&D Program of China, grant number 2022YFB4703701.

Institutional Review Board Statement

Not applicable.

Informed Consent Statement

Not applicable.

Data Availability Statement

The original contributions presented in this study are included in the article. Further inquiries can be directed to the corresponding author.

Acknowledgments

The authors thank the anonymous reviewers, who provided valuable suggestions that improved the manuscript.

Conflicts of Interest

Author Hairui Du was employed by the company Kunming Metallurgical Research Institute Co., Ltd. The remaining authors declare that the research was conducted in the absence of any commercial or financial relationships that could be construed as a potential conflict of interest.

References

  1. Zhao, H.Z. Key Mining Technology Research and Application in Surface Mine from Flat Seam to Inclined Seam. Ph.D. Dissertation, China University of Mining and Technology (Beijing), Beijing, China, 2012. [Google Scholar]
  2. Cao, B. The Optimization Research and Application of Surface Mine Transition Alternative Mode of Mining Area and Transportation Dumping Engineering Under Complicated Geological Conditions. Ph.D. Dissertation, China University of Mining and Technology (Beijing), Beijing, China, 2012. [Google Scholar]
  3. Wang, D.; Li, G.H.; Cao, L.Z.; Bai, R.C.; Song, Z.L.; Zhao, J.C. Method for arranging the working line of internal waste dump in surface coal mining based on maximizing utilization. J. China Coal Soc. 2020, 45, 3150–3156. [Google Scholar] [CrossRef]
  4. Zhou, W.; Han, L.; Cai, Q.X. Influence of inner dump on end-slope stability. J. Min. Saf. Eng. 2015, 32, 671–676. [Google Scholar] [CrossRef]
  5. Liu, F.M.; Cai, Q.X.; Zhou, W.; Fang, J. Experimental study on the rainfall infiltration rule in the dump slope of surface mines. J. China Coal Soc. 2015, 40, 1534–1540. [Google Scholar] [CrossRef]
  6. Zhao, H.Z.; Wang, D.Y.; Ma, M.; Zheng, K.H. Parameter inversion and location determination of evolutionary weak layer for open-pit mine slope. Int. J. Coal Sci. Technol. 2020, 7, 714–724. [Google Scholar] [CrossRef]
  7. Song, Z.L.; Liu, W.F.; Fan, J.F.; Yang, X.C.; Cao, L.Z. Analysis of the inner dumping slope stability with inclining basement. Met. Mine 2018, 179–183. [Google Scholar] [CrossRef]
  8. Zhao, H.Z.; Du, H.R.; Tao, Z.G.; Lin, Z.C. Method and mechanism of dump overlying the bedrock with large dip angle in opencast mine. Adv. Civ. Eng. 2021, 2021, 6632944. [Google Scholar] [CrossRef]
  9. Cao, L.Z.; Zhang, J.F.; Wang, D. Instability mechanism and control of the dump slope with soft inclined composite basement. Met. Mine 2019, 43–47. [Google Scholar] [CrossRef]
  10. Shiau, J.; Lai, V.Q.; Keawsawasvong, S. Multivariate adaptive regression splines analysis for 3D slope stability in anisotropic and heterogenous clay. J. Rock Mech. Geotech. Eng. 2023, 15, 1052–1064. [Google Scholar] [CrossRef]
  11. Lann, T.S.; Bao, H.; Lan, H.X.; Zheng, H.; Yan, C.G.; Peng, J.B. Hydro-mechanical effects of vegetation on slope stability: A review. Sci. Total Environ. 2024, 926, 171691. [Google Scholar] [CrossRef]
  12. Kardani, N.; Zhou, A.; Nazem, M.; Shen, S.-L. Improved prediction of slope stability using a hybrid stacking ensemble method based on finite element analysis and field data. J. Rock Mech. Geotech. Eng. 2021, 13, 188–201. [Google Scholar] [CrossRef]
  13. Shi, S.H.; Guo, Z.Z.; Ding, P.; Tao, Y.B.; Mao, H.; Jiao, Z.C. Failure mechanism and stability control technology of slope during open-pit combing underground extraction: A case study from Shanxi Province of China. Sustainability 2022, 14, 8939. [Google Scholar] [CrossRef]
  14. Dong, F.L.; Zhang, G.Q. A study on the application of the bumpy surface blasting method. J. Fuxin Min. Inst. 1988, 2, 95–102. [Google Scholar]
  15. Bi, J.W.; Gao, G.Y.; Zhang, J.J. Centrifuge model test of soft soil for pile-net composite foundation with overlying sloping base reinforced by inclined piles. J. Tongji Univ. (Nat. Sci.) 2020, 48, 953–961. [Google Scholar] [CrossRef]
  16. Wang, D.; Li, G.H.; Cao, L.Z.; Bai, R.C.; Song, Z.L. Mechanical effect of supporting and retaining coal pillar on internal waste dump with weak basement. J. China Coal Soc. 2019, 44, 934–941. [Google Scholar] [CrossRef]
  17. Mahanta, A.; Bhowmik, R.; Datta, M. Stabilization of hazardous solid waste landfill on sloping ground with variable base inclination. In Proceedings of the Eighth International Conference on Case Histories in Geotechnical Engineering, Austin, TX, USA, 24–27 March 2019; pp. 62–71. [Google Scholar]
  18. Kumar, A.; Das, S.K.; Nainegali, L.; Reddy, K.R. Phytostabilization of coalmine overburden waste rock dump slopes: Current status, challenges, and perspectives. Bull. Eng. Geol. Environ. 2023, 82, 130. [Google Scholar] [CrossRef]
  19. Bhowmik, R.; Sukumar, R.; Datta, M.; Shahu, J.T. The Use of Geosynthetic Reinforcement for Enhancing the Stability of the Geomembrane–Soil Interface along the Slopes of Cover Systems of MSW Landfills. In Proceedings of the Geo-Chicago 2016, Chicago, IL, USA, 26–29 August 2016; pp. 307–318. [Google Scholar]
  20. Bao, H.; Liu, L.; Lan, H.; Peng, J.; Yan, C.; Tang, M.; Guo, G.; Zheng, H. Evolution of high-filling loess slope under long-term seasonal fluctuation of groundwater. Catena 2024, 238, 107898. [Google Scholar] [CrossRef]
  21. Li, Z.G.; Li, W.L.; Xu, Q.; Lu, H.Y.; Fu, H.; Guo, P.Y.; Zhao, J.J.; Yu, C.W. Preliminary analysis of the catastrophic February 22nd 2023 Xinjing open-pit mine landslide, Inner Mongolia, China. Landslides 2024, 21, 1053–1067. [Google Scholar] [CrossRef]
  22. Jia, L.; Wang, J.; Gao, S.; Fang, L.; Wang, D. Landslide risk evaluation method of open-pit mine based on numerical simulation of large deformation of landslide. Sci. Rep. 2023, 13, 15410. [Google Scholar] [CrossRef]
  23. Yang, Y.S.; Yi, X.; Hu, P.; Dong, Q. The optimized design for groove parameters based on cement pavement materials performance. Adv. Mater. Res. 2011, 213, 613–617. [Google Scholar] [CrossRef]
  24. Jiang, S.Z. Case analysis of the impact of anti-slide trenches on the stability of gravity dams on gently inclined downstream bedrock. Water Conserv. Sci. Technol. Econ. 2015, 21, 54–56. [Google Scholar] [CrossRef]
  25. Qian, G.P.; Li, S.J.; Yu, H.N.; Gong, X.B. Interlaminar bonding properties on cement concrete deck and phosphorous slag asphalt pavement. Materials 2019, 12, 1427. [Google Scholar] [CrossRef]
  26. Hou, C.H. Analysis and control of slope stability of end wall coal mining in Anjialing open-pit mine. Saf. Coal Mines 2022, 53, 235–240. [Google Scholar] [CrossRef]
  27. Yang, X. Study on the Stability of South Slope In-Pit Dump of Anjialing Open Pit Mine. Master’s Thesis, Liaoning Technical University, Fuxin, China, 2012. [Google Scholar]
  28. Zhu, J.M.; Liu, X.Q.; Feng, J.Y.; Wu, J.P. Study on slope stability and optimization of boundary parameters under condition of combined open-underground mining. Chin. J. Rock Mech. Eng. 2009, 28, 3971–3977. [Google Scholar] [CrossRef]
  29. Li, C.H.; Xiao, Y.G.; Wang, Y.; Bu, L.; Hou, Z.Q. Review and prospects for understanding deformation and failure of rock slope in cold regions with high altitude. Chin. J. Eng. 2019, 41, 1374–1386. [Google Scholar] [CrossRef]
  30. Ma, L.; Jin, X.Y.; Zhang, Q.F.; Jiang, K.S.; Li, M.B.; Hu, Y. Stability analysis of the inner dump with inclined base considering anti-slip pillar. Coal Sci. Technol. 2024, 52, 181–188. [Google Scholar] [CrossRef]
  31. GB/T 37573-2019; Technical Specification for Annual Evaluation of the Stability of Open-Pit Coal Mine Slopes. State Administration for Market Regulation, Standardization Administration of China: Beijing, China, 2019.
  32. Wang, J.C.; Sun, S.W. Slope Engineering in Open-Pit Mines; Science Press: Beijing, China, 2016. [Google Scholar]
  33. Tu, L.X.; Tian, Y.; Wang, Z.L.; Zhou, W.; Cai, Q.X.; Lu, X. Study on slope stability under different weak layer replacement parameters in open-pit mines. Coal Mine Saf. 2023, 54, 214–220. [Google Scholar] [CrossRef]
  34. Bang, V.S.; Wang, Y.; Vu, T.; Zhou, W.; Liu, X.; Ao, Z.C.; Nguyen, D.; Pham, H.; Nguyen, H. The influence of rainfall and evaporation wetting–drying cycles on the open-pit coal mine dumps in Cam Pha, Quang Ninh Region of Vietnam. Appl. Sci. 2024, 14, 1711. [Google Scholar] [CrossRef]
Figure 1. Model test box. (a) Panoramic view; (b) View along the width direction; (c) View along the length direction.
Applsci 15 10510 g001
Figure 2. Establishing the physical model of an inclined bedrock: (a) Test ① model; (b) Test ② model; (c) Test ③ model; and (d) Test ④ model.
Applsci 15 10510 g002
Figure 3. Slope surface cracks. Horizontal rows represent experiments ①, ②, ③, and ④. Vertical columns represent four loading stages: (ad) L represents the distance from the slope’s toe to the transverse crack; (e) the schematic diagram of model loading.
Applsci 15 10510 g003
Figure 4. Displacement curves at monitoring points. (a) No anti-sliding trench (experiment ①); (b) Anti-sliding trench with a 4 m width (Experiment ②); (c) Anti-sliding trench with an 8 m width (Experiment ③); (d) Anti-sliding trench with a 12 m width (Experiment ④); (e) Arrangement of monitoring points.
Applsci 15 10510 g004
Figure 5. Section view of cracks. (a) Side view of experiment ① after three loading stages; (b) Side view of experiment ② after three loading stages; (c) Side view of experiment ③ after three loading stages; (d) Side view of experiment ④ after three loading stages.
Applsci 15 10510 g005
Figure 6. Schematic diagram of the single bench dump slope without anti-sliding trenches.
Applsci 15 10510 g006
Figure 7. Schematic diagram of the single bench dump slope with anti-sliding trenches.
Applsci 15 10510 g007
Figure 8. Schematic representations of two hypotheses sliding surfaces. (a) Hypothesis: FA2+A3 > FA1; (b) Hypothesis: FA2+A3 < FA1.
Applsci 15 10510 g008
Figure 9. Simplified force diagram of waste extruded along the horizontal plane at the upper opening of the anti-sliding trench. WA11 represents the gravity of A11, in kN; WA12 represents the gravity of A12, in kN; R11 represents the anti-sliding force of A11, in kN; R12 represents the anti-sliding force of A12, in kN; P represents the maximum thrust of A12 on A11, in kN, and −P represents the maximum thrust of A11 on A12 (the reaction force of A12 on A11), in kN; α represents the angle of the base slope of the waste dump, in degrees; β represents the slope angle of the waste dump, in degrees; N11 represents the supporting force of the base on A11, in kN, and N11 = WA11cosα. N12 represents the supporting force of A2 on A12, in kN, and N12 = WA12 + Psinα. AD represents the depth of the anti-sliding trench, in m. AF represents the width of the anti-sliding trench in the slope inclination direction, in m, and h represents the slope’s vertical height, in m.
Applsci 15 10510 g009
Figure 10. Force diagram of waste material extrusion along the bottom horizontal plane of the anti-sliding trench.
Applsci 15 10510 g010
Figure 11. Calculation of the Anti-Sliding Trench Parameters.
Applsci 15 10510 g011
Figure 12. The relationship between the slope stability and anti-sliding trench dimensions.
Applsci 15 10510 g012
Figure 13. Numerical model of the waste dump steps.
Applsci 15 10510 g013
Figure 14. Cloud charts of maximum shear strain increments for each scheme. (a) No anti-sliding trench; (b) 4 m anti-sliding trench; (c) 8 m anti-sliding trench; (d) 12 m anti-sliding trench.
Applsci 15 10510 g014
Figure 15. Numerical calculation model.
Applsci 15 10510 g015
Figure 16. The slope stability factor for different anti-sliding trench dimensions.
Applsci 15 10510 g016
Table 1. Physical and mechanical parameters of rock layers.
Rock LayerDensity/
g/cm3
Cohesion/kPaInternal Friction Angle, φ/°Elastic Modulus/104 MPaPoisson’s Ratio
Waste1.999.7180.0170.39
Mudstone2.23154.428.51.210.31
Sandstone2.3361.527.11.950.22
Table 2. Comparison between the model’s physical parameters and the actual engineering physical parameters.
Name of the Rock LayerSand (%)Lime (%)Plaster (%)
Sandstone87.56.256.25
Mudstone88.898.892.22
Waste90.99.10
Table 3. Similarity Ratio used in the model.
Physical ParameterSimilarity RatioModel Value and UnitActual Engineering Value and Unit
Slope Model and DimensionsSlope Length (along the slope)10035 cm35 m
Slope Height (vertical)10020 cm20 m
Slope Angle118°18°
Base Rock Slope Angle135°35°
Anti-sliding Trench DimensionsAnti-sliding Trench Depth1004 cm4 m
Anti-sliding Trench Width 4 cm/8 cm/12 cm4 m/8 m/12 m
LoadStress15010.62 Pa/16.82 Pa1592.5 Pa/2523.5 Pa
Materials (Waste, Mudstone, Sandstone)Density1.5See values in Table 1 for actual engineering values; model values are the actual values divided by the similarity ratio.
Cohesion150
Internal Friction Angle1
Elastic Modulus150
Poisson’s Ratio1
Table 4. Slope stability factors for anti-sliding trenches of different sizes.
h0 (m)F (l = 5 m)F (l = 10 m)F (l = 15 m)F (l = 20 m)F (l = 25 m)F (l = 30 m)
0.51.3121.3421.4041.4551.4521.449
11.3121.3421.4041.5131.5901.582
1.51.3121.3421.4041.5131.6991.710
21.3121.3421.4041.5131.6991.833
2.51.3121.3421.4041.5131.6991.953
31.3121.3421.4041.5131.6992.040
Table 5. Numerical calculation results of slope stability for different anti-sliding trench dimensions.
DF (W = 5)F (W = 10)F (W = 15)F (W = 20)F (W = 25)F (W = 30)
11.2911.3161.3841.5141.6581.516
21.2901.3201.3721.4821.6331.837
31.2911.3161.3751.4601.6102.02
Disclaimer/Publisher’s Note: The statements, opinions and data contained in all publications are solely those of the individual author(s) and contributor(s) and not of MDPI and/or the editor(s). MDPI and/or the editor(s) disclaim responsibility for any injury to people or property resulting from any ideas, methods, instructions or products referred to in the content.