Article

Shear Mechanical Properties of Rock Joints Under Non-Uniform Load Based on DEM

1
School of Resources and Safety Engineering, Central South University, Changsha 410083, China
2
Yunnan Diqing Non-Ferrous Metals Co., Ltd., Shangri-La 674400, China
3
China Railway 5 Engn Grp Co., Ltd., Guiyang 550003, China
*
Authors to whom correspondence should be addressed.
Appl. Sci. 2025, 15(8), 4257; https://doi.org/10.3390/app15084257
Submission received: 20 February 2025 / Revised: 29 March 2025 / Accepted: 9 April 2025 / Published: 12 April 2025
(This article belongs to the Special Issue New Trends in Slope Stability)

Abstract

:
Previous joint test studies have mainly been conducted under the condition of uniformly distributed loads, but in engineering, overlying loads are often non-uniformly distributed. It is necessary to investigate the shear mechanical properties of joints under non-uniform loads. This paper establishes three typical mechanical models: far-field concentration (FFC), near-field concentration (NFC), and focus on center (FOC). Direct shear test simulations using the DEM software PFC reveal that the location of load concentration affects main shear parameters. The closer the load concentration is to the far end along the shear direction, the greater the deformation of rock mass during failure is, the higher the proportion of shear cracks is, and the greater the strength and energy required for failure are. Compared to a uniformly distributed load (UD) condition, FOC shows similar mechanical properties; NFC yields inferior outcomes, while FFC results in superior mechanical performance compared to UD. By utilizing machine learning, five prediction models for non-uniform load shear strength are developed, with the Genetic-XGBoost algorithm demonstrating the highest accuracy. Weight calculation results indicate that load distribution form is the most critical factor influencing shear strength.

1. Introduction

Joints control the mechanical stability of rock masses [1], and their deterioration often leads to project destabilization, such as slope sliding and tunnel collapse, which seriously threaten life and property safety [2,3,4,5]. Typically, slip along the contact interface is the predominant mode of joint failure [6,7]. Therefore, investigating the shear mechanical properties of rock joints is imperative in computer-aided geotechnical engineering to understand potential hazards and formulate effective mitigation strategies.
The shear mechanical properties of joints are influenced by various factors including overburden thickness, roughness, filling conditions, and rock yield [8,9,10,11]. Numerous researchers have studied the impact of overburden loads on the shear mechanical properties of joints. For example, Esaki, Du [12] investigated the effect of shear deformation on the hydraulic conductivity of joints under normal load boundary conditions and found a similar trend between hydraulic conductivity and the shear expansion of joints. Xia, Yu [13] conducted shear tests on joints with different roughness with varying normal stiffness and infiltration pressure to reveal the hydraulic mechanism under normal stiffness (CNS) boundary conditions, considering effective normal stress interaction, normal stiffness, infiltration water pressure, and joint roughness. Zhang, Li [14] performed multi-stage creep tests on joints under different normal stresses to uncover the influencing mechanism of normal stress on creep characteristics. Liu, Liu [15] obtained factors influencing strength in jointed rock masses through a series of tests on structural surfaces under different circumferential pressures while proposing a criterion for strength under complex stress conditions. In terms of dynamics, Li, Gong [16] proposed two coupled loading methods, “critical static stress + slight disturbance” and “elastic static stress + impact disturbance”, to reveal the mechanical mechanism of rocks under dynamic loading. Okubo, Fukui [17] prepared tuff specimens under two conditions: natural air drying and saturation. Lajtai, Schmidtke [18] carried out uniaxial creep tests for 14.5 years to study the creep characteristics of rocks on a 10-year scale, analyzing the influence of water on rock creep mechanical properties based on indoor creep tests. Wu, Jiang [19] studied the shear properties of anchored joints under cyclic loading through laboratory shear tests, finding that the shear strength of bolted connections decreases more significantly than that of non-bolted connections.
The existing studies have effectively elucidated the mechanical mechanisms of joints under various conditions. However, these studies have been conducted based on the assumption of uniformly distributed overburden loads. In reality, due to diverse boundary conditions, overburden thicknesses along the joints often exhibit variations, resulting in a non-uniform distribution of overburden load (Figure 1). In this study, to investigate the mechanical properties of joints under non-uniform load and establish a shear theory that reflects their actual state, we initially constructed a non-uniform-load mechanical model incorporating common forms of overburden load distribution in engineering applications using the strip partitioning method. Subsequently, we conducted a series of simulations to examine the shear mechanical behavior of joints using the DEM software PFC while focusing on the impact different load distribution forms have on shear mechanical parameters, crack development, and energy evolution laws. Finally, we developed a shear strength criterion under non-uniform load using machine learning techniques, providing theoretical support for stability assessment and the reinforcement of rock-related projects.

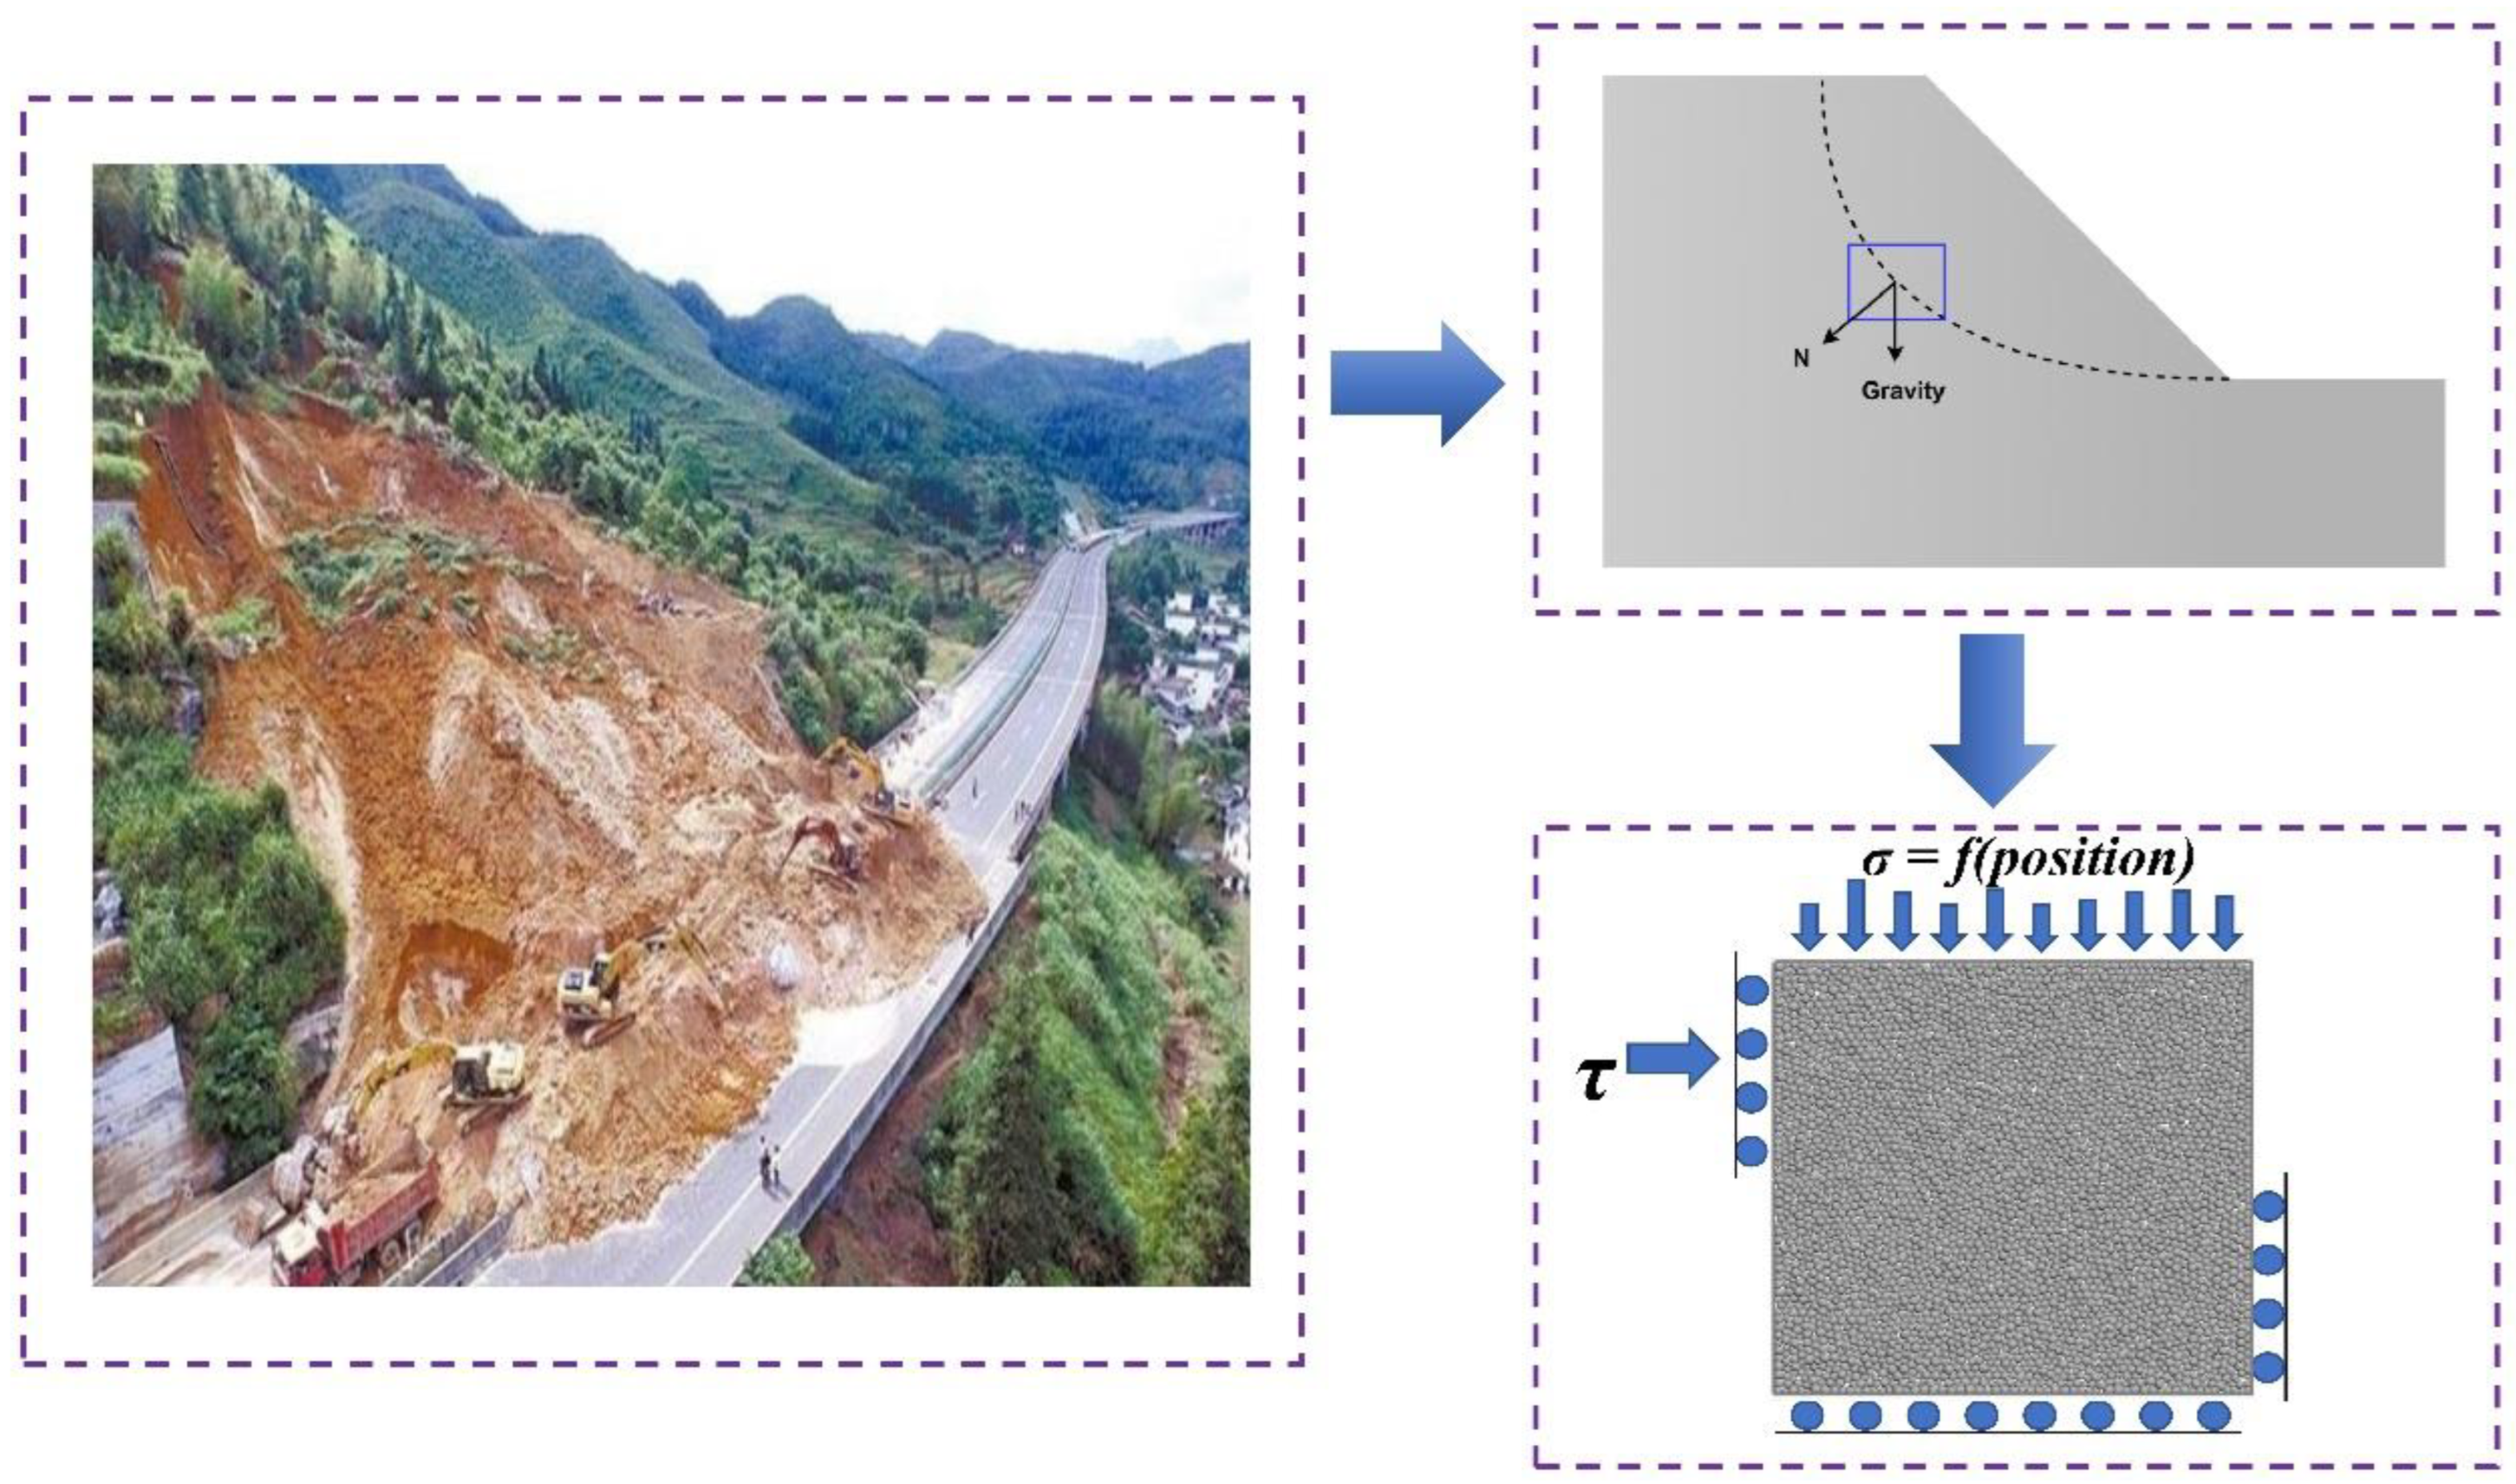
2. Modeling of Non-Uniform Load Mechanics

Establishing a mechanics model that accurately reflects non-uniform load conditions is the foundation of this study. Assuming that the joint is smooth, we constructed an overburden load mechanics model using the strip division method [20]. According to this, three typical forms of overburden load distribution are observed on slopes and in tunnels (Figure 2). The first and second forms of load distribution are commonly encountered in tunneling conditions, where the load on the joint comes from the dead weight of the overlying strata (P = mgh), with its magnitude determined by the height of the overlying strata. Since the angle of the joint remains constant, both distribution forms (a) and (b) exhibit proportional increases or decreases in height along with shear direction while maintaining an isometric pattern. The difference Ld between adjacent loads depends on the angle α. The third type of load distribution, often found in slope conditions, features more overlying strata above the joint center that symmetrically decrease along both sides with a constant difference; thus, this results in greater overlying loads at the joint center tapering off evenly on both sides.
In this study, these three distribution forms are designated as far-field concentration (FFC), near-field concentration (NFC), and focus on central (FOC) based on their respective patterns along the shear direction indicating varying degrees of load concentration. To accurately represent how different modes of load distribution affect mechanical properties at joints, we divide each form into equal strips and use identical differences in applied loads for NFC and FFC distributions, respectively [21]. The magnitude distributions within NFC and FFC strips relative to the shear direction can be expressed as follows:
G T = N G 1 + N ( N 1 ) G d 2 G n = G 1 + ( n 1 ) G d
where G T is the total overlying load, N is the total number of strip loads, G n is non-uniform load at different positions, n is the sequence number of each sub-load, G 1 is the first strip load along the shear direction, and G d is the load difference between each strip load.
For FOC, the load decreases with the same difference along the node, and the distribution of the load with the shear direction can be expressed as follows:
G T = 2 [ N 2 G 1 + N 2 ( N 2 1 ) G d 2 ] G n = G 1 + ( n 1 ) G d ( n N 2 ) G n = G N 2 ( n 1 ) G d ( n > N 2 )

3. Numerical Modeling

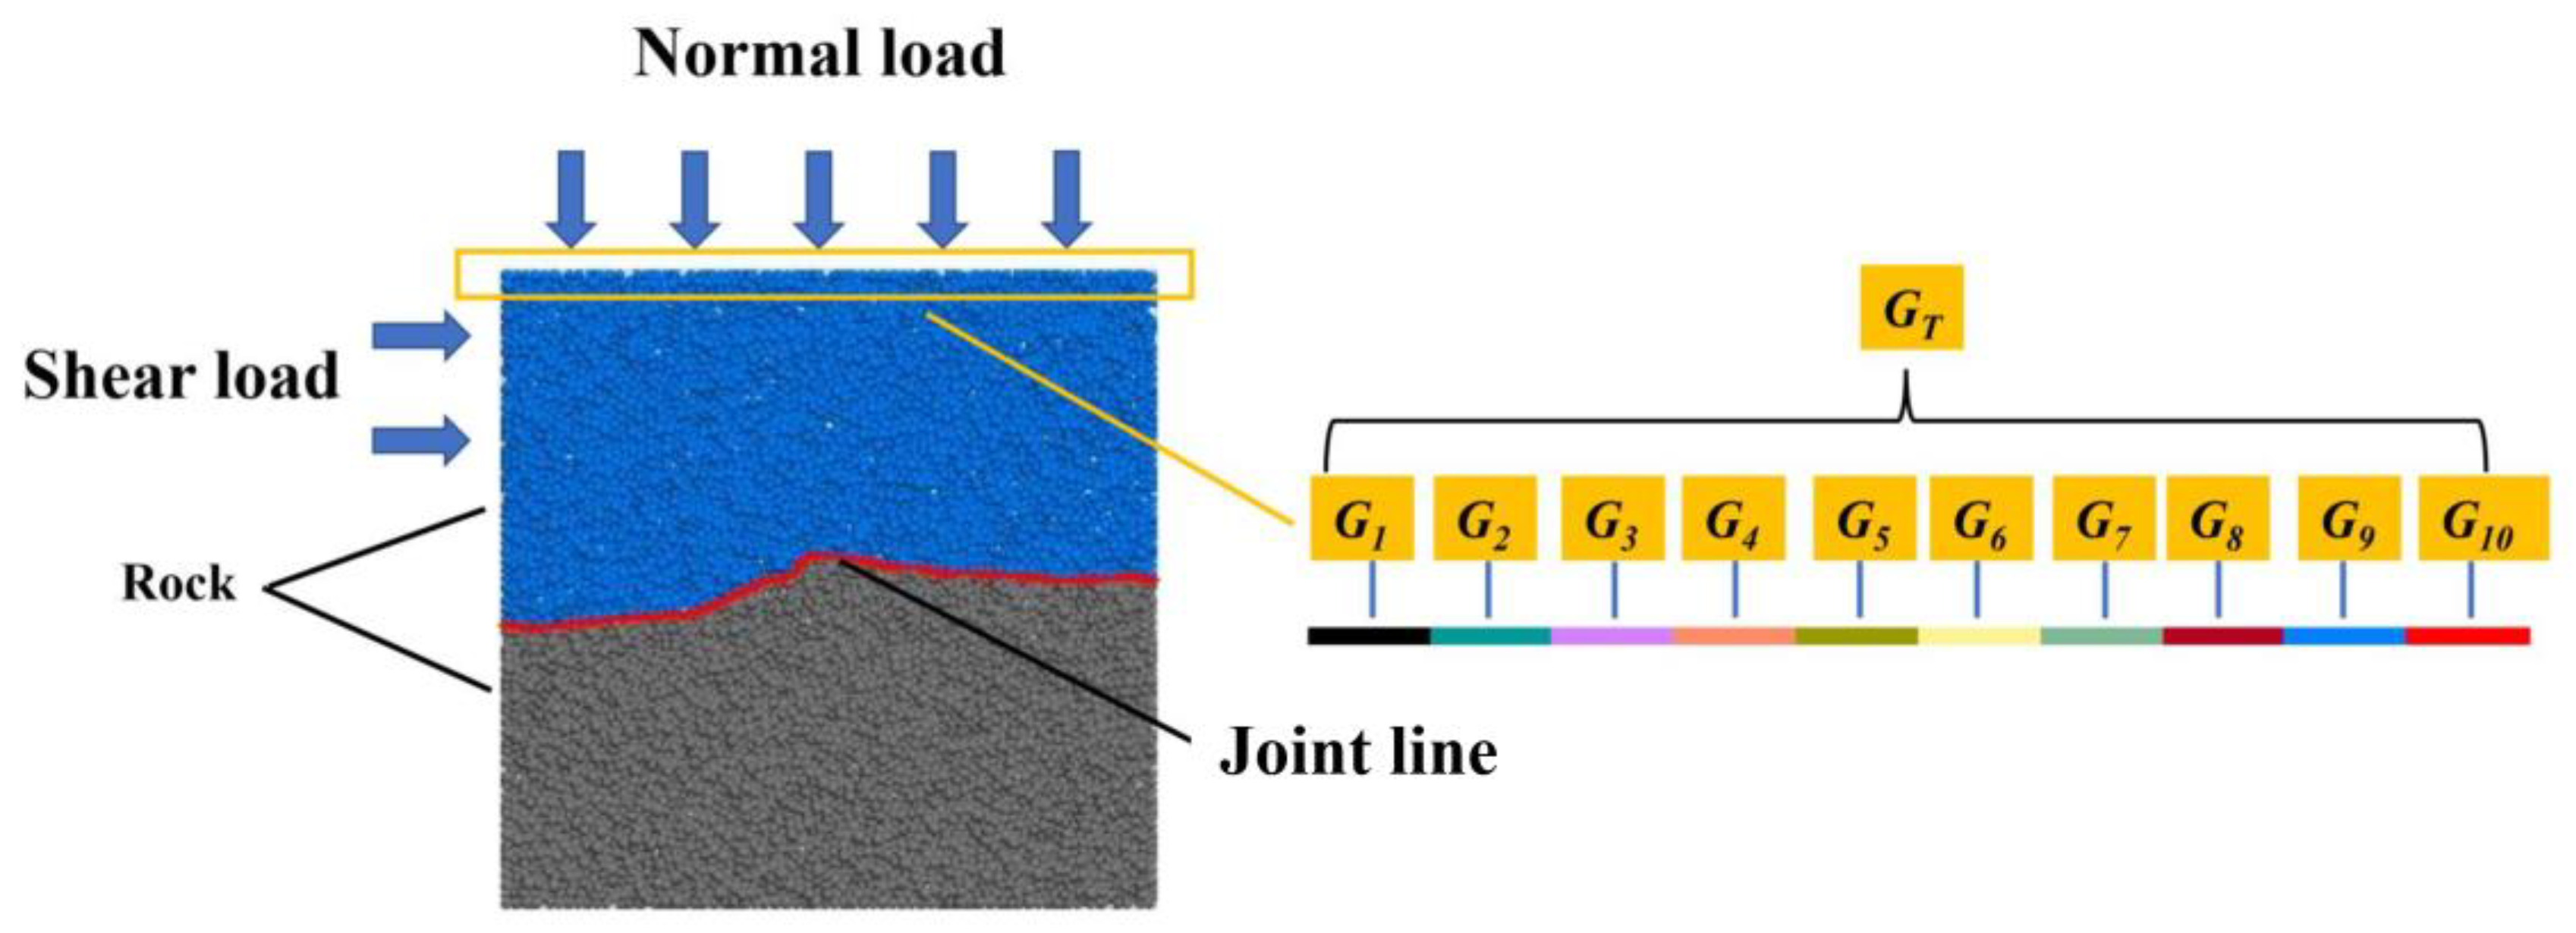
3.1. Geometric Model

Current laboratory testing methods have limitations in achieving non-uniform loads. DEM is a numerical method based on modeling the behavior of granular materials, which is particularly suitable for studying the motion and interaction of particle systems under mechanical actions, such as rock mechanics. This study utilized the DEM software PFC 5.0 [22,23], which offers easily implemented boundary conditions and minimal dispersion, to address this issue. To accurately replicate the non-uniform load distribution found in natural settings, we selected a joint of natural rock that had sustained shear damage and conducted simulations based on contour lines obtained through scanning with a morphological instrument. This instrument, which comprised a set of platforms and devices, enabled rapid, non-contact 3D measurements, straightforward calibration, and robust analysis software. The coordinates of the contour lines were determined by measuring the position of the laser spot on the surface. Each point was scanned, resulting in corresponding x-, y-, and z-coordinate values with z representing the vertical height above the datum. The scanning resolution in the x-, y-, and z-directions was 0.5 μm. Data acquisition and analysis were automated using TalyMap 3.0 analysis software. The specific modeling steps were as follows: (1) Red sandstone underwent direct shear tests to obtain the structural surface of rock after shear damage. (2) The structural surface was scanned using an HL-3DC color 3D scanner to capture its 3D form (Figure 3b) and then processed with TalyMap software. (3) A 2D curve section along the shear direction was selected from the acquired structural surface contour and uniformly scaled to obtain a 100 mm-long section of contour data; these coordinate data were collected (Figure 3d). (4) The collected coordinates were imported into CAD software to generate a corresponding file in DXF format which was then imported into PFC for constructing a numerical geometric model of the rock body including a joint surface measuring with dimensions of 100 mm × 100 mm (Figure 3 illustrates the scanning process of the joint contour line).

3.2. Calibration of Microscopic Parameters

The microscopic parameters of the numerical model in this study were calibrated based on the agreement between the simulation and experimental results. However, sampling rock joints from field conditions and the inherent uncertainties in their properties pose challenges for laboratory direct shear tests. To replicate joint specimens for these tests [24], a mixture of water, high-strength cement, and fine quartz sand was used at a mass ratio of 1:2:4, following Xie, Lin [25]. Cement mortar has been widely employed as a model material to investigate the shear behavior of rock joints [26]. The size of the specimens was 100 mm × 100 mm. Details about specimen preparation can be found in reference [27], while Figure 4 and Figure 5 present the production flow chart and test results, respectively. Each group of tests was repeated three times under the same conditions, and the average value was taken as the curve data.
Considering both the mechanical properties of rocks and joints, values were assigned to them using a flat-joint model for rocks and smooth-joint model (in accordance with the mechanical characteristics of the joint surface) for joints [28]. The flat joint was used as a comparison object to calibrate micro-mechanical parameters for each contact model. The micro-parameter calibration results are presented in Table 1.

3.3. Boundary Conditions and Loading Scheme

In this study, the top loading plate was divided into 10 smaller sections (N = 10), and distinct loads were applied to achieve a non-uniform distribution of overburden loads; as illustrated in Figure 6, there are different differences in the initial stage of the shear stress–shear displacement curve, that is, in the micro-crack compaction stage, which were caused by the difference in normal stress and the dispersion of the sample itself. For the FFC and NFC conditions, Gd was set at 1.1% GT and −1.1% GT, respectively. G1 was set at 15% GT for the FFC condition and 5% GT for the NFC condition. According to Equation (1), the calculation formula for the load division of each strip is shown as follows:
G n = 15 % G T 1.1 % ( n 1 ) G T N F C 5 % G T + 1.1 % ( n 1 ) × G T N F C
For FOC, the strip load had a centrally symmetric isometric distribution with d set at 2.5% GT, while G5 and G6 were both set at 15% GT. According to Equation (2), the calculation formula for the strip load is as follows:
G n = 5 % G T + 2.5 % ( n 1 ) G T n 5 27.5 % G T 2.5 % ( n 1 ) G T n > 5
As part of simulating direct shear tests, four different forms of load distribution under various overburden loads (GT = 10 kN, 15 kN, 20 kN, 25 kN, 30 kN) were designed, as shown in Table 2.

4. Simulation Results and Analysis

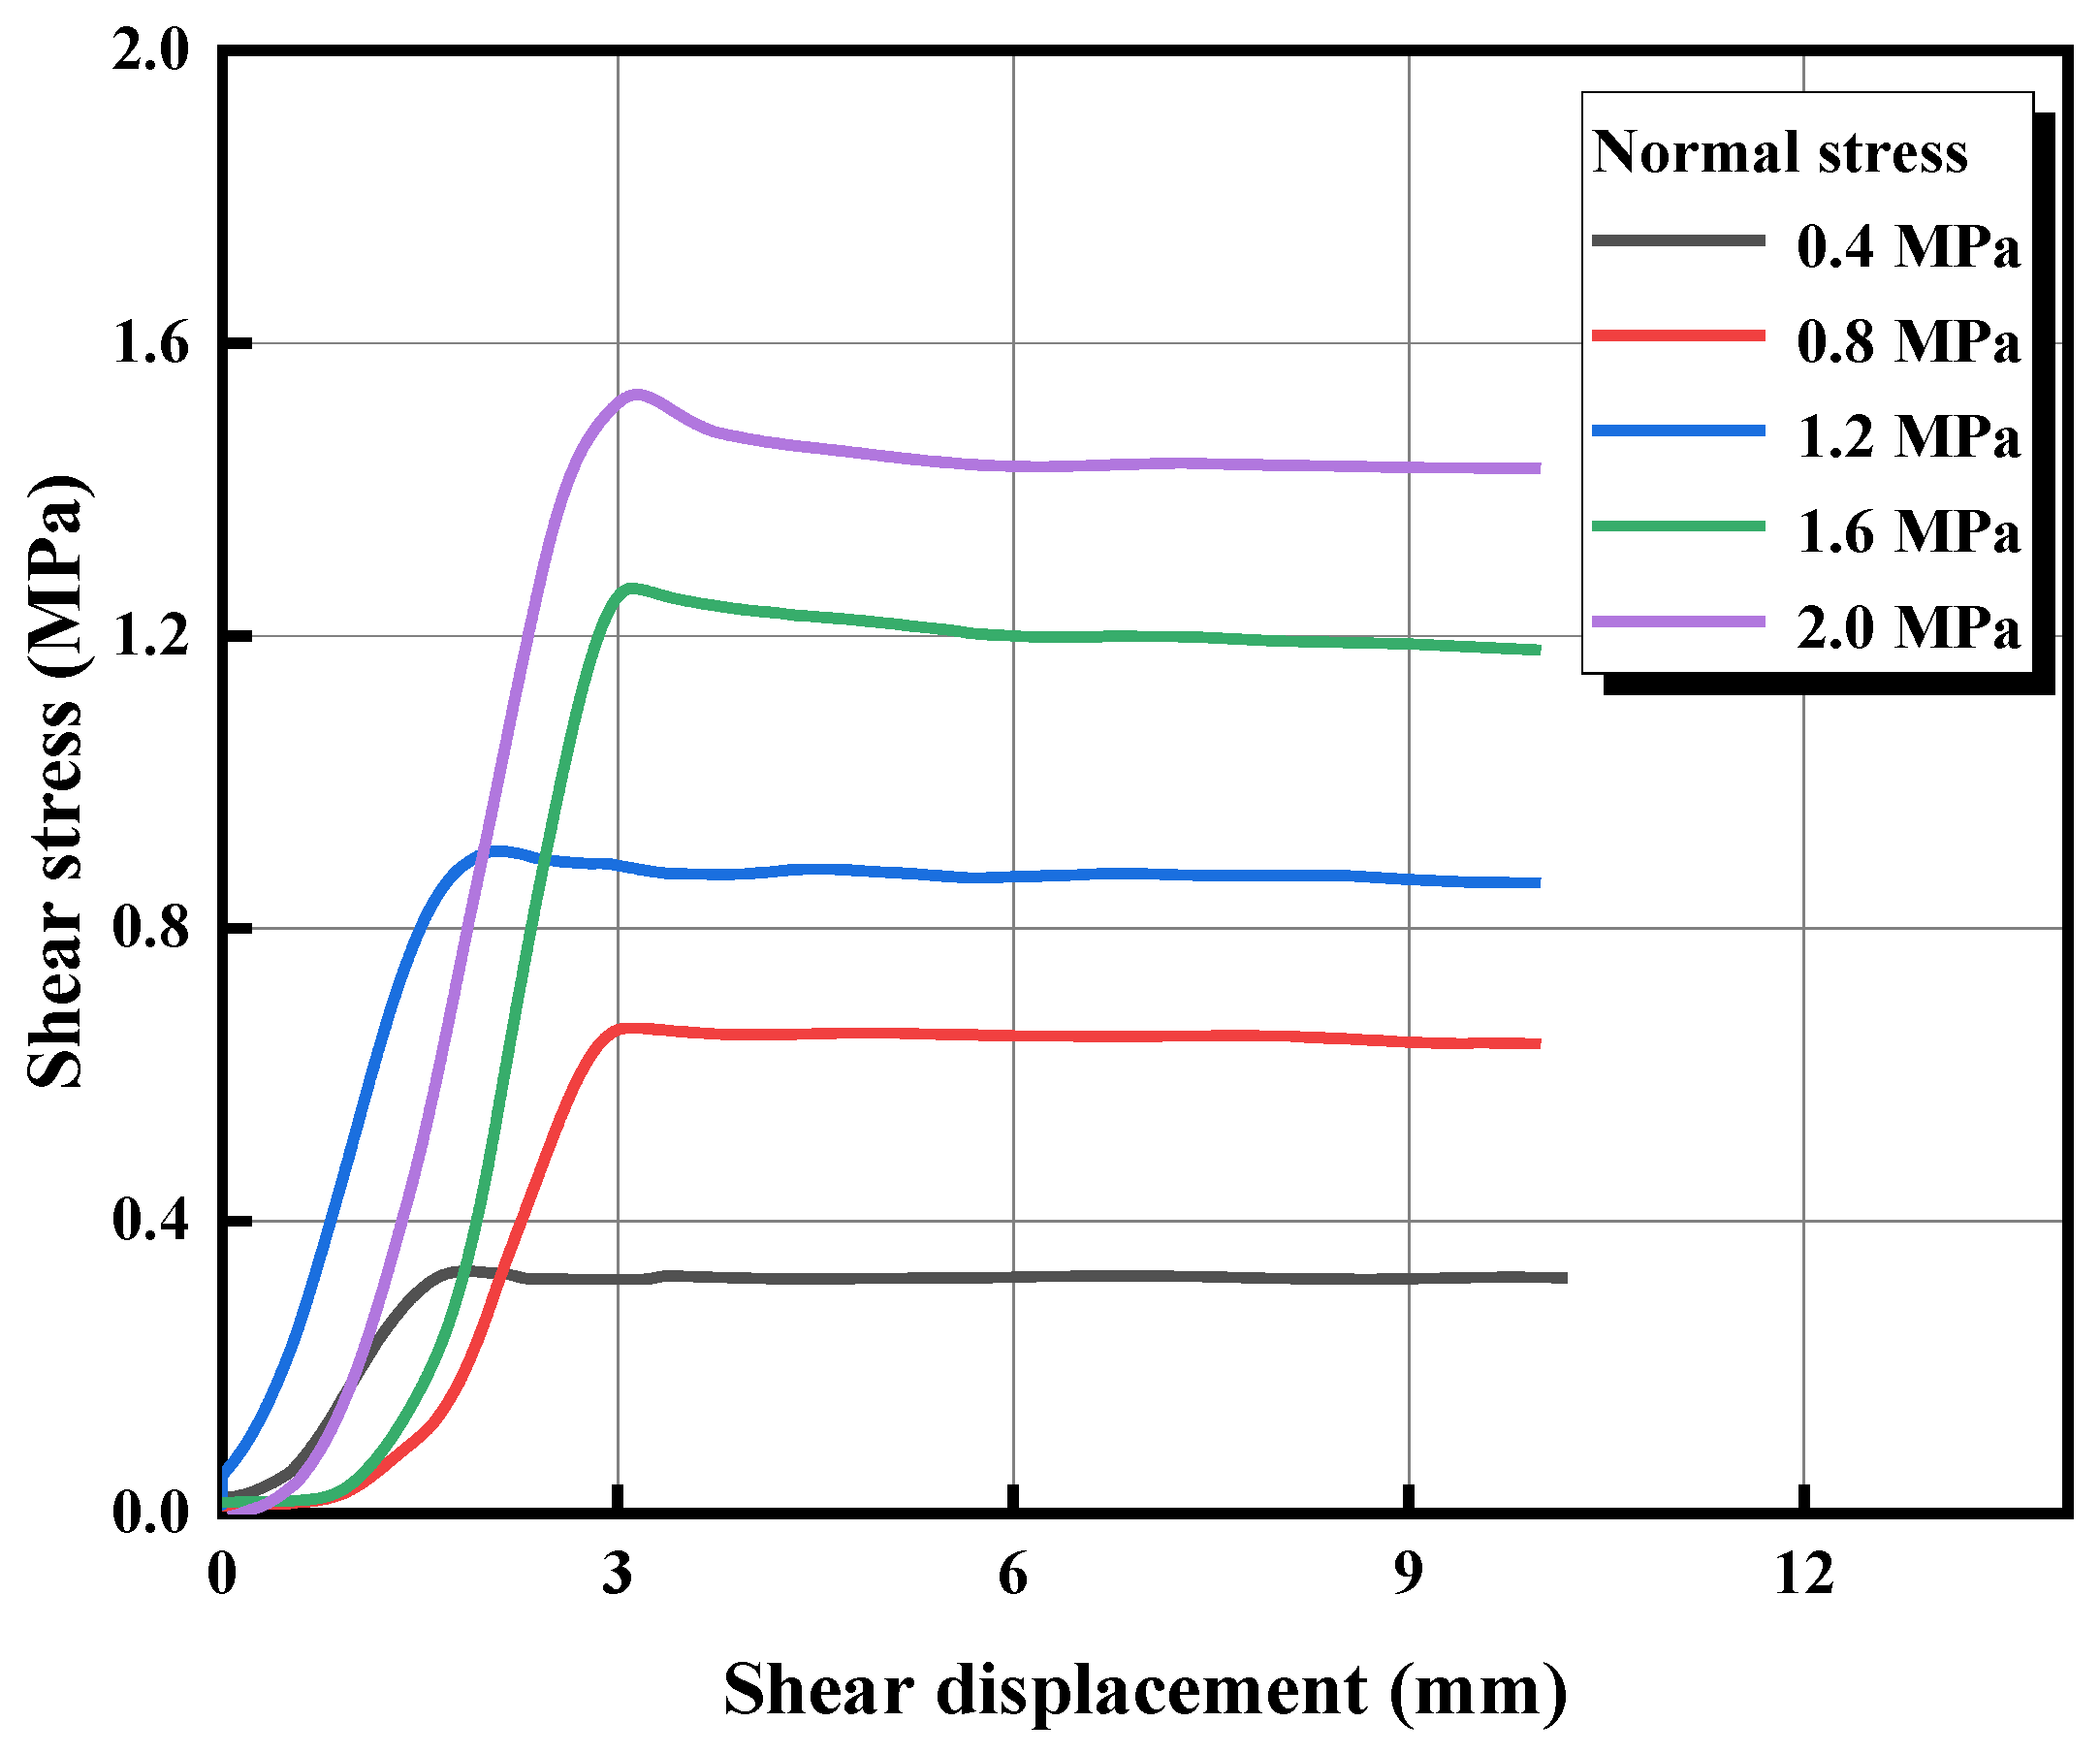
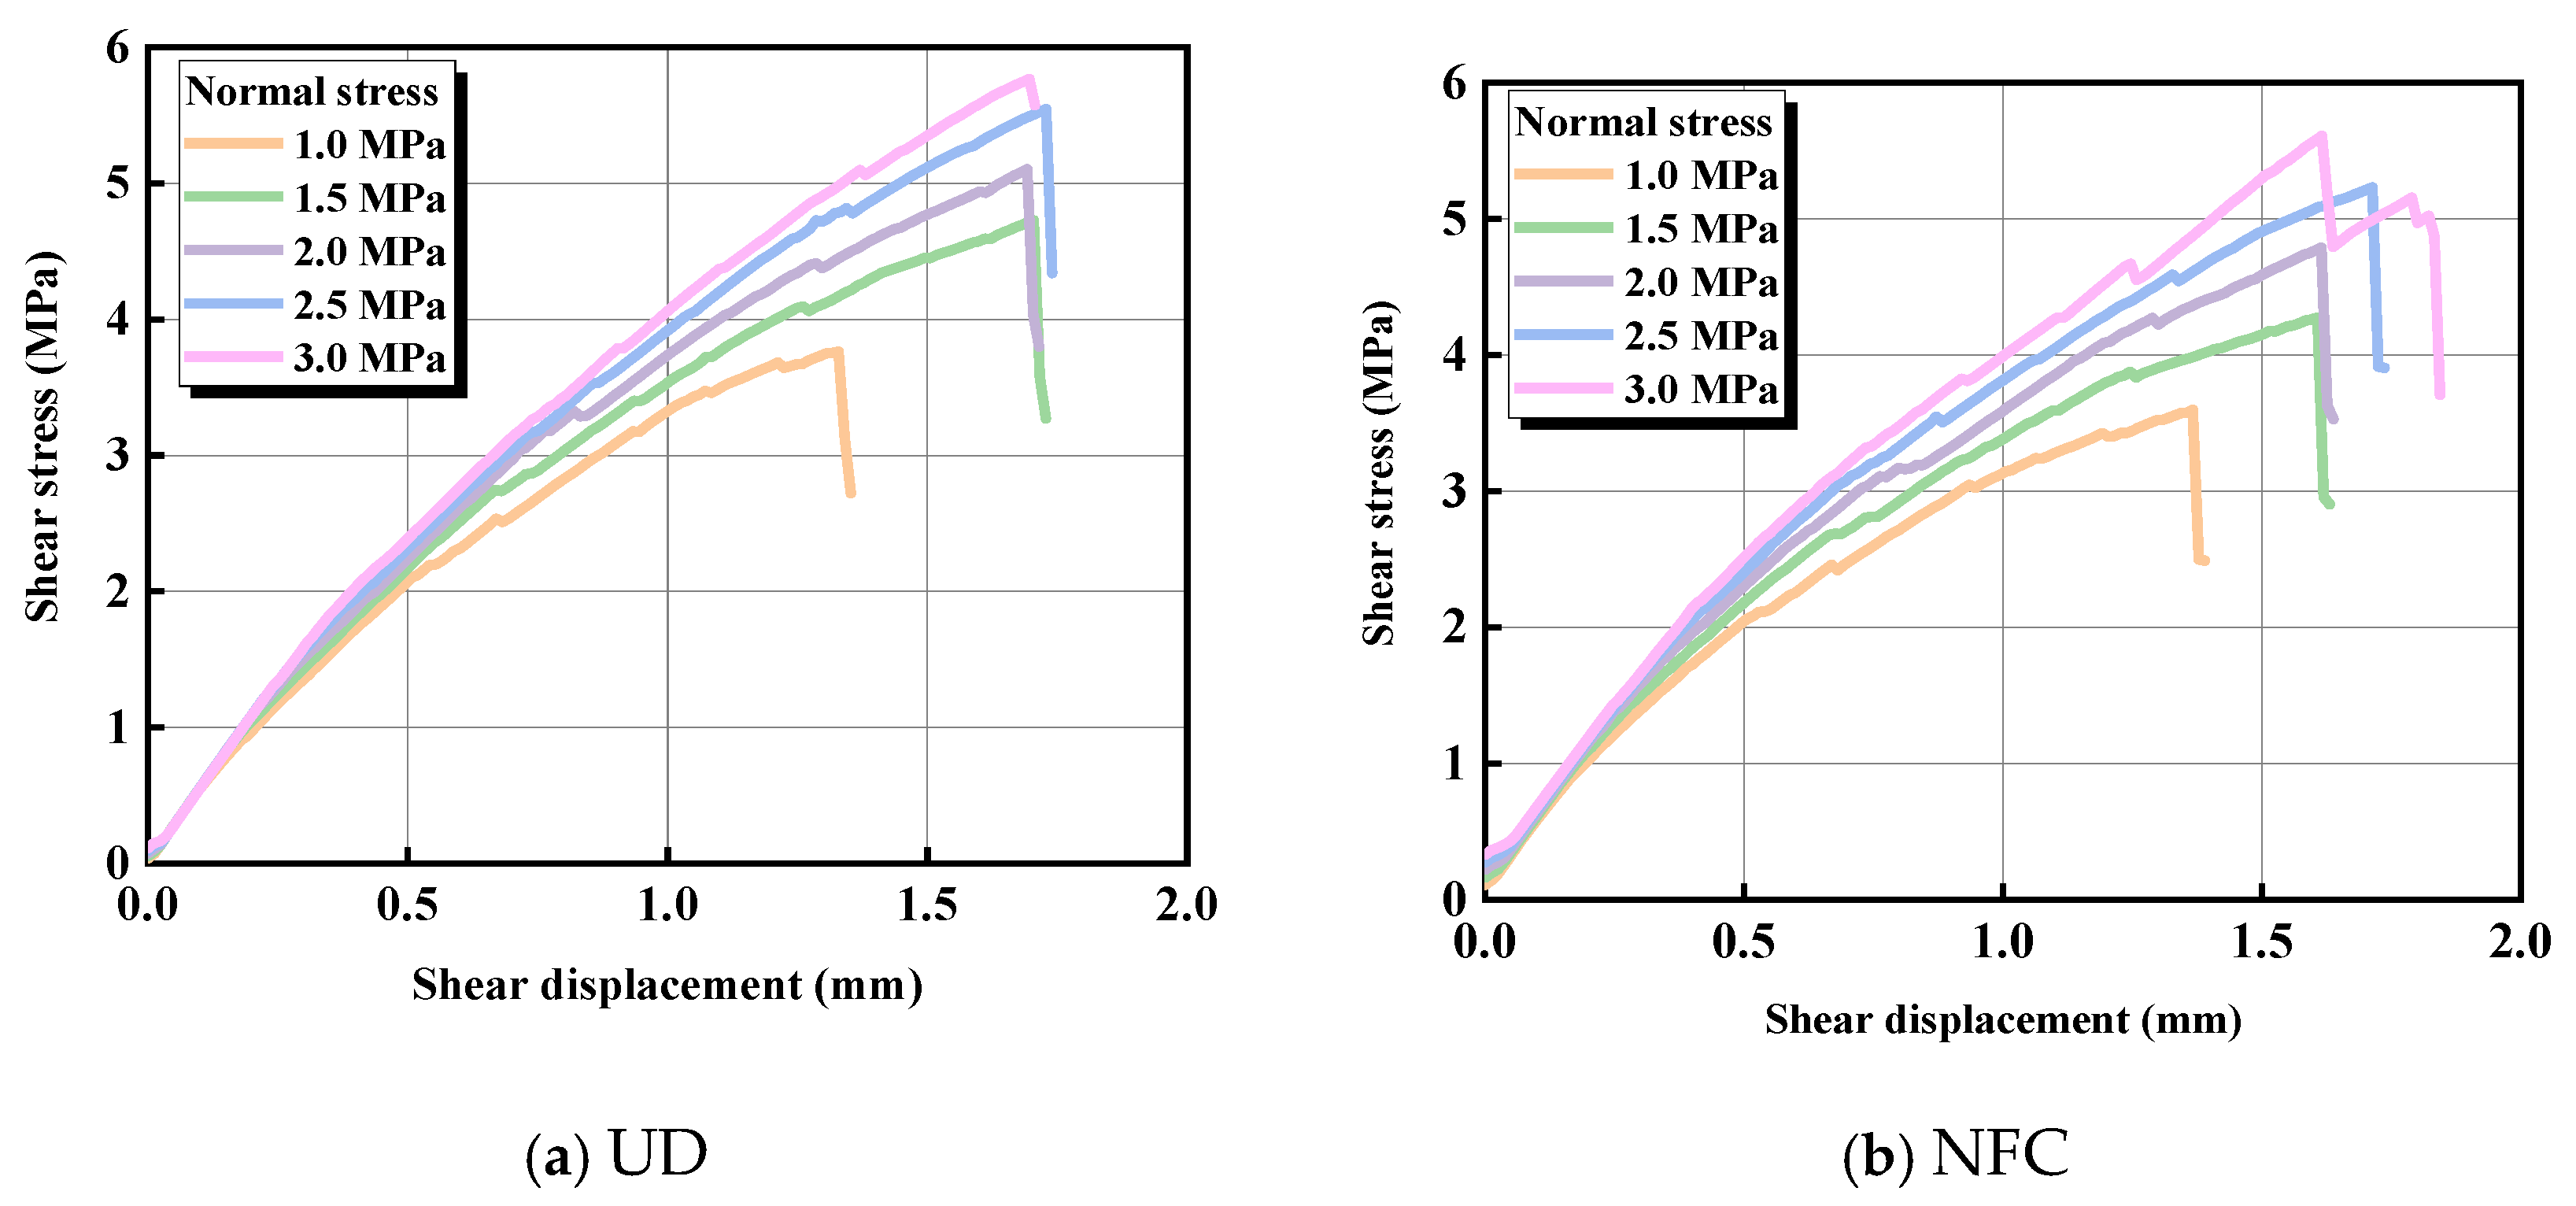
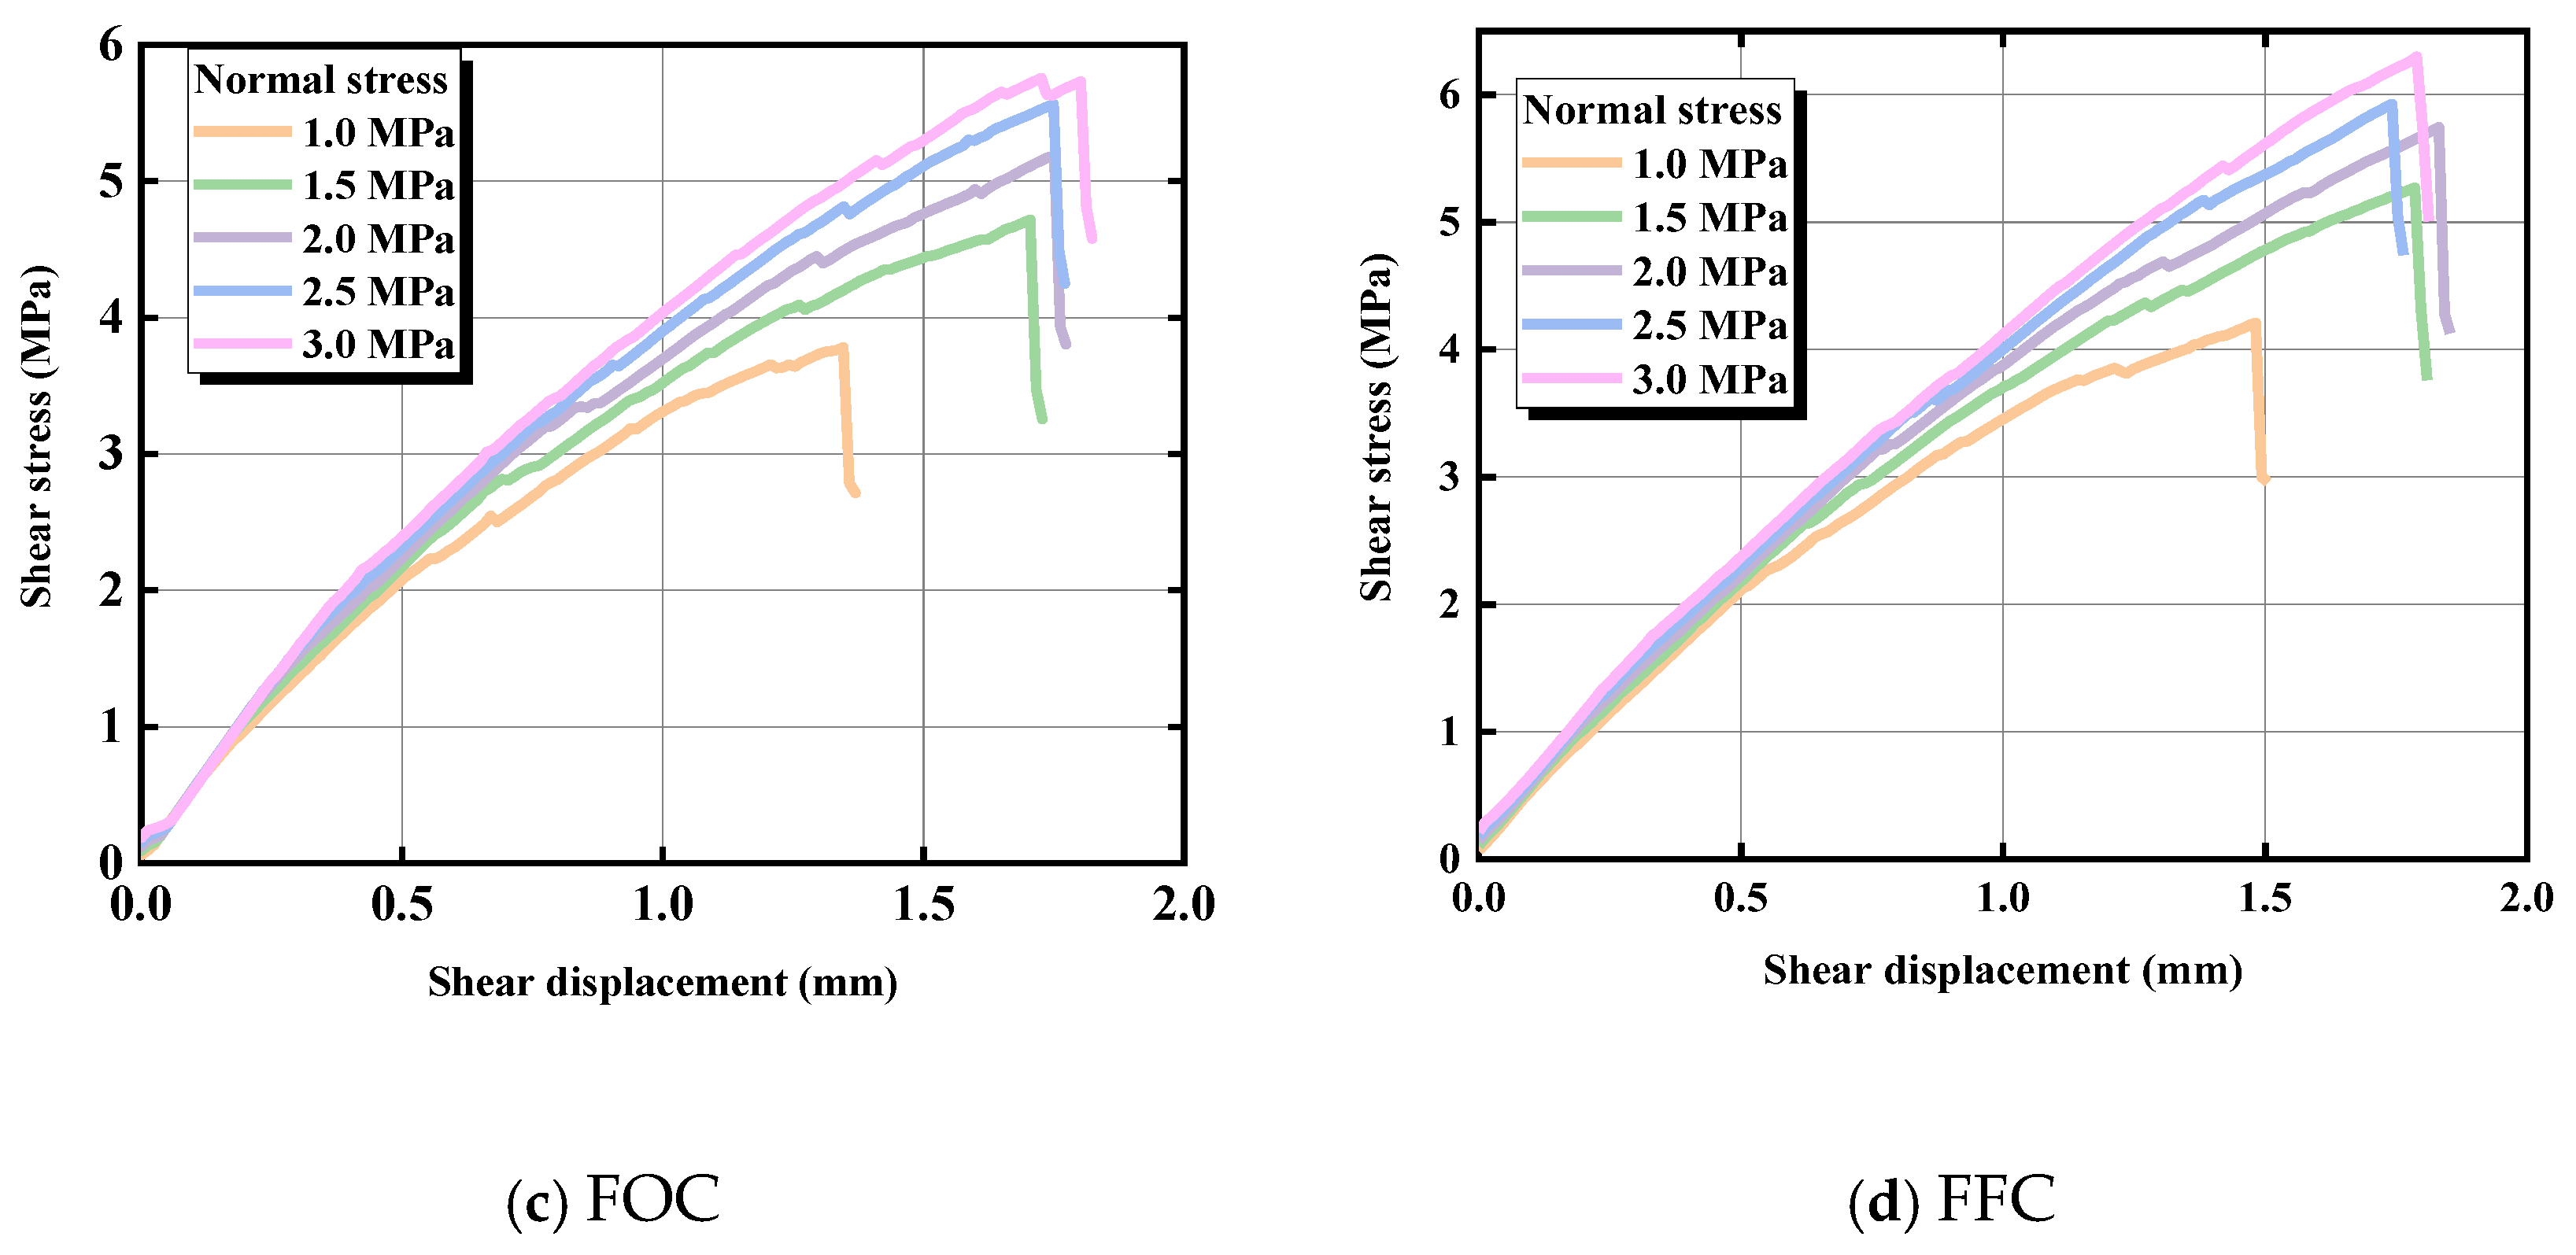
4.1. Shear Stress–Shear Displacement Curve

Upon completing the simulation of the direct shear test, the shear stress–displacement curves for the joint surface corresponding to three distinct load distribution forms and a uniform load distribution (UD) form were obtained, as shown in Figure 7. In the initial loading phase, peak shear stresses related to various load and distribution forms closely aligned with the slope of the curve. As loading progressed, there was a deviation between the slope of the curve, peak shear displacement, and shear strength; higher normal stress combined with a load concentration location closer to the distal end resulted in increased corresponding shear strength. The closer the load concentration location was to the far end of the shearing direction, the stronger the damage resistance of the rock mass structure was.
The relationship between normal stress and peak shear displacement is illustrated in Figure 8. Generally, peak shear displacements increased with increasing normal stress, although the average values varied across different load distribution forms. Specifically, the average peak shear displacements for the uniform distribution (UD), near-field concentration (NFC), focus-on-central (FOC), and far-field concentration (FFC) load distribution forms were 1.634 mm, 1.576 mm, 1.656 mm, and 1.728 mm, respectively. In comparison to the NFC condition, the average peak shear displacements for FOC and FFC increased by 13.72% and 18.64%, respectively. This indicates that the average peak shear displacement increased with the location of load concentration and could be well approximated by a linear expression, as shown in Equation (5). This finding emphasizes the significant influence of load distribution form on peak shear displacement.
γ p = 0.0152 γ P + 1.577
where γ p is the average peak shear displacement and γ P is the peak shear displacement, both in mm.
To further analyze the influence of load distribution form on shear stiffness, the slope (shear stiffness) of the shear stress–shear displacement curve under normal stress 2.0 MPa was calculated as a change in the form of shear displacement, as shown in Figure 9. It can be seen from the figure that the shear stiffness in all distribution forms decreased with the increase in shear displacement, but the rate of decrease was more and more slow, which corresponded to the evolution of the elastic stage–damage-softening stage of the shear stress–shear displacement curve. However, according to the slope of the rigidity–shear displacement fitting curve under different load distribution forms, the attenuation trend of shear stiffness with shear displacement was kNFC > kFOC > kFFC. In terms of average stiffness, the average values of kNFC, kFOC, and kFFC were 2.95, 2.99, and 3.11, respectively, and kFFC was 4.1% larger than kFOC. It was 5.4% larger than kFFC, indicating that the stiffness resistance to decay under FFC conditions was stronger and less prone to damage.

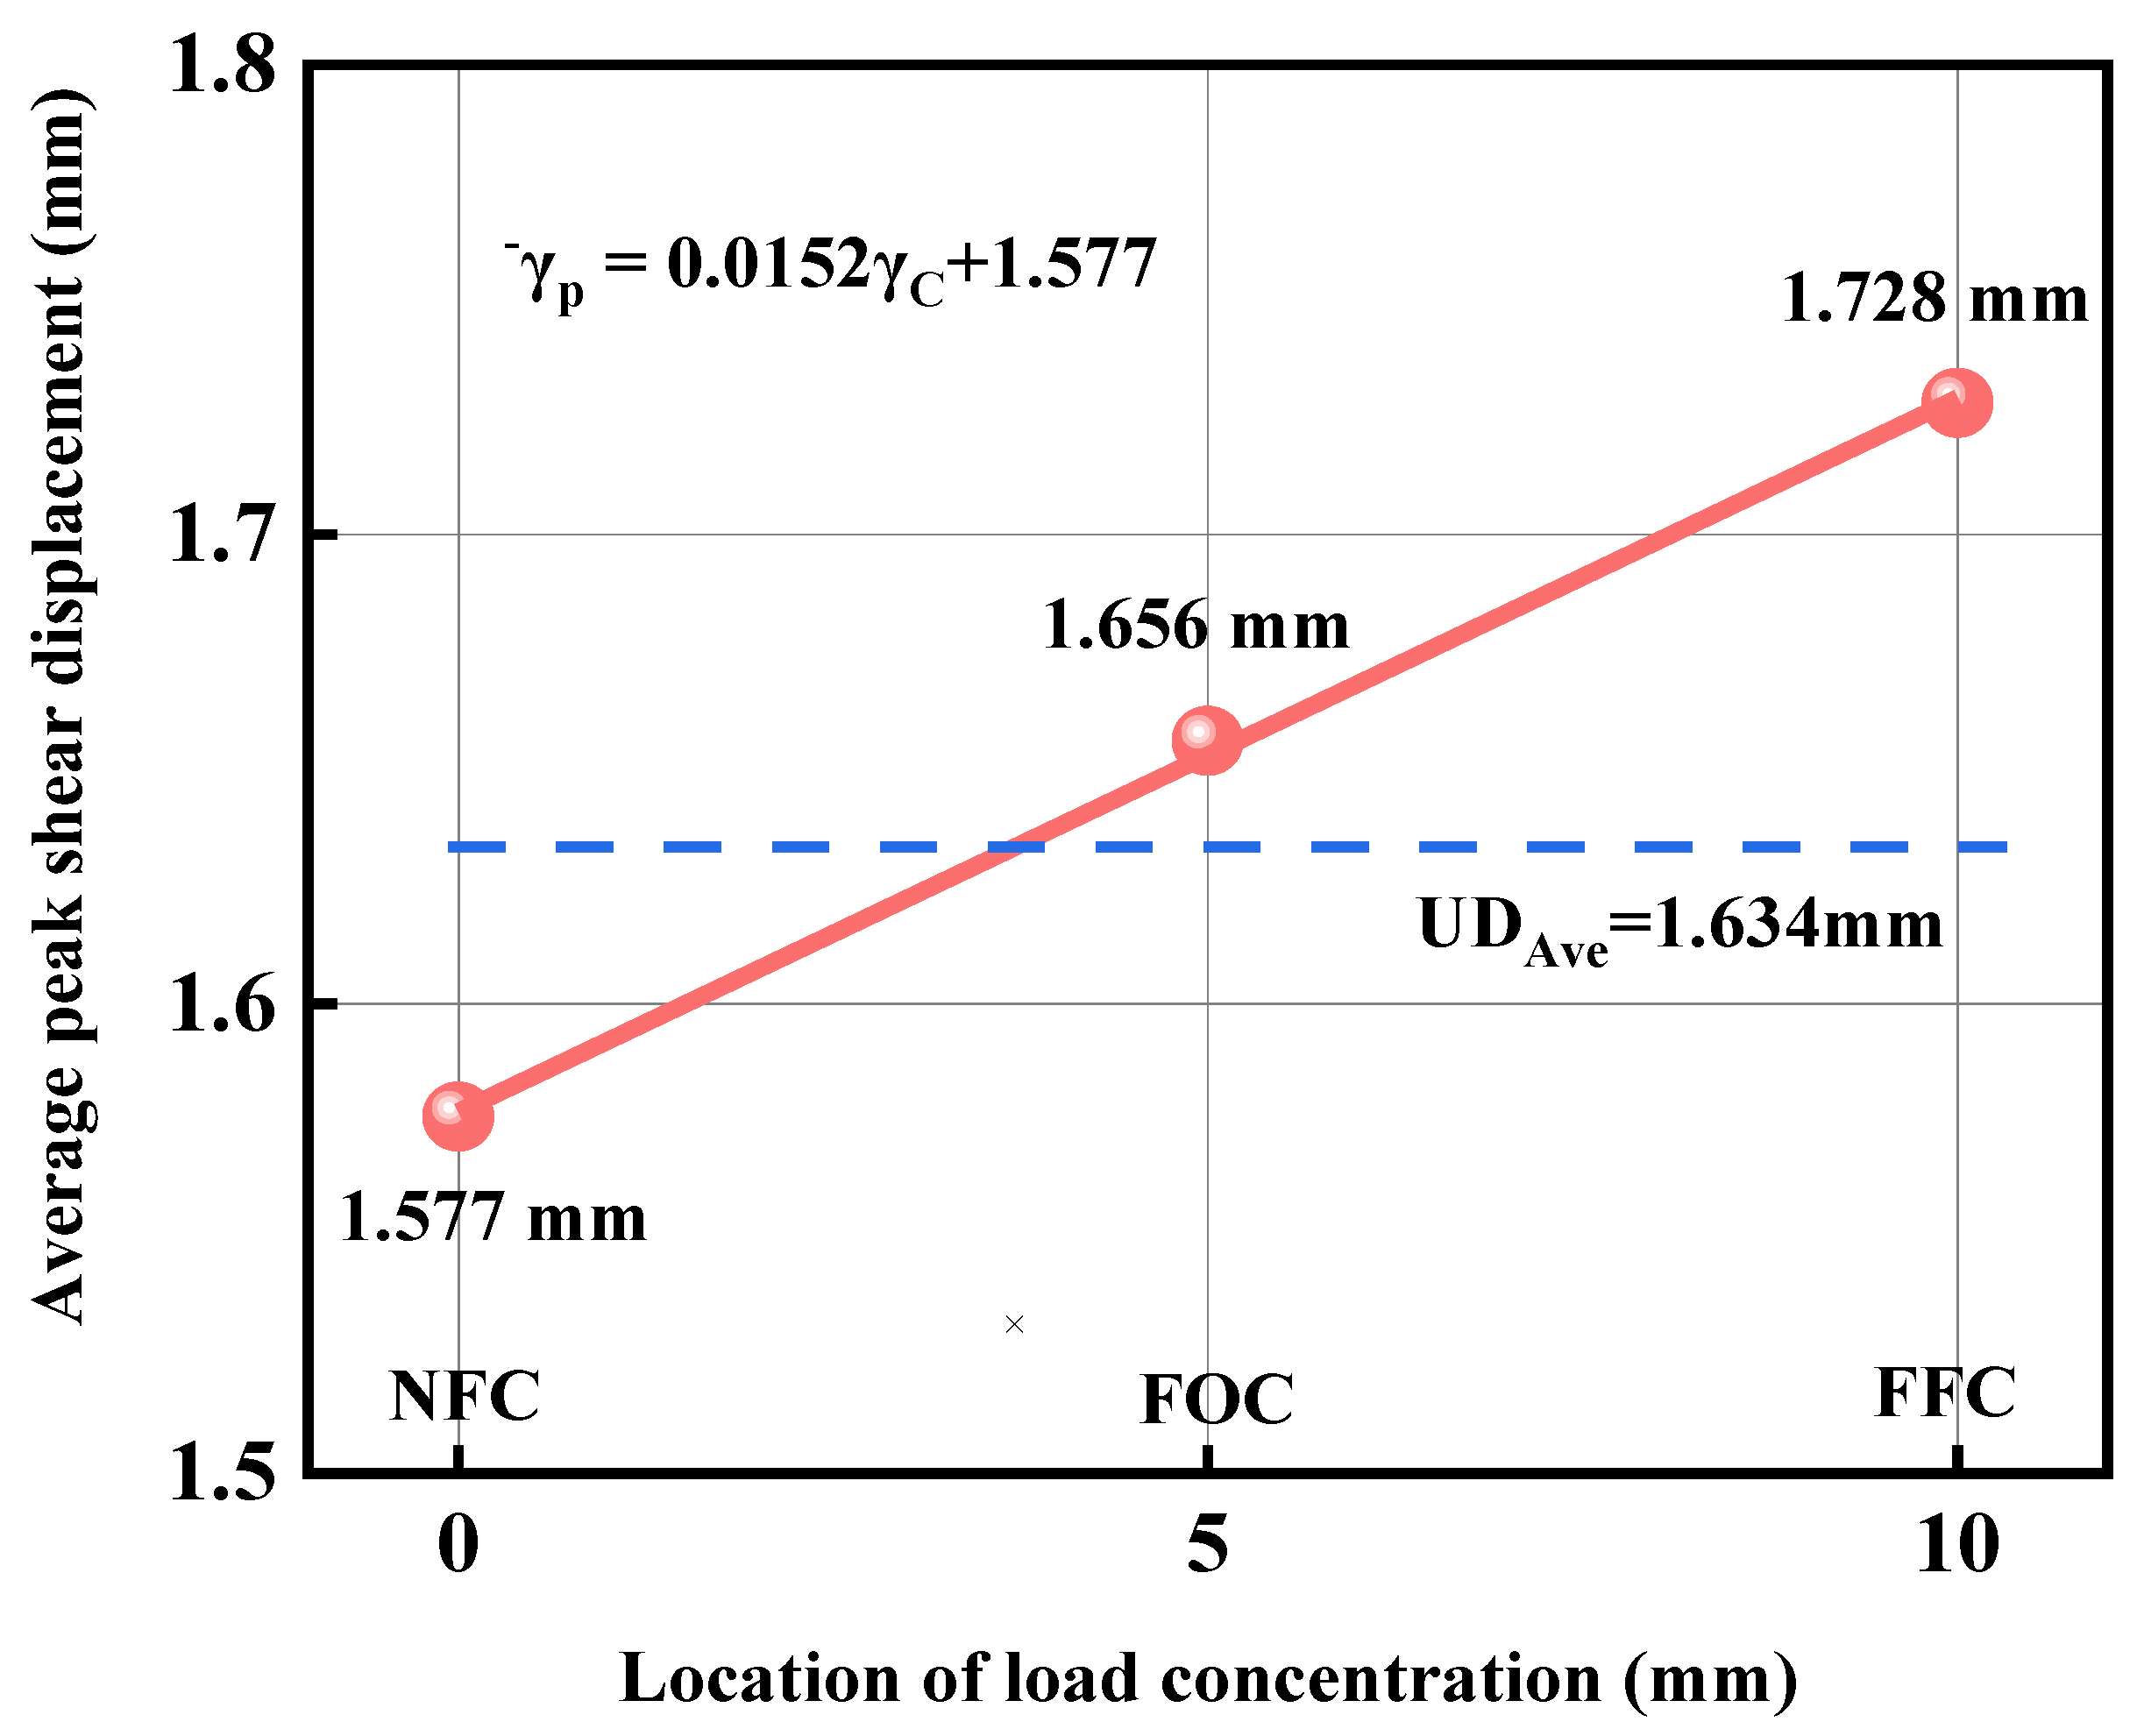
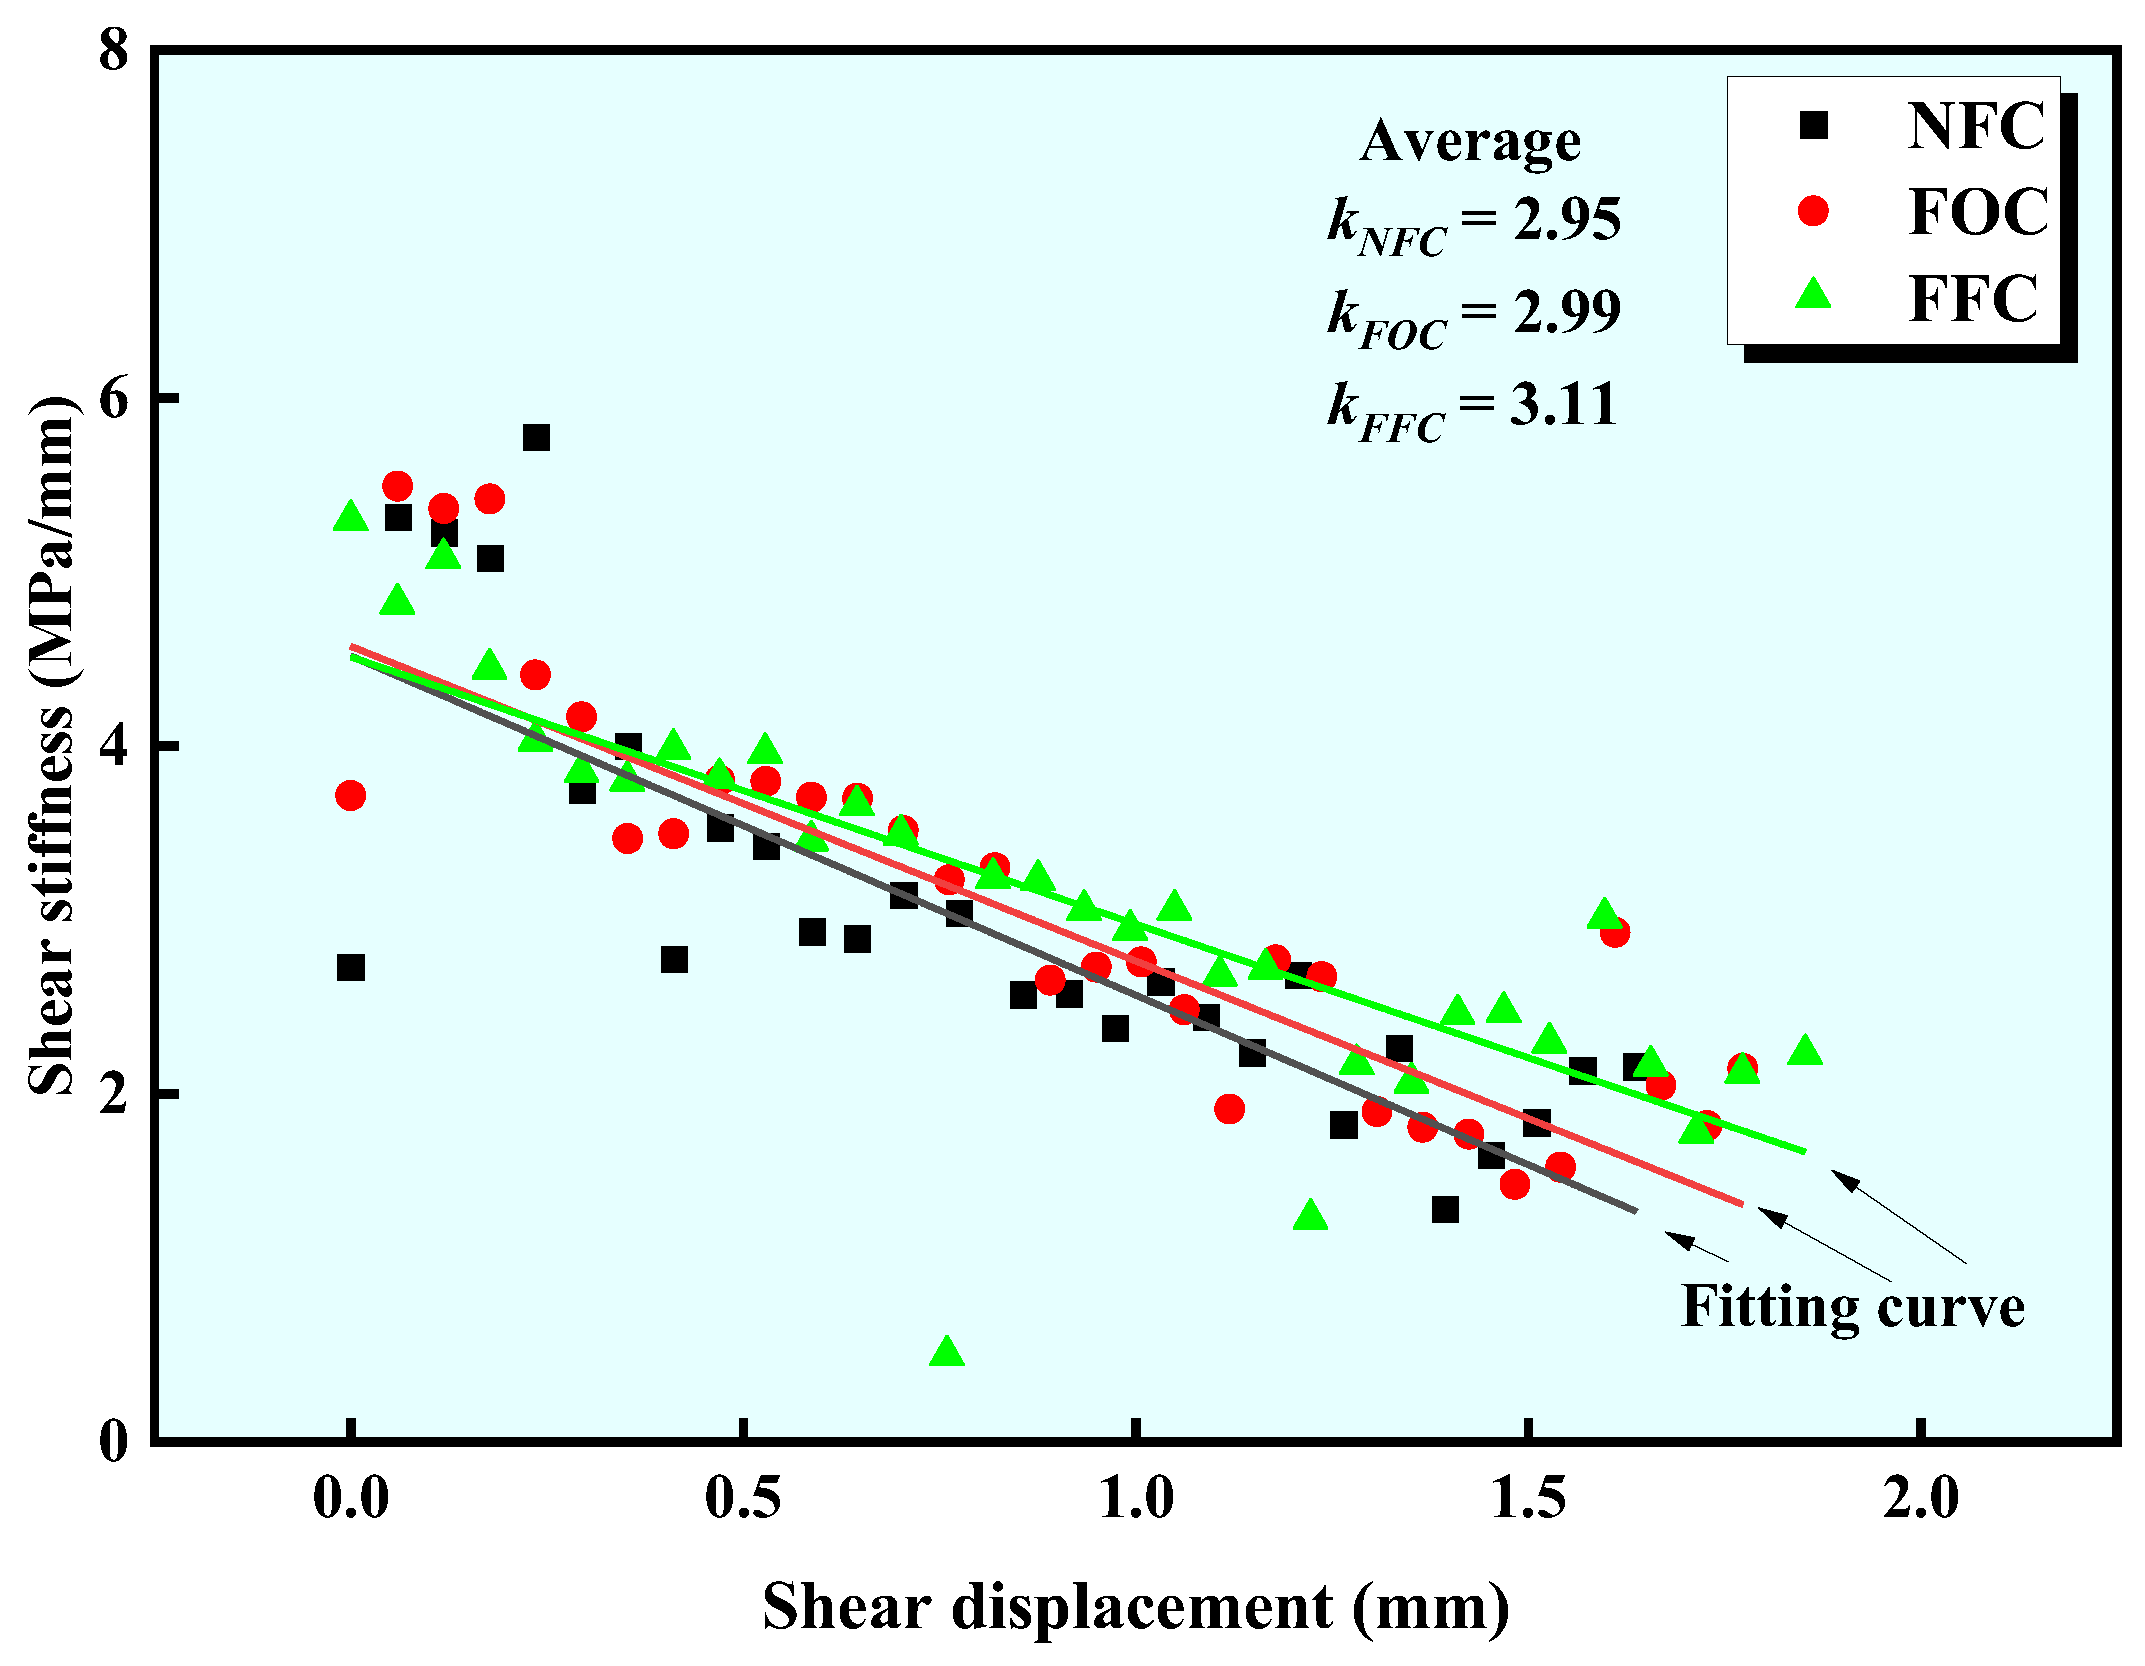
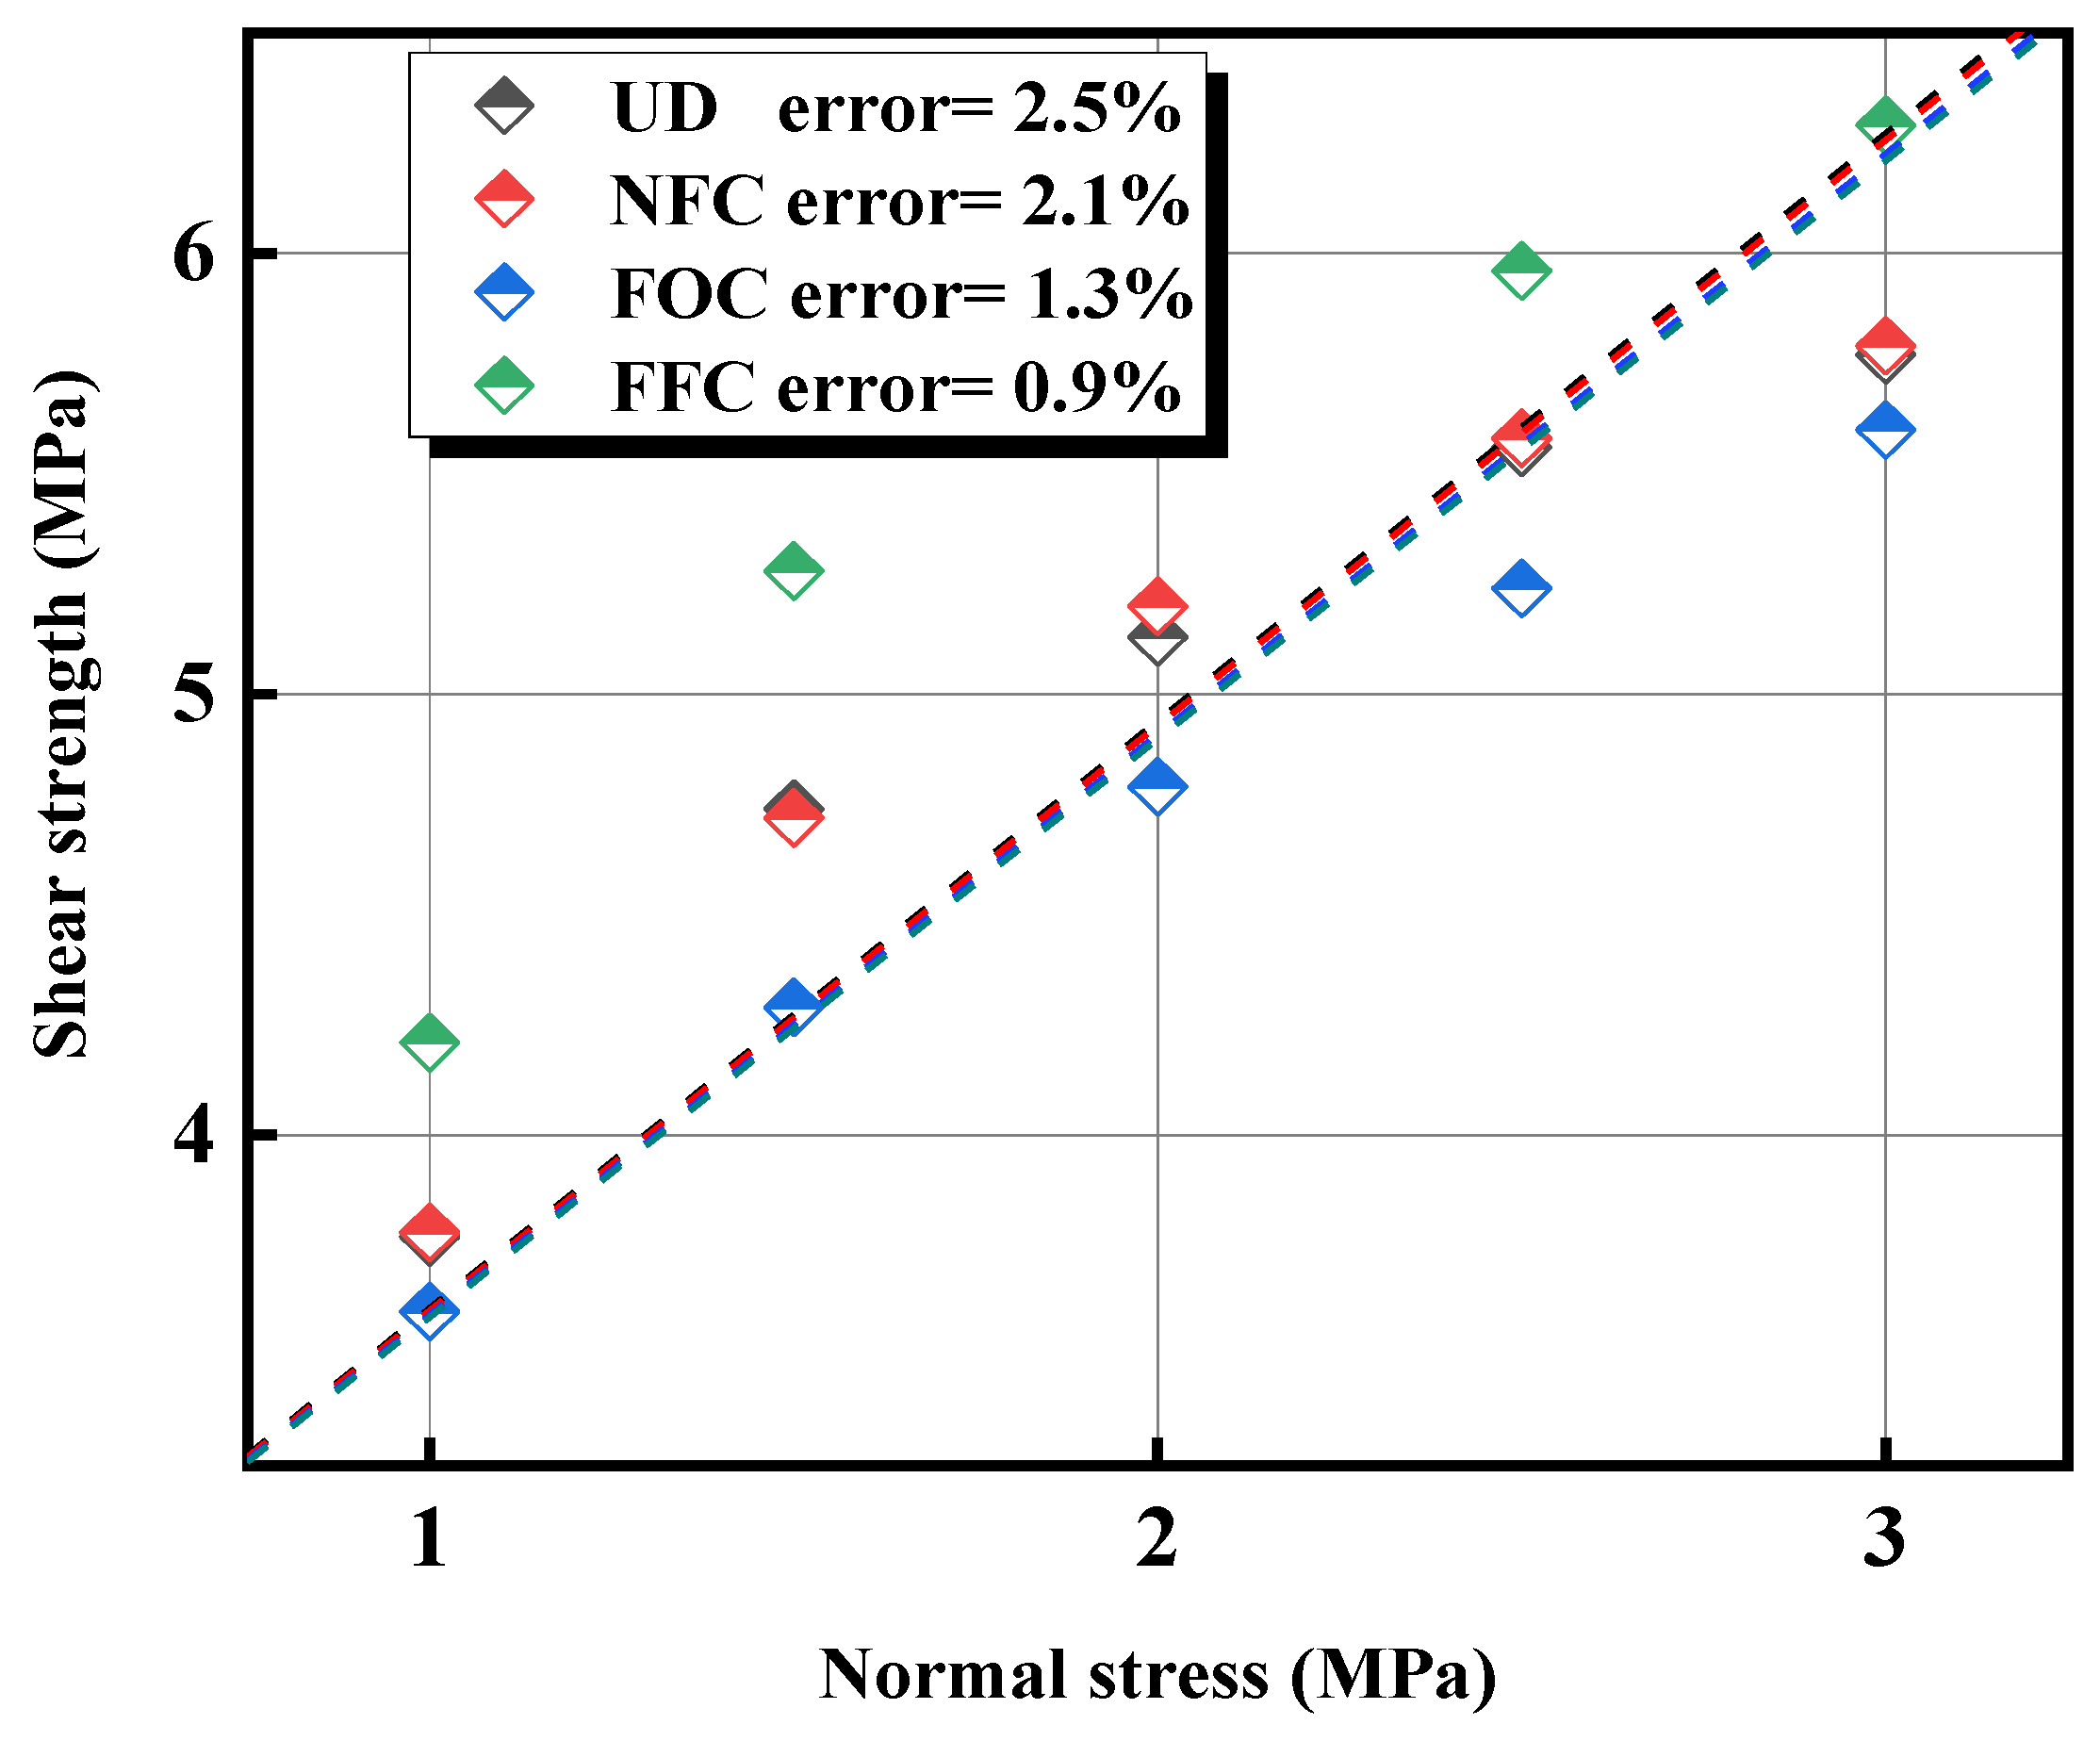
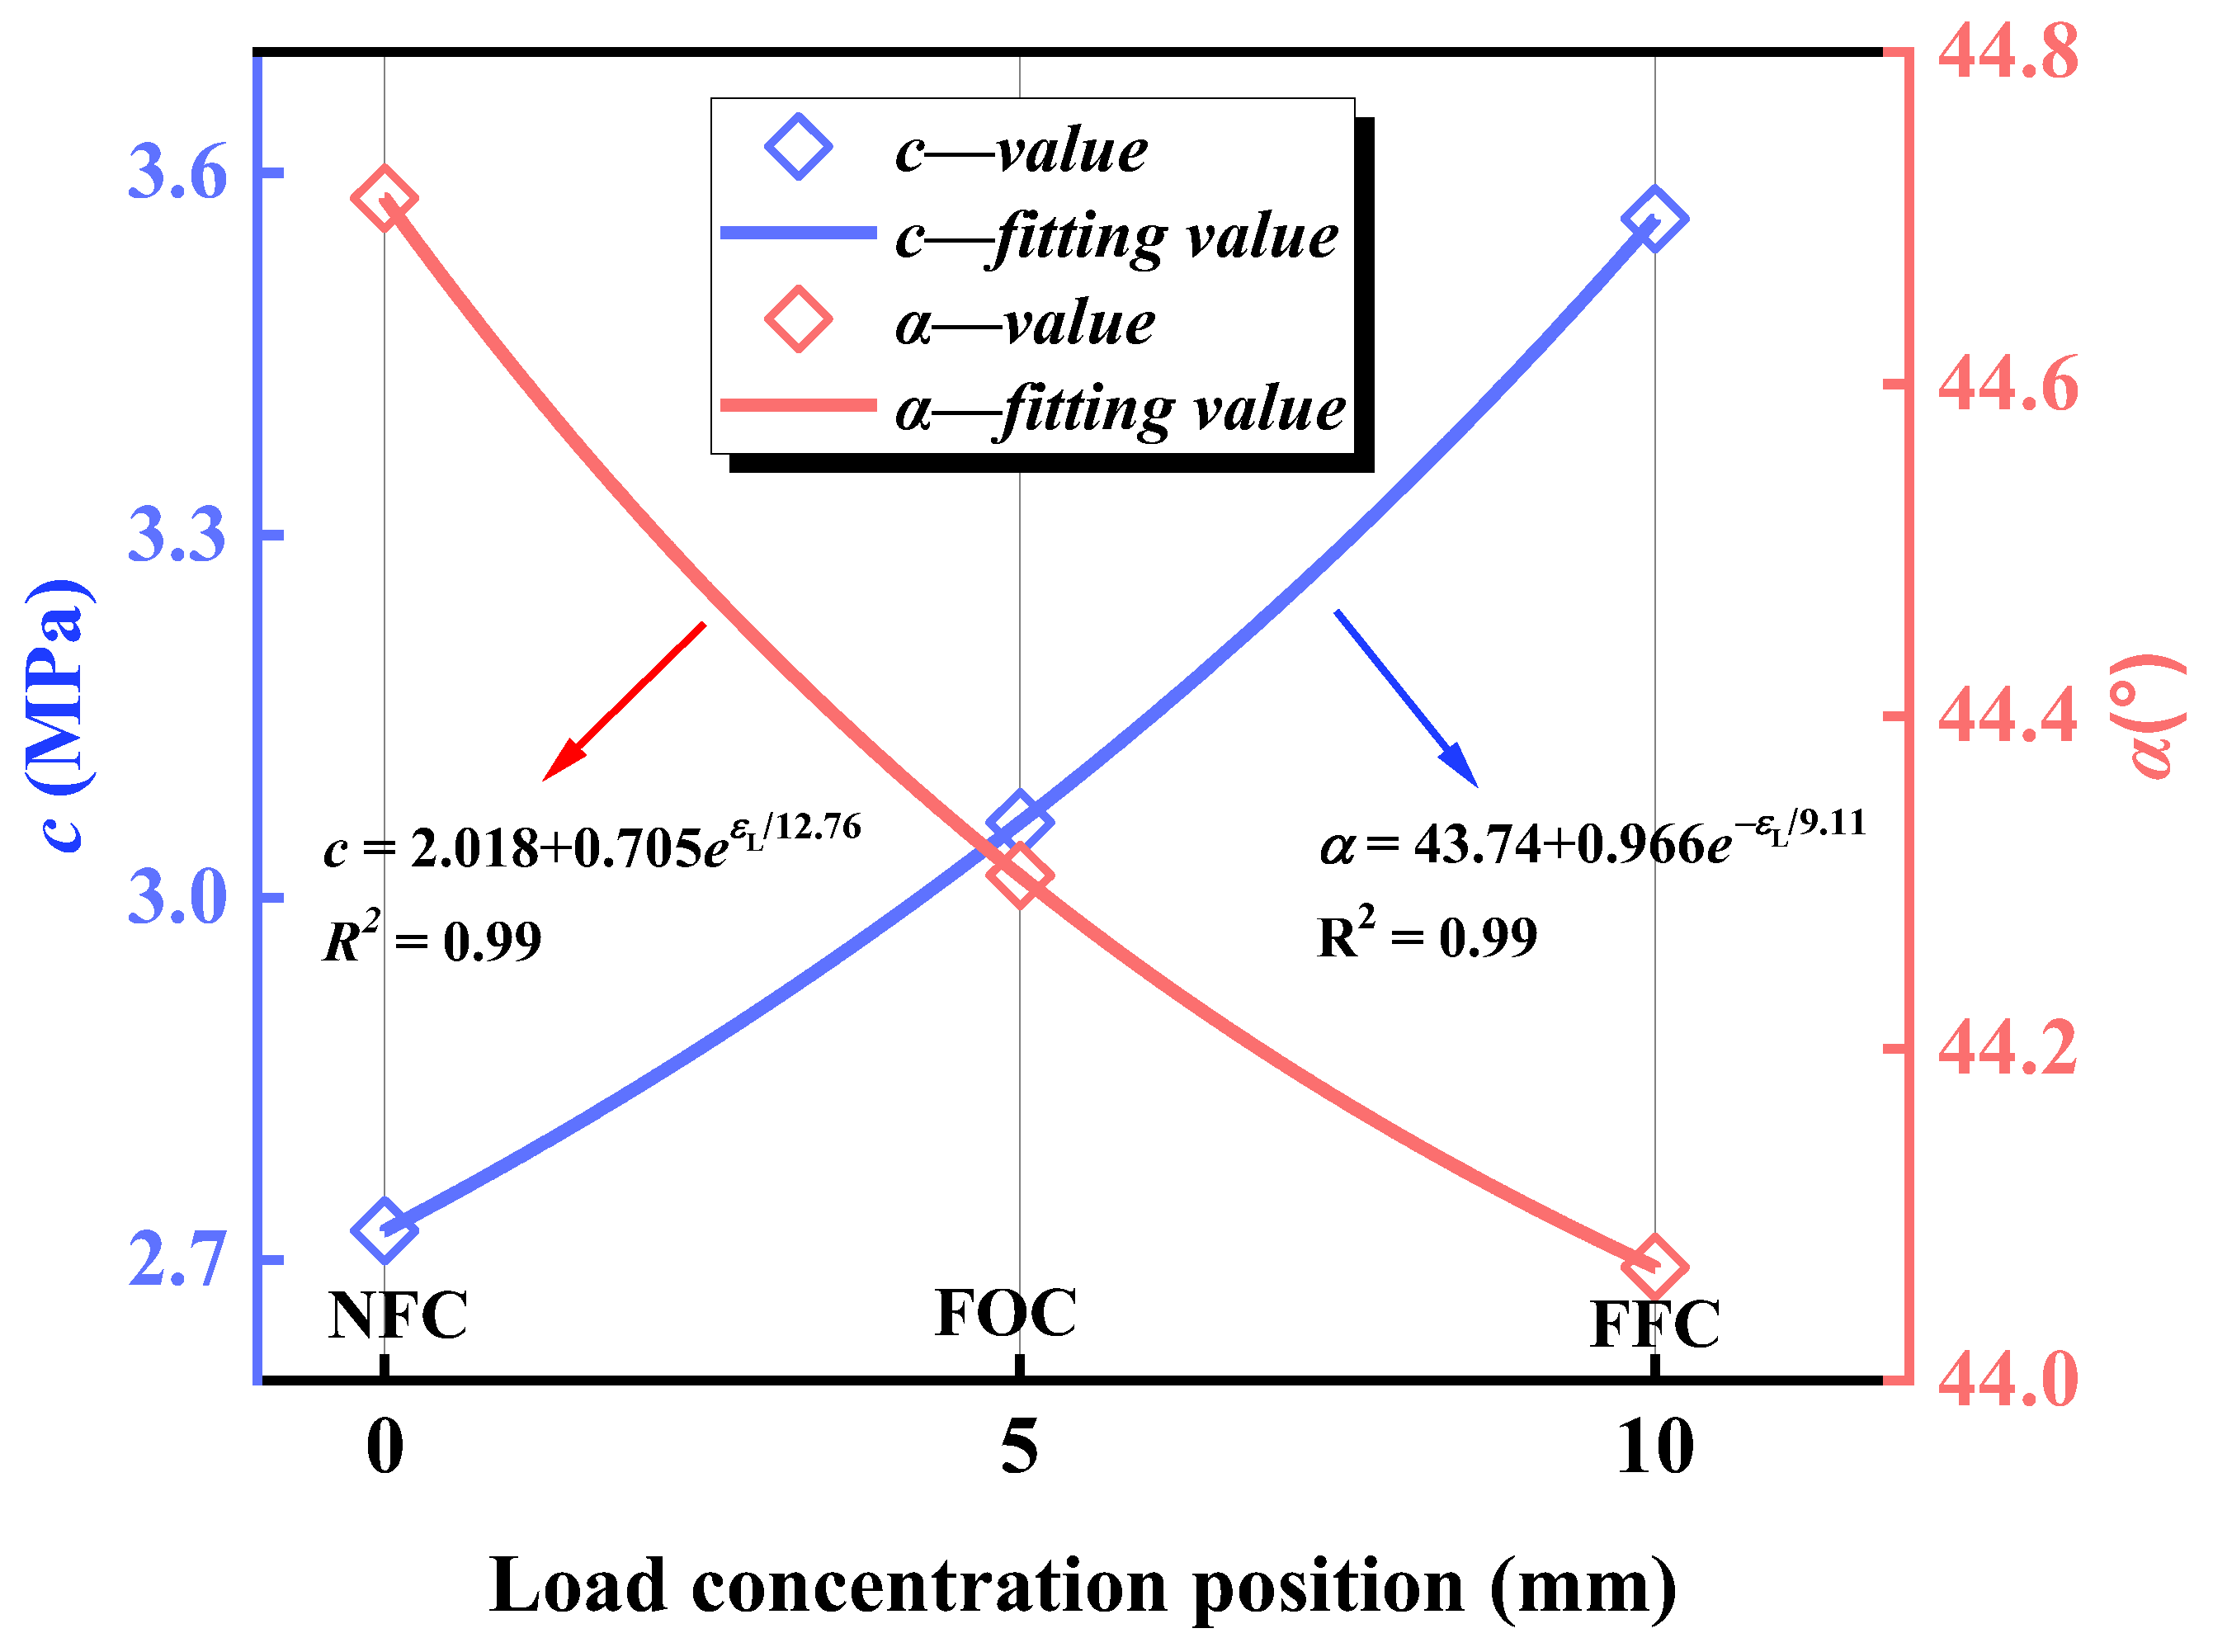
4.2. Main Shear Mechanical Parameters

The relationship between normal stress and shear strength is illustrated in Figure 10. Under the same normal load, the shear strength corresponding to FFC was the highest, followed by FOC, with the lowest for NFC. It should be noted that the shear strength under FOC conditions was more similar to that under UD conditions in terms of numerical magnitude and trend. Further analysis of shear strength was conducted using the Mohr–Coulomb criterion [29], as shown in Figure 11. The cohesion increased with an increase in the location of load concentration. Compared with the NFC condition, the cohesion increased by 12.4% under FOC and by 30.76% under FFC conditions, respectively. The internal friction angle decreased with an increase in the location of load concentration as well. Compared to the NFC condition, there was a decrease of 0.91% in the internal friction angle under FOC conditions and a decrease of 1.44% under FFC conditions.

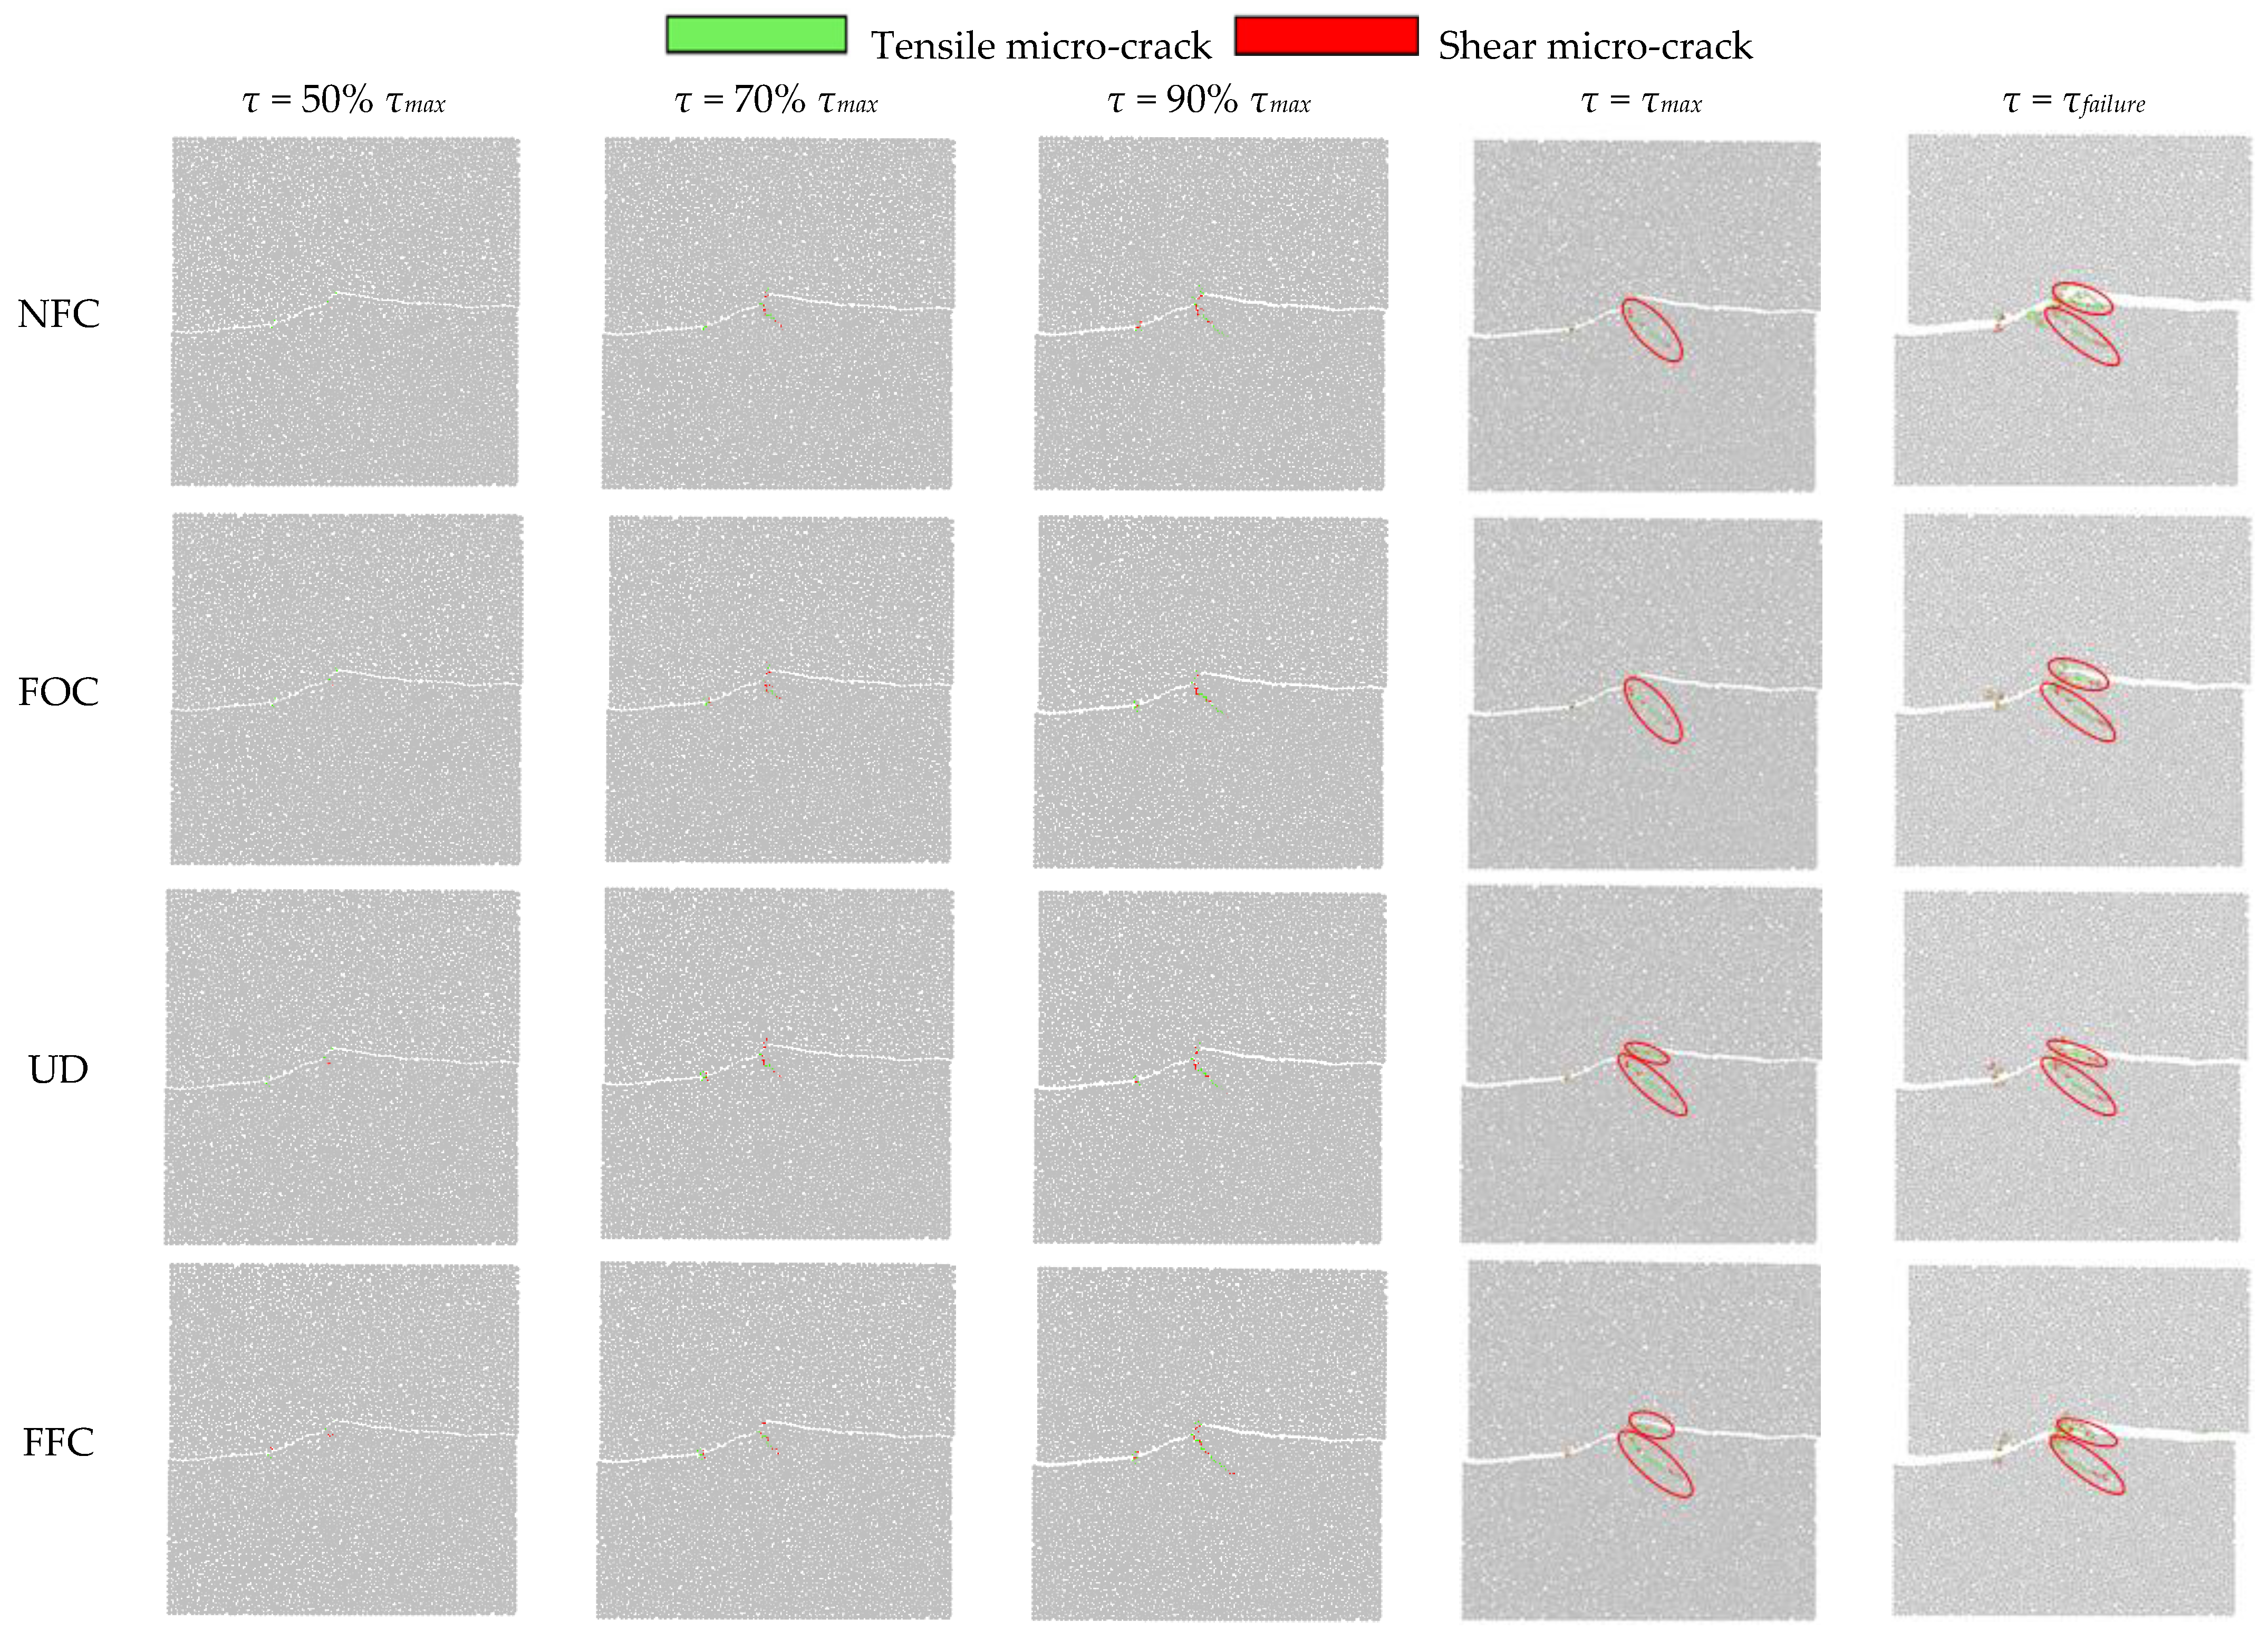
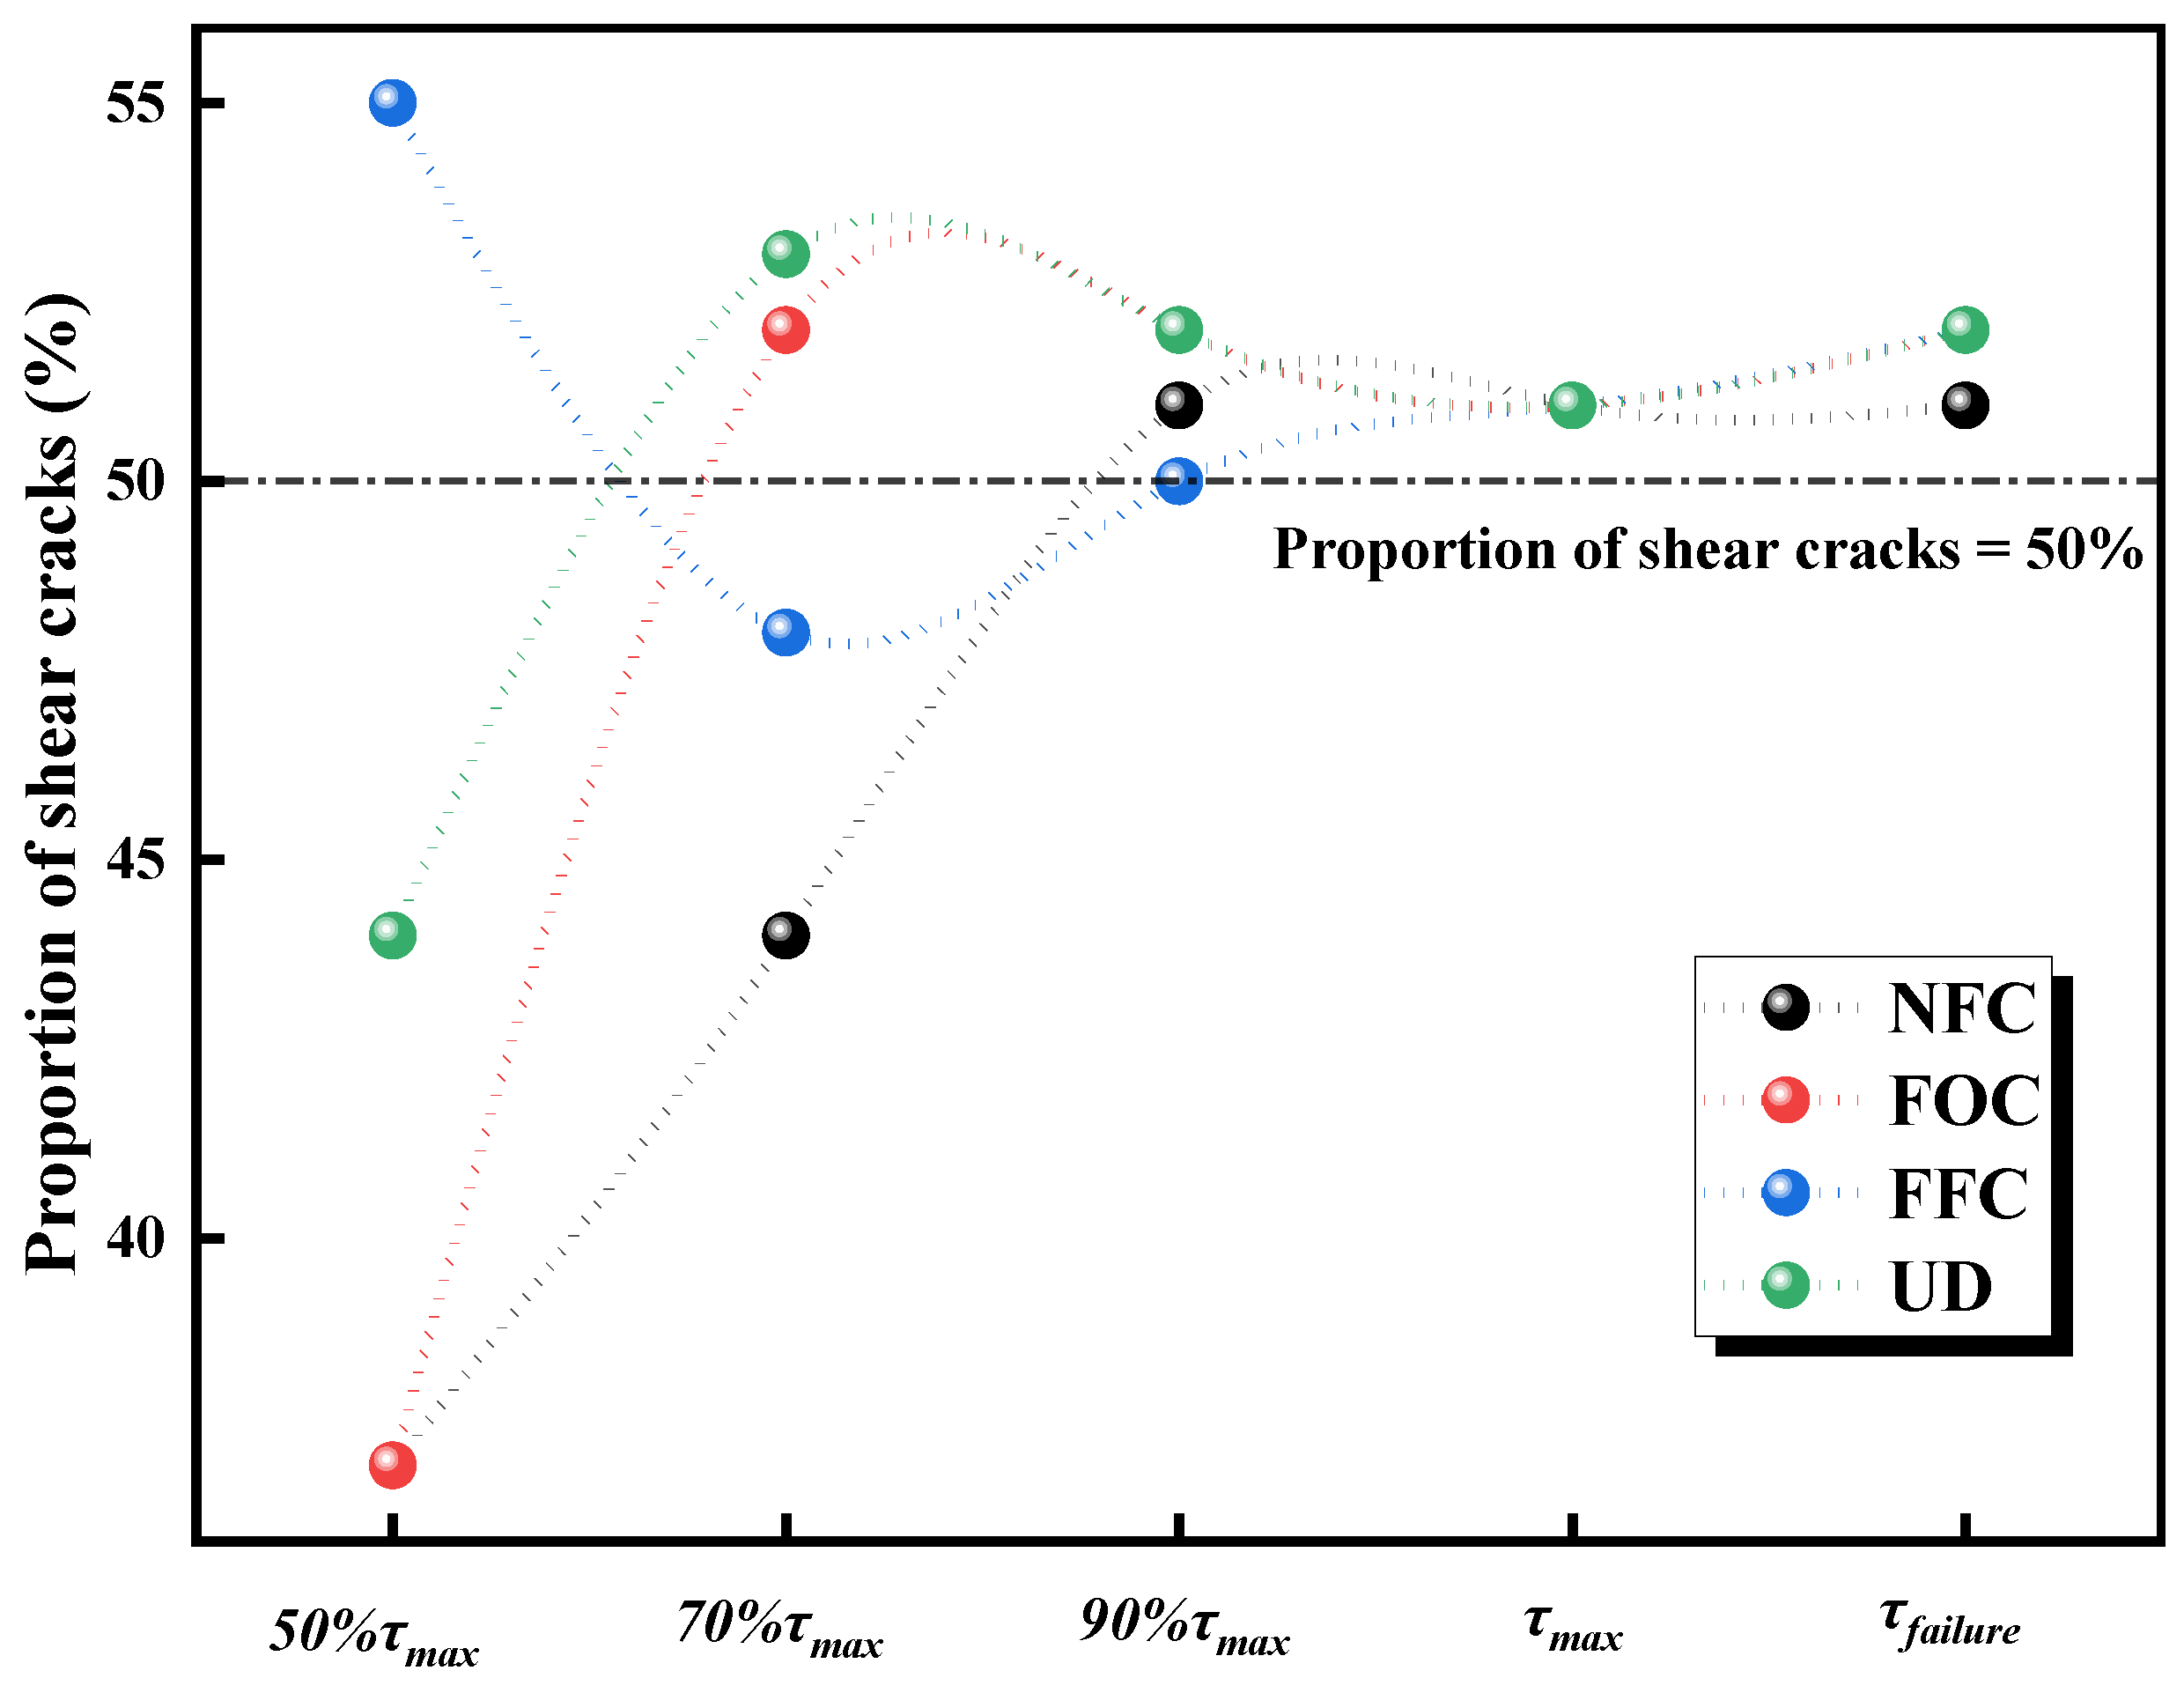
4.3. Crack Evolution

To investigate the law of damage evolution, crack extensions for different forms of load distribution are presented in Figure 12 (GT = 20 kN), at various stress levels (τ = 50% τmax; τ = 70% τmax; τ = 90% τmax; τ = τmax; τ = τfailure). Shear cracks are represented by the red color, while the green color indicates tensile cracks. From observing crack propagation in different load distribution modes, it can be seen that the main cause of rock mass failure was micro-tensile cracking at the highest joint center. With an increase in shear stress level, cracks initiated at the highest undulation (the center of the joint surface) and gradually expanded along the lower slope to form two macro-through-cracks. It is worth noting that there was only one through-crack for NFC and FFC at the peak shear stress, while under UD and FFC conditions, the crack growth mode was essentially similar with two obvious through-cracks at the peak shear stress. The results indicate that compared to FOC and UD conditions, NFC and FFC conditions required more damage for rock mass failure and made it more difficult to destroy the rock mass structure.
Figure 13 delineates the spatial–temporal evolution of tensile versus shear fracture distribution across distinct loading phases under varying load configuration modes. During the initial loading stages (NFC, FOC, and UD conditions), tensile fractures prevailed as the principal crack type due to localized stress concentrations exceeding the material’s tensile resistance. With progressive loading, a characteristic transition occurred where shear fractures gradually dominated the failure process, achieving predominance at 90% τmax under NFC conditions. This transition occurred earlier at 70% τmax for FOC and UD configurations, indicating accelerated shear localization under these boundary constraints. Contrastingly, FFC conditions exhibited sustained shear fracture dominance throughout the entire loading history, confirming shear-driven failure as the fundamental fracture propagation mechanism under fully confined conditions.
The observed fracture pattern transition reveals two distinct failure pathways: (1) For the NFC, FOC, and UD conditions, initial tensile-dominated damage evolved into shear-controlled failure through progressive micro-crack coalescence and stress redistribution during shear deformation. (2) FFC conditions demonstrated immediate shear fracture nucleation and propagation due to enhanced confinement restricting tensile crack development. This mechanistic difference explains the enhanced shear strength under FFC loading; the energy-intensive shear fracture process (characterized by frictional sliding and asperity degradation) requires greater energy dissipation compared to tensile fracture mechanisms (governed by bond separation with lower energy consumption). The resultant strength hierarchy (FFC > NFC ≈ FOC) directly correlated with the proportion of high-energy shear fractures in the failure process.

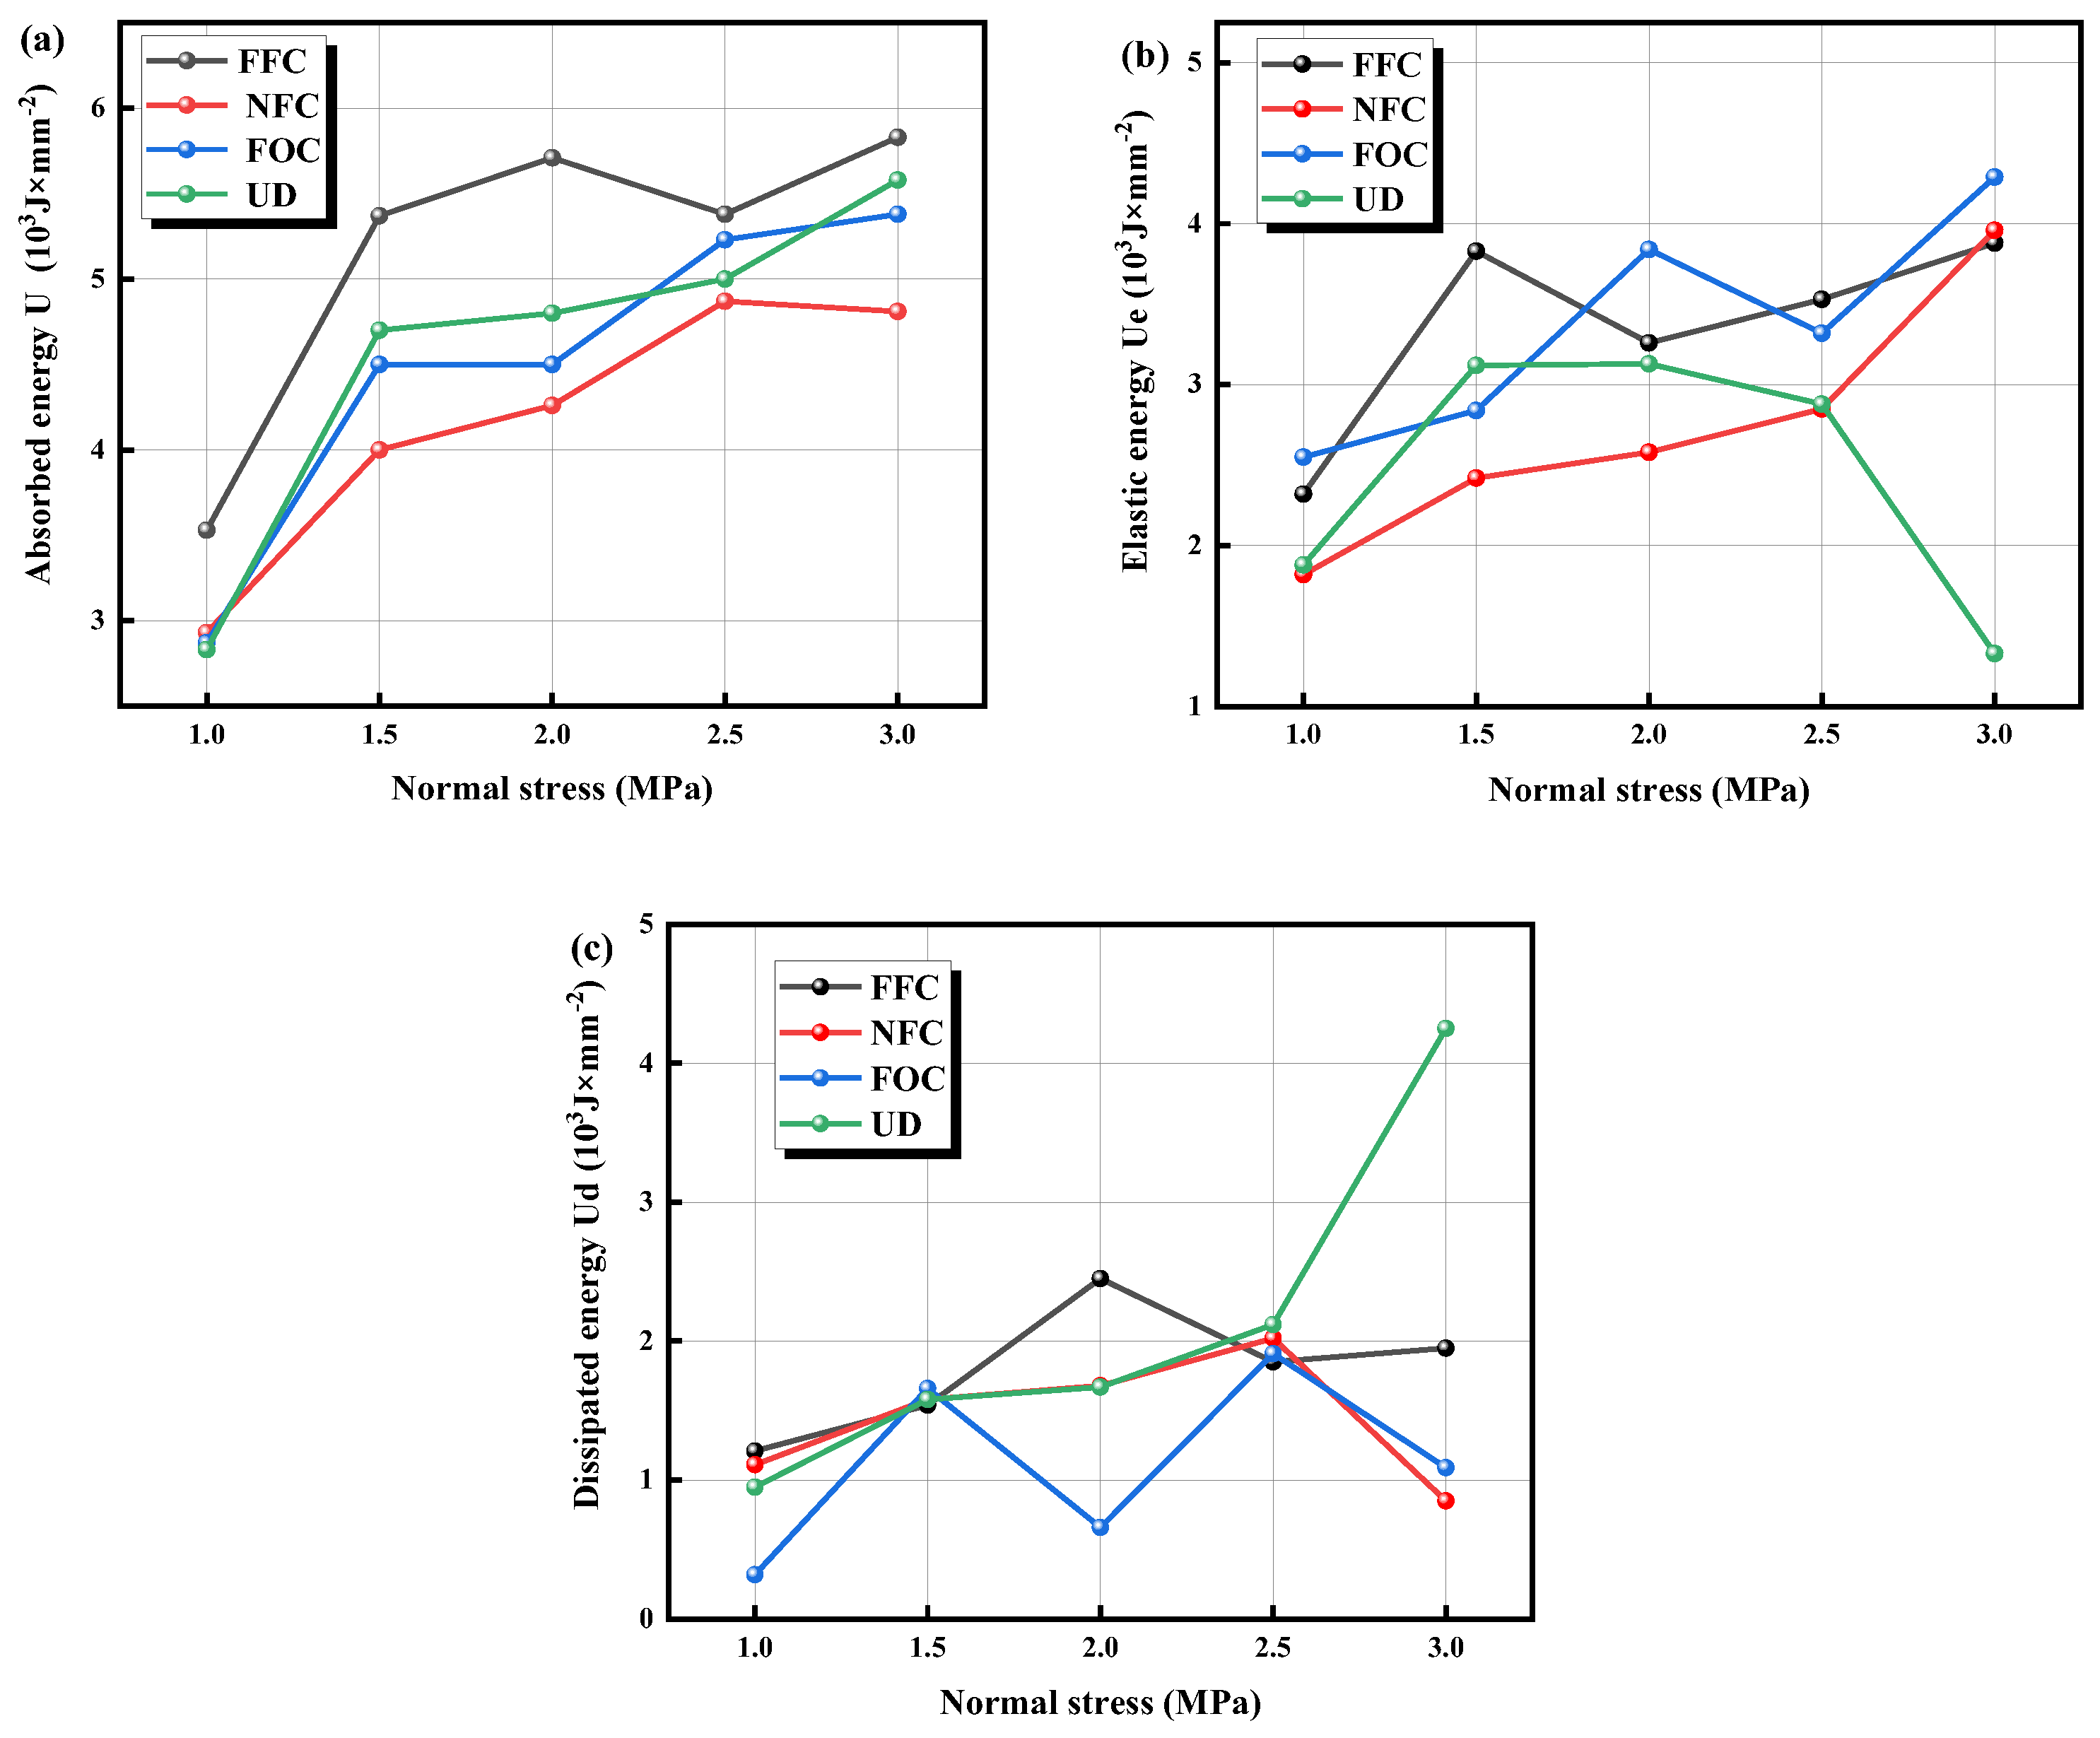
4.4. Energy Evolution Law

The essence of the mechanical behavior of rocks under loading lies in the process of external energy input, storage, and dissipation. Examining the rock damage process from an energy perspective can effectively reveal the underlying mechanical mechanisms of rocks. Assuming that no energy exchange occurs between the rock loading system and the external environment, according to the law of the conservation of energy, the relationship between absorbed energy (U), elastic energy (Ue), and dissipated energy (Ud) generated by microdefect closure or expansion can be expressed as
U = U e + U d
where U is the energy absorbed in loading; Ue is the elastic energy stored inside the rock and released during the unloading process; Ud is the energy consumed during the plastic deformation of the rock, which is irreversible.
Equation (6) can be expressed in the integral form of energy density as
u d V = u e d V + u d d V
where u represents the input energy density, Ue denotes the elastic energy density, Ud signifies the dissipative energy density, and dV represents the sum of the energy density corresponding to the unit volume.
These parameters could be calculated by integrating the curves [30], as shown in Figure 14. The lower stress point could be set to 30% of shear strength, and the area of trapezoid ABCF represents the input energy density for the loading process. Trapezoid ABCED indicates the elastic energy density that can be released. Trapezoid CDEF represents the dissipated energy density. The calculation of these areas can be obtained from Equation (8):
u n = γ n n γ n m τ m a x d γ u e n = γ n m γ n m τ l o w d γ u d n = u n u e n = γ n n γ m m τ m a x d γ γ n n γ n m τ l o w d γ ,
where τmax and τlow are used to calculate the maximum and minimum shear stresses, respectively.
The evolution relationships of absorbed energy (U), elastic energy (Ue), and dissipated energy (Ud) are presented in Figure 15 to analyze the energy level of the joint surface under different load distribution methods. As the stress level increased, both U and Ue showed a gradual rise, except under UD conditions, while Ud did not display a discernible trend. The average values of U and Ue for FFC were larger than those for FOC and NFC, and the average values of Ud for FFC were greater than those for NFC and FOC. These differences stemmed from the varying degrees of crack evolution under different forms of load distribution; FFC was characterized by shear cracks with higher strength and greater energy dissipation, whereas NFC and FOC were dominated by tensile cracks with lower strength and less energy dissipation. In practical engineering, it is advisable to avoid placing load concentration locations too close together. Based on the above results and analysis, it can be observed that as the load concentration location becomes closer to the far end along the shear direction, there is greater deformation in rock mass during failure, requiring more strength and energy for failure. Increasing the distance between load concentration locations makes the rock mass structure less prone to damage; therefore, it should be avoided when load concentration locations are too close together but rather placed in positions with large load concentrations.

5. Non-Uniform-Load Shear Strength Criterion Based on Machine Learning Methods

The shear strength criterion provides an intuitive theoretical explanation for the strength properties of rock masses. However, due to the challenges in quantitatively describing the non-uniform distribution characteristics of loads, traditional shear strength criteria with quantitative parameters have become less applicable. In this study, prediction models were constructed using the XGBoost algorithm based on simulation results from direct shear tests. This algorithm can describe parameters both qualitatively and quantitatively. Additionally, XGBoost algorithms optimized by Whale, Particle Swarm, Genetics, and Bayesian algorithms were employed. By comparing the model’s predicted values with the test data, we selected the algorithm that exhibited higher accuracy to build our prediction model.
The XGBoost (Extreme Gradient Boosting) model is an integrated machine learning algorithm based on decision trees with a gradient boosting framework. XGBoost possesses numerous advantages, such as high accuracy, flexibility, impressive learning efficiency, and parallelizable algorithms, making it widely used in various industries for big data processing. The specific approach involves continuously splitting and growing the tree using predetermined feature values. Each additional tree learns a new function to fit the residuals of the previous prediction. Ultimately, training is completed by yielding k trees, and the score of a sample is predicted by combining these k trees. During this process, the CART regression tree model is employed. CART assumes that the regression tree is binary and performs splitting based on feature values; for instance, tree nodes are split according to the j-th feature value and divided into left and right subtrees depending on whether the feature value is less than s:
R 1 ( j , s ) = x x ( j ) s   R 2 ( j , s ) = x x ( j ) > s
The typical objective function of a CART regression tree is
x i R m y i f x i 2
When solving for the optimal cut-off feature j and the optimal cut-off point s, the function can be transformed as
min j , s min c 1 x i R 1 j , s y i c 1 2 + min c 2 x i R 2 j , s y i c 2 2
With the above equations, we can obtain the optimal cut features and cut points and finally build the regression tree. When the training is completed to obtain k trees, the scores corresponding to each tree are accumulated to obtain the predicted value of that sample. The specific calculation equation is as follows:
y ^ = φ x i = k = 1 K f k x i
where
F = f x = w q x q : R m T , w R T
where w q ( x ) is the fraction of leaf nodes and f(x) is one of the regression trees.
The dataset used to construct the strength prediction model consisted of test results from four different distribution forms under 21 different normal loads, totaling 84 sets of data (Table 3). It could be found that in these data, FFC had the highest strength under the same normal stress condition, which was consistent with the conclusion above. The model was trained using 75% of the samples as the training set, while the remaining 25% served as the test set for validation. Among all algorithms tested, Genetic-XGBoost yielded the highest R2 value of 0.973 for predicting shear strength and was therefore chosen to construct the model. A weight algorithm module was introduced to calculate weights corresponding to load value and load distribution form [31]. The load distribution form had a significantly larger weight value (76.7%) than load value (23.2%), indicating that it is a more dominant factor affecting shear strength compared to uniform conditions where overburden load remains an important influencing factor. This study highlights that considering load distribution form is critical when predicting shear strength and ensuring rock mass stability.

6. Conclusions

In this study, we constructed a non-uniform load mechanical model using the strip division method to investigate the effect of non-uniform load on the shear mechanical properties of joint surfaces. We then conducted a series of shear test simulations based on PFC software to analyze how different load distribution forms affect main shear parameters (cohesion and internal friction angle), crack expansion patterns, and energy evolution laws. Finally, we used machine learning methods to develop a quantitative prediction model for shear strength.
(1) Taking into account the common overburden loads on joint surfaces in engineering projects, we established a non-uniform-load mechanics model for joint surfaces using the strip partitioning method. This resulted in three representative forms of load distribution: far-field concentration (FFC), near-field concentration (NFC), and focus on central (FOC). Additionally, based on idealized mathematical hypotheses, we derived load distribution formulas for these three conditions.
(2) The proximity of load concentration to the distal shear direction correlated positively with peak shear displacement and strength. Compared to NFC, cohesion increased by 12.4% (FOC) and 30.76% (FFC), whereas internal friction angles decreased marginally by 0.91% (FOC) and 1.44% (FFC). Fracture analysis revealed distinct failure modes: NFC and FOC specimens exhibited one through-crack at the peak shear stress, while FFC developed two. Initial loading stages in NFC/FOC prioritized tensile cracks, transitioning to shear-dominated failure. Notably, shear cracks comprised >50% of total crack propagation in FFC. Energy dissipation metrics showed hierarchical trends: deformation energy (U) and elastic energy (Ue) followed FFC > FOC > NFC, while dissipated energy (Ud) ranked FFC > NFC > FOC, reflecting crack evolution differences under varying loading configurations.
(3) According to the characteristics of deformation, strength, crack formation, and energy evolution under different load distribution forms, the farther the maximum load location was along the shear direction, the stronger the resistance to damage and stability of rock mass was. In engineering practice, it is advisable to position the maximum load as far away as possible from the joint along the shear direction.
(4) By using the XGBoost algorithm, we proposed five quantitative shear strength prediction models: the Whale, Genetic, Bayesian, and Particle Swarm algorithms. By comparing the predicted values with the test values, we obtained the Genetic-XGBoost algorithm prediction model with the highest prediction accuracy (R2 = 0.973). The weight of the load distribution mode was 76.7%, which was considerably higher than that of the load value at 23.2%. This indicates that load distribution form is a primary factor affecting shear strength.

Author Contributions

Conceptualization, C.Y.; Methodology, H.L. (Hongwei Liu) and X.Z.; Software, X.Z. and Y.C.; Validation, H.L. (Hongwei Liu) and K.O.; Formal analysis, H.L. (Hongwei Liu), X.Z., H.L. (Hang Lin), Y.C., C.Y. and K.O.; Resources, H.L. (Hongwei Liu), H.L. (Hang Lin) and Y.C.; Writing—original draft, H.L. (Hongwei Liu) and Hang Lin; Writing—review & editing, H.L. (Hang Lin). All authors have read and agreed to the published version of the manuscript.

Funding

This paper received its funding from Project (42277175) supported by National Natural Science Foundation of China; Project (2023JJ30657) supported by the Hunan Provincial Natural Science Foundation of China; the Guizhou Provincial Major Scientific and Technological Program (2023-425); the Yunnan Province Science and Technology Plan Project (202205AD160063); and the Hunan provincial key research and development Program (2022SK2082).

Institutional Review Board Statement

Not applicable.

Informed Consent Statement

Not applicable.

Data Availability Statement

The data used to support the findings of this study are available from the corresponding author upon request.

Conflicts of Interest

Author Chaoyi Yang was employed by Yunnan Diqing Non-Ferrous Metals Co., Ltd. Author Ke Ou was employed by China Railway 5 Engn Grp Co., Ltd. The remaining authors declare that the research was conducted in the absence of any commercial or financial relationships that could be construed as a potential conflict of interest.

References

  1. Zhang, Y.; Jiang, Y.; Asahina, D.; Wang, Z. Shear behavior and acoustic emission characteristics of en-echelon joints under constant normal stiffness conditions. Theor. Appl. Fract. Mech. 2020, 109, 102772. [Google Scholar] [CrossRef]
  2. Asadizadeh, M.; Hossaini, M.F.; Moosavi, M.; Masoumi, H.; Ranjith, P.G. Mechanical characterisation of jointed rock-like material with non-persistent rough joints subjected to uniaxial compression. Eng. Geol. 2019, 260, 105224. [Google Scholar] [CrossRef]
  3. Aziznejad, S.; Esmaieli, K.; Hadjigeorgiou, J.; Labrie, D. Responses of jointed rock masses subjected to impact loading. J. Rock Mech. Geotech. Eng. 2018, 10, 624–634. [Google Scholar] [CrossRef]
  4. Kou, M.; Liu, X.; Tang, S.; Wang, Y. Experimental study of the prepeak cyclic shear mechanical behaviors of artificial rock joints with multiscale asperities. Soil. Dyn. Earthq. Eng. 2019, 120, 58–74. [Google Scholar] [CrossRef]
  5. Wang, G.; Zhang, Y.Z.; Jiang, Y.J.; Liu, P.X.; Guo, Y.S.; Liu, J.K.; Ma, M.; Wang, K.; Wang, S.G. Shear Behaviour and Acoustic Emission Characteristics of Bolted Rock Joints with Different Roughnesses. Rock Mech. Rock Eng. 2018, 51, 1885–1906. [Google Scholar] [CrossRef]
  6. Xie, S.; Lin, H.; Wang, Y.; Chen, Y.; Xiong, W.; Zhao, Y.; Du, S. A statistical damage constitutive model considering whole joint shear deformation. Int. J. Damage Mech. 2020, 29, 988–1008. [Google Scholar] [CrossRef]
  7. Zhang, X.; Lin, H.; Wang, Y.; Yong, R.; Zhao, Y.; Du, S. Damage evolution characteristics of saw-tooth joint under shear creep condition. Int. J. Damage Mech. 2021, 30, 453–480. [Google Scholar] [CrossRef]
  8. Oh, J.; Li, Y.; Mitra, R.; Canbulat, I. A Numerical Study on Dilation of a Saw-Toothed Rock Joint Under Direct Shear. Rock Mech. Rock Eng. 2017, 50, 913–925. [Google Scholar] [CrossRef]
  9. Saadat, M.; Taheri, A. A numerical study to investigate the influence of surface roughness and boundary condition on the shear behaviour of rock joints. Bull. Eng. Geol. Environ. 2020, 79, 2483–2498. [Google Scholar] [CrossRef]
  10. Singh, P.; Spearing, A.J.S. An Improved Analytical Model for the Elastic and Plastic Strain-hardening Shear Behaviour of Fully Grouted Rockbolts. Rock Mech. Rock Eng. 2021, 54, 3909–3925. [Google Scholar] [CrossRef]
  11. Tang, Z.C.; Wong, L.N.Y. New Criterion for Evaluating the Peak Shear Strength of Rock Joints Under Different Contact States. Rock Mech. Rock Eng. 2016, 49, 1191–1199. [Google Scholar] [CrossRef]
  12. Esaki, T.; Du, S.; Mitani, Y.; Ikusada, K.; Jing, L. Development of a shear-flow test apparatus and determination of coupled properties for a single rock joint. Int. J. Rock Mech. Min. Sci. 1999, 36, 641–650. [Google Scholar] [CrossRef]
  13. Xia, C.-C.; Yu, Q.-F.; Qian, X.; Gui, Y.; Zhuang, X.-Q. Experimental study of shear-seepage behaviour of rock joints under constant normal stiffness. Rock Soil Mech. 2020, 41, 57. [Google Scholar] [CrossRef]
  14. Zhang, Q.; Li, Y.; Wu, C.; Fei, X.; Hong, Y. Impacts of stress and roughness on steady-state creep of synthetic rock joints under shear. Geotech. Lett. 2019, 9, 46–52. [Google Scholar] [CrossRef]
  15. Liu, X.W.; Liu, Q.S.; Kang, Y.S.; Pan, Y.C. Improved Nonlinear Strength Criterion for Jointed Rock Masses Subject to Complex Stress States. Int. J. Geomech. 2018, 18, 04017164. [Google Scholar] [CrossRef]
  16. Li, X.; Gong, F.; Tao, M.; Dong, L.; Du, K.; Ma, C.; Zhou, Z.; Yin, T. Failure mechanism and coupled static-dynamic loading theory in deep hard rock mining: A review. J. Rock Mech. Geotech. Eng. 2017, 9, 767–782. [Google Scholar] [CrossRef]
  17. Okubo, S.; Fukui, K.; Hashiba, K. Long-term creep of water-saturated tuff under uniaxial compression. Int. J. Rock Mech. Min. Sci. 2010, 47, 839–844. [Google Scholar] [CrossRef]
  18. Lajtai, E.Z.; Schmidtke, R.H.; Bielus, L.P. The effect of water on the time-dependent deformation and fracture of a granite. Int. J. Rock Mech. Min. Sci. Geomech. Abstr. 1987, 24, 247–255. [Google Scholar] [CrossRef]
  19. Wu, X.; Jiang, Y.; Gong, B.; Guan, Z.; Deng, T. Shear Performance of Rock Joint Reinforced by Fully Encapsulated Rock Bolt Under Cyclic Loading Condition. Rock Mech. Rock Eng. 2019, 52, 2681–2690. [Google Scholar] [CrossRef]
  20. Li, H.-Y.; Wang, Z.; Sun, Y.-F.; Li, W.-H. Terrain classification based on adaptive weights with airborne LiDAR data for mining area. Trans. Nonferrous Met. Soc. China 2011, 21, S648–S653. [Google Scholar] [CrossRef]
  21. Kim, Y.; Sim, T.E.; Chua, Y.S.; Bakytuly, N.; Satyanaga, A.; Pu, J.H. Harnessing Green Cover Systems for Effective Slope Stabilization in Singapore. Land 2025, 14, 436. [Google Scholar] [CrossRef]
  22. Bahaaddini, M.; Sharrock, G.; Hebblewhite, B.K. Numerical direct shear tests to model the shear behaviour of rock joints. Comput. Geotech. 2013, 51, 101–115. [Google Scholar] [CrossRef]
  23. Mehranpour, M.H.; Kulatilake, P.H.S.W. Improvements for the smooth joint contact model of the particle flow code and its applications. Comput. Geotech. 2017, 87, 163–177. [Google Scholar] [CrossRef]
  24. Fereshtenejad, S.; Kim, J.; Song, J.-J. Experimental Study on Shear Mechanism of Rock-Like Material Containing a Single Non-Persistent Rough Joint. Energies 2021, 14, 987. [Google Scholar] [CrossRef]
  25. Xie, S.J.; Lin, H.; Duan, H.Y. A novel criterion for yield shear displacement of rock discontinuities based on renormalization group theory. Eng. Geol. 2023, 314, 107008. [Google Scholar] [CrossRef]
  26. Gell, E.M.; Walley, S.M.; Braithwaite, C.H. Review of the Validity of the Use of Artificial Specimens for Characterizing the Mechanical Properties of Rocks. Rock Mech. Rock Eng. 2019, 52, 2949–2961. [Google Scholar] [CrossRef]
  27. Hu, H.; Zhang, X.; Qin, J.; Lin, H. Influence of Morphology Characteristics on Shear Mechanical Properties of Sawtooth Joints. Buildings 2022, 12, 886. [Google Scholar] [CrossRef]
  28. Cheng, Y.; Wong, L.N.Y. A study on mechanical properties and fracturing behavior of Carrara marble with the flat-jointed model. Int. J. Numer. Anal. Methods Geomech. 2020, 44, 803–822. [Google Scholar] [CrossRef]
  29. Zhai, W.; Zhang, H.; Yang, Z.; Chen, Z.; Wu, B.; Zhou, J.; Cheng, S.; Tan, P. A semi-analytical model for predicting the mechanical responses around a non-circular wellbore by using complex variable method. Geomech. Geophys. Geo-Energy Geo-Resour. 2025, 11, 26. [Google Scholar] [CrossRef]
  30. Tan, H.; Li, J.T.; Shi, Z.M.; Wang, M.X.; Wang, J.; Li, J. Damage evolution and failure characteristics of red sandstone with prefabricated crack under coupled dry-wet cycle-fatigue loading. Int. J. Fatigue 2023, 175, 107751. [Google Scholar] [CrossRef]
  31. Uddin, M.G.; Nash, S.; Rahman, A.; Olbert, A.I. A comprehensive method for improvement of water quality index (WQI) models for coastal water quality assessment. Water Res. 2022, 219, 118532. [Google Scholar] [CrossRef] [PubMed]
Figure 1. Schematic diagram of non-uniform distribution of overburden load on joints.
Applsci 15 04257 g001
Figure 2. Three main forms of the distribution of overburden loads on joints (where N = 10; h is the height of the rock above the joint; P is the load; α is the angle between the joint plane and the rock surface; Ld is the length difference determined according to the strip division method; and Ln is the length of the rock).
Applsci 15 04257 g002
Figure 3. The process of extracting the contours of the rock joint surface used in the simulation: (a) Structural plane scanning (b) Structural plane topography (c) Select a 100 mm long structural plane profile (d) Obtain profile coordinate data.
Applsci 15 04257 g003
Figure 4. Test preparation process (The white bag in Figure (a) is a cement bag).
Applsci 15 04257 g004
Figure 5. Laboratory shear stress–shear displacement curves of jointed rock mass under different normal stress conditions.
Applsci 15 04257 g005
Figure 6. The simulation diagram depicts a non-uniform distribution of overburden load.
Applsci 15 04257 g006
Figure 7. Shear stress–shear displacement curves under different forms of load distribution.
Applsci 15 04257 g007aApplsci 15 04257 g007b
Figure 8. Average peak shear displacement under different forms of load distribution (standard deviations: UD = 0.126; NFC = 0.109; FOC = 0.091; FFC = 0.083).
Applsci 15 04257 g008
Figure 9. Relationship between shear stiffness and shear displacement under different load distribution forms (normal stress = 2.0 MPa).
Applsci 15 04257 g009
Figure 10. Relationship between normal stress and shear strength under different forms of load distribution (standard deviations: UD = 0.116; NFC = 0.089; FOC = 0.078; FFC = 0.076).
Applsci 15 04257 g010
Figure 11. Relationship between cohesion and internal friction angle vs. location of load concentration (standard deviations: UD = 0.118; NFC = 0.088; FOC = 0.076; FFC = 0.075).
Applsci 15 04257 g011
Figure 12. Crack expansion process under different forms of load distribution ( G T = 20 kN).
Applsci 15 04257 g012
Figure 13. Crack percentage under different load distributions ( G T = 20 kN; standard deviations: UD = 0.096; NFC = 0.083; FOC = 0.078; FFC = 0.073).
Applsci 15 04257 g013
Figure 14. Schematic diagram of energy calculation.
Applsci 15 04257 g014
Figure 15. The relationship between energy and stress under different load distributions (standard deviations: UD = 0.125; NFC = 0.093; FOC = 0.088; FFC = 0.075): (a) Absorbed energy (b) Elastic energy (c) Dissipated energy.
Applsci 15 04257 g015
Table 1. Calibration results of microscopic parameters.
Parameter TypeMicroscopic ParametersValue
ParticleDensity (kg/m3)2500
Radius (mm)0.6–0.9
Porosity0.1
Flat-joint contact modelContact modulus, E c ¯   ( G P a ) 1.8
Contact stiffness ratio, k n ¯ k s ¯ 1.0
Tensile strength (MPa)13.8
Cohesion (MPa)28.8
Internal friction angle (°)32.5
Friction coefficient, f1.5
Smoot-joint contact modelNormal stiffness, k n   ( G P a ) 100
Shear stiffness, k s   ( G P a ) 0.62
Friction coefficient, f0.92
Table 2. Experimental simulation scheme.
Distribution Form Total   Normal   Load   G T Normal Stress σ
Uniform distribution (UD)10 kN, 15 kN, 20 kN, 25 kN, 30 kN1 MPa, 1.5 MPa, 2 MPa, 2.5 MPa, 3 MPa
Far-field concentration (FFC)
Near-field concentration (NFC)
Focus on center (FOC)
Table 3. Sample dataset.
Normal Stress (MPa)Shear Strength Simulation (MPa)
NFCFOCFFCUD
13.63.784.213.77
1.13.713.934.223.9
1.23.844.294.384.31
1.34.114.544.824.55
1.44.254.535.084.71
1.54.294.715.284.74
1.64.414.675.314.76
1.74.524.845.314.92
1.84.524.745.445.06
1.94.665.065.584.84
24.795.25.755.13
2.15.052.165.775.1
2.25.015.285.885.22
2.35.125.45.915.34
2.45.195.535.975.46
2.55.245.585.945.56
2.65.35.636.215.67
2.75.355.695.295.71
2.85.385.76.215.75
2.95.415.816.265.83
35.65.916.315.8
Disclaimer/Publisher’s Note: The statements, opinions and data contained in all publications are solely those of the individual author(s) and contributor(s) and not of MDPI and/or the editor(s). MDPI and/or the editor(s) disclaim responsibility for any injury to people or property resulting from any ideas, methods, instructions or products referred to in the content.

