Article

Dynamic Modeling and Experimental Validation of the Photovoltaic/Thermal System

1
Faculty of Energy Technology, University of Maribor, Hočevarjev trg 1, 8270 Krško, Slovenia
2
Faculty of Electrical Engineering and Computer Science, University of Maribor, Koroška cesta 46, 2000 Maribor, Slovenia
3
Statistical Office of the Republic of Slovenia, Litostrojska Cesta 54, 1000 Ljubljana, Slovenia
*
Author to whom correspondence should be addressed.
Appl. Sci. 2025, 15(19), 10505; https://doi.org/10.3390/app151910505
Submission received: 29 August 2025 / Revised: 18 September 2025 / Accepted: 25 September 2025 / Published: 28 September 2025
(This article belongs to the Special Issue Solar Thermal Energy: Conversion, Storage, and Utilization)

Abstract

The aim of this paper is to present a novel and comprehensive methodology for the dynamic modeling and experimental validation of a photovoltaic/thermal system. The dynamic model is divided into thermal and electrical subsystems, encompassing the photovoltaic/thermal module and the thermal energy storage. The thermal subsystem of both the photovoltaic/thermal module and the thermal energy storage is described by a one-dimensional dynamic model of heat transfer mechanisms and optical losses, while the electrical subsystem is presented as an electrical equivalent circuit of double diode solar cell. Model validation was conducted on a modern experimental photovoltaic/thermal system over an extended operational period at a five-minute resolution, with validation days classified as sunny, cloudy, or overcast based on weather conditions, thereby demonstrating an applied approach. The results demonstrate the lowest deviation values reported to date, confirmed using six quantitative indicators. The added value of the proposed methodology, not previously addressed in the literature, lies in the following contributions: (i) comprehensive modeling of the entire photovoltaic/thermal system, (ii) accurate consideration of optical losses in the photovoltaic/thermal module, and (iii) long-term experimental validation. Overall, the proposed methodology provides a reliable and efficient framework for PV/T system design, optimization, and long-term performance assessment.

1. Introduction

In today’s world, photovoltaic (PV) systems are an indispensable source of electricity from renewable sources that can be easily and quickly integrated onto building roofs or other land surfaces. The electricity production from PV systems depends on the power density of solar radiation, the temperature of the PV module, and the air mass factor. The temperature of the PV module primarily negatively affects the electrical parameters [1], where an increase in the PV module temperature by 1 °C causes a decrease in output power [2] or a drop in the PV module efficiency [3], depending on the properties and sensitivity of the individual PV module. To achieve more efficient operation, increase the lifespan, and enhance the energy yield of PV systems, photovoltaic/thermal (PV/T) systems have appeared on the market over the last ten years. Unlike commercial PV systems, PV/T systems have a heat exchanger or cooling fins installed on the backside of the PV module. The primary task of the heat exchanger is to lower the PV module temperature and thereby increase the electrical efficiency [4]. On the other hand, the excess heat removed from the PV/T module can be used for heating in low-temperature heating applications. Due to their ability to generate more energy per unit area compared to conventional PV modules and thermal collectors separately, PV/T modules are particularly advantageous for applications with constrained space [5]. Accurate estimation of the PV/T system size and its performance requires a detailed understanding of its operation, which is based on electrical and thermal principles and described through various mathematical models.
Numerous studies have been undertaken to accurately assess the temperature distribution within a PV/T module. Predominantly, static or steady-state mathematical models of PV/T modules are prevalent [6,7,8,9,10,11,12,13,14,15,16,17], which, unlike dynamic mathematical models of PV/T modules [18,19,20,21,22,23,24,25,26,27,28,29,30,31,32,33,34,35,36,37,38,39,40,41,42,43,44,45,46,47,48,49,50,51,52], represent a lower level of accuracy but provide higher computational speed. In most cases, dynamic mathematical models of PV/T modules are presented in either one-dimensional [19,23,24,25,26,30,32] or two-dimensional [20,21,27,28,29,34,44] spaces, where the temperature distribution within each layer is uniform. Each individual layer of the PV/T module is described in the dynamic mathematical model by heat conduction, convection, and radiation. The most predominant papers discussing the dynamic modelling of PV/T modules are presented in more detail, followed by notable examples of steady-state models for comparison. The authors of [27,28] present state-of-the-art two-dimensional dynamic modelling of a PV/T module at the layer level, solving transient energy balance equations for the glass cover, PV cells, encapsulant, absorber, and fluid domain. The models account for conductive, convective, and radiative heat transfer, as well as thermal–electrical coupling, enabling detailed prediction of temperature and efficiency over time and allowing reliable performance assessment under variable irradiance and flow conditions. In contrast to these dynamic approaches, Sakellariou et al. [8] investigated a retrofitted PV/T module installed alongside a conventional PV module and developed a steady-state model based on the Hottel–Whillier equation modified by Florschuetz. Expanding on steady-state modelling, Shahsaver et al. [9] presented a mathematical model for a direct-coupled PV/T air collector that integrates PV electrical performance, DC fan characteristics, and heat transfer analysis. This approach highlights the adaptability of steady-state methods for air-based systems. Similarly, Aste et al. [16] proposed a steady-state one-dimensional model for a PV/T water collector, incorporating coupled energy balance equations for all components and validating the model through experiments. Model accuracy was assessed using nMBE, nRMSE, and R2, with validation performed on clear and cloudy winter days as well as in summer, further confirming the robustness of steady-state approaches in water-based configurations. Building on the topic of PV/T system modeling, the authors in [38] presented a set of thermal models, including the quasi-steady thermal model and the transient thermal model, and electrical models such as the single-diode, double-diode, and other configurations, validated against literature data. They found that the choice of electrical model has a strong influence on prediction accuracy under different climatic conditions and identified key limitations of each approach. While these studies focus on physics-based formulations, other research has explored data-driven techniques that simplify the modelling process and reduce computational effort. Similarly, ref. [53] proposed a dynamic modelling approach for PV/T systems using polynomial regression to estimate both thermal and electrical outputs. The model was trained and validated with experimental data, achieving high accuracy in predicting performance under variable operating and environmental conditions, while requiring lower computational effort compared to detailed physical models.
For a more detailed description of the heat transfer mechanisms and the thermal and mechanical properties of the materials, a precise description of the optical properties [34,35,37,51,54] is crucial. Optical properties or optical losses are usually defined in those layers where light absorption, transmission, and/or reflection can occur. A sufficient amount of absorbed light is required to generate an electric current in a solar cell, which can be increased by texturing the surface of the solar cell or by applying an anti-reflective coating. To determine the temperature distribution in the solar cell using the proposed dynamic model, the output electric power of the solar cell is also needed as an input parameter. This requirement is addressed by numerous mathematical models for determining the electric power of a solar cell, which are based on empirical equations [6,7,8,10,14,18,20,21,23,24,25,26,29,30,32,34] or equivalent electrical circuits [9,18,27,28,31]. Empirical equations represent a lower accuracy level than equivalent electrical circuits, as they only account for the solar cell temperature and the power density of solar radiation, neglecting the influence of other electrical parameters on the output electric power. To achieve a sufficiently high level of accuracy in calculating the output power of a solar cell, an accurate mathematical model for calculating the temperature of the solar cell is required, and vice versa.
Excess heat from PV/T modules can be utilized in various ways. One such method is storing the excess heat in a thermal energy storage (TES). Similar to the mathematical modeling of PV/T modules, both static or steady-state, and dynamic mathematical models are used to model the temperature distribution within TES [55,56,57,58,59,60,61,62,63,64,65,66,67,68,69].
Since multi-dimensional TES models require more computational time and resources, making them less suitable for use in various optimization approaches, recent research has increasingly focused on enhancing and optimizing existing one-dimensional dynamic TES models. Berkenkamp et al. [61] proposed a generic model predictive control algorithm for managing stratified TES using a one-dimensional dynamic model, providing a flexible framework for optimization-based operation. Building on the aim of reducing computational effort, Bird et al. [62] introduced a dynamic quasi-static approach that couples dynamic components of the TES without increasing the model order, thus maintaining low computational cost while preserving essential system dynamics. To address the limitations of standard multi-node modelling in reproducing the behavior of highly stratified tanks, De La Cruz et al. [63] developed a hybrid one-dimensional multi-node model with a non-linear hybrid continuous–discrete time formulation capable of capturing sudden temperature changes. Focusing on improving the physical representation of thermal mixing, Lago et al. [65] proposed a smooth and continuous one-dimensional TES model that incorporates buoyancy and mixing effects through a continuous formulation. A similar emphasis on mixing effects can be found in the work of Soares et al. [69], who developed a novel TES model that enables efficient temperature estimation while accounting for buoyancy-driven flows. Finally, Saloux et al. [68] further advanced one-dimensional TES modelling by introducing an improved flow distribution strategy at the tank inlet, resulting in better prediction accuracy compared to traditional approaches.
Generally, the response of TES can be calculated using multi-dimensional partial differential equations that describe energy, momentum, and mass ratios, as well as equations that describe geometry and heat transfer. Certain authors [70,71] have used this approach in their research to calculate two- or three-dimensional numerical modeling (CFD) of TES dynamics. These models are highly suitable for analyzing specific problems but are computationally demanding, time-consuming, and impractical for real-time system operation modeling. For this purpose, dynamic mathematical models in one-dimensional space, based on ordinary differential equations, are used while maintaining high accuracy.
Now that the importance of the proposed methodology has been presented, it makes sense to raise the following research question: Can the proposed mathematical model accurately calculate the temperature distribution and output power of the PV/T system?
The answer to this research question is presented in the novel proposed methodology, which includes mathematical modeling and validation of the mathematical model with measurements (graphically illustrated in Figure 1).
The modeling and validation results presented in this paper are based on a comprehensive mathematical model of the entire PV/T system, which includes the electrical and thermal subsystems of the PV/T module as well as the TES. In contrast to existing papers, which typically focus on modeling and validating only individual components of the PV/T system, this paper addresses the PV/T system as a whole. The proposed mathematical model is structured as a one-dimensional dynamic model and was validated using year-long experimental data with a 5-min time interval. Emphasis was placed on varying weather conditions, categorized as sunny, cloudy, and overcast days. The validation relied on established quantitative error indicators, all of which confirm the high accuracy of the model across all subsystems.
The novelties of the proposed methodology, representing its added value beyond existing studies, are as follows:
  • comprehensive modelling of the entire PV/T system, including both the PV/T module and the TES,
  • accurate consideration of optical losses in the PV/T module,
  • long-term experimental validation over the full course of a year,
  • validation using high-resolution five-minute data,
  • performance assessment under different climatic conditions (sunny, cloudy, and overcast days),
  • use of six quantitative error indicators, ensuring robust confirmation of model accuracy.
This paper is organized into five sections. Section 2 presents the mathematical modelling of the PV/T system together with the validation approach. Section 3 reports the validation results of the proposed model using experimental measurements. Section 4 discusses the findings, and Section 5 concludes the paper.

2. Materials and Methods

Our study encompasses over 66 scientific papers published between 1996 and 2025, where various authors explore different approaches for modeling individual components of PV/T systems. This section provides a comprehensive overview of the data collection from the experimental PV/T system, the detailed mathematical modeling of the PV/T module and TES, and the quantitative indicators for experimental validation of the proposed mathematical model of the PV/T system.

2.1. Data Collection

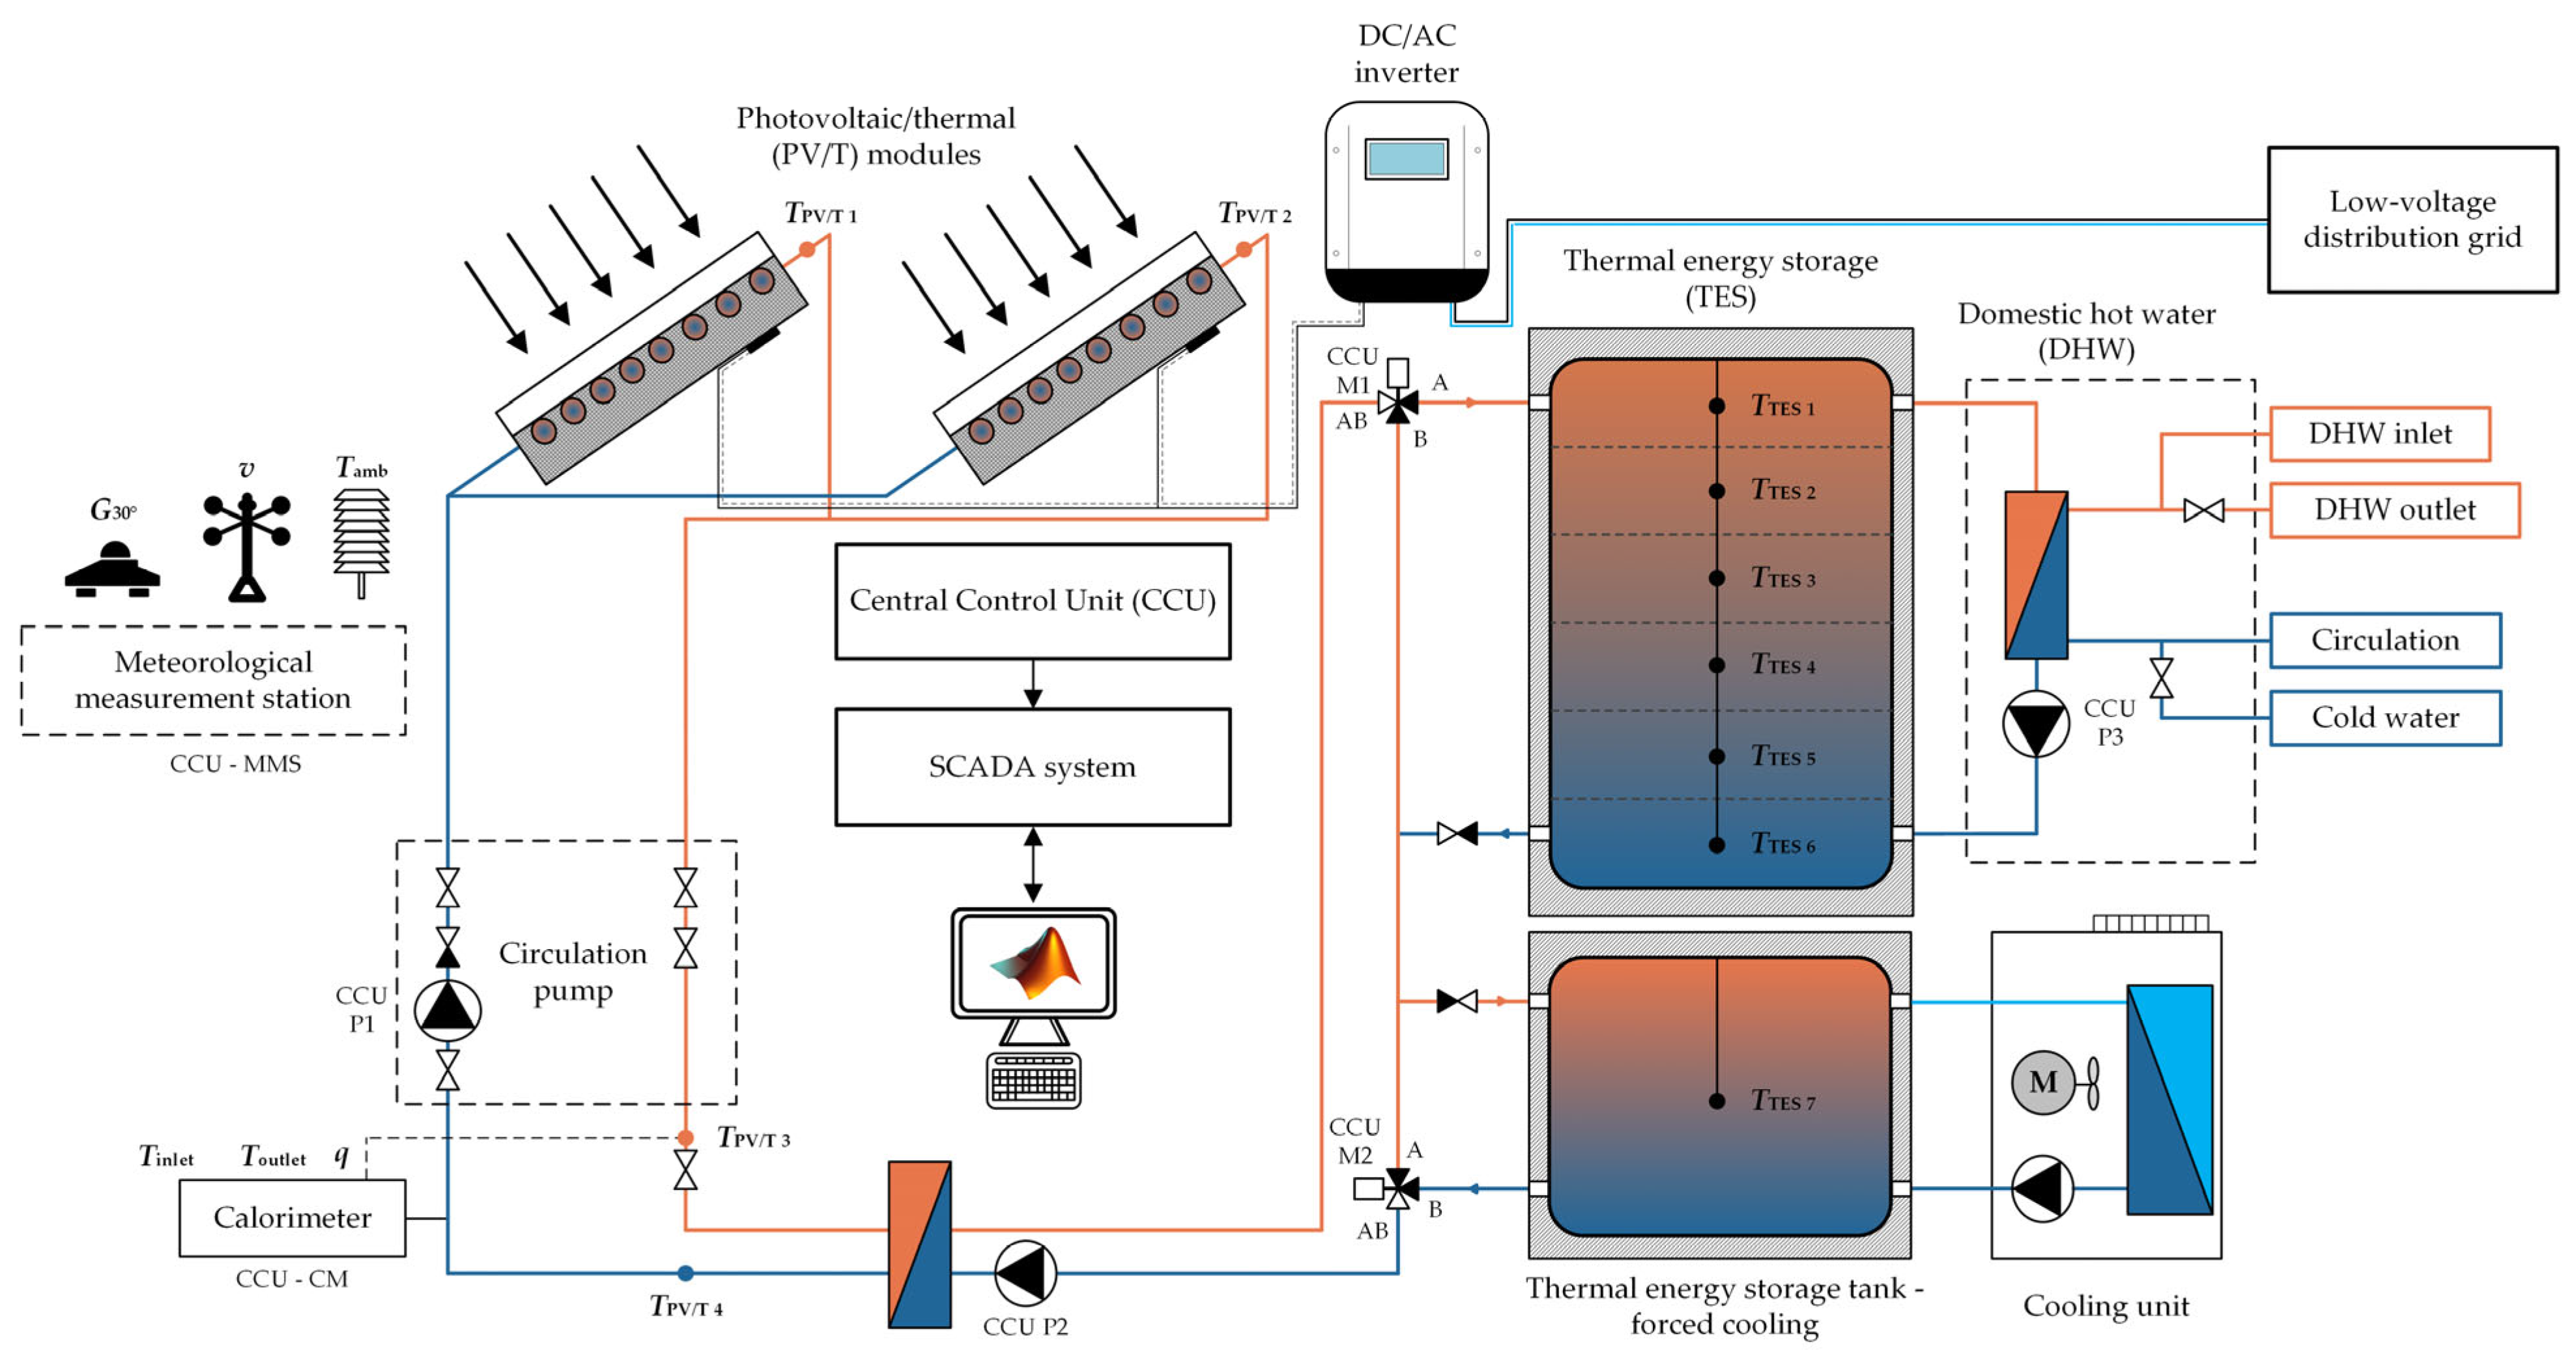
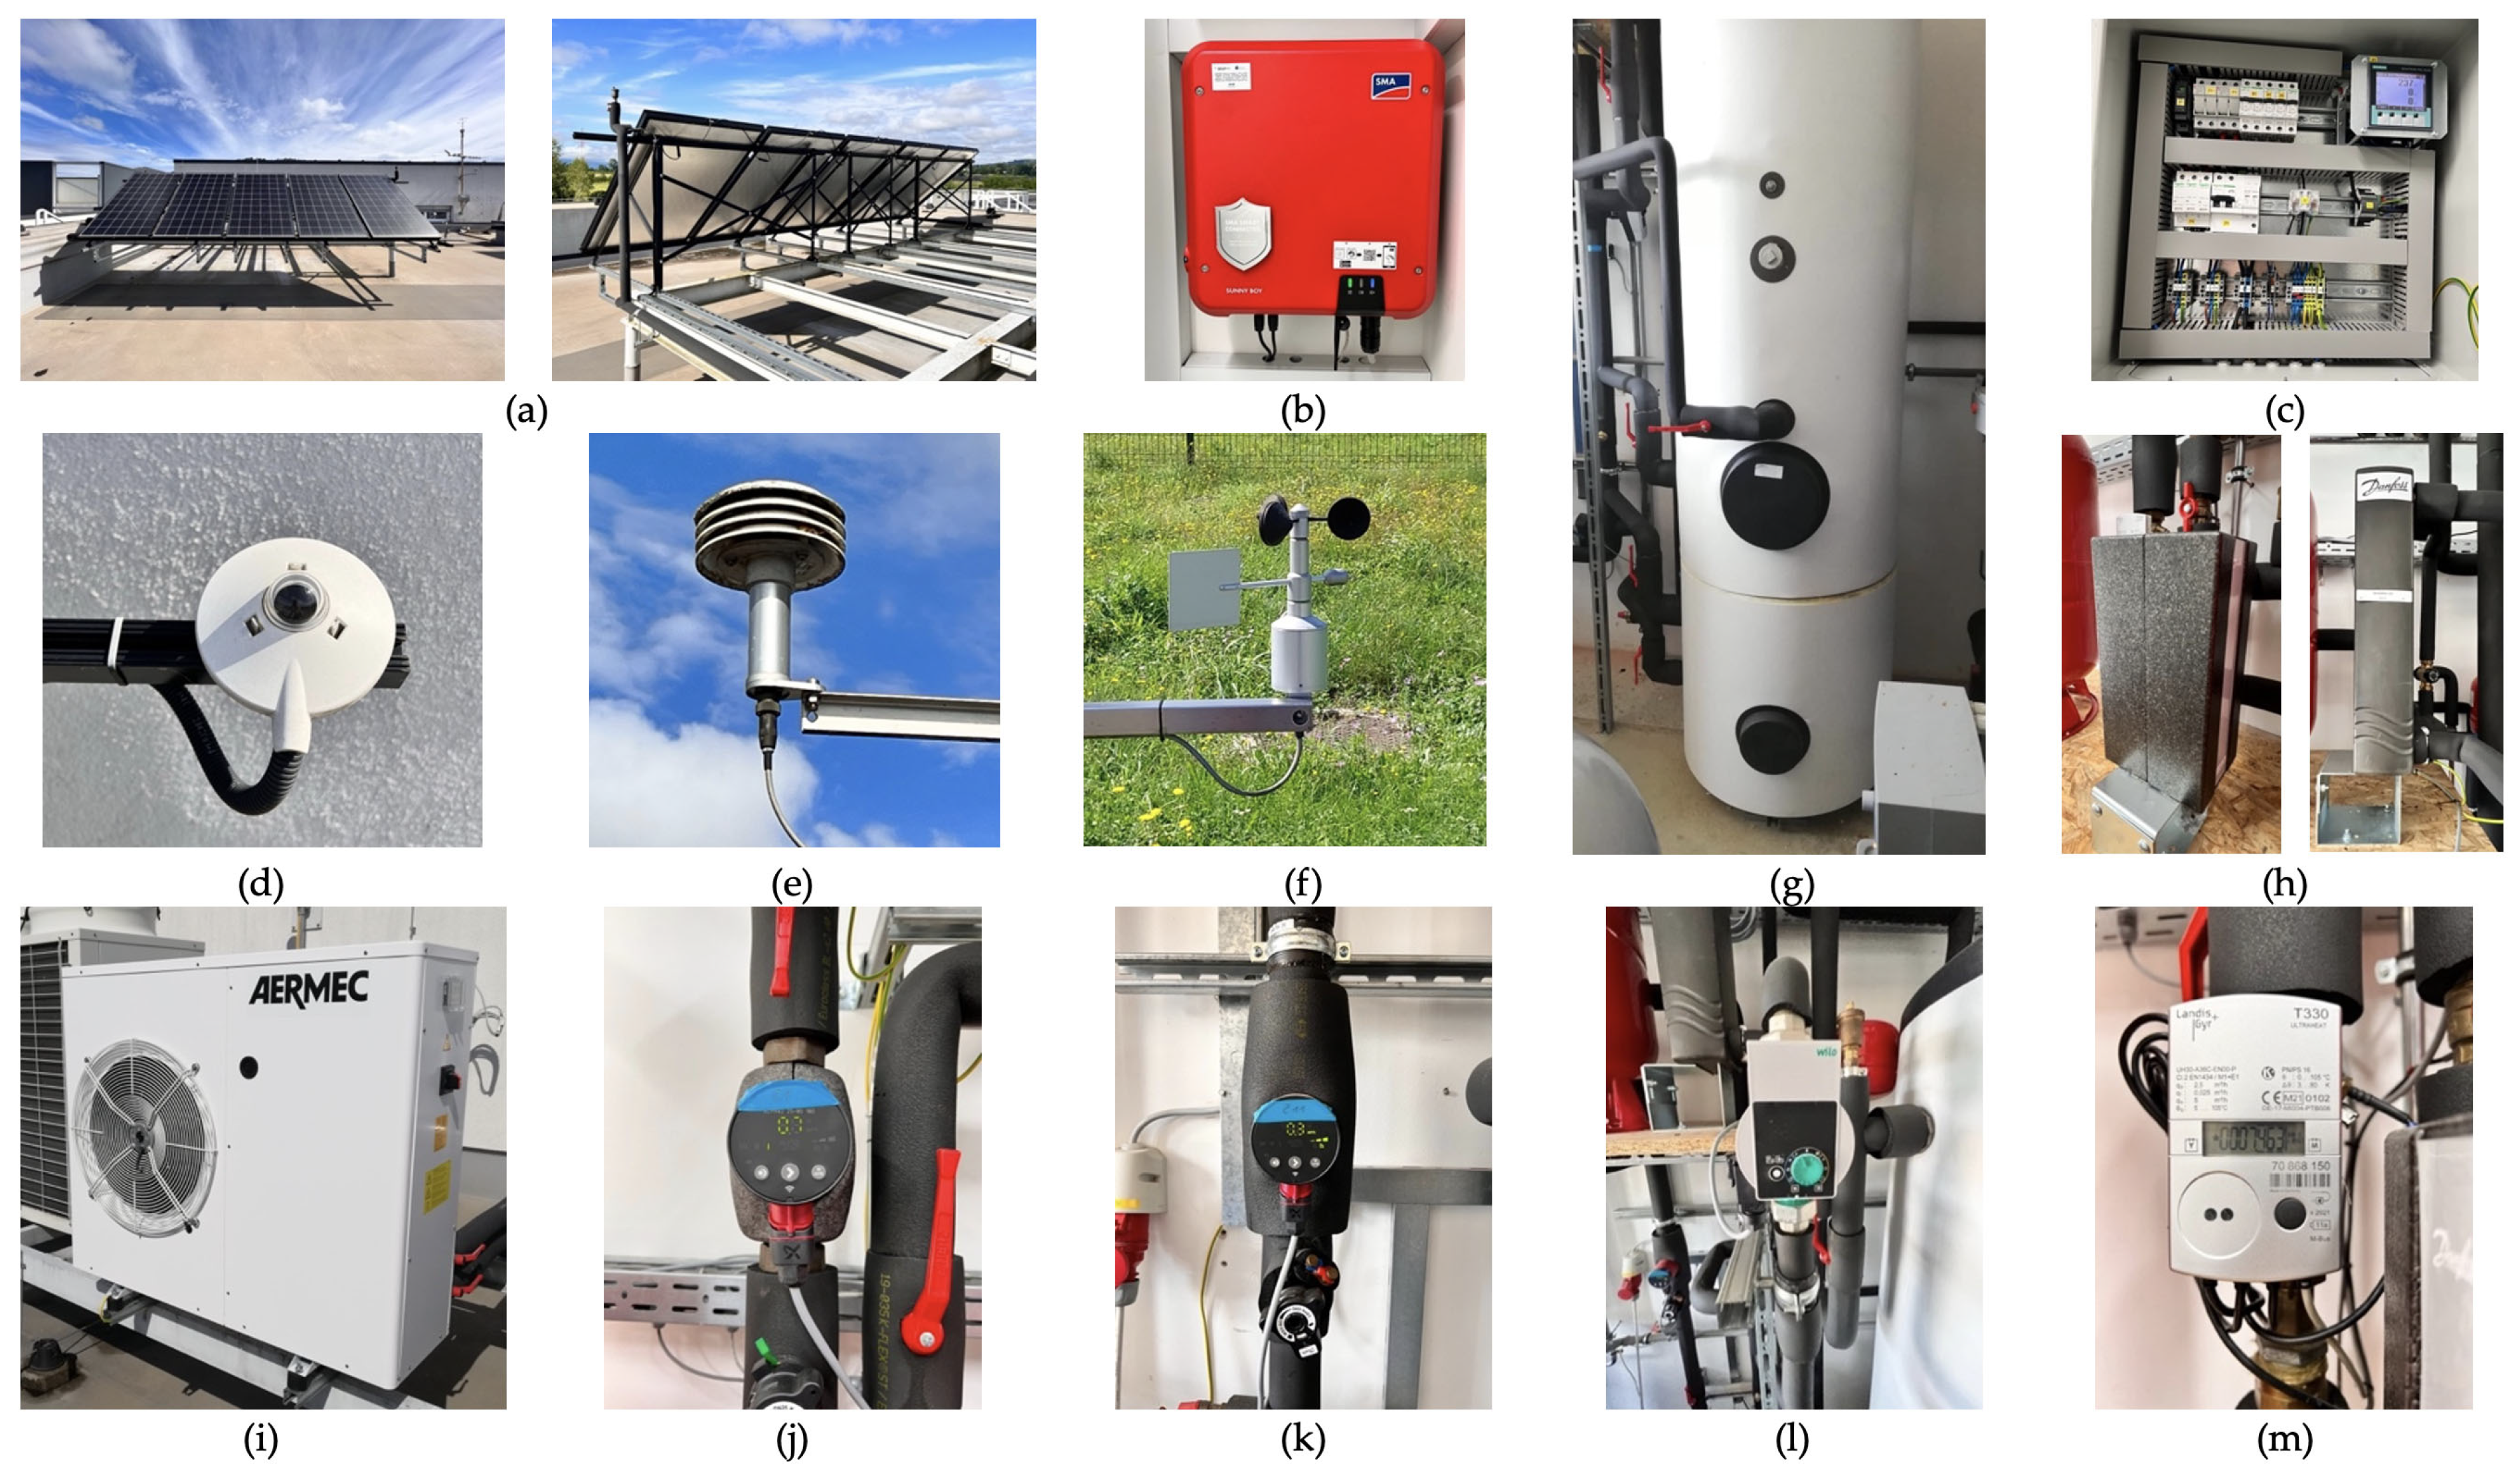
The experimental PV/T system used to validate the mathematical model of the PV/T system presented in this paper is installed at the Institute of Energy Technology, Faculty of Energy Technology, University of Maribor (latitude 45°56′ N, longitude 15°30′ E). The PV/T system consists of ten PV/T modules with a total installed electrical power of 3.3 kW and thermal power of 8.0 kW. In addition, the system is supplemented by two heat exchangers, TES, a cooling unit, three circulation pumps, valves, expansion vessels, an inverter, sensor technology, and a SCADA system. The primary pipeline connects the PV/T modules with the first heat exchanger, while the secondary pipeline extends from the first heat exchanger to the TES. The working fluid or a glycol-water mixture (65–35%) flows through the pipes up to the second heat exchanger, located on the secondary side of the TES. Temperature sensors are installed at various heights within the TES to measure the internal temperature. The temperature data is used to validate the mathematical model and monitor temperature, which is permitted to reach up to 75 °C within the TES. If the temperature within the TES rises above this value, or if there is insufficient heat energy withdrawal, an additional cooling unit is activated via a valve to reduce the temperature or to manage the heat energy withdrawal. From the second heat exchanger onward, water flows through the pipes, which can then be directed to a low-temperature heating system for further heating (e.g., a water-to-water heat pump). The working mechanism of the experimental PV/T system is divided into three modes: daily mode, heat consumption mode, and night mode. In the daily mode, if the temperature of the working fluid at the outlet of the PV/T modules is higher than the temperature inside the TES (TPV/T 1 or TPV/T 2 > TTES 1), the three-way valves M1-A and M2-A open, and circulation pumps P1 and P2 are switched on. This allows the accumulation of thermal energy inside the TES. On the other hand, if the temperature of the working fluid at the inlet of the PV/T modules is greater than or equal to 75 °C (TPV/T 4 ≥ 75 °C), the three-way valves M1-B and M2-A+B open. If the temperature further exceeds 90 °C, circulation pump P1 is switched off. In the heat consumption mode, the inlet of the domestic hot water (DHW) system opens if the temperature of the working fluid inside the TES (TTES 1) is higher than 75 °C. Alternatively, if the temperature of the working fluid at the outlet of the PV/T modules (TPV/T 1 or TPV/T 2) is higher than 80 °C, the TES forced cooling unit is switched on. In the night mode, if the temperature of the working fluid at the outlet of the PV/T modules (TPV/T 1 or TPV/T 2) is lower than the temperature inside the TES, the three-way valves M1-A and M2-A open, and circulation pumps P1 and P2 are switched on. This allows the remaining heat of the working fluid inside the TES to be released, preparing the cooled working fluid for the following day. Figure 2 shows a schematic presentation of the experimental PV/T system, while Figure 3 shows the main components of the experimental PV/T system.
Several details about main components of the experimental PV/T system are presented in Table 1.
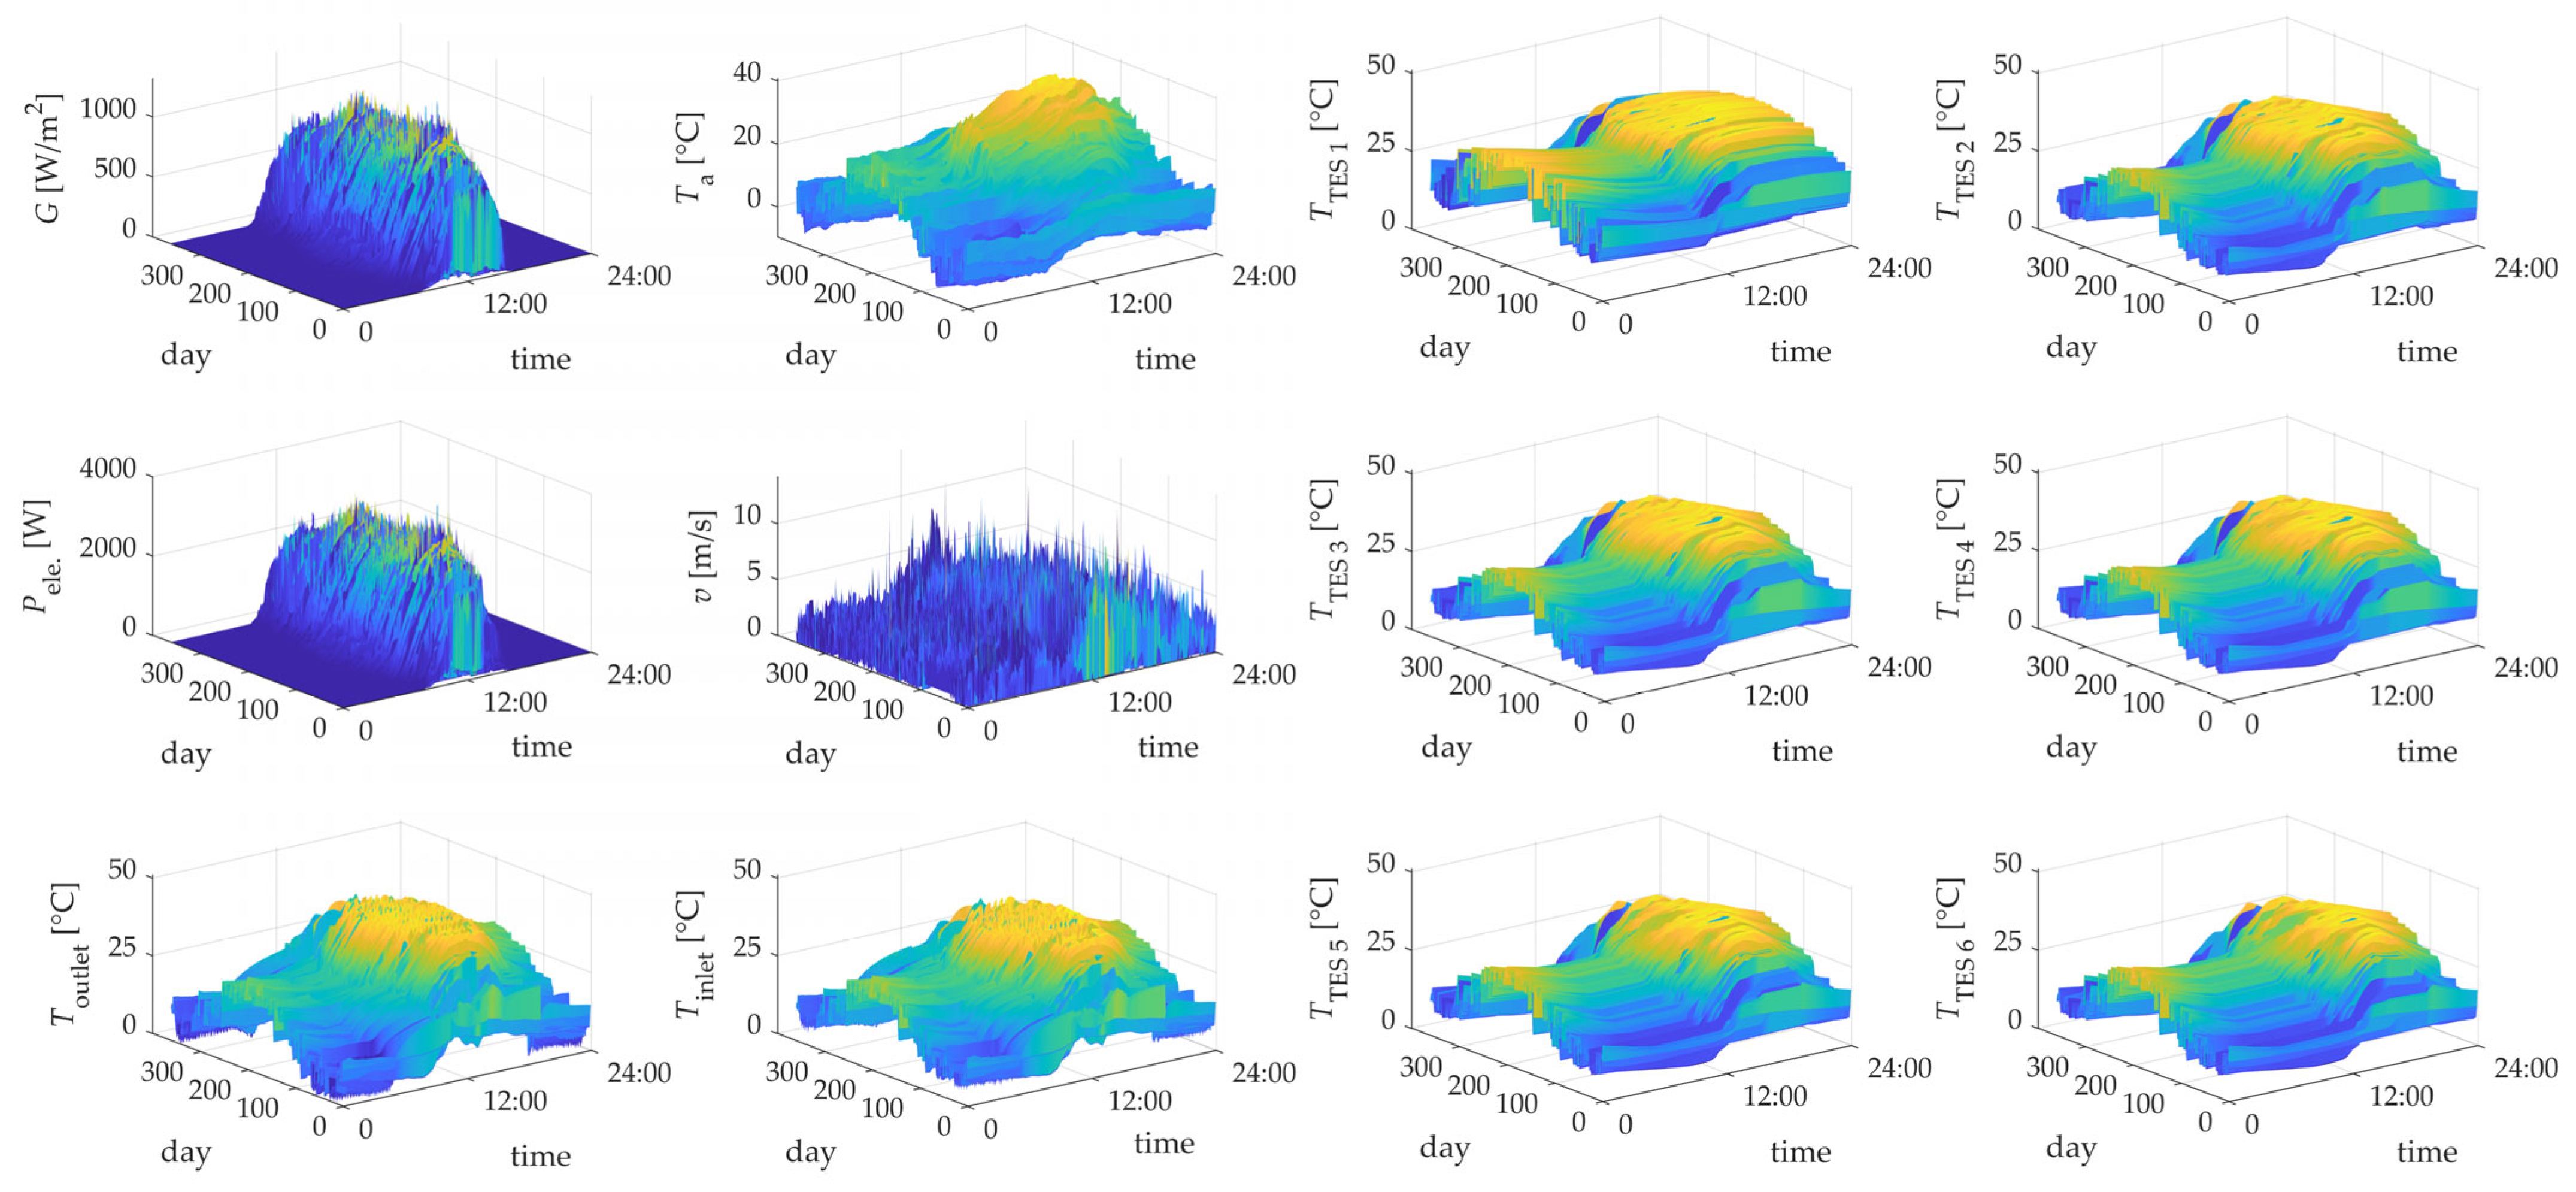
The measurements provided by the pyranometer, atmospheric temperature sensor and anemometer are used as input parameters to the mathematical model of the PV/T system, while the calorimeter and temperature sensors inside TES are used for validating the results of the mathematical model. The measurements for all the abovementioned meteorological, electrical, and thermal quantities are taken at a five-minute time interval over one year, presented in Figure 4.
Currently, the heat energy extraction mechanism for the experimental PV/T system has not been implemented. Consequently, the thermal energy stored within the TES is cooled down at the end of the day. At 8:00 p.m., circulation pumps P1 and P2 are activated to circulate the working fluid through the pipes, allowing it to be cooled through convection with the surrounding air. If this process was not carried out, the temperature of the PV/T modules in the early morning, when they are still cool, would be increased to the temperature of the working fluid, thus reducing the production of electrical energy. The measurements of the mass flow rate of the circulation pumps present an additional input parameter of the mathematical model of the PV/T system. This operational method is presented in Figure 5, where the mass flow values of the working fluid are shown.
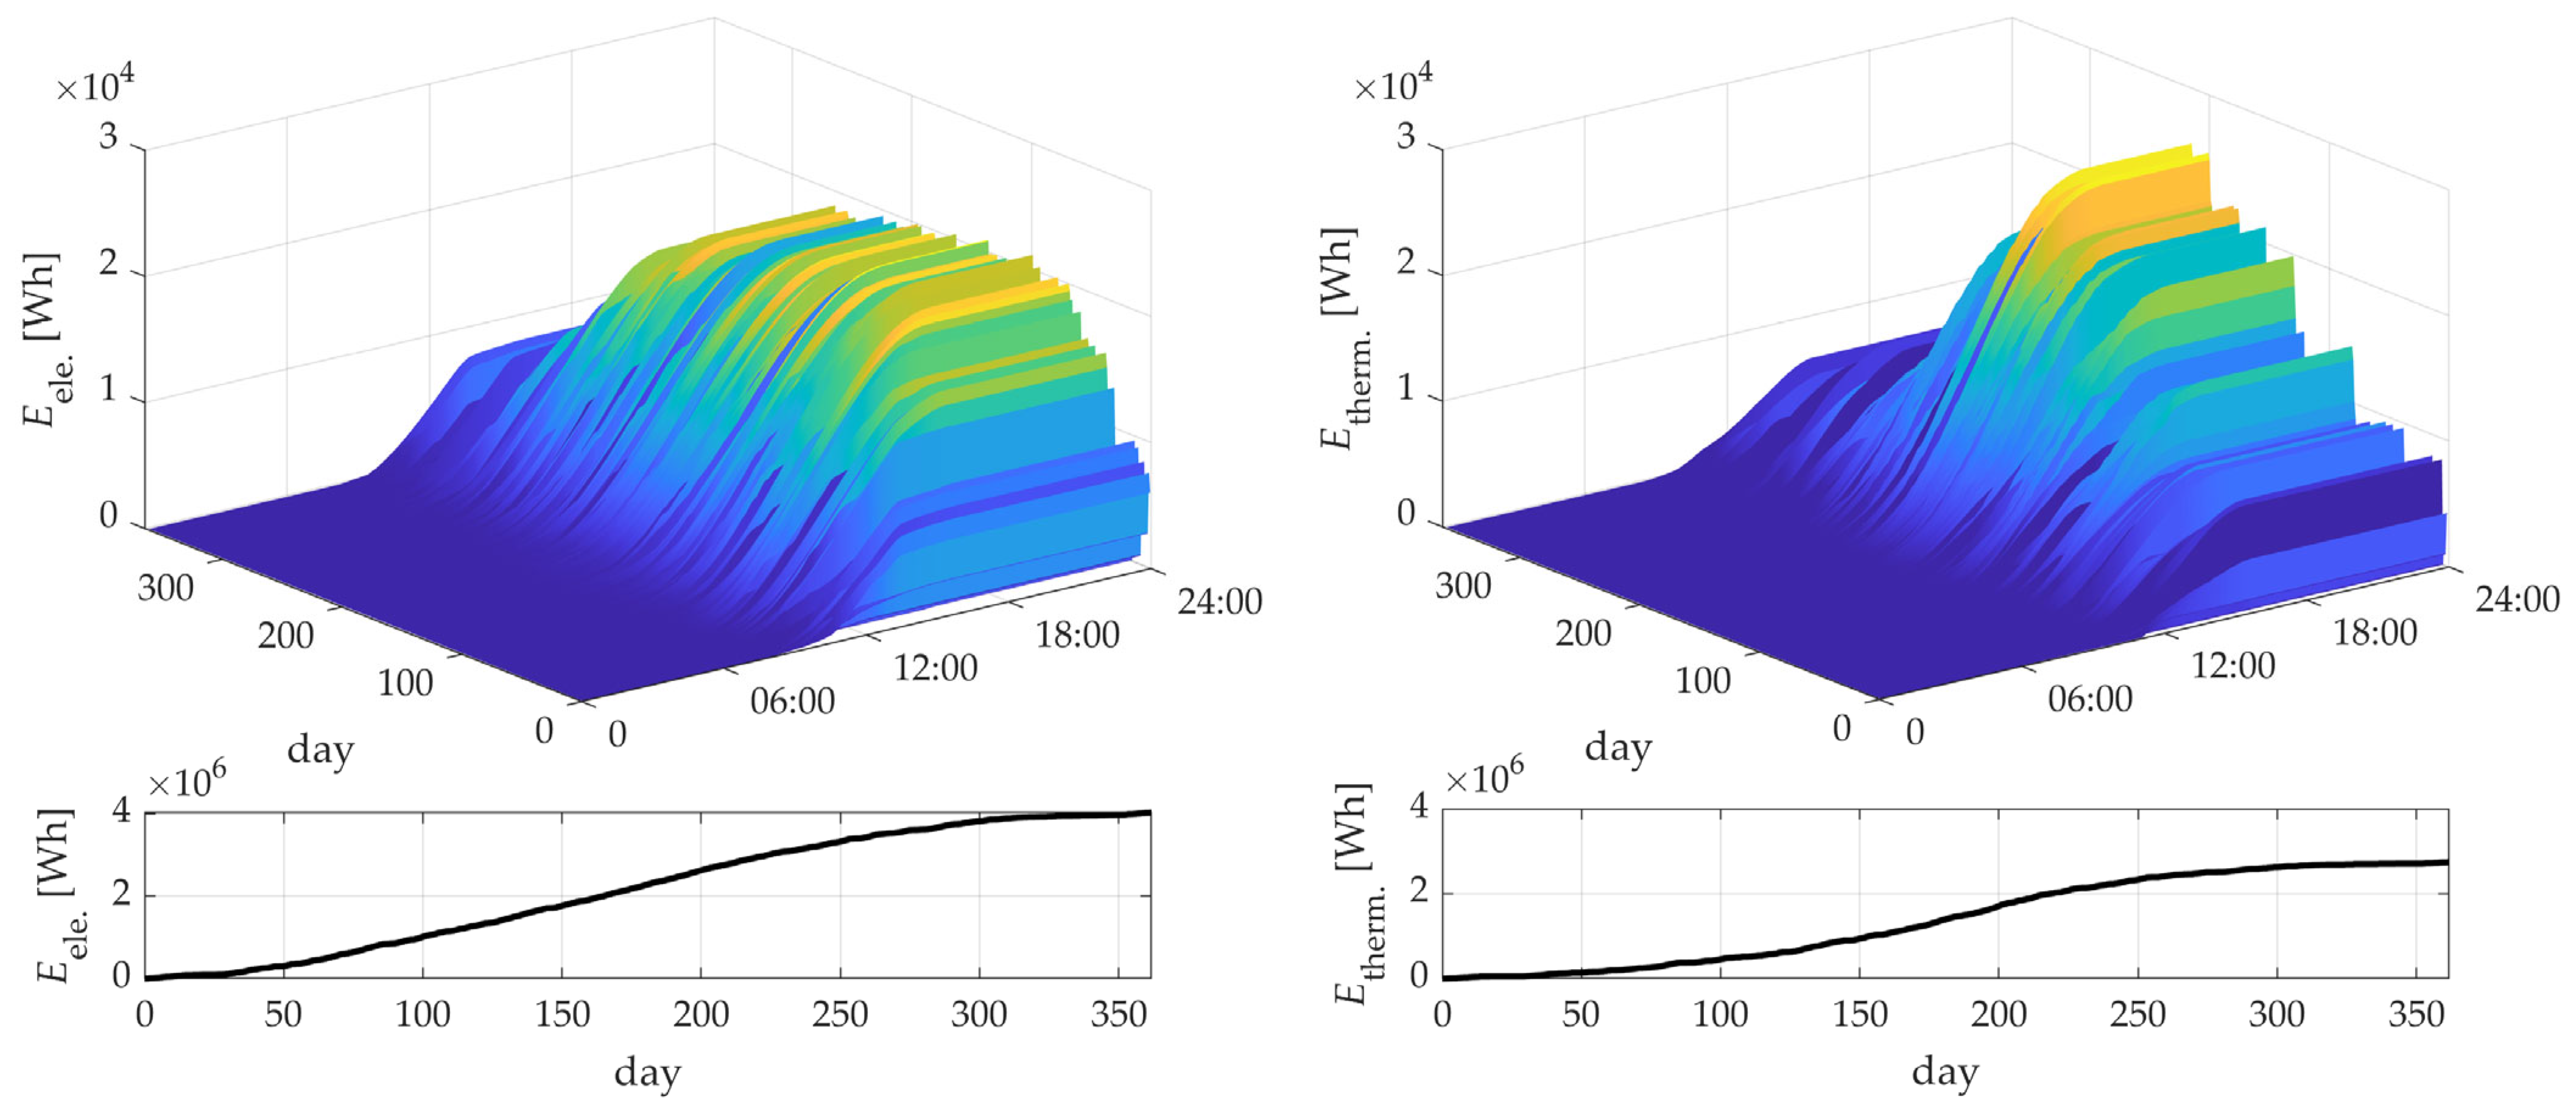
The experimental PV/T system produces 4.022 MWh of electrical energy and 2.744 MWh of thermal energy annually. Figure 6 shows the cumulative daily and annual electrical and thermal energy production of the PV/T system.

2.2. Mathematical Modeling of the Photovoltaic/Thermal Module

The mathematical model of the PV/T module is divided into the electrical and thermal subsystems of the PV/T module. The electrical subsystem is presented using the equivalent circuit of the double diode model of the solar cell, while the thermal subsystem is presented by a one-dimensional dynamic model (ordinary differential equations for temperature distribution—energy balance equations within each layer of the PV/T module). A mathematical model of the PV/T module was created in the MATLAB Simulink R2024b using s-function and Matlab-function blocks.

2.2.1. Electrical Subsystem of the Photovoltaic/Thermal Module

Electrical models of solar cells can be found in various papers [25,26] as simple empirical correlations between electrical power Pele., the power density of solar radiation G, and solar cell temperature T, or as equivalent electrical circuits of single-diode or double-diode models of solar cells [27,28,29,30,31,38,48] using the MPPT algorithm. In this paper, the mathematical model for the electrical subsystem of the PV/T module utilizes an equivalent circuit of the double-diode model of a solar cell, described by two diodes and two resistances. This model also incorporates the dependencies of specific electrical parameters (such as ISC, VOC, Rs, and Rsh) on the power density of solar radiation G and the solar cell temperature [51]. The mathematical model of the electrical subsystem of the PV/T module, presented as an equivalent electrical circuit of the double-diode model of a solar cell, is expressed in (1):
I = I p h I 01 · e x p V + I · R s n 1 · T · K q · N s 1 I 02 · e x p V + I · R s n 2 · T · K q · N s 1 V + I · R s R s h
where Ns is the number of series-connected solar cells, q is the charge of an electron (q = 1.602 × 10⁻¹⁹ As), T is the temperature of the solar cell, K is the Boltzmann constant (K = 1.38 × 10⁻²³ J/K), n1 and n2 are the ideality factors of the first and second diodes, Iph is the photocurrent, I01 and I02 are the reverse saturation currents of the first and second diodes, and (n1 × K × T) and (n2 × K × T) represent the thermal voltage of the first and second diodes. The photocurrent Iph, resulting from light absorption, is expressed in (2):
I p h = I S C + α P V T T S T C · G G S T C
where ISC is the short-circuit current, αPV is the temperature coefficient of the short-circuit current, G is the power density of solar radiation, and TSTC and GSTC are the temperature of the solar cell and solar irradiance density under standard test conditions. The reverse saturation currents of the first diode I01 and the second diode I02 are expressed in (3) and (4):
I 01 = I S C e x p V O C · q T · K · N s · n 1 1 · T T S T C 3 · e x p q · E g 0 · 1 T S T C 1 T n 1 · K
I 02 = I S C e x p V O C · q T · K · N s · n 2 1 · T T S T C 3 · e x p q · E g 0 · 1 T S T C 1 T n 2 · K
where Eg0 is the bandgap energy of the semiconductor (1.21 eV for silicon at 300 K). As mentioned, ISC, VOC, Rs, and Rsh are determined as functions of the power density of solar radiation G and solar cell temperature T and are presented in [51].
The result of the equivalent circuit of the double-diode model of the solar cell is the I-V characteristic, which represents the current and voltage of the solar cell at a given power density of solar radiation G and solar cell temperature T.

2.2.2. Thermal Subsystem of the Photovoltaic/Thermal Module

Designing the mathematical model for the thermal subsystem of a PV/T module is complex, requiring consideration of heat transfer, electricity generation, and the optical properties of surfaces exposed to solar radiation. The optical properties determine how much solar radiation is absorbed, reflected, or penetrates active PV/T layers. For PV/T or PV modules, most solar rays should be absorbed in the solar cell layer to maximize electrical energy conversion. Anti-reflection coatings are used to enhance solar cell efficiency, but they do not affect the proportion of absorbed solar radiation that becomes electrical versus thermal energy or heat losses in other layers. To calculate a material’s optical properties in the PV/T module, the solar incidence angle on the surface must be determined based on geometric properties between the Sun and the surface. This angle depends on latitude, declination, tilt, azimuth, and hour angles. The declination angle for any day of the year δ(n) is given by (5) [72]:
δ n = 23.45 · s i n 360 365 · 284 n
where n represents the day of the year. For the time-dependent calculations in this paper, solar time was used to relate to the Sun’s position relative to the Earth. Local Solar Time (LST) is noon when the Sun reaches its highest point. All locations on the same meridian have noon simultaneously, while locations to the west or east experience noon slightly earlier or later. However, using LST daily is impractical, so time zones were introduced. Within a time zone, the time is the same everywhere. Time zones are based on Local Standard Time Meridians (LSTM), which change by 15° for each hour of time zone difference. This is shown in (6), where ΔtUTC represents the difference between Local Time (LT) and Universal Coordinated Time (UTC) [72]:
L S T M = 15 ° · Δ t U T C
Based on the prime meridian, also known as the Greenwich meridian, ΔtUTC is calculated based on the number of meridians to the west or east. Slovenia is geographically located on the local standard meridian at 15° east. This means Slovenia is in a time zone where one hour is added to the base time zone, so ΔtUTC = 1. For more precise calculations based on solar time, it is essential to consider the time correction in minutes, known as the Equation of Time (EoT), which is given by (7) [72]:
E o T n = 9.87 · sin 2 · 360 365 · n 81 7.53 · cos 360 365 · n 81 1.5 · sin 360 365 · n 81
Local Solar Time (LST), which is crucial for calculating the hour angle, is expressed using LT and by considering EoT and LSTM as shown in (8) [72]:
L S T t , n = L T t , n + 4 · l L S T M + E o T 60
where l represents the longitude. The hour angle ω(t) represents LST expressed in angular degrees, reflecting the Sun’s movement across the sky, and is given by (9) [72]:
ω t = 15 ° · L S T t , n 12
Based on the hour angle ω(t), the next step involves calculating the solar altitude angle αs(t) and the angle of incidence of solar rays i(t), which are given by (10) and (11) [72]:
sin α s t , n = sin L · sin δ + cos L · cos δ · cos ω t
i t , n = c o s 1 sin L · sin δ · cos β   cos L · sin δ · sin β · cos γ   + cos L · cos δ · cos β · cos ω t   + sin L · cos δ · cos γ · sin β · cos ω t   + cos δ · sin β · sin γ · sin ω t
where β and γ represent the tilt and azimuth angles of the PV/T module, respectively. Figure 7 shows the solar altitude angle αs(t) and the angle of incidence of solar rays i(t) as functions of the sequential day of the year and the time of day.
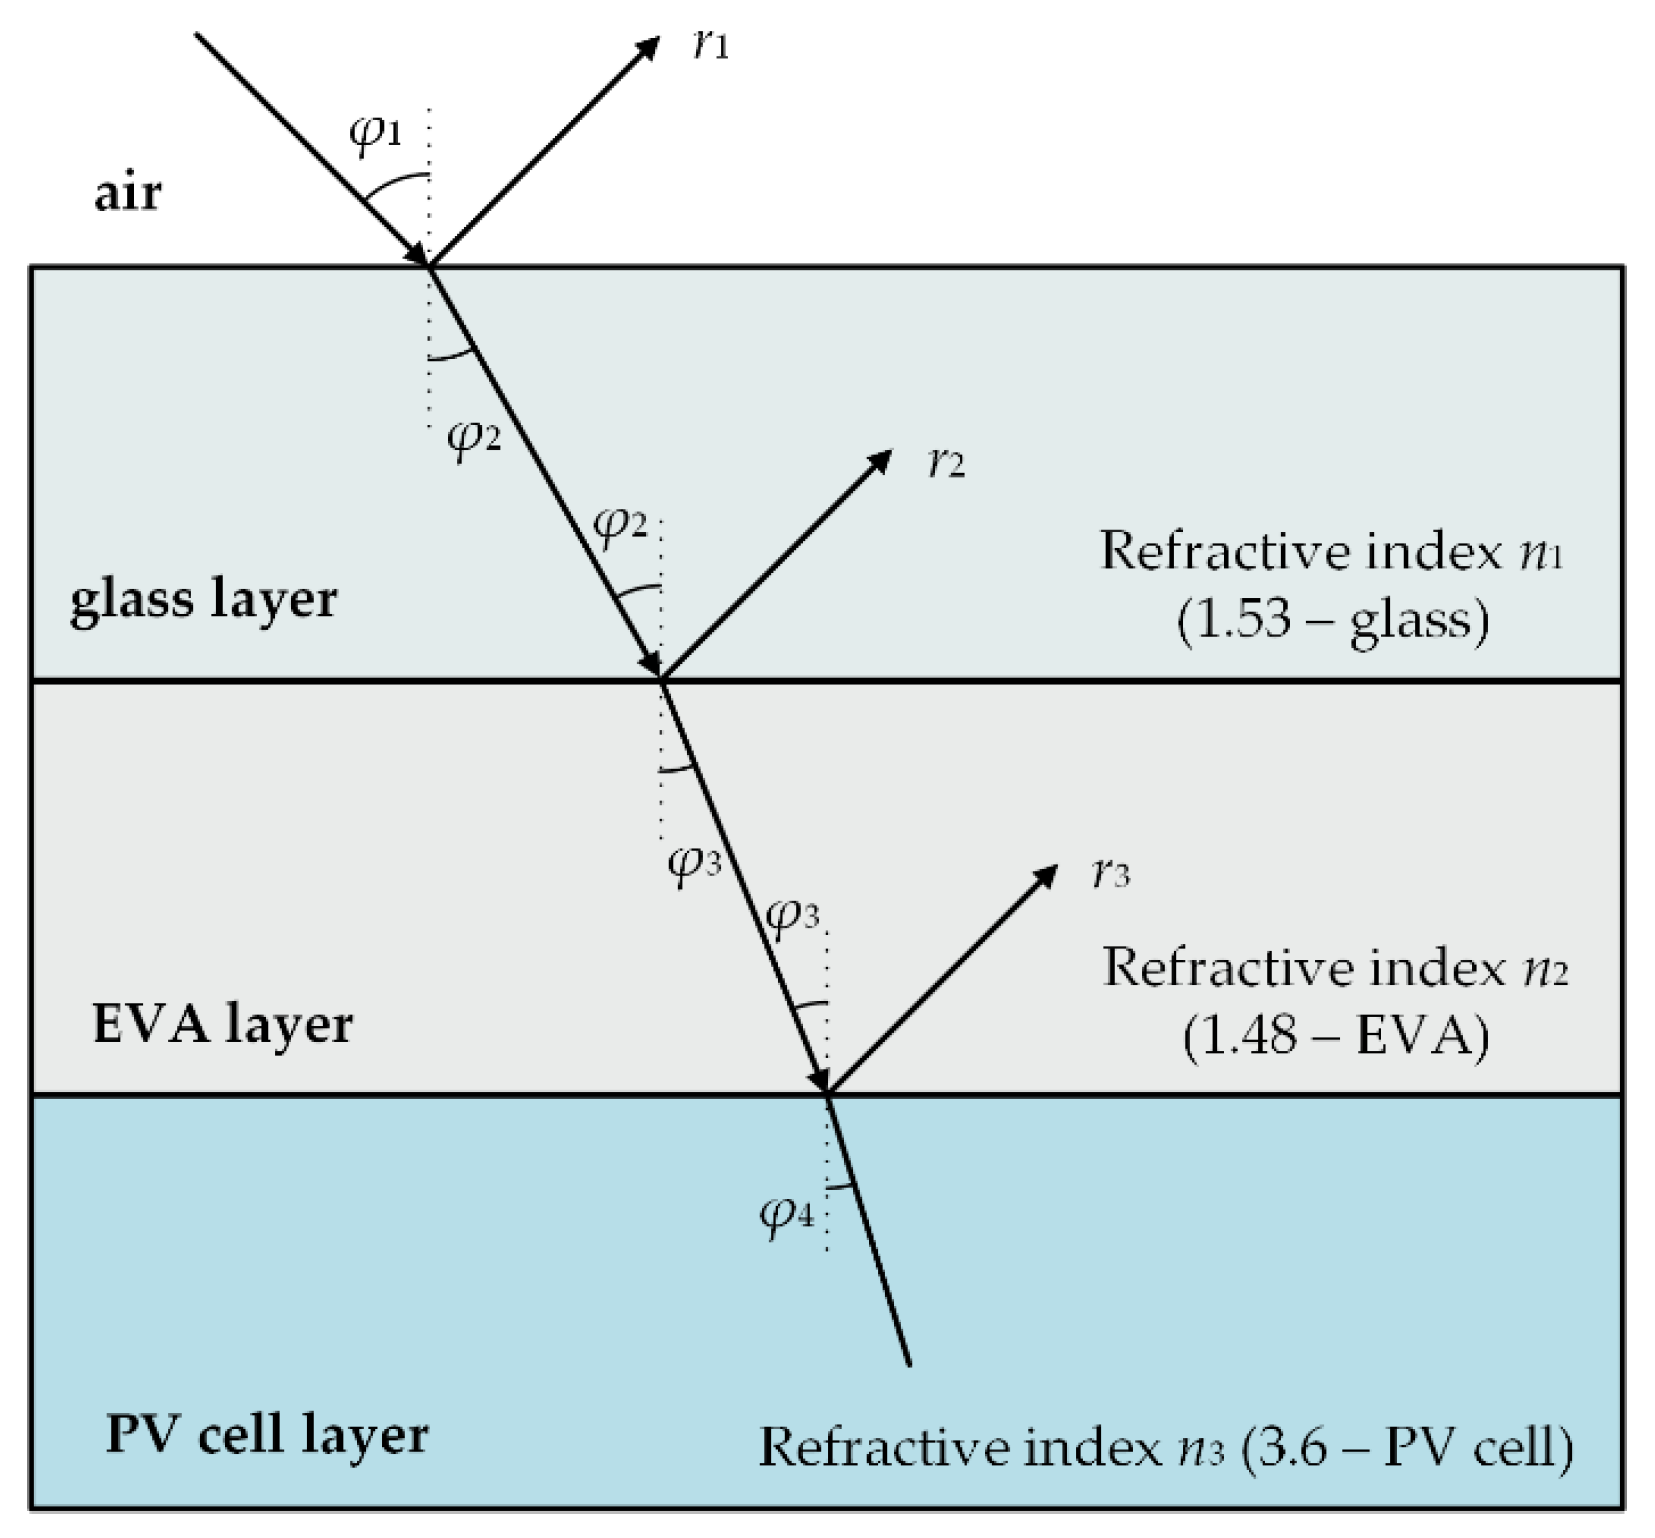
The angle of incidence of solar radiation i was determined, allowing the optical properties of the PV/T module layers directly exposed to solar radiation to be established. The angle of incidence i (hereafter φ1) describes the angle at which the PV/T module is illuminated by solar radiation. The path of solar rays through the layers of the PV/T module is graphically illustrated in Figure 8.
The optical properties of materials, particularly in the context of PV/T and PV modules, as well as solar collectors, play a crucial role in determining the efficiency and performance of the system. These properties determine the absorption, reflection, and transmission of solar radiation through various materials. Initially, the focus was on describing Fresnel’s equations, which detail the reflection and transmission of light at the interface of two dielectric media, depending on the polarization of light and the angle of incidence. Fresnel’s equations are divided into two types: equations for parallel polarization and equations for perpendicular polarization, which are expressed in (12) and (13) [73]:
r 1 p = n g 2 · cos φ 1 n g 2 sin φ 1 2 2 n g 2 · cos φ 1 + n g 2 sin φ 1 2
r 1 s = cos φ 1 n g 2 sin φ 1 2 cos φ 1 + n g 2 sin φ 1 2
where ng is the refractive index for glass, φ1 is the angle of incidence, r1p is the parallel polarization, and r1s is the perpendicular polarization of light. These polarizations describe how light behaves at an interface. When light strikes a surface, some is reflected, and some is refracted. The total reflectance r1 for unpolarized light is the average of r1p and r1s and is represented by (14):
r 1 = 1 2 r 1 p + r 1 s
The angle of refraction φ2, when light passes from one medium to another, can be determined using Snell’s law (15):
φ 2 = s i n 1 sin φ 1 n g
where φ1 is the angle of incidence of solar radiation and ng is the refractive index of glass. The inverse value of the refractive index ngz is needed to calculate the transition of light from glass back into air (16). The refractive index ngz is crucial for calculating the reflection and transmission of light at the second interface of the glass:
n g z = 1 n g
To calculate the reflection and transmission at the second interface, Fresnel’s equations can again be used for parallel polarization r2p and perpendicular polarization r2s, which are expressed in (17) and (18):
r 2 p = n g z 2 · cos φ 2 n g z 2 sin φ 2 2 2 n g z 2 · cos φ 2 + n g z 2 sin φ 2 2
r 2 s = cos φ 2 n g z 2 sin φ 2 2 cos φ 2 + n g z 2 sin φ 2 2
where ngz is the refractive index between glass and air, φ2 is the angle of refraction, r2p is the parallel polarization, and r2s is the perpendicular polarization of light. By combining the values of r2p and r2s, the total reflectance r2 for unpolarized light or light with combined polarization can be obtained. The total reflectance r2 is the average of r2p and r2s and is represented by (19):
r 2 = 1 2 r 2 p + r 2 s
The determination of the proportion of light transmittance without absorption τg can be described by (20):
τ g = e x p K i · d g cos φ 2
where Ki is the absorption coefficient of glass and dg is the glass thickness. The greater the thickness dg and the absorption coefficient Ki, the more light is absorbed in the glass layer. Light entering the glass can travel back and forth between the air and glass interfaces. Each time it reaches an interface, some light is reflected back, resulting in multiple reflections before fully absorbing or transmitting. This phenomenon of multiple reflections ρo,g and transmissions τo,g is described by (21) and (22):
τ o , g = 1 r 1 · τ g · 1 r 2 1 r 1 · r 2 · τ g 2
ρ o , g = r 1 + 1 r 1 2 · τ g 2 · 1 r 2 2 1 r 1 · r 2 · τ g 2
Absorption αo,g is then calculated by subtracting the total reflection ρo,g and transmission τo,g from 1, as shown in (23):
α o , g = 1 τ o , g ρ o , g
Figure 9 shows all three coefficients of optical properties (reflection, transmission, and absorption) as functions of the sequential day of the year and the time of day.
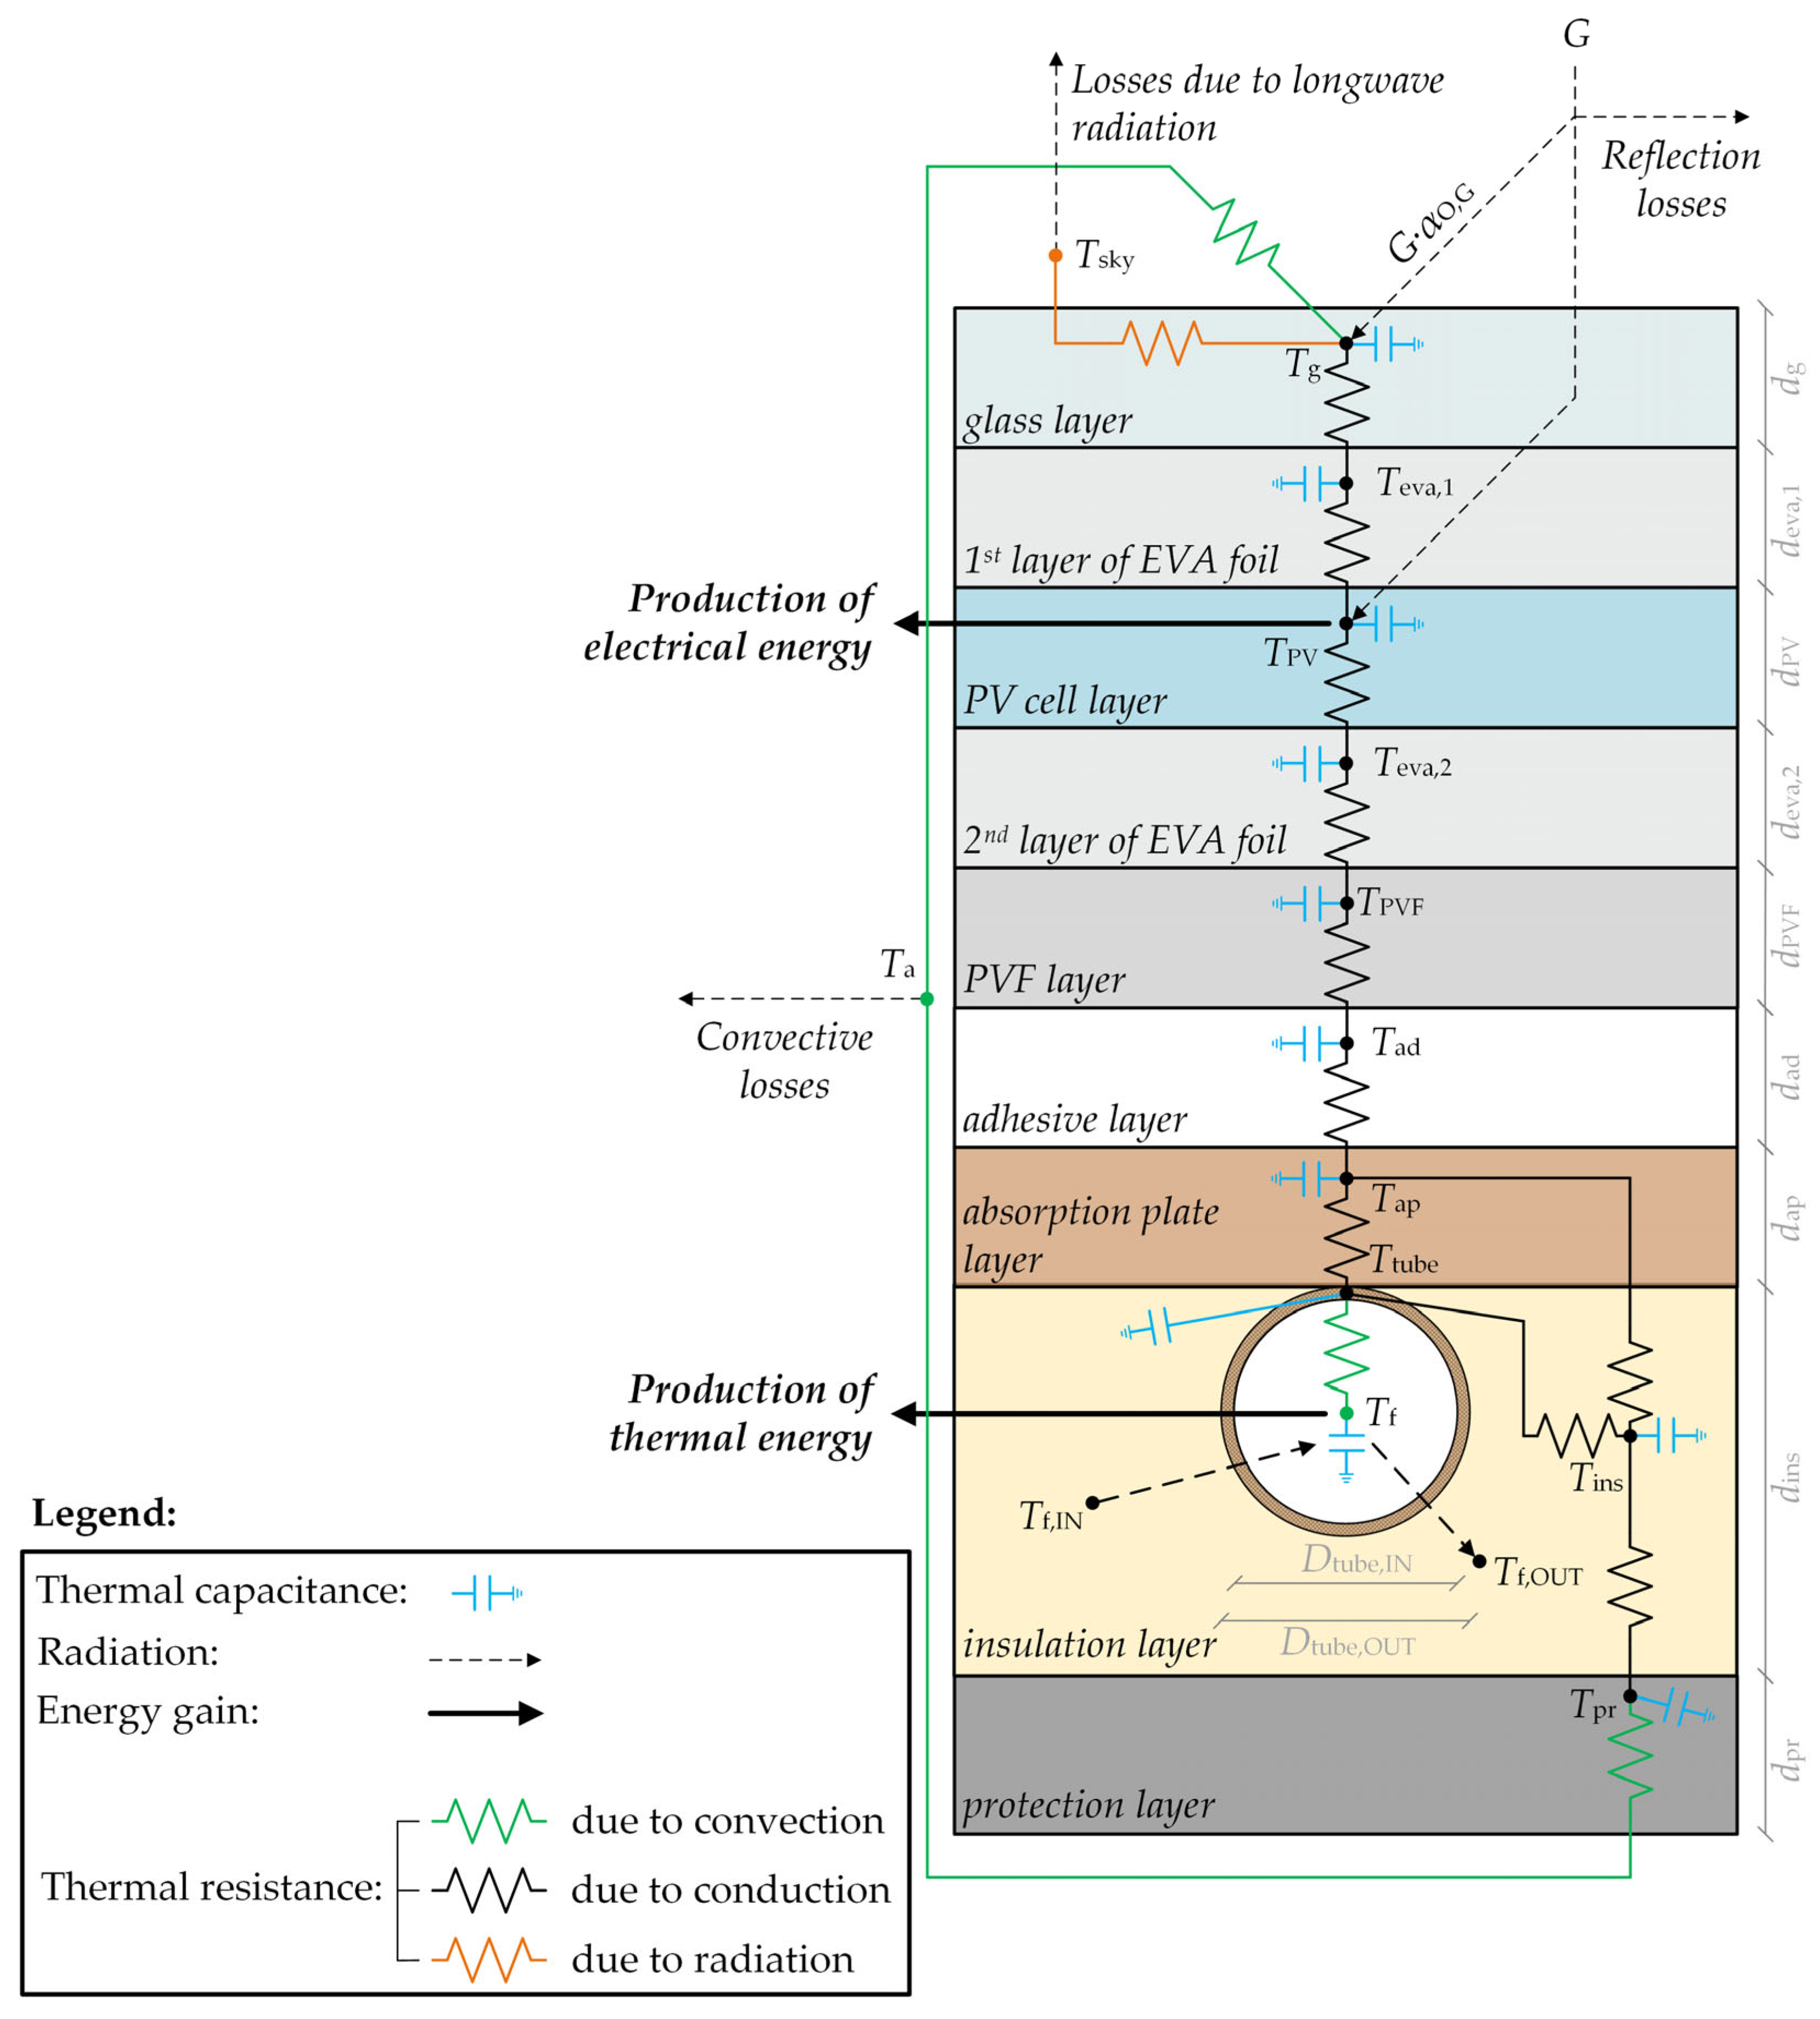
After calculating the optical properties, the mathematical model of the thermal subsystem of the PV/T module can be expressed using three heat transfer mechanisms (conduction, convection, and radiation). For easier understanding, Figure 10 shows a schematic of the thermal network for the PV/T module.
The glass layer of the PV/T module is subject to both incoming and outgoing heat flows. The incoming flow includes absorbed solar radiation and multiple reflections between the glass and solar cell layer, while the outgoing flow comprises conduction through the EVA layer, convection with air, and radiation to the sky and ground. Assuming time-dependent optical properties of glass due to the solar incidence angle and treating the sky as a transparent body, the glass layer temperature Tg is given by (24):
ρ · d · A · C p g · d T g d t = α o , g · 1 + τ o , g · ρ o , P V ρ o , g · ρ o , P V · G · A g T g T E V A , 1 1 2 d g k g + d E V A , 1 k E V A , 1 · A g h g a i r · T g T a i r · A g ε g · σ · F g , s k y · T g 4 T s k y 4 · A g ε g · σ · F g , g r o u n d · T g 4 T a i r 4 · A g σ · T g 4 T P V 4 1 ε g 1 ε P V 1 · A g
The expressions for the convective heat transfer coefficient between the glass layer and the ambient air hg-air, the sky temperature Tsky, and the view factors between the glass layer and the sky Fg,sky and the ground Fg,ground are used from [51].
Assuming the first EVA layer serves as an intermediate medium between the glass layer and the solar cell layer, the associated heat flows are defined by conduction from both adjacent layers. The temperature of the first EVA layer, TEVA,1 is expressed by (25):
ρ · d · A · C p E V A , 1 · d T E V A , 1 d t = T g T E V A , 1 1 2 d g k g + d E V A , 1 k E V A , 1 · A E V A , 1 T E V A , 1 T P V 1 2 d E V A , 1 k E V A , 1 + d P V k P V · A E V A , 1
Similar to the glass layer, the solar cell layer is also subject to both incoming and outgoing heat flows. The incoming flow includes absorbed solar radiation, multiple reflections between the glass and solar cell layer, heat conduction through the first EVA layer, and radiative heat transfer through the glass layer. The outgoing flow consists of heat conduction through the second EVA layer and the electrical power generated by the solar cells. The calculation of the electrical power output Pele. of the PV/T module is described in Section 2.2.1. Based on this, the temperature of the solar cell layer, TPV is defined by (26):
ρ · d · A · C p P V · d T P V d t = T E V A , 1 T P V 1 2 d E V A , 1 k E V A , 1 + d P V k P V · A P V T P V T E V A , 2 1 2 d P V k P V + d E V A , 2 k E V A , 2 · A P V + τ o , g · ρ o , P V 1 ρ o , g · ρ o , P V · G · A P V + σ · T g 4 T P V 4 1 ε g 1 ε P V 1 · A P V P e l e .
Given that the second EVA layer functions as an intermediate layer between the PVF (Tedlar) layer and the solar cell layer, the corresponding heat flows are defined by conduction from both the PVF and the solar cell layers. The temperature of the second EVA layer, TEVA,2 is defined by (27):
ρ · d · A · C p E V A , 2 · d T E V A , 2 d t = T P V T E V A , 2 1 2 d P V k P V + d E V A , 2 k E V A , 2 · A E V A , 2 T E V A , 2 T P V F 1 2 d E V A , 2 k E V A , 2 + d P V F k P V F · A E V A , 2
In contrast, the incoming and outgoing heat flows for the PVF (Tedlar) layer are defined by heat conduction from the second EVA layer and the thermal adhesive layer. The temperature of the PVF layer, TPVF is given by (28):
ρ · d · A · C p P V F · d T P V F d t = T E V A , 2 T P V F 1 2 d E V A , 2 k E V A , 2 + d P V F k P V F · A P V F T P V F T A D 1 2 d P V F k P V F + d A D k A D · A P V F
Subsequently, the incoming and outgoing heat flows for the thermal adhesive layer are defined by heat conduction from the PVF layer and the copper absorber plate. The temperature of the thermal adhesive layer, TLE is given by (29):
ρ · d · A · C p A D · d T A D d t = T P V F T A D 1 2 d P V F k P V F + d A D k A D · A A D T A D T A P 1 2 d A D k A D + d A P k A P · A A D
When defining the incoming and outgoing heat flows for the copper absorber layer, the geometry or cross-section of the PV/T module must also be considered. The incoming heat flow is determined by heat conduction through the thermal adhesive layer, while the outgoing heat flow is defined by heat conduction through the heat transfer medium. The temperature of the copper absorber layer, TAP is given by (30):
ρ · d · A · C p A P · d T A P d t = T A D T A P 1 2 d A D k A D + d A P k A P · A A P T A P T t u b e 1 2 d A P k A P + ln D t u b e , O U T D t u b e , I N 2 · π · k t u b e · A A P t u b e , O U T
The subsequent layer is the heat exchanger, where the incoming heat flow is defined by conduction through the copper absorber plate layer, while the outgoing heat flow is divided between conduction through the glass wool insulation layer and heat transfer to the working fluid. The temperature of the heat exchanger, Ttube is given by (31):
ρ · l · C p t u b e · π · D t u b e , O U T 2 D t u b e , I N 2 4 · d T t u b e d t = T A P T t u b e 1 2 d A P k A P + ln D t u b e , O U T D t u b e , I N 2 · π · k t u b e · A A P t u b e , O U T T t u b e T i n s 1 2 d i n s k i n s + ln D t u b e , O U T D t u b e , I N 2 · π · k t u b e · A i n s t u b e , O U T h f · T t u b e T f · A t u b e , I N
In the case of the working fluid, the incoming heat flow comprises both the advective heat flow of the inflowing working fluid and the convective heat transfer from the heat exchanger. The outgoing heat flow corresponds to the advective heat flow of the outflowing working fluid. The temperature of the working fluid, Tf is given by (32):
ρ · C p f · π · D t u b e , I N 2 · l t u b e · d T f d t = h f · T f T t u b e · A t u b e , I N m ˙ f · C p , f · T f , O U T T f , I N
The heat transfer coefficient of the working fluid, hf depends on the flow regime, whether laminar or turbulent. In the case of natural or forced circulation, hf is determined accordingly, while during nighttime operation or when the circulation pump is inactive, the heat transfer between the working fluid and the heat exchanger occurs through conduction.
The temperature within the PV/T module is considered uniform across the transverse direction. This assumption holds well for thin layers or those with high thermal conductivity. However, in the case of thicker layers or materials with low thermal conductivity, it may result in reduced accuracy. To improve the precision, the layer can be divided into several sub-layers. The temperature of the glass wool insulation layer, Tins is given by (33):
ρ · d · A · C p i n s · d T i n s d t = T t u b e T i n s 1 2 d i n s k i n s + ln D t u b e , O U T D t u b e , I N 2 · π · k t u b e · A i n s t u b e , O U T T i n s T P L 1 2 d i n s k i n s + d P L k P L · A i n s
For the final layer of the PV/T module, i.e., the protective layer, the incoming heat flow is defined by conduction through the glass wool insulation, while the outgoing heat flow consists of convective heat transfer to the surroundings and radiative heat exchange between the ground and the sky. The temperature of the protective layer, TPL is given by (34):
ρ · d · A · C p P L · d T P L d t = T i n s T P L 1 2 d i n s k i n s + d P L k P L · A P L h P L a i r · T P L T a i r · A P L ε P L · σ · F P L , s k y · T P L 4 T s k y 4 · A P L + ε P L · σ · F P L , g r o u n d · T P L 4 T a i r 4 · A P L
In the final layer, the heat transfer coefficient between the protective layer and the ambient air is calculated in the same way as for the glass-air interface. The view factors between the protective layer and the sky FPL,sky, as well as between the protective layer and the ground FPL,ground, are also considered. As shown in Figure 10, the thermal resistances of the individual layers are modeled predominantly as series connections (for example: glass, EVA sheet, PV cell layer, EVA foil, PVF foil, adhesive, absorber plate, heat exchanger, insulation, protective layer), since heat transfer between the PV/T module layers is mainly by conduction. In addition, certain boundary thermal resistances, such as between ambient air and the glass or between ambient air and the protective layer, are represented as series elements corresponding to convection.

2.3. Mathematical Model of the Thermal Energy Storage Tank

The mathematical model of the TES is presented only as a thermal subsystem by a one-dimensional dynamic model (ordinary differential equations for temperature distribution—energy balance equations within each layer of the TES). A mathematical model of the TES was created in the MATLAB Simulink R2024b using s-function and Matlab-function blocks.
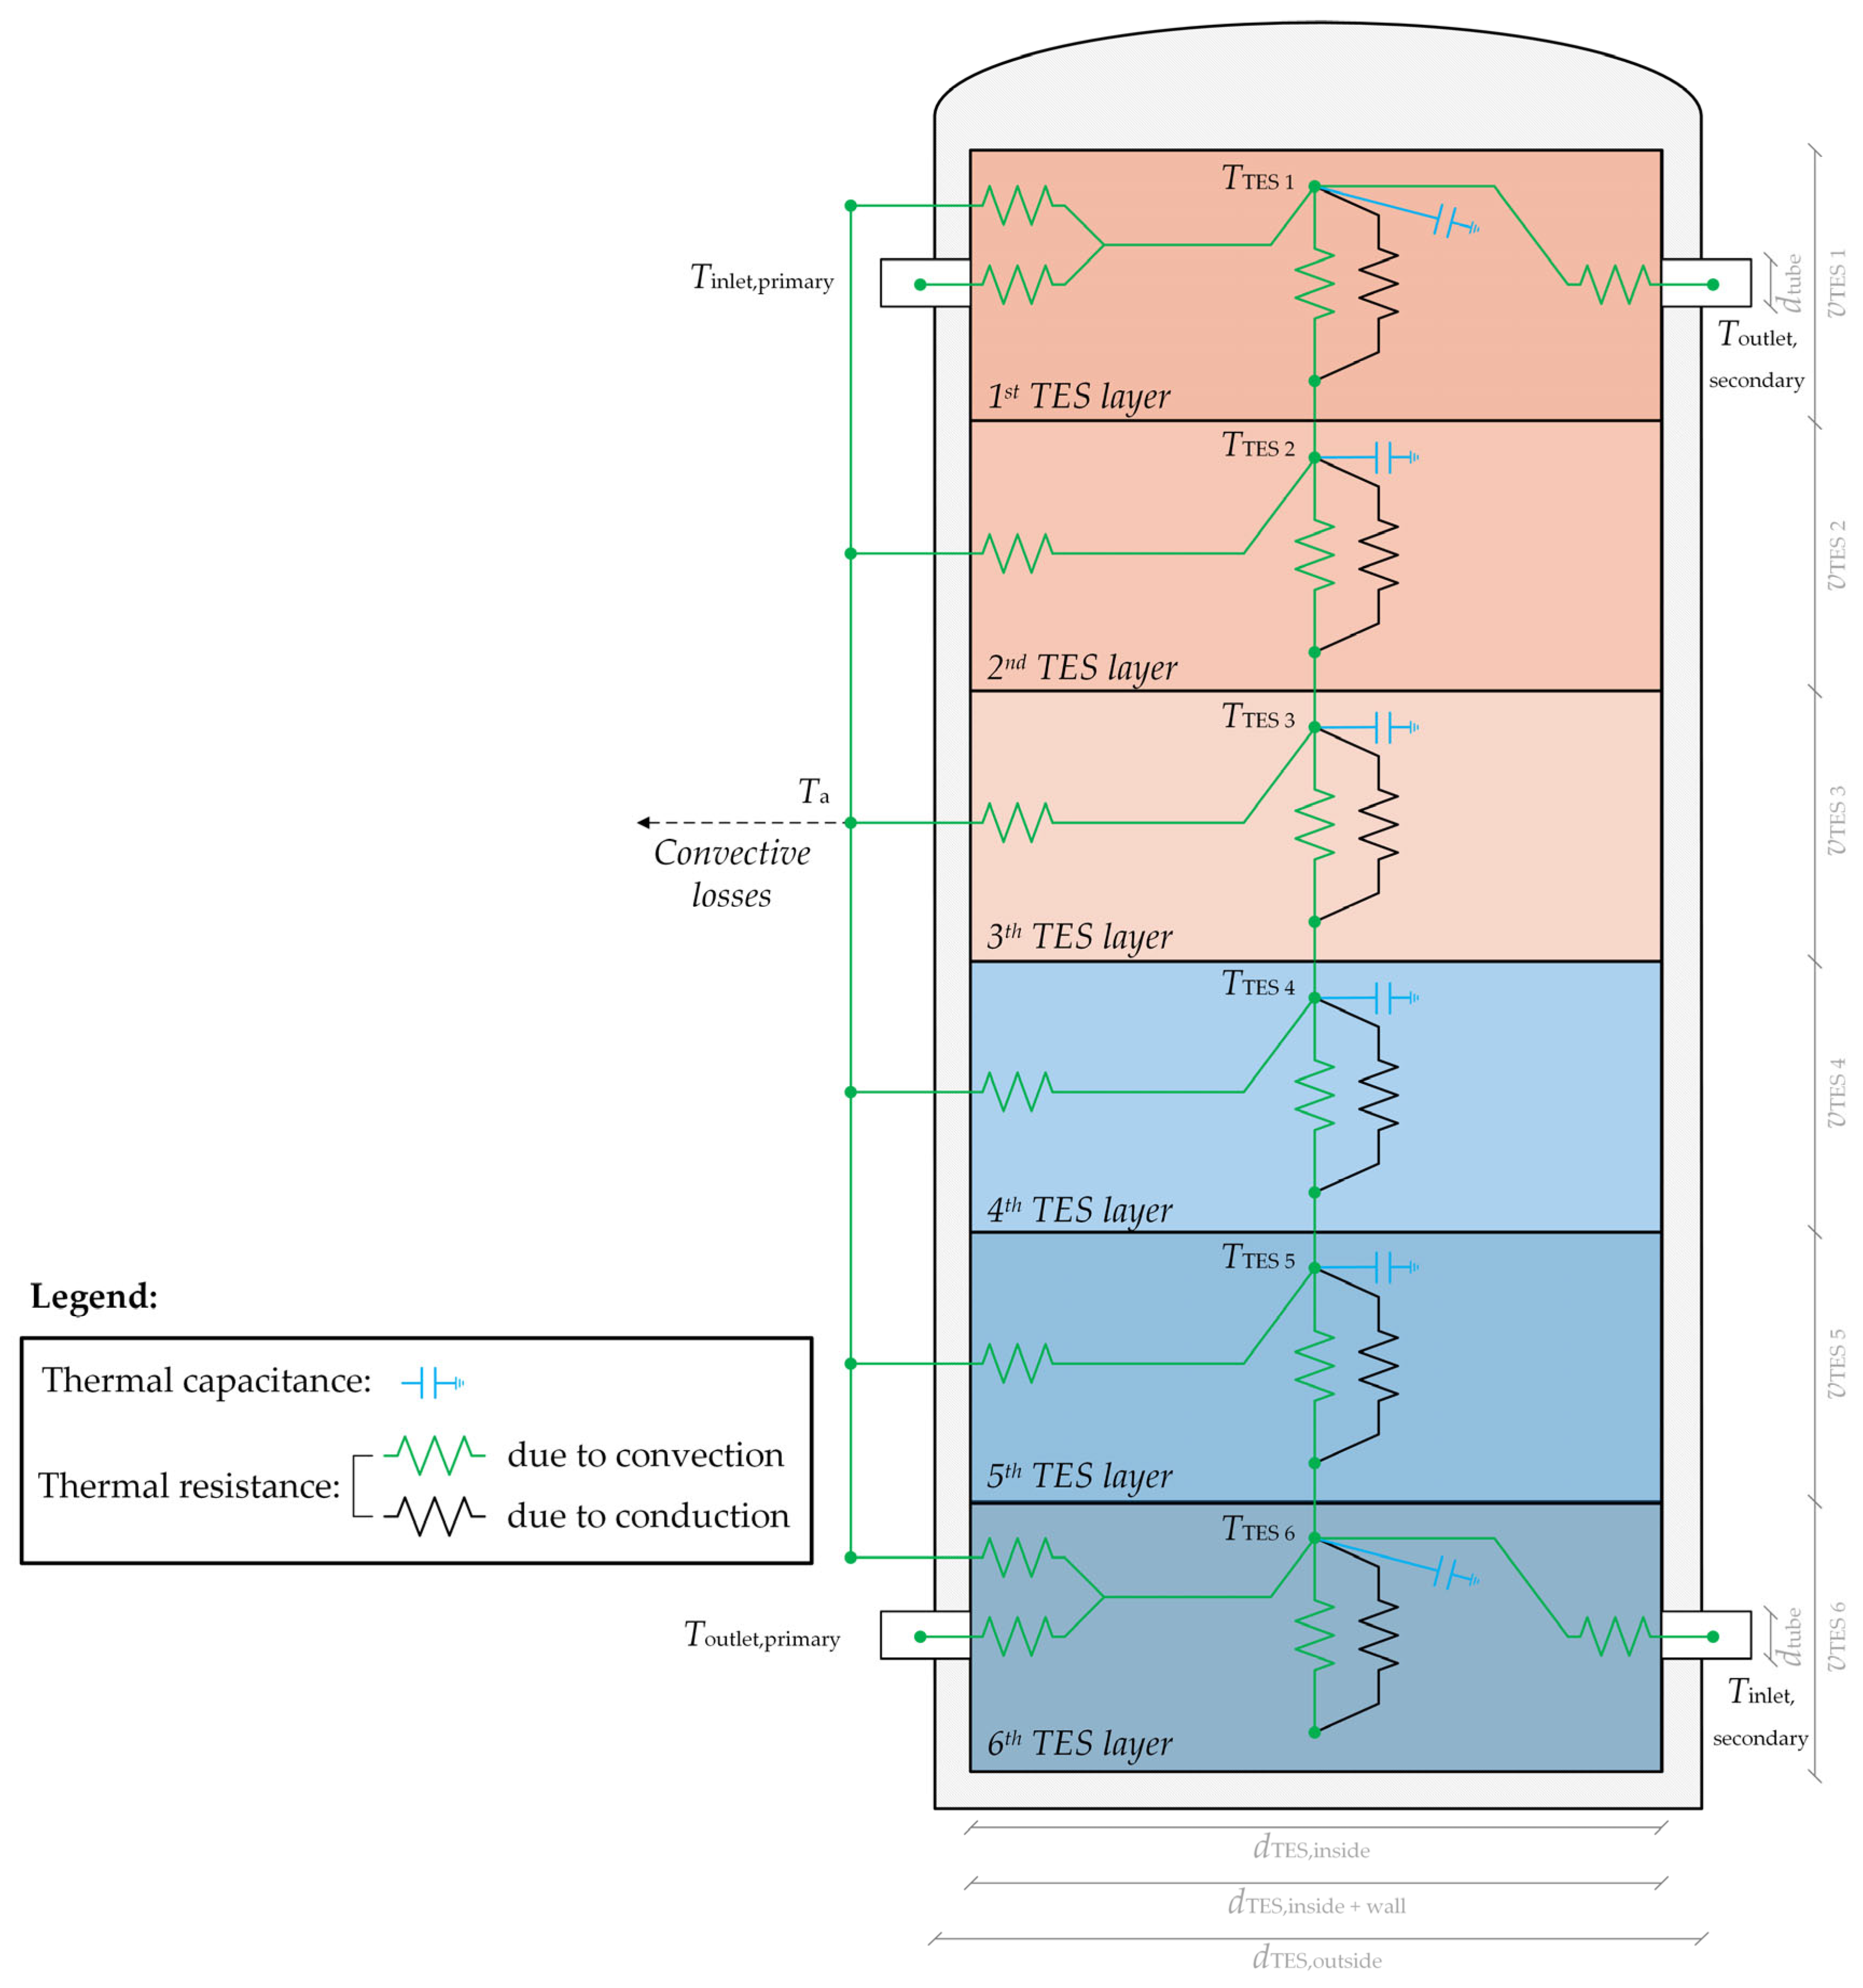
In the mathematical model of the TES, physical properties such as kinematic viscosity, density, thermal conductivity, Prandtl number, and specific heat capacity are defined as temperature-dependent functions of the working fluid [51]. Based on these properties, the Reynolds number is determined, which serves as the basis for calculating the heat transfer coefficient of the working fluid hf. The procedure for calculating the heat transfer coefficient of the working fluid in the TES is identical to that used in the PV/T module, with the only difference being the applied mass flow rates. To support the understanding of the thermal subsystem model of the TES, Figure 11 shows the corresponding thermal network for the TES.
As shown in Figure 11, the mathematical model of the thermal subsystem of the TES is divided into six layers. This division was made for validation purposes, as six temperature sensors are installed in the experimental PV/T system. The first layer includes the inlet of the warmer working fluid from the PV/T modules and the outlet of the warmer fluid to the tertiary heat exchanger (for heating purposes). In contrast, the sixth layer includes the inlet of the cooler working fluid from the tertiary heat exchanger and the outlet of the cooler fluid to the PV/T modules (for cooling purposes).
The first layer of the TES includes both incoming and outgoing heat flows. The incoming heat flow is represented by convective heat transfer resulting from the inflow of warmer working fluid into the first TES layer. Conversely, the outgoing heat flow includes convective heat transfer due to the outflow of the warmer working fluid from the first TES layer, as well as additional convective heat losses to the surroundings through the TES walls. In addition, conductive heat transfer caused by the temperature difference between adjacent layers and natural convection of the working fluid due to density differences between these layers can act as either incoming or outgoing heat flows, depending on the temperature gradients within the TES. The temperature of the first TES layer, THTE 1 is given by (35):
π · r 2 · v · ρ · C p T E S   1 · d T T E S   1 d t = k + Δ k v T E S   1 · A c i , T E S   1 · T T E S   2 T T E S   1 + m ˙ u p · C p , T E S   1 · T T E S   2 T T E S   1 +   m ˙ d o w n · C p , T E S   1 · T i n l e t , p r i m a r y T T E S   1 U T E S   1 · A T E S   1 · T a T T E S   1   + m ˙ i n l e t , p r i m a r y · C p , T E S   1 · T i n l e t , p r i m a r y T T E S   1 m ˙ o u t l e t , s e c o n d a r y · C p , T E S   1 · T T E S   1 T i n l e t , p r i m a r y
where r denotes the inner radius of the TES, v the height of the considered layer (in cross-section), ρ the density of the working fluid, Cp its specific heat capacity, k the thermal conductivity of the fluid within the TES, Δk the overall thermal conductivity of the TES wall, Aci,TES represents the internal cross-sectional surface area of the TES for the given layer, down and up correspond to the mass flow rates of the working fluid caused by natural convection (resulting from density differences). inlet,primary, outlet,secondary, inlet,primary and outlet,secondary represent the mass flow rates of the working fluid at the primary and secondary inlets and outlets of the TES (as illustrated in Figure 11).
Unlike the first and sixth layers of the TES, the intermediate layers TTES n involve only conductive heat transfer resulting from the temperature difference between adjacent layers, convective heat transfer due to natural convection (caused by density gradients), and additional convective heat losses to the surroundings through the TES walls. The temperature of the intermediate TES layers is described by (36):
π · r 2 · v · ρ · C p T E S   n · d T T E S   n d t = k + Δ k v T E S   n · A c i , T E S   n · T T E S   n + 1 T T E S   n + k + Δ k v T E S   n · A c i , T E S   n · T T E S   n 1 T T E S   n +   m ˙ u p · C p , T E S   n · T T E S   n + 1 T T E S   n + m ˙ u p · C p , T E S   n · T T E S   n 1 T T E S   n U T E S   n · A T E S   n · T a T T E S   n
The mathematical formulation of the sixth (final) TES layer closely resembles that of the first TES layer. The incoming heat flow is governed by convective heat transfer from the inflow of cooler working fluid, while the outgoing heat flow includes convection due to fluid outflow and additional convective heat losses through the TES walls. Conductive heat transfer between adjacent layers and natural convection caused by density differences are defined in the same way as in the first layer. The temperature of the sixth TES layer, TTES 6 is given by (37):
π · r 2 · v · ρ · C p T E S   6 · d T T E S   6 d t = k + Δ k v T E S   6 · A c i , T E S   6 · T T E S   6 T T E S   5 + m ˙ u p · C p , T E S   6 · T T E S   6 T T E S   5 +   m ˙ d o w n · C p , T E S   6 · T T E S   5 T T E S   6 U T E S   6 · A T E S   6 · T a T T E S   6 +   m ˙ i n l e t , s e c o n d a r y · C p , T E S   6 · T i n l e t , s e c o n d a r y T T E S   6 m ˙ o u t l e t , p r i m a r y · C p , T E S   6 · T T E S   6 T o u t l e t , p r i m a r y

2.4. Experimental Validation of the Mathematical Model of the Photovoltaic/Thermal System

The mathematical model validation for the PV/T system was conducted based on measurements from the experimental PV/T system. Parameters such as power density of solar radiation G, ambient temperature Ta, wind speed v, and mass flow rate were set as input variables, while other parameters, including the temperature of the working fluid at the inlet and outlet of the PV/T modules TPV/T 1 and TPV/T 4, electrical power Pele., and the temperature of the working fluid within the TES layers TTES, were used to validate the results of the mathematical model of the PV/T system. The accuracy of the proposed mathematical model for the PV/T system was evaluated over an entire year at 5-min intervals. Due to the extensive time-based data within one year, the data were further categorized based on weather types (sunny, cloudy, and overcast). This approach to model validation was also suggested in [74]. Annually (in 2024), this included 69 sunny days, 183 partly cloudy days, and 113 cloudy days. To achieve a more precise validation of the accuracy of the PV/T system’s mathematical model compared to the measurements, various quantitative indicators were used, allowing for the comparison of models, predictions, or measurements with actual or reference values. The literature indicates that the accuracy of mathematical models is typically assessed using only one or two quantitative indicators (most commonly normalized Root Mean Square Error (nRMSE) and/or normalized Mean Absolute Error (nMAE)) [35,37]. However, in this paper, the validation of the mathematical model with measurements was also assessed using four additional quantitative indicators: normalized Mean Bias Error (nMBE), Mean Absolute Percentage Error (MAPE), Correction Coefficient (CC), and Determination Coefficient (R2) for better insight into error values of specific days. The quantitative indicators are presented from (38) to (43).
n R M S E = 1 n i = 1 n y i , m e a s . y i , m o d . 2 y ¯ m e a s . · 100
n M A E = 1 n i = 1 n y i , m e a s . y i , m o d . y ¯ m e a s . · 100
n M B E = 1 n i = 1 n y i , m e a s . y i , m o d . y ¯ m e a s . · 100
M A P E = 1 n i = 1 n y i , m e a s . y i , m o d . y ¯ i , m e a s . · 100
C C = i = 1 n y i , m e a s . y ¯ m e a s . · y i , m o d . y ¯ m e a s . i = 1 n y i , m e a s . y ¯ m e a s . 2 · i = 1 n y i , m o d . y ¯ m o d . 2
R 2 = 1 i = 1 n y i , m e a s . y i , m o d . 2 i = 1 n y i , m e a s . y ¯ m e a s . 2
where yi,meas. and yi,mod. represent the measured and modeled values, respectively, while y ¯ m e a s . and y ¯ m o d . represent mean measured and mean modeled values.

3. Results

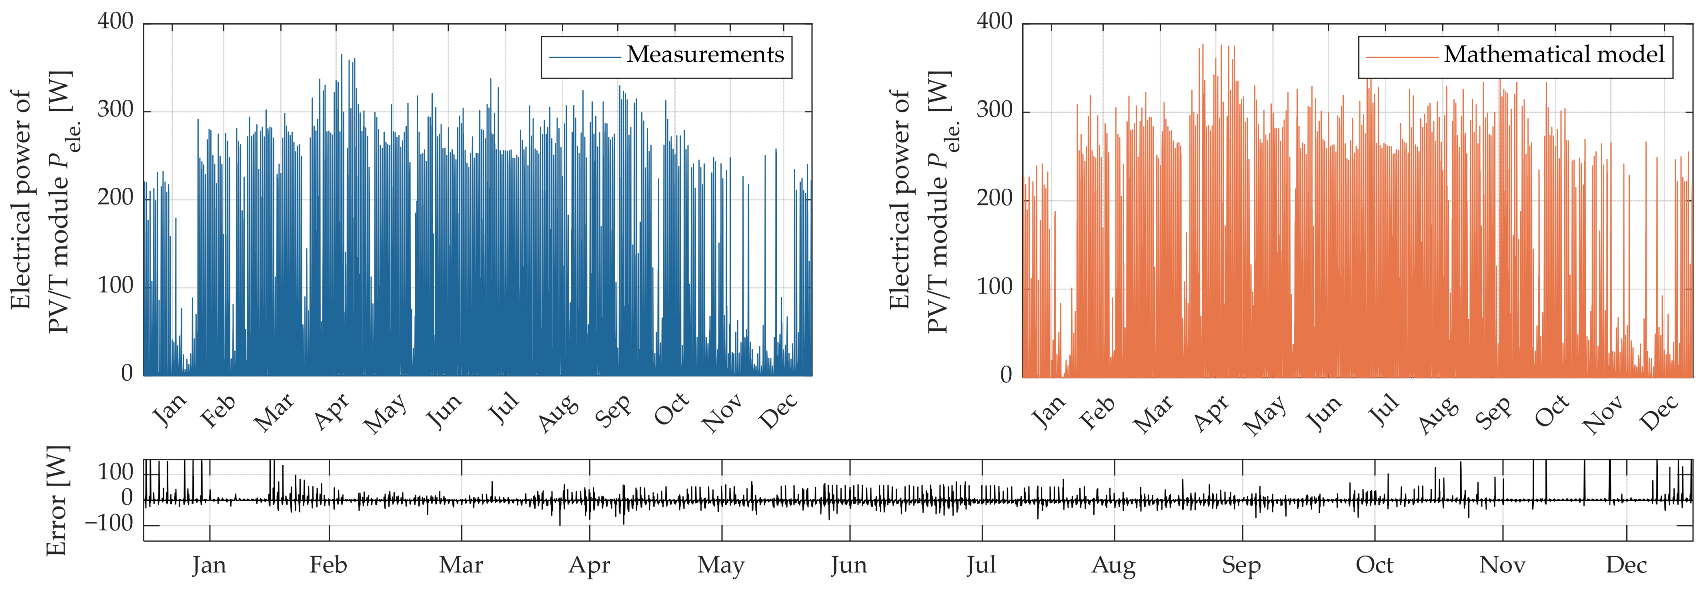
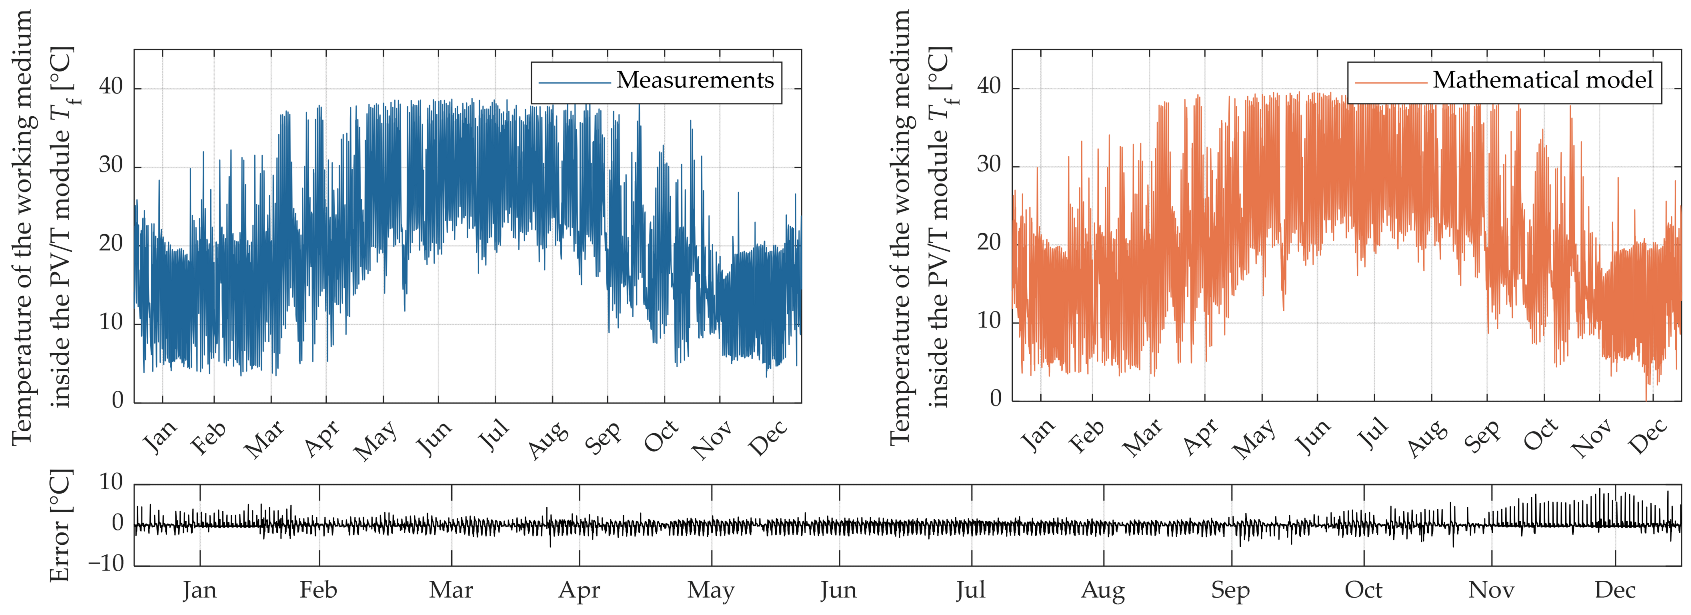
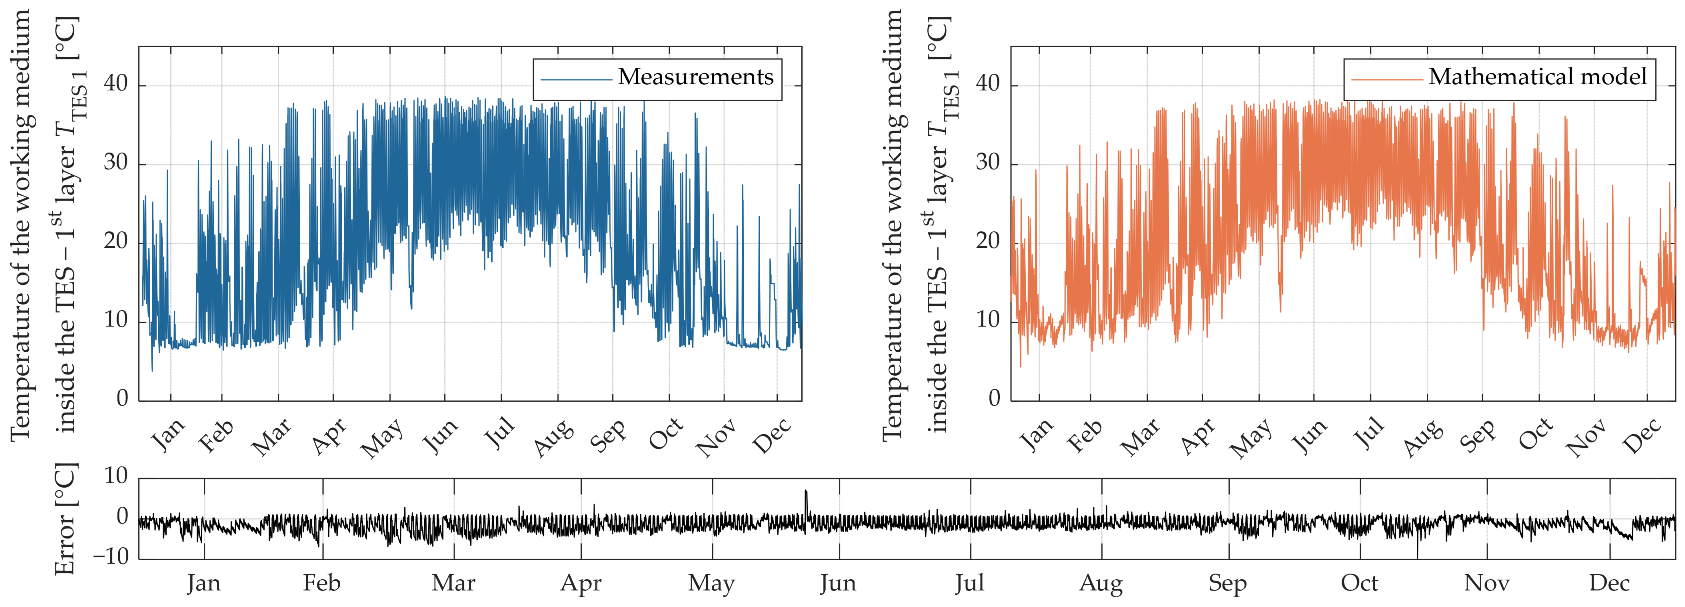
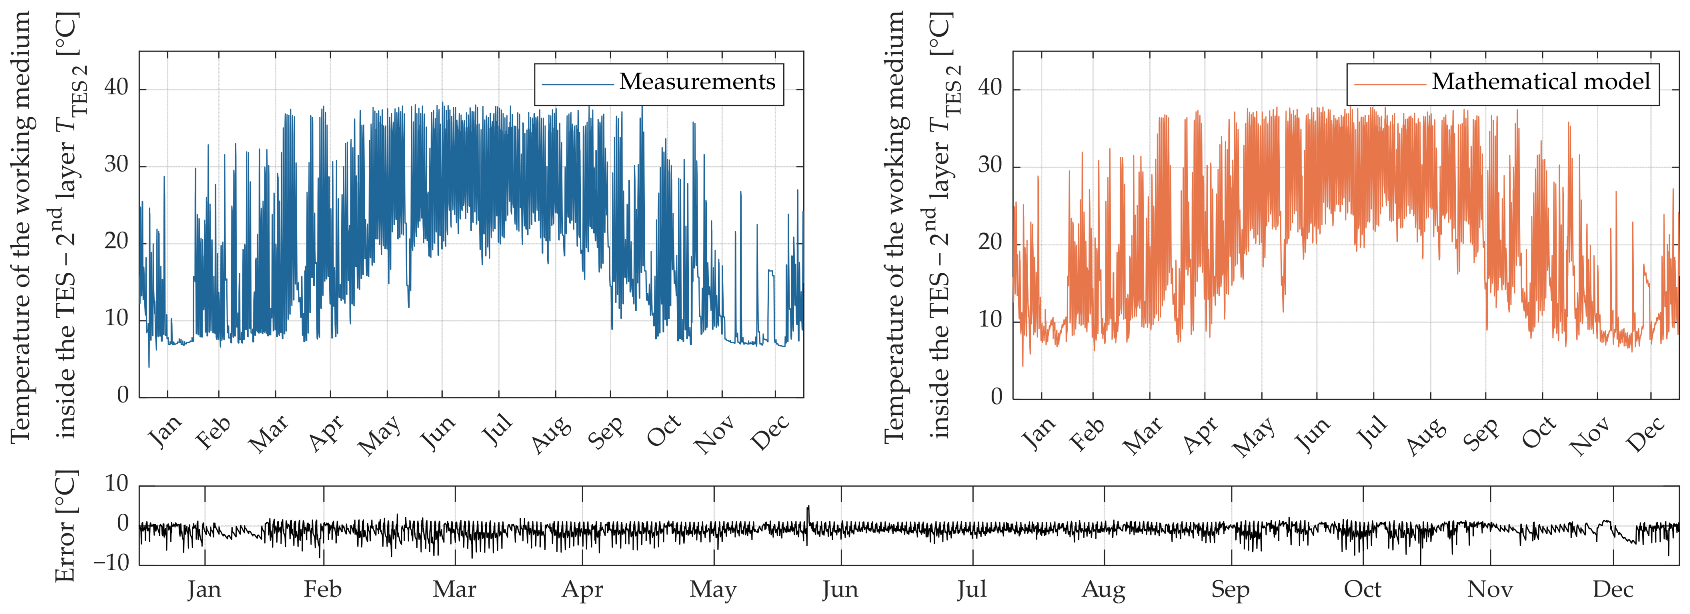
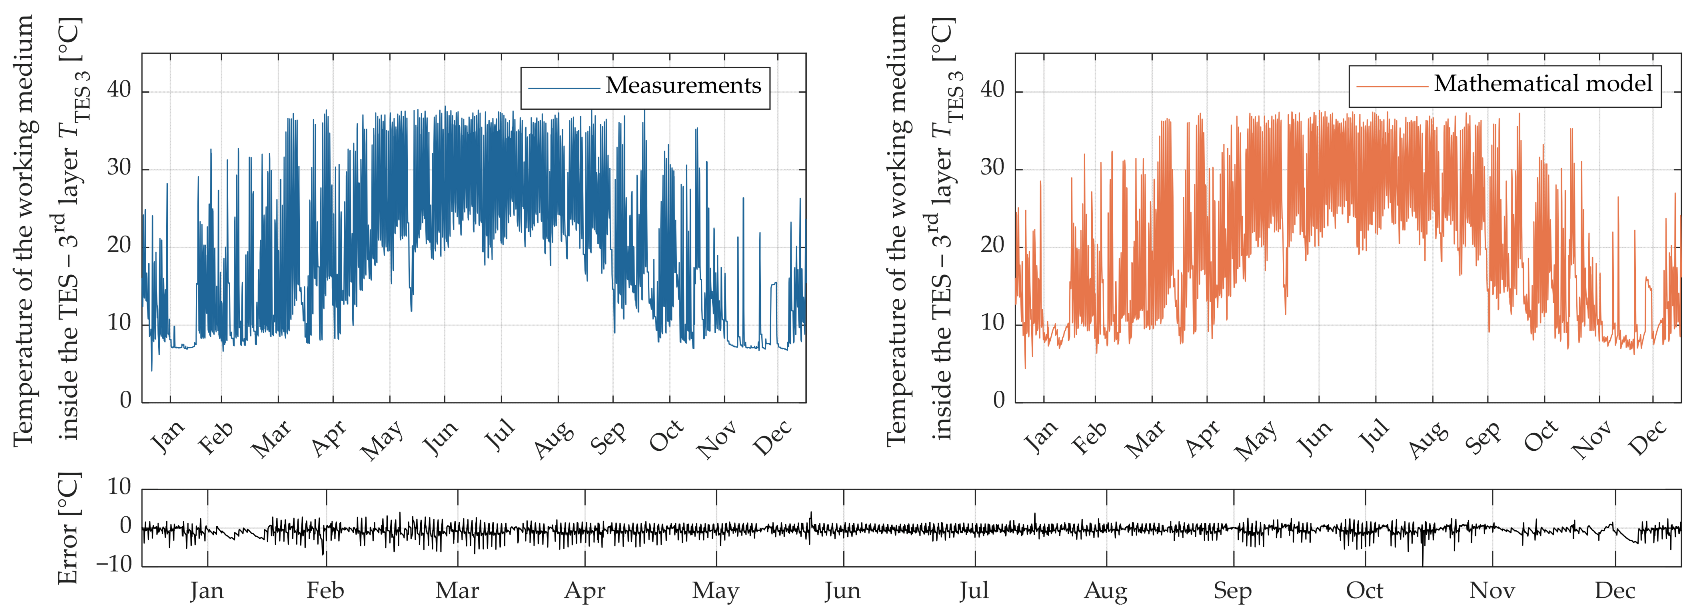
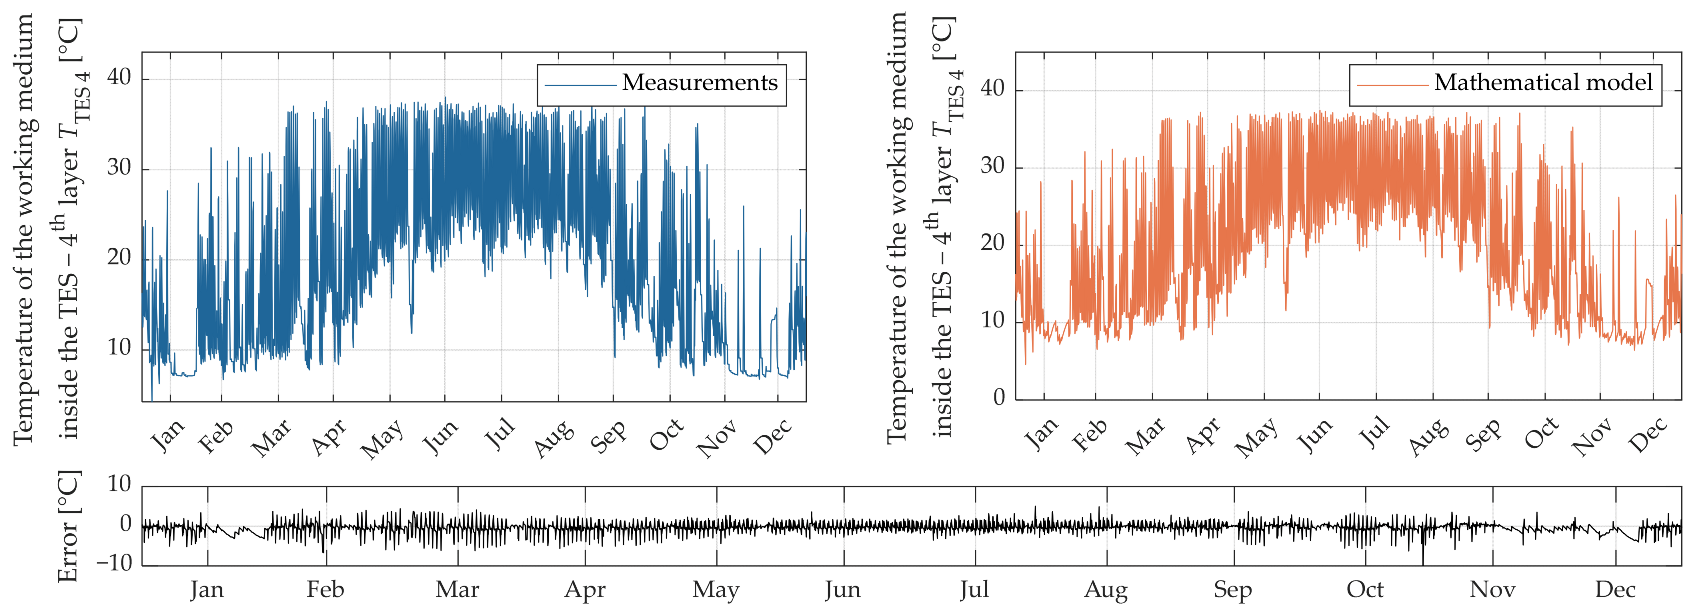
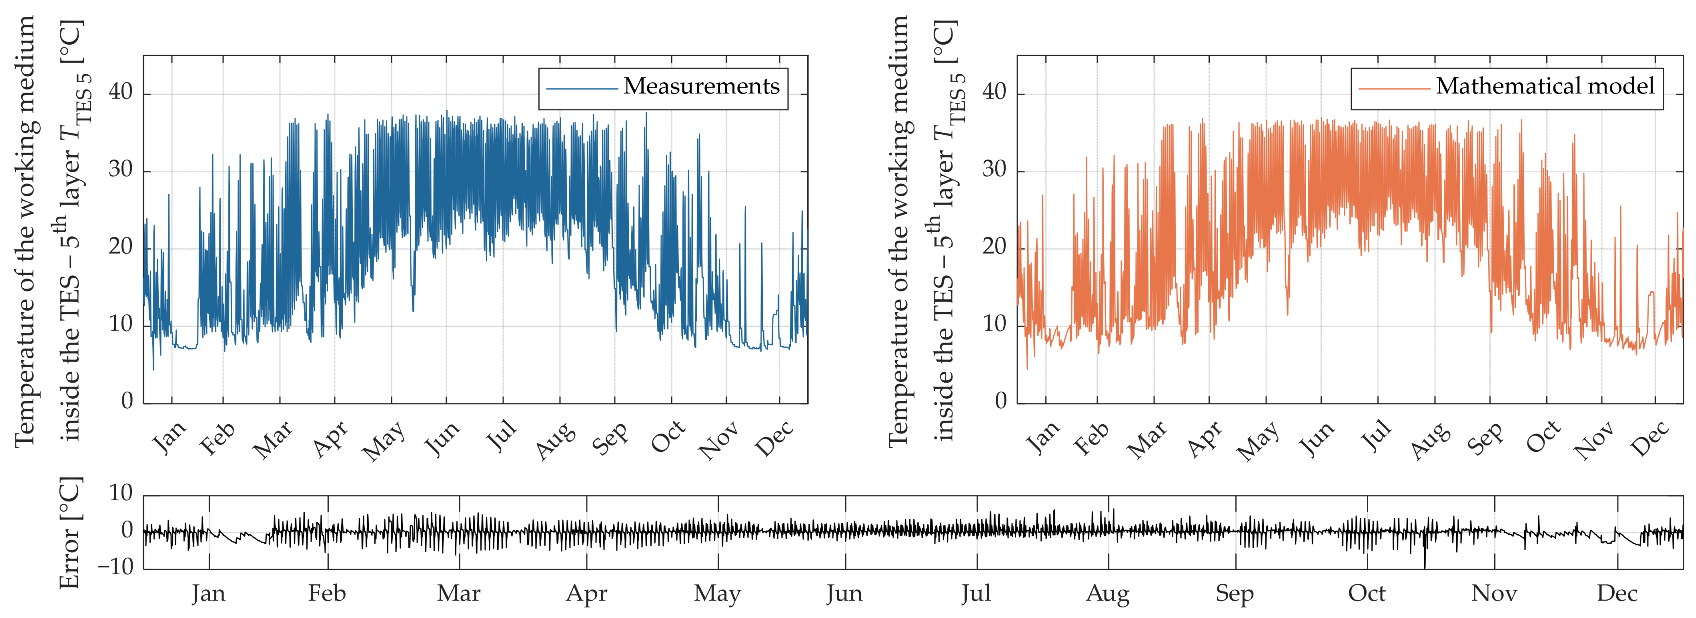
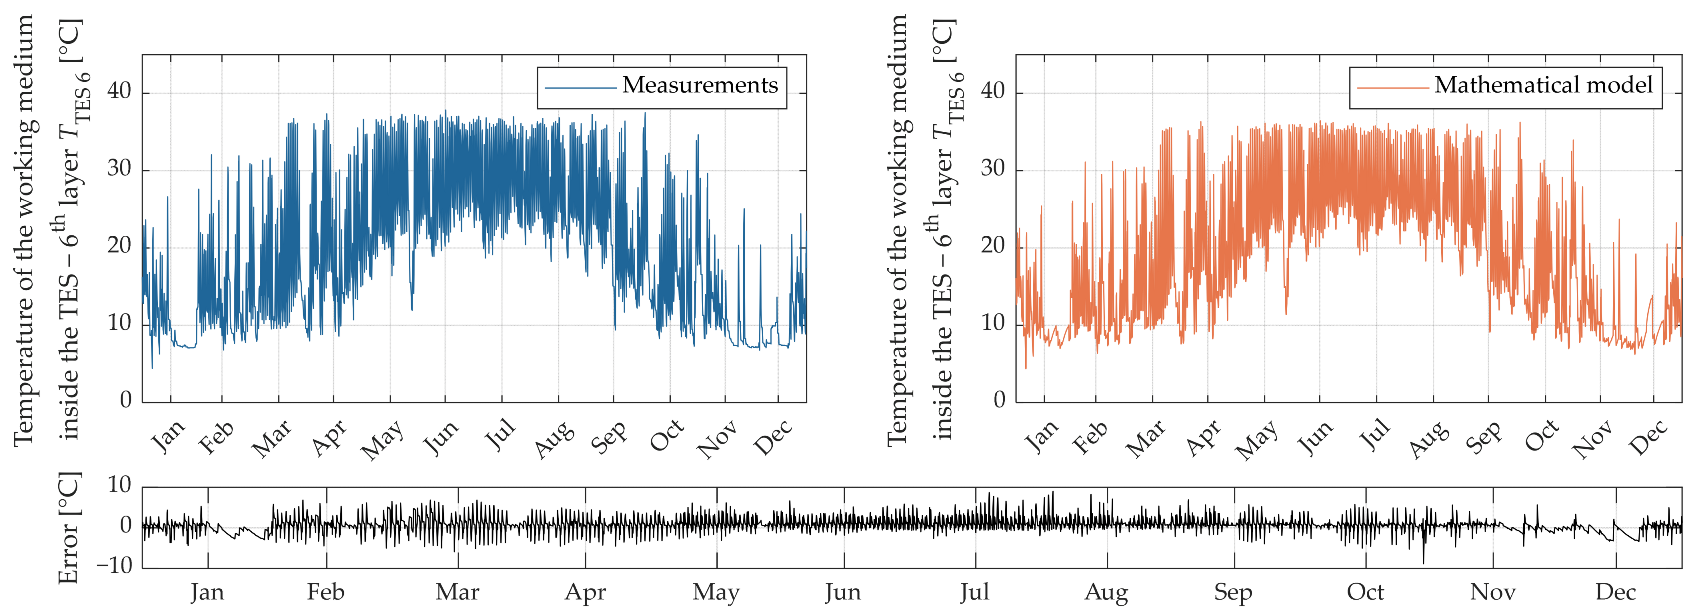
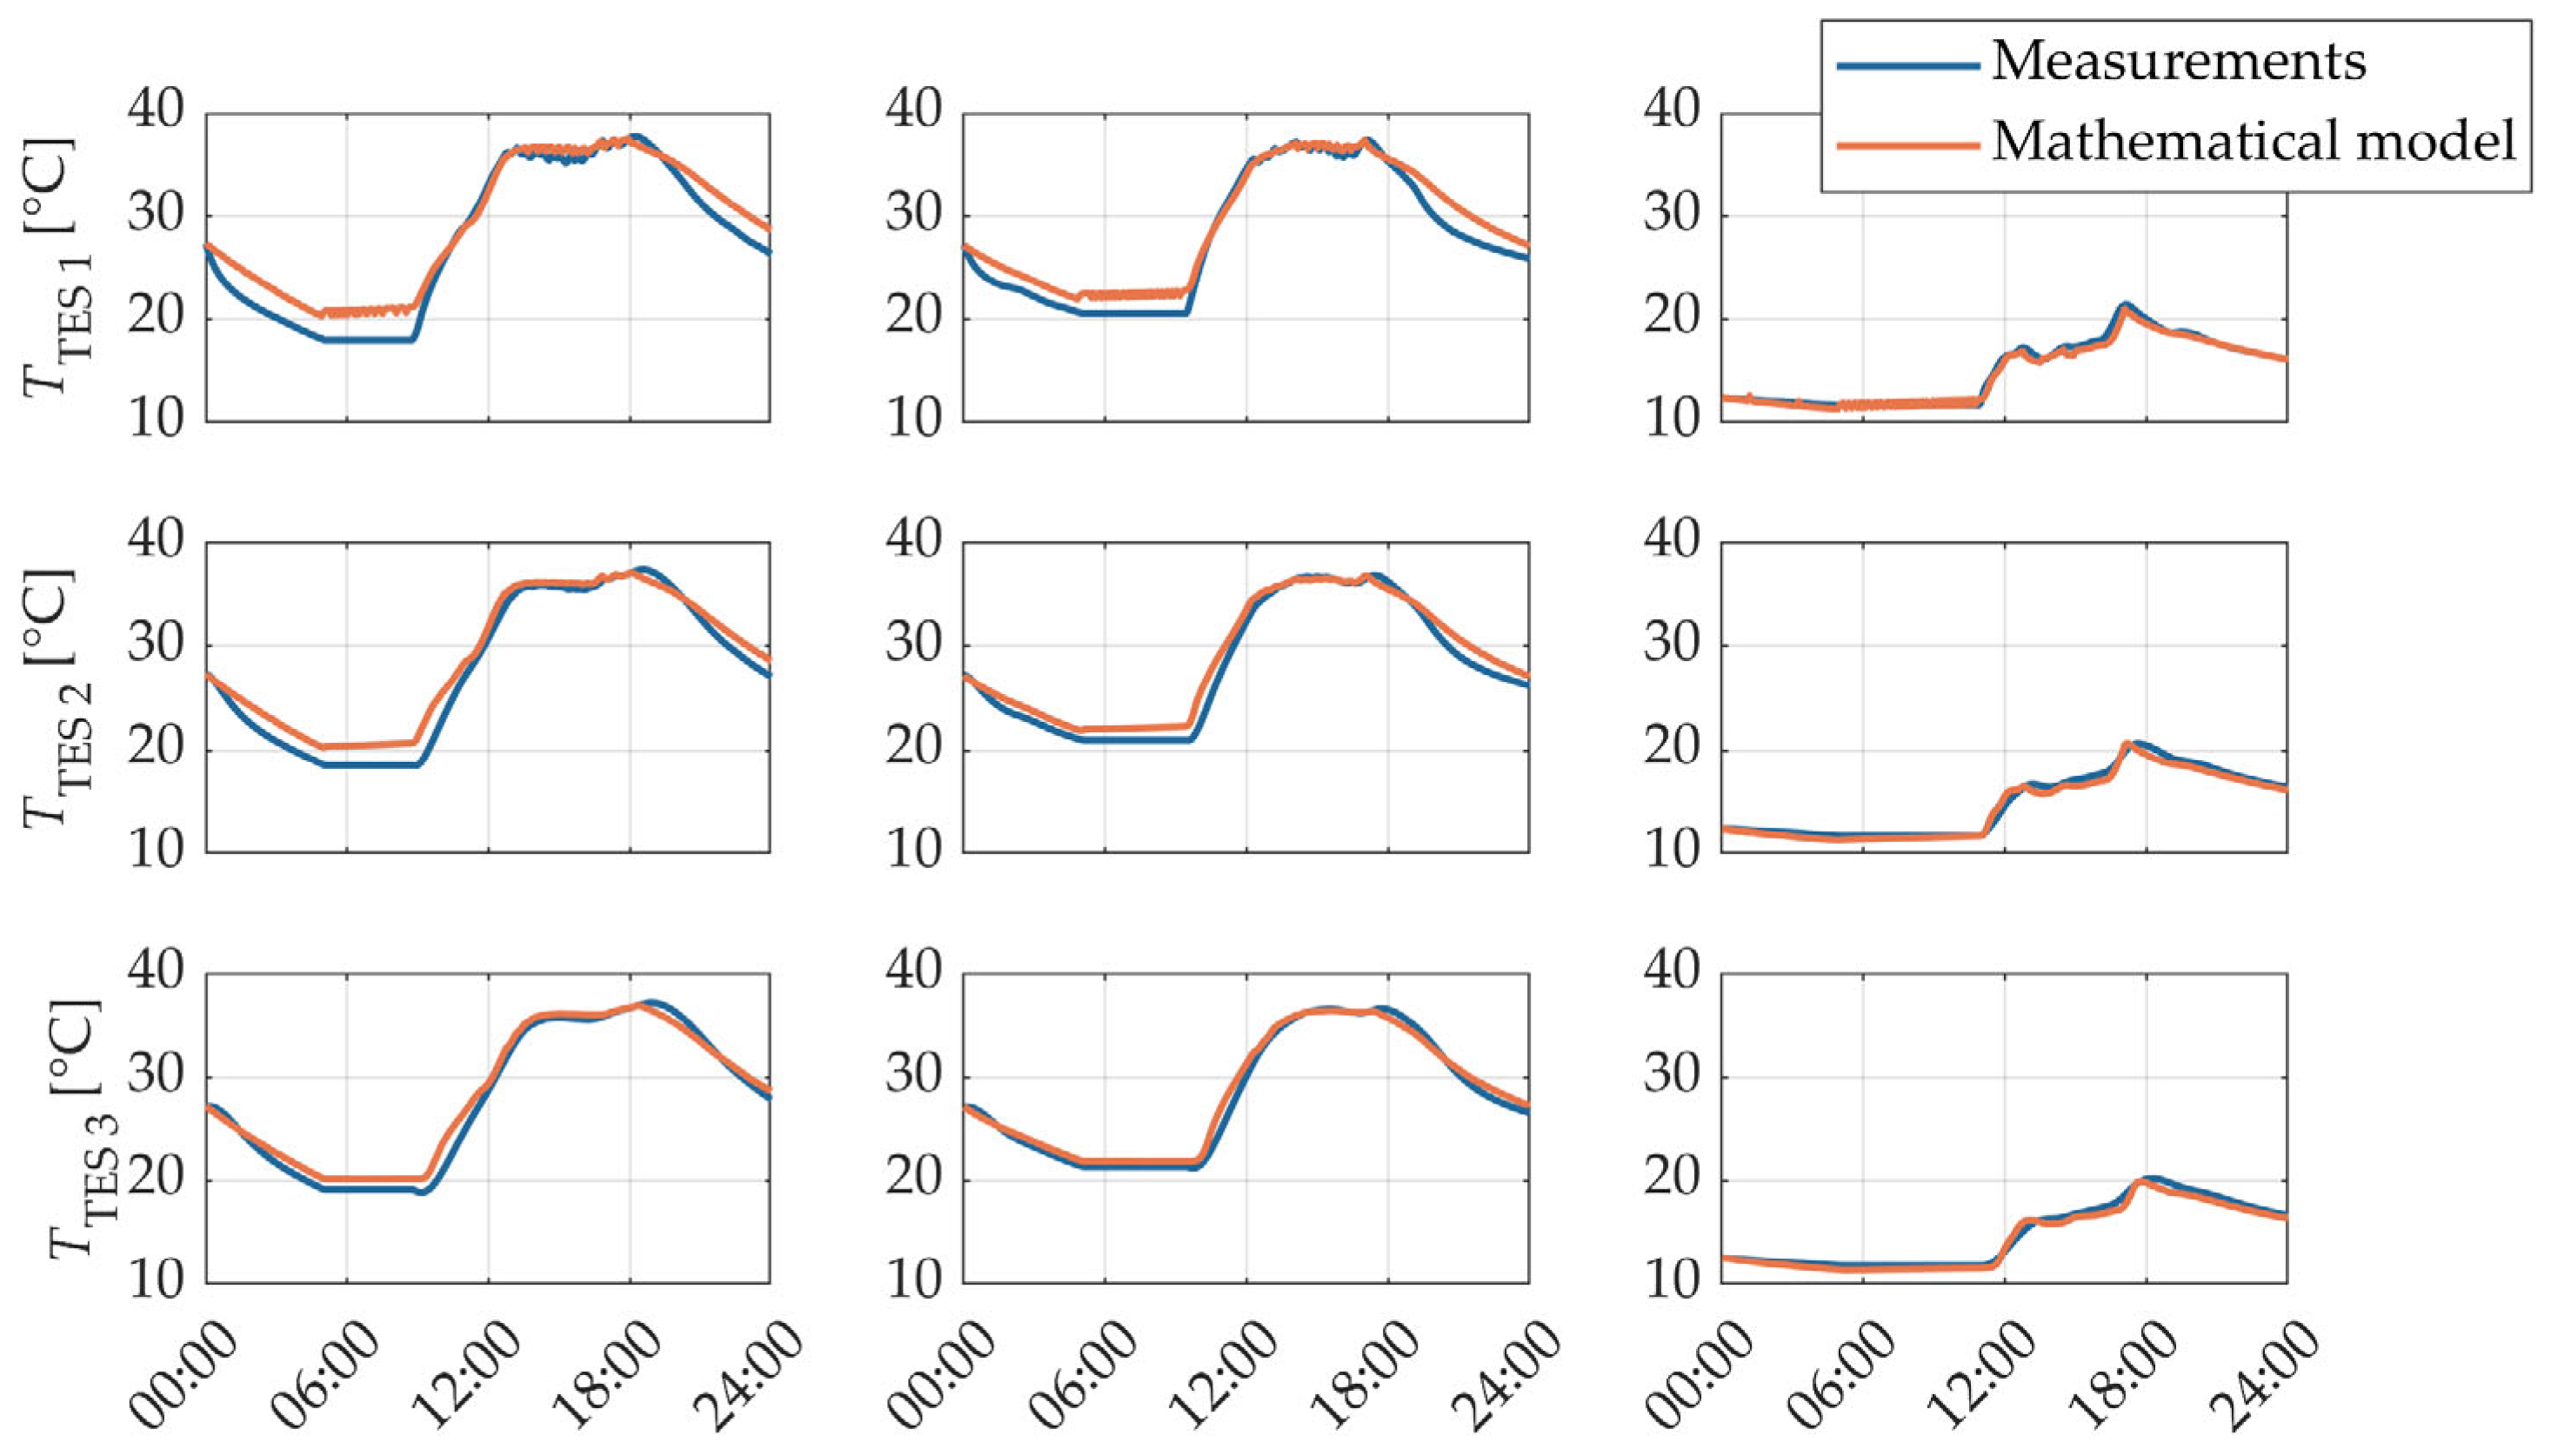
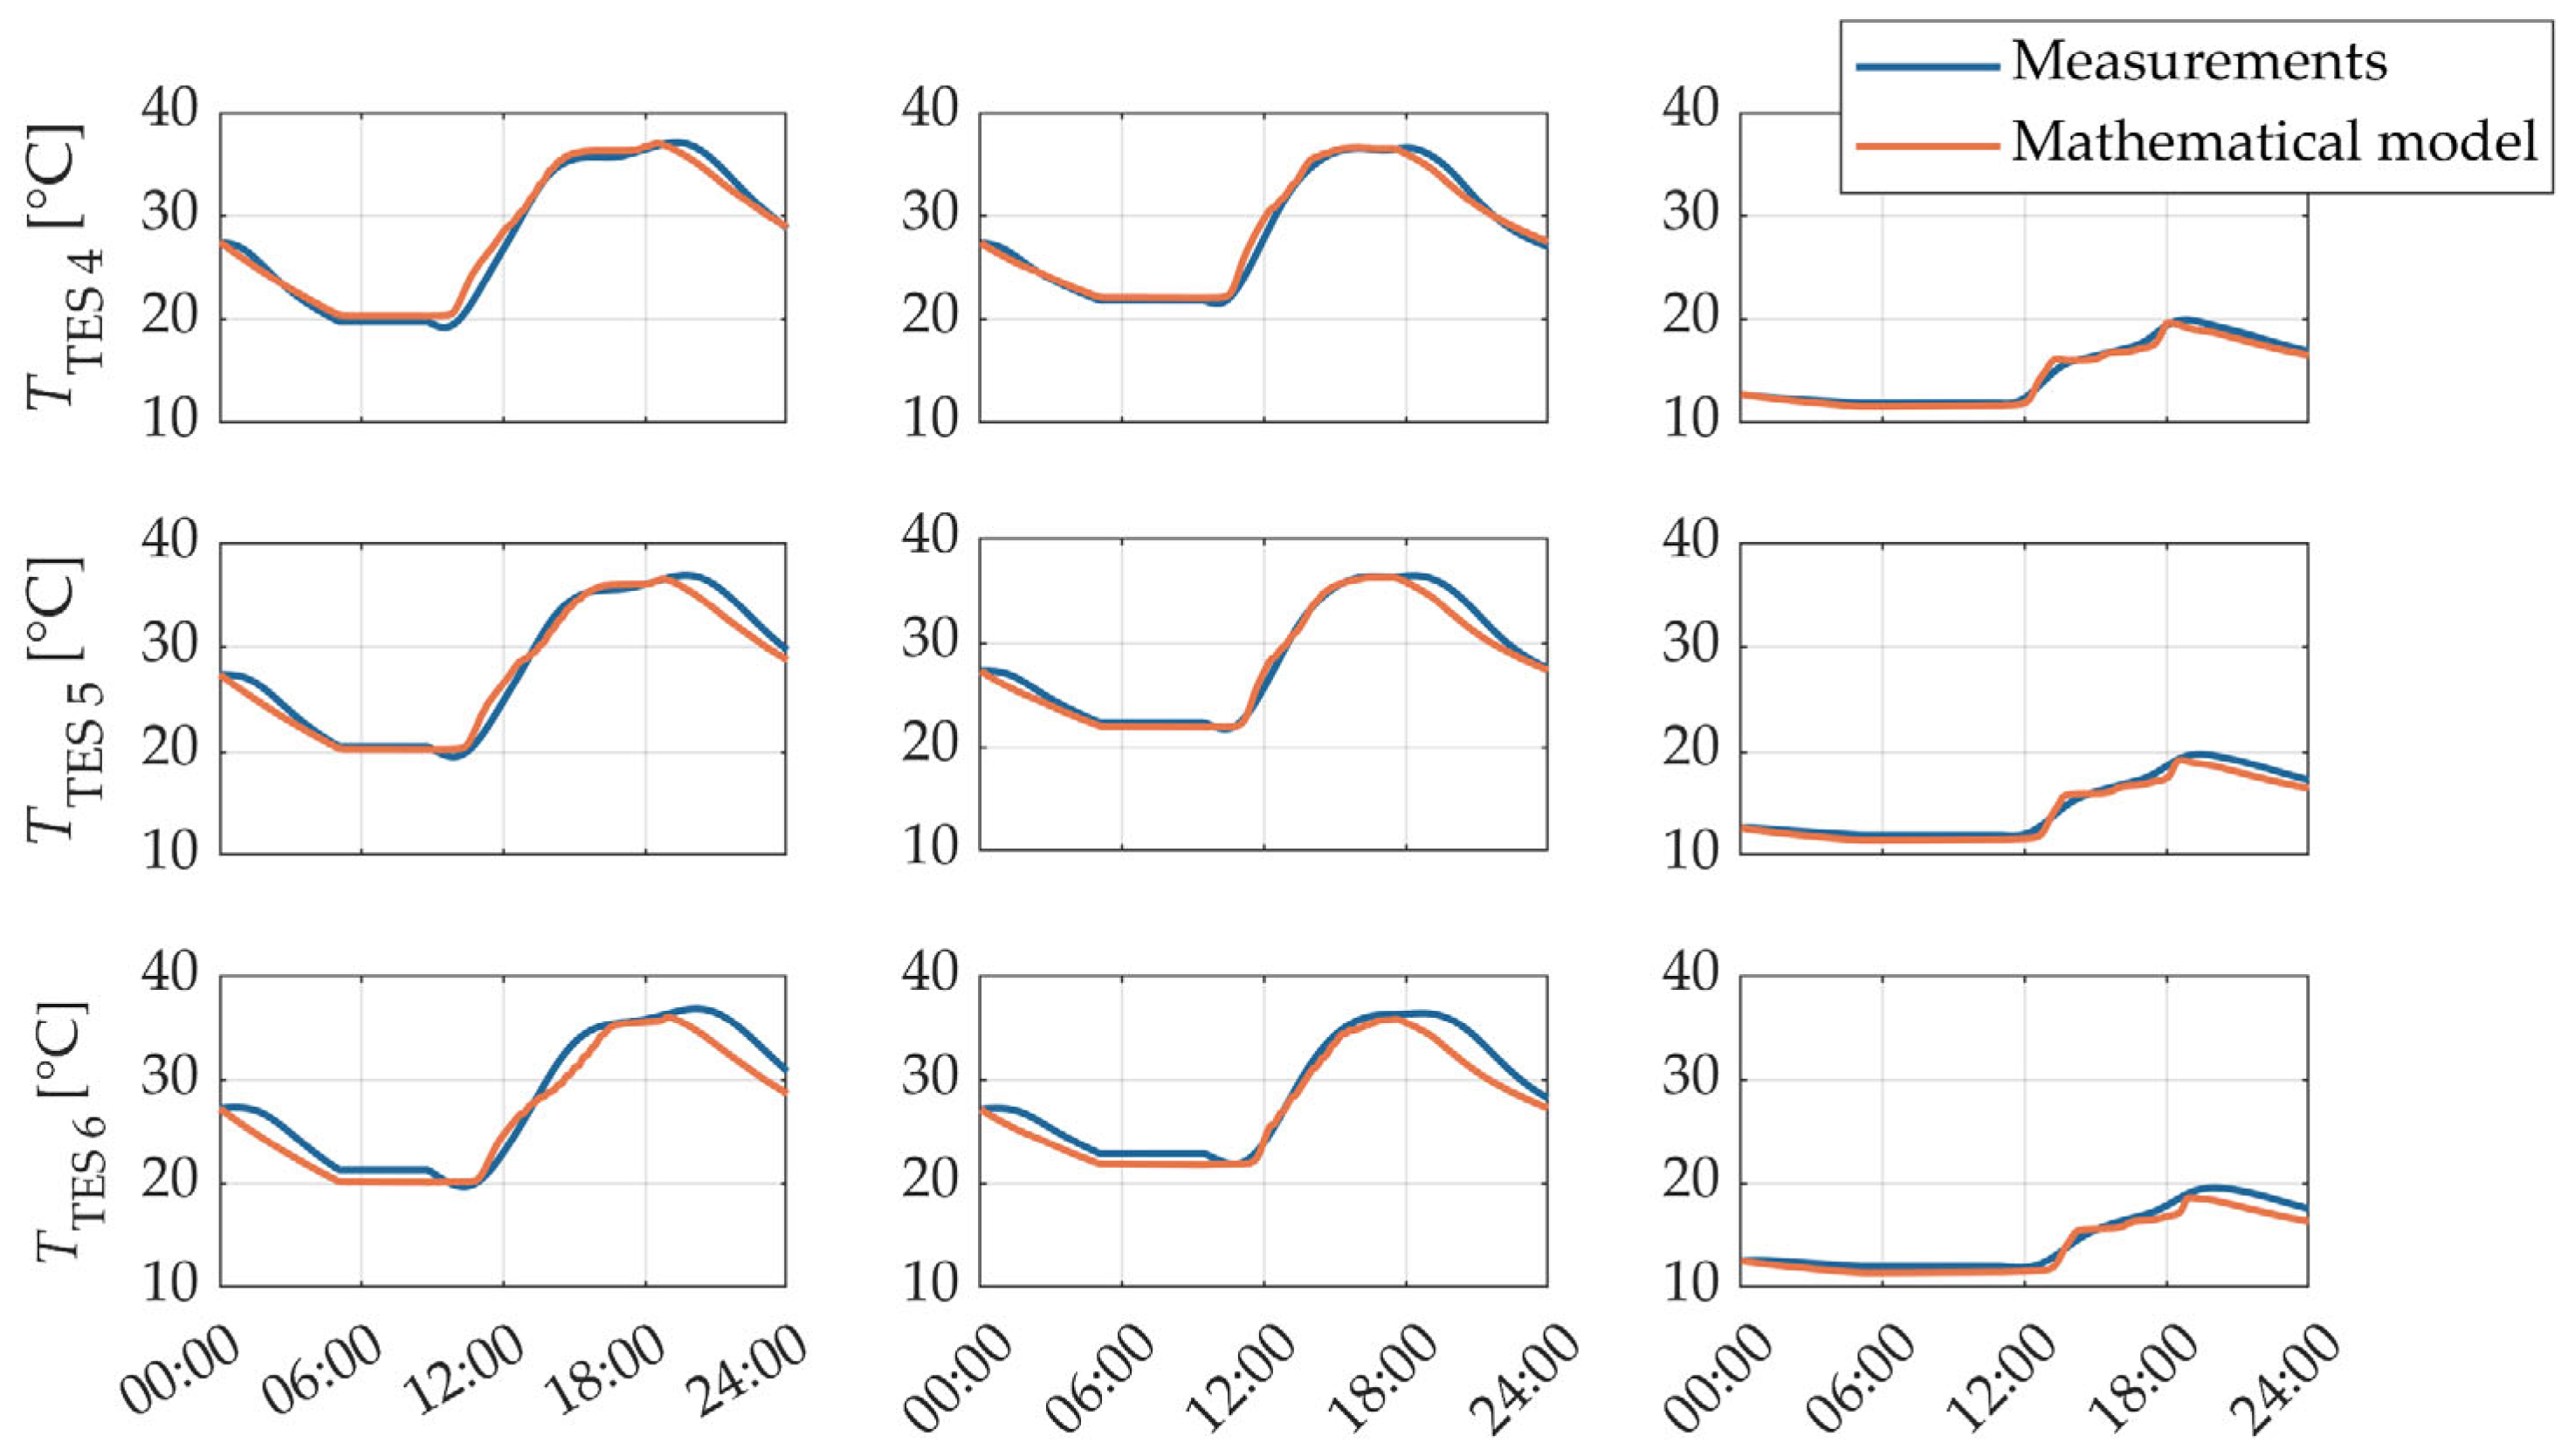
Based on the presented mathematical model of the PV/T system, this section presents the results of its validation using data obtained from an experimental PV/T system. The validation covers the electrical and thermal subsystems of the PV/T module as well as the thermal subsystem of the TES and was performed over the entire year 2024 using a 5-min time interval. Due to missing data, the last two days of December were excluded, resulting in a total of 363 days. Figure 12, Figure 13, Figure 14, Figure 15, Figure 16, Figure 17, Figure 18 and Figure 19 show the time series of the electrical power output Pele. of the PV/T module, the working fluid temperature Tf in the PV/T module, and the working fluid temperatures in the TES across all six layers (TTES 1 to TTES 6).
Figure 12, Figure 13, Figure 14, Figure 15, Figure 16, Figure 17, Figure 18 and Figure 19 show that the results of the mathematical model of the PV/T system correspond well with the measurements obtained from the experimental PV/T setup. A more pronounced deviation is observed during the winter months, primarily due to snow coverage. The deviation arises from the functioning pyranometer, which remained snow-free and continued measuring solar irradiance, while the PV/T modules were partially or fully covered with snow. As the irradiance measurements are essential for calculating the electrical power output of the PV/T module, as well as the working fluid temperature in the PV/T module and consequently in the TES, this mismatch leads to increased error in winter. If the average deviations between the model and the measurements are presented quarterly, a more detailed insight into the dynamics and seasonal characteristics of the deviations throughout the year can be obtained (as shown in Table 2).
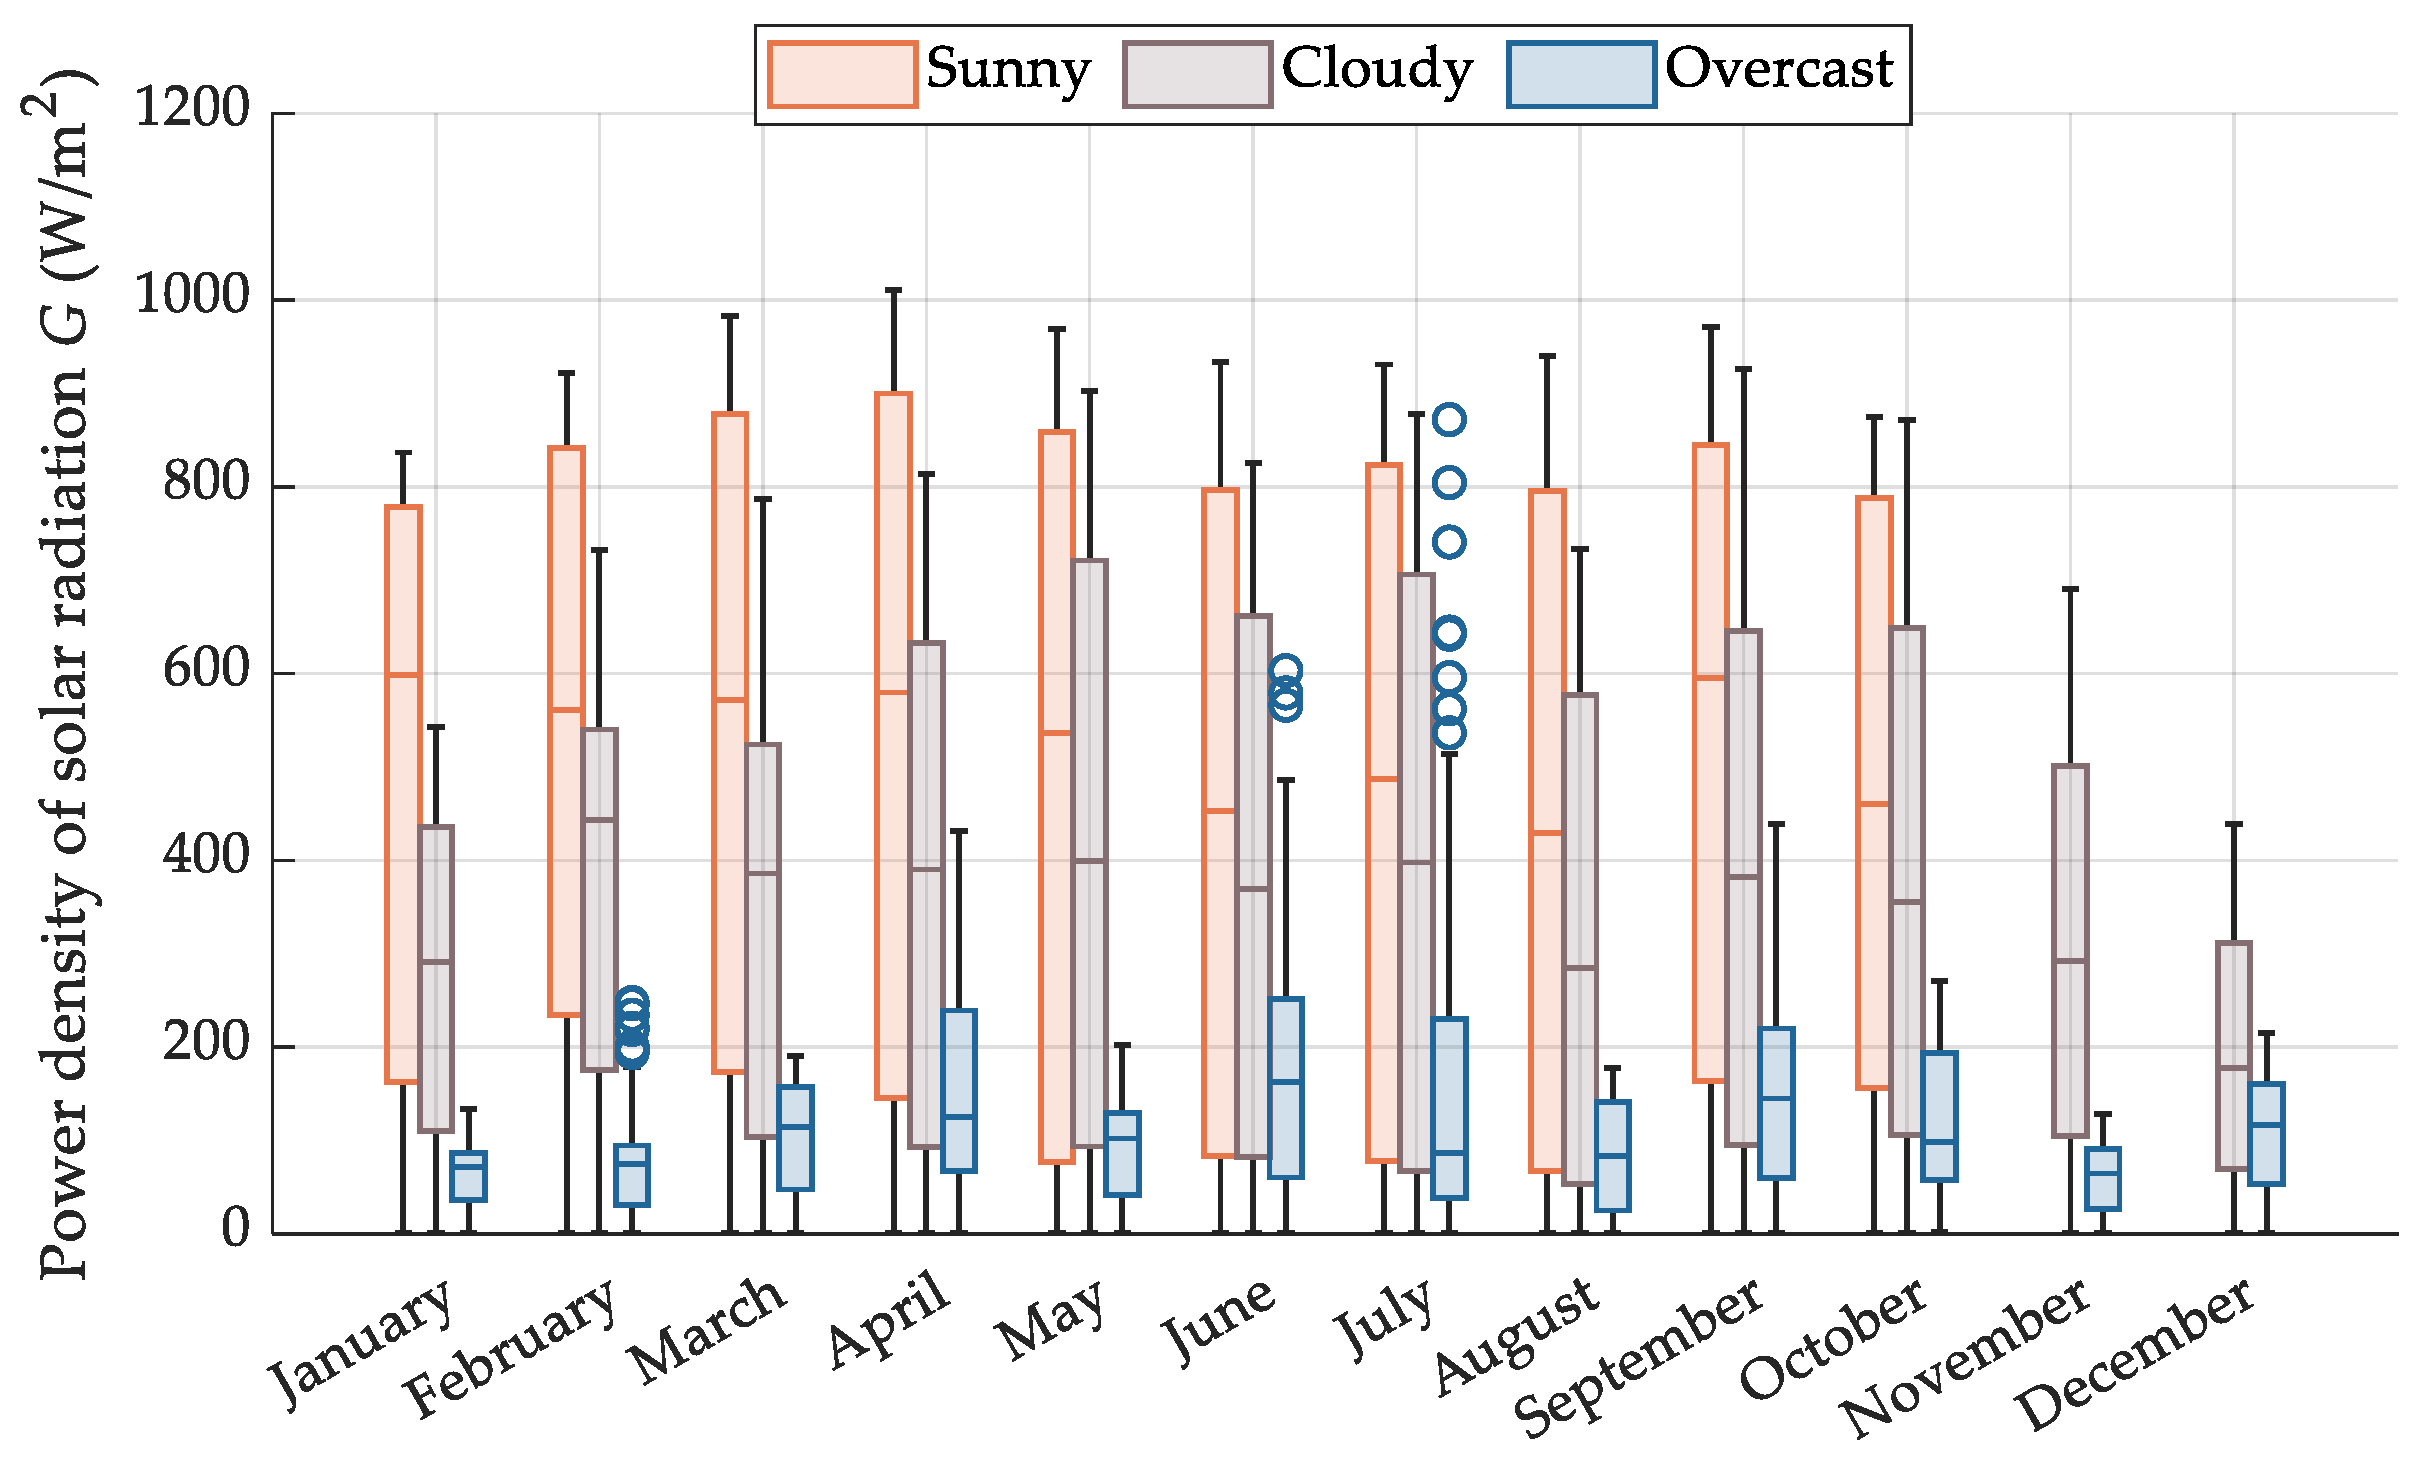
Table 2 shows that the highest deviation values occur during the winter period, which is consistent with the previously mentioned issue of snow coverage on the PV/T modules. The lowest average deviations are observed during the summer months, when weather conditions are the most stable. Despite the more detailed seasonal analysis of model accuracy, the evaluation of the mathematical model in this paper is based on weather classification. Days in the year were categorized as sunny, cloudy, and overcast. This approach to model evaluation has also been suggested in [74]. Figure 20 presents the monthly power density of solar radiation values for sunny, cloudy, and overcast days throughout the year.
Figure 20 shows that the power density of solar radiation values are highest on sunny days, lowest on overcast days, and moderately high on cloudy days. In addition to the maximum and minimum solar radiation values, the boxplots also indicate the average value (represented by the line in the middle of the box) and the range of values for each category (indicated by the whisker length). In addition, the blue circles mark individual overcast-day measurements that lie outside the whisker range and therefore represent statistical outliers. It can also be observed that there were no days classified as “sunny” in November and December. Over the entire year, 69 days were categorized as sunny, 182 as cloudy, and 112 as overcast. Figure 21 presents the average daily power density of solar radiation by month for sunny, cloudy, and overcast days.
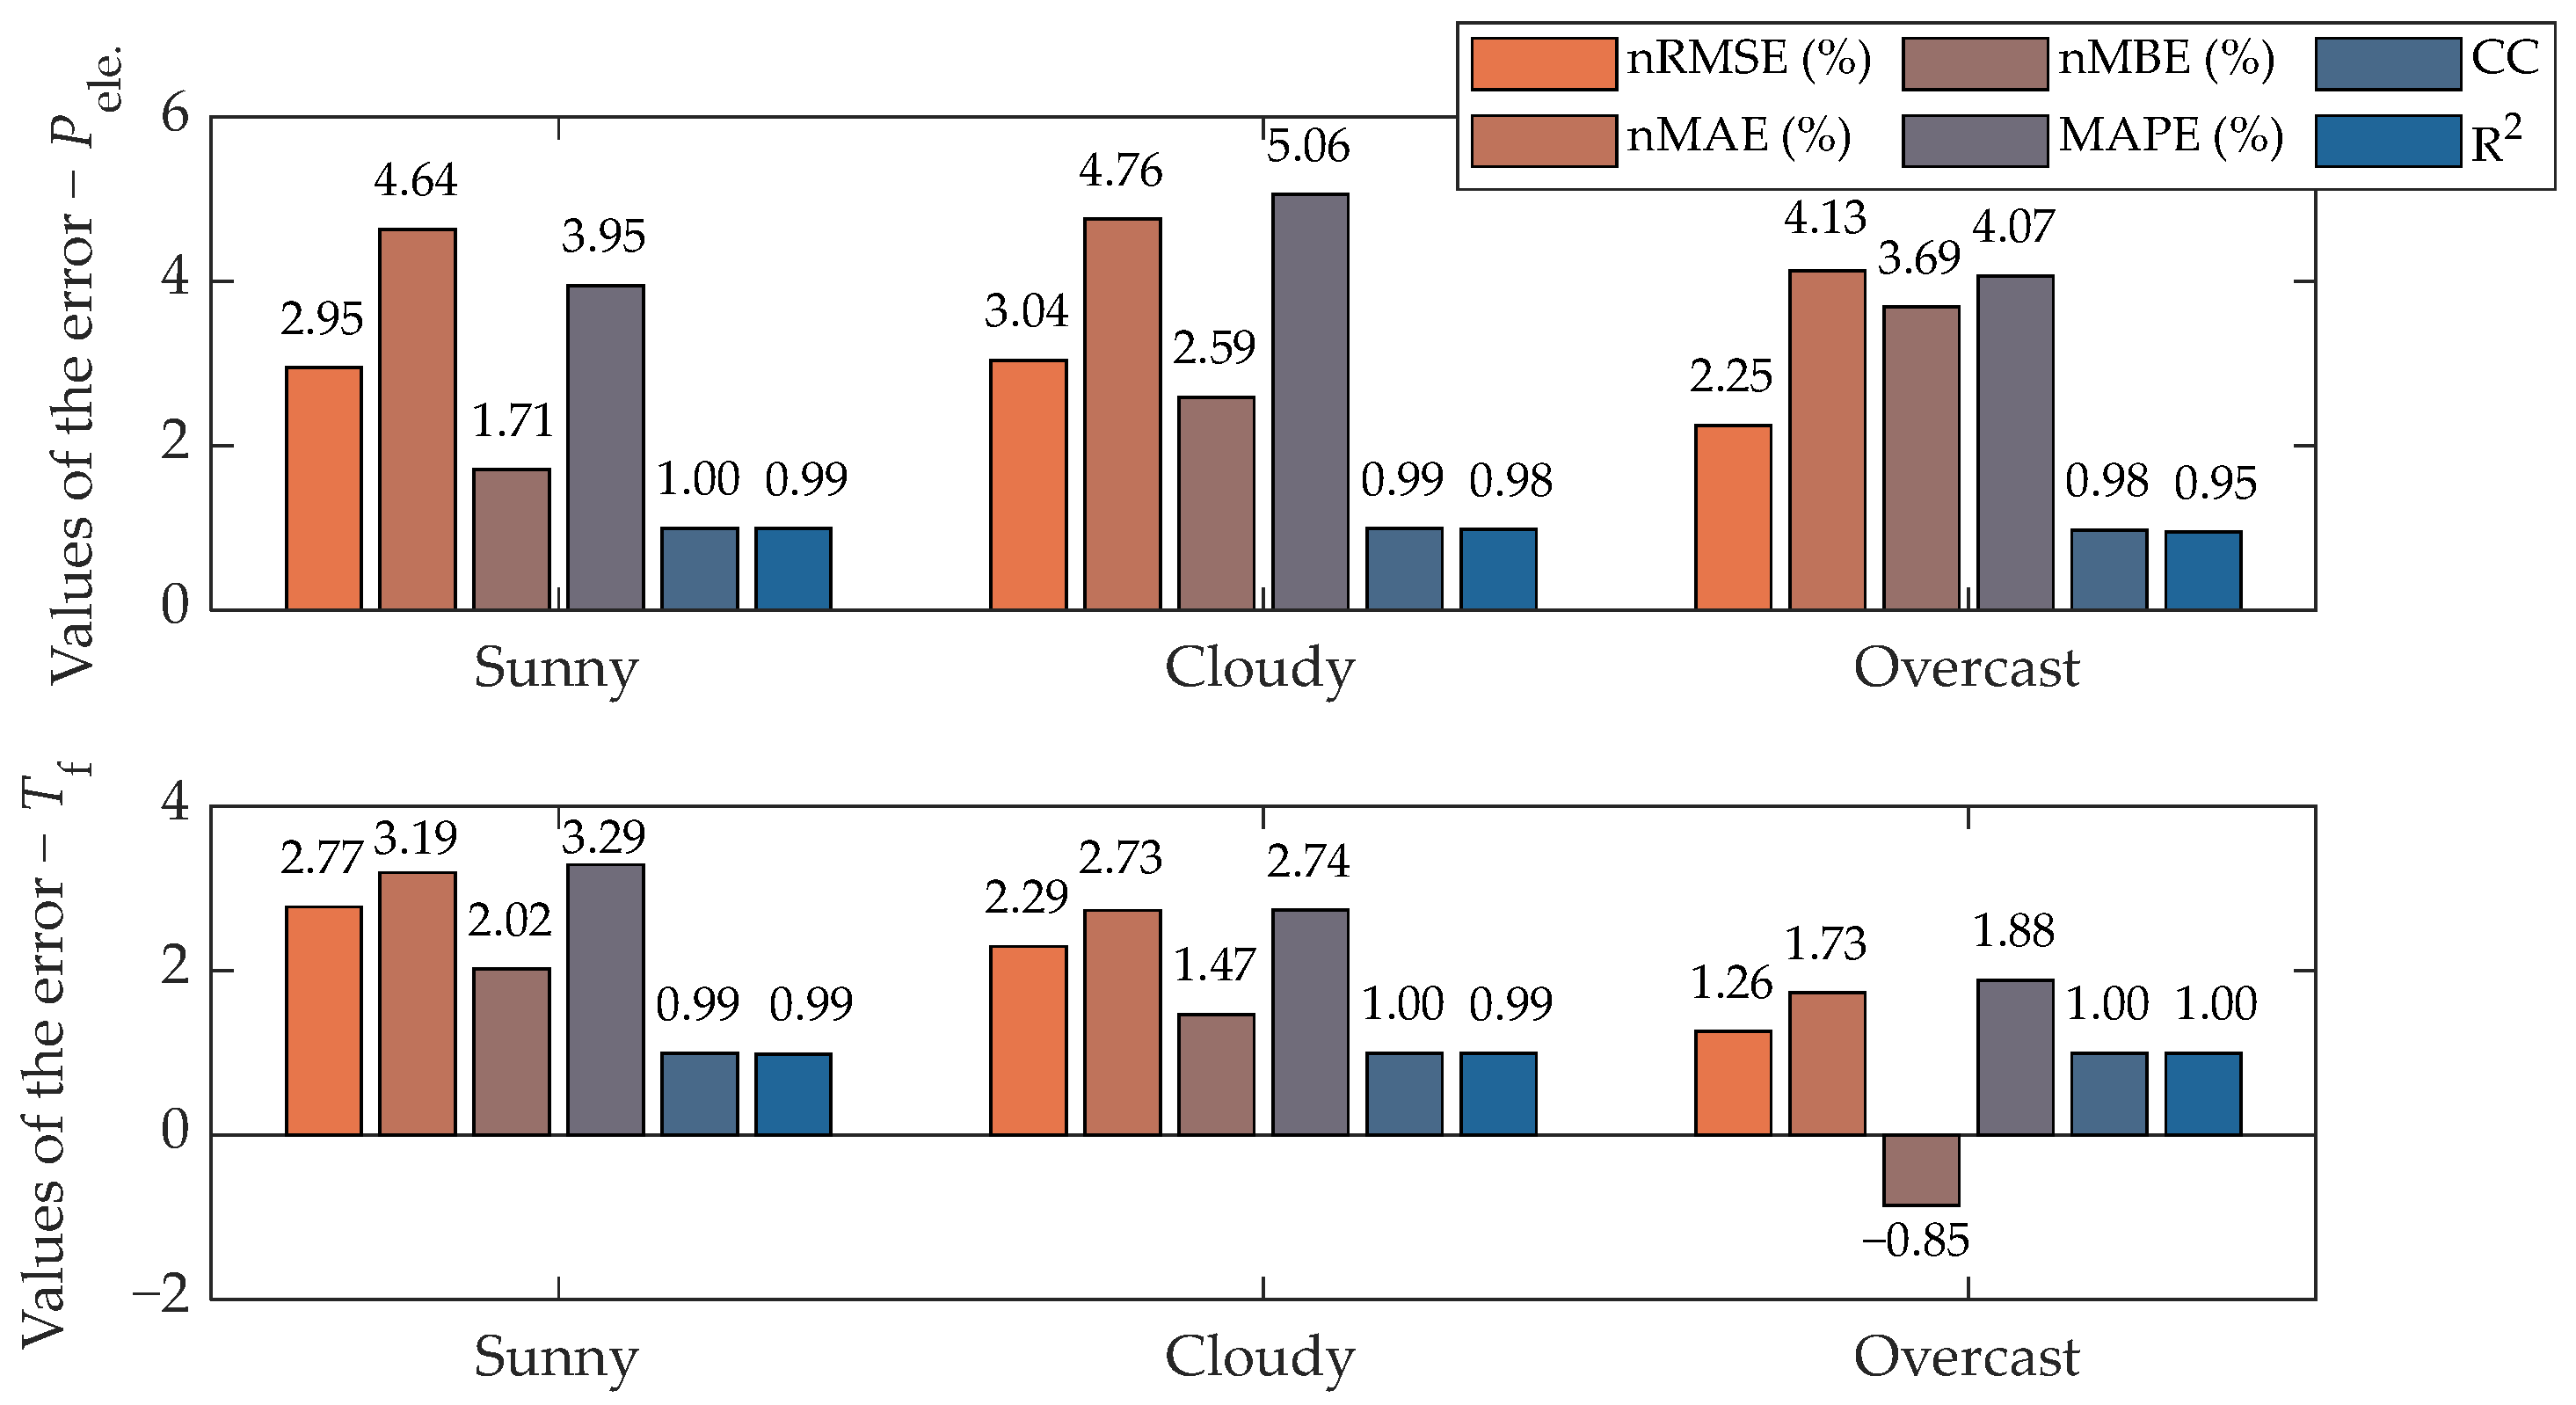
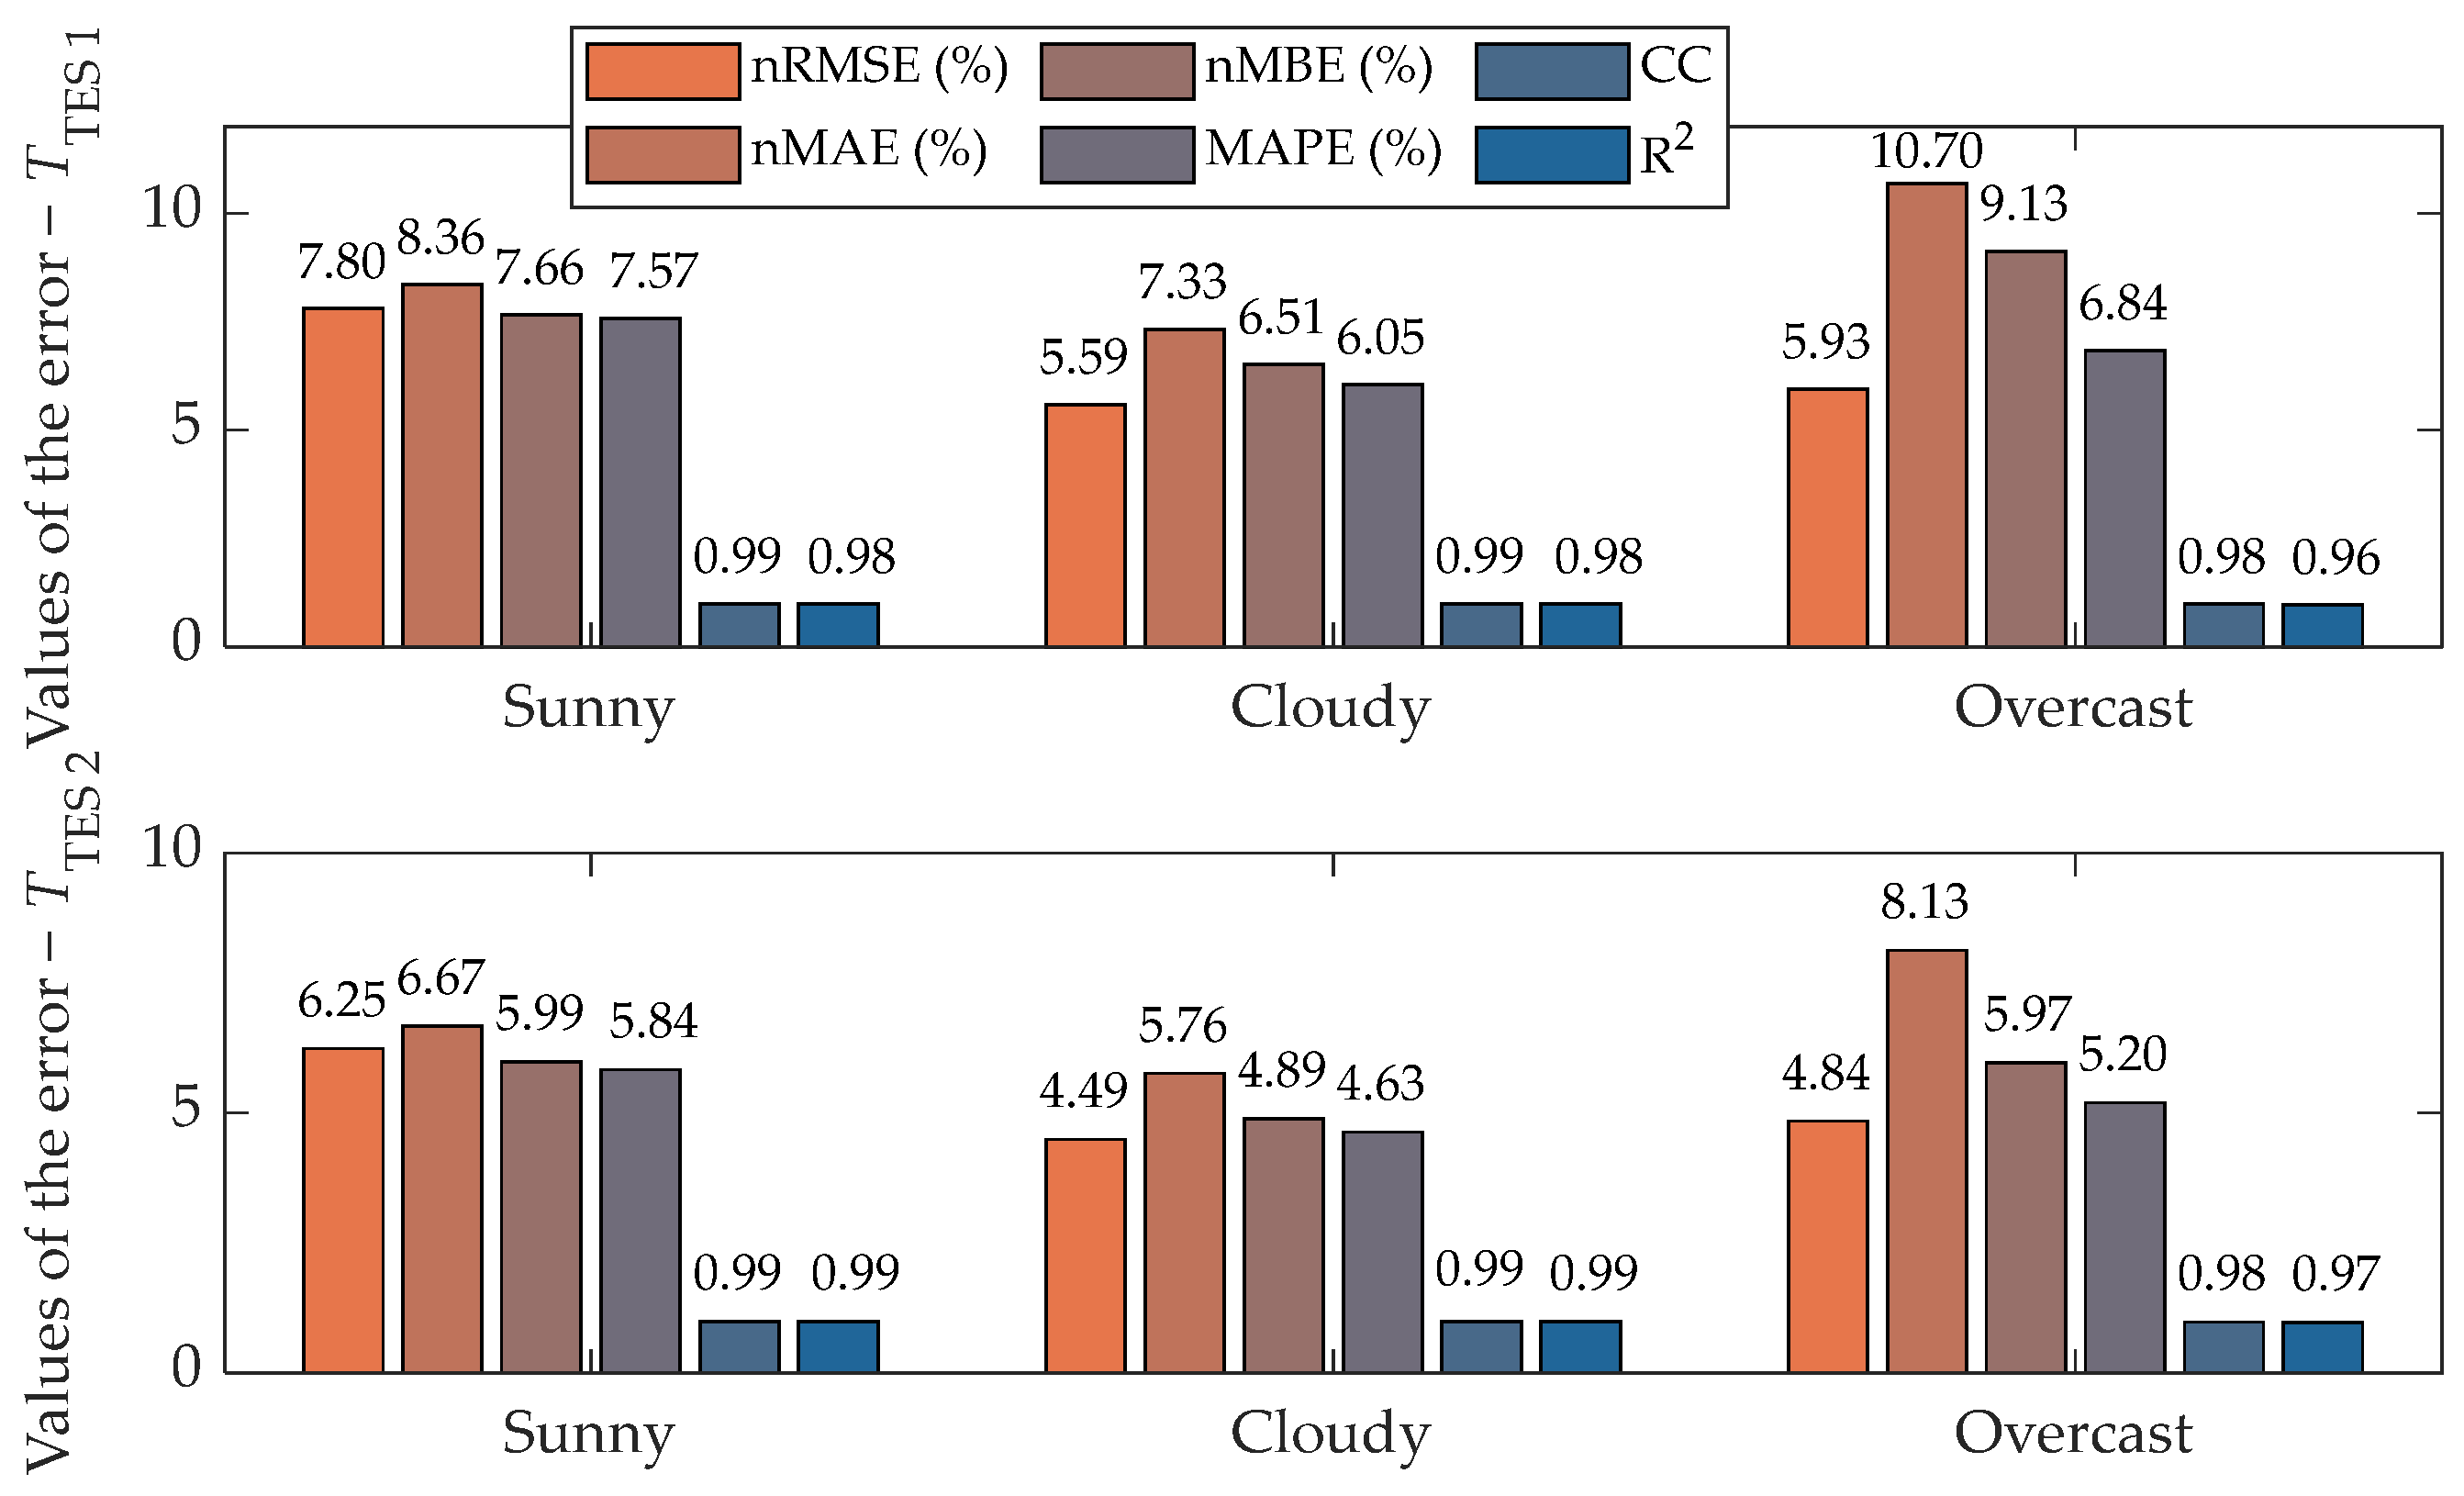
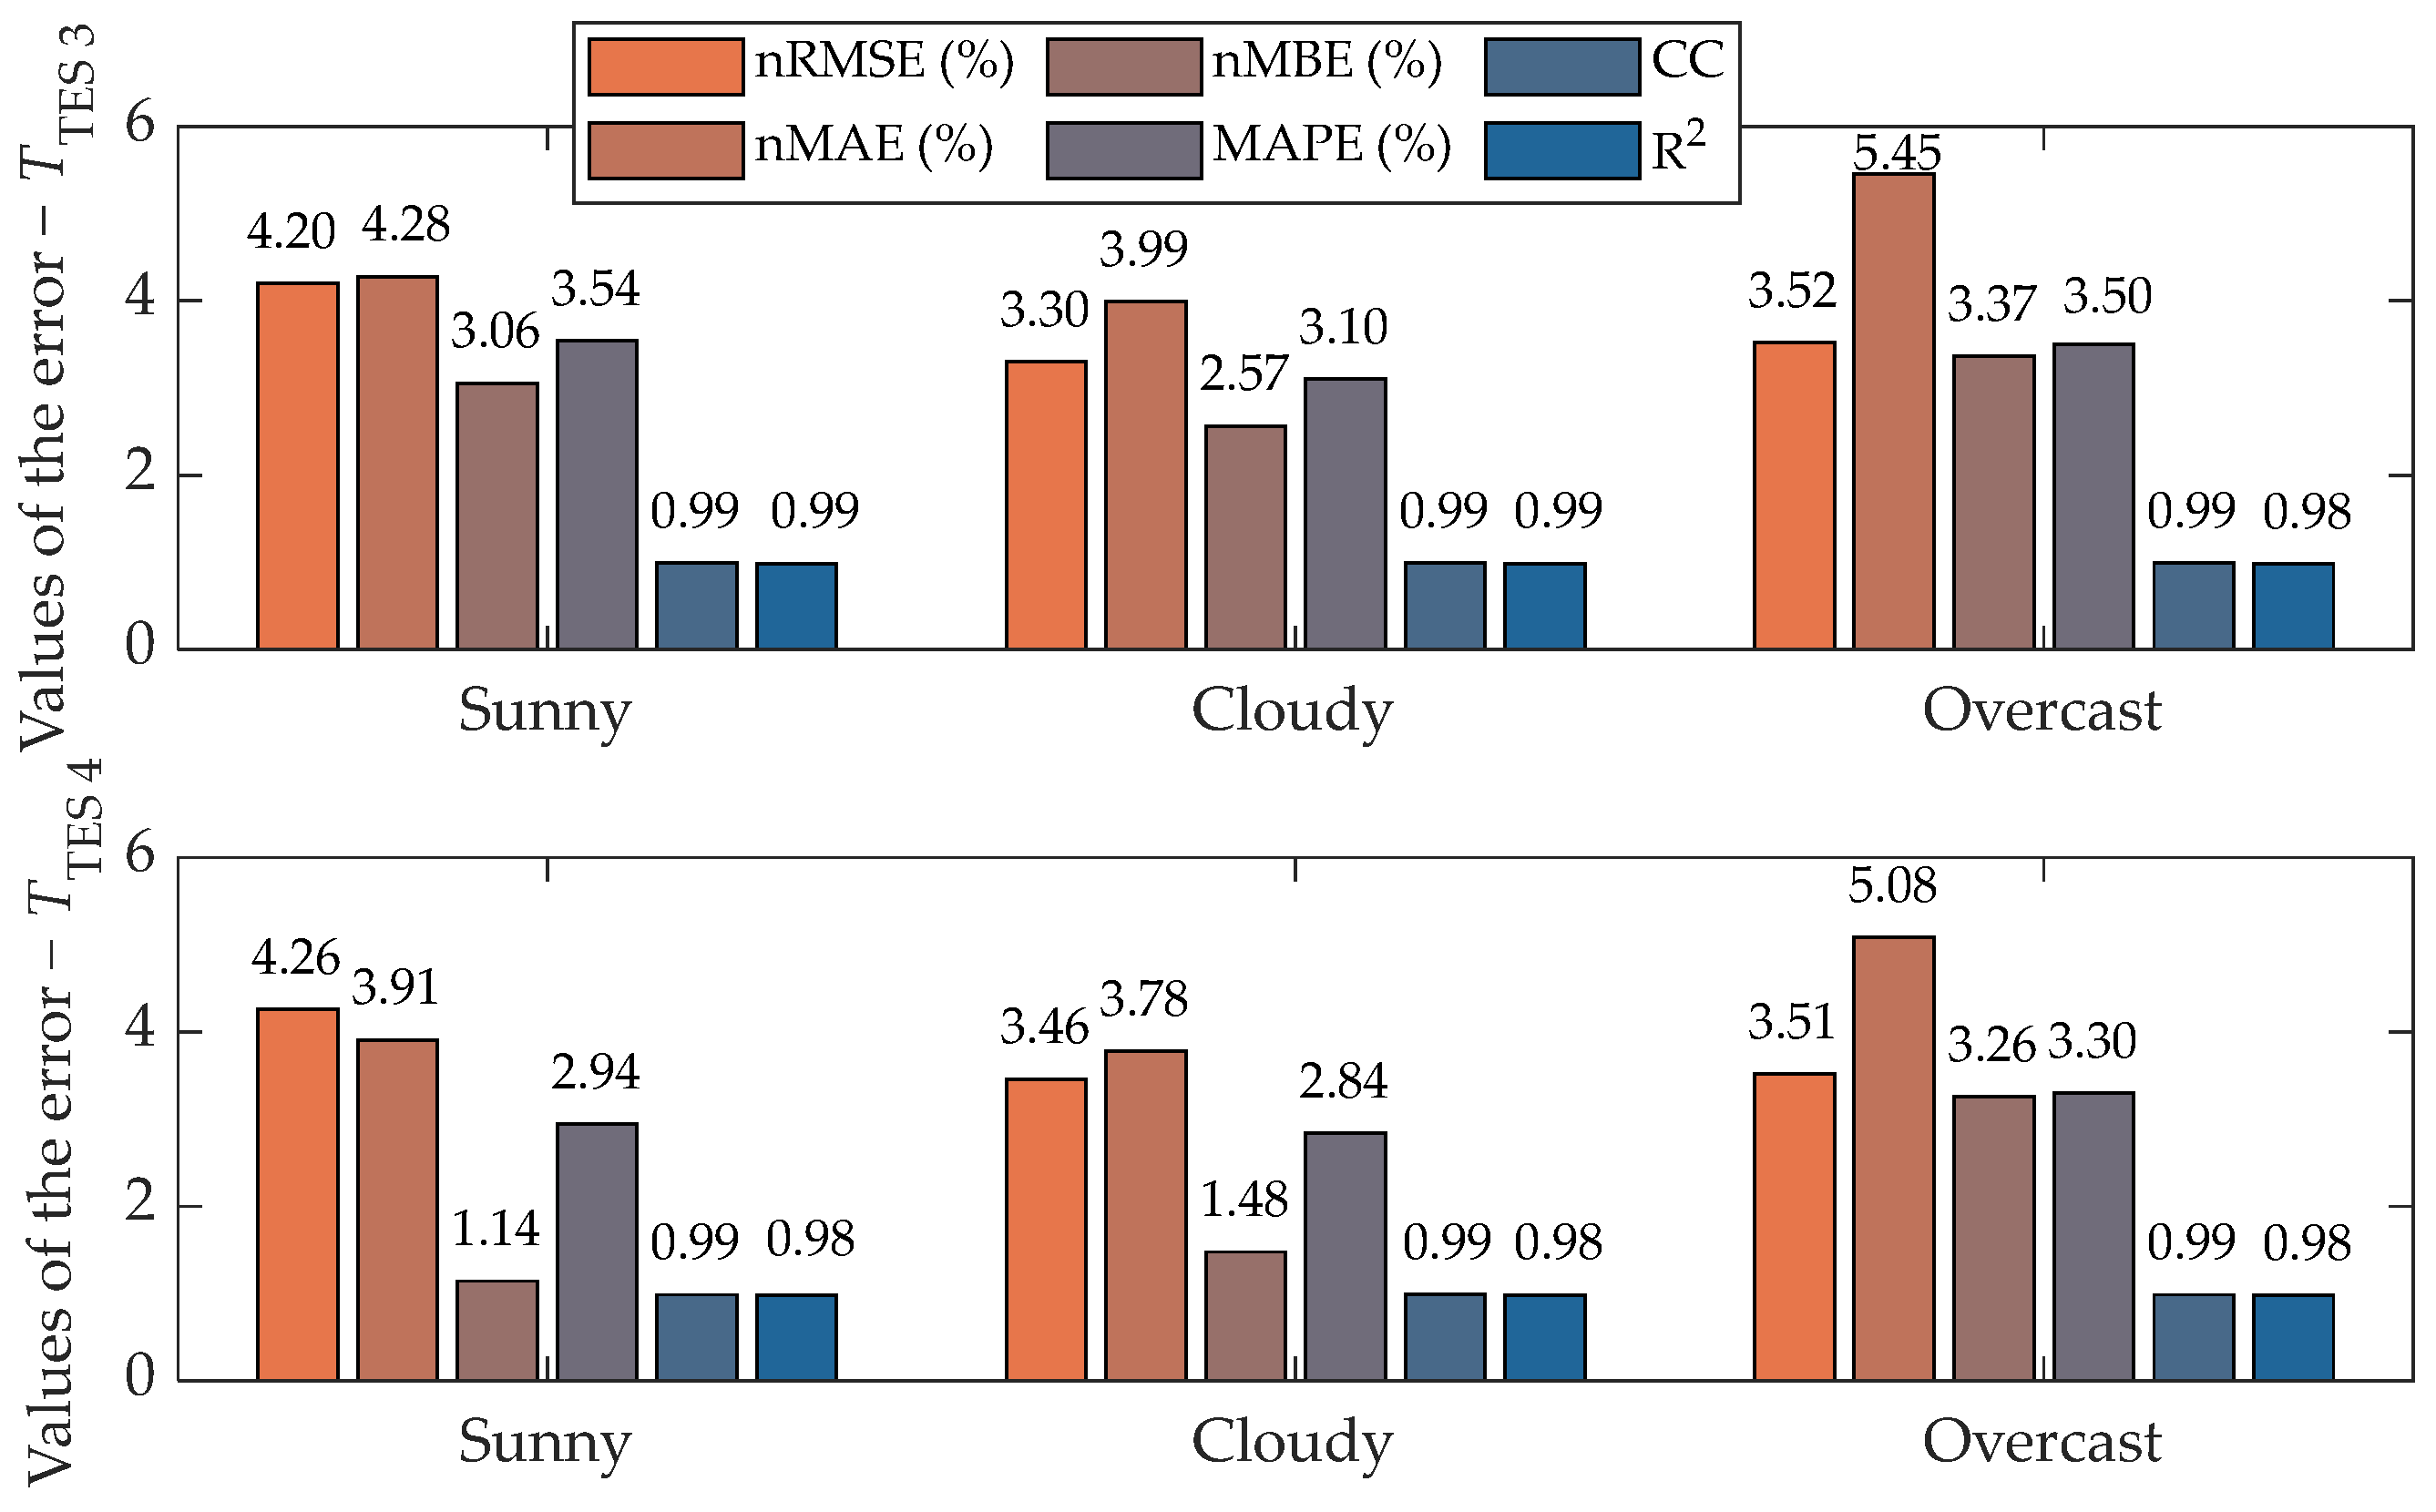
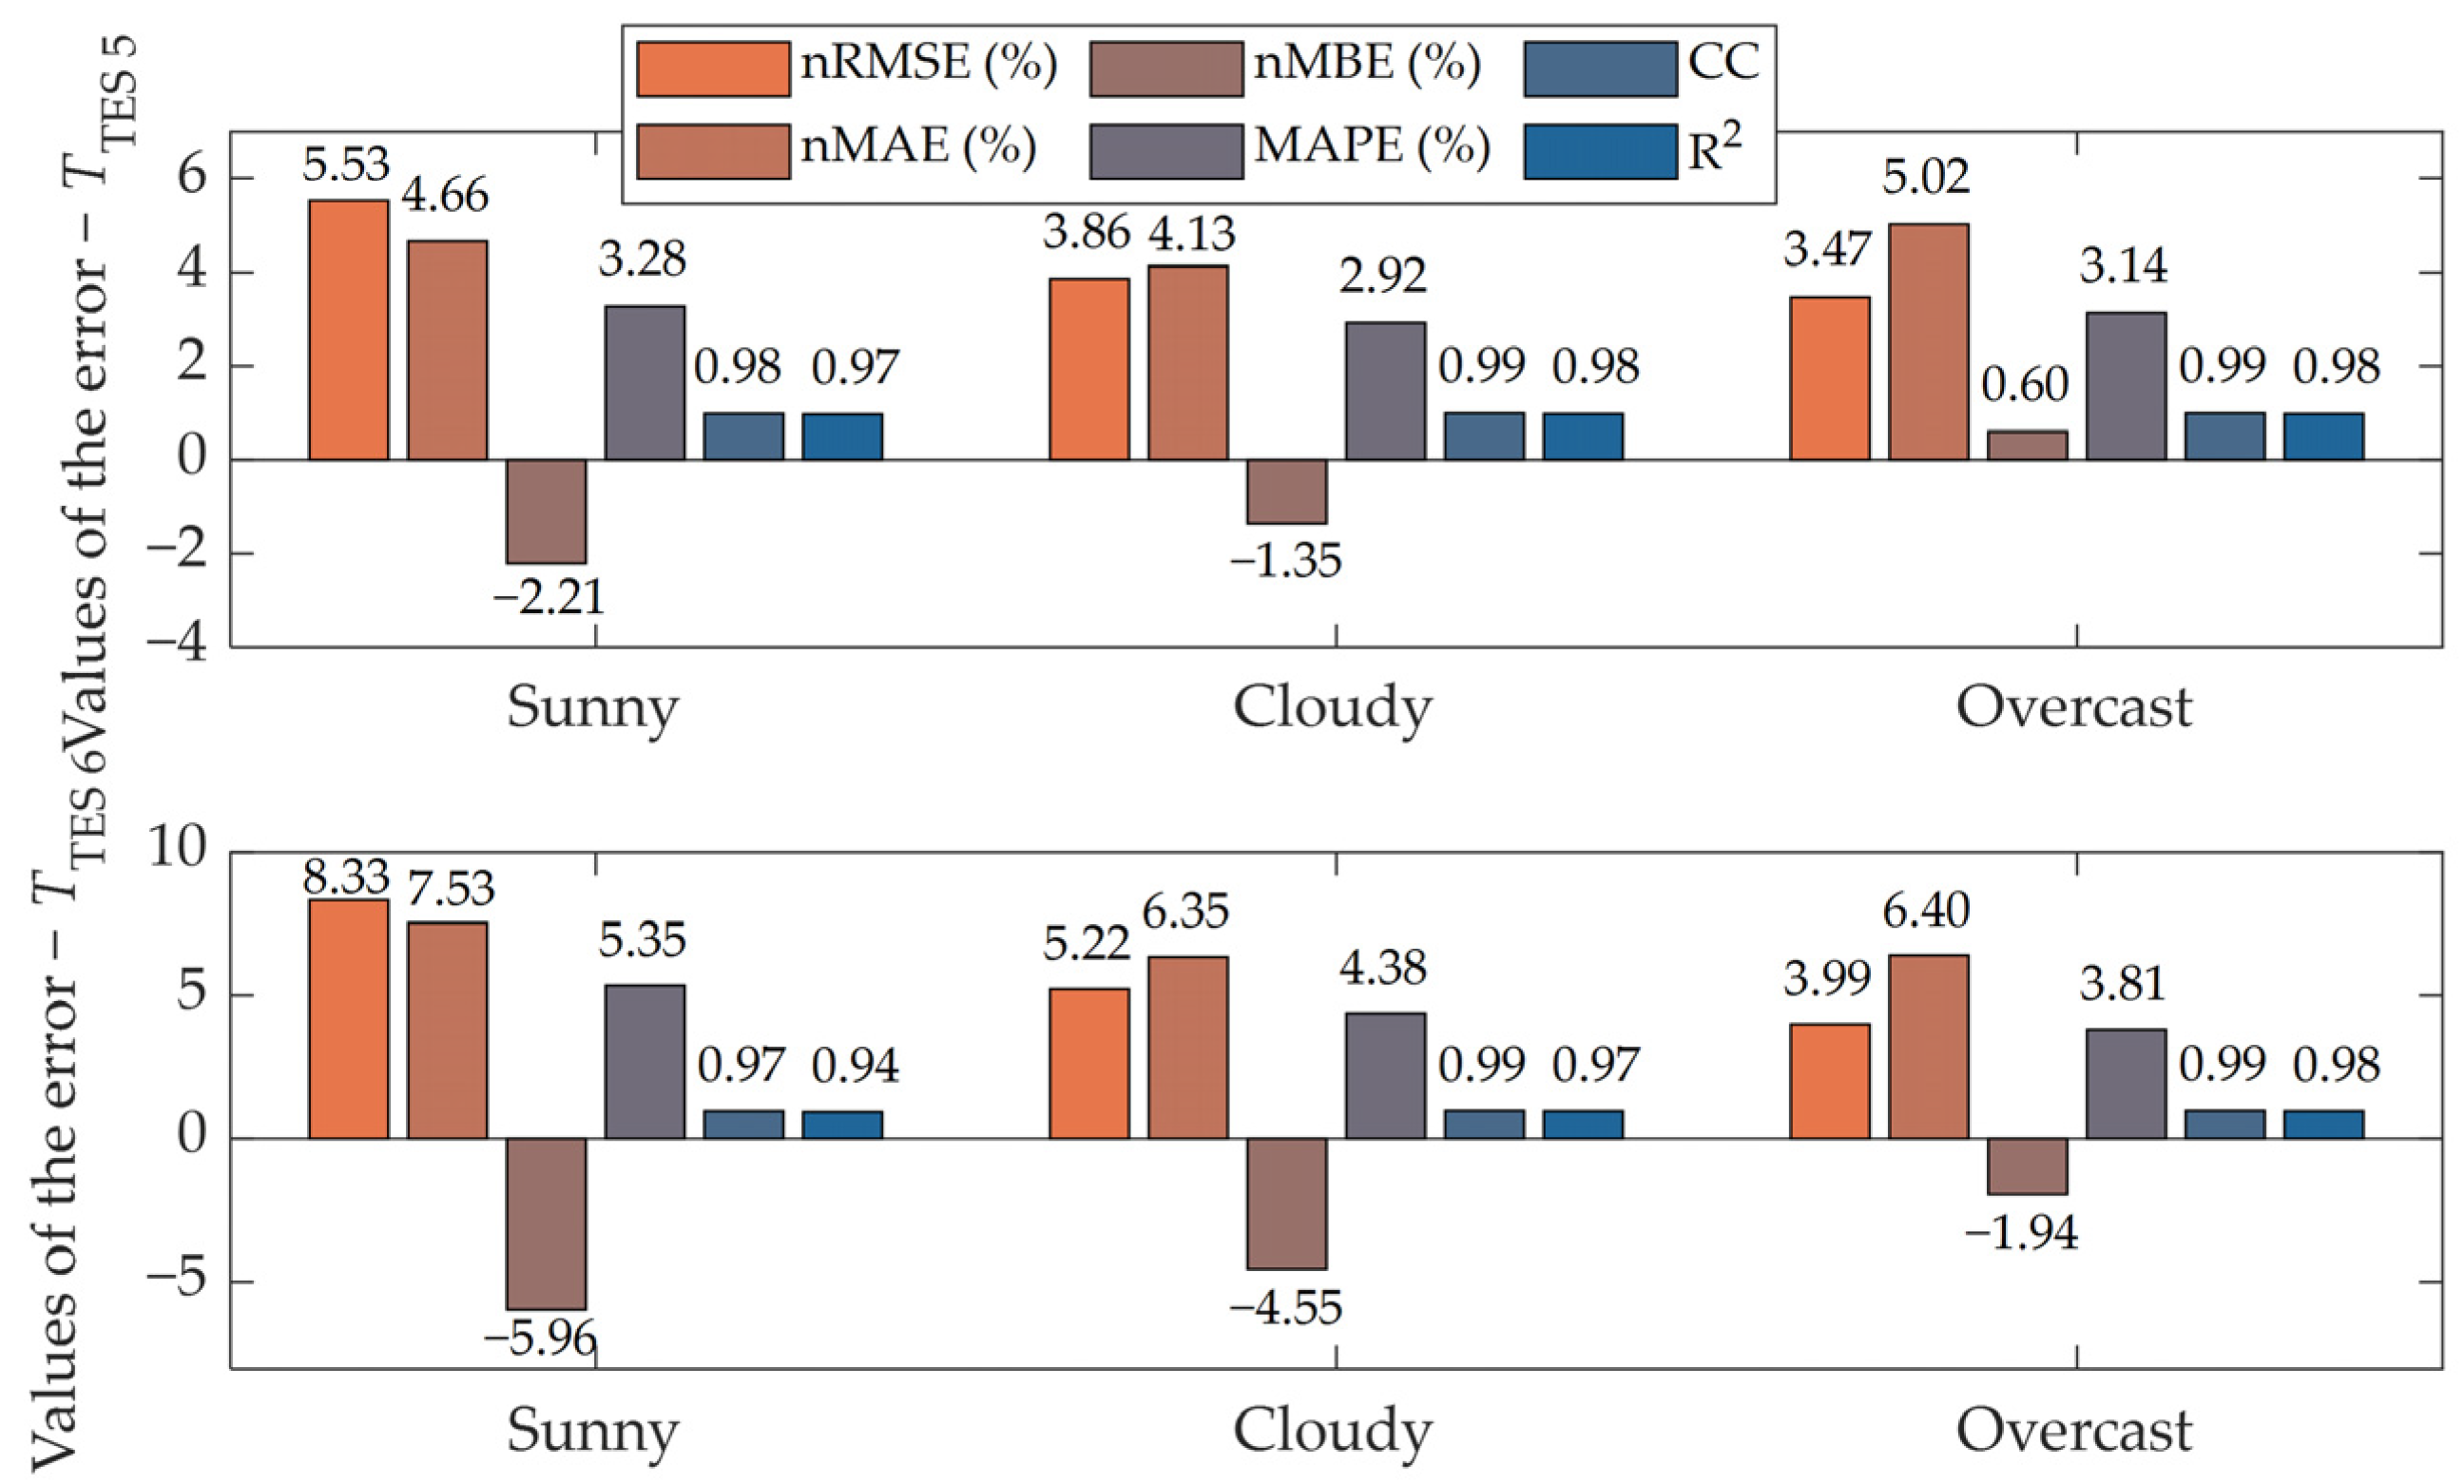
Based on the presented quantitative indicators, Figure 22, Figure 23, Figure 24 and Figure 25 show the error values for the electrical power Pele., the working fluid temperature Tf in the PV/T module, and the working fluid temperatures in all six TES layers TTES 1, TTES 2, TTES 3, TTES 4, TTES 5, and TTES 6.
Figure 22 shows that the error values of the electrical power Pele., expressed through various quantitative indicators, vary only slightly across different weather conditions, indicating high accuracy of the mathematical model of the PV/T module’s electrical subsystem (based on the equivalent circuit of the double-diode model) when compared to other empirical equations for calculating Pele.. The lowest nRMSE and nMAE values are observed under overcast conditions, while the differences between sunny and cloudy days are minimal. The average values across all three weather categories show that the errors in nRMSE, nMAE, nMBE, and MAPE range between 2.66% and 4.51%, which reflects very good accuracy of the electrical subsystem model.
For the working fluid temperature Tf in the PV/T module (Figure 22), the highest errors in all four quantitative indicators (nRMSE, nMAE, nMBE, and MAPE) are observed on sunny days, and the lowest on overcast days. In all three weather scenarios, the errors between the thermal subsystem model of the PV/T module and the measurements remain very low, with average nRMSE, nMAE, nMBE, and MAPE values ranging from 1.45% to 2.64%. The higher error observed on sunny days is due to the stronger influence of the power density of solar radiation and optical properties on the PV/T module temperature, while under overcast conditions, this influence is almost negligible.
Figure 23, Figure 24 and Figure 25 show that the error values for the working fluid temperature in the TES (TTES 1, TTES 2, TTES 3, TTES 4, TTES 5, and TTES 6) are several percentage points higher than the error values for the working fluid temperature Tf in the PV/T module. This increased error can be attributed to the greater complexity of the mathematical description of the TES compared to that of the PV/T module. For clarity, Table 3 presents the average error values of each quantitative indicator under all three weather conditions for the TES.
Table 3 reveals a trend of decreasing error values for all six quantitative indicators in the inner layers of the TES, particularly in TTES 3, TTES 4, and TTES 5. In the first, second, and sixth layers, the error values increase due to mixing effects of the working fluid, which are not captured by the proposed mathematical model. These mixing mechanisms could only be accurately represented using a two-dimensional or three-dimensional model; however, this would significantly increase the computational complexity, which is not the aim of the proposed approach. When comparing the model’s error values to those in similar papers employing one-dimensional models, it can be observed that the obtained results lie within a comparable range or, in certain cases, even perform better.
It is important to emphasize that none of the referenced papers, including those addressing the electrical power Pele., the working fluid temperature Tf in the PV/T module, or the working fluid temperatures in the TES (TTES 1 to TTES 6), provide a long-term performance evaluation of the PV/T system. Instead, they focus on short-term analyses or selected days, which makes it difficult to directly compare their results with those presented in this paper. Nevertheless, the findings from other studies indicate that the results of the proposed PV/T system model fall within a comparable accuracy range or even outperform those reported in the literature. Figure 26, Figure 27 and Figure 28 present the average daily values of the electrical power output Pele., the working fluid temperature Tf in the PV/T module, and the working fluid temperatures in the TES (TTES 1 to TTES 6) for sunny, partly cloudy, and cloudy days.

4. Discussion

This subsection provides a comparative analysis of validation approaches used in other papers that apply modelling techniques similar to those proposed in this work, such as dynamic one-dimensional modeling and single- or double-diode equivalent circuit models. As presented in the Results Section, the proposed mathematical model was validated using six quantitative indicators: nRMSE, nMAE, nMBE, MAPE, CC, and R2, which is more comprehensive than the validation methods typically employed in the literature. Moreover, most papers validate their models using only characteristic days, such as a single sunny or cloudy day, and lower-resolution datasets, making direct comparison challenging. In contrast, the present work conducts full-year validation at a 5-min resolution, enabling assessment under a wide range of operating and climatic conditions. Nevertheless, a comparison of validation results is provided below. For the PV/T module thermal subsystem, the authors in [27] reported nRMSE values of fluid outlet temperature between 4.9% and 7.39%, while [37] achieved values between 1.66% and 5.02%, further supporting the high accuracy of the thermal model presented in this paper. Similarly, authors in [8] validated their steady-state model using two representative days, obtaining deviations of 3.12% for useful heat and 4.46–10.72% for electricity, with average daily prediction errors of 8.25% for thermal energy and 7.49% for electrical energy. In another steady-state approach, authors [9] reported strong agreement with experimental results, achieving correlation coefficients between 0.95 and 0.99, with deviation errors ranging from 0.78% to 7.4% for air mass flow rate, outlet air temperature, and PV temperature. Authors in [16] also applied a steady-state one-dimensional model, assessing accuracy using NMBE, nRMSE, and R2, with validation on clear and cloudy winter days as well as in summer, yielding R2 values between 0.917 and 0.998, nRMSE from 1.47% to 11.41%, and NMBE from −3.21% to 2.9%. For models incorporating both thermal and electrical subsystems, authors in [19] achieved deviations within ±7% for thermal efficiency and ±6% for electrical efficiency, confirming the accuracy of their dynamic modeling approach. These results, while demonstrating good agreement, generally involve shorter validation periods and less diverse operating conditions compared to the comprehensive, long-term validation performed in the present paper.
When extending the comparison to TES modelling approaches, it becomes evident that model accuracy largely depends on the number of layers used in the TES discretization and on the inclusion of mixing mechanisms at the inlet and outlet. When comparing the error values obtained in this study with those reported in similar works employing one-dimensional models, the results fall within a comparable range and, in some cases, show improved accuracy. For example, the authors in [55] reported an nRMSE of approximately 20% for a TES model with five layers, which decreased to 5% when the number of layers was increased to 75. Another study [63] reported nRMSE values between 3.34% and 6.35% for a 60-layer TES on a specifically selected day of the year. The most comparable paper is [62], which uses a 7-layer TES and shows that the error values in the first and last layers are significantly higher than those in the middle of the TES. In their case, nRMSE values from the first to the seventh layer were 8.34%, 5.12%, 3.35%, 4.49%, 6.28%, and 8.94%. A similar trend was observed in the present work, where nRMSE values for the corresponding layers were 6.44%, 5.19%, 3.72%, 3.74%, 4.29%, and 5.58%, confirming that the error distribution along the TES height is strongly influenced by boundary layer effects.
In conclusion, the proposed dynamic PV/T system model demonstrates very high accuracy, particularly considering that the PV/T modules and the TES are directly coupled components within the system, whereas other papers validate only individual components.

5. Conclusions

This paper presents a novel and comprehensive methodology for the dynamic modeling and long-term experimental validation of a PV/T system, encompassing both the PV/T module and the TES as directly coupled subsystems. The main achievements of this paper can be summarized as follows:
(i)
Comprehensive modeling of the entire PV/T system (novel methodology).
(ii)
Accurate consideration of optical losses in the PV/T module.
(iii)
Validation of the mathematical model using measurements from a highly accurate experimental PV/T system (applied approach).
(iv)
Long-term validation covering the entire year under different weather conditions.
The proposed one-dimensional dynamic model integrates a detailed thermal and electrical description, including optical properties, and enables precise prediction of system behavior under varying climatic conditions. Validation was performed using an extensive year-long experimental dataset with a five-minute resolution, classified into sunny, cloudy, and overcast days, and assessed with six quantitative error indicators. Validation results, presented as average error values across all three weather conditions, confirmed strong agreement between the mathematical model of the PV/T system and the experimental PV/T system measurements. For the electrical power Pele., the model achieved nRMSE of 2.75%, nMAE of 4.51%, nMBE of 2.66% and MAPE of 4.36%, with CC of 0.99 and R2 of 0.973. The deviations for the working fluid temperature Tf were even lower, with nRMSE of 2.10%, nMAE of 2.55%, nMBE of 1.44% and MAPE of 2.63%, accompanied by CC of 0.996 and R2 of 0.993. For the working fluid temperatures in TES TTES, somewhat higher deviations were observed (nRMSE of 4.87%, nMAE of 5.71%, nMBE of 3.98% and MAPE of 4.14%), yet correlation remained strong (CC of 0.986 and R2 of 0.977). The results demonstrate that the proposed dynamical model achieves accuracy levels comparable to or exceeding those reported in the literature for both the PV/T module and TES subsystems. In contrast to previous papers, which typically validate only individual components and rely on short-term or characteristic-day datasets, this paper validates the complete PV/T system over extended periods, capturing the full range of seasonal and weather-related variability. The findings confirm that the dynamic model reliably reproduces the thermal and electrical dynamics of the integrated system, with error distributions closely matching the physical behavior observed in experiments.
Beyond its high validation accuracy, the proposed modeling approach offers a robust framework for system analysis, optimization, and control strategy development, while maintaining low computational demands suitable for long-term simulations. Future research will aim to extend the model by incorporating single- and multi-objective optimization of electrical and thermal energy production, with mass flow rate considered as a key optimization parameter.

Author Contributions

Conceptualization, K.S.; methodology, K.S.; software, K.S.; validation, K.S. and S.S.; formal analysis, K.S.; investigation, K.D., M.B. and N.L.; resources, K.S. and S.S.; data curation, E.S., K.D., M.B. and N.L.; writing—original draft preparation, K.S.; writing—review and editing, E.S., K.D., M.B., N.L. and S.S.; visualization, K.S.; supervision, S.S.; project administration, S.S.; funding acquisition, K.S. and S.S. All authors have read and agreed to the published version of the manuscript.

Funding

This research received no external funding.

Institutional Review Board Statement

Not applicable.

Informed Consent Statement

Not applicable.

Data Availability Statement

The data presented in this study are available upon request from the corresponding author. The data are not publicly available due to institutional and project-specific restrictions.

Acknowledgments

The authors acknowledge the use of research equipment DC power supply system for simulations of diffuse sources with an equipment set for managing energy systems together with a hybrid solar system, procured within the operation “Upgrading national research infrastructures—RIUM”, which was co-financed by the Republic of Slovenia and the European Union from the European Regional Development Fund.

Conflicts of Interest

The authors declare no conflicts of interest.

Abbreviations

The following abbreviations are used in this manuscript:
ACAlternating Current
CCCorrection Coefficient
CCUCentral Control Unit
CFDComputational Fluid Dynamics
DCDirect Current
DHWDomestic Hot Water
EVAEthylene-Vinyl Acetate
LSTLocal Solar Time
LSTMLocal Standard Time Meridians
LTLocal Time
MAPEMean Absolute Percentage Error
MMSMeteorological Measurement Station
nMAEnormalized Mean Absolute Error
nMBEnormalized Mean Bias Error
nRMSEnormalized Root Mean Square Error
PFVPolyvinyl Fluoride
PVPhotovoltaic
PV/TPhotovoltaic/thermal
R2Determination coefficient
SCADASupervisory Control And Data Acquisition
TESThermal Energy Storage
UTCUniversal Coordinated Time
MPPTMaximum Power Point Tracking

References

  1. Mesquita, I.; Andrade, L.; Mendes, A. Temperature Impact on Perovskite Solar Cells Under Operation. Chemsuschem 2019, 12, 2186–2194. [Google Scholar] [CrossRef]
  2. Jordan, D.; Kurtz, S. Photovoltaic Degradation Rates—An Analytical Review. Prog. Photovolt. 2013, 21, 12–29. [Google Scholar] [CrossRef]
  3. Radziemska, E. The effect of temperature on the power drop in crystalline silicon solar cells. Renew. Energy 2003, 28, 1–12. [Google Scholar] [CrossRef]
  4. Wu, S.; Zhang, Q.; Xiao, L.; Guo, F. A heat pipe photovoltaic/thermal (PV/T) hybrid system and its performance evaluation. Energy Build. 2011, 43, 3558–3567. [Google Scholar] [CrossRef]
  5. Kamel, M.; Elbanhawy, A.; El-Nasr, M. A novel methodology to compare between side-by-side photovoltaics and thermal collectors against hybrid photovoltaic thermal collectors. Energy Conv. Manag. 2019, 202, 12196. [Google Scholar] [CrossRef]
  6. Hu, H.; Wang, R.; Fang, G. Dynamic Characteristics Modeling of a Hybrid Photovoltaic-Thermal Heat Pump System. Int. J. Green Energy 2010, 7, 537–551. [Google Scholar] [CrossRef]
  7. Salameh, T.; Tawalbeh, M.; Juaidi, A.; Abdallah, R.; Hamid, A. A novel three-dimensional numerical model for PV/T water system in hot climate region. Renew. Energy 2021, 164, 1320–1333. [Google Scholar] [CrossRef]
  8. Sakellariou, E.; Axaopoulos, P. Simulation and experimental performance analysis of a modified PV panel to a PVT collector. Sol. Energy 2017, 155, 715–726. [Google Scholar] [CrossRef]
  9. Shahsavar, A.; Ameri, M. Experimental investigation and modeling of a direct-coupled PV/T air collector. Sol. Energy 2010, 84, 1938–1958. [Google Scholar] [CrossRef]
  10. Dubey, S.; Tiwari, G.N. Analysis of PV/T flat plate water collectors connected in series. Sol. Energy 2009, 83, 1485–1498. [Google Scholar] [CrossRef]
  11. Tonui, J.K.; Tripanagnostopoulos, Y. Performance improvement of PV/T solar collectors with natural air flow operation. Sol. Energy 2008, 82, 1–12. [Google Scholar] [CrossRef]
  12. Tonui, J.K.; Tripanagnostopoulos, Y. Air-cooled PV/T solar collectors with low cost performance improvements. Sol. Energy 2007, 81, 498–511. [Google Scholar] [CrossRef]
  13. Misha, S.; Abdullah, A.L.; Tamaldin, N.; Rosli, M.A.M.; Sachit, F.A. Simulation CFD and experimental investigation of PVT water system under natural Malaysian weather conditions. Energy Rep. 2020, 6, 28–44. [Google Scholar] [CrossRef]
  14. Shan, F.; Tang, F.; Cao, L.; Fang, G. Comparative simulation analyses on dynamic performances of photovoltaic-thermal solar collectors with different configurations. Energy Conv. Manag. 2014, 87, 778–786. [Google Scholar] [CrossRef]
  15. Touafek, K.; Haddadi, M.; Malek, A. Modeling and Experimental Validation of a New Hybrid Photovoltaic Thermal Collector. Ieee Trans. Energy Convers. 2011, 26, 176–183. [Google Scholar] [CrossRef]
  16. Aste, N.; Del Pero, C.; Leonforte, F.; Manfren, M. Performance monitoring and modeling of an uncovered photovoltaic-thermal (PVT) water collector. Sol. Energy 2016, 135, 551–568. [Google Scholar] [CrossRef]
  17. Aste, N.; Leonforte, F.; Del Pero, C. Design, modeling and performance monitoring of a photovoltaic-thermal (PVT) water collector. Sol. Energy 2015, 112, 85–99. [Google Scholar] [CrossRef]
  18. Amrizal, N.; Chemisana, D.; Rosell, J.I. Hybrid photovoltaic-thermal solar collectors dynamic modeling. Appl. Energy 2013, 101, 797–807. [Google Scholar] [CrossRef]
  19. Amrizal, N.; Chemisana, D.; Rosell, J.I.; Barrau, J. A dynamic model based on the piston flow concept for the thermal characterization of solar collectors. Appl. Energy 2012, 94, 244–250. [Google Scholar] [CrossRef]
  20. Jarimi, H.; Abu Bakar, M.N.; Othman, M.; Din, M.H. Bi-fluid photovoltaic/thermal (PV/T) solar collector: Experimental validation of a 2-D theoretical model. Renew. Energy 2016, 85, 1052–1067. [Google Scholar] [CrossRef]
  21. Zhou, J.; Ma, X.; Zhao, X.; Yuan, Y.; Yu, M.; Li, J. Numerical simulation and experimental validation of a micro-channel PV/T modules based direct-expansion solar heat pump system. Renew. Energy 2020, 145, 1992–2004. [Google Scholar] [CrossRef]
  22. Zhang, H.; Liang, K.; Chen, H.; Gao, D.; Guo, X. Thermal and electrical performance of low-concentrating PV/T and flat-plate PV/T systems: A comparative study. Energy 2019, 177, 66–76. [Google Scholar] [CrossRef]
  23. Zhang, P.; Rong, X.; Yang, X.; Zhang, D. Design and performance simulation of a novel hybrid PV/T-air dual source heat pump system based on a three-fluid heat exchanger. Sol. Energy 2019, 191, 505–517. [Google Scholar] [CrossRef]
  24. Su, D.; Jia, Y.; Huang, X.; Alva, G.; Tang, Y.; Fang, G. Dynamic performance analysis of photovoltaic-thermal solar collector with dual channels for different fluids. Energy Conv. Manag. 2016, 120, 13–24. [Google Scholar] [CrossRef]
  25. Kuo, C.-F.J.; Lee, Y.-W.; Umar, M.L.; Yang, P.-C. Dynamic modeling, practical verification and energy benefit analysis of a photovoltaic and thermal composite module system. Energy Conv. Manag. 2017, 154, 470–481. [Google Scholar]
  26. Cai, J.; Ji, J.; Wang, Y.; Zhou, F.; Yu, B. A novel PV/T-air dual source heat pump water heater system: Dynamic simulation and performance characterization. Energy Conv. Manag. 2017, 148, 635–645. [Google Scholar] [CrossRef]
  27. Simonetti, R.; Molinaroli, L.; Manzolini, G. Development and validation of a comprehensive dynamic mathematical model for hybrid PV/T solar collectors. Appl. Therm. Eng. 2018, 133, 543–554. [Google Scholar] [CrossRef]
  28. Yu, Q.; Hu, M.; Li, J.; Wang, Y.; Pei, G. Development of a 2D temperature-irradiance coupling model for performance characterizations of the flat-plate photovoltaic/thermal (PV/T) collector. Renew. Energy 2020, 153, 404–419. [Google Scholar] [CrossRef]
  29. Guarracino, I.; Freeman, J.; Ramos, A.; Kalogirou, S.A.; Ekins-Daukes, N.J.; Markides, C.N. Systematic testing of hybrid PV-thermal (PVT) solar collectors in steady-state and dynamic outdoor conditions. Appl. Energy 2019, 240, 1014–1030. [Google Scholar] [CrossRef]
  30. Guarracino, I.; Mellor, A.; Ekins-Daukes, N.J.; Markides, C.N. Dynamic coupled thermal-and-electrical modelling of sheet-and-tube hybrid photovoltaic/thermal (PVT) collectors. Appl. Therm. Eng. 2016, 101, 778–795. [Google Scholar] [CrossRef]
  31. Pierrick, H.; Christophe, M.; Leon, G.; Patrick, D. Dynamic numerical model of a high efficiency PV-T collector integrated into a domestic hot water system. Sol. Energy 2015, 111, 68–81. [Google Scholar] [CrossRef]
  32. Das, D.; Kalita, P.; Dewan, A.; Tanweer, S. Development of a novel thermal model for a PV/T collector and its experimental analysis. Sol. Energy 2019, 188, 631–643. [Google Scholar] [CrossRef]
  33. da Silva, R.M.; Fernandes, J.L.M. Hybrid photovoltaic/thermal (PV/T) solar systems simulation with Simulink/Matlab. Sol. Energy 2010, 84, 1985–1996. [Google Scholar] [CrossRef]
  34. Ji, J.; He, H.; Chow, T.; Pei, G.; He, W.; Liu, K. Distributed dynamic modeling and experimental study of PV evaporator in a PV/T solar-assisted heat pump. Int. J. Heat Mass Transf. 2009, 52, 1365–1373. [Google Scholar] [CrossRef]
  35. Fan, W.; Kokogiannakis, G.; Ma, Z.; Cooper, P. Development of a dynamic model for a hybrid photovoltaic thermal collector—Solar air heater with fins. Renew. Energy 2017, 101, 816–834. [Google Scholar] [CrossRef]
  36. Hussain, M.I.; Kim, J.-T. Performance Optimization of Unglazed Nanofluid Photovoltaic/Thermal System: Energy and Exergy Analyses. Int. J. Photoenergy 2018, 2018, 95013. [Google Scholar] [CrossRef]
  37. Sakellariou, E.; Axaopoulos, P. An experimentally validated, transient model for sheet and tube PVT collector. Sol. Energy 2018, 174, 709–718. [Google Scholar] [CrossRef]
  38. Chaibi, Y.; El Rhafiki, T.; Simón-Allué, R.; Guedea, I.; Luaces, C.; Gajate, O.; Kousksou, T.; Zeraouli, Y. Physical models for the design of photovoltaic/thermal collector systems. Sol. Energy 2021, 226, 134–146. [Google Scholar] [CrossRef]
  39. Chow, T. Performance analysis of photovoltaic-thermal collector by explicit dynamic model. Sol. Energy 2003, 75, 143–152. [Google Scholar] [CrossRef]
  40. Dubey, S.; Tiwari, G. Thermal modeling of a combined system of photovoltaic thermal (PV/T) solar water heater. Sol. Energy 2008, 82, 602–612. [Google Scholar] [CrossRef]
  41. El Fouas, C.; Hajji, B.; Gagliano, A.; Tina, G.; Aneli, S. Numerical model and experimental validation of the electrical and thermal performances of photovoltaic/thermal plant. Energy Conv. Manag. 2020, 220, 12939. [Google Scholar] [CrossRef]
  42. Jidhesh, P.; Arjunan, T.; Gunasekar, N. Thermal modeling and experimental validation of semitransparent photovoltaic- thermal hybrid collector using CuO nanofluid. J. Clean. Prod. 2021, 316, 28360. [Google Scholar] [CrossRef]
  43. Ben Youssef, W.; Maatallah, T.; Menezo, C.; Ben Nasrallah, S. Modeling and optimization of a solar system based on concentrating photovoltaic/thermal collector. Sol. Energy 2018, 170, 301–313. [Google Scholar] [CrossRef]
  44. Khelifa, A.; Touafek, K.; Ben Moussa, H. Approach for the modelling of hybrid photovoltaic-thermal solar collector. IET Renew. Power Gener. 2015, 9, 207–217. [Google Scholar] [CrossRef]
  45. Li, S.; Karava, P.; Currie, S.; Lin, W.; Savory, E. Energy modeling of photovoltaic thermal systems with corrugated unglazed transpired solar collectors—Part 1: Model development and validation. Sol. Energy 2014, 102, 282–296. [Google Scholar] [CrossRef]
  46. Mustapha, M.; Fudholi, A.; Nazri, N.; Zaini, M.; Rosli, N.; Sulong, W.; Sopian, K. Mathematical modeling and experimental validation of bifacial photovoltaic-thermal system with mirror reflector. Case Stud. Therm. Eng. 2023, 43, 2800. [Google Scholar] [CrossRef]
  47. Rejeb, O.; Sardarabadi, M.; Ménézo, C.; Passandideh-Fard, M.; Dhaou, M.; Jemni, A. Numerical and model validation of uncovered nanofluid sheet and tube type photovoltaic thermal solar system. Energy Conv. Manag. 2016, 110, 367–377. [Google Scholar] [CrossRef]
  48. Sarhaddi, F.; Farahat, S.; Ajam, H.; Behzadmehr, A.; Adeli, M. An improved thermal and electrical model for a solar photovoltaic thermal (PV/T) air collector. Appl. Energy 2010, 87, 2328–2339. [Google Scholar] [CrossRef]
  49. Shan, F.; Cao, L.; Fang, G. Dynamic performances modeling of a photovoltaic-thermal collector with water heating in buildings. Energy Build. 2013, 66, 485–494. [Google Scholar] [CrossRef]
  50. Singh, G.; Dwivedi, V.; Yadav, J.; Tiwari, G. Experimental validation of thermal model of hybrid photovoltaic thermal (HPVT) double slope active solar still. Desalination Water Treat. 2012, 45, 182–190. [Google Scholar] [CrossRef]
  51. Sredensek, K.; Seme, S.; Stumberger, B.; Hadziselimovic, M.; Chowdhury, A.; Praunseis, Z. Experimental Validation of a Dynamic Photovoltaic/Thermal Collector Model in Combination with a Thermal Energy Storage Tank. Energies 2021, 14, 8162. [Google Scholar] [CrossRef]
  52. Veynandt, F.; Klanatsky, P.; Plank, H.; Heschl, C. Hybrid photovoltaic-thermal solar collector modelling with parameter identification using operation data. Energy Build. 2023, 295, 13277. [Google Scholar] [CrossRef]
  53. Moradi, K.; Jafari, F.; Moghaddam, F.; Shafiee, Q. Dynamic modeling of photovoltaic-thermal systems using polynomial regression. Renew. Energy 2025, 250, 23242. [Google Scholar] [CrossRef]
  54. Alayi, R.; Kasaeian, A.; Atabi, F. Optical modeling and optimization of parabolic trough concentration photovoltaic/thermal system. Environ. Prog. Sustain. Energy 2020, 39, 13303. [Google Scholar] [CrossRef]
  55. Nash, A.L.; Badithela, A.; Jain, N. Dynamic modeling of a sensible thermal energy storage tank with an immersed coil heat exchanger under three operation modes. Appl. Energy 2017, 195, 877–889. [Google Scholar] [CrossRef]
  56. Maveety, J.; Razani, A. A two-dimensional numerical investigation of the optimal removal time and entropy production rate for a sensible thermal storage system. Energy 1996, 21, 1265–1276. [Google Scholar] [CrossRef]
  57. Nelson, J.; Balakrishnan, A.; Murthy, S. Parametric studies on thermally stratified chilled water storage systems. Appl. Therm. Eng. 1999, 19, 89–115. [Google Scholar] [CrossRef]
  58. Abdulla, A.; Reddy, K.S. Effect of operating parameters on thermal performance of molten salt packed-bed thermocline thermal energy storage system for concentrating solar power plants. Int. J. Therm. Sci. 2017, 121, 30–44. [Google Scholar] [CrossRef]
  59. Raccanello, J.; Rech, S.; Lazzaretto, A. Simplified dynamic modeling of single-tank thermal energy storage systems. Energy 2019, 182, 1154–1172. [Google Scholar] [CrossRef]
  60. Rahman, A.; Smith, A.D.; Fumo, N. Performance modeling and parametric study of a stratified water thermal storage tank. Appl. Therm. Eng. 2016, 100, 668–679. [Google Scholar] [CrossRef]
  61. Berkenkamp, F.; Gwerder, M. Hybrid model predictive control of stratified thermal storages in buildings. Energy Build. 2014, 84, 233–240. [Google Scholar] [CrossRef]
  62. Bird, T.J.; Jain, N. Dynamic modeling and validation of a micro-combined heat and power system with integrated thermal energy storage. Appl. Energy 2020, 271, 14955. [Google Scholar] [CrossRef]
  63. De la Cruz-Loredo, I.; Zinsmeister, D.; Licklederer, T.; Ugalde-Loo, C.E.; Morales, D.A.; Bastida, H.; Peric, V.S.; Saleem, A. Experimental validation of a hybrid 1-D multi-node model of a hot water thermal energy storage tank. Appl. Energy 2023, 332, 20556. [Google Scholar] [CrossRef]
  64. Kreuzinger, T.; Bitzer, M.; Marquardt, W. State estimation of a stratified storage tank. Control Eng. Pract. 2008, 16, 308–320. [Google Scholar] [CrossRef]
  65. Lago, J.; De Ridder, F.; Mazairac, W.; De Schutter, B. A 1-dimensional continuous and smooth model for thermally stratified storage tanks including mixing and buoyancy. Appl. Energy 2019, 248, 640–655. [Google Scholar] [CrossRef]
  66. Nelson, J.; Balakrishnan, A.; Murthy, S. Transient analysis of energy storage in a thermally stratified water tank. Int. J. Energy Res. 1998, 22, 867–883. [Google Scholar] [CrossRef]
  67. Riebel, A.; Wolde, I.; Escobar, R.; Barraza, R.; Cardemil, J.M. Transient modeling of stratified thermal storage tanks: Comparison of 1D models and the Advanced Flowrate Distribution method. Case Stud. Therm. Eng. 2024, 61, 5084. [Google Scholar] [CrossRef]
  68. Saloux, E.; Candanedo, J.A. Modelling stratified thermal energy storage tanks using an advanced flowrate distribution of the received flow. Appl. Energy 2019, 241, 34–45. [Google Scholar] [CrossRef]
  69. Soares, A.; Camargo, J.; Al-Koussa, J.; Diriken, J.; Van Bael, J.; Lago, J. Efficient temperature estimation for thermally stratified storage tanks with buoyancy and mixing effects. J. Energy Storage 2022, 50, 4488. [Google Scholar] [CrossRef]
  70. Yin, H.; Ding, J.; Jiang, R.; Yang, X. Thermocline characteristics of molten-salt thermal energy storage in porous packed-bed tank. Appl. Therm. Eng. 2017, 110, 855–863. [Google Scholar] [CrossRef]
  71. Karim, A.; Burnett, A.; Fawzia, S. Investigation of Stratified Thermal Storage Tank Performance for Heating and Cooling Applications. Energies 2018, 11, 1049. [Google Scholar] [CrossRef]
  72. Duffie, J.A.; Beckman, W.A. Solar Engineering of Thermal Processes; John Wiley & Sons: Hoboken, NJ, USA, 2013. [Google Scholar]
  73. Yamada, T.; Nakamura, H.; Sugiura, T.; Sakuta, K.; Kurokawa, K. Reflection loss analysis by optical modeling of PV module. Sol. Energy Mater. Sol. Cells 2001, 67, 405–413. [Google Scholar] [CrossRef]
  74. Li, C.; Spataru, S.; Zhang, K.; Yang, Y.; Wei, H. A Multi-State Dynamic Thermal Model for Accurate Photovoltaic Cell Temperature Estimation. IEEE J. Photovolt. 2020, 10, 1465–1473. [Google Scholar] [CrossRef]
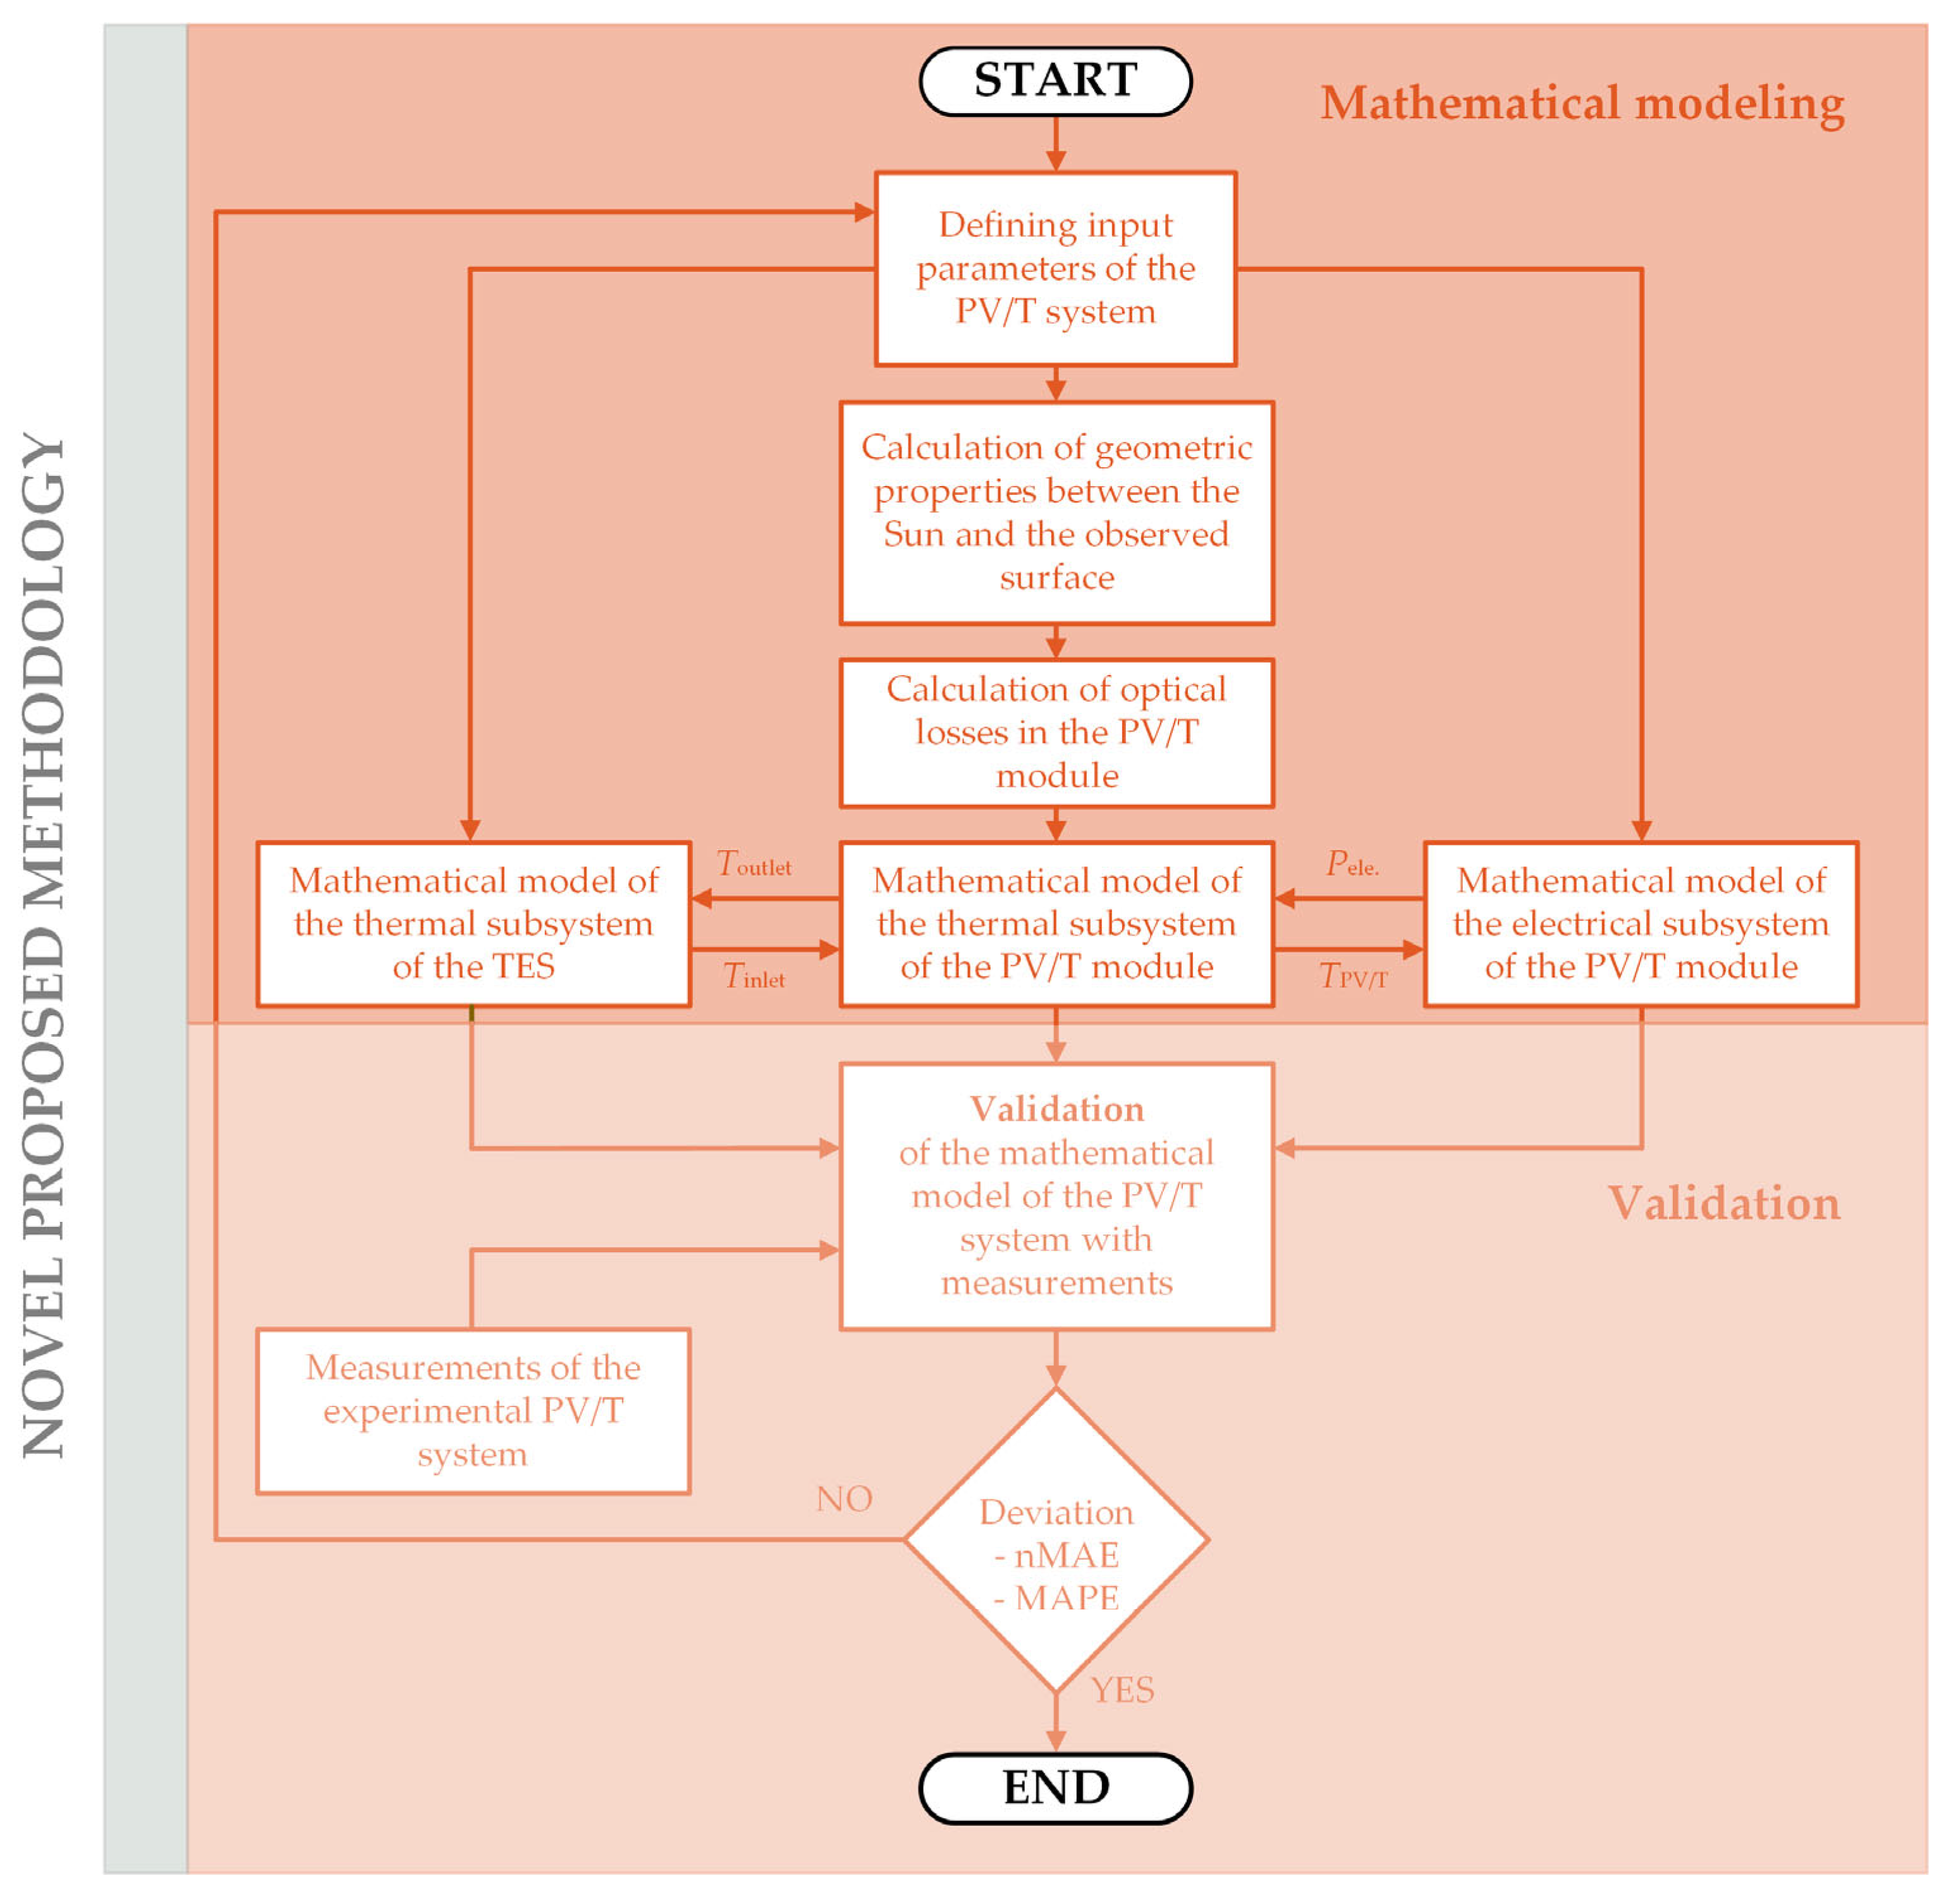
Figure 1. Flow chart of the proposed methodology for modeling and validation of the photovoltaic/thermal system.
Applsci 15 10505 g001
Figure 2. Schematic presentation of the experimental PV/T system.
Applsci 15 10505 g002
Figure 3. Main components of the experimental PV/T system: (a) PV/T modules (TPV/T 1 and TPV/T 4), (b) an inverter (Pele.), (c) central control unit (CCU), (d) pyranometer (G), (e) atmospheric temperature sensor (Ta), (f) anemometer (v), (g) TES (TTES), (h) heat exchanger on primary and secondary side of the TES, (i) TES—forced cooling unit, (j) circulation pump P1, (k) circulation pump P2, (l) circulation pump P3 and (m) calorimeter (Tinlet, Toutlet, q).
Applsci 15 10505 g003
Figure 4. Measurements of the meteorological, electrical, and thermal quantities of the experimental PV/T system.
Applsci 15 10505 g004
Figure 5. The mass flow of the circulation pumps P1 and P2.
Applsci 15 10505 g005
Figure 6. The cumulative daily and annual electrical and thermal energy production by the PV/T system.
Applsci 15 10505 g006
Figure 7. The solar altitude angle αs(t) and the angle of incidence of solar rays i(t) as functions of the sequential day of the year and the time of day.
Applsci 15 10505 g007
Figure 8. The path of solar rays through the layers of the PV/T module.
Applsci 15 10505 g008
Figure 9. Optical properties ((a) reflection, (b) transmission, and (c) absorption) as functions of the sequential day of the year and the time of day.
Applsci 15 10505 g009
Figure 10. Schematic of the thermal network for the PV/T module.
Applsci 15 10505 g010
Figure 11. Schematic of the thermal network for the TES.
Applsci 15 10505 g011
Figure 12. Time series of the electrical power of the PV/T module Pele..
Applsci 15 10505 g012
Figure 13. Time series of the temperature of the working fluid inside the PV/T module Tf.
Applsci 15 10505 g013
Figure 14. Time series of the temperature of the working fluid inside the TES—1st layer TTES 1.
Applsci 15 10505 g014
Figure 15. Time series of the temperature of the working fluid inside the TES—2nd layer TTES 2.
Applsci 15 10505 g015
Figure 16. Time series of the temperature of the working fluid inside the TES—3rd layer TTES 3.
Applsci 15 10505 g016
Figure 17. Time series of the temperature of the working fluid inside the TES—4th layer TTES 4.
Applsci 15 10505 g017
Figure 18. Time series of the temperature of the working fluid inside the TES—5th layer TTES 5.
Applsci 15 10505 g018
Figure 19. Time series of the temperature of the working fluid inside the TES—6th layer TTES 6.
Applsci 15 10505 g019
Figure 20. Boxplot of monthly power density of solar radiation under sunny, cloudy, and overcast weather conditions.
Applsci 15 10505 g020
Figure 21. Average daily power density of solar radiation by month for (a) sunny, (b) cloudy, and (c) overcast days.
Applsci 15 10505 g021
Figure 22. Validation of the electrical (Pele.) and thermal (Tf) subsystems of the PV/T model.
Applsci 15 10505 g022
Figure 23. Validation of the thermal (THTE 1 in THTE 2) subsystems of the TES model.
Applsci 15 10505 g023
Figure 24. Validation of the thermal (THTE 3 in THTE 4) subsystems of the TES model.
Applsci 15 10505 g024
Figure 25. Validation of the thermal (THTE 5 in THTE 6) subsystems of the TES model.
Applsci 15 10505 g025
Figure 26. Average daily values of electrical power Pele. and working fluid temperature Tf for sunny, cloudy, and overcast days.
Applsci 15 10505 g026
Figure 27. Average daily values of working fluid temperature inside the TES—1st, 2nd and 3rd layer (TTES 1, TTES 2, TTES 3) for sunny, cloudy, and overcast days.
Applsci 15 10505 g027
Figure 28. Average daily values of working fluid temperature inside the TES—4th, 5th and 6th layer (TTES 4, TTES 5, TTES 6) for sunny, cloudy, and overcast days.
Applsci 15 10505 g028
Table 1. Detail information of main components of the experimental PV/T system.
ComponentManufacturerTypeDescription
PV/T modules (a)Solimpeks (Konya, Turkey)VoltherPele. = 330 W; Ptherm. = 855 W
Inverter (b)SMA (Niestetal, Germany)Sunny Boy 3.6PDC = 5500 W; PAC = 3680 W
Central control unit (c)Siemens (Munich, Germany)S7-300 PLCCycle time ≥ 0.1 µs/bit operation
Pyranometer (d)Kipp & Zonen (Delft, The Netherlands)SMP3-A300 to 2800 nm;
Atmospheric temperature sensor (e)Ames (Brezovica pri Ljubljani, Slovenia)TPR 159−40 to +60 °C; +/−0.15 °C; 0.1 °C
Anemometer (f)Ames (Brezovica pri Ljubljani, Slovenia)VMT 107 A0 m/s–50 m/s; +/−0.5 m/s; 0.1 m/s
TES (g)Wolf (Mainburg, Germany)SE-2-500Volume: 500 L
Heat exchanger (h)Danfoss (Nordborg, Denmark)XB 37H-1 40Plates: 40; 25 bar; −10 °C to +180 °C
TES—forced cooling unit (i)Aermec (Bevilacqua, Italy)ANL 041APcool. = 9.6 kW; Pheat. = 10.6 kW
Circulation pump P1 in P2 (j,k)Grundfos (Bjerringbro, Denmark)Alpha 23.8 m3/h; +2 °C to +110 °C; 1.0 MPa
Circulation pump P3 (l)Wilo SE (Dortmund, Germany)Maxo11.8 m3/h; −20 °C to +110 °C; 1.0 MPa
Calorimeter (m)Landis+Gyr (Zug, Switzerland)T3301.2–5.0 m3/h; 5–105 °C
Table 2. Average quarterly deviation values between the mathematical model and the measurements.
SpringSummerAutumnWinterAnnual Average
Pele. (W)0.4260.2510.3020.5343.261
Tf (°C)3.2120.8611.0601.3441.534
TTES 1 (°C)1.1890.2151.2811.5791.574
TTES 2 (°C)0.8730.2550.9051.2431.233
TTES 3 (°C)0.5790.2400.5520.8460.842
TTES 4 (°C)0.5890.1780.5080.8010.791
TTES 5 (°C)0.5860.4690.4980.8730.873
TTES 6 (°C)0.9080.6960.8851.2991.290
Table 3. Average error values of each quantitative indicator for all three weather conditions for the TES.
nRMSEnMAEnMBEMAPECCR2
Error value—TTES 16.44%8.79%7.76%5.62%0.9870.973
Error value—TTES 25.19%5.33%5.62%5.22%0.9830.983
Error value—TTES 33.72%4.57%3.00%3.38%0.9900.986
Error value—TTES 43.74%4.26%1.96%3.03%0.9900.980
Error value—TTES 54.29%4.60%1.39%3.11%0.9860.976
Error value—TTES 65.85%6.76%4.15%4.51%0.9830.963
Disclaimer/Publisher’s Note: The statements, opinions and data contained in all publications are solely those of the individual author(s) and contributor(s) and not of MDPI and/or the editor(s). MDPI and/or the editor(s) disclaim responsibility for any injury to people or property resulting from any ideas, methods, instructions or products referred to in the content.