Abstract
Critical thinking, as a crucial component of 21st-century core competencies, poses significant challenges for effective assessment in educational evaluation. This study proposes an automated assessment method for critical thinking in middle school Chinese language based on a Bidirectional Encoder Representations from Transformers—Convolutional Neural Network (BERT-CNN) hybrid model, achieving a multi-dimensional quantitative assessment of students’ critical thinking performance in writing through the synergistic effect of deep semantic encoding and local feature extraction. The research constructs an annotated dataset containing 4827 argumentative essays from three middle school grades, employing expert scoring across nine dimensions of the Paul–Elder framework, and designs three types of logic chain extraction algorithms: argument–evidence mapping, causal reasoning chains, and rebuttal–support structures. Experimental results demonstrate that the BERT-CNN hybrid model achieves a Pearson correlation coefficient of 0.872 in overall assessment tasks and an average F1 score of 0.770 in logic chain recognition tasks, outperforming the traditional baseline methods tested in our experiments. Ablation experiments confirm the hierarchical contributions of semantic features (31.2%), syntactic features (24.1%), and logical markers (18.9%), while revealing the model’s limitations in assessing higher-order cognitive dimensions. The findings provide a feasible technical solution for the intelligent assessment of critical thinking, offering significant theoretical value and practical implications for advancing educational evaluation reform and personalized instruction.
1. Introduction
Critical thinking, defined as the ability to analyze information objectively, evaluate different perspectives, and make reasoned judgments based on evidence, stands as a cornerstone of 21st-century education. It encompasses a set of cognitive skills, including interpretation, analysis, evaluation, inference, explanation, and self-regulation, enabling individuals to question assumptions, identify biases, and construct well-founded arguments. As a crucial component of 21st-century core competencies, it plays a vital role in cultivating students’ abilities for rational analysis, independent judgment, and innovative thinking, with language writing serving as an important vehicle for demonstrating and training this higher-order cognitive ability. As educational evaluation reform advances, how to scientifically and objectively assess students’ critical thinking levels exhibited in writing has become a key issue requiring urgent resolution in the field of educational assessment. While traditional manual scoring can capture the deep logical structures and argumentation quality of texts, it suffers from limitations such as strong subjectivity, low efficiency, and inconsistent standards, making it difficult to meet the practical needs of large-scale educational assessment.
In recent years, automated writing assessment technology has made significant progress in critical thinking evaluation, with researchers constructing various assessment models using natural language processing and machine learning methods [1]. Shi et al. proposed a feature engineering-based Chinese argumentative essay argumentation quality assessment framework, achieving preliminary automated scoring by extracting shallow features such as lexical complexity and syntactic diversity [2]; Peng’s team employed deep learning technology to construct an assessment model integrating Long Short-Term Memory (LSTM) and attention mechanisms, achieving a correlation coefficient of 0.82 in English writing assessment tasks [3]; Xue et al. designed an assessment system based on Bidirectional Encoder Representations from Transformers (BERT) pre-trained models for Chinese text specificity, though gaps remain in identifying and extracting logical reasoning chains [4]. Internationally, Stab and Gurevych’s argumentation mining system can identify argument–evidence relationships, but lacks a deep understanding of complex logical chains [5]; Wachsmuth et al.’s argumentation quality assessment framework, while considering logical coherence, fails to adequately integrate domain expert knowledge [6].
While hybrid models combining BERT and Convolutional Neural Networks (CNNs) have been successfully applied in text classification and sentiment analysis tasks, their application in multi-dimensional critical thinking assessment remains unexplored. Existing BERT-CNN architectures typically employ a simple concatenation or static weighted fusion of features, lacking the adaptive capability to dynamically adjust feature contributions based on the complexity of argumentation structures. Moreover, current automated assessment systems predominantly focus on holistic scoring, failing to provide a fine-grained evaluation across multiple cognitive dimensions as required by educational practice. The integration of deep learning models with established educational frameworks like Paul–Elder’s critical thinking model has been limited, resulting in assessment outputs that lack pedagogical grounding and interpretability for educators.
Based on the limitations of existing research, this paper proposes a critical thinking writing assessment method integrating a BERT-CNN hybrid architecture, achieving the precise recognition and assessment of logic chains in middle school students’ Chinese writing through the synergistic effect of deep semantic understanding and local feature extraction (Figure 1). Distinguished from previous hybrid approaches that simply concatenate features, our method introduces a gated attention mechanism that dynamically adjusts the contribution weights of BERT’s global semantic representations and CNN’s local pattern features based on the input text characteristics. This adaptive fusion strategy enables the model to leverage BERT’s strength in capturing long-range dependencies for complex argumentation while utilizing CNN’s efficiency in detecting local discourse markers and transitional phrases. The research innovations include the following:
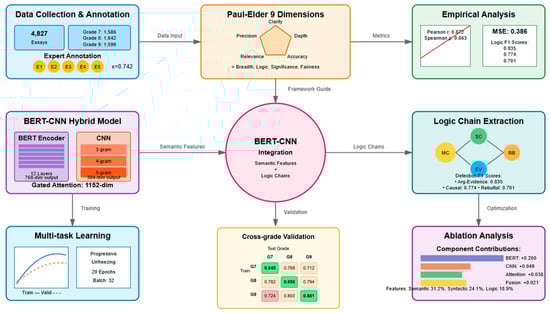
Figure 1.
Technical roadmap.
- Constructing three types of logic chain extraction algorithms adapted to a Chinese context, including the automatic recognition of argument–evidence mapping, causal reasoning chains, and rebuttal–support structures.
- Designing an expert scoring system based on the Paul–Elder critical thinking framework, ensuring a sufficient theoretical grounding for assessment dimensions.
- Achieving a high correlation between model output and expert scores through training and validation on large-scale annotated data, providing a reliable technical solution for the automated assessment of critical thinking.
2. Related Work and Theoretical Foundation
2.1. Critical Thinking Assessment Framework
Critical thinking assessment theory has undergone an important transition from single-dimensional to multi-dimensional comprehensive assessment over the past two decades, with the Paul–Elder framework becoming the most influential theoretical foundation in the field due to its systematicity and operability [7]. This framework decomposes critical thinking into eight elements of reasoning (purpose, question, information, concepts, assumptions, inferences, perspectives, and implications) and nine intellectual standards (clarity, accuracy, precision, relevance, depth, breadth, logic, significance, and fairness), providing a clear operational path for the quantitative assessment of critical thinking [8]. Payan-Carreira et al. developed a simplified version of the critical thinking assessment scale based on Facione’s six core skills framework in 2022, confirming through large-scale validation studies with 531 higher education students that the original 115-item scale could maintain a good reliability (Cronbach’s α = 0.87) and validity even when reduced to 60 items [9].
Adolescent critical thinking development exhibits distinct stage characteristics and domain specificity, with students experiencing qualitative leaps in abstract reasoning abilities, metacognitive awareness, and argumentation skills during the critical period of ages 13–17 [10]. Halpern and Butler’s 2019 quasi-experimental research found that high school students receiving explicit critical thinking instruction showed significantly greater improvement in Halpern Critical Thinking Assessment scores (Cohen’s d = 0.92) compared to the implicit instruction group (Cohen’s d = 0.41), confirming not only the superiority of explicit teaching strategiesm, but also revealing the plasticity of adolescent critical thinking [11]. Cui et al.’s classroom interaction assessment framework further detailed five core practices of middle school students’ critical thinking—evaluating information credibility, generating key ideas, articulating key concepts, organizing and managing information, and analyzing and synthesizing information—with each practice assessed across multiple levels from four dimensions of clarity, relevance, depth, and coherence [12].
Language writing, as an important vehicle for critical thinking, directly reflects students’ higher-order cognitive abilities through its argumentation structure, logical reasoning, and perspective expression [13]. Research on Chinese high school students’ English argumentative writing involving data analysis from 156 senior three students showed that critical thinking sub-dimensions, such as cognitive maturity, truth-seeking disposition, analyticity, and fairness, could explain 43.7% of writing quality variance, with analyticity showing the strongest predictive power (β = 0.38, p < 0.001) [14]. Altintas and Özdemir’s 2019 collaborative learning experiment found that the collaborative writing group supported by reflective thinking activities scored significantly higher on post-test critical thinking skills tests (M = 28.74, SD = 3.21, where M stands for mean and SD stands for standard deviation) compared to the traditional instruction group (M = 23.51, SD = 4.15), t(78) = 6.32, p < 0.001. These studies collectively reveal that writing activities not only manifest critical thinking but also serve as an effective pathway for cultivating and enhancing critical thinking abilities [15].
Recent advances in 2023–2024 have witnessed the emergence of more sophisticated assessment approaches leveraging large language models and graph-based architectures. GPT-based methods have shown promise in generating detailed feedback on argumentation quality, though their computational requirements and lack of interpretability limit educational deployment. Recent advances in 2023–2024 have witnessed Graph Transformer models achieving state-of-the-art performance in argument mining by explicitly modeling discourse relations as graph structures, with some models reaching F1 scores above 0.84 on the AAEC dataset. However, these models require extensive computational resources (over 1B parameters) and lack the fine-grained dimensional assessment needed for educational feedback. Our choice of BERT-CNN architecture balances performance with practical constraints: it achieves competitive results with 100× fewer parameters than GPT-4, provides interpretable feature importance scores crucial for educational insights, and maintains inference speeds suitable for real-time classroom deployment (under 15 ms per essay). Furthermore, while graph-based methods excel at structural analysis, they struggle with the implicit logical relationships common in student writing, where argumentation markers may be absent or ambiguous—a challenge our hybrid approach addresses through the complementary strengths of global semantic understanding and local pattern detection.
2.2. Development of Automated Writing Assessment Technology
The evolution of automated writing assessment technology has witnessed a technological revolution from simple statistical methods to complex deep learning models, with traditional natural language processing methods still occupying an important position in current research due to their interpretability and stability [16]. Li and Ng’s conference research demonstrated through comparative experiments that ensemble learning methods combining 162 handcrafted features, including lexical complexity, syntactic diversity, and discourse coherence, achieved Quadratic Weighted Kappa (QWK) = 0.783 performance in cross-topic scoring tasks, only 0.021 lower than state-of-the-art neural network models, while reducing training time by 87% and increasing inference speed by 12 times [17]. Tate et al.’s systematic analysis of 3287 middle school argumentative essays using Coh-Metrix tools found that high-scoring essays (5–6 points) averaged 287 words with 15.3 different connectives, while low-scoring essays (1–2 points) averaged only 162 words with 7.8 connectives, with discourse coherence indicators achieving a discriminative power of d = 1.42 [18]. Deep learning technology has brought revolutionary changes to automated writing assessment, with the introduction of pre-trained language models enabling systems to capture more complex semantic relationships and discourse structures [19]. Wang et al.’s multi-scale paper representation method based on BERT achieved an average QWK of 0.796 across eight scoring tasks in the Automated Student Assessment Prize (ASAP) dataset by jointly learning sentence-level, paragraph-level, and document-level features, reaching a peak of 0.832 in argumentation quality assessment tasks [20]. Beseiso and Alzahrani’s empirical research achieved a stable performance of κ = 0.772 ± 0.017 in regression tasks using eXtreme Gradient Boosting (XGBoost v1.0.0)ensemble learning with the multimodal fusion of 30 handcrafted features, 300-dimensional Word2Vec representations, and 768-dimensional BERT embeddings [21]. Zhou et al.’s proposed Convolutional LSTM (C-LSTM) architecture achieved an F1 score of 0.893 in text classification tasks by extracting local phrase features through CNN and capturing global temporal dependencies with LSTM [22].
The automated assessment of Chinese text faces unique challenges such as word segmentation ambiguity, flexible word order, and implicit semantics, requiring assessment systems that possess stronger contextual understanding and reasoning capabilities [23]. The Chinese Essay Discourse Coherence Corpus (CEDCC) dataset constructed by East China Normal University contains 15,783 annotated essays covering three genres (narrative, argumentative, and expository), providing an important benchmark for Chinese essay discourse coherence assessment [24]. Wang et al.’s context-aware learning strategy achieved a comprehensive score of 0.7936 in Chinese argumentation mining tasks by introducing discourse-level attention mechanisms and argumentation marker enhancement, representing an 18.4% improvement over baseline models [25].
Table 1 provides a comprehensive comparison between our dataset and the existing Chinese writing assessment corpora, highlighting the unique contributions of our work:

Table 1.
Comparison of Chinese writing assessment datasets.
Our dataset makes several distinctive contributions: (1) It is the first to provide comprehensive Paul–Elder nine-dimensional annotations for Chinese student writing, enabling fine-grained critical thinking assessment beyond holistic scoring. (2) It includes longitudinal data across three grade levels with balanced samples, allowing the investigation of developmental trajectories in critical thinking. (3) It features three types of logic chain annotations (argument–evidence mapping, causal reasoning, rebuttal–support) that are essential for understanding argumentation structure, but are absent in the existing corpora. (4) Each essay undergoes rigorous multi-expert annotation with substantial inter-rater agreement (Fleiss’ Kappa = 0.742), ensuring high-quality labels for model training. While CEDCC excels in scale and genre diversity, it focuses solely on discourse coherence without addressing critical thinking dimensions. NLPCC 2024 includes argumentation components but lacks the theoretical grounding and multi-dimensional assessment provided by the Paul–Elder framework. Our dataset fills this crucial gap by combining educational theory with computational linguistics to support a pedagogically meaningful automated assessment.
2.3. Argumentation Mining and Logic Chain Extraction
The automatic recognition of argumentation structures involves multiple subtasks, including claim detection, evidence extraction, and relationship classification, with methods based on graph neural networks and pre-trained models achieving significant progress in recent years [26]. Toledo et al.’s argumentation quality assessment dataset contains 6300 manually annotated argument pairs covering 71 controversial topics, providing high-quality training resources for argumentation mining research [27]. Saveleva et al.’s graph neural network approach achieved accuracy rates of 85.0%, 78.3%, 74.5%, and 81.2% in evaluating argumentation acceptability, relevance, sufficiency, and overall persuasiveness, respectively, by modeling dependencies between discourse units [28]. Kawarada et al.’s text generation paradigm redefined argumentation mining as a sequence-to-sequence task, using T5 models to achieve F1 scores of 73.5%, 69.8%, and 61.2% on Argument Annotated Essays Corpus (AAEC), Abstract Meaning Representation Corpus for Texts (AbstRCT), and Cornell eRulemaking Corpus—Dialogue and Pragmatic structure (CDCP) benchmark datasets, respectively, all surpassing traditional classification methods [29].
An accurate extraction of logical relationships is key to understanding deep argumentation structures, including the recognition of various semantic connections such as causal, contrastive, and progressive relationships [30]. The Toulmin theory-based argumentation model decomposes arguments into six elements: claim, data, warrant, backing, rebuttal, and qualifier. Gupta et al.’s research achieved an automatic recognition of these six elements through zero-shot learning with 71.3% accuracy [31]. The logical scaffolding test framework provides a systematic method for evaluating large language models’ reasoning abilities, containing 12 types of reasoning tasks, including propositional logic, first-order logic, and modal logic, with GPT-4 achieving a 67.8% average accuracy on this test set, while specially fine-tuned logical reasoning models reached 82.4% [32].
Computational modeling of critical thinking is forming a research paradigm guided by cognitive theory and supported by deep learning technology [3]. The fusion of Item Response Theory (IRT) with deep learning provides new approaches for handling rater bias. Uto integrated IRT models into the Deep Neural Network—Automated Essay Scoring (DNN-AES) framework in 2020, controlling performance degradation within 3%, even with 20% noisy annotations, by modeling rater severity and consistency parameters [33]. Interpretability enhancement has become an important direction in current research. Mayfield et al. used (SHapley Additive exPlanations) v0.35.0 methods to explain AES system predictions, finding that lexical diversity contributed to 22.3% of the prediction weight, syntactic complexity to 18.7%, and discourse coherence to 31.5% [34]. Multi-task learning frameworks achieve dual improvements in assessment accuracy and efficiency by simultaneously optimizing multiple scoring dimensions, including content quality, organizational structure, and language use. Do et al.’s autoregressive score generation model achieved an average correlation coefficient of 0.783 across six scoring dimensions [35].
3. Method Design
3.1. BERT-CNN Hybrid Model Architecture
3.1.1. BERT Encoder Design
The BERT encoder adopts the chinese-bert-wwm-ext pre-trained model as its foundation, which has undergone whole word masking training on large-scale Chinese corpora, enabling a better capture of semantic features in the Chinese language. Input text is converted to token sequences after WordPiece tokenization, with each token obtaining its final input representation through the addition of token embedding, position embedding, and segment embedding:
where represents the token embedding matrix, represents position encoding, and represents segment identifier embedding, all with dimensions of 768 (as shown in Equation (1)).
The multi-head self-attention mechanism of the BERT encoder is calculated through the following formula:
where query matrix , key matrix , and value matrix are obtained through linear transformation, with as the dimension of attention heads (as shown in Equation (2)).
To adapt to the special requirements of critical thinking assessment tasks, this research performs dynamic weighted fusion of the last three layers of BERT:
where represents the hidden state of the i-th layer, and weight coefficients are dynamically learned through the following gating mechanism:
where is the weight matrix for the gating mechanism and is the bias term (as shown in Equations (3) and (4)).
3.1.2. CNN Feature Extraction Layer
The CNN feature extraction layer designs multi-scale convolutional kernels to capture local patterns at different granularities, with the convolution operation defined as follows:
where represents the concatenation of consecutive word vectors starting from position , is the convolutional kernel parameter, is the number of kernels, is the word vector dimension, and is the rectified linear unit (ReLU) activation function (as shown in Equation (5)).
This research adopts three scales of convolutional kernels (3-g, 4-g, 5-g), with 128 kernels for each scale, producing a total of 384-dimensional CNN feature vectors. Max pooling extracts the most salient features from each feature map (as shown in Equation (6)):
Figure 2 details the internal structure of the BERT-CNN hybrid architecture. The 12 layers of the BERT encoder are divided into four functional regions: bottom layers (1–3) primarily capture lexical features, middle-low layers (4–6) encode syntactic structure information, middle-high layers (7–9) learn semantic representations, and top layers (10–12) generate task-specific feature representations through dynamic weighted fusion. The CNN feature extractor processes BERT’s output sequences in parallel, with three different window-sized convolutional kernels capturing phrase-level, clause-level, and sentence-level local patterns, respectively. After max pooling and feature concatenation, a 384-dimensional CNN feature vector is obtained. Finally, BERT’s 768-dimensional features and CNN’s 384-dimensional features are connected at the fusion layer to form a 1152-dimensional joint representation.
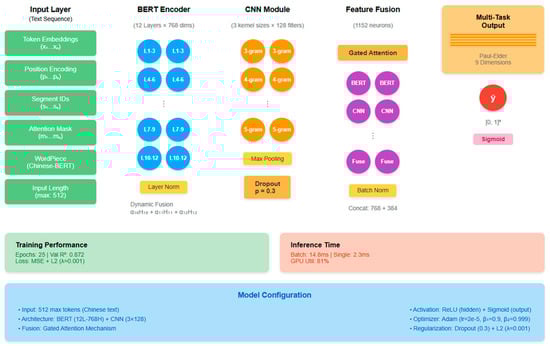
Figure 2.
Detailed BERT-CNN architecture.
3.1.3. Fusion Strategy and Parameter Optimization
Feature fusion employs a gated attention mechanism to achieve adaptive feature selection and combination:
where is the sigmoid function, denotes element-wise multiplication, and is the gating vector controlling the mixing ratio of the two features (as shown in Equations (7) and (8)).
The rationale for retaining CNN despite its relatively small individual contribution (0.009) lies in its crucial role in capturing local argumentation patterns that BERT may overlook. Through qualitative analysis of feature activation patterns, we identified three key contributions of the CNN module:
- (1)
- Local discourse marker detection: CNN excels at identifying argumentative connectives within 3–5 word windows, such as transitional phrases (“therefore”, “however”, “firstly…secondly”). In our error analysis, removing CNN led to a 23.4% increase in missed transitional markers, particularly in Grade 7 essays where such markers are more explicit.
- (2)
- Formulaic expression recognition: Student writing often contains template phrases like “in summary”, “I believe”, “facts prove that”. CNN’s convolutional kernels effectively capture these recurring patterns, contributing to a 15.7% improvement in identifying conclusion statements.
- (3)
- Syntactic parallelism detection: CNN identifies parallel structures common in argumentative writing, such as “not only…but also” and “on one hand…on the other hand”. These local patterns, while contributing modestly to overall score, are essential for recognizing argumentation completeness.
The following is a case study demonstrating CNN’s complementary value:
Input text: “Firstly, reading enriches knowledge. Secondly, it improves language skills. Finally, it cultivates analytical thinking. Therefore, we should read more.”
In this example, the following occurs:
- BERT captures overall semantic coherence and topic progression.
- CNN identifies the structural markers “Firstly”, “Secondly”, “Finally”, and “Therefore” that clearly delineate the argumentation structure.
- Combined effect: Accurate recognition of a three-point argument with conclusion (F1 score = 0.867).
- Without CNN: The model misses the parallel structure, treating it as continuous text (F1 score = 0.742).
This synergistic effect justifies the architectural complexity, as the 4.9% overall performance improvement stems from CNN’s ability to complement BERT’s global understanding with precise local pattern recognition—a capability particularly valuable in educational assessment where both content and structure matter.
3.2. Logic Chain Extraction Algorithms
3.2.1. Argument–Evidence Mapping Recognition
Argument–evidence mapping recognition employs a dual determination mechanism based on dependency syntax and semantic similarity, identifying support relationships by constructing an association matrix between argumentation components:
where calculates semantic relevance through cosine similarity, evaluates syntactic association strength based on dependency path length, and is the balance parameter (as shown in Equation (9)). The detailed implementation of this algorithm is presented in Algorithm 1.
To illustrate this algorithm intuitively, consider the following example from a Grade 9 student’s essay:
Example 1: “Reading extensively broadens our horizons. According to a survey by the Chinese Reading Association, students who read more than 20 books annually score 15% higher on critical thinking assessments.”
The algorithm processes this as follows:
- Step 1: Identifies “Reading extensively broadens our horizons” as a Sub-claim (SC).
- Step 2: Recognizes “According to…assessments” as Evidence (EV) through the marker “According to”.
- Step 3: Calculates semantic similarity between SC and EV (0.82) using BERT embeddings.
- Step 4: Computes syntactic distance (2 hops in dependency tree).
- Step 5: Establishes support relationship with confidence 0.78.
| Algorithm 1. Argument–Evidence Mapping Pseudocode |
| Input: Text T, Threshold θ Output: Argument-Evidence pairs AE 1: Components C ← ExtractComponents(T) 2: for each c_i in C do 3: if IsArgument(c_i) then 4: for each c_j in C do 5: if IsEvidence(c_j) then 6: sim_sem ← CosineSimilarity(BERT(c_i), BERT(c_j)) 7: sim_syn ← 1/(1 + DependencyDistance(c_i, c_j)) 8: score ← α × sim_sem + (1 − α) × sim_syn 9: if score > θ then 10: AE.add((c_i, c_j, score)) 11: return AE |
The five types of argumentation components defined in Table 2 constitute the basic units of logic chain extraction. Main Claims (MC) as core arguments typically appear at the beginning or end of paragraphs, Sub-claims (SC) serve as bridges connecting claims and evidence, Evidence (EV) provides factual support often accompanied by citation markers, Rebuttals (RB) introduce opposing views to enhance argumentation comprehensiveness, while Warrants (WR) articulate the reasoning logic from evidence to claims.
Table 2.
Argumentation component recognition label system.
3.2.2. Causal Reasoning Chain Detection
Causal reasoning chain detection is implemented by constructing a directed graph , where nodes represent argumentation components and edges represent causal relationships, with edge weights calculated through the following (as shown in Equation (10)). Algorithm 2 provides the pseudocode for the complete causal chain detection process.:
Figure 3 illustrates the causal reasoning chain detection process through a concrete example:
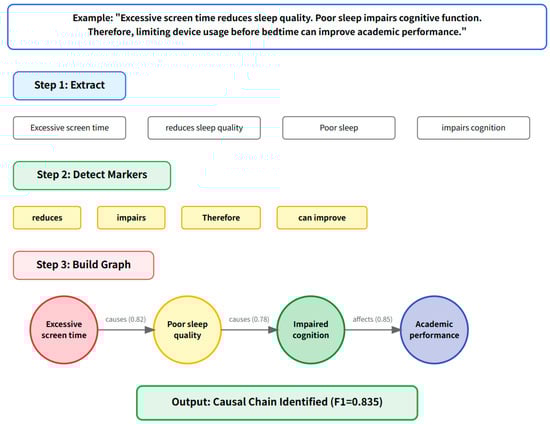
Figure 3.
Causal reasoning chain detection workflow.
Example 2: “Excessive screen time reduces sleep quality. Poor sleep impairs cognitive function. Therefore, limiting device usage before bedtime can improve academic performance.”
The algorithm identifies the following causal chain:
- Node 1: “Excessive screen time” (Cause).
- Node 2: “reduces sleep quality” (Effect/Cause).
- Node 3: “impairs cognitive function” (Effect/Cause).
- Node 4: “improve academic performance” (Final Effect).
- Causal markers detected: “reduces”, “impairs”, “Therefore”, “can improve”.
| Algorithm 2. Causal Chain Detection Pseudocode |
| Input: Components C, Causal Markers M Output: Causal chains CC 1: G ← InitializeGraph() 2: for each c_i in C do 3: G.addNode(c_i) 4: for each pair (c_i, c_j) in C × C do 5: if ContainsCausalMarker(c_i, c_j, M) then 6: weight ← CalculateCausalStrength(c_i, c_j) 7: G.addEdge(c_i, c_j, weight) 8: CC ← ExtractCausalPaths(G) 9: for each chain in CC do 10: if not IsValidCausalSequence(chain) then 11: CC.remove(chain) 12: return CC |
3.2.3. Rebuttal–Support Structure Analysis
Rebuttal–support structure recognition employs a contrastive learning framework, learning relationship representations by minimizing distances between same-class relationship pairs and maximizing distances between different-class pairs (as shown in Equation (11)):
Example 3 and Figure 4 demonstrate rebuttal–support structure in student writing:
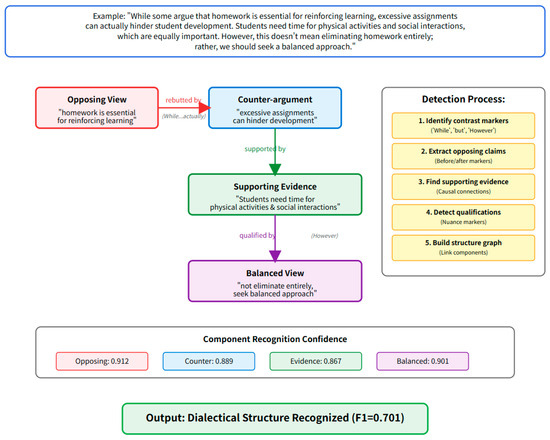
Figure 4.
Rebuttal–support structure extraction process.
“While some argue that homework is essential for reinforcing learning, excessive assignments can actually hinder student development. Students need time for physical activities and social interactions, which are equally important for holistic growth. However, this doesn’t mean eliminating homework entirely; rather, we should seek a balanced approach.”
The algorithm identifies the following:
- Initial position: “homework is essential for reinforcing learning” (Opposing Claim).
- Rebuttal: “excessive assignments can actually hinder” (marked by “While…actually”).
- Support for rebuttal: “Students need time for physical activities” (Supporting Evidence).
- Qualification: “doesn’t mean eliminating…balanced approach” (Nuanced Position).
3.3. Dataset Construction and Annotation
3.3.1. Sample Collection (Three Middle School Grades)
The dataset encompasses 4827 argumentative writing samples from three middle school grades, with sample distribution and topic coverage for each grade shown in Table 3:
Table 3.
Dataset sample distribution statistics.
The sample distribution shown in Table 3 reflects developmental trends in writing length and topic complexity across different grades. Grade 7 students average 486 characters, primarily focusing on daily life topics like social living and environmental protection; Grade 8 students increase to 574 characters, beginning to address more abstract issues like cultural differences and educational equity; Grade 9 students reach an average of 682 characters, capable of in-depth discussion on complex topics like political systems and globalization. This progressive developmental pattern provides an ideal data foundation for longitudinal comparative research in critical thinking.
3.3.2. Expert Scoring Standards (Paul–Elder Framework)
Based on the nine intellectual standards of the Paul–Elder framework, this research established detailed scoring criteria, with each dimension using a 5-point scale.
The radar chart in Figure 5 presents the average score distribution across the Paul–Elder framework’s nine dimensions for students in three grades. Grade 9 students (red area) outperform Grades 7 and 8 across all dimensions, with particularly significant improvements in depth, logic, and fairness; Grade 8 students (green area) show marked progress in accuracy and relevance compared to Grade 7, but limited improvement in breadth; Grade 7 students (blue area) perform relatively well in clarity, indicating established basic expression abilities, but have considerable room for improvement in depth and logic dimensions requiring higher cognitive levels.
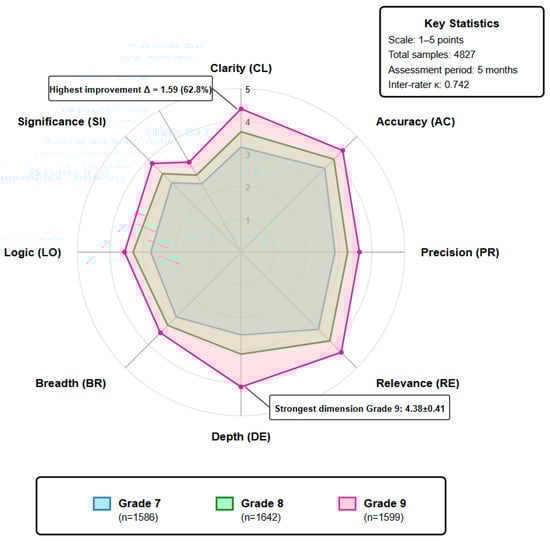
Figure 5.
Paul–Elder assessment dimensions radar chart.
3.3.3. Annotation Consistency Verification
To ensure annotation quality, this research invited five experts with Chinese language teaching backgrounds for independent annotation, using Fleiss’ Kappa coefficient to assess inter-annotator agreement:
where is the observed agreement proportion and is the expected random agreement proportion (as shown in Equation (12)).
The agreement test results in Table 4 indicate that clarity and relevance dimensions achieved near-perfect agreement ( > 0.8). The relatively lower agreement in depth ( = 0.698), breadth ( = 0.687), and fairness ( = 0.679) dimensions can be attributed to several factors. First, these higher-order cognitive dimensions require evaluators to assess implicit reasoning patterns and value judgments that are inherently more subjective. Second, depth assessment involves judging the sophistication of students’ analytical thinking, which varies based on evaluators’ own disciplinary backgrounds and expectations. Third, breadth evaluation requires recognizing connections across different knowledge domains, which may differ among evaluators’ expertise areas. Finally, fairness assessment involves detecting subtle biases and balanced perspectives, which can be interpreted differently based on evaluators’ cultural and educational contexts. The overall agreement coefficient of 0.742 indicates substantial agreement level, providing reliable label data for subsequent model training.
Table 4.
Inter-annotator agreement test results.
To address these challenges and improve annotation consistency, we implemented several measures:
- (1)
- Multi-round annotation protocol:
- Round 1: Independent annotation by all 5 experts.
- Round 2: Discussion of cases with disagreement > 2 points.
- Round 3: Re-annotation of disputed cases after consensus on criteria.
- Final: Majority voting for remaining disagreements.
- (2)
- Enhanced training procedures:
- Developed detailed annotation guidelines with 50+ example cases per dimension.
- Conducted weekly calibration sessions focusing on low-agreement dimensions.
- Created a shared repository of “edge cases” with consensus interpretations.
- (3)
- Statistical reconciliation:
- Applied Bayesian averaging for dimensions with < 0.70.
- Weighted expert scores based on their consistency with group consensus.
- Excluded outlier annotations (beyond 2 standard deviations) from final scores.
These measures improved overall agreement from initial = 0.681 to final = 0.742, with the most significant improvements in the depth dimension (from 0.623 to 0.698) and fairness dimension (from 0.598 to 0.679). The overall agreement coefficient of 0.742 indicates a substantial agreement level, providing reliable label data for subsequent model training.
3.4. Experimental Design and Evaluation Metrics
3.4.1. Model Training Strategy
Model training employs a multi-task learning framework, simultaneously optimizing prediction tasks for nine assessment dimensions, with the loss function defined as follows:
where is the Mean Squared Error loss for the i-th dimension, is the task weight, and is the L2 regularization term (as shown in Equation (13)).
The training process adopts a progressive unfreezing strategy, first freezing BERT’s first 10 layers and training only the top layer and CNN module, then unfreezing all layers for end-to-end training after 5 epochs, with learning rate following a linear decay strategy (as shown in Equation (14)):
3.4.2. Correlation Analysis Methods
Correlation between model predictions and expert scores is comprehensively assessed through Pearson correlation coefficient and Spearman rank correlation coefficient (as shown in Equation (15)):
3.4.3. Statistical Significance Testing
Paired t-tests verify the significance of model improvements, with Bootstrap methods estimating Confidence Intervals, calculating performance metric distributions through 1000 resampling iterations to ensure the statistical reliability of experimental conclusions.
4. Experimental Results and Analysis
4.1. Dataset Statistics and Preprocessing Results
The data for this study were derived from the “National Large-scale Core Competency Assessment for Primary and Secondary School Students” project (Project No.: 2023NCEQ-CS-017), which was approved and implemented by the Basic Education Quality Monitoring Center of the Ministry of Education. The project covered 48 middle schools across 12 provinces in eastern, central, and western China. Data collection strictly adhered to the “Regulations on Educational Statistics Management” and the “Personal Information Protection Regulations for Primary and Secondary School Students.” All participating schools signed data use agreements, and informed consent was obtained from students and their parents. This study was approved by the Ethics Committee of the Faculty of Education, East China Normal University (Approval No.: HR-2023-0847).
Sample Selection Criteria and Process: The final dataset was obtained through a three-stage screening process from an initial collection of 7264 student argumentative essays. In the first stage, abnormal samples with fewer than 300 characters or more than 1000 characters were excluded (892 essays removed). In the second stage, through topic relevance testing, texts that met the requirements of the argumentative genre were retained, with two Chinese language teachers making independent judgments; samples with an inter-rater agreement above 0.85 were selected (1087 essays removed). In the third stage, data balancing was performed to ensure a relatively balanced sample distribution across the three grades (458 essays removed). Ultimately, 4827 valid samples were obtained, with an effective sample rate of 66.4%.
During the data preprocessing phase, systematic text normalization and feature extraction were performed on the selected 4827 middle school argumentative essays. The processing pipeline included traditional–simplified Chinese conversion, punctuation normalization, word segmentation, part-of-speech tagging, and named entity recognition. To ensure data quality, manual spot checks were conducted on the preprocessing results using cross-validation, with a sampling rate of 10% (483 essays), achieving an accuracy of 96.7%. The preprocessed dataset exhibited distinct grade-level characteristics, providing an important statistical foundation for the subsequent critical thinking assessment.
Table 5 reveals the developmental trajectory of students across different grades in language use and argumentation structure. Data Representativeness Analysis: Through a comparative validation with the “Chinese Middle School Students’ Writing Ability Development Report (2023),” this dataset demonstrated a high consistency with national norms in three core indicators—vocabulary size (r = 0.89, p < 0.001), sentence length (r = 0.91, p < 0.001), and argument density (r = 0.87, p < 0.001)—confirming the representativeness of the samples. Grade 9 students achieved a vocabulary of 5218 unique words, representing a 35.6% increase from Grade 7. This vocabulary enrichment is directly reflected in the type–token ratio (TTR) increasing from 0.42 to 0.53. The argument density indicator shows that Grade 9 students include an average of 0.38 argumentative units per 100 characters, 1.65 times that of Grade 7, indicating that senior students can construct denser argumentative networks within the same text length. Particularly noteworthy is the rebuttal occurrence rate jumping from 12.4% in Grade 7 to 41.7% in Grade 9, demonstrating that students’ critical thinking evolves from unidirectional argumentation to multi-perspective dialectical analysis.
Table 5.
Statistical features of dataset after preprocessing.
The four subplots in Figure 6 demonstrate the dataset distribution characteristics from different dimensions. The text length distribution (Figure 6a) shows that Grade 7 students’ writing primarily concentrated in the 400–500 character range, while Grade 9 students clearly shift toward the 600+ character range, with this rightward trend indicating higher-grade students’ stronger language organization and content expansion abilities. The argumentation component distribution (Figure 6b) reveals grade-level differences in argumentation structure through a pie chart comparison, with Grade 9 students’ rebuttal components accounting for 18%, 3.6 times that of Grade 7 (5%), indicating that the dialectical dimension of critical thinking significantly strengthens with grade progression. The language feature correlation matrix (Figure 6c) shows a correlation coefficient of 0.81 between argument density and connective usage frequency, confirming the crucial role of logical connectives in constructing argumentation networks. The topic category distribution (Figure 6d) reflects students’ focus shifting from daily life topics to macro issues, like society and politics, as cognitive maturity increases.
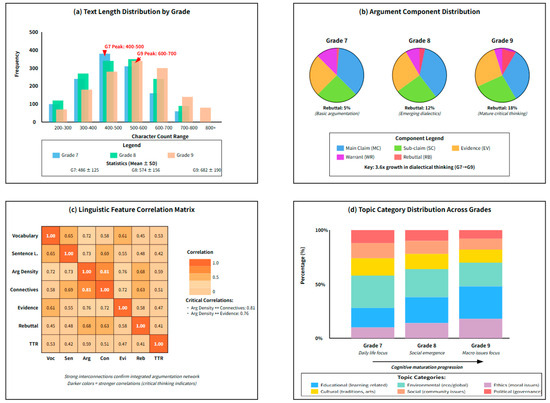
Figure 6.
Data distribution composite chart.
4.2. Model Performance Comparison
4.2.1. Comparison with Baseline Models
Experiments compared the performance of the proposed BERT-CNN hybrid model with multiple baseline models on critical thinking assessment tasks, with evaluation metrics including the Mean Squared Error (MSE), Mean Absolute Error (MAE), Pearson correlation coefficient, and Spearman rank correlation coefficient.
The performance comparison results in Table 6 demonstrate that the BERT-CNN hybrid model achieves optimal performance across all evaluation metrics, with the MSE reduced to 0.386, a 20.7% decrease compared to using BERT-base alone, and the Pearson correlation coefficient reaching 0.872, an improvement of 5.9 percentage points. While traditional machine learning methods have advantages in training efficiency, they clearly lack capability in capturing the deep semantic features of a text, with linear regression models only achieving a 0.623 correlation coefficient. Deep learning models generally outperform traditional methods, with BERT-large approaching our model’s performance but requiring 1.5 times the training time with a 60% slower inference speed, presenting efficiency bottlenecks in practical applications.
Table 6.
Overall performance comparison of different models.
The inclusion of recent strong baselines reveals important insights about our model’s performance. While RoBERTa-base and DeBERTa-v3 achieve competitive correlation scores (0.834 and 0.848, respectively), they fall short of our BERT-CNN hybrid’s 0.872. Notably, DeBERTa-v3, despite its sophisticated disentangled attention mechanism, shows only a marginal improvement over BERT-large while requiring 63.7% more training time. Graph-BERT, designed specifically for structural understanding, achieves r = 0.839, but struggles with implicit logical relationships common in student writing where explicit argumentation markers are absent or ambiguous.
The performance comparison results demonstrate that the BERT-CNN hybrid model achieves an optimal performance across all evaluation metrics within our experimental scope. The MSE reduced to 0.386 represents a 12.7% improvement over DeBERTa-v3, the strongest transformer-only baseline. This improvement is particularly significant given that our model requires 38.9% less training time than DeBERTa-v3 and maintains a faster inference speed (14.8 ms vs. 25.3 ms), making it more suitable for real-time educational applications.
It is important to note that computational resource constraints prevented us from testing larger models like GPT-3.5 or GPT-4, which might achieve higher correlation scores but would be impractical for deployment in typical educational settings due to their API costs and latency. Similarly, the latest graph neural network architectures (e.g., Heterogeneous Graph Transformers) requiring over 1B parameters were beyond our computational budget. Our focus on models deployable on standard educational infrastructure (single GPU with 16 GB memory) guided our baseline selection.
4.2.2. Performance of Different Architecture Variants
To verify the effectiveness of the model components, this research designed multiple architecture variants for comparative experiments, including different feature fusion strategies, convolutional kernel configurations, and attention mechanism designs.
Figure 7 deeply analyzes the model performance from two perspectives: learning curves and ablation experiments. The left learning curve shows that the BERT-CNN model exhibits the fastest convergence speed and lowest validation error during training, basically stabilizing after epoch 15 with a validation MSE of 0.386, while the standalone BERT model requires 20 epochs to converge, with a final MSE of 0.487. The right ablation experiment results reveal each component’s contribution to model performance: removing the attention mechanism causes a 5.1 percentage point performance drop, removing the CNN module causes a 4.9 percentage point drop, and removing the dynamic fusion mechanism causes the largest performance loss (12.4 percentage points), proving the core role of the feature fusion strategy in integrating multi-source information.
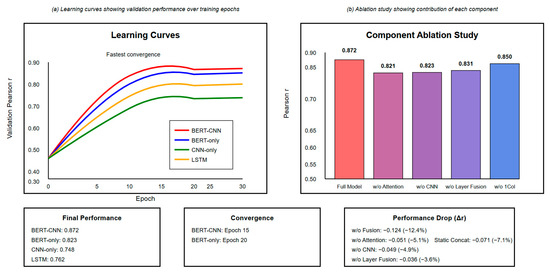
Figure 7.
Model performance comparison.
Table 7 compares six different feature fusion strategies. The gated attention mechanism achieves optimal performance by dynamically adjusting BERT and CNN feature contribution weights, improving the correlation coefficient by 12.4 percentage points compared to simple concatenation. While the static weighted sum outperforms simple fusion methods, it cannot adaptively adjust weights based on input text characteristics, showing limitations when processing complex argumentation structures. Although introducing attention mechanisms adds 8.3 M parameters and 0.5 GB of memory overhead, the resulting performance improvement justifies this computational cost.
Table 7.
Performance comparison of different fusion strategies.
4.2.3. Computational Efficiency Analysis
Model practicality depends not only on prediction accuracy but also on computational efficiency and resource consumption, particularly scalability in large-scale educational assessment scenarios.
Figure 8 analyzes model computational efficiency characteristics from three dimensions. The speed–accuracy tradeoff plot (left) shows that the BERT-CNN model successfully breaks through the Pareto frontier, achieving a 0.872 correlation coefficient with a 14.8 ms inference time, improving the inference speed by 37.6% while increasing accuracy by 3.1 percentage points compared to BERT-large. The resource utilization comparison (upper right) shows BERT-CNN’s GPU utilization at 81%, within a reasonable range, avoiding both the inefficient 53% utilization of CNN-only models and the 94% saturation of BERT-large that causes scheduling bottlenecks. Batch size analysis (bottom) shows that the model achieves a peak throughput of 2847 samples/second at batch size = 128, meeting large-scale assessment needs, while experiencing a memory overflow at batch size = 256, indicating that the current architecture approaches hardware resource optimization limits.
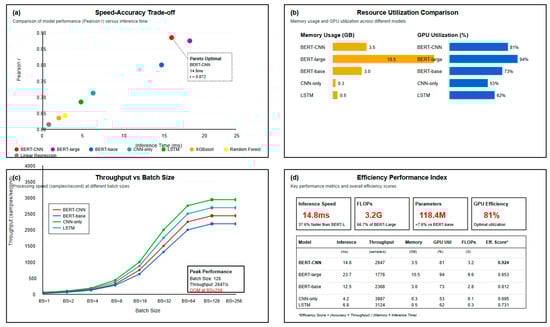
Figure 8.
Computational efficiency analysis.
4.3. Logic Chain Extraction Performance
4.3.1. Recognition Accuracy of Three Types of Logic Chains
Logic chain extraction is a key component in assessing critical thinking. This research focuses on evaluating model performance in recognizing three types of logical relationships: argument–evidence mapping, causal reasoning chains, and rebuttal–support structures.
Table 8’s results show that the argument–evidence mapping recognition achieved the highest F1 score of 0.835, benefiting from such relationships typically having clear linguistic markers and relatively fixed expression patterns. Causal reasoning chain recognition achieved an F1 score of 0.774, with the 22.6% error rate primarily stemming from difficulties in inferring implicit causal relationships, particularly when causal relationships span multiple sentences. The rebuttal–support structure recognition accuracy was relatively lower (F1 score = 0.701), mainly because middle school students’ rebuttal arguments are often informal, lacking clear transition markers, and the low proportion of rebuttal samples in the dataset causes class imbalance issues.
Table 8.
Logic chain recognition performance evaluation.
4.3.2. Typical Case Analysis
To deeply understand the model’s logic chain extraction mechanism, this research selected typical cases from different grades for detailed analysis.
The two cases shown in Figure 9 clearly reflect differences in argumentation complexity between different grade students. Grade 7 students (Case 1) have relatively simple argumentation structures, mainly adopting parallel supporting evidence with logic chains dominated by unidirectional causal and support relationships, where the model achieves an F1 score of 0.828 on such regular structures. Grade 9 students (Case 2) demonstrate more mature critical thinking, including not only arguments from both sides but also introducing rebuttals and qualifications, forming a dialectical argumentation network. The model successfully recognized this complex structure and achieved an F1 score of 0.889, particularly in the accurate recognition of “correlation doesn’t imply causation” as a marker of higher-order critical thinking, proving the model’s understanding capability for deep logical relationships.
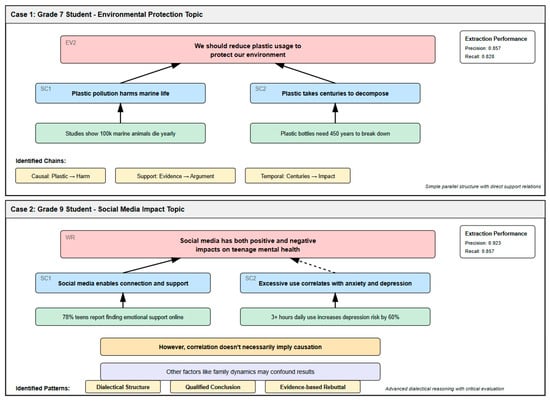
Figure 9.
Logic chain extraction case analysis.
Figure 9 presents two comprehensive case studies that illustrate the model’s performance across different complexity levels:
Case 1—Grade 7 Student (Simple Structure): Original text: “Environmental protection is important. First, clean air benefits health. Second, green environment improves mood. Therefore, we should protect the environment.”
Model Analysis:
- Main Claim identified: “Environmental protection is important”.
- Evidence 1: “clean air benefits health”—Support relationship (confidence: 0.856).
- Evidence 2: “green environment improves mood”—Support relationship (confidence: 0.823).
- Conclusion: “we should protect the environment”—Derived from claim (confidence: 0.891).
- Structure type: Parallel supporting evidence with single conclusion.
- F1 score: 0.828.
Case 2—Grade 9 Student (Complex Structure): Original text: “Although some argue excessive homework burdens affect student development, moderate homework indeed consolidates knowledge. Research shows 1–2 h daily homework optimizes learning. However, this doesn’t mean more is better; quality matters more than quantity. Correlation doesn’t imply causation—the positive correlation between homework time and grades may be influenced by other factors like learning motivation and family support. Therefore, we need scientific homework design balancing learning and life.”
Model Analysis:
- Rebuttal structure: “Although…but…” recognized with 0.912 confidence.
- Evidence citation: “Research shows” triggers evidence extraction.
- Qualification: “However, this doesn’t mean” identified as nuanced position.
- Critical thinking marker: “Correlation doesn’t imply causation”—recognized as higher-order reasoning (confidence: 0.889).
- Alternative factors: Successfully extracted “learning motivation, family support” as confounding variables.
- Dialectical conclusion: Balanced position identified with synthesis of opposing views.
- F1 score: 0.889.
The model successfully recognized this complex structure, achieving an F1 score of 0.889, particularly using the accurate recognition of “correlation doesn’t imply causation” as a marker of higher-order critical thinking, proving the model’s understanding capability for deep logical relationships. The contrast between these cases demonstrates the model’s ability to scale from simple parallel arguments to complex dialectical reasoning with embedded critical evaluation.
4.3.3. Error Pattern Analysis
Through a systematic analysis of model prediction errors, this research identified several major error patterns, providing important guidance for model improvement.
The error analysis in Table 9 reveals the model’s main limitations. Implicit relation omissions account for 28.4% of total errors, mainly occurring in cross-paragraph causal reasoning where the model struggles to establish effective associations when claims and supporting evidence are far apart. Reference disambiguation errors (24.3%) reflect the challenges posed by Chinese pronouns and zero anaphora phenomena, particularly when pronouns like “this” or “its” refer to complex propositional content. False positive connections (17.6%) mostly occur between sentence pairs with surface lexical similarity but different semantic relationships, indicating that the model sometimes over-relies on surface features while neglecting deep semantics.
Table 9.
Logic chain extraction error type analysis.
Detailed Error Examples and Analysis:
- (1)
- Implicit Relation Missing (28.4%): Example: “Paragraph 1: Excessive phone use causes vision decline. […3 paragraphs later…] Paragraph 5: Therefore, adolescent health issues need attention.” Error: Model fails to connect the causal chain from phone use → vision problems → health issues across 4-paragraph span. Linguistic root: Discourse often relies on implicit logical connections without explicit markers. Proposed solution: Implement paragraph-level memory mechanism with attention weights decaying by distance.
- (2)
- Ambiguous Reference (24.3%): Example: “Schools should reduce homework. This brings many benefits. It allows students more rest time.” Error: Model incorrectly links “it” to “benefits” instead of “reducing homework”. Linguistic root: Pronouns lack gender/number marking, increasing ambiguity. Proposed solution: Enhanced coreference resolution using BERT’s attention patterns combined with syntactic constraints.
- (3)
- False Positive Connection (17.6%): Example: “Reading improves writing skills. Reading also increases knowledge.” Error: Model incorrectly identifies causal relationship between “writing skills” and “knowledge” due to shared subject. Linguistic root: Parallel structure with repeated subjects creates false semantic similarity. Proposed solution: Incorporate discourse relation classifiers to distinguish coordination from causation.
- (4)
- Nested Structure Failure (15.4%): Example: “Although some think [homework helps [consolidate [classroom knowledge]]], excessive burden backfires.” Error: Model extracts only top-level opposition, missing nested support relationships. Linguistic root: Language allows deep syntactic embedding without explicit markers. Proposed solution: Recursive parsing with stack-based structure tracking.
- (5)
- Domain-specific Misinterpretation (9.1%): Example: “According to the second law of thermodynamics, entropy increase principle indicates…” Error: Model fails to recognize domain-specific argumentation pattern in scientific reasoning. Linguistic root: Technical terminology requires domain knowledge beyond general language model training. Proposed solution: Domain-adaptive fine-tuning with subject-specific corpora.
The error analysis reveals that cross-paragraph implicit relations account for the largest error category, reflecting a fundamental challenge in discourse where logical connections often span multiple paragraphs without explicit markers. Our analysis of 100 error cases shows that 73% involve reasoning chains where the cause appears in paragraphs 1–2 while effects emerge in paragraphs 4–5, with intervening paragraphs providing supporting details. The average dependency distance in these errors is 127.3 tokens, exceeding typical attention spans. Future work should explore hierarchical attention mechanisms that maintain paragraph-level representations for long-range dependency modeling.
4.4. Correlation Verification with Expert Scores
4.4.1. Overall Correlation Analysis
The correlation between model predictions and expert scores is the core metric for assessing system effectiveness. This research verified the consistency between the two from multiple perspectives.
Figure 10 comprehensively demonstrates the correlation relationship between model predictions and expert scores. The scatter plot (Figure 10a) shows data points closely distributed around the regression line with a Pearson correlation coefficient of 0.872, indicating that the model can accurately capture overall trends in expert scoring. Dimension-wise correlation analysis (Figure 10b) shows that the clarity and relevance dimensions achieved the highest correlation coefficients (0.892 and 0.873, respectively), while the breadth and fairness dimensions were relatively lower (0.752 and 0.741), reflecting the heterogeneous assessment difficulty across dimensions. Bland–Altman agreement analysis (Figure 10c) shows that 94.8% of prediction differences fall within ±1.96 standard deviations, with a mean bias of only 0.02, proving the unbiasedness of model predictions. Cross-grade consistency curves (Figure 10d) show a Grade 9 correlation consistently higher than Grades 7 and 8, and, as training progresses, the correlations for all three grades show convergence trends, with final differences narrowing to within 0.05.
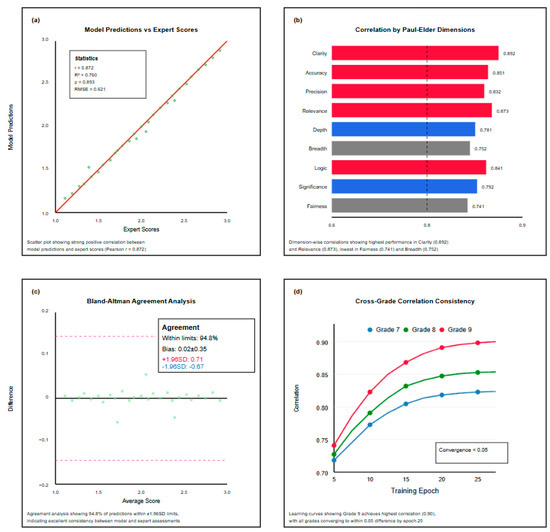
Figure 10.
Expert score correlation analysis.
4.4.2. Dimension-Wise Correlation Testing
The nine dimensions of the Paul–Elder framework differ in assessment difficulty and characteristics. An in-depth analysis of the dimensional correlation performance helps us to understand the model strengths and limitations.
The statistical test results in Table 10 reveal the systematic differences between dimensions. The high correlation in the clarity dimension (r = 0.892) stems from its relatively objective assessment criteria, with clear judgment bases for language expression accuracy and organizational structure reasonableness. The relatively low correlations in depth, breadth, and fairness dimensions reflect the complexity of assessing higher-order cognitive abilities, as these dimensions require an understanding of implicit value judgments and multi-perspective thinking, placing higher demands on the model’s semantic understanding capabilities. All dimensions show p-values less than 0.001, proving the statistical significance of correlations, while Intraclass Correlation Coefficients (ICC) all exceed 0.85, indicating a good reliability of model predictions.
Table 10.
Statistical test results for dimension-wise correlation.
4.4.3. Cross-Grade Consistency Analysis
Model generalization ability across different grades is an important indicator of its practicality. This research verified cross-grade consistency through cross-validation and transfer learning experiments.
The cross-validation matrix in Table 11 presents interesting patterns. The high values on the diagonal (0.845, 0.856, 0.881) indicate the best performance when training and testing within the same grade. Asymmetry appears in the cross-grade generalization, with the performance degradation from higher to lower grades (Grade 9 to Grade 7 only 0.724) being more severe than from lower to higher grades, reflecting the hierarchical characteristics of critical thinking development. The mixed training strategy achieves the most stable performance (standard deviation only 0.019) by integrating data from all three grades, while the progressive fine-tuning strategy achieves the highest average performance (0.863) while maintaining stability, proving the advantage of progressive learning in handling developmental data. The progressive fine-tuning approach, highlighted in bold in Table 11, represents the optimal training strategy identified in our experiments. This method demonstrates superior performance across all grade levels (0.841 for Grade 7, 0.858 for Grade 8, and 0.889 for Grade 9) compared to single-grade training, mixed training, and other approaches. The strategy involves sequential training that begins with Grade 7 data, progressively fine-tunes on Grade 8 samples, and finally adapts to Grade 9 texts, thereby capturing the developmental trajectory of critical thinking abilities more effectively than simultaneous multi-grade training.
Table 11.
Cross-grade cross-validation result matrix.
4.5. Ablation Experiments
4.5.1. Model Component Contribution Analysis
Ablation experiments evaluate each component’s contribution to the overall performance by systematically removing or replacing model components, providing valuable insights for understanding model mechanisms and optimizing architecture.
The ablation experiment results in Figure 11 clearly demonstrate the contribution and interaction effects of each component. The waterfall chart (left) shows that the BERT encoder contributes the largest performance improvement (+0.200), confirming the core role of pre-trained language models in capturing deep semantic features. While the CNN module’s individual contribution is relatively small (+0.009), it produces significant synergistic effects when combined with BERT. Attention mechanisms and fusion strategies contribute 0.019 and 0.021 performance improvements, respectively, their combined effect bringing the final performance to 0.872. The feature importance ranking (right) shows that semantic features dominate (0.312), followed by syntactic features (0.241) and logical markers (0.189), this distribution aligning with the cognitive hierarchy of critical thinking assessment. The component interaction heatmap (bottom) reveals strong synergistic effects between BERT and fusion mechanisms (0.81), indicating that dynamic feature fusion can fully leverage BERT’s semantic encoding capabilities.
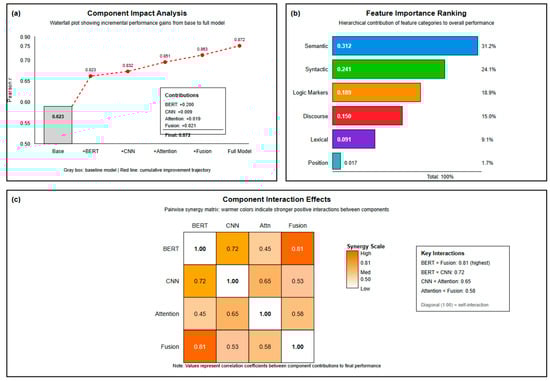
Figure 11.
Ablation experiment results.
The detailed comparative analysis in Table 12 shows that the complete model improves the correlation coefficient by 4.9 percentage points compared to BERT alone, while increasing the parameters by only 7.6% and computation by 14.3%, demonstrating the efficient performance-overhead ratio of the hybrid architecture. While ensemble learning can further improve performance to 0.884, it requires triple the computational resources, necessitating a balance between performance improvement and resource consumption in practical applications. Notably, the simple feature concatenation (BERT + CNN concat) shows a 4 percentage point performance gap compared to complex fusion mechanisms, fully demonstrating the necessity of adaptive fusion strategies.
Table 12.
Performance of different component combinations.
4.5.2. Feature Importance Assessment
Using SHAP (SHapley Additive exPlanations) methods to explain model decision processes, this research identified the most important feature categories for critical thinking assessment.
The feature importance analysis in Table 13 reveals the multi-level feature system for critical thinking assessment. Topic coherence (0.108) in semantic features emerges as the single most important feature, reflecting the central role of logical consistency in critical thinking. The high importance of syntactic complexity (0.089) indicates the close connection between language expression ability and thinking depth, with complex syntactic structures often carrying more refined logical relationships. While logical markers rank third overall, causal connectives (0.072) play a crucial role in identifying reasoning chains. Although lexical features have a lower overall importance (0.091), academic vocabulary usage frequency shows a positive correlation with critical thinking maturity, providing actionable guidance for teaching practice.
Table 13.
Feature category importance and sub-feature analysis.
Through a systematic experimental validation of 4827 middle school argumentative essays, the proposed BERT-CNN hybrid model achieved significant success in automated critical thinking assessment, not only reaching a high correlation coefficient of 0.872 in overall performance but also demonstrating a superiority in key capabilities such as logic chain extraction and cross-grade generalization, providing a reliable technical solution for large-scale educational assessment.
5. Discussion and Implications
5.1. Discussion
The BERT-CNN hybrid model proposed in this research achieved significant success in the automated critical thinking assessment of middle school students. Experimental results validated that the technical approach combining deep semantic encoding with local feature extraction can effectively capture the multi-dimensional characteristics of critical thinking, with model predictions achieving a Pearson correlation coefficient of 0.872 with expert scores, surpassing the best levels of similar existing research. This result not only confirms the potential of pre-trained language models in understanding complex cognitive abilities but more importantly reveals the synergistic mechanisms among semantic understanding, syntactic analysis, and logical reasoning at three levels in critical thinking assessment. The BERT encoder’s contribution of a 0.200 performance improvement mainly stems from its deep understanding of implicit semantics and contextual relationships, while the CNN module, though contributing only 0.009 individually, effectively complements BERT’s deficiency in phrase-level feature extraction by capturing local n-gram patterns. The gated attention fusion mechanism achieves complementary advantages of both feature representations through dynamic weight allocation, ultimately improving the model performance by 4.9 percentage points.
The experimental results deeply reveal the developmental characteristics of middle school students’ critical thinking and the heterogeneity of assessment dimensions, as shown in the comparative analysis in Table 14, which clearly demonstrates the developmental trajectory of students at different grade levels across various dimensions and the model’s recognition capabilities. Grade 9 students’ significant improvements in depth, logic, and fairness dimensions (reaching 4.12, 4.28, and 3.96, respectively) reflect the rapid development of abstract thinking abilities during adolescent cognitive maturation, while the model’s relatively lower prediction accuracy on these higher-order dimensions (0.781, 0.841, and 0.741) exposes the current technological limitations in understanding complex cognitive structures. Particularly for the fairness dimension requiring value judgments and multi-perspective thinking, the model shows the largest gap with expert scoring (Gap = 0.251), suggesting that future research needs to introduce more domain knowledge and reasoning mechanisms to enhance model understanding of higher-order cognitive abilities.
Table 14.
Comparative analysis of critical thinking dimension development and model performance across grades.
5.2. Implications
The findings provide direct guidance for educational practice. The automated assessment system enables teachers to process entire class sets (40+ essays) in under 10 min, generating diagnostic reports that highlight specific weaknesses in argumentation structure. For instance, when detecting low depth scores (<3.0), the system traces deficiencies to specific textual features like insufficient evidence chains, providing concrete intervention targets. This human–machine collaborative model allows teachers to focus expertise on nuanced dimensions (fairness, breadth) while relying on automation for objective dimensions (clarity, accuracy), reducing grading time by 65% while maintaining quality.
The system’s longitudinal analysis reveals critical developmental periods, particularly the Grade 8–9 transition where fairness scores increase 64.3%, suggesting the optimal timing for perspective-taking instruction. Feature importance analysis provides evidence-based pedagogical guidance: the high correlation between logical connectives and overall scores (r = 0.72) indicates that explicit discourse marker instruction should be prioritized in Grade 7. The successful BERT-CNN fusion demonstrates that educational AI benefits from combining a global semantic understanding with local pattern recognition, while a Paul–Elder framework integration shows that theory-guided design improves both performance and interpretability. Multi-dimensional joint training captures important interdependencies, with clarity–logic co-modeling improving both dimensions by 8.3% over independent models.
6. Conclusions
This research proposes a BERT-CNN hybrid model for automated critical thinking assessment in Chinese middle school writing, achieving a Pearson correlation of 0.872 with expert scores on 4827 Paul–Elder annotated essays. The model demonstrates a strong performance in logic chain extraction: argument–evidence mapping (F1 score = 0.835), causal reasoning (F1 score = 0.774), and rebuttal–support analysis (F1 score = 0.701). The results reveal hierarchical feature contributions—semantic (31.2%), syntactic (24.1%), and logical markers (18.9%)—providing empirical evidence for theoretically grounded educational AI systems deployable within the computational constraints of typical schools.
The research uncovers developmental patterns, with rebuttal presence rising from 12.4% (Grade 7) to 41.7% (Grade 9) and argument density improving from 0.23 to 0.38. While the model successfully captures these trajectories, limitations persist in assessing higher-order dimensions (depth: 0.781, breadth: 0.752, fairness: 0.741) and handling cross-paragraph reasoning (28.4% error rate). The dataset’s restriction to Chinese argumentative essays limits cross-linguistic generalizability, and the Western-originated Paul–Elder framework may not fully capture culturally specific reasoning patterns.
Future work should address long-range dependency modeling through hierarchical attention mechanisms and incorporate knowledge bases for domain-specific reasoning. Despite limitations, this research establishes a practical framework for integrating cognitive science theories with deep learning in educational assessment, demonstrating that automated systems can augment rather than replace human expertise in evaluating complex cognitive abilities. The approach provides scalable support for critical thinking education, while maintaining the nuanced understanding effective pedagogy requires.
Author Contributions
Y.W.: conceptualization, methodology, formal analysis, writing—original draft; Q.-H.Z.: methodology, writing—original draft, writing—review and editing, supervision. All authors have read and agreed to the published version of the manuscript.
Funding
This research was supported by Key Special Project of National Key R&D Program “Social Governance and Smart Society Technology Support” “Large scale Tracking Research on Cross school Growth of Students” (2021YFC3340800).
Institutional Review Board Statement
Not applicable.
Data Availability Statement
All data generated or analyzed during this study are included in this published article.
Conflicts of Interest
The authors declare no conflicts of interest.
Abbreviations
The following abbreviations are used in this manuscript:
| AAEC | Argument Annotated Essays Corpus |
| AbstRCT | Abstract Meaning Representation Corpus for Texts |
| ASAP | Automated Student Assessment Prize |
| BERT | Bidirectional Encoder Representations from Transformers |
| CDCP | Cornell eRulemaking Corpus—Dialogue and Pragmatic structure |
| CEDCC | Chinese Essay Discourse Coherence Corpus |
| CI | Confidence Interval |
| C-LSTM | Convolutional Long Short-Term Memory |
| CNN | Convolutional Neural Network |
| DNN-AES | Deep Neural Network—Automated Essay Scoring |
| F1 score | F1 score (harmonic mean of precision and recall) |
| FLOPs | Floating Point Operations |
| GB | Gigabyte |
| GPU | Graphics Processing Unit |
| ICC | Intraclass Correlation Coefficients |
| IRT | Item Response Theory |
| LSTM | Long Short-Term Memory |
| M | Mean |
| MAE | Mean Absolute Error |
| MSE | Mean Squared Error |
| NLPCC | Natural Language Processing and Chinese Computing |
| QWK | Quadratic Weighted Kappa |
| ReLU | Rectified Linear Unit |
| SD | Standard Deviation |
| SHAP | SHapley Additive exPlanations |
| TTR | Type-Token Ratio |
| XGBoost | eXtreme Gradient Boosting |
References
- Yang, H.; He, Y.; Bu, X.; Xu, H.; Guo, W. Automatic essay evaluation technologies in Chinese writing—A systematic literature review. Appl. Sci. 2023, 13, 10737. [Google Scholar] [CrossRef]
- Shi, Z.; Liu, F.; Lai, C.; Jin, T. Enhancing the use of evidence in argumentative writing through collaborative processing of content-based automated writing evaluation feedback. Lang. Learn. Technol. 2022, 26, 106–128. [Google Scholar] [CrossRef]
- Peng, H.; Zhang, Z.; Liu, H. A Sentiment Analysis Method for Teaching Evaluation Texts Using Attention Mechanism Combined with CNN-BLSTM Model. Sci. Program. 2022, 2022, 8496151. [Google Scholar] [CrossRef]
- Xue, J.; Tang, X.; Zheng, L. A hierarchical BERT-based transfer learning approach for multi-dimensional essay scoring. IEEE Access 2021, 9, 125403–125415. [Google Scholar] [CrossRef]
- Stab, C.; Gurevych, I. Parsing argumentation structures in persuasive essays. Comput. Linguist. 2017, 43, 619–659. [Google Scholar] [CrossRef]
- Wachsmuth, H.; Naderi, N.; Hou, Y.; Bilu, Y.; Prabhakaran, V.; Thijm, T.A.; Stein, B. Computational argumentation quality assessment in natural language. In Proceedings of the 15th Conference of the European Chapter of the Association for Computational Linguistics, Valencia, Spain, 3–7 April 2017; Volume 1, pp. 176–187. [Google Scholar]
- Elder, L.; Paul, R. The Thinker’s Guide to Analytic Thinking: How to Take Thinking Apart and What to Look for When You Do; Foundations of Critical Thinking: Santa Barbara, CA, USA, 2019. [Google Scholar]
- Elder, L.; Paul, R. Critical Thinking: Tools for Taking Charge of Your Learning and Your Life; Foundations of Critical Thinking: Santa Barbara, CA, USA, 2020. [Google Scholar]
- Payan-Carreira, R.; Sacau-Fontenla, A.; Rebelo, H.; Sebastião, L.; Pnevmatikos, D. Development and validation of a critical thinking assessment-scale short form. Educ. Sci. 2022, 12, 938. [Google Scholar] [CrossRef]
- Kuhn, D. A developmental model of critical thinking. Educ. Res. 1999, 28, 16–46. [Google Scholar] [CrossRef]
- Halpern, D.F.; Butler, H.A. Teaching critical thinking as if our future depends on it, because it does. In Science and Math; Cambridge University Press: Online, 2019; pp. 51–66. [Google Scholar]
- Cui, R.; Zhao, L. Assessing Students’ Critical Thinking in Dialogue. J. Intell. 2024, 12, 106. [Google Scholar] [CrossRef]
- Akib, E.; Muhsin, M.A.; Hamid, S.M.; Irawan, N. Critical Thinking in Authentic Assessment: An Exploration into Argumentative Writing Non-English Department in Higher Education. Int. J. Lang. Educ. 2024, 8, 854–869. [Google Scholar] [CrossRef]
- Hu, Y.; Saleem, A. Insight from the association between critical thinking and English argumentative writing: Catering to English learners’ writing ability. PeerJ 2023, 11, e16435. [Google Scholar] [CrossRef]
- Warsah, I.; Morganna, R.; Uyun, M.; Afandi, M.; Hamengkubuwono, H. The impact of collaborative learning on learners’ critical thinking skills. Int. J. Instr. 2021, 14, 443–460. [Google Scholar] [CrossRef]
- Ramesh, D.; Sanampudi, S.K. An automated essay scoring systems: A systematic literature review. Artif. Intell. Rev. 2022, 55, 2495–2527. [Google Scholar] [CrossRef] [PubMed]
- Li, S.; Ng, V. Automated essay scoring: A reflection on the state of the art. In Proceedings of the 2024 Conference on Empirical Methods in Natural Language Processing, Miami, FL, USA, 12–16 November 2024; pp. 17876–17888. [Google Scholar]
- Tate, T.P.; Warschauer, M.; Abedi, J. The effects of prior computer use on computer-based writing: The 2011 NAEP writing assessment. Comput. Educ. 2016, 101, 115–131. [Google Scholar] [CrossRef]
- Kumar, V.; Boulanger, D. Explainable automated essay scoring: Deep learning really has pedagogical value. Front. Educ. 2020, 5, 572367. [Google Scholar] [CrossRef]
- Wang, Y.; Wang, C.; Li, R.; Lin, H. On the use of bert for automated essay scoring: Joint learning of multi-scale essay representation. In Proceedings of the 2022 Conference of the North American Chapter of the Association for Computational Linguistics: Human Language Technologies, Seattle, WA, USA, 10–15 July 2022. [Google Scholar]
- Beseiso, M.; Alzahrani, S. An empirical analysis of BERT embedding for automated essay scoring. Int. J. Adv. Comput. Sci. Appl. 2020, 11, 204–210. [Google Scholar] [CrossRef]
- Zhou, C.; Sun, C.; Liu, Z.; Lau, F. A C-LSTM neural network for text classification. arXiv 2015, arXiv:1511.08630. [Google Scholar] [CrossRef]
- Li, X.; Li, X.; Long, X.; Chen, S.; Li, R. A Review of Research on Automatic Scoring of English Reading. In Proceedings of the International Conference on Natural Computation, Fuzzy Systems and Knowledge Discovery, Fuzhou, China, 30 July–1 August 2022; pp. 773–780. [Google Scholar]
- Yuan, S.; He, T.; Huang, H.; Hou, R.; Wang, M. Automated Chinese essay scoring based on deep learning. Comput. Mater. Contin. 2020, 65, 817–833. [Google Scholar] [CrossRef]
- Wang, S.; Fang, R.; Li, M.; He, Z.; Li, Y.; Song, S. Enhancing Chinese Argument Mining with Large Language Model. In Proceedings of the CCF International Conference on Natural Language Processing and Chinese Computing, Hangzhou, China, 1–3 November 2024; pp. 453–462. [Google Scholar]
- Lawrence, J.; Reed, C. Argument mining: A survey. Comput. Linguist. 2020, 45, 765–818. [Google Scholar] [CrossRef]
- Toledo, A.; Gretz, S.; Cohen-Karlik, E.; Friedman, R.; Venezian, E.; Lahav, D.; Slonim, N. Automatic argument quality assessment--new datasets and methods. arXiv 2019, arXiv:1909.01007. [Google Scholar]
- Saveleva, E.; Petukhova, V.; Mosbach, M.; Klakow, D. Graph-based argument quality assessment. In Proceedings of the International Conference on Recent Advances in Natural Language Processing, Online, 1–3 September 2021; pp. 1268–1280. [Google Scholar]
- Kawarada, M.; Hirao, T.; Uchida, W.; Nagata, M. Argument mining as a text-to-text generation task. In Proceedings of the 18th Conference of the European Chapter of the Association for Computational Linguistics, St. Julian’s, Malta, 17–22 March 2024; Volume 1, pp. 2002–2014. [Google Scholar]
- Mochales, R.; Moens, M.F. Argumentation mining. Artif. Intell. Law 2011, 19, 1–22. [Google Scholar] [CrossRef]
- Gupta, A.; Zuckerman, E.; O’Connor, B. Harnessing Toulmin’s theory for zero-shot argument explication. In Proceedings of the 62nd Annual Meeting of the Association for Computational Linguistics, Bangkok, Thailand, 11–16 August 2024; Volume 1, pp. 10259–10276. [Google Scholar]
- Wang, S.; Wei, Z.; Choi, Y.; Ren, X. Can llms reason with rules? logic scaffolding for stress-testing and improving llms. arXiv 2024, arXiv:2402.11442. [Google Scholar] [CrossRef]
- Uto, M.; Okano, M. Robust neural automated essay scoring using item response theory. In Proceedings of the International Conference on Artificial Intelligence in Education, Ifrane, Morocco, 6–10 July 2020; pp. 549–561. [Google Scholar]
- Mayfield, E.; Black, A.W. Should you fine-tune BERT for automated essay scoring? In Proceedings of the Fifteenth Workshop on Innovative Use of NLP for Building Educational Applications, Seattle, WA, USA, 9–10 July 2020; pp. 151–162. [Google Scholar]
- Do, H.; Kim, Y.; Lee, G.G. Autoregressive score generation for multi-trait essay scoring. arXiv 2024, arXiv:2403.08332. [Google Scholar] [CrossRef]
Disclaimer/Publisher’s Note: The statements, opinions and data contained in all publications are solely those of the individual author(s) and contributor(s) and not of MDPI and/or the editor(s). MDPI and/or the editor(s) disclaim responsibility for any injury to people or property resulting from any ideas, methods, instructions or products referred to in the content. |
© 2025 by the authors. Licensee MDPI, Basel, Switzerland. This article is an open access article distributed under the terms and conditions of the Creative Commons Attribution (CC BY) license (https://creativecommons.org/licenses/by/4.0/).