Article

Research on Leakage Localization in Gaseous CO2 Pipelines Using the Acoustic Emission Method

1
Karamay Campus, China University of Petroleum (Beijing), Karamay 834000, China
2
Xinjiang Key Laboratory of Multi-Medium Pipeline Safety Transportation, Urumqi 830011, China
*
Author to whom correspondence should be addressed.
Appl. Sci. 2025, 15(19), 10501; https://doi.org/10.3390/app151910501
Submission received: 29 August 2025 / Revised: 17 September 2025 / Accepted: 24 September 2025 / Published: 28 September 2025
(This article belongs to the Topic Oil and Gas Pipeline Network for Industrial Applications)

Abstract

In the CCUS industrial chain, the pipeline transportation of CO2 is a crucial link that connects the upstream and downstream. However, currently, there is still no reliable, stable, and efficient method for detecting pipeline leaks. Based on the time difference in arrival (TDOA) localization method within the acoustic emission technique, this study conducted preliminary experiments on air pipeline leak localization and experiments on gaseous CO2 pipeline leak localization, thereby establishing the applicability of acoustic emission technology for leak detection in gaseous CO2 pipelines. In the preliminary experiment on air pipeline leak location, the SNR (signal-to-noise ratio) of the CEEMDAN denoising algorithm is greater than that of the EEMD denoising algorithm. The larger the SNR, the smaller the signal interference, which proves the superiority of the CEEMDAN denoising algorithm. In the experiment on gaseous CO2 pipeline leak location, the CEEMDAN denoising algorithm was adopted. Five time-delay estimation methods, namely GCC, Roth weighting, PHAT weighting, ML weighting, and SCOT weighting, were used for location calculations. The positioning accuracies were 10.6%, 6.9%, 6.9%, 8.6%, and 8.6% respectively, all meeting the engineering accuracy requirements. Combining the results of the preliminary experiment on air pipeline leak location, the Roth weighting time-delay estimation method is recommended. The results show that: Acoustic emission technology can be used for the leak location of gaseous CO2 pipelines.

1. Introduction

In response to the climate crisis and to reduce carbon emissions, China proposed in 2020 that it aims to peak carbon emissions by 2030 and achieve carbon neutrality by 2060. Carbon emissions need to shift from relative reduction to absolute reduction, and ultimately achieve zero carbon emissions [1]. At present, China is vigorously researching, developing, and promoting the CCUS (Carbon Capture, Utilization, and Storage) technology. This technology not only plays an indispensable role in coal emission reduction and reducing global carbon emissions but also lays the foundation for the early realization of the “dual carbon” goals.
CCUS typically consists of three stages. First, carbon dioxide is captured and separated from sources such as fossil fuel power plants and industrial process derivatives. Then, it is transported via tank trucks, railways, pipelines, and sea transportation to suitable scenarios such as enhanced oil recovery by fracturing and chemical production for utilization or storage [2]. The CCUS technology not only greatly facilitates the low-carbon utilization of oil and natural gas and promotes efficient carbon reduction in the steel industry, but also holds great significance in terms of reducing non-carbon dioxide greenhouse gas emissions and ultimately achieving the carbon neutrality goal [3].
Due to the misaligned distribution characteristics of carbon sources and carbon sinks, the use of pipelines to transport CO2 has become a crucial link in connecting the upstream and downstream of the CCUS industrial chain. The construction of large-scale CO2 transportation pipelines is imperative [4,5]. However, during the operation of carbon dioxide pipelines, leakage accidents may occur due to impacts such as third-party damage, operational accidents, pipeline corrosion, and geological disasters like debris flows and landslides [6]. CO2 is colorless and odorless, and its gas diffusion is difficult to detect. As a suffocating gas, a high concentration of CO2 (the semi-lethal concentration is 5%) can be fatal with only a small amount inhaled. When a CO2 pipeline, especially the above-ground pipeline in the station yard, leaks, it not only poses a suffocation risk to surrounding residents and operating personnel but also, as the CO2 gas spreads rapidly, forms a large suffocation hazard area in low-lying areas. In addition, CO2 forms dry ice in a low-temperature environment, which further increases the risk of frostbite for emergency rescue personnel [7]. Therefore, developing a carbon dioxide pipeline leakage monitoring system with the function of accurately locating leakage points can effectively reduce the risks of frostbite and suffocation caused by CO2 leakage and promptly issue effective warnings to surrounding residents and maintenance workers.

2. Research Status

2.1. Common Leak Detection Methods for Gas Transmission Pipelines

In the aspect of leakage detection and location of oil and gas transmission pipelines, rich experience has been accumulated and many achievements have been made in terms of theoretical research, technical application, and product development [8]. Generally, the leakage detection of gas transmission pipelines is more difficult than that of oil pipelines. This is because the gas-phase medium has a relatively large compressibility, and important parameters such as the pressure and density of the medium during transportation are often not constant values. At the same time, the variation laws of the negative pressure wave and stress wave generated after a leak during their propagation are not obvious. This means that some detection methods with excellent performance in oil pipelines are difficult to be directly applied to gas pipelines.
At present, the common leak detection methods for gas transmission pipelines are as follows:
(1)
Infrared imaging detection method
When the fluid in the pipeline, such as natural gas, leaks, it quickly discharges to the outside, causing the surrounding temperature to drop. Infrared sensors can detect the temperature changes within a certain range. Therefore, the occurrence of a leak can be judged by the rapid changes in the ambient temperature around the pipeline [9]. The detection range of the infrared thermal imaging method is limited, but its flexibility can be improved by mounting it on unmanned aerial vehicles or vehicles. However, the cost of the infrared imaging method is still relatively high at present. For buried long-distance pipelines, since the pipelines are laid in the soil, it is difficult to detect and handle the leak immediately when it occurs.
(2)
Equipment Wall Detection Method
This method is usually based on non-destructive testing technologies such as magnetic flux leakage testing, ultrasonic testing, eddy current testing, visual inspection, and radiographic testing. It determines whether a leak has occurred by detecting defects on the equipment wall. This method can use equipment for external detection of the pipeline, or be made into a small detector and placed inside the equipment for detection. Moreover, combined with pipeline robot technology, the detection equipment can move inside the pipeline and realize multiple functions such as leak detection, spraying, welding, and cleaning. Figure 1a–g shows inspection robots with different mechanical structures and driving forms [10].
The advantages of the equipment wall detection method are that it theoretically has a very high detection accuracy and can even give early warnings before a leak occurs. The disadvantages are that the external detection method is ineffective for buried equipment, and the internal detection method is prone to blockage accidents at bends, vertical sections, and pipe diameter changes. In addition, when detecting, it is necessary to scan the equipment wall, which involves a large amount of work and is difficult to achieve real-time continuous monitoring. At present, the detection cost is relatively high. With the progress of technology, miniaturized, intelligent detection robots with built-in systems and high-pressure resistance will have great application potential.
(3)
Distributed Optical Fiber Method
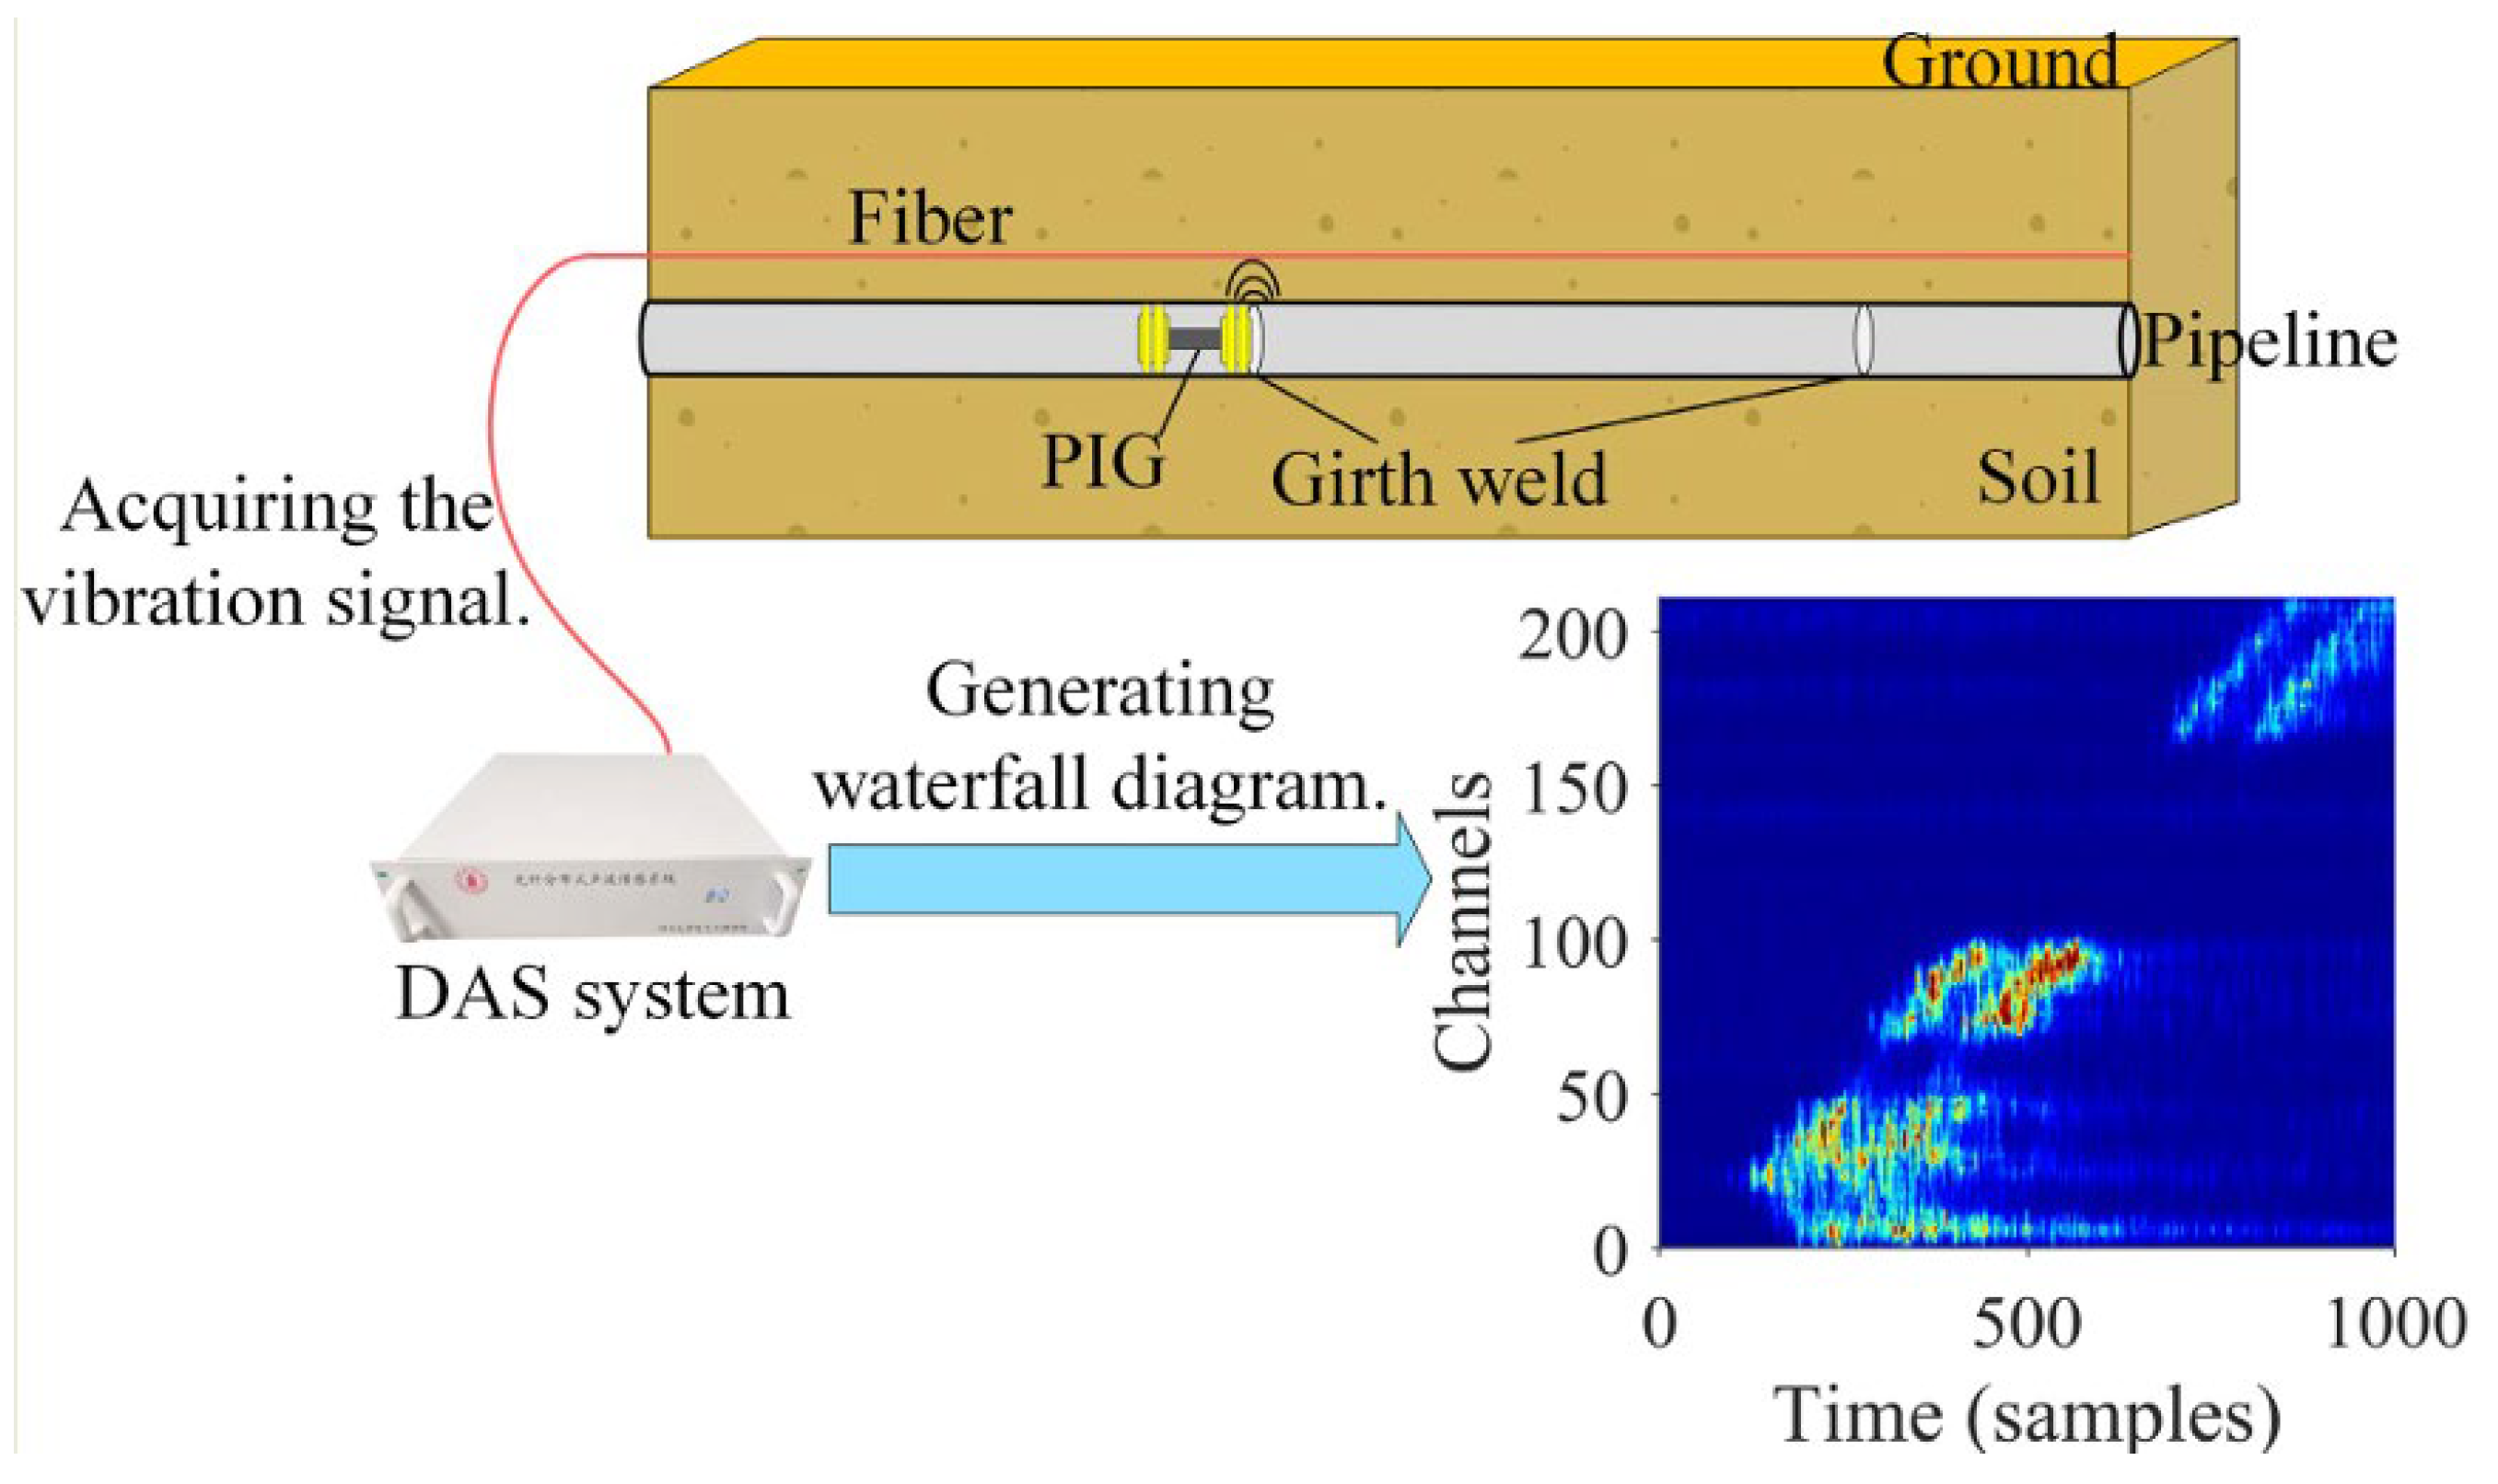
Distributed optical fiber detection technology is a method that uses optical fiber sensors to monitor pipelines in real time. In this technology, an optical fiber cable is installed along the pipeline. By detecting changes in optical fiber signals, the status of the pipeline, including changes in parameters such as temperature and vibration, is monitored to determine whether a pipeline leak has occurred [11]. The principle of the distributed optical fiber detection system is shown in Figure 2. The distributed optical fiber method is often used in combination with other detection methods and is suitable for small-scale and high-precision detection and positioning. The advantage is that it can achieve all-around real-time detection. However, since the optical fiber cable is laid over a long distance along the pipeline, there are problems such as high equipment costs, high maintenance costs, and a large amount of construction work.
(4)
Negative Pressure Wave Detection Method
When a leak point appears in the pipeline, the pressure at the leak point drops suddenly, forming a certain pressure difference with adjacent areas. Fluids in other areas will flow into the leak point to compensate for the pressure drop at the leak point, resulting in a slow overall pressure drop of the fluid in the pipeline. Pressure sensors installed at both ends of the pipeline can capture the negative pressure wave generated by the leak point. By calculating the pressure gradient characteristics and the pressure time difference, the location of the leak point can be quickly determined [13]. The disadvantage of the negative pressure wave detection method is that under the influence of external noise, false negatives and false positives may occur when the pipeline has a minor or slow leak. To improve the accuracy, empirical mode decomposition (EMD) and variational mode decomposition (VMD) are often used for noise reduction. The advantages of this method are easy operation, convenient maintenance, low cost, rapid response, wide detection range, and strong applicability. It has been successfully applied to long-distance natural gas pipelines.
(5)
Acoustic Emission Detection Method
When a pipeline leaks, due to the pressure difference between the inside and outside of the pipeline, the fluid jets from the inside to the outside of the pipeline through the leak hole, forming a sound source. The sound wave generated by the leak source propagates along the pipeline wall. By collecting and analyzing the acoustic emission signals, leak detection can be achieved [14]. Combining the sensor layout and positioning algorithm can realize the localization of the leak source.
Each of the above detection methods has its own advantages and limitations.
Although the infrared imaging method has a relatively wide detection range, its cost is high, and the detection accuracy for buried pipeline leaks is not good.
The equipment wall detection method has extremely high detection accuracy and can provide real-time feedback on the pipeline status to achieve leak prediction. However, its cost is relatively high, and it is prone to blockage accidents in pipelines with complex geometric shapes.
The distributed optical fiber method has high detection accuracy and can perform real-time detection. However, the cost of laying optical fibers is high, and the maintenance cost and construction volume are large.
The negative pressure wave detection method has a low cost. However, under the influence of external noise, false negatives and false positives may occur, and it is not applicable to pipelines transporting multi-phase media.
The acoustic emission method has obvious advantages in leak detection: Firstly, in terms of hardware equipment, acoustic emission sensors are small in size and easy to install. Meanwhile, during installation and maintenance, only the soil and insulation layer at specific locations need to be dug, which does not affect the normal operation of the pipeline. This greatly reduces the cost of leakage detection and transformation of in-service pipelines [15]. Secondly, in terms of the detection principle, the acoustic emission method belongs to non-destructive testing. During the detection process, it will not damage the internal flow field of the pipeline. It has a fast detection speed and high sensitivity, and can achieve real-time and continuous monitoring of long-distance pipelines. Finally, in terms of detection cost, its system composition is relatively simple. Compared with monitoring technologies such as distributed optical fibers, it has a higher cost-performance ratio [16]. However, the acoustic emission method also has its drawbacks. The propagation of acoustic waves strongly depends on the length and characteristics of the path they travel. The position of the sensors needs to be carefully evaluated based on the geometry of the specimen under analysis
A comparison of the advantages and disadvantages of different detection methods is shown in Table 1. No matter which method is used, the main goal is to improve the sensitivity and accuracy of leak detection. The selection of the leak detection and location technology method needs to be comprehensively determined according to the on-site conditions.

2.2. Application of Acoustic Emission Leak Detection Method

At present, real-time monitoring systems are mostly used for leak early warning in long-distance gas pipelines [17]. Among them, the acoustic emission method has obvious advantages in detecting gas pipeline leaks. In 1950, Kaiser [18] observed the acoustic emission phenomenon of metals and discovered the irreversibility of acoustic emission, laying the physical foundation for acoustic emission detection. In the following decades, the theory and application of acoustic emission technology have been continuously developed. In the 1970s, the Dunegan team in the United States successfully developed a high-frequency modern acoustic emission instrument, solving the problem of capturing tiny leak signals and achieving the first online monitoring of crack growth in chemical containers. In 1978, Grabec [19] carried out simulation experiments on discrete and continuous acoustic emission signals and proposed the cross-correlation method for time difference estimation of signals. In 1997, ASTM issued the standard E1930-97, specifying the sensor frequency for acoustic emission detection of storage tanks, promoting the standardization of online detection of petrochemical storage tanks.
In 2004, Jiao Jingpin et al. [20]. analyzed the main characteristics of leak acoustic emission signals through leakage experiments of water-filled pipelines and pointed out that modal acoustic emission technology is one of the methods that can achieve quantitative detection of pipeline leaks. In 2011, Hao Yongmei et al. [21]. compared the positioning accuracy of the amplitude attenuation method and the cross-correlation method through leakage experiments of air-filled pipelines. The results showed that the cross-correlation method had higher positioning accuracy. In 2012, Ozevin [22] used a one-dimensional source location algorithm to determine the location of leakage points in a two-dimensional distributed pipe network. In 2013, Li Zhenlin et al. [23]. combined the root mean square value (RMS) of acoustic emission with a hydrodynamic model and proposed a calculation formula for the gas leakage rate of valves, with an error < 10%, providing a basis for chemical process control.
In 2016, Kong Delian et al. [24] combined the wavelet transform method to process the acoustic emission signals of petrochemical valves, reducing the interference of background noise and decreasing the false alarm rate by 15%. In 2020, Quy et al. [25]. carried out leakage experiments on air-filled pipelines. They used two sensor channels to simultaneously collect two acoustic emission signals to construct a vector in the frequency domain. This characterized the spectrogram of the acoustic emission signals generated by the leak, so its features better reflected the characteristics of the leak signals, while the features measured by a single sensor had greater distortion. This method improved the accuracy and reliability of leak detection and identification.
In 2023, Ullah et al. [26] carried out leakage experiments on air-filled and water-filled pipelines, collected acoustic emission signals of different media and leak hole sizes, extracted a variety of time-domain and frequency-domain features, and trained with a variety of machine learning algorithms, obtaining extremely high classification accuracy. In 2024, Cui et al. [27] combined the improved Complete Ensemble Empirical Mode Decomposition with Adaptive Noise (ICEEMDAN) and the Probabilistic Neural Network (PNN) to achieve more accurate pipeline leak identification. In 2025, Saleem et al. [28] combined the Empirical Wavelet Transform (EWT) of adaptive frequency decomposition with a customized one-dimensional DenseNet architecture to achieve accurate leak detection and size classification.
Although existing research has theoretically proven the applicability of acoustic emission leak location technology in pipelines with different media (natural gas and crude oil), a large number of experiments have also been carried out, and various improved algorithms have been proposed to verify and improve the positioning accuracy. However, there are few studies on pipeline leak location with CO2 as the medium. Therefore, this paper intends to verify the adaptability and reliability of the acoustic emission method in the application of CO2 pipeline leak location through experiments.

3. Basic Methods and Principles of AE

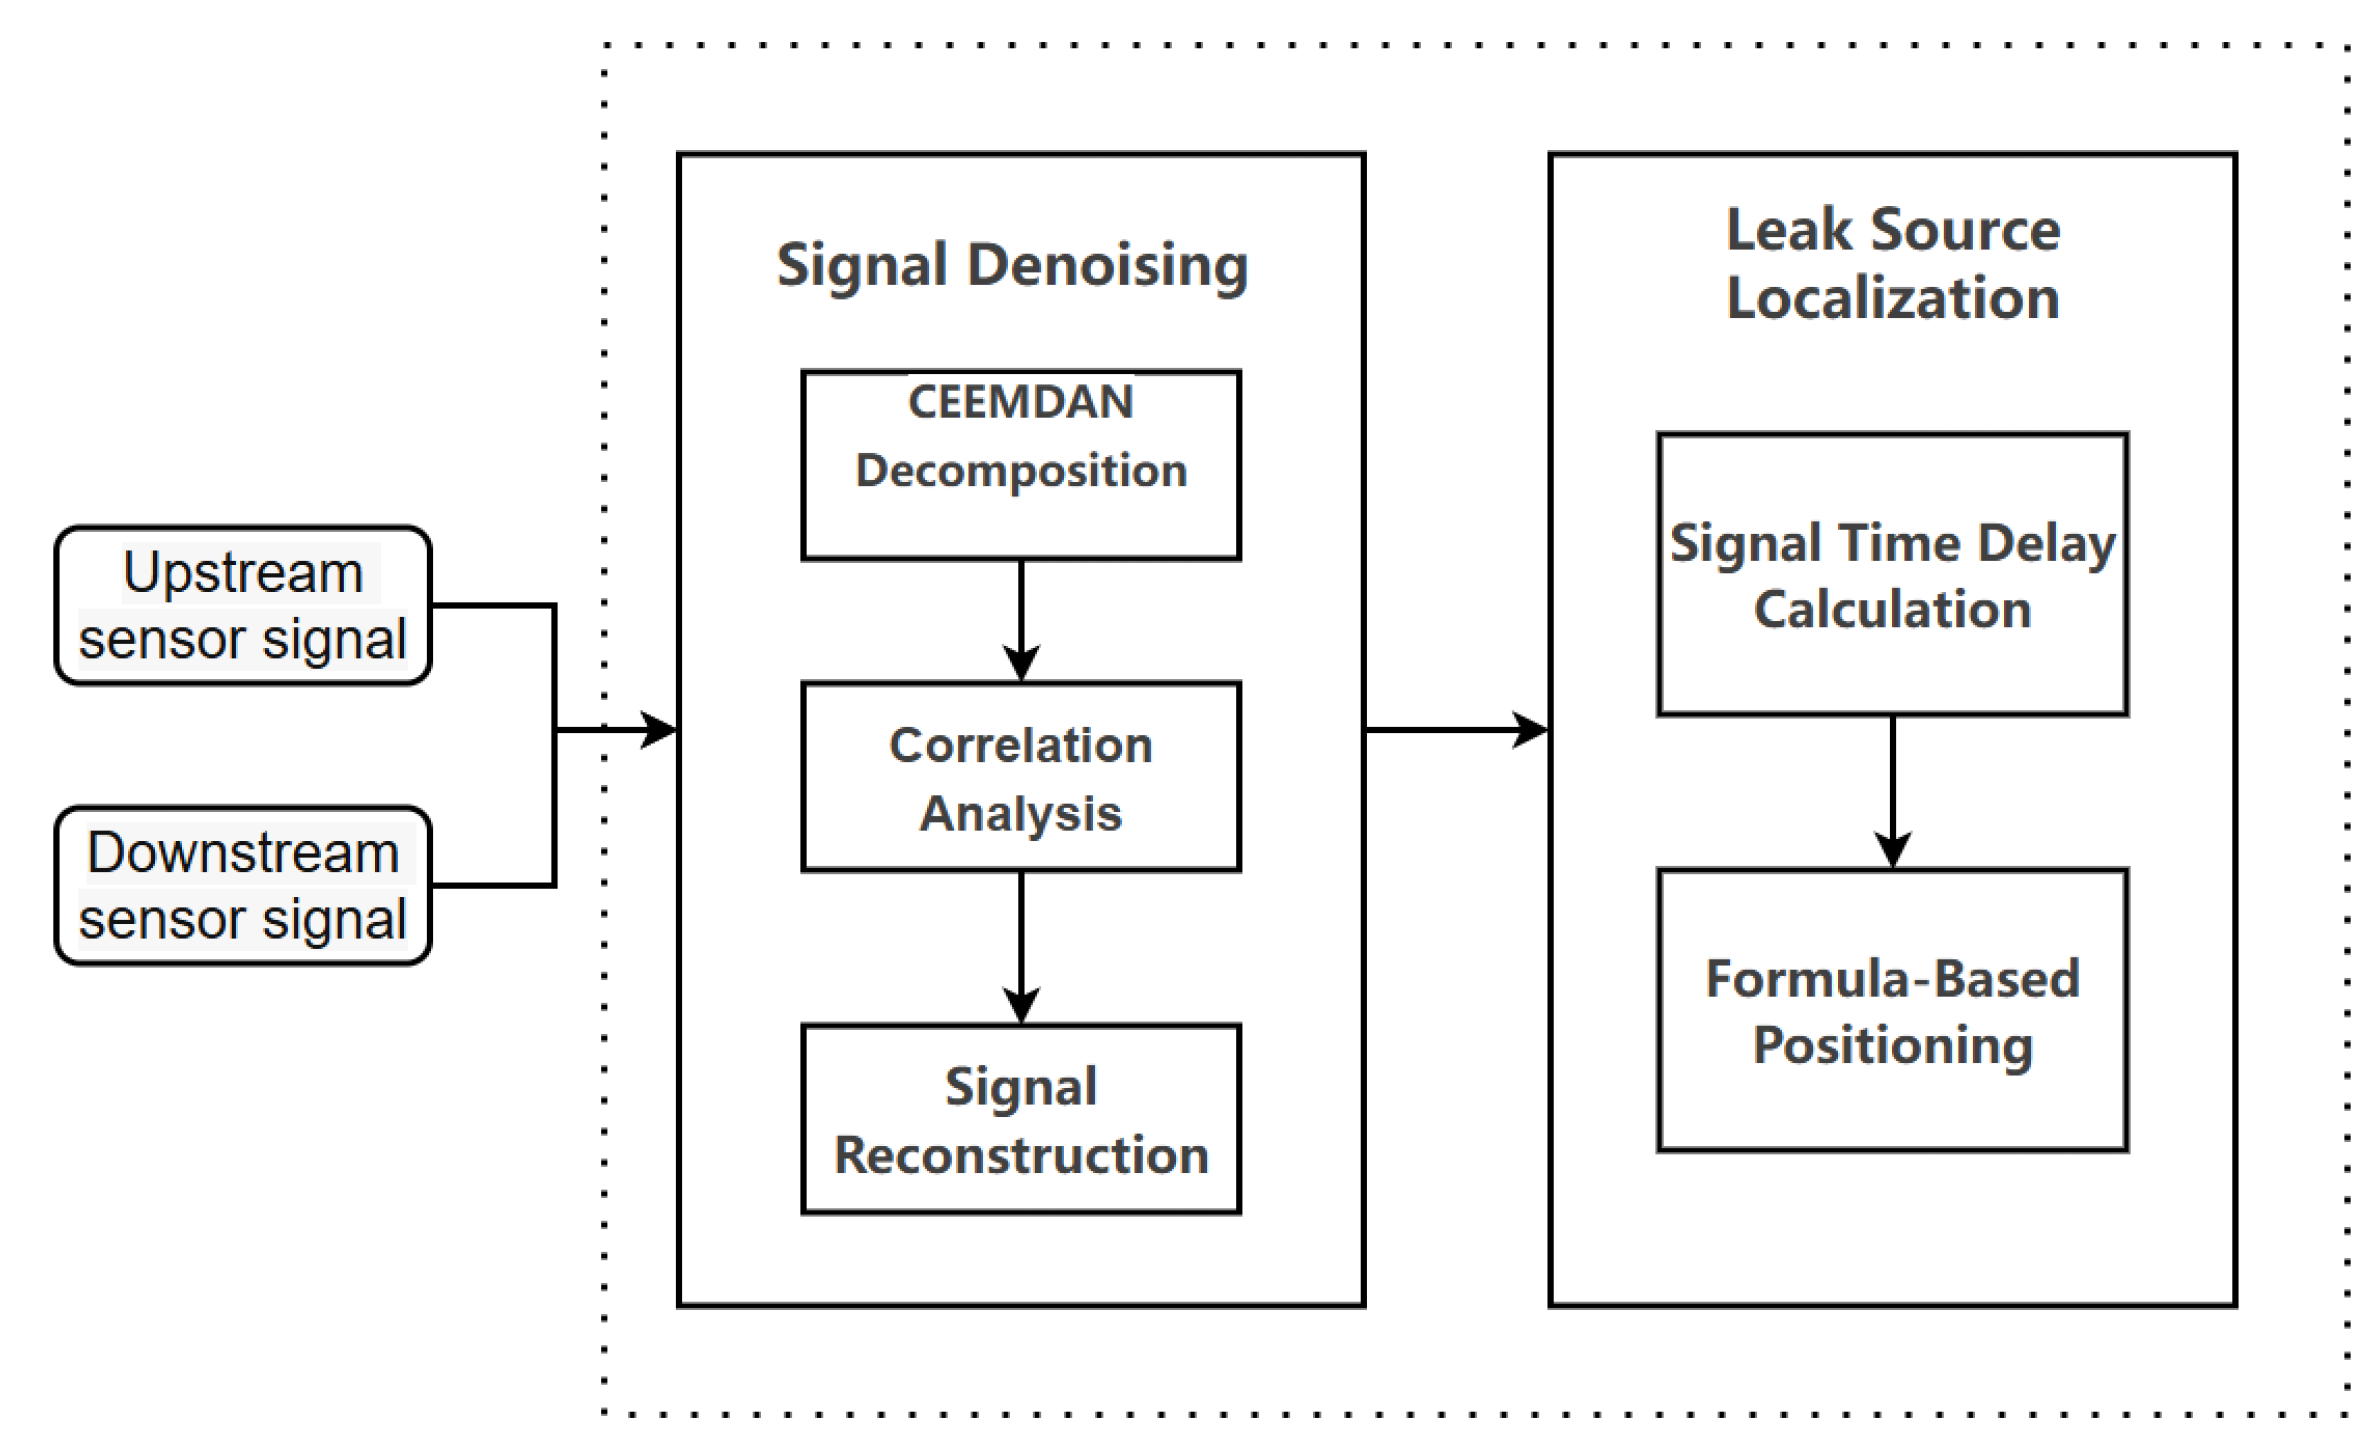
The process of leak location using the acoustic emission method is roughly as follows: First, use acoustic emission sensors to collect the acoustic emission signals triggered by pipeline leaks. Then, perform noise reduction on the collected signals to remove the noise in the signals. Next, through the time delay estimation algorithm, calculate the time difference based on the peak value of the cross-correlation function. Finally, calculate the specific location of the leak point according to the positioning formula. The process of the acoustic emission positioning method is shown in Figure 3.

3.1. Method for Determining Pipeline Leak Location

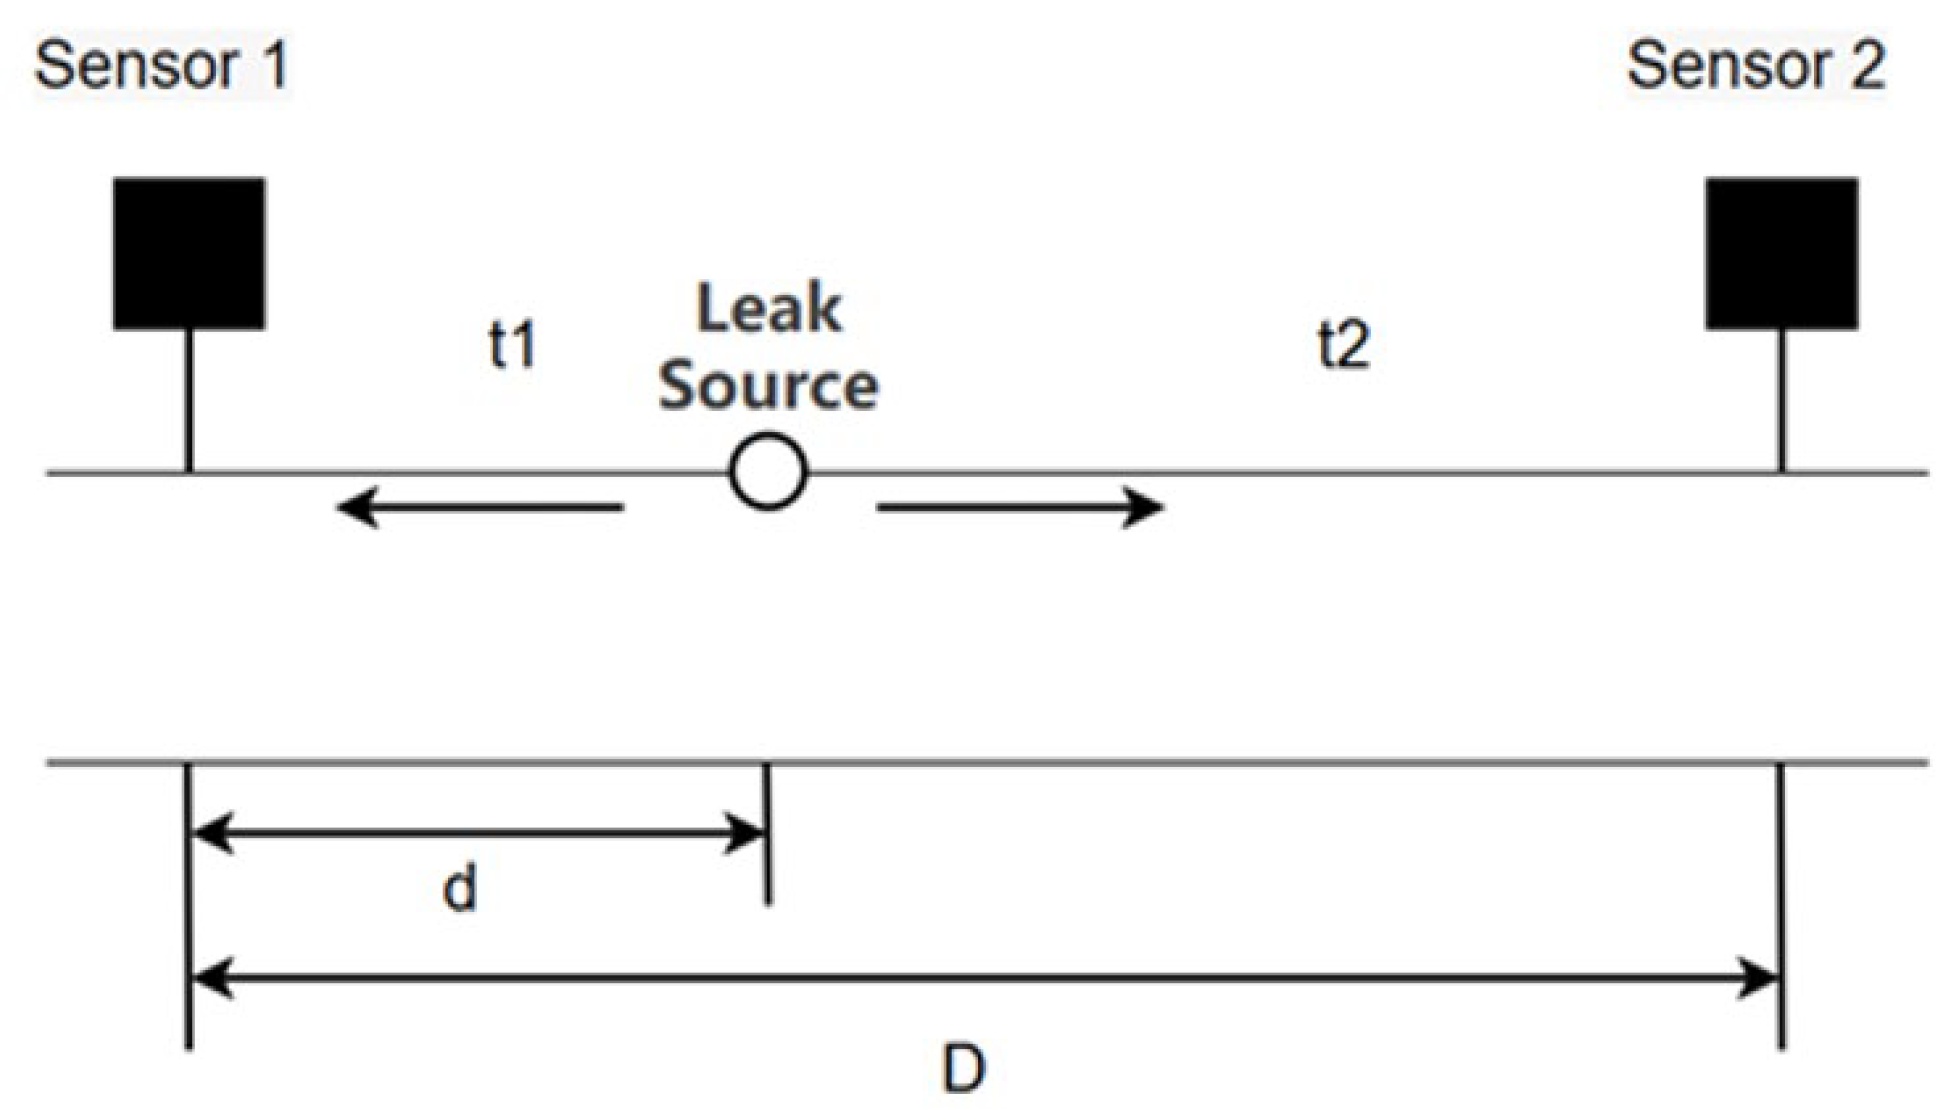
In this study, the acoustic emission signals generated by leakage exist in various guided wave forms (longitudinal waves, transverse waves, surface waves, plate waves), which mainly travel across the pipe external surface. Although the inner movement of the gas generates background noise, the wide-band and high-energy stress wave signals generated by the leakage and background noise have significant differences in time-frequency domain characteristics. Additionally, a threshold can be set during signal acquisition to filter out some noise signals, and then appropriate denoising algorithms can be applied to minimize the impact of noise to the greatest extent possible. As one of the widely used sound source localization algorithms, the Time Difference of Arrival (TDOA) method’s core is to estimate the time delay between signals and then obtain the position of the sound source by solving a system of equations. When a pipeline leaks, there is a huge pressure difference between the inside and outside of the pipe. The medium jets out through the leak hole, and the high-speed air flow rubs against the pipe wall to form a sound source. The stress wave generated by the sound source propagates along the pipe wall. By installing sensors on the pipeline to collect the acoustic emission signals and then analyzing and processing them through algorithms, the detection and precise location of the leak point can be achieved. A schematic diagram of the Time Difference of Arrival (TDOA) method is shown in Figure 4.
The stress wave generated by the leak is a generalized continuous acoustic emission signal that propagates along the pipe wall towards both ends of the pipeline. The leak point is located between two sensors, and the stress wave generated reaches the acoustic emission sensors installed on the pipe wall at different times. Therefore, the Time Difference of Arrival method is used to calculate the time difference for the signal source to reach different sensors. Then, by measuring the current sound wave propagation speed, the specific location of the leak point can be obtained by combining these two values [29].
The distance between the leak point and Sensor 1 can be calculated by the following formula:
d = D + v Δ t 2
where D is the distance between Sensor 1 and Sensor 2, v is the sound velocity, and Δt is the time difference for the acoustic emission signal to reach Sensor 1 and Sensor 2.

3.2. Denoising Method for Acoustic Emission Signals

When using the acoustic emission method for leak detection, since the propagation speed of the stress wave generated by the leak point in the pipeline is relatively stable, it can generally be regarded as a fixed value. In fact, the time difference in the sensors has a significant impact on the positioning accuracy.
Empirical Mode Decomposition (EMD) is a commonly used signal decomposition method. It can decompose complex signals into a series of Intrinsic Mode Functions (IMFs), enabling the analysis of the time-domain and frequency-domain characteristics of the signals under different IMFs. However, after the signal is processed by the EMD method, there is usually a problem of mode mixing, that is, high-frequency signals with relatively small amplitudes appear at a certain moment or within a very short time interval. When mode mixing occurs, the obtained Intrinsic Mode Function (IMF) is meaningless. To solve this problem, researchers proposed the Ensemble Empirical Mode Decomposition (EEMD), which adds random white noise to the signal to assist the decomposition and thus reduce the impact of mode mixing [30].
Although EEMD solves the mode mixing problem to a certain extent, there may still be some residual white noise in the decomposition results. In addition, the introduction of white noise may lead to inconsistent numbers of signal modes, thus affecting subsequent signal analysis. To address these issues, Torres et al. proposed the Complete Ensemble Empirical Mode Decomposition with Adaptive Noise (CEEMDAN) algorithm. The CEEMDAN algorithm shows better signal decomposition and denoising capabilities by further improving the noise processing and mode decomposition processes [31]. The Adaptive Noise Complete Ensemble Empirical Mode Decomposition is developed based on Empirical Mode Decomposition. It solves the problem of white noise transfer from high frequency to low frequency when the EMD method decomposes signals, effectively overcomes the mode mixing phenomenon in the EMD method, and has a relatively high reconstruction accuracy.
For a given signal y(t), the CEEMDAN decomposition steps are as follows:
Add Gaussian white noise to the signal to be decomposed to obtain a new signal y ( t ) + ( 1 ) q ε ν j ( t ) , where q = 1, 2. Perform EMD on the new signal to obtain the first Intrinsic Mode Function (IMF) component X1.
E ( y ( t ) + ( 1 ) ε ν j ( t ) ) = X i j ( t ) + r j
Here, Xi is the i-th Intrinsic Mode Function component after EMD, ε is the standard deviation of white noise, ν j is the Gaussian white noise signal that follows a normal distribution, and X i j ( t ) is the Intrinsic Mode Function component obtained after CEEMDAN decomposition.
Perform the overall average on the N generated mode components to obtain the first Intrinsic Mode Function component of CEEMDAN decomposition:
X 1 ( t ) ¯ = 1 N j = 1 N X 1 j ( t )
Here, X 1 ( t ) is the first mode component obtained by set averaging after decomposition, N is the number of generated mode components, and j = 1,2…,N is the number of times white noise is added.
Calculate the residual after removing the first mode component:
r 1 ( t ) = y ( t ) X 1 ( t ) ¯
Here, r 1 ( t ) is the residual signal after removing the first component.
Subsequently, add paired positive and negative white noise to r 1 ( t ) to obtain a new signal r 1 ( t ) + ( 1 ) q ε ν j ( t ) . Then perform EMD on r 1 ( t ) + ( 1 ) q ε ν j ( t ) to obtain the first-order mode component D 1 j ( t ) . By repeating the set averaging according to Equation (2), we can obtain X 2 ( t ) ¯ .
Repeat the above steps until the residual signal is monotonic. Stop the decomposition to obtain all components X K ( t ) and the residual r K ( t ) .
The cross-correlation method is commonly used for the time delay estimation of acoustic emission signals. Denote the two sensors arranged on the pipeline as m1 and m2, and the received acoustic emission signals as x1(t) and x2(t). Then the signals received by sensors m1 and m2 are, respectively:
x 1 ( t ) = s ( t ) + n 1 ( t ) x 2 ( t ) = s ( t τ ) + n 2 ( t )
where s(t) is the leak source signal; tau is the time delay; n1(t) and n2(t) are noise signals.
The cross-correlation function R12(τ) of x1(t) and x2(t) is:
R 12 ( τ ) = E x 1 ( t ) x 2 ( t )
Since the data has a finite length, the cross-correlation of the above signals can be estimated using the following formula:
R ^ 12 ( τ ) = 1 T τ τ T x 1 ( t ) x 2 ( t τ ) d τ
where T is the length of the observation time.
Using the generalized cross-correlation can improve the detection accuracy. It can improve the accuracy of time-delay estimation in noisy and reverberant environments through pre-processing and weighting of the signal extremes. To improve the accuracy of time-delay estimation in a noisy environment, the cross-power spectrum can be weighted. Commonly used weighting functions include:
(1)
Roth weighting: Using the auto-power spectrum of the signal as the weighting function.
(2)
SCOT weighting: Using the square root of the auto-power spectrum of the signal as the weighting function.
(3)
PHAT: Using the reciprocal of the magnitude of the cross-power spectrum of the signal as the weighting function.
(4)
ML weighting: Set large values when the signal-to-noise ratio is high; set small values when the signal-to-noise ratio is low to reduce the influence of environmental noise.

4. Preliminary Experiment on Air Pipeline Leakage

To verify the applicability of the acoustic emission method in the leakage detection of gas pipelines, a preliminary experiment on pipeline leak location was carried out with air as the leakage medium, aiming to lay a foundation for the subsequent experiment on the leakage location of gaseous CO2 pipelines. In this experiment, the leakage signals of the air pipeline were collected by acoustic emission technology. Then, the obtained acoustic emission leakage signals were denoised, and finally, various time-delay estimation and location methods were used to determine the leakage point of the air pipeline.

4.1. Experimental Setup

The experimental setup mainly consists of two parts: the test pipeline with a leak port and the acoustic emission signal collector.

4.1.1. Test Pipeline

The pipeline is 4 m long, with an outer diameter of 50 mm and is made of carbon steel. The gas source is provided by an air compressor. One end of the pipeline is sealed with a blind flange, and the other end is opened to facilitate air intake. The leakage point is located at the 12 o’clock position circumferentially, 3 m away from the air intake of the pipeline. The leakage opening is a circular hole with an inner diameter of 1 mm. Start the air compressor, and air leaks from the pipeline leakage opening. When the pressure in the air compressor cavity reaches 0.1 MPa, acoustic emission data collection is carried out. The test pipeline with a leakage opening is shown in Figure 5.
Although leakage may occur at any location along the pipeline, the resulting stress waves propagate along the pipe surface once leakage occurs. Even when the sensors are positioned at different elevations as the leakage point, they can effectively capture the leakage signals. Therefore, to facilitate data acquisition, sensors are typically installed on both sides of the leakage point at the same elevation on the pipeline.

4.1.2. Acoustic Emission Signal Collector

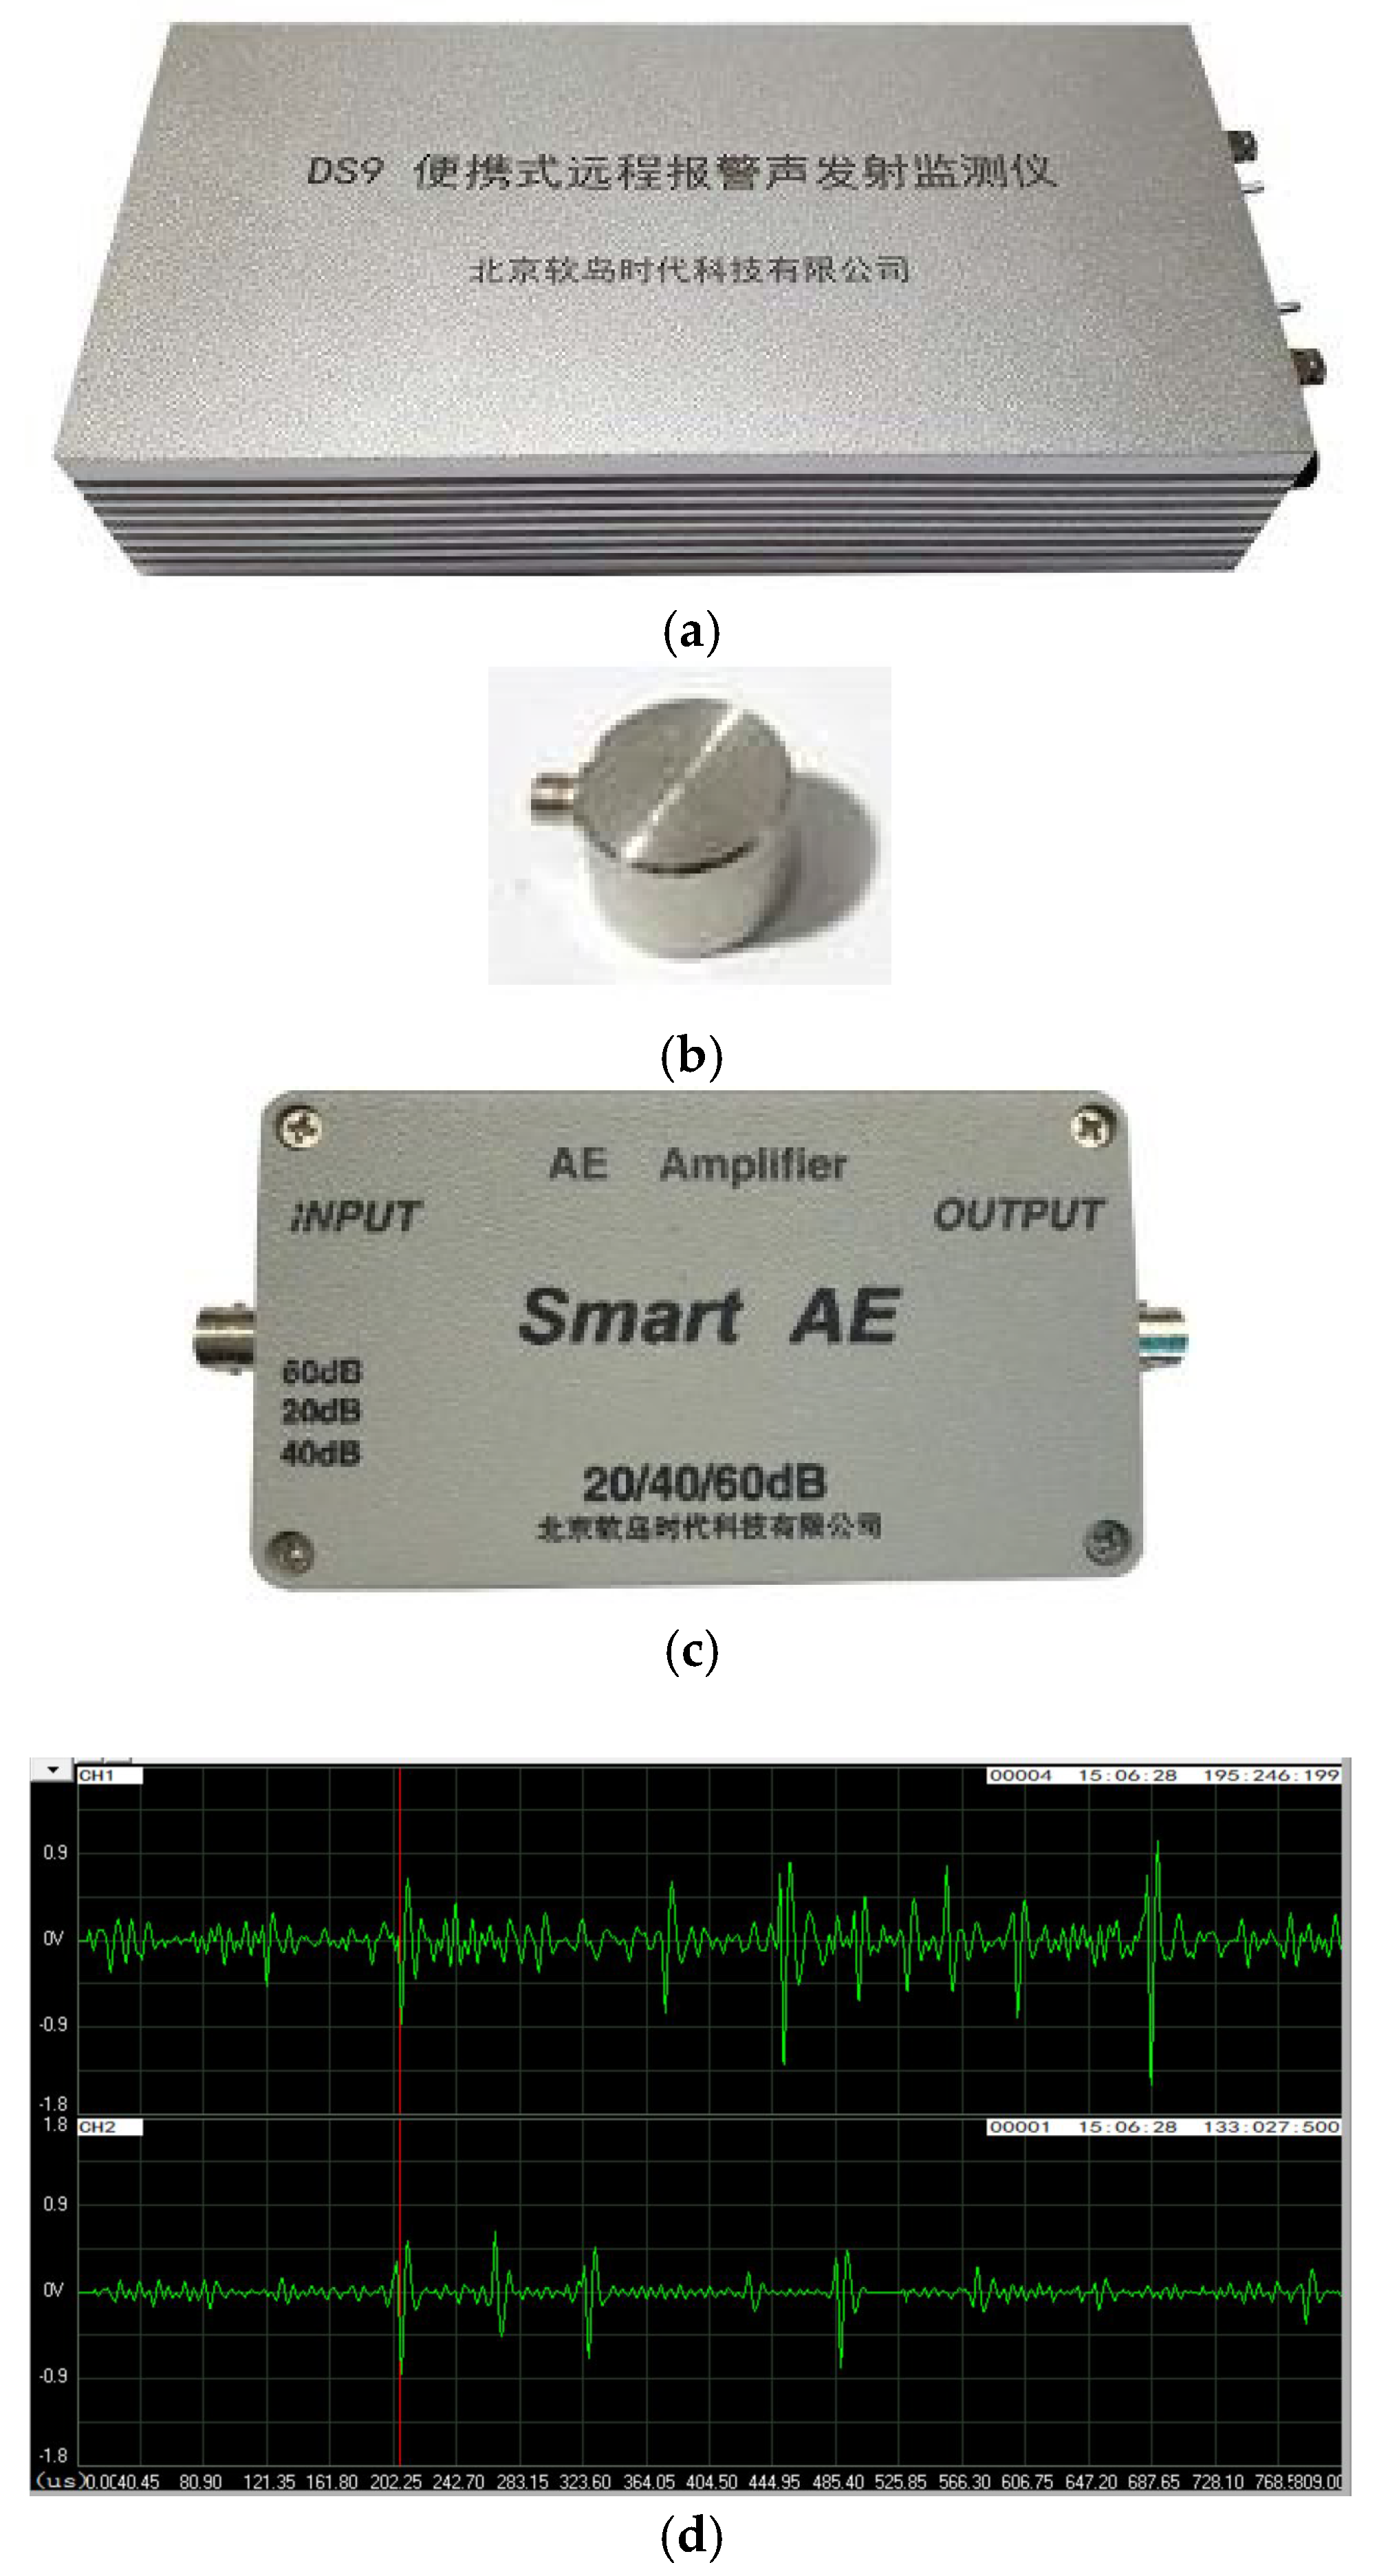
The acoustic emission signal collector used in this experiment is shown in Figure 6 and it includes:
(1)
An acoustic emission monitor with a high waveform sampling rate (10 MHz), which can store the acoustic emission waveform at a rate of 10 M (sampling rate is adjustable) sampling points.
(2)
An RS-2A sensor with a frequency range of 50 kHz–400 kHz.
(3)
A preamplifier with amplification factors of 20/40/60 dB.
(4)
Acoustic emission signal acquisition software. Sensor 1 and Sensor 2 are located on both sides of the leak port, and their distances from the leak port are arranged according to the experimental requirements.
Numerous studies have shown that the acoustic energy of gas jets generally has a relatively wide spectral range from 1 kHz to 1 MHz, and most of the energy is confined to the high-frequency band of 175–750 kHz. The captured acoustic emission signals generated by the vibration behavior of the air pipe (with 5 bar air) range from 100 to 300 kHz. Therefore, a high-frequency (>100 kHz) AE sensor is chosen for leakage detection. This sensor exhibits good sensitivity in the frequency band of 50 to 400 kHz. In this frequency range, the sensor can effectively avoid the influence of audible sounds.

4.2. Signal Acquisition and Processing

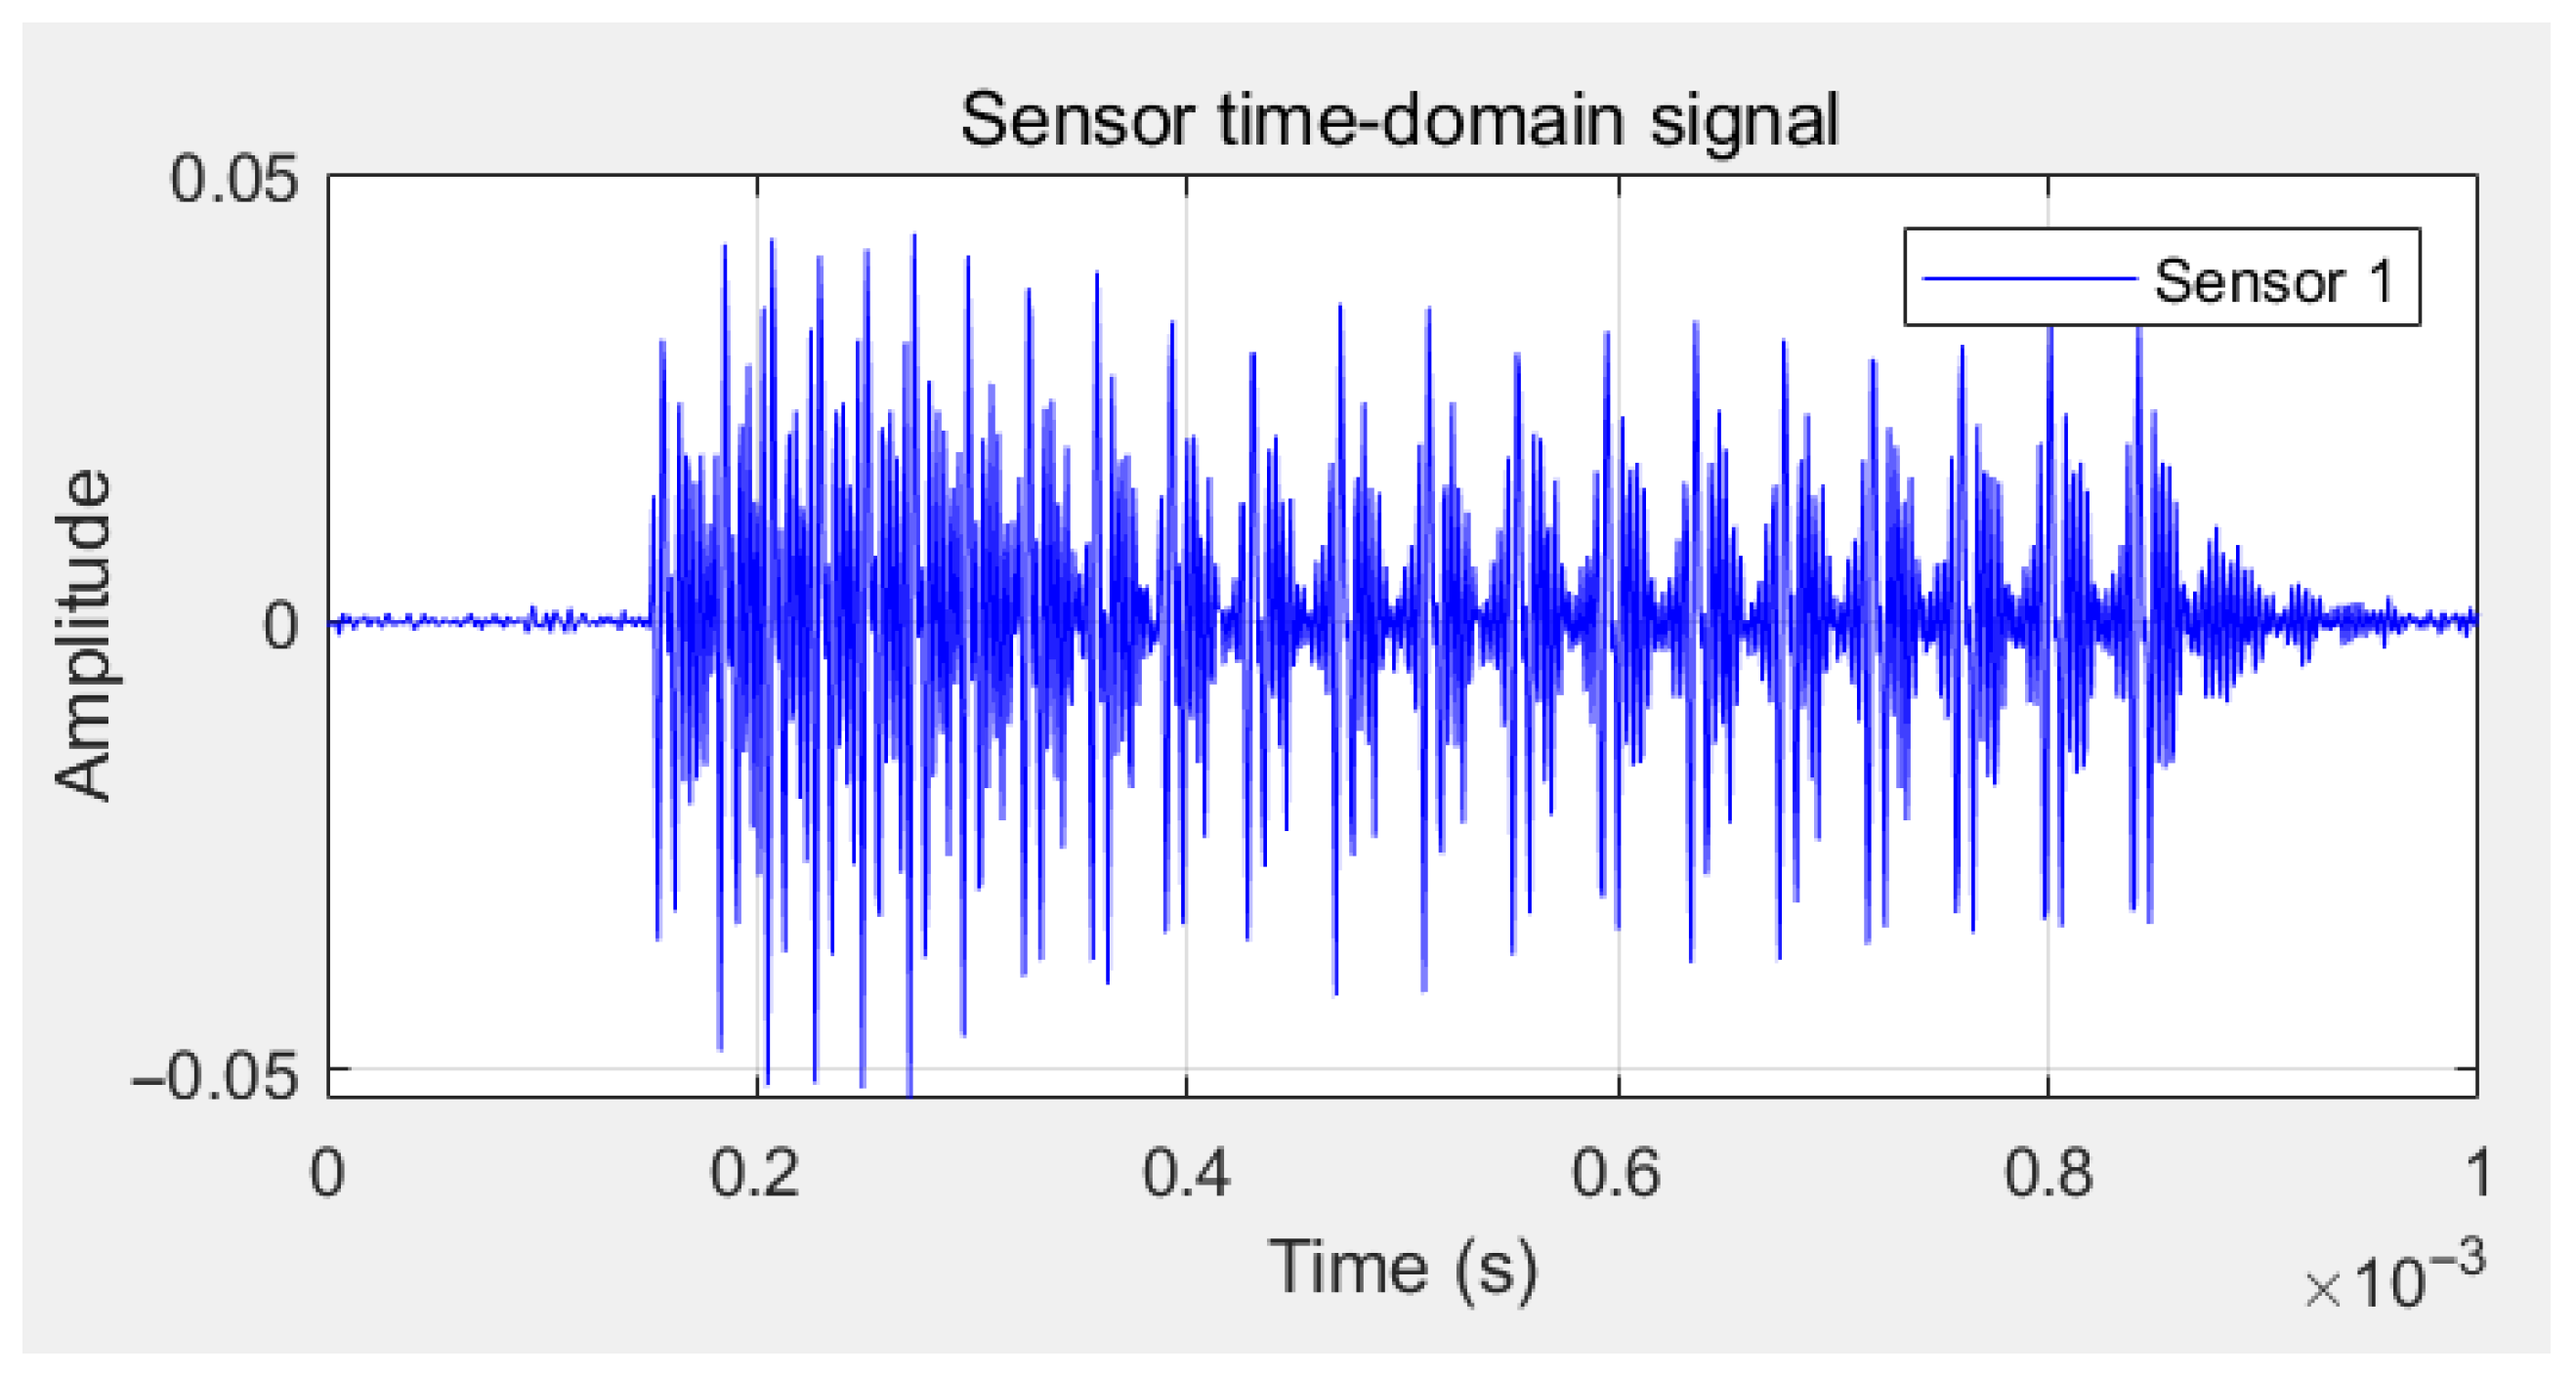
When the pipeline is operating without leakage, the time-domain signal collected by Sensor 1 (Figure 7) has a signal recording threshold set at 100 mV. This is to exclude noise interference and ensure that the collected signals are all stress waves generated by the leakage source. To guarantee the signal quality and minimize the interference of environmental background noise to the greatest extent, the threshold of the acoustic emission acquisition system in this experiment is set at 100 mV. This setting can effectively filter out most of the low-energy environmental vibrations and electromagnetic interferences, ensuring that the collected signals mainly originate from the pipeline leakage event itself.

4.2.1. Measurement of Pipeline Wave Velocity

The acoustic wave velocity c is an important parameter in the calculation of acoustic emission leakage source location. The Hsu-Nielsen method is currently the most widely used method for measuring sound velocity in the field of acoustic emission. As the standard form of the broken lead method, this method ensures the repeatability and consistency of the signal source by strictly standardizing the hardness of the pencil lead, the protruding length, and the breaking angle. It overcomes the signal instability problem caused by the operational randomness of the general broken lead method. The Hsu-Nielsen method is easy to operate and has good repeatability. Therefore, this paper uses this method to measure the sound velocity on the test pipeline. The specific test procedure is as follows: Extend a 2H-hardness pencil lead about 2 mm, make an angle of 30° with the pipeline and closely adhere it to the pipeline. Then break the pencil lead while ensuring that the pencil does not have secondary contact with the pipeline. The stress wave generated by the broken pencil lead is collected by the sensor. Since the positions of the sensors are known, only by calculating the signal time difference can the sound velocity in the pipeline be calculated. Figure 8 shows the time-domain signals of the broken lead collected by two sensors. Through calculation, the propagation velocity of the acoustic wave in the pipeline is obtained as 3358 m/s. This pipeline wave velocity (3358 m/s) is measured on an empty tube.

4.2.2. Noise Reduction in Pipeline Leak Signals

Two sensors are arranged on both sides of the leakage port at a distance of 0.5 m from the leakage port for signal acquisition. Although the acquisition threshold is set, the acquired signals inevitably still contain noise components. In this paper, the CEEMDAN algorithm is used to adaptively denoise the collected pipeline leakage signals. The advantage of the CEEMDAN algorithm lies in its ability to adaptively decompose Intrinsic Mode Functions (IMFs) according to the characteristics of the signal itself. There is no need to preset basis functions in advance, making it highly suitable for processing non-stationary and non-linear acoustic emission signals. For background noise, whether it is stationary environmental noise or non-stationary random impact interference, this algorithm can effectively decompose it into different IMF components. Through correlation analysis with the original signal, the noise-dominant components can be accurately separated and removed, thereby achieving signal enhancement. The white noise intensity is set to 0.2, the number of additions is 100 times, and the maximum number of envelope detections is 1000. The results are shown in Figure 9. The signal is decomposed into 10-order components, and the last order is the residual quantity. The series of characteristic components obtained from the decomposition represents the characteristics of the signal at different time scales. Usually, the high-frequency IMFs correspond to the characteristics of noise, and the low-frequency IMFs correspond to the characteristics of the signal. By calculating the correlation of each order component with the original signal, the dominant component of the original signal is identified to achieve the purpose of denoising.
To effectively denoise, it is necessary to distinguish between the noise-dominated components and the signal-dominated components. Calculate the cross-correlation coefficients between each order of characteristic components and the original signal, respectively (Table 2).
The CEEMDAN algorithm is used for adaptive decomposition. The IMF components are screened based on the correlation coefficient to reconstruct the signal, thereby achieving noise separation. Generally, if the cross-correlation coefficient |R(i)| ≤ 0.1, it is considered to have extremely low correlation, that is, the IMF component has almost no linear relationship with the original signal; when 0.20 ≤ |R(i)| ≤ 0.39, it is of low correlation; when 0.40 ≤ |R(i)| ≤ 0.69, it is of moderate correlation; when 0.70 ≤ |R(i)| ≤ 1, it is of high correlation. From this, it can be determined that IMF1 is the signal-dominated component, and the rest are noise components. Therefore, when reconstructing the signal, IMF2-IMF9 are removed, and only IMF1 is retained. Figure 10 shows the comparison diagrams of the original signals collected by sensors 1 and 2 and the denoised signals.
In signal denoising, the signal-to-noise ratio (SNR) and root mean square error (RMSE) are commonly used to evaluate the denoising effect.
The SNR is defined as the ratio of the effective signal power to the background noise power. The RMSE reflects the degree of difference between the denoised signal and the original noisy signal. By quantifying the overall deviation between the denoised signal and the original signal, it can directly show the quality of the denoising effect. Therefore, when denoising a signal, it is necessary to increase the SNR and decrease the RMSE. By comparing the EEMD and CEEMDAN denoising algorithms, the signal evaluation indicators (Table 3) are obtained. The CEEMDAN algorithm has a higher SNR, effectively removes noise clutter, reduces the root mean square error, and has a better denoising effect. The CEEMDAN algorithm can not only significantly improve the signal quality but also demonstrate its excellent anti-noise interference ability. This provides a technical basis for the application of this method in on-site environments where background noise is uncontrollable.

4.3. Pipeline Leak Source Location

After denoising the signal using the CEEMDAN method, the interference of noise can be reduced to a certain extent. Then, through the acoustic emission leak detection and location formula, combined with the cross-correlation algorithm, the delay between the two signals can be calculated. The calculation results are shown in Figure 11.
After calculating the time differences between the sensors upstream and downstream of the leak source through various time delay estimation algorithms such as cross-correlation positioning, ROTH weighting, PHAT weighting, ML weighting, and SCOT weighting, the location of the leak point can be calculated by combining with the sound speed of the pipeline. Table 4 shows the positioning results under different positioning methods. From the time delay estimation calculation diagram in Figure 9 and the positioning results in Table 4, it can be seen that the effect of this preliminary experiment on the air pipeline is good. The time delay estimation values of various algorithms are relatively accurate, and the error of the final positioning calculation result is small, laying a foundation for the next CO2 pipeline leak experiment.

5. Gas CO2 Pipeline Leak Location Experiment

5.1. CO2 Test Pipeline and Sensor Arrangement

A CO2 pipeline is used for the leak location experiment. The CO2 pipeline is shown in Figure 12. Its main parameters are as follows: inner diameter of 25.4 mm, pipe length of 30 m, pipeline pressure-bearing capacity of 18 MPa, operating temperature range from −20 °C to 90 °C, maximum gas flow rate of 15 m3/h, and the pipeline material is 316 stainless steel.
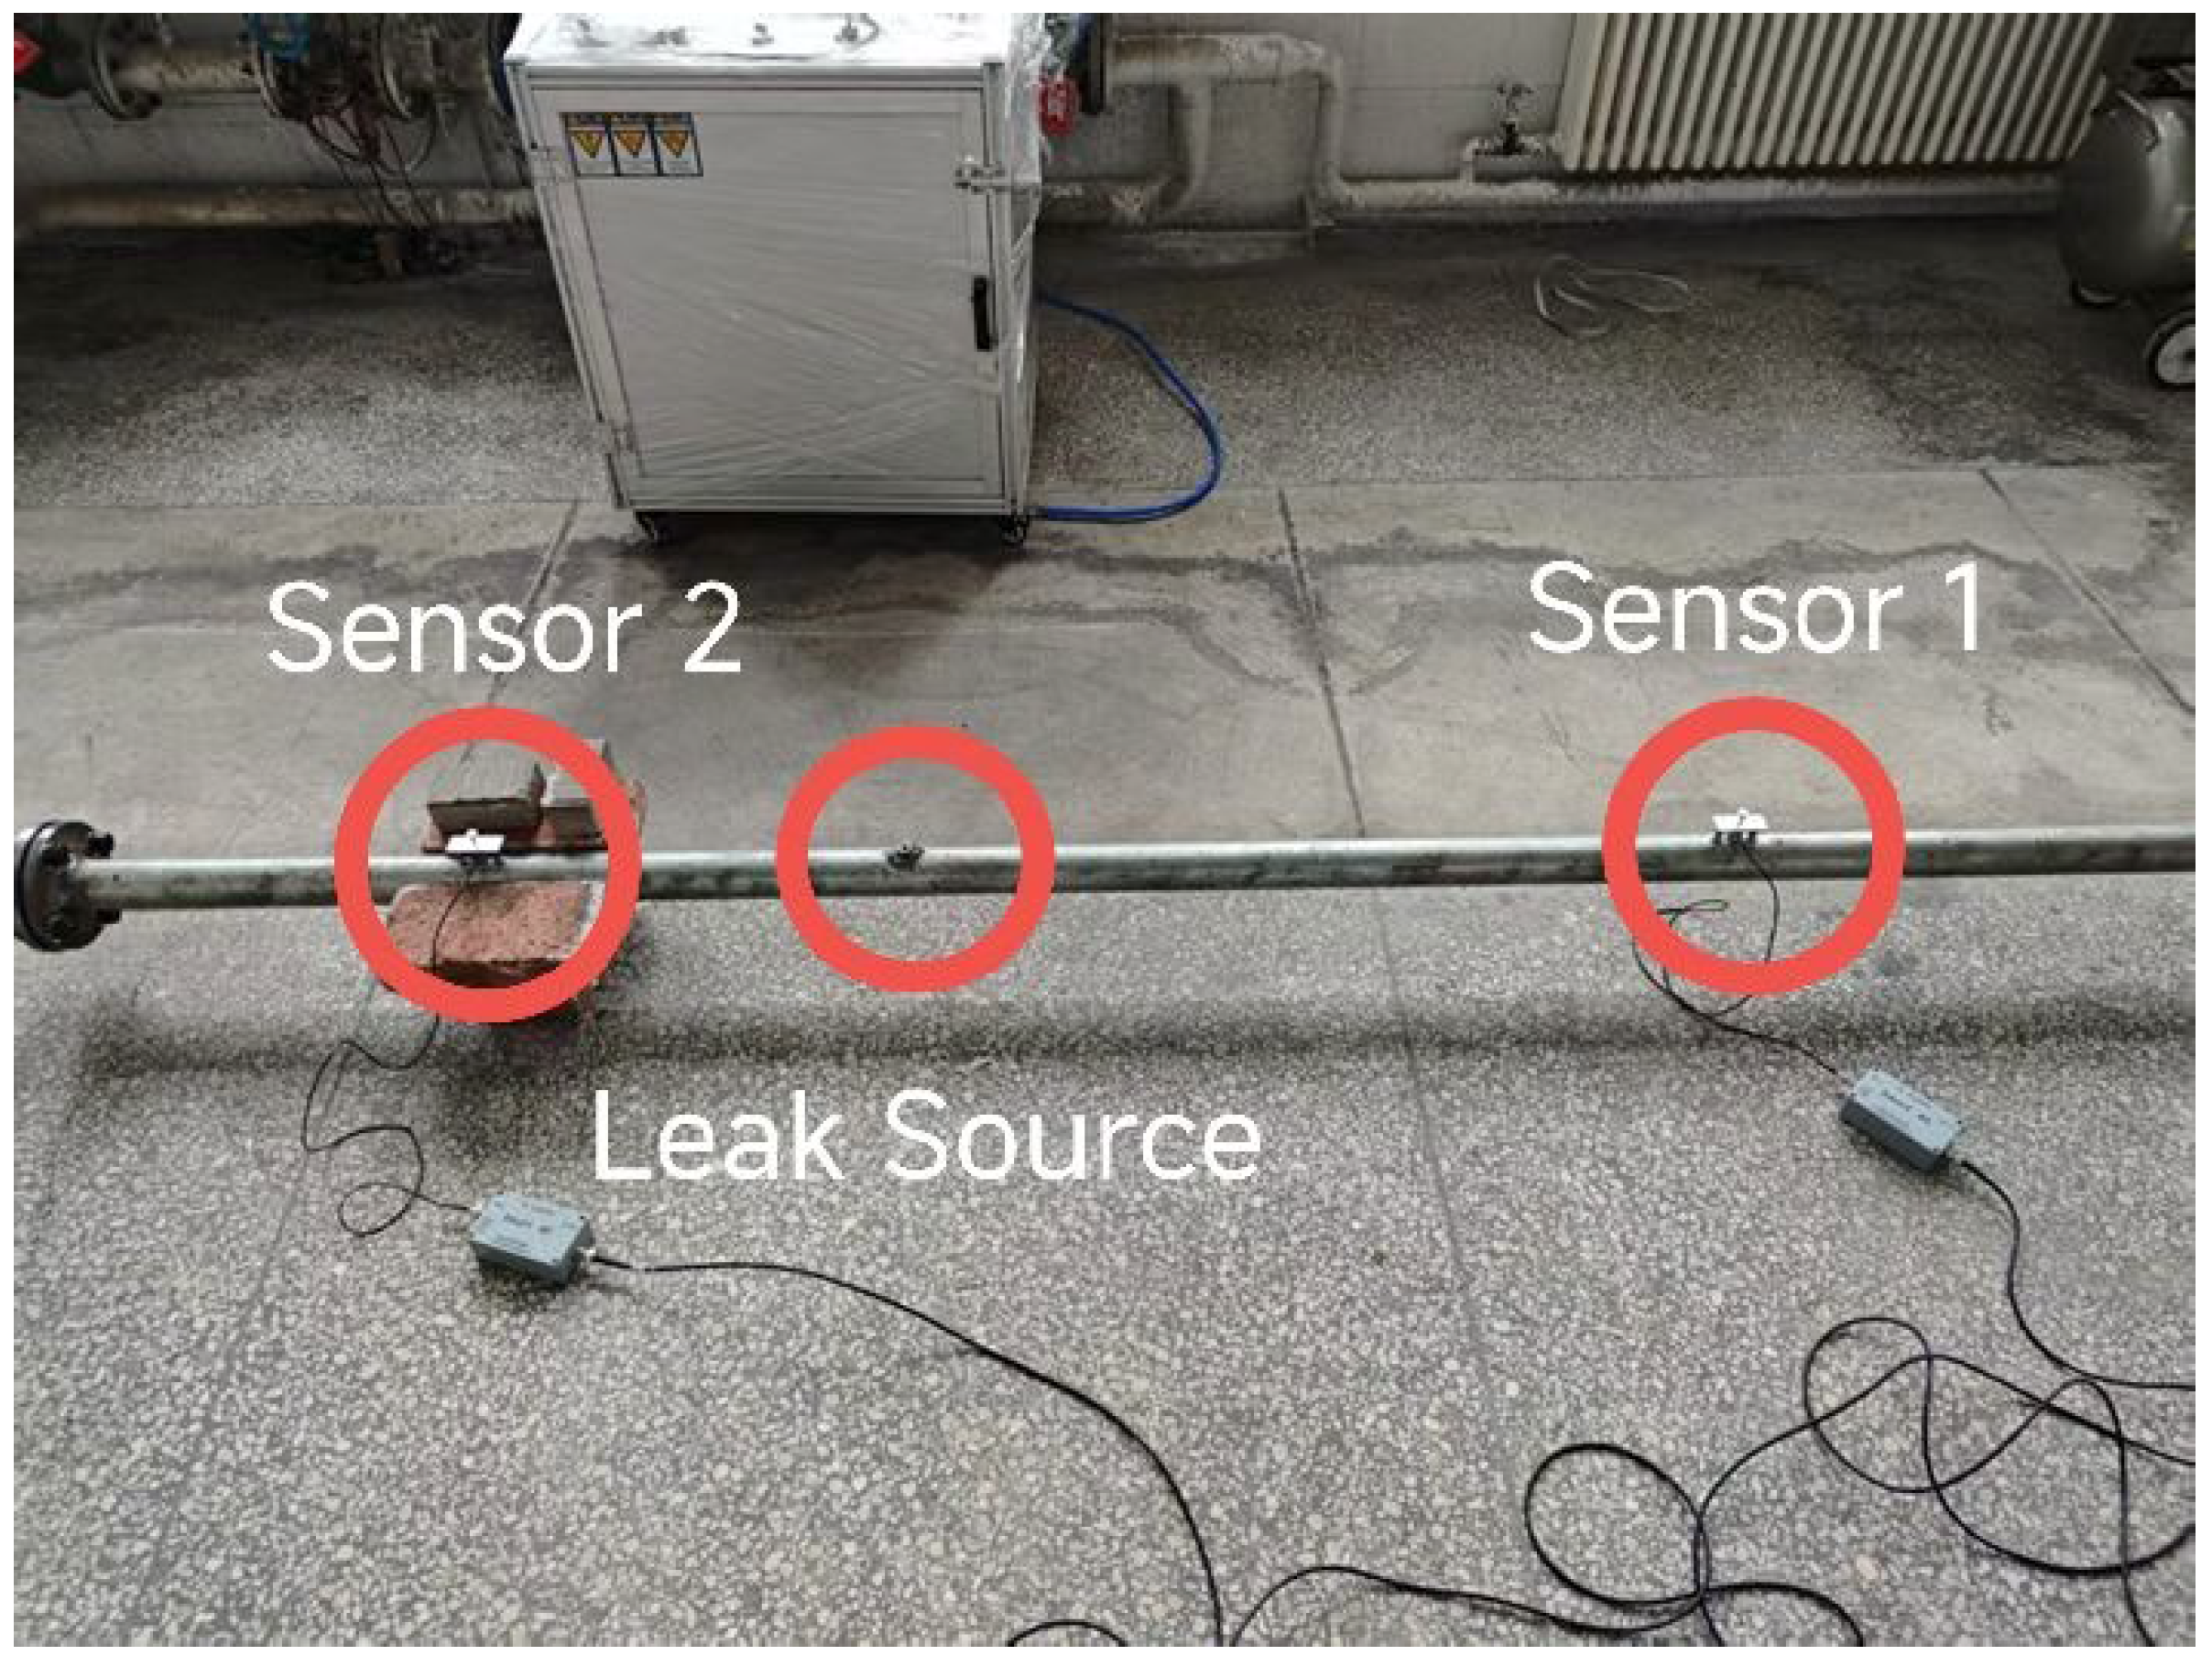
The pipeline drain valve is used as the leak point, with a leak port diameter of 6 mm. Two sensors are installed near the drain valve. The layout of the sensors on both sides of the leak point is shown in Figure 13 and Figure 14. Sensor 1 is 20 cm away from the leak point, and Sensor 2 is 15 cm away from the leak point. When conducting the leak experiment, the pipeline pressure is 1 MPa. The sensor is coupled to the pipeline surface through a coupling agent and fixed with tape to ensure efficient signal conduction and stability.

5.2. Leak Signal Processing

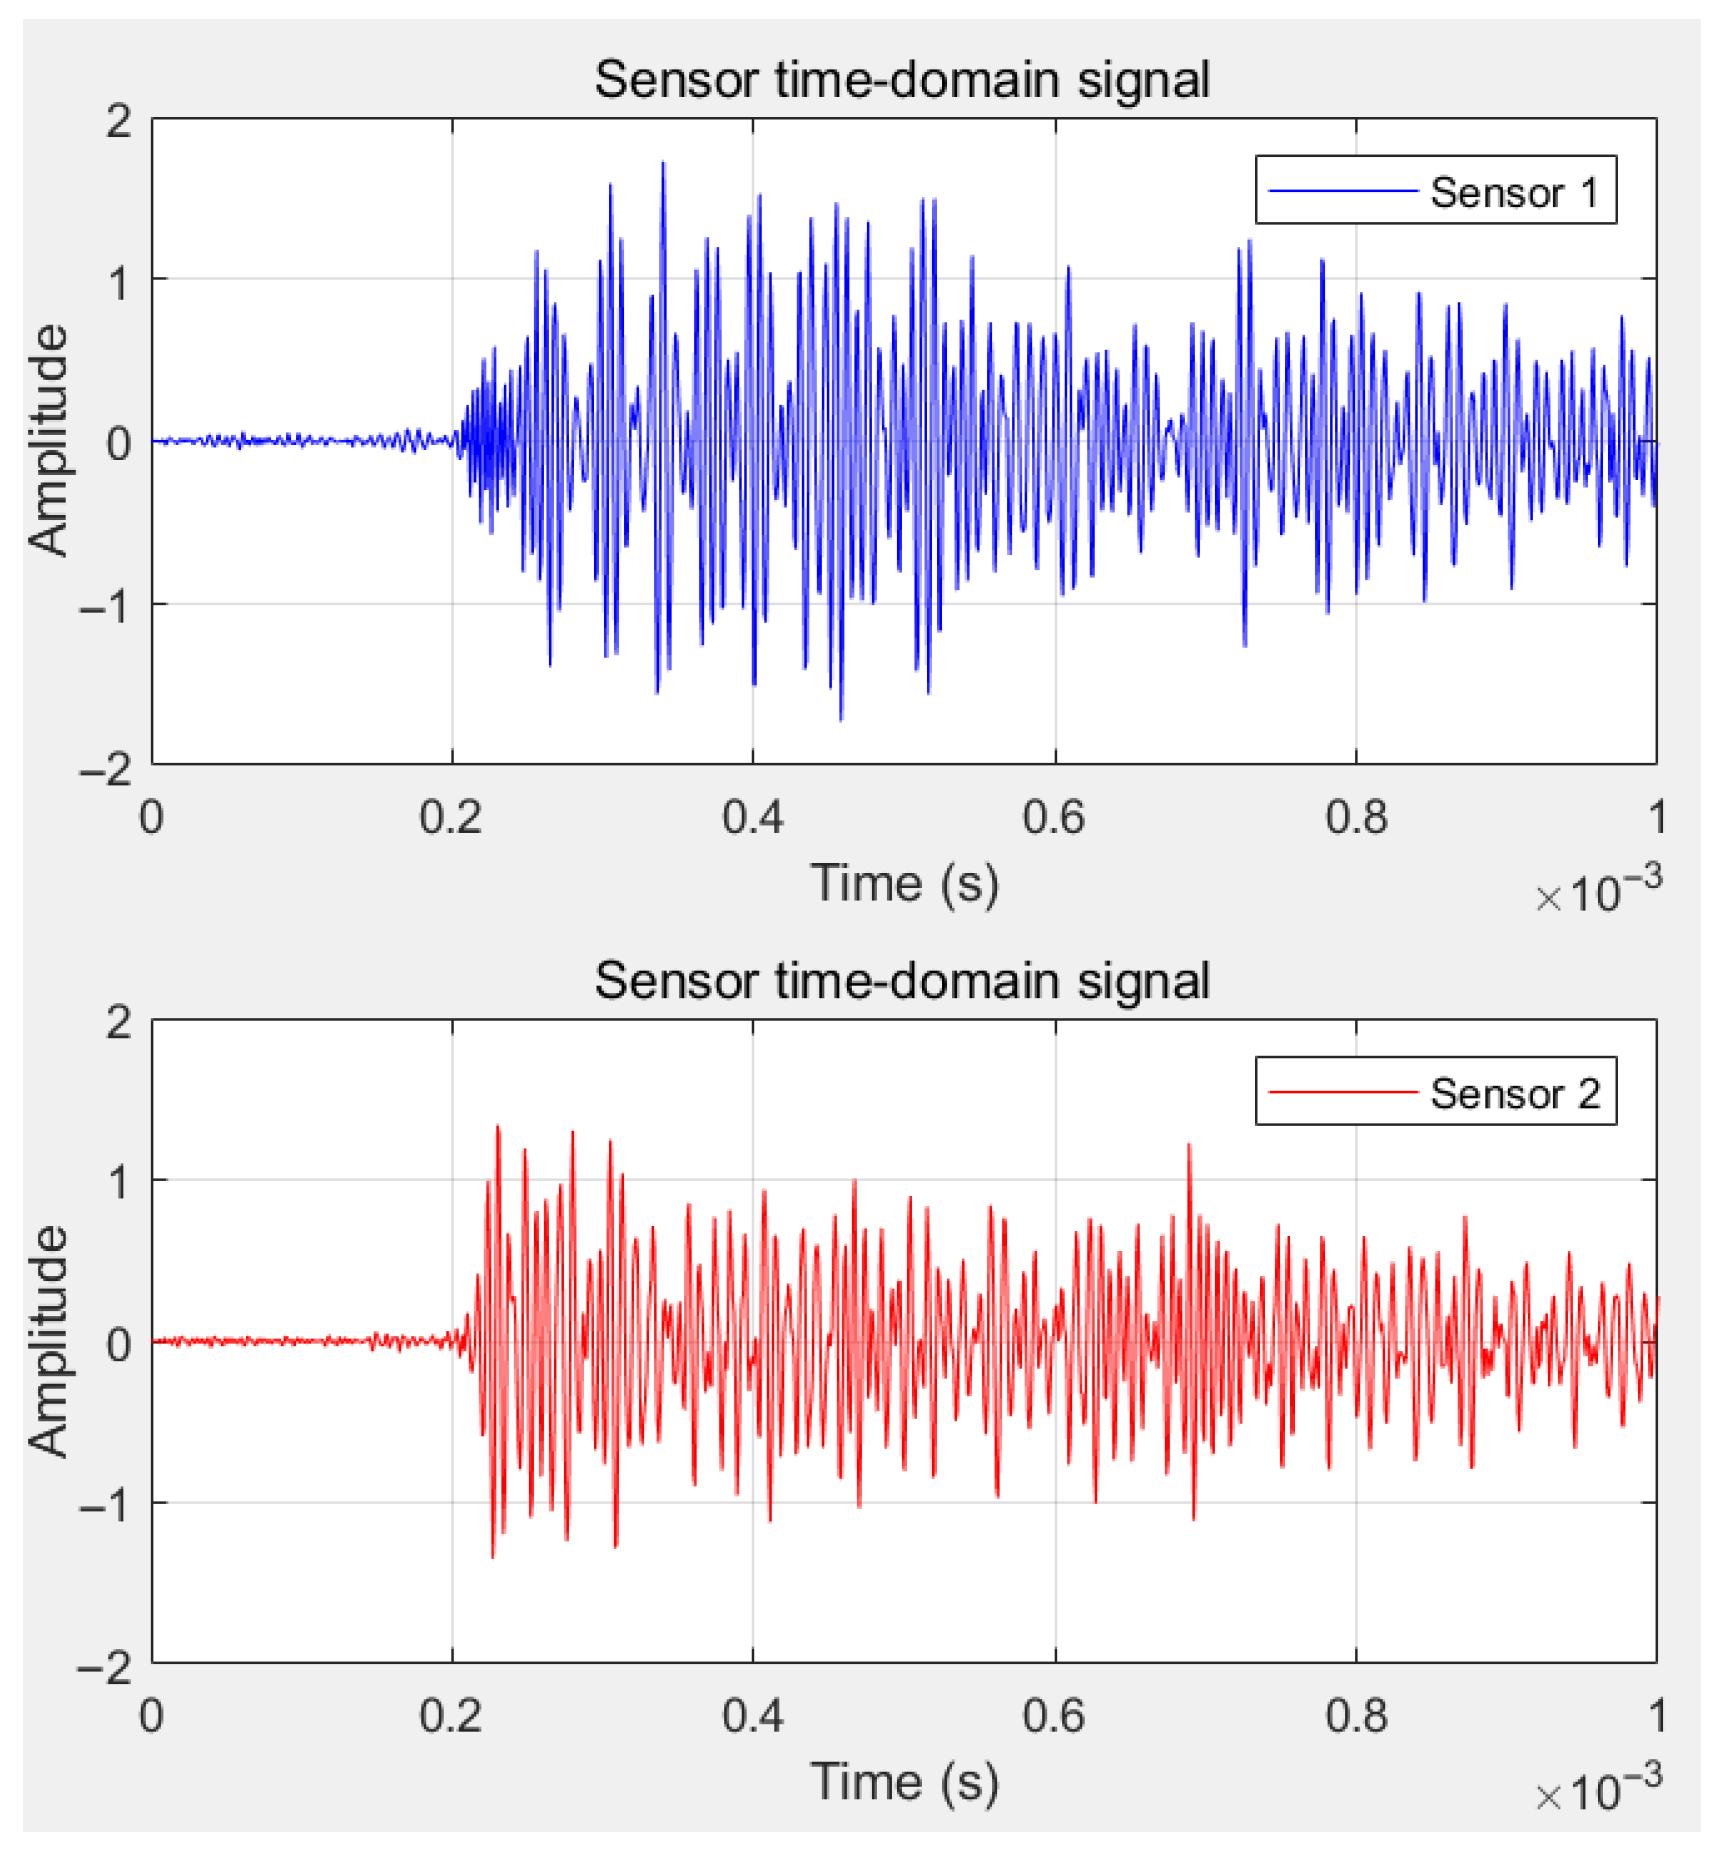
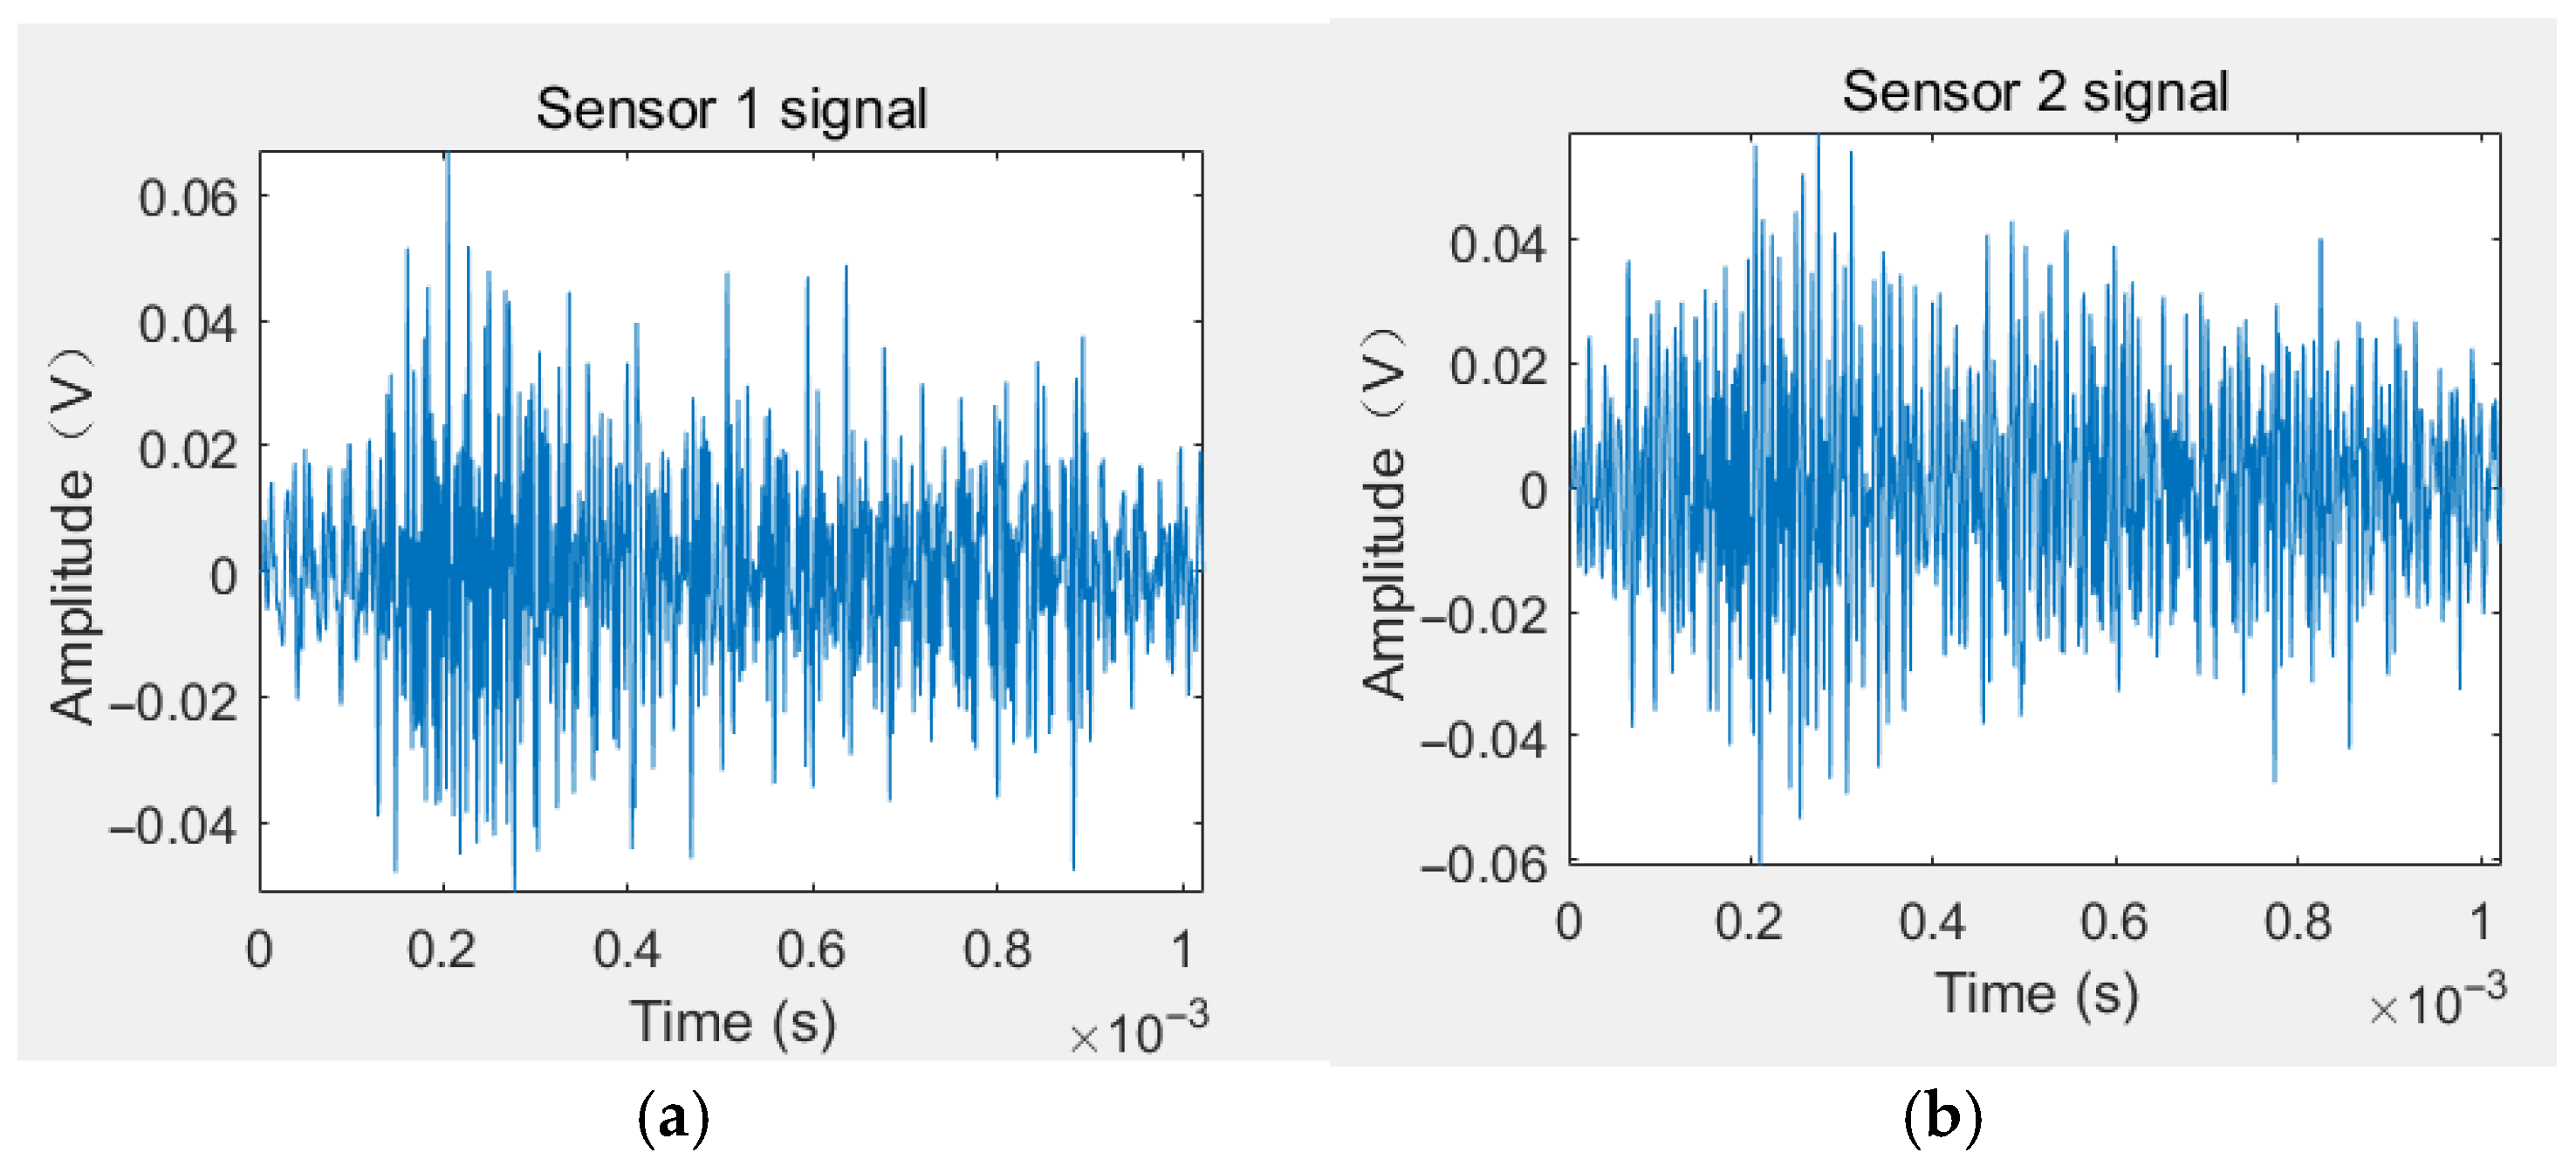
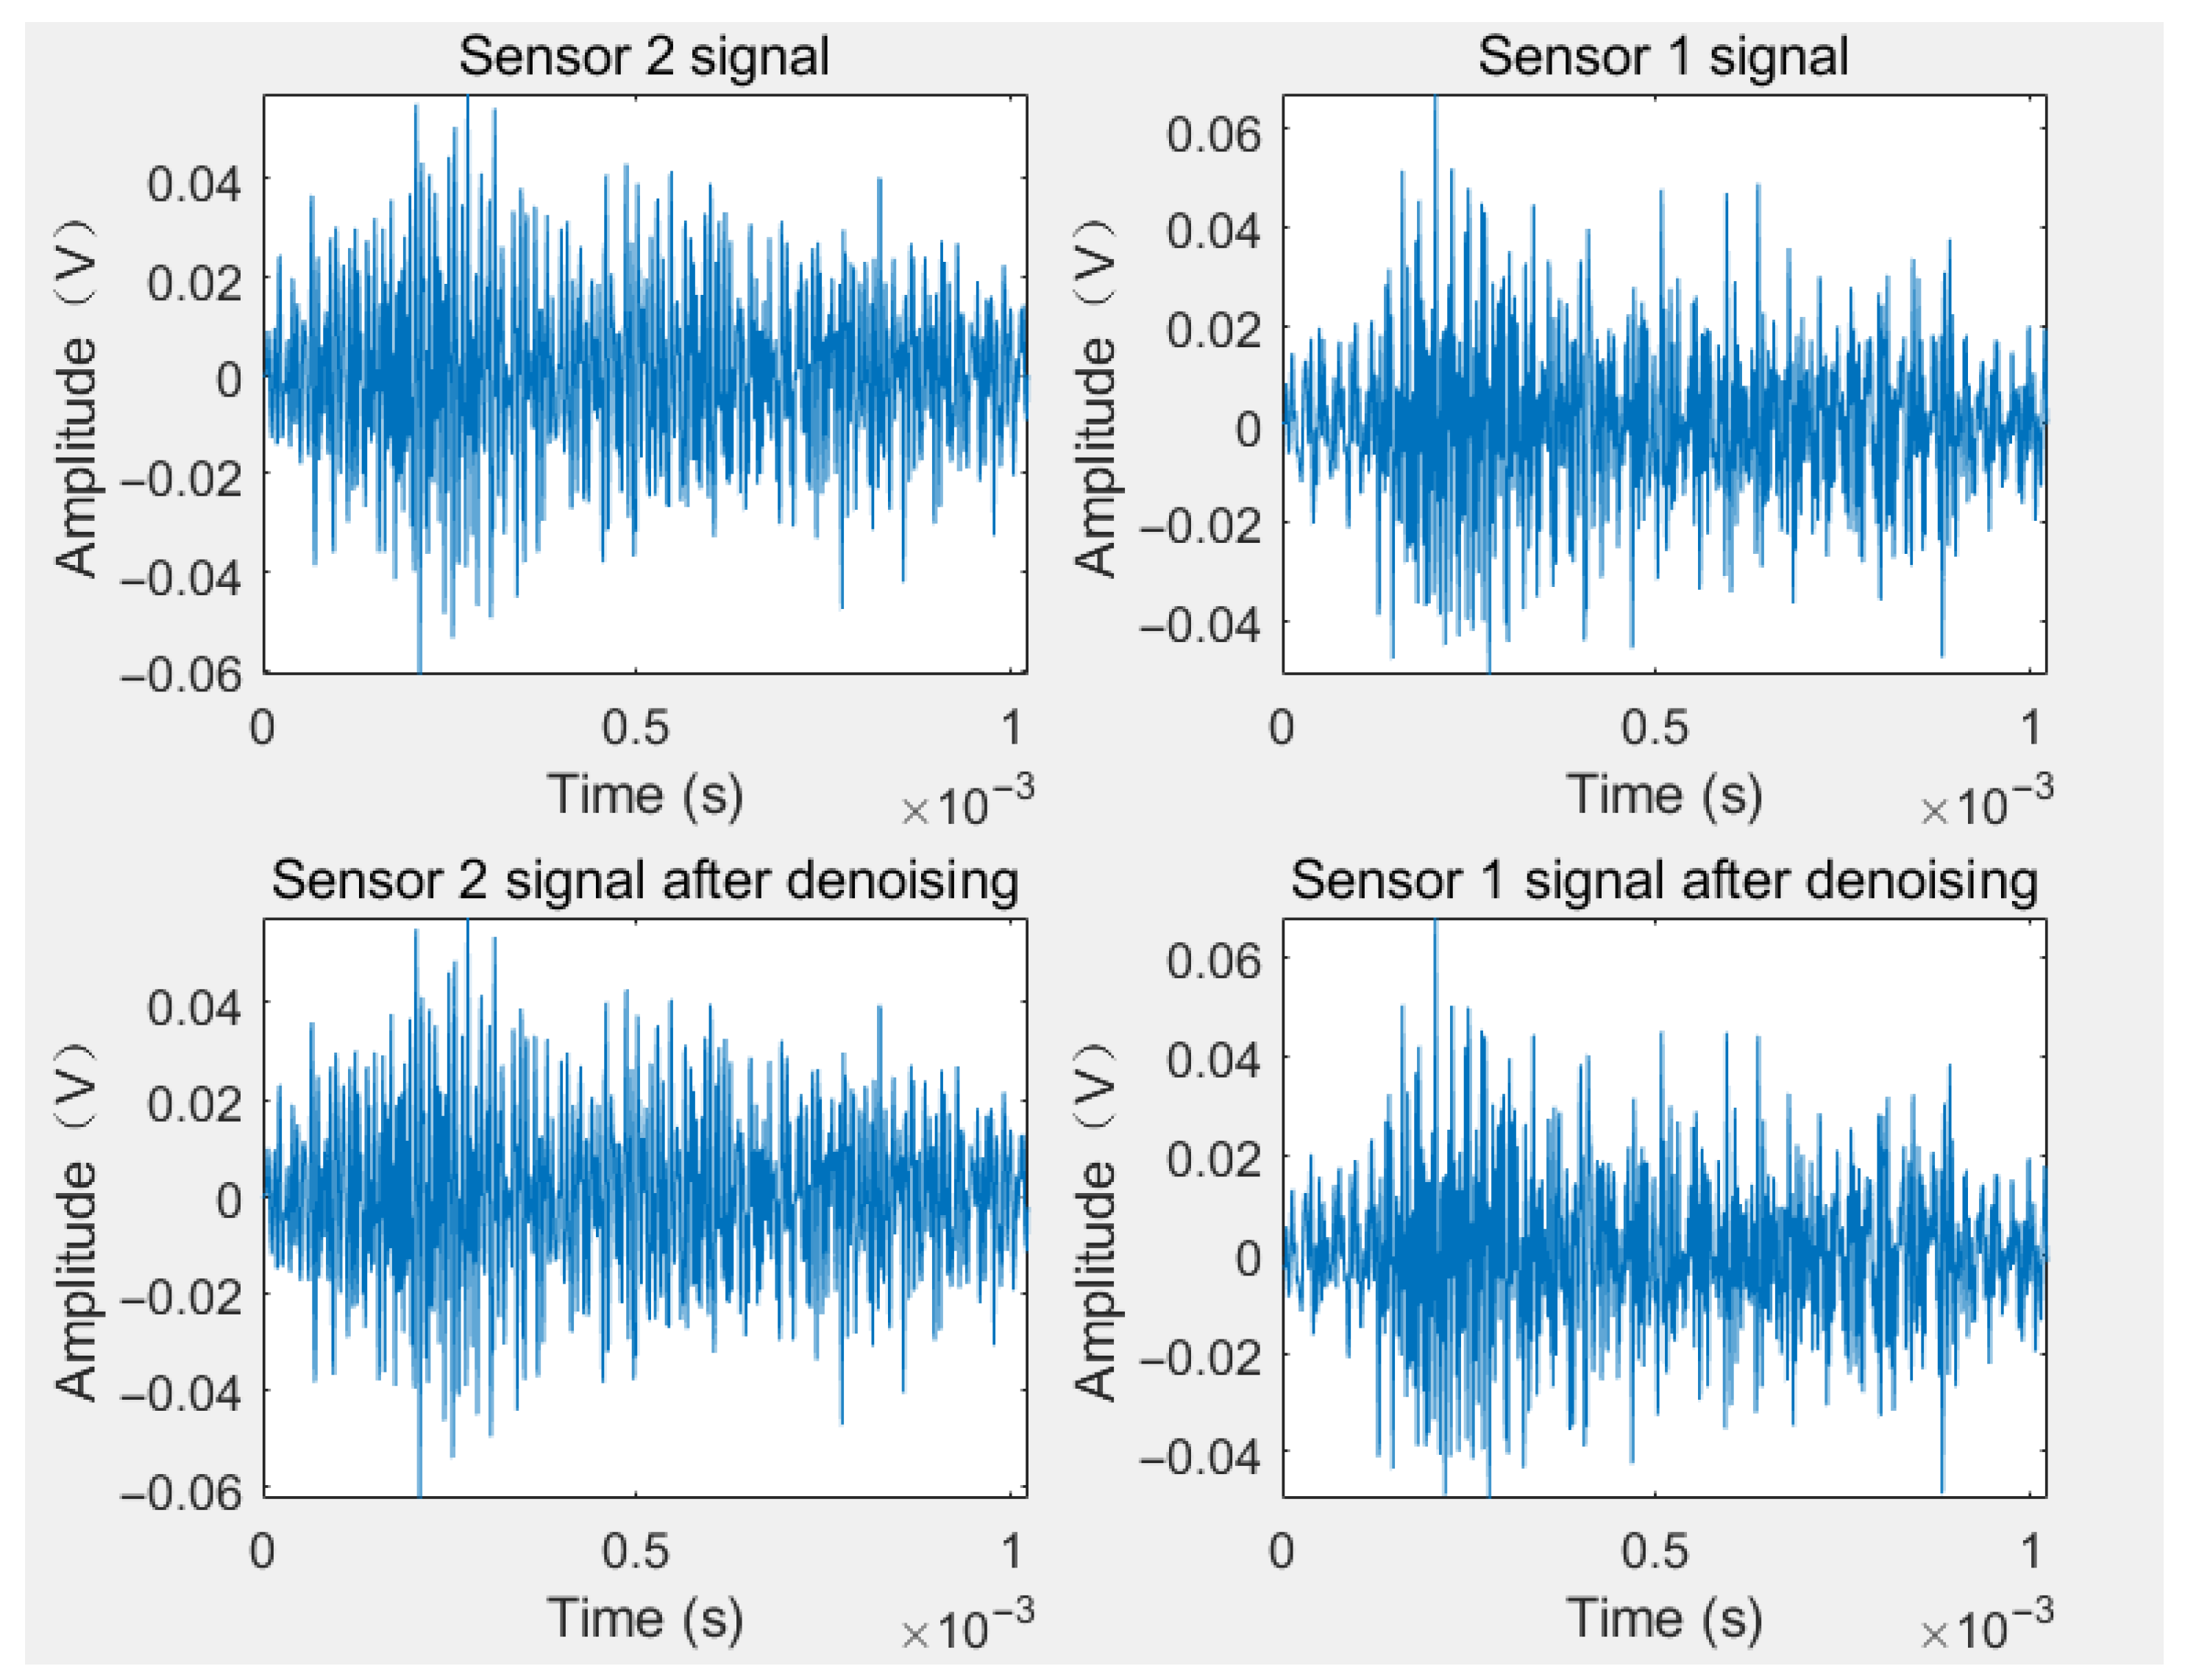
The signal data collected by the two sensors are shown in Figure 15. Calculate the leak location parameters based on the signal time delay, and then compare them with the actual leak point to obtain the error value.
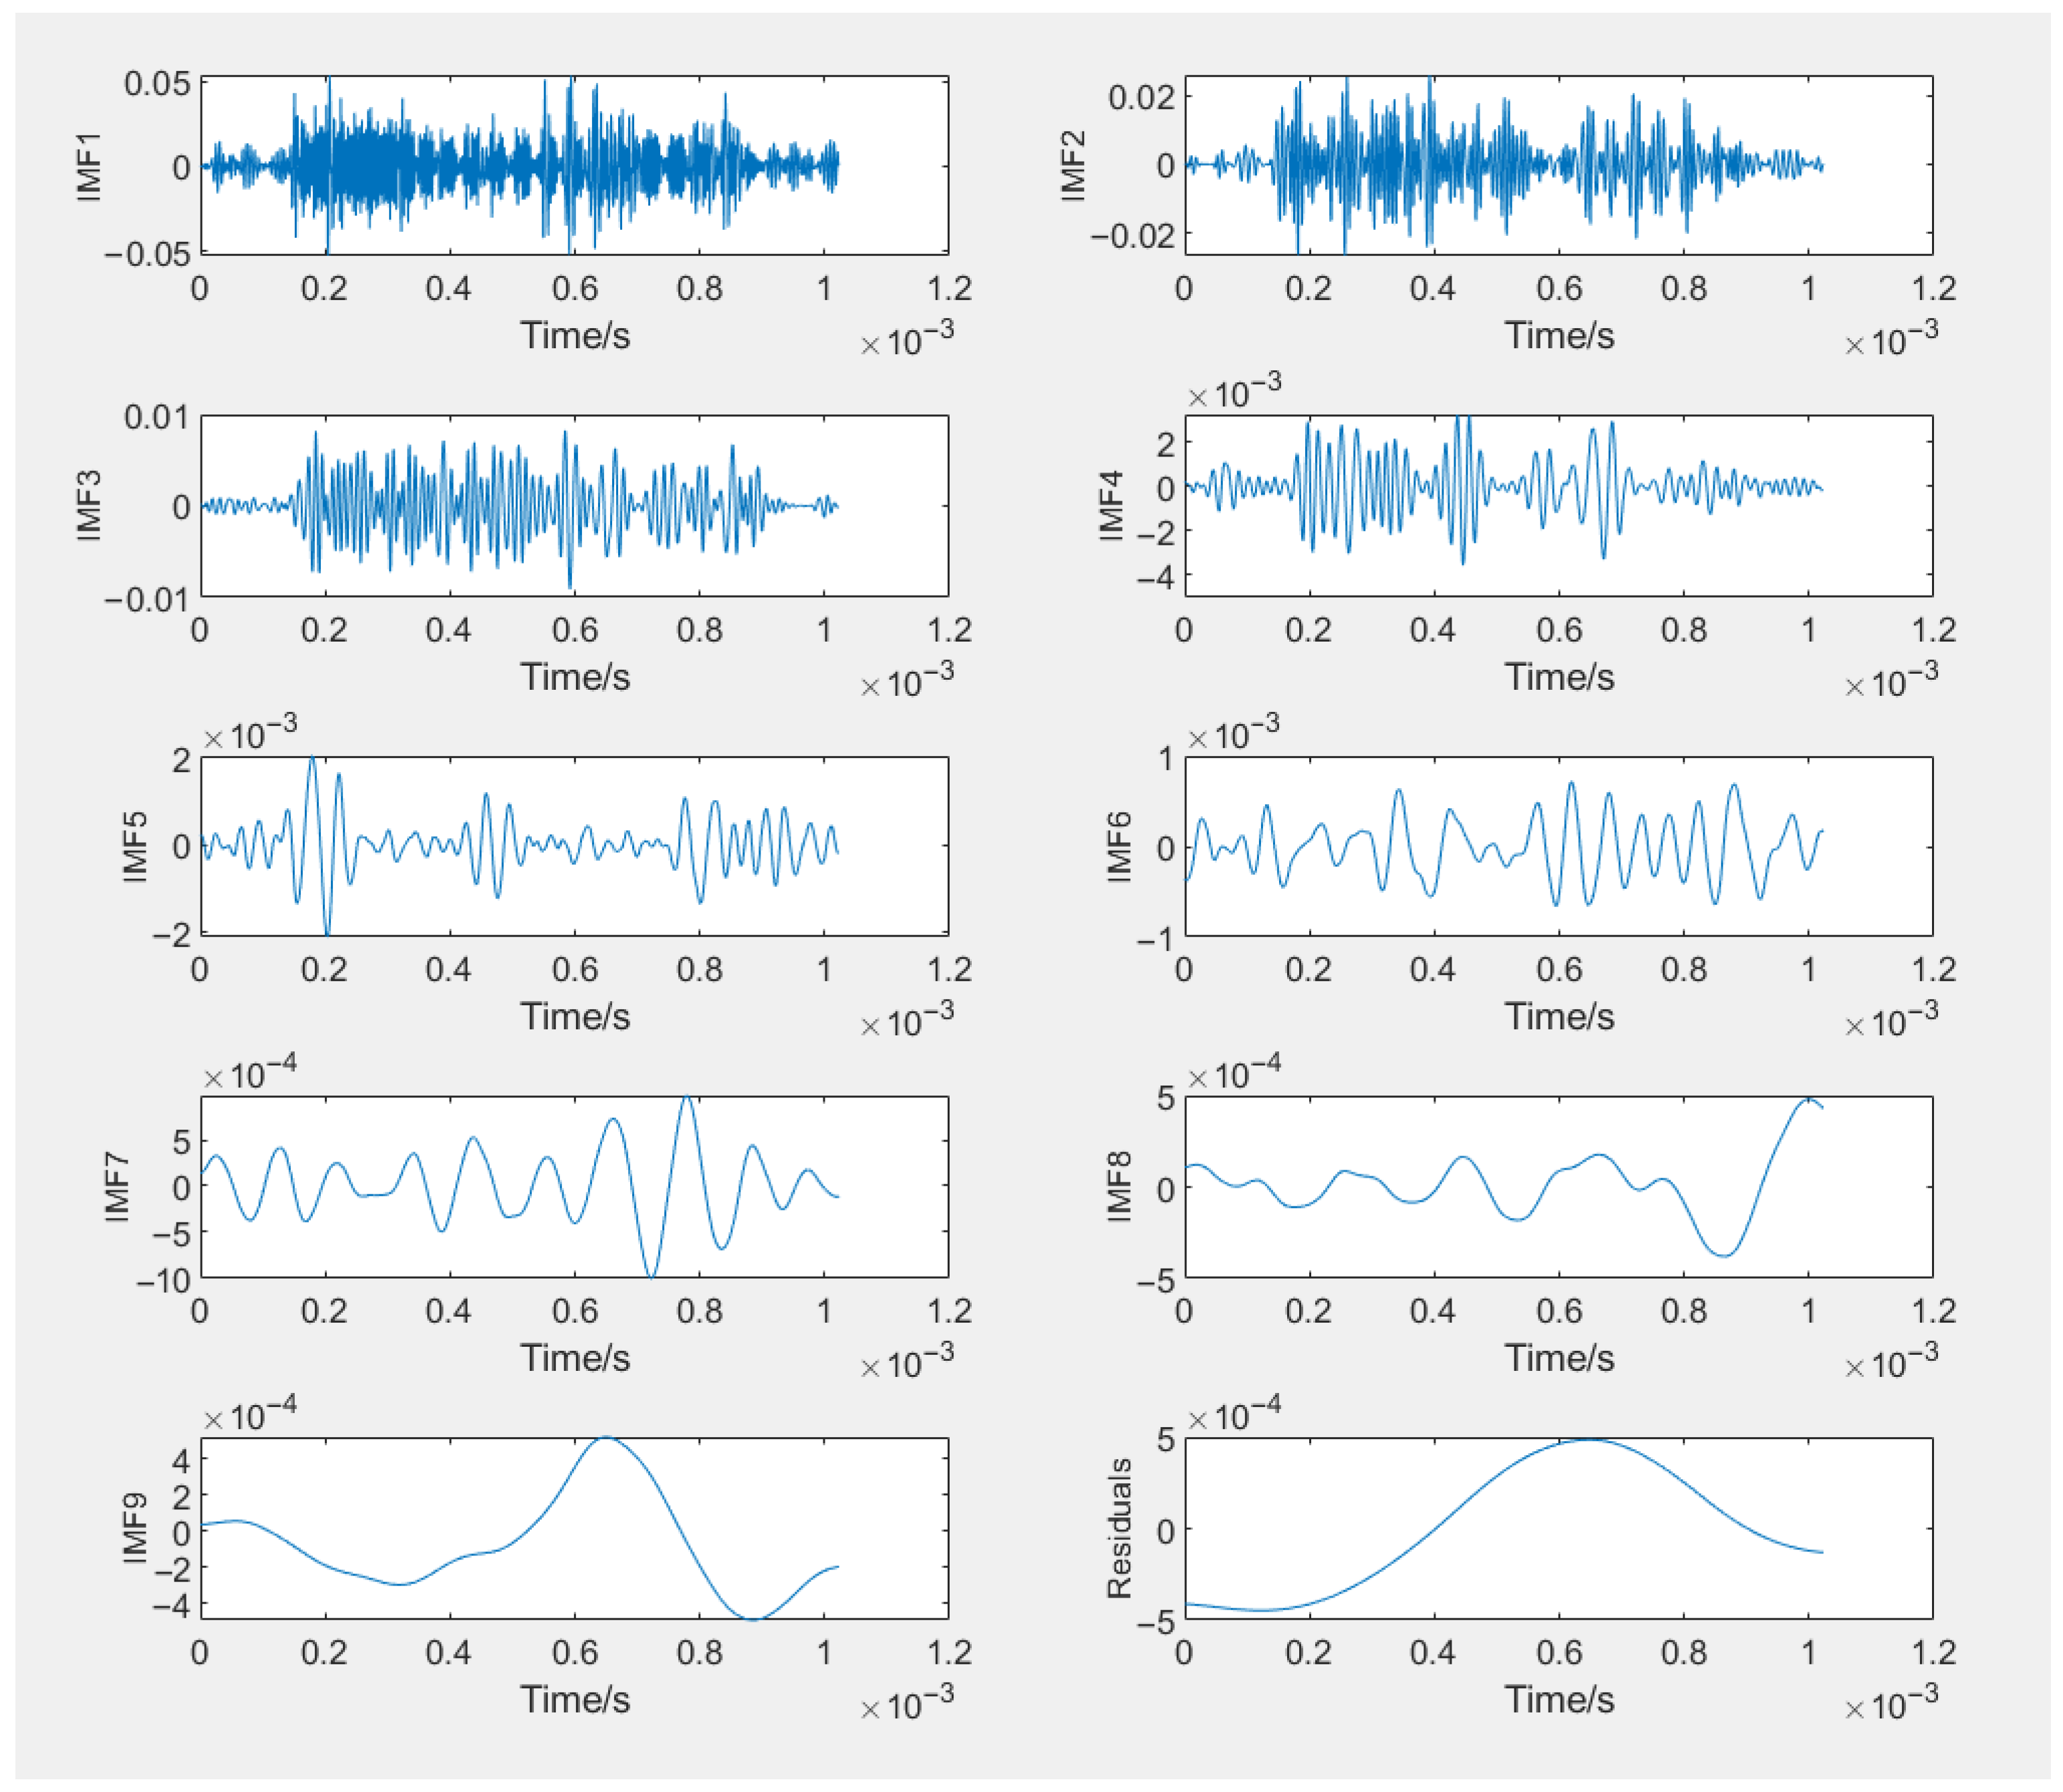
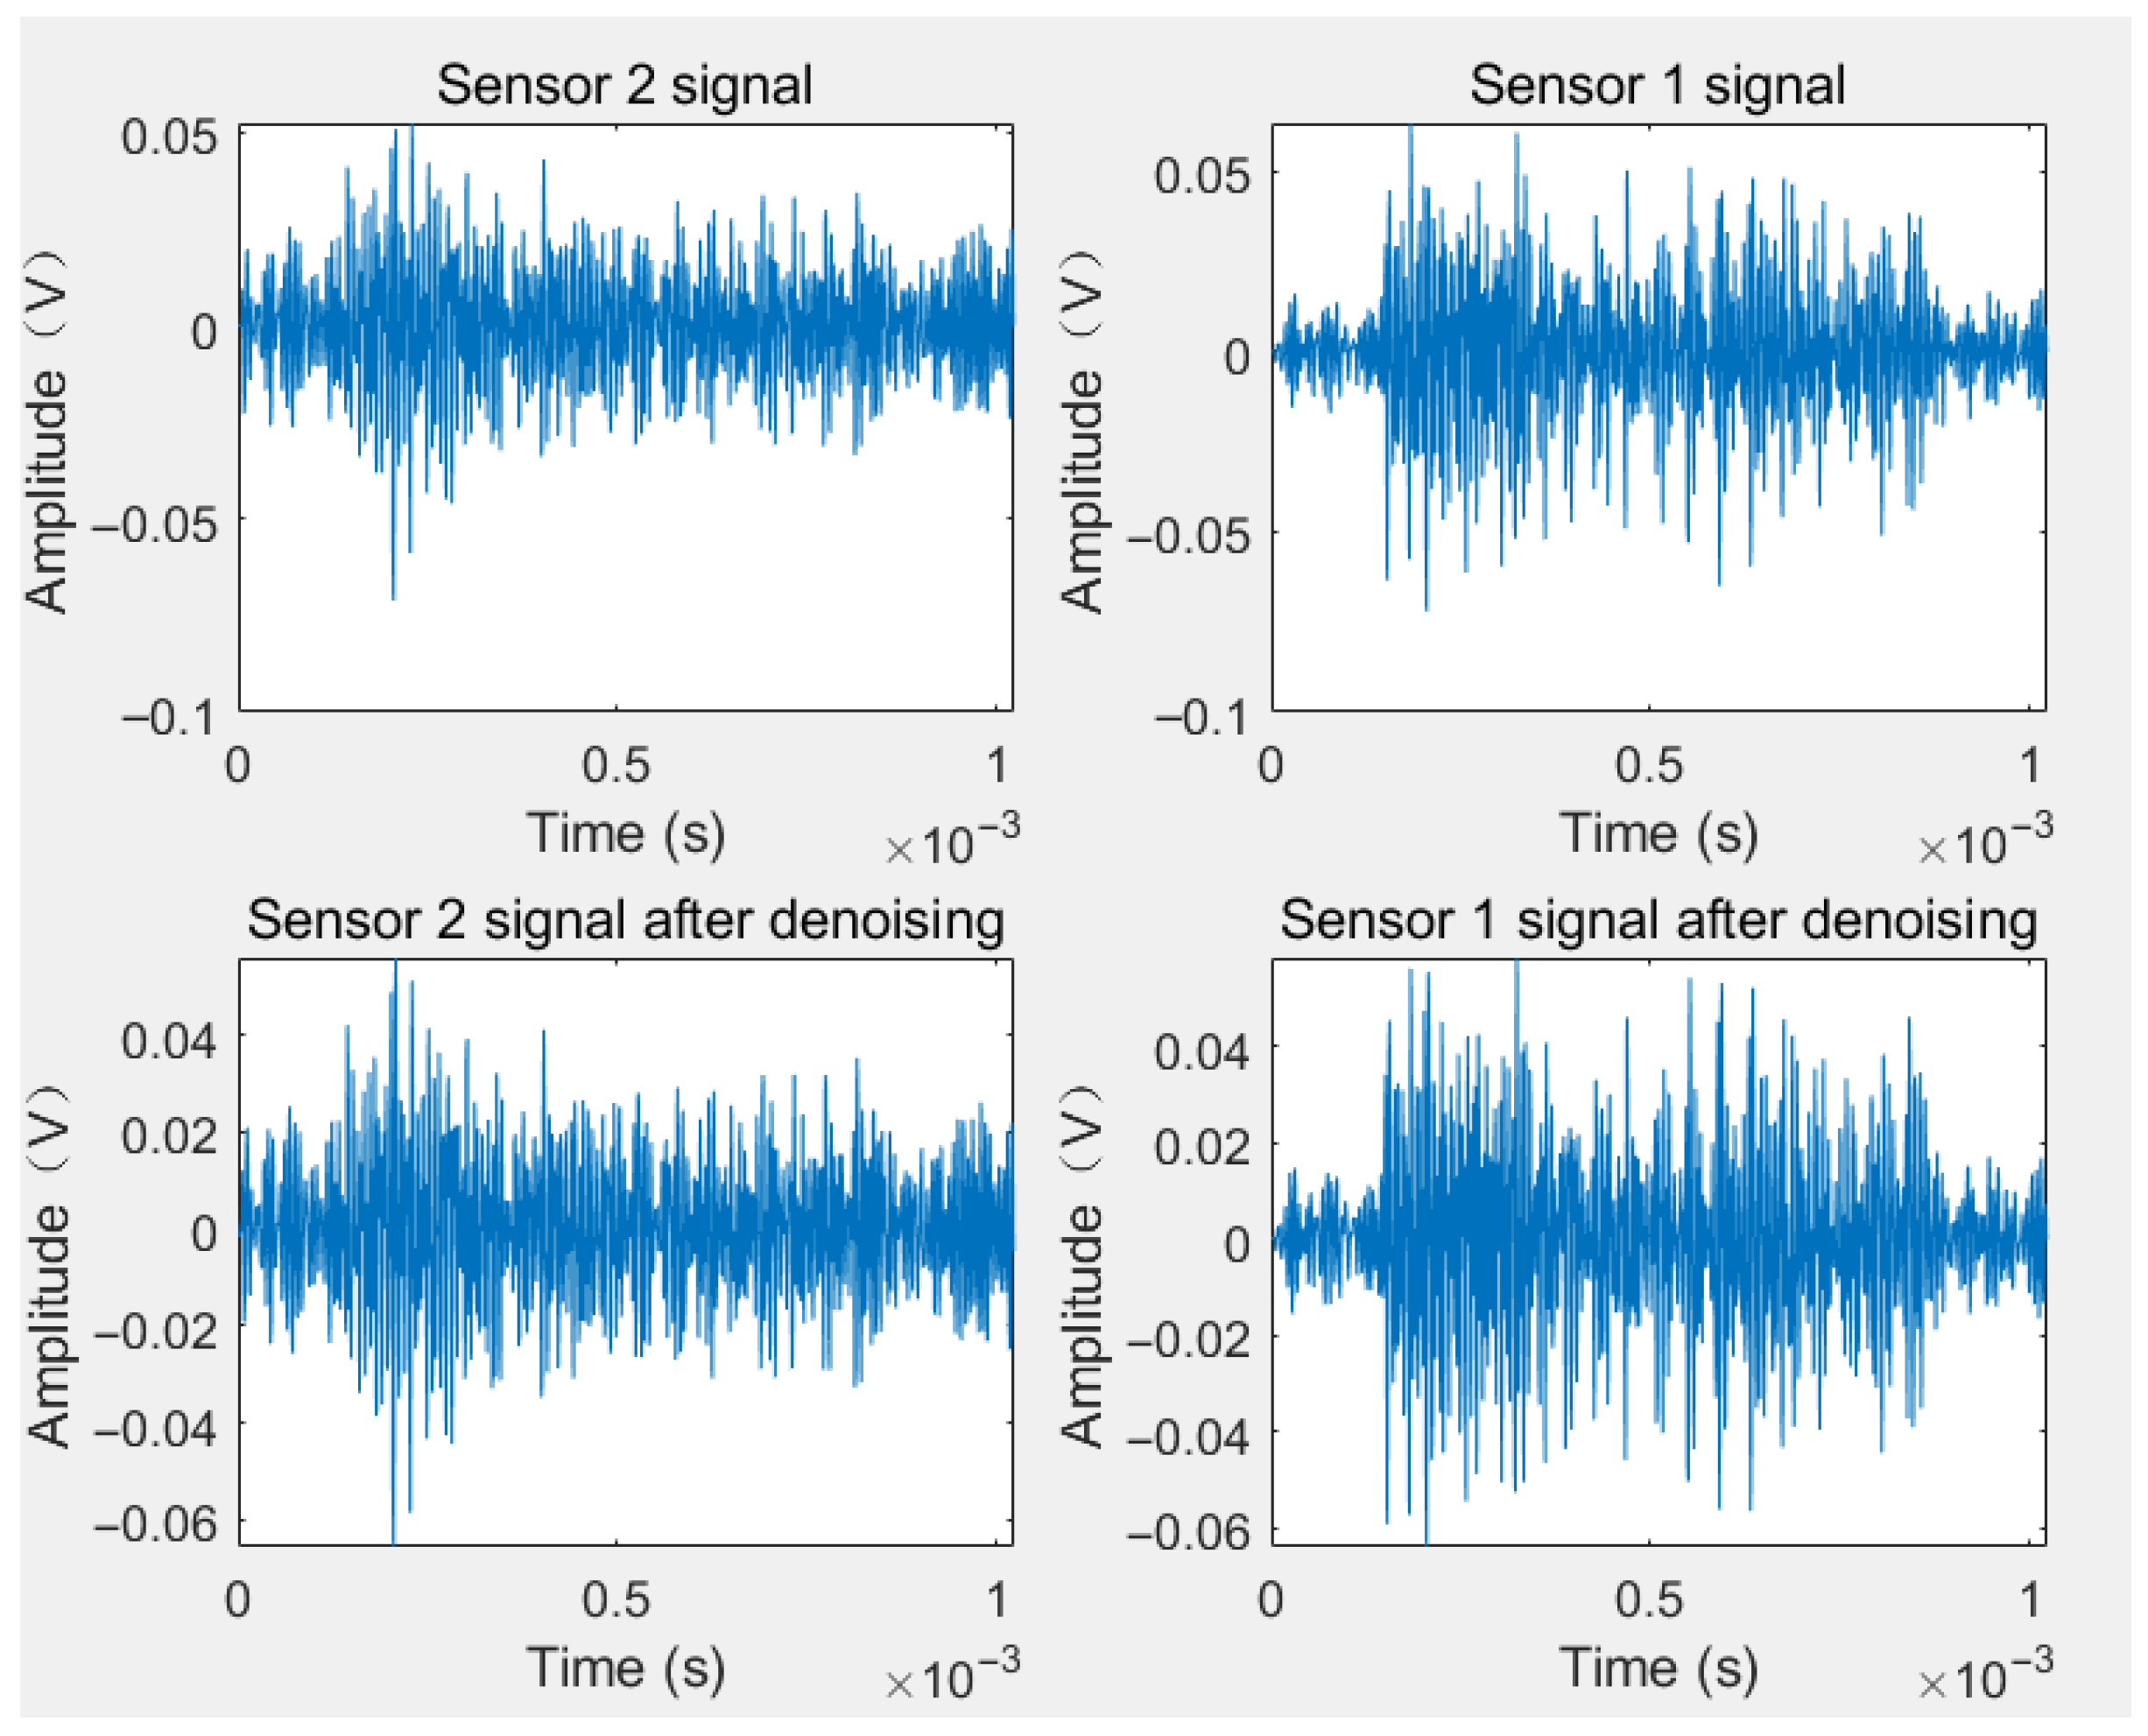
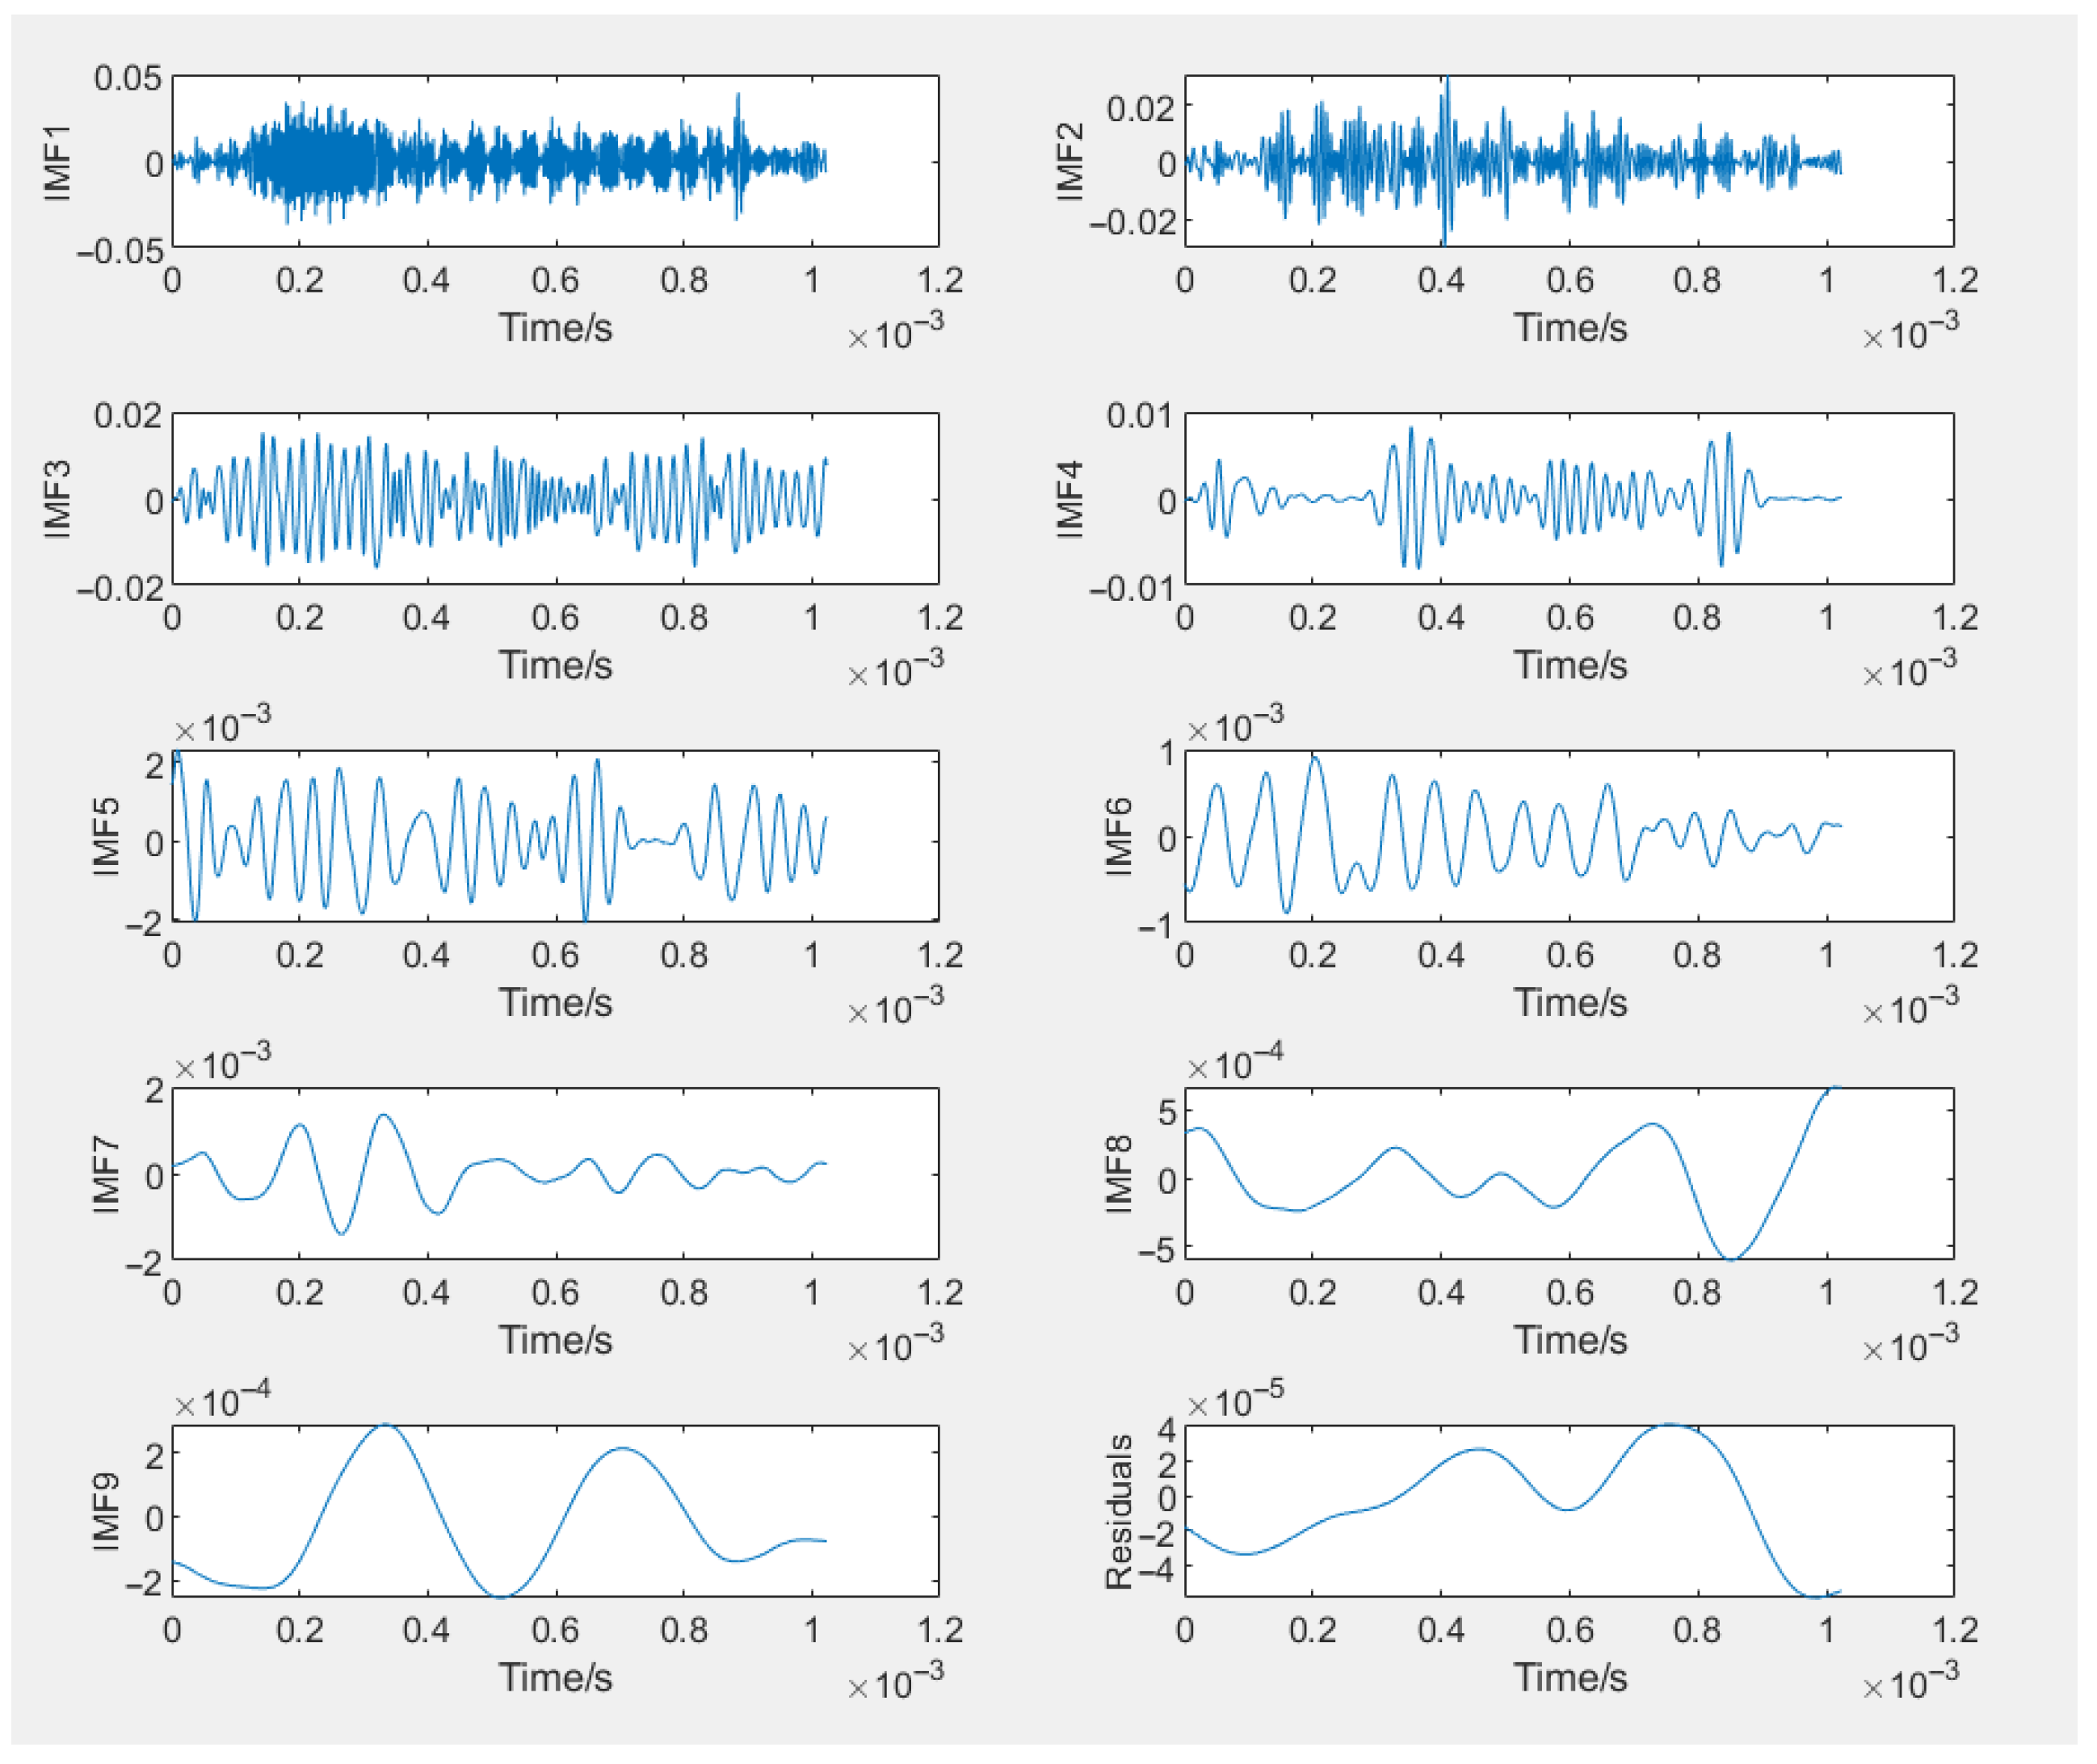
The CEEMDAN algorithm is used to denoise the collected leak signals. The leak signals are self-decomposed into 10 IMF components of different scale levels, arranged from high frequency to low frequency, representing the trend or mean value of the original signal (Figure 16). The series of IMFs obtained through decomposition characterizes the features of the signal at different time scales. The purpose of distinguishing the noise-dominated components can be achieved through the correlation analysis between the IMFs and the leak signals.
Perform cross-correlation calculations between the obtained characteristic components of different orders and the original signal to distinguish between noise-dominated components and signal-dominated components. Calculate the cross-correlation coefficients between each order of characteristic components and the original signal, respectively (Table 5). From the results of the cross-correlation calculations, it can be determined that IMF4-IMF10 are pure noise or noise-dominated components, and IMF1-IMF3 are signal-dominated components.

5.3. Reconstruction of the Leak Signal

After determining that IMF1-IMF3 are the signal-dominated components, signal reconstruction is carried out. Figure 17 shows a comparison between the denoised signal after reconstruction and the original noisy signal.
After denoising, the denoising effect is evaluated using two metrics, SNR (Signal-to-Noise Ratio) and RMSE (Root Mean Square Error). As can be seen from Table 6, after denoising, the SNR of the signal is greater than 10, and the root mean square error is small, meeting the requirements for cross-correlation time delay estimation of the signal.

5.4. Calculation of Leak Point Location

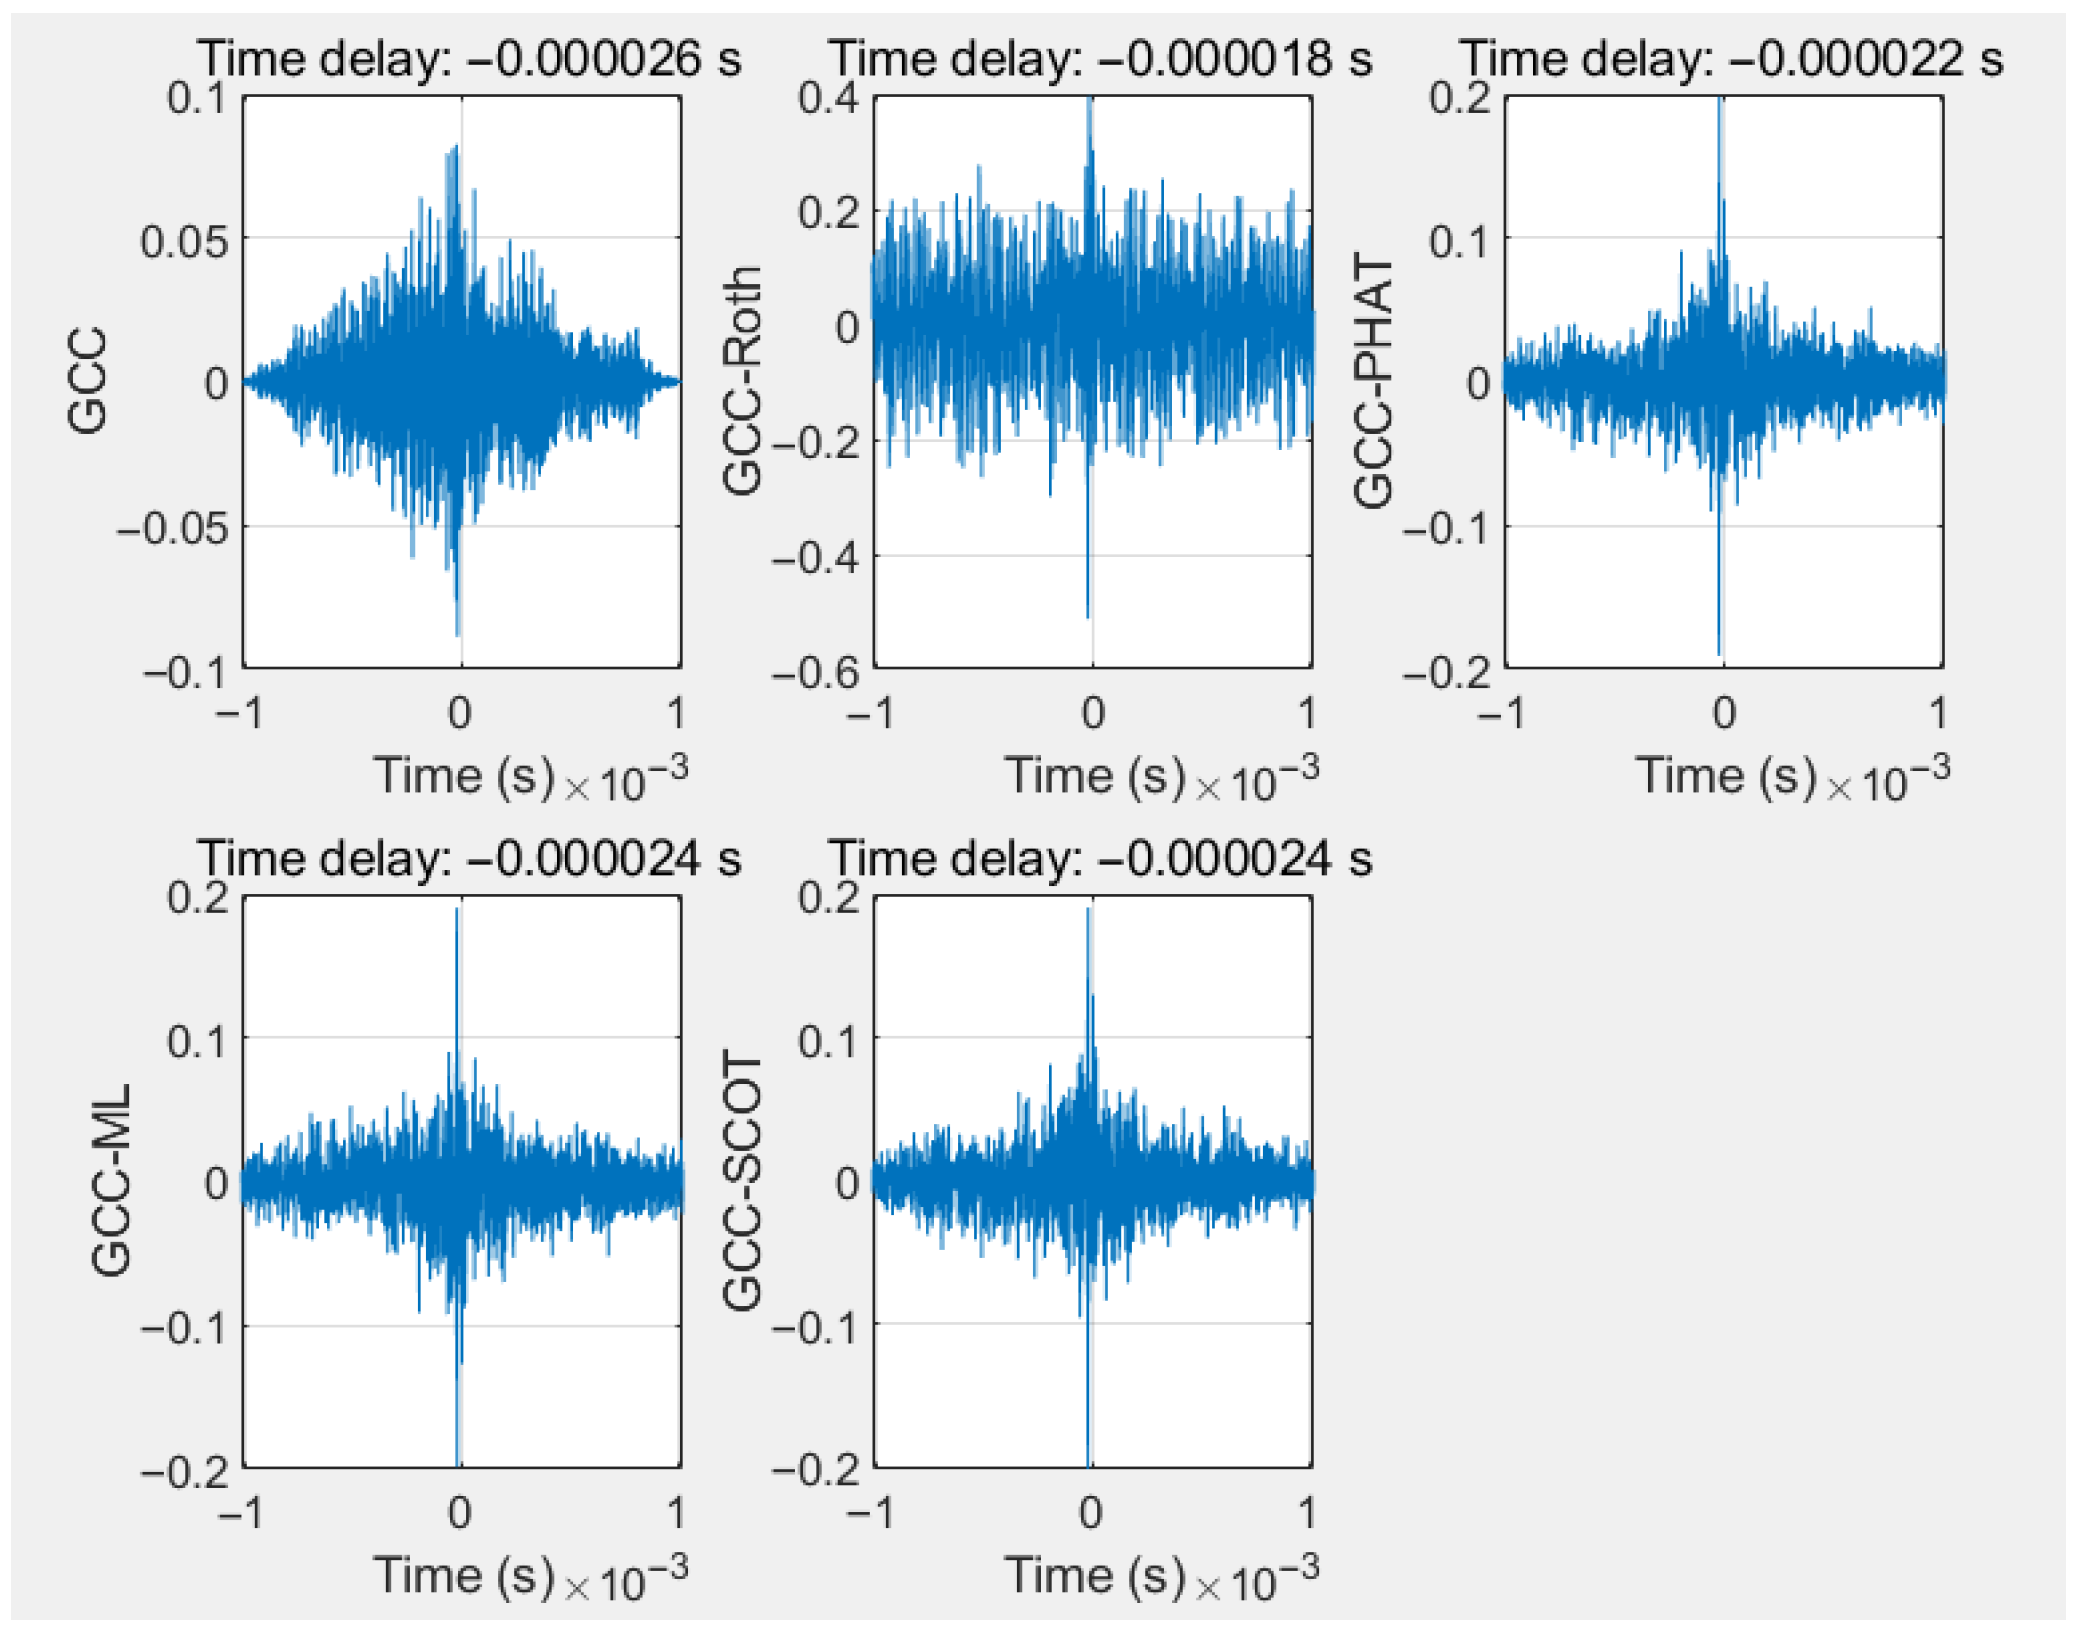
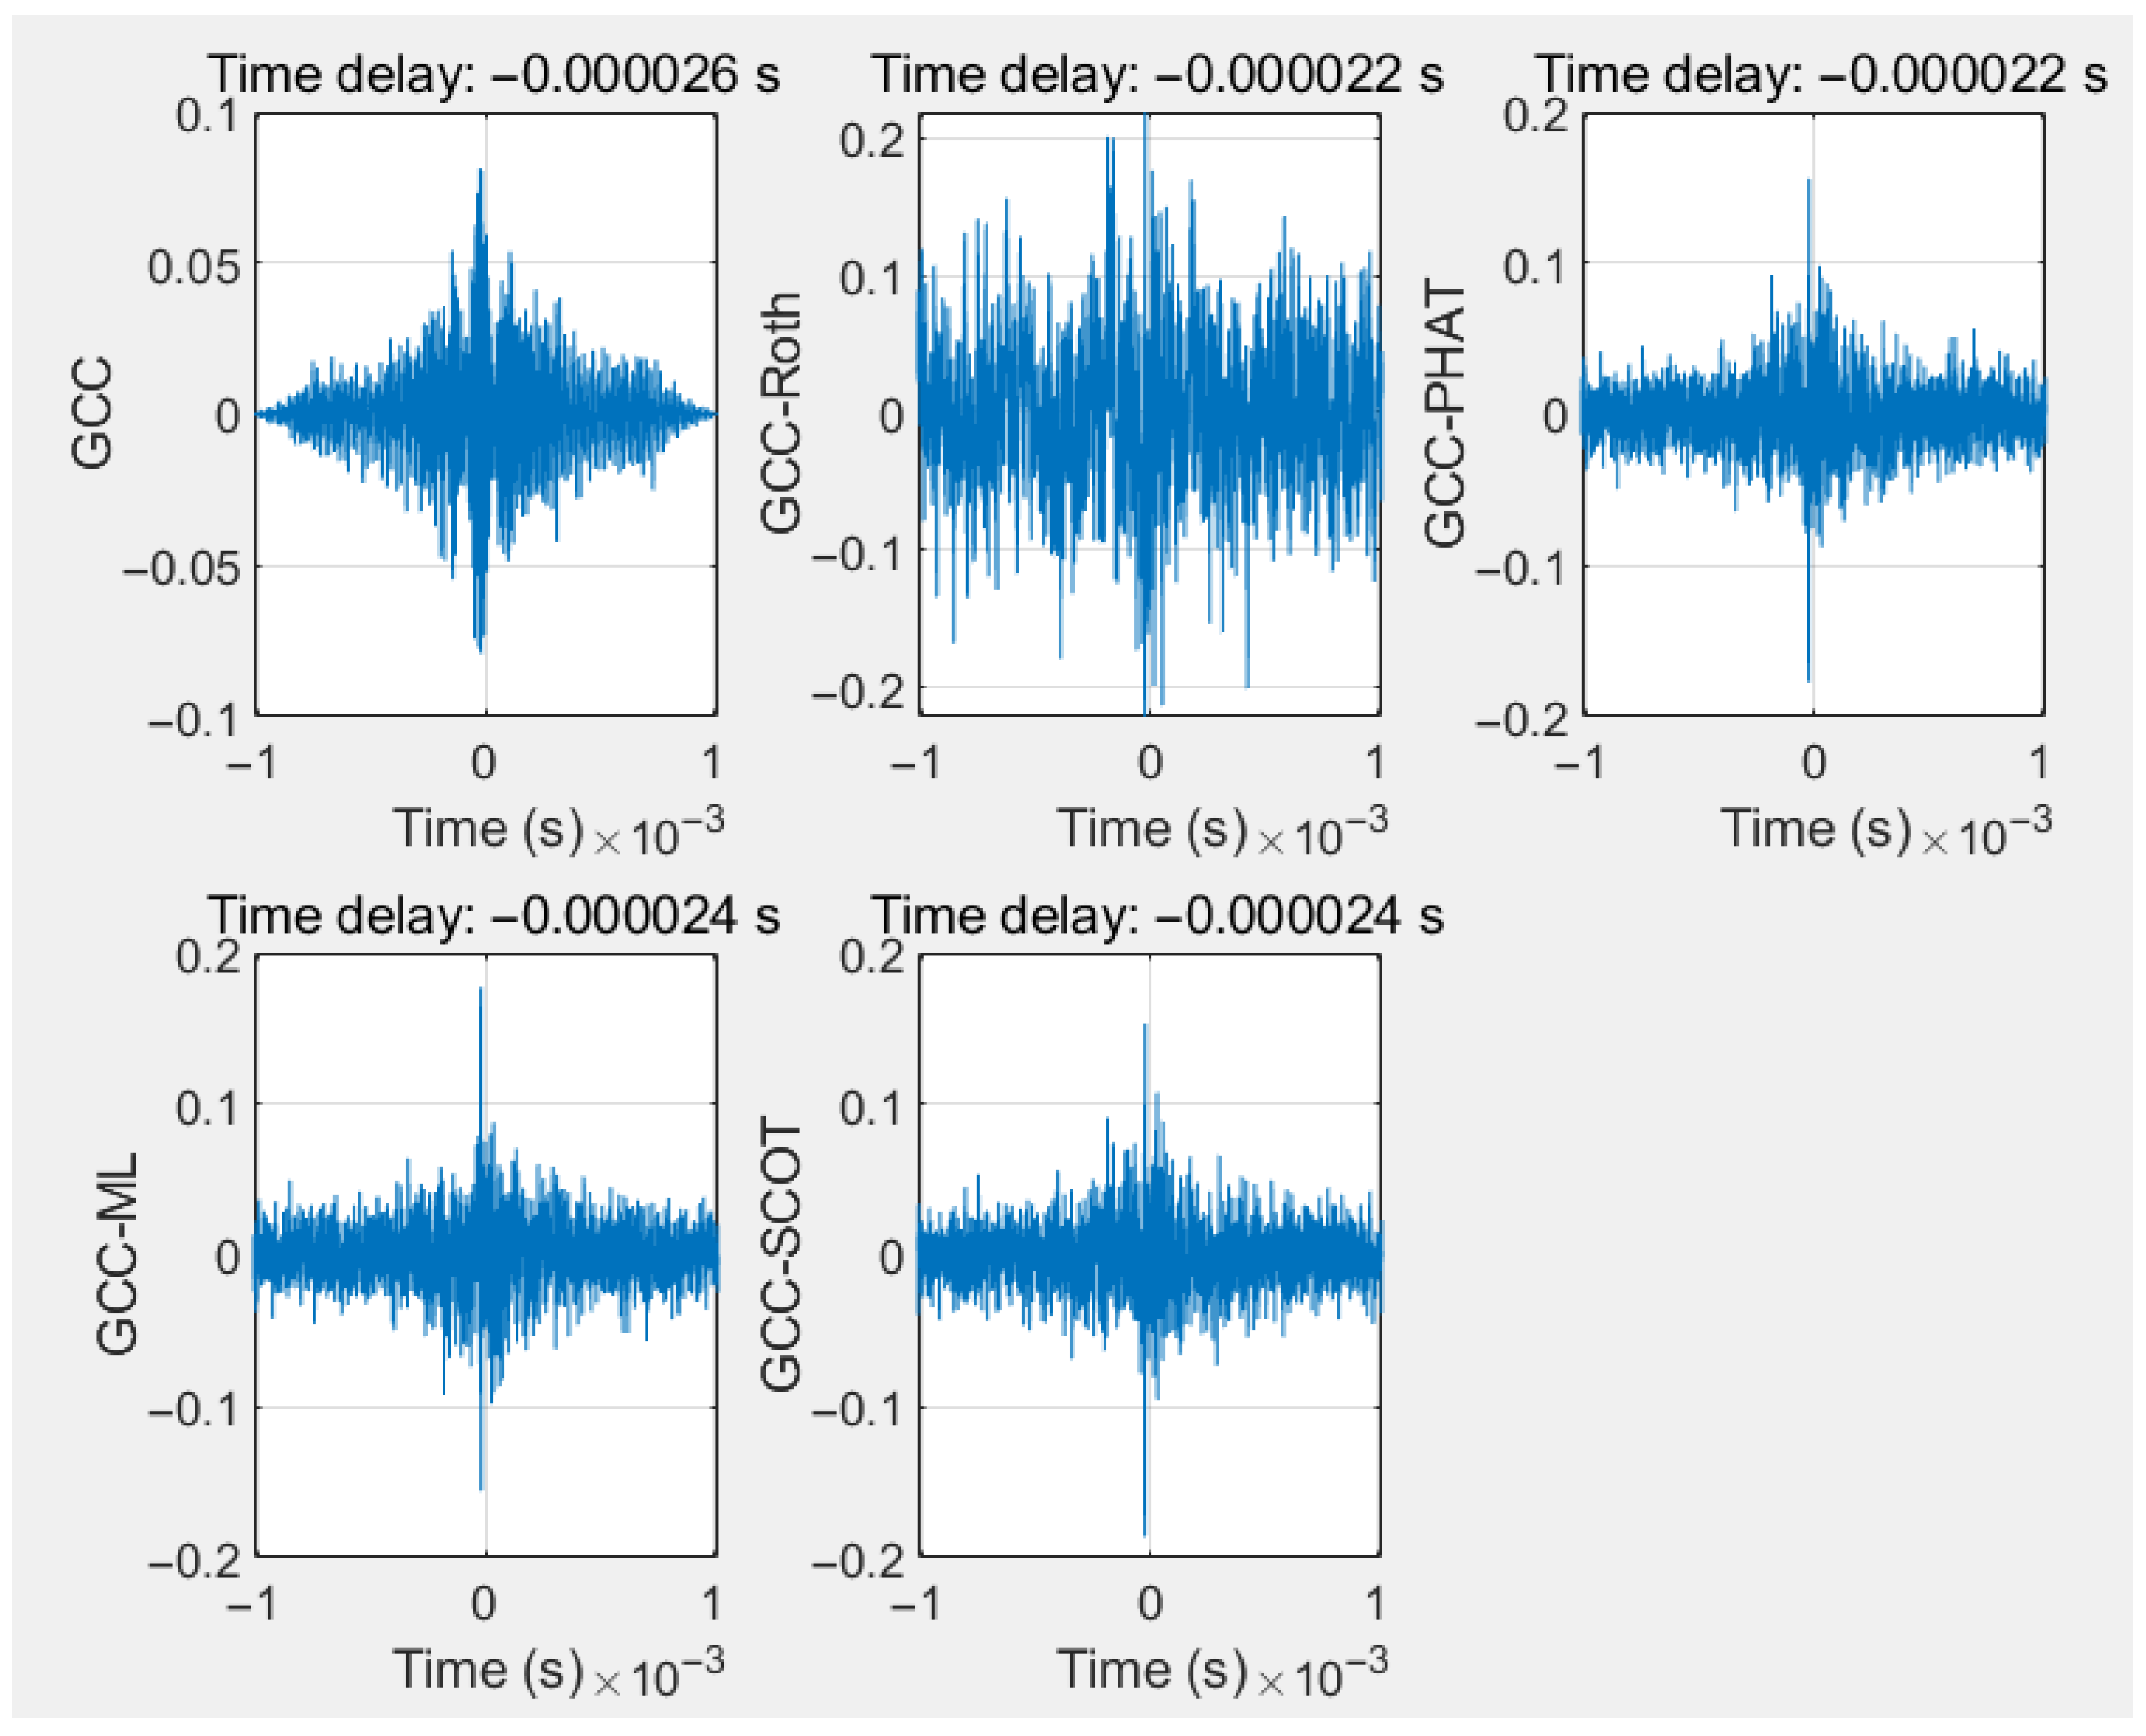
After denoising the signal by the CEEMDAN method, the interference of noise can be reduced to a certain extent. Then, the delay between the two signals can be calculated by combining five cross-correlation algorithms with the acoustic emission leak detection and location formula. The calculation results are shown as Figure 18.
The time difference between the sensors upstream and downstream of the leak source is calculated using five time delay estimation algorithms. Then, combined with the sound speed in the pipeline, the location of the leak point can be calculated. As shown in Table 7, the errors of the location results obtained by the five different time delay calculation methods are within the acceptable range of the project. Thus, it can be concluded that acoustic emission technology has good applicability for gaseous pipelines, providing a reliable, economical, and efficient leak location method for CO2 pipelines.

5.5. The Prospect of Industrial Pipeline Applications

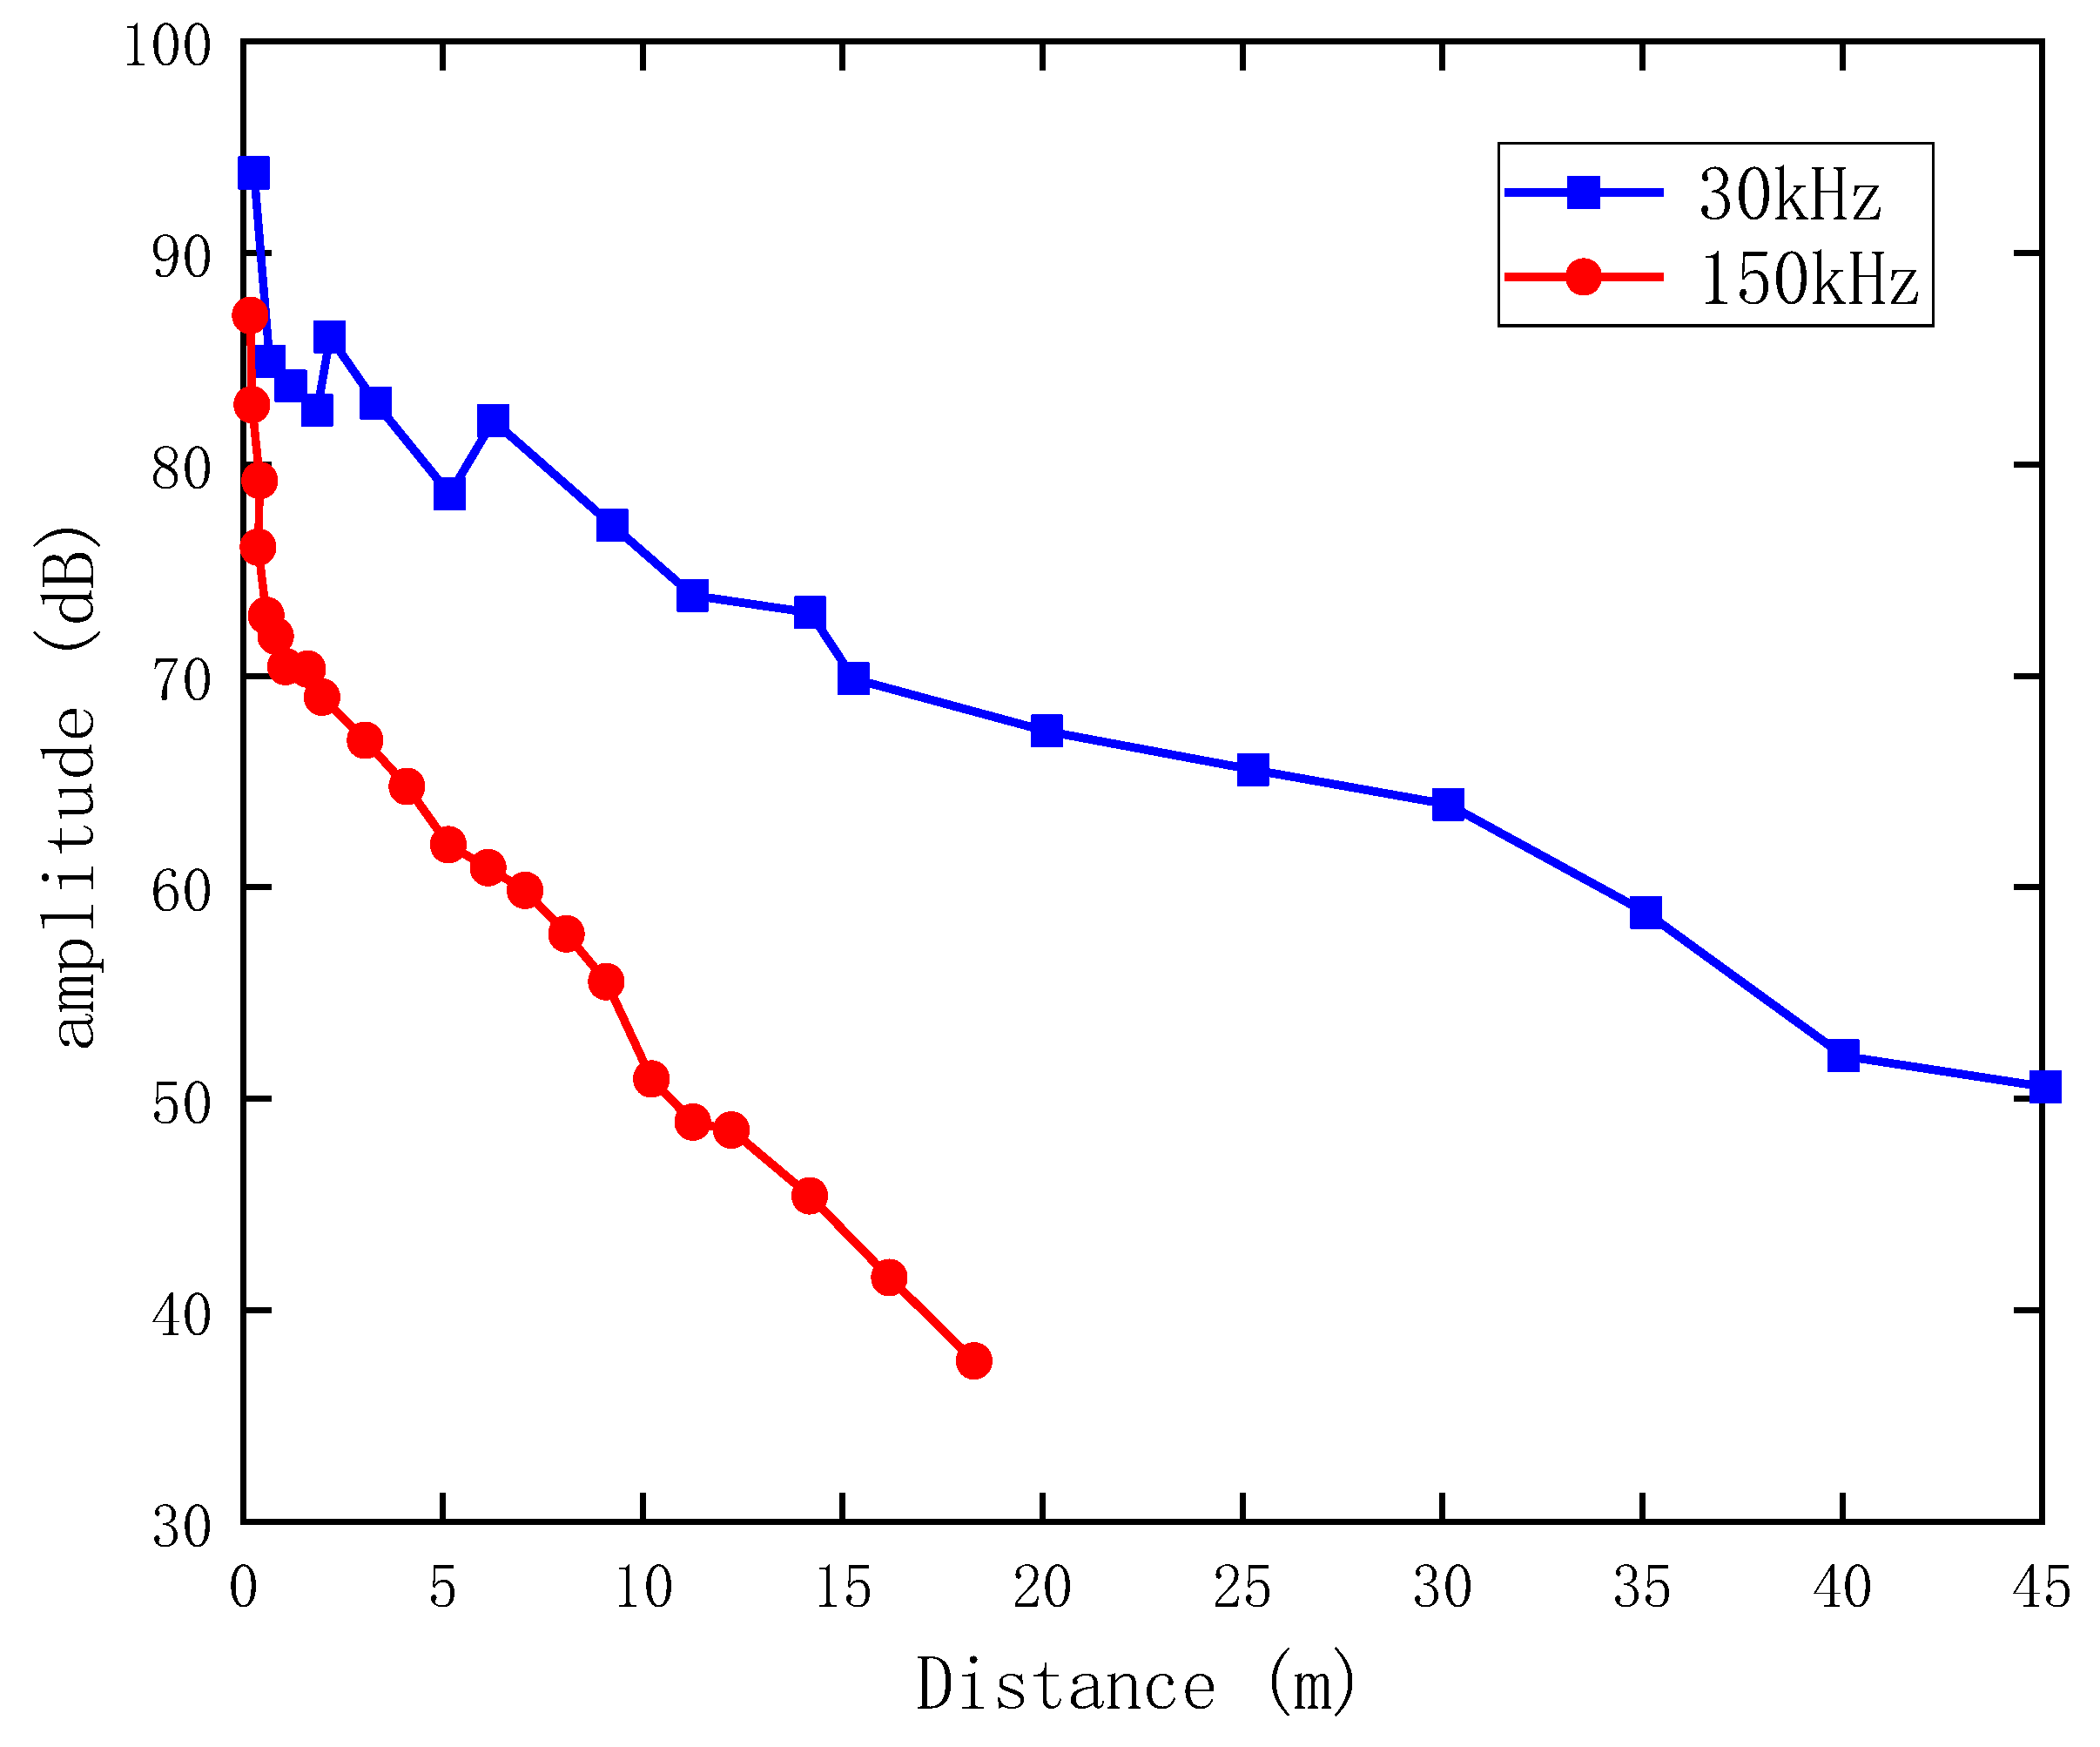
The acoustic emission signals collected by sensors with different frequencies are different. The attenuation coefficient (α) of acoustic emission signals is usually proportional to the square of the frequency (f) (α ∝ f2), which means that the lower the frequency, the farther the signal can travel. At the same time, increasing the gain of the pre-amplifier can enhance the signal intensity, thereby effectively extending the detection distance. From Figure 19, it can be seen that frequency has a strong influence on the attenuation characteristics of signals. The signal collected by a sensor with a center frequency of 150 kHz at a distance of 20 m has already attenuated by 50%, while the signal collected by a sensor with the same center frequency of 30 kHz at a distance of 45 m still has a relatively high amplitude. Due to the limitations of current experimental conditions, it is impossible to obtain the attenuation curves of pipelines several kilometers long. However, based on experimental data, it can be inferred that a low-frequency acoustic emission sensor, with a magnification of 40 dB, can achieve a detection distance of nearly 100 m in one measurement. If a sensor with an even lower frequency (such as an infrasound sensor) and a pre-amplifier with a higher magnification (such as 60 dB or 80 dB) are selected, the detection distance should be further extended.
Maximum Detection Distances Achievable by Combinations of Some Common Sensors and Amplifiers can be seen from Table 8. Considering the extended distance of long-distance pipelines, the system can typically be simplified as a one-dimensional model. The sensors are advised to be linearly installed on the pipeline. The low-frequency sensors combined with high-magnification amplifiers can be arranged at intervals of 150 m in high-consequence areas. At the same time, stress and strain detection devices can be installed on the pipeline, and 360° spherical cameras can be installed around it for 24 h real-time monitoring. These three measures together can ensure the safety of the pipeline and the lives and property of people in the surrounding area.

6. Conclusions

(1)
In the preliminary experiment of air pipeline leak location, the SNR values obtained by the CEEMDAN denoising algorithm were 18.46 and 21.16, respectively, while the SNR values obtained by the EEMD algorithm were 15.84 and 18.45, respectively. The RMSE values of both denoising methods were relatively small. This indicates that the CEEMDAN denoising algorithm can enhance the signal decomposition and denoising capabilities, increase the signal-to-noise ratio, better preserve the effective components of the signal, and the reconstructed waveform has a high degree of fit with the original waveform, proving the reliability of the method. Five time-delay estimation methods, namely GCC, Roth weighting, PHAT weighting, ML weighting, and SCOT weighting, were used for location calculations, and the positioning accuracies were 8.7%, 6.0%, 7.4%, 8.1%, and 8.1% respectively.
(2)
In the experiment of CO2 pipeline leak location, after denoising the signal using the CEEMDAN denoising algorithm, based on the principle of acoustic emission location detection, five time-delay estimation algorithms, namely the GCC method, Roth weighting, PHAT weighting, ML weighting, and SCOT weighting, were used to calculate the time difference between the sensors upstream and downstream of the leak source. Combining this with the pipeline sound speed, the specific location of the leak point can be determined. The positioning accuracies of different generalized weighted cross-correlation methods were 10.6%, 6.9%, 6.9%, 8.6%, and 8.6% respectively, all meeting the engineering accuracy requirements. Combining the results of the preliminary experiment on air pipeline leak location, the Roth weighting method has more advantages.
(3)
This study verified that the acoustic emission technology has good applicability and engineering feasibility in the leak location of gaseous CO2 pipelines. The positioning error is controlled within 6.9%. However, the current experiment only covers the gaseous CO2 working conditions and has not yet covered the leak location of dense-phase and supercritical CO2 pipelines, which are more common in actual engineering. This part will be further improved in subsequent research.

Author Contributions

Conceptualization, methodology, supervision, writing—review and editing, X.L.; writing—original draft preparation, formal analysis, software, Y.M. All authors have read and agreed to the published version of the manuscript.

Funding

Supported by the National Natural Science Foundation of China for Regional Fund (52562047); Natural Science Foundation of Xinjiang Uygur Autonomous Region (2023D01A19); Xinjiang Uygur Autonomous Region “Tianchi talents” introduction plan project (TCYC12); Xinjiang Tianshan Innovation Team for Research and Application of High-Efficiency Oil and Gas Pipeline Transportation Technology (2022TSYCTD0002); Xinjiang Uygur Region “One Case, One Policy” Strategic Talent Introduction Project (XQZX20240054).

Institutional Review Board Statement

Not applicable.

Informed Consent Statement

Not applicable.

Data Availability Statement

The original contributions presented in this study are included in the article.

Conflicts of Interest

The authors declare no conflicts of interest.

References

  1. Rui, Z.; Zeng, L.; Dindoruk, B. Challenges in the large-scale deployment of CCUS. Engineering 2025, 44, 17–20. [Google Scholar] [CrossRef]
  2. Yan, Y.; Borhani, T.N.; Subraveti, S.G.; Pai, K.N.; Prasad, V.; Rajendran, A.; Nkulikiyinka, P.; Asibor, J.O.; Zhang, Z.; Shao, D.; et al. Harnessing the power of machine learning for carbon capture, utilisation, and storage (CCUS)—A state-of-the-art review. Energy Environ. Sci. 2021, 14, 6122–6157. [Google Scholar] [CrossRef]
  3. Liu, H.J.; Were, P.; Li, Q.; Gou, Y.; Hou, Z. Worldwide status of CCUS technologies and their development and challenges in China. Geofluids 2017, 2017, 6126505. [Google Scholar] [CrossRef]
  4. Huang, W.H.; Li, Y.X.; Chen, P.C. Development strategy of carbon dioxide pipelines in China under the vision of carbon neutrality. Nat. Gas Ind. 2023, 43, 1–9. (In Chinese) [Google Scholar]
  5. Lu, S.J.; Zhang, J.J.; Yang, F.; Wang, F.; Liu, M.M.; Gon, Y.P.; Fan, Z.N.; Fang, Q.Q.; Li, Q.F.; Chen, H.F.; et al. Analysis on the progress and future development of CO2 pipeline transportation technology. J. Nanjing Univ. Nat. Sci. 2022, 58, 944–952. (In Chinese) [Google Scholar]
  6. Siddique, M.F.; Ahmad, Z.; Kim, J. Pipeline leak diagnosis based on leak-augmented scalograms and deep learning. Eng. Appl. Comput. Fluid Mech. 2023, 17, 2225577. [Google Scholar] [CrossRef]
  7. Gholami, R.; Raza, A.; Iglaurer, S. Leakage risk assessment of a CO2 storage site: A review. Earth-Sci. Rev. 2021, 223, 103849. [Google Scholar] [CrossRef]
  8. Korlapati, N.V.S.; Khan, F.; Noor, Q.; Mirza, S.; Vaddiraju, S. Review and analysis of pipeline leak detection methods. J. Pipeline Sci. Eng. 2022, 2, 100074. [Google Scholar] [CrossRef]
  9. Hou, F.; Zhang, Y.; Zhou, Y.; Zhang, M.; Lv, B.; Wu, J. Review on infrared imaging technology. Sustainability 2022, 14, 11161. [Google Scholar] [CrossRef]
  10. Roh, S.; Choi, H.R. Differential-drive in-pipe robot for moving inside urban gas pipelines. IEEE Trans. Robot. 2005, 21, 1–17. [Google Scholar]
  11. Ashry, I.; Mao, Y.; Wang, B.; Hveding, F.; Bukhamsin, A.Y.; Ng, T.K.; Ooi, B.S. A review of distributed fiber–optic sensing in the oil and gas industry. J. Light. Technol. 2022, 40, 1407–1431. [Google Scholar] [CrossRef]
  12. Huang, C.; Peng, F.; Liu, K. Pipeline inspection gauge positioning system based on optical fiber distributed acoustic sensing. IEEE Sens. J. 2021, 21, 25716–25722. [Google Scholar] [CrossRef]
  13. Li, J.; Zheng, Q.; Qian, Z.; Yang, X. A novel location algorithm for pipeline leakage based on the attenuation of negative pressure wave. Process Saf. Environ. Prot. 2019, 123, 309–316. [Google Scholar] [CrossRef]
  14. Banjara, N.K.; Sasmal, S.; Voggu, S. Machine learning supported acoustic emission technique for leakage detection in pipelines. Int. J. Press. Vessel. Pip. 2020, 188, 104243. [Google Scholar] [CrossRef]
  15. Li, S.; Wen, Y.; Li, P.; Yang, J.; Yang, L. Leak detection and location for gas pipelines using acoustic emission sensors. In Proceedings of the 2012 IEEE International Ultrasonics Symposium, Dresden, Germany, 7–10 October 2012; pp. 957–960. [Google Scholar]
  16. Quy, T.B.; Muhammad, S.; Kim, J. A reliable acoustic emission based technique for the detection of a small leak in a pipeline system. Energies 2019, 12, 1472. [Google Scholar] [CrossRef]
  17. Idachaba, F.; Rabiei, M. Current technologies and the applications of data analytics for crude oil leak detection in surface pipelines. J. Pipeline Sci. Eng. 2021, 1, 436–451. [Google Scholar] [CrossRef]
  18. Kaiser, J. Untersuchungen über das Auftreten von Geräuschen beim Zugversuch (An Investigation into the Occurrence of Noises in Tensile Tests or a Study of Acoustic Phenomena in Tensile Tests). Ph.D. Thesis, Technische Hochschule München, Munich, Germany, 1950. (In German). [Google Scholar]
  19. Grabec, I. Application of correlation techniques for localization of acoustic emission sources. Ultrasonics 1978, 16, 111–115. [Google Scholar] [CrossRef]
  20. Jiao, J.P.; He, C.F.; Wu, B.; Fei, R.Y. A new acoustic emission localization technique for pipeline leakage based on guided wave theory. J. Mech. Eng. 2004, 40, 77–81. (In Chinese) [Google Scholar] [CrossRef]
  21. Hao, Y.M.; Xing, Z.X.; Shao, H.; Wang, K.Q.; Wang, X.J. Experimental study on acoustic emission source localization for pressure pipeline leakage. J. Saf. Sci. Technol. 2011, 7, 140–144. (In Chinese) [Google Scholar]
  22. Ozevin, D.; Harding, J. Novel leak localization in pressurized pipeline networks using acoustic emission and geometric connectivity. Int. J. Press. Vessel. Pip. 2012, 92, 63–69. [Google Scholar] [CrossRef]
  23. Li, Z.L.; Zhang, H.F.; Xia, G.H. Quantitative detection of gas internal leakage in valves based on acoustic emission theory. J. Vib. Shock 2013, 32, 77–81. (In Chinese) [Google Scholar]
  24. Kong, D.L.; Huo, Z.; Yang, Y.Q.; Hu, B.; Peng, Z.J. Application of acoustic emission technology in on-line monitoring of valve leakage. In Proceedings of the 15th Chinese Acoustic Emission Symposium, Beijing, China, 3 June 2016; pp. 138–144. (In Chinese). [Google Scholar]
  25. Quy, T.B.; Kim, J. Leak detection in a gas pipeline using spectral portrait of acoustic emission signals. Measurement 2020, 152, 107403. [Google Scholar] [CrossRef]
  26. Ullah, N.; Ahmed, Z.; Kim, J. Pipeline leakage detection using acoustic emission and machine learning algorithms. Sensors 2023, 23, 3226. [Google Scholar] [CrossRef]
  27. Cui, J.; Zhang, M.; Qu, X.; Zhang, J.; Chen, L. An improved identification method of pipeline leak using acoustic emission signal. J. Mar. Sci. Eng. 2024, 12, 625. [Google Scholar] [CrossRef]
  28. Saleem, F.; Ahmad, Z.; Siddique, M.F.; Umar, M.; Kim, J.-M. Acoustic emission-based pipeline leak detection and size identification using a customized one-dimensional DenseNet. Sensors 2025, 25, 1112. [Google Scholar] [CrossRef] [PubMed]
  29. Zou, Y.; Liu, H. TDOA localization with unknown signal propagation speed and sensor position errors. IEEE Commun. Lett. 2020, 24, 1024–1027. [Google Scholar] [CrossRef]
  30. Teja, K.; Tiwari, R.; Mohanty, S. Adaptive denoising of ECG using EMD, EEMD and CEEMDAN signal processing techniques. J. Phys. Conf. Ser. 2020, 1706, 012077. [Google Scholar] [CrossRef]
  31. Bennia, F.; Moussaoui, S.; Boutalbi, M.C.; Messaoudi, N. Comparative study between EMD, EEMD, and CEEMDAN based on de-noising bioelectric signals. In Proceedings of the 2024 8th International Conference on Image and Signal Processing and Their Applications (ISPA), Biskra, Algeria, 21–22 April 2024; pp. 1–6. [Google Scholar]
  32. Cui, X.W. Research on Leakage Detection and Localization of CO2 Transportation and Storage Equipment Based on Acoustic Emission. Ph.D. Thesis, North China Electric Power University (Beijing), Beijing, China, 2017. (In Chinese). [Google Scholar]
Figure 1. Different types of pipeline robots.
Applsci 15 10501 g001
Figure 2. Schematic diagram of the distributed optical fiber detection principle [12].
Applsci 15 10501 g002
Figure 3. Flowchart of the acoustic emission positioning method.
Applsci 15 10501 g003
Figure 4. Schematic diagram of the acoustic emission positioning principle.
Applsci 15 10501 g004
Figure 5. Test Pipeline with a Leak Port.
Applsci 15 10501 g005
Figure 6. Acoustic Emission Signal Collector. (a) DS9-2W Portable Remote Alarm Acoustic Emission Monitor (Beijing Softland Times Technology Co., Ltd., Beijing, China); (b) RS-2A Sensor; (c) Preamplifier (Beijing Softland Times Technology Co., Ltd., Beijing, China); (d) Interface of DS9 Acoustic Emission Software.
Applsci 15 10501 g006
Figure 7. Time-domain signal diagram of the pipeline without leakage.
Applsci 15 10501 g007
Figure 8. Time-domain signal diagrams of broken lead collected by two sensors on Carbon Steel.
Applsci 15 10501 g008
Figure 9. IMF components obtained by CEEMDAN decomposition in air pipeline leakage experiment.
Applsci 15 10501 g009
Figure 10. Comparison between the original signal and the denoised signal.
Applsci 15 10501 g010
Figure 11. Calculation of time difference using different types of generalized cross-correlation methods in air pipeline leakage experiment.
Applsci 15 10501 g011
Figure 12. CO2 Pipeline.
Applsci 15 10501 g012
Figure 13. Schematic diagram of the layout of sensors on both sides of the leak point.
Applsci 15 10501 g013
Figure 14. Physical diagram of the layout of sensors on both sides of the leak point.
Applsci 15 10501 g014
Figure 15. Leak signal acquisition. (a) Signal collected by Sensor 1; (b) Signal collected by Sensor 2.
Applsci 15 10501 g015
Figure 16. IMF components obtained by CEEMDAN decomposition in gaseous CO2 pipeline leakage experiment.
Applsci 15 10501 g016
Figure 17. Comparison diagram before and after signal denoising.
Applsci 15 10501 g017
Figure 18. Calculation of time difference using different types of generalized cross-correlation methods in gaseous CO2 pipeline leakage experiment.
Applsci 15 10501 g018
Figure 19. Attenuation curves of signals with different frequencies [32].
Applsci 15 10501 g019
Table 1. Comparison of Advantages and Disadvantages of Different Detection Methods.
No.Detection MethodAdvantagesDisadvantages
1Infrared Imaging MethodWide detection range, relatively high accuracyUnable to detect buried pipelines. High cost for long-term use of low-altitude aircraft.
2Equipment Wall Detection MethodTheoretically has very high detection accuracy and can even give early warnings before a leak occursRelatively expensive. Prone to blockage accidents at bends, vertical sections, and pipe diameter changes.
3Distributed Optical Fiber MethodCan achieve all-round real-time detectionHigh equipment cost, high maintenance cost, and large construction volume.
4Negative Pressure Wave Detection MethodRelatively accurate positioning, low costProne to false alarms. Unable to detect leaks that have already occurred.
5Acoustic Emission Detection MethodWide application range, high reliability, moderate priceDifficult signal analysis, vulnerable to noise interference. The propagation of acoustic waves strongly depends on the length and characteristics of the path they travel.
Table 2. Cross-correlation coefficients between each order of IMFs of the leak signal and the original signal.
Characteristic ComponentIMF1IMF2IMF3IMF4IMF5IMF6IMF7IMF8IMF9IMF10
Cross-correlation Coefficient0.9930.1190.1170.0620.0170.0020.0050.0010.0010.001
Table 3. Evaluation of the denoising effect of air pipeline leak signals.
Denoising MethodSource of Acoustic Emission SignalSNRRMSE
EEMDSensor 115.840.01173
EEMDSensor 218.450.01592
CEEMDANSensor 118.460.01311
CEEMDANSensor 221.160.01165
Table 4. Positioning Results under Different Positioning Methods.
Positioning MethodTime Difference (ms)Distance Difference (m)Absolute Error (m)Sensor Spacing (m)Relative Error (%)
Cross-correlation Positioning0.0260.0870.08718.7
Roth Weighting0.0180.0600.06016.0
PHAT Weighting0.0220.0740.07417.4
ML Weighting0.0240.0810.08118.1
SCOT Weighting0.0240.0810.08118.1
Table 5. Cross-correlation coefficients between each order of IMF of the pipeline leak signal and the original signal.
Characteristic ComponentIMF1IMF2IMF3IMF4IMF5IMF6IMF7IMF8IMF9IMF
10
Cross-correlation Coefficient0.72740.66390.27580.07550.01670.00450.00010.00030.00060.0005
Table 6. Evaluation results of the denoising effect of the pipeline leak signal.
Denoising MethodAcoustic Emission SignalSNRRMSE
CEEMDANSensor 118.070.00221
CEEMDANSensor 215.050.00297
Table 7. Location results under different location methods.
Location MethodTime Difference (ms)Distance Difference (m)Absolute Error (m)Sensor Spacing (m)Relative Error (%)
Cross-correlation Location0.0260.0870.0370.3510.6
Roth Weighting0.0220.0740.0240.356.9
PHAT Weighting0.0220.0740.0240.356.9
ML Weighting0.0240.0810.0310.358.6
SCOT Weighting0.0240.0810.0310.358.6
Table 8. Maximum Detection Distances Achievable by Combinations of Some Common Sensors and Amplifiers.
Sensor Center FrequencyPre-Amplifier GainTheoretical Maximum Detection DistanceApplication Scope
30 kHz40 dBApproximately 30–70 mSuitable for short-distance and high-precision leakage monitoring within the station yard or laboratory research.
20 kHz60 dBApproximately 100–150 mSuitable for high-consequence areas. Install sensors at ≤150 m intervals. Low-frequency operation requires robust noise reduction algorithms due to susceptibility to interference.
Disclaimer/Publisher’s Note: The statements, opinions and data contained in all publications are solely those of the individual author(s) and contributor(s) and not of MDPI and/or the editor(s). MDPI and/or the editor(s) disclaim responsibility for any injury to people or property resulting from any ideas, methods, instructions or products referred to in the content.