Article

Identification of Rubber Belt Damages Using Machine Learning Algorithms

1
Faculty of Mechanical Engineering, Casimir Pulaski Radom University, Stasieckiego 54-B1, 26-600 Radom, Poland
2
Institute of Mechanical Science, Vilnius Gediminas Technical University, Sauletekio al. 11, LT-10223 Vilnius, Lithuania
*
Author to whom correspondence should be addressed.
Appl. Sci. 2025, 15(19), 10449; https://doi.org/10.3390/app151910449
Submission received: 29 August 2025 / Revised: 23 September 2025 / Accepted: 25 September 2025 / Published: 26 September 2025
(This article belongs to the Special Issue AI-Based Machinery Health Monitoring)

Abstract

This paper presents the experimental results of a Machine Learning application for the health monitoring of a conveyor belt. The real-time analysis of the rubber belt condition is a crucial issue in achieving safety and avoiding critical failures and related expenses. The measuring system based on strain gauges was applied to identify the actual state of the belt. Using the Classification Lerner application from MATLAB platform, 22 algorithms were tested, and using the Diagnostic Feature Designer application, the analysis was performed. Three tested ML algorithms were able to classify the states of the conveyor belt with preset damages correctly, exhibiting 100% prediction accuracy. The k-nearest neighbors (KNN) classifiers and neural networks failed to achieve that level of accuracy.

1. Introduction

Artificial Intelligence (AI) and machine learning (ML) concepts are finding increasing applications in industry [1]. In conveyors, the belt is the most important, constantly moving element exposed to damages that usually cause costly downtimes, even though the belt itself is not an expensive component [2,3]. Prediction of belt degradation under harsh working loads is very important for preventing costly failures. In this context, using various devices to collect the information about the actual state of the belt [4,5,6,7], many attempts have been made to apply Machine Learning algorithms for data processing and early damage detection.
For instance, machine learning models based on artificial neural networks (ANNs) pre-trained on historical failure data collected from mining enterprises were demonstrated to be able to predict belt degradation and help optimize maintenance schedules [8]. It was also demonstrated that it was possible to identify certain correlations between the damages in rubber–textile conveyor belts and some parameters of new and renovated belts [9]. The authors demonstrated experimentally that classification models, such as decision trees, logistic regression, regression analysis, and the Naïve Bayes classifier were able to assign the specimens to the degree of damage, significant or insignificant one. Cunckel et al. [10] proposed a methodology how to build a failure forecasting systems, and applied it to the working mining conveyor belt. The authors demonstrated successful integration between a Distributed Control System (DCS), an operational logbook, a Digital Twin, and principal component analysis (PCA).
Non-destructive testing (NDT) methods based on machine learning are becoming increasingly popular. Guo and co-authors [11] applied a modified generative adversarial network (GAN) for damage detection on the belt surface. Similarly, Komorska with team [12] applied a hybrid data augmentation method using GANs to combine generative artificial intelligence (AI) techniques with signal analysis, using the TimeGAN model to augment data from the belts that were working without damages. Yuan and collaborators [13] improved the Faster Region-Convolutional Neural Network (R-CNN) algorithm and demonstrated its effectiveness in identification of the scratches and ruptures of the conveyor belt. Rzeszowska with co-authors [14] published results on a neural network-based classification study concerning the conveyor belt damage. Using partial DiagBelt data and optimizing a two-layer neural network, the authors obtained a high level of efficiency, reaching 80–90% of accuracy. Liu and co-authors [15] developed YOLO-STOD method utilizing the BotNet mechanism able to extract multi-dimensional features of tears even in the cases of small targets achieving 91.9% of detection accuracy. Hu et al. [16] proposed a model for visual detection of the conveyor belt damage, improving the available deep neural network YOLOv5. The model with the application of Improved Depth-Separable Convolution (IDSC) and Scale Sequence Feature Fusion (SSFF) methods was demonstrated to achieve high mean average precision of 95.65%. The application of a knowledge distillation approach with the introduction of a GhostConv feature extraction and linear transformations allowed for significant reduction in model parameters, which, when used with an additional Damage Shape Convolutional (DSC) module, enabled the developed network to achieve an average precision of AP = 98.9% [17]. Chen with colleagues [18] successfully integrated multispectral data acquisition and deep learning methods, developing a DBAF-YOLO11n model for accurate detection of surface damage of a conveyor belt. Pulcini and Modoni [19] used a predictive maintenance approach and proposed a digital twin (DT) in order to predict failures during the belt operations. The proposed model analyzed data from various sensors, including a piezoelectric microphone, accelerometers, photocell, and current probes. When the data is collected continually, it can be useful for the prediction of failure and remaining service time [20], while from the collected and archived data records, critical failures can be predicted and potential countermeasures can be proposed [21]. Numerous efforts and studies devoted to the monitoring of conveyor belts during their work indicate that the optimal solution has still not been found.
In the present study, the machine learning algorithms were tested for the contact method of conveyor belt tension monitoring based on the pressure sensor strip [22]. The work of a pre-damaged belt was simulated on the experimental rig, and the collected data was then analyzed using several machine learning algorithms. Moreover, the effect of the belt speed on the registered signal patterns was examined in detail, considering the presence of different damages.

2. Materials and Methods

The experimental rig consisted of two pulleys and a belt with adjustable tension and movement speed. The strain gauges in the form of the pressure sensor strip RP-L-170 were delivered by DFRobot (Chengdu, China) and positioned on the tail pulley surface, as shown in Figure 1. The tail pulley was equipped with a 360° Mini Digital Protractor Inclinometer and an electronic unit with the printed circuit board (PCB).
To assess the uncertainty propagation, the calibration was performed in the dedicated laboratory at the Radwag company (Radom, Poland) using the patented calibration device [23]. The expanded uncertainty was estimated considering the level of confidence 99% for the strain gauges conductance as U0.99 = 0.75 [μS], with the maximal approximation error below 8% [24]. Runout of the rollers bearings was not larger than ±0.04 mm, which was found negligible, since the repeatability of the entire system was EV = 1.25 N or in percentage EV% = 9.5% [25]. This value covered all the variations in the results registered in repeatable conditions defined by [26], including effects of all units of the entire measurement system and the test rig with both mechanical components and electronic units.
The belt used in the research was made out of material EDV08PB-AS 2.0, fabricated by Enitra Sp. z o.o. (Wałbrzych, Poland). The belt material strength characteristics exhibited anisotropy, especially when the belt was damaged. For instance, when the transverse damages appeared in the sample, it withstood the breaking force of ca. 40% lower compared to the samples with the longitudinal damages [27].
The experimental rig used in the research provided a possibility to regulate the rotational speed of the driving pulley and thus to set the linear speed of the belt. The respective values of speed are shown in Table 1. The results in the form of indications from strain gauges in analog-to-digital units (ADUs) were then analyzed. A higher ADU value received from the strain gauge corresponded with smaller value of the pressure exerted on it. The flowchart in Figure 2 illustrates the process with input and output values, also indicating some of the most important influence factors.
In order to test the ability of the ML algorithms to identify the damages, five preset cuts were made in the belt. It was decided to make four of them in a longitudinal direction, because the transverse tears appear less commonly than longitudinal ones [28].
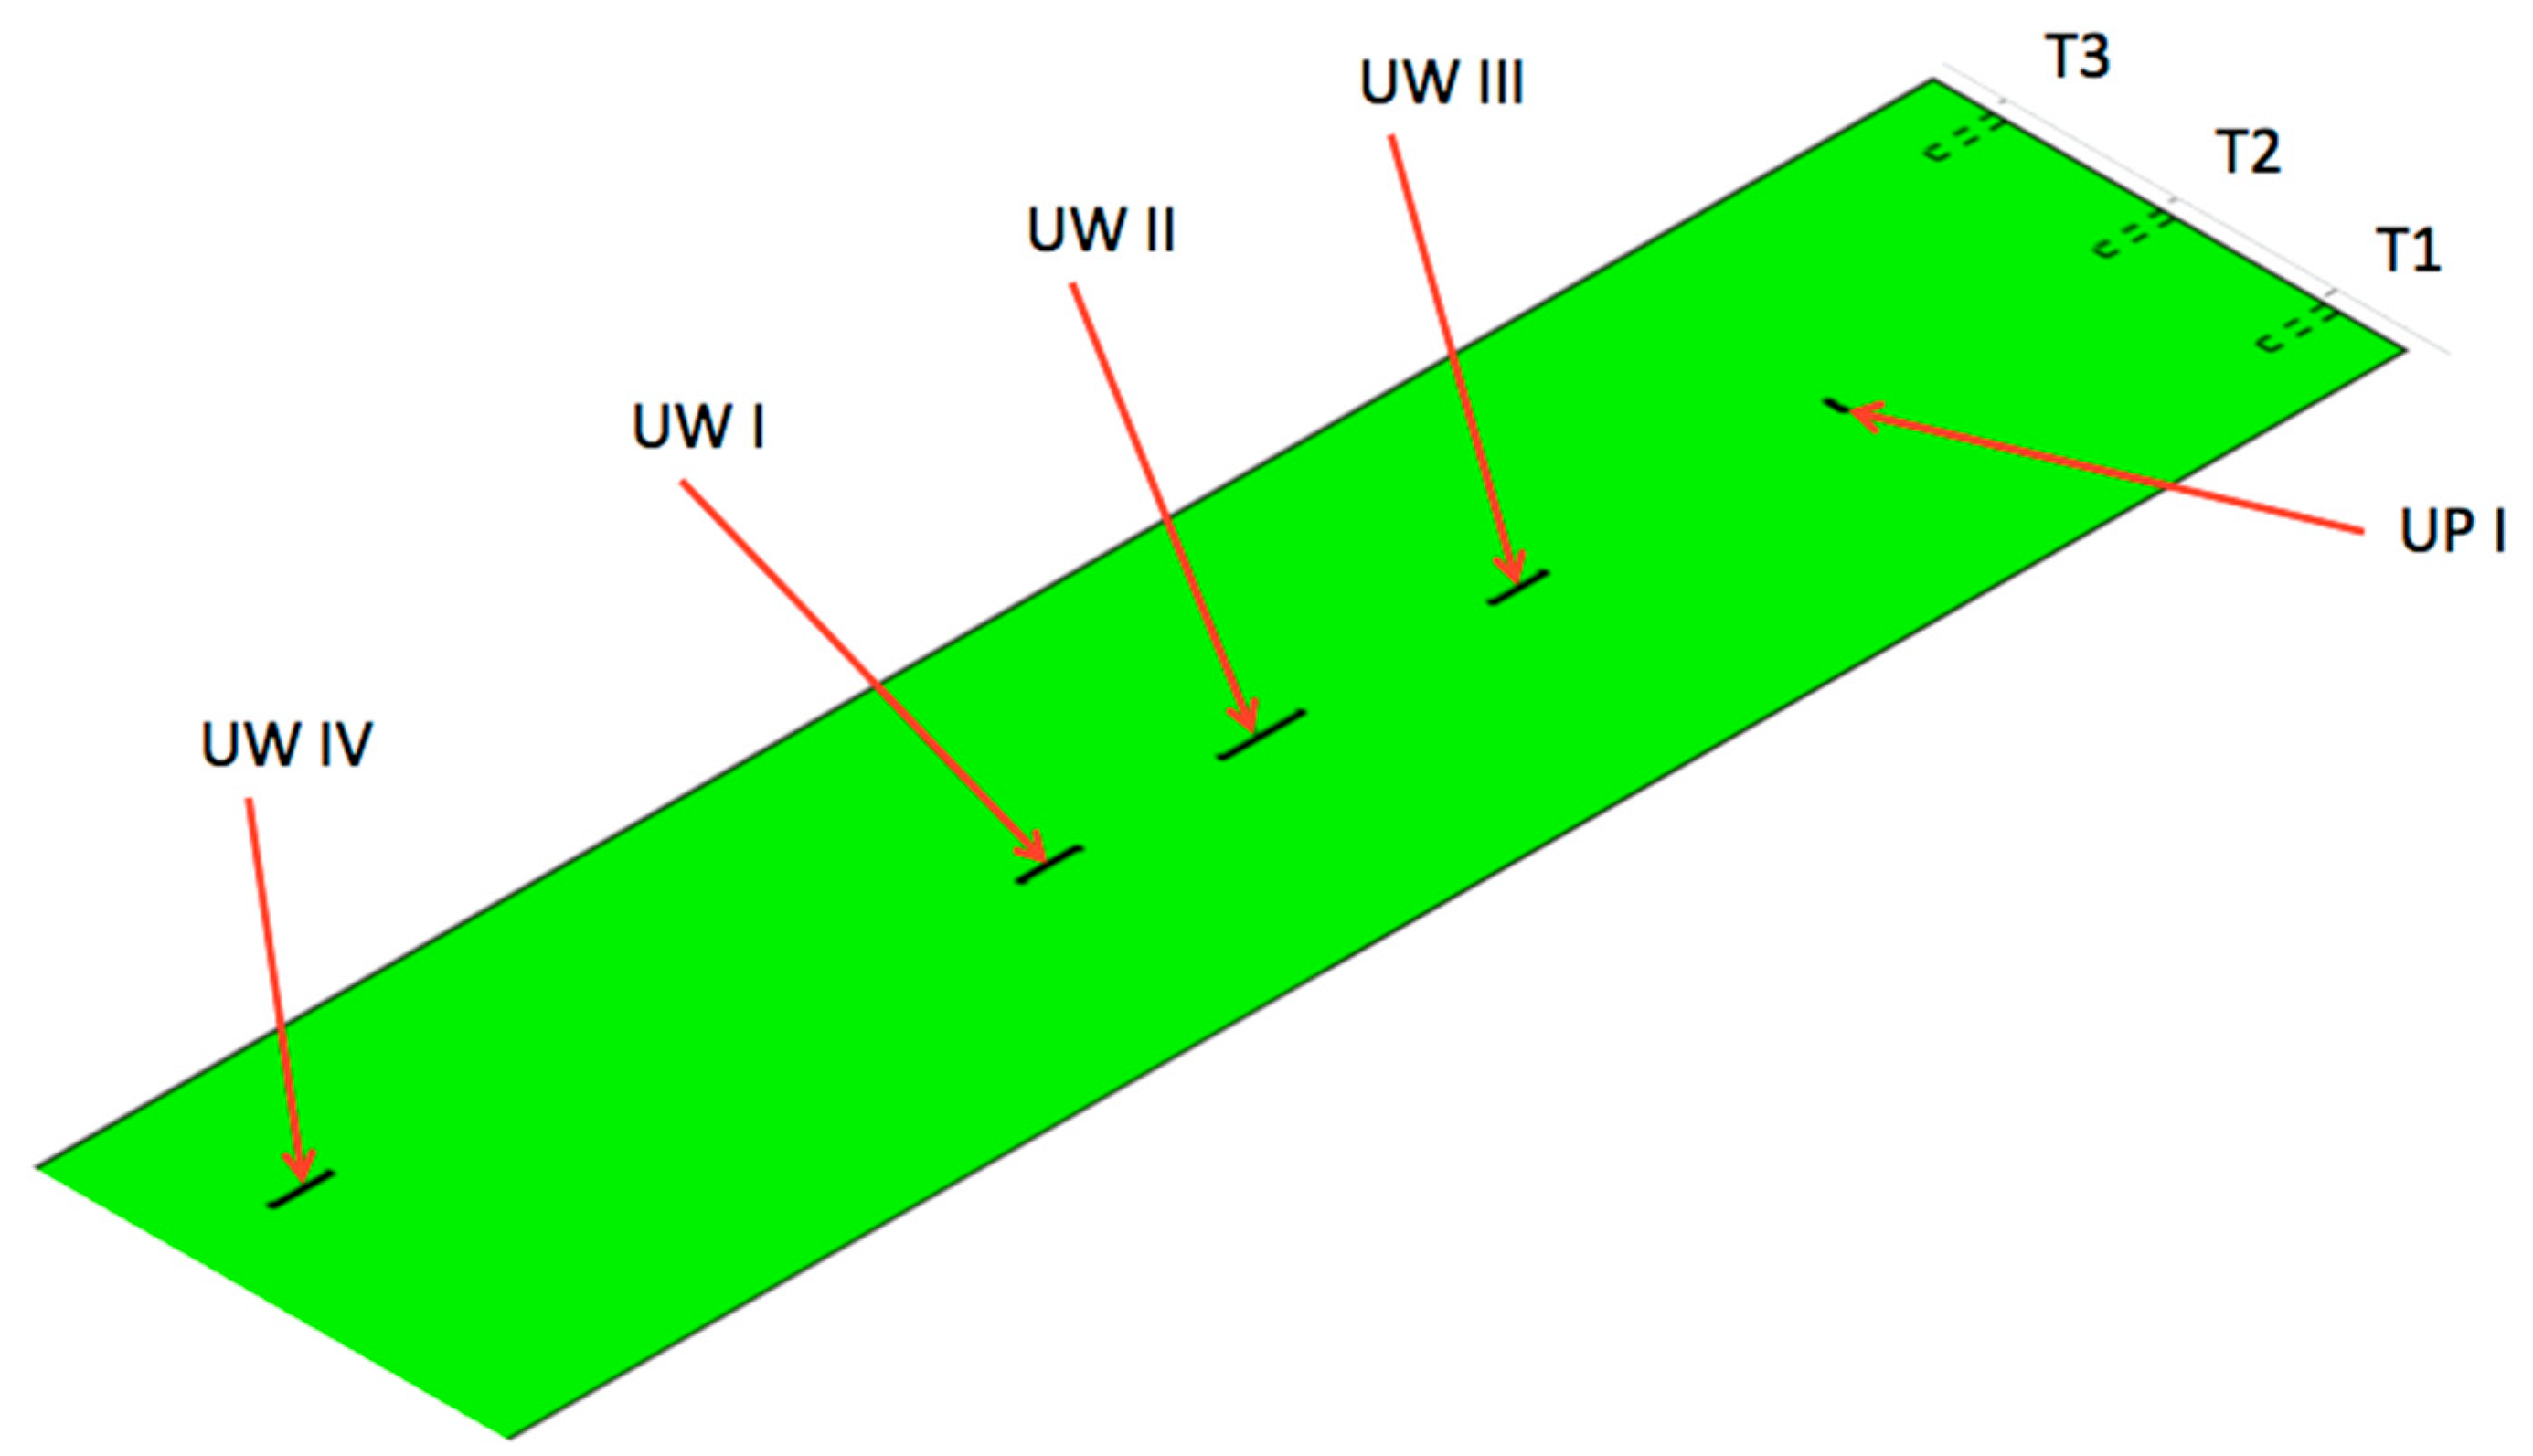
Moreover, to imitate some development of the damages, the first group of experiments was performed with three preset damages, and later two others were added and the tests were repeated. The description of the damages cut in two stages is presented in Table 2 and their positions on the belt are illustrated in Figure 3. Damages denoted UW II and UW III were positioned in the middle of the belt, directly against strain gauge T2.
Apparently, these damages are far from covering all types of damage and their mutual relations that may appear on a real-world conveyor belt working in industrial conditions, such as abrasion of the rubber cover, puncture and cutting of the rubber cover, cover adhesion loss, or cover breakage [2]. However, the preset damages were found to be sufficient for the initial validation of the machine learning (ML) algorithms.
The data obtained from the experiments was analyzed in terms of strain gauge indications corresponding with the damaged points, and then used to train the ML models from the perspective of monitoring of the damages in the conveyor belt. After calculation of the statistical parameters, the data were imported to MATLAB platform (R2024b) using the Classification Lerner application. In addition to the 10 algorithms previously reported [22], another 22 were tested, making up altogether 32 ML algorithms. For the cross-validation, a typical number of folds kv = 5 was chosen, according to the available published recommendations [29]. Then, using the Diagnostic Feature Designer application, the analysis was performed, considering 18 extracted features in order to specify which ones were the most discriminating for the ML algorithms. The model ANOVA (one-way analysis of variance) was chosen to perform this task [30].

3. Results and Discussion

The results are presented and discussed in the following sections, concerning the effect of the belt speed on the obtained monitoring signals, statistical analysis of the collected data, and tests of the ML algorithms.

3.1. Effect of the Speed

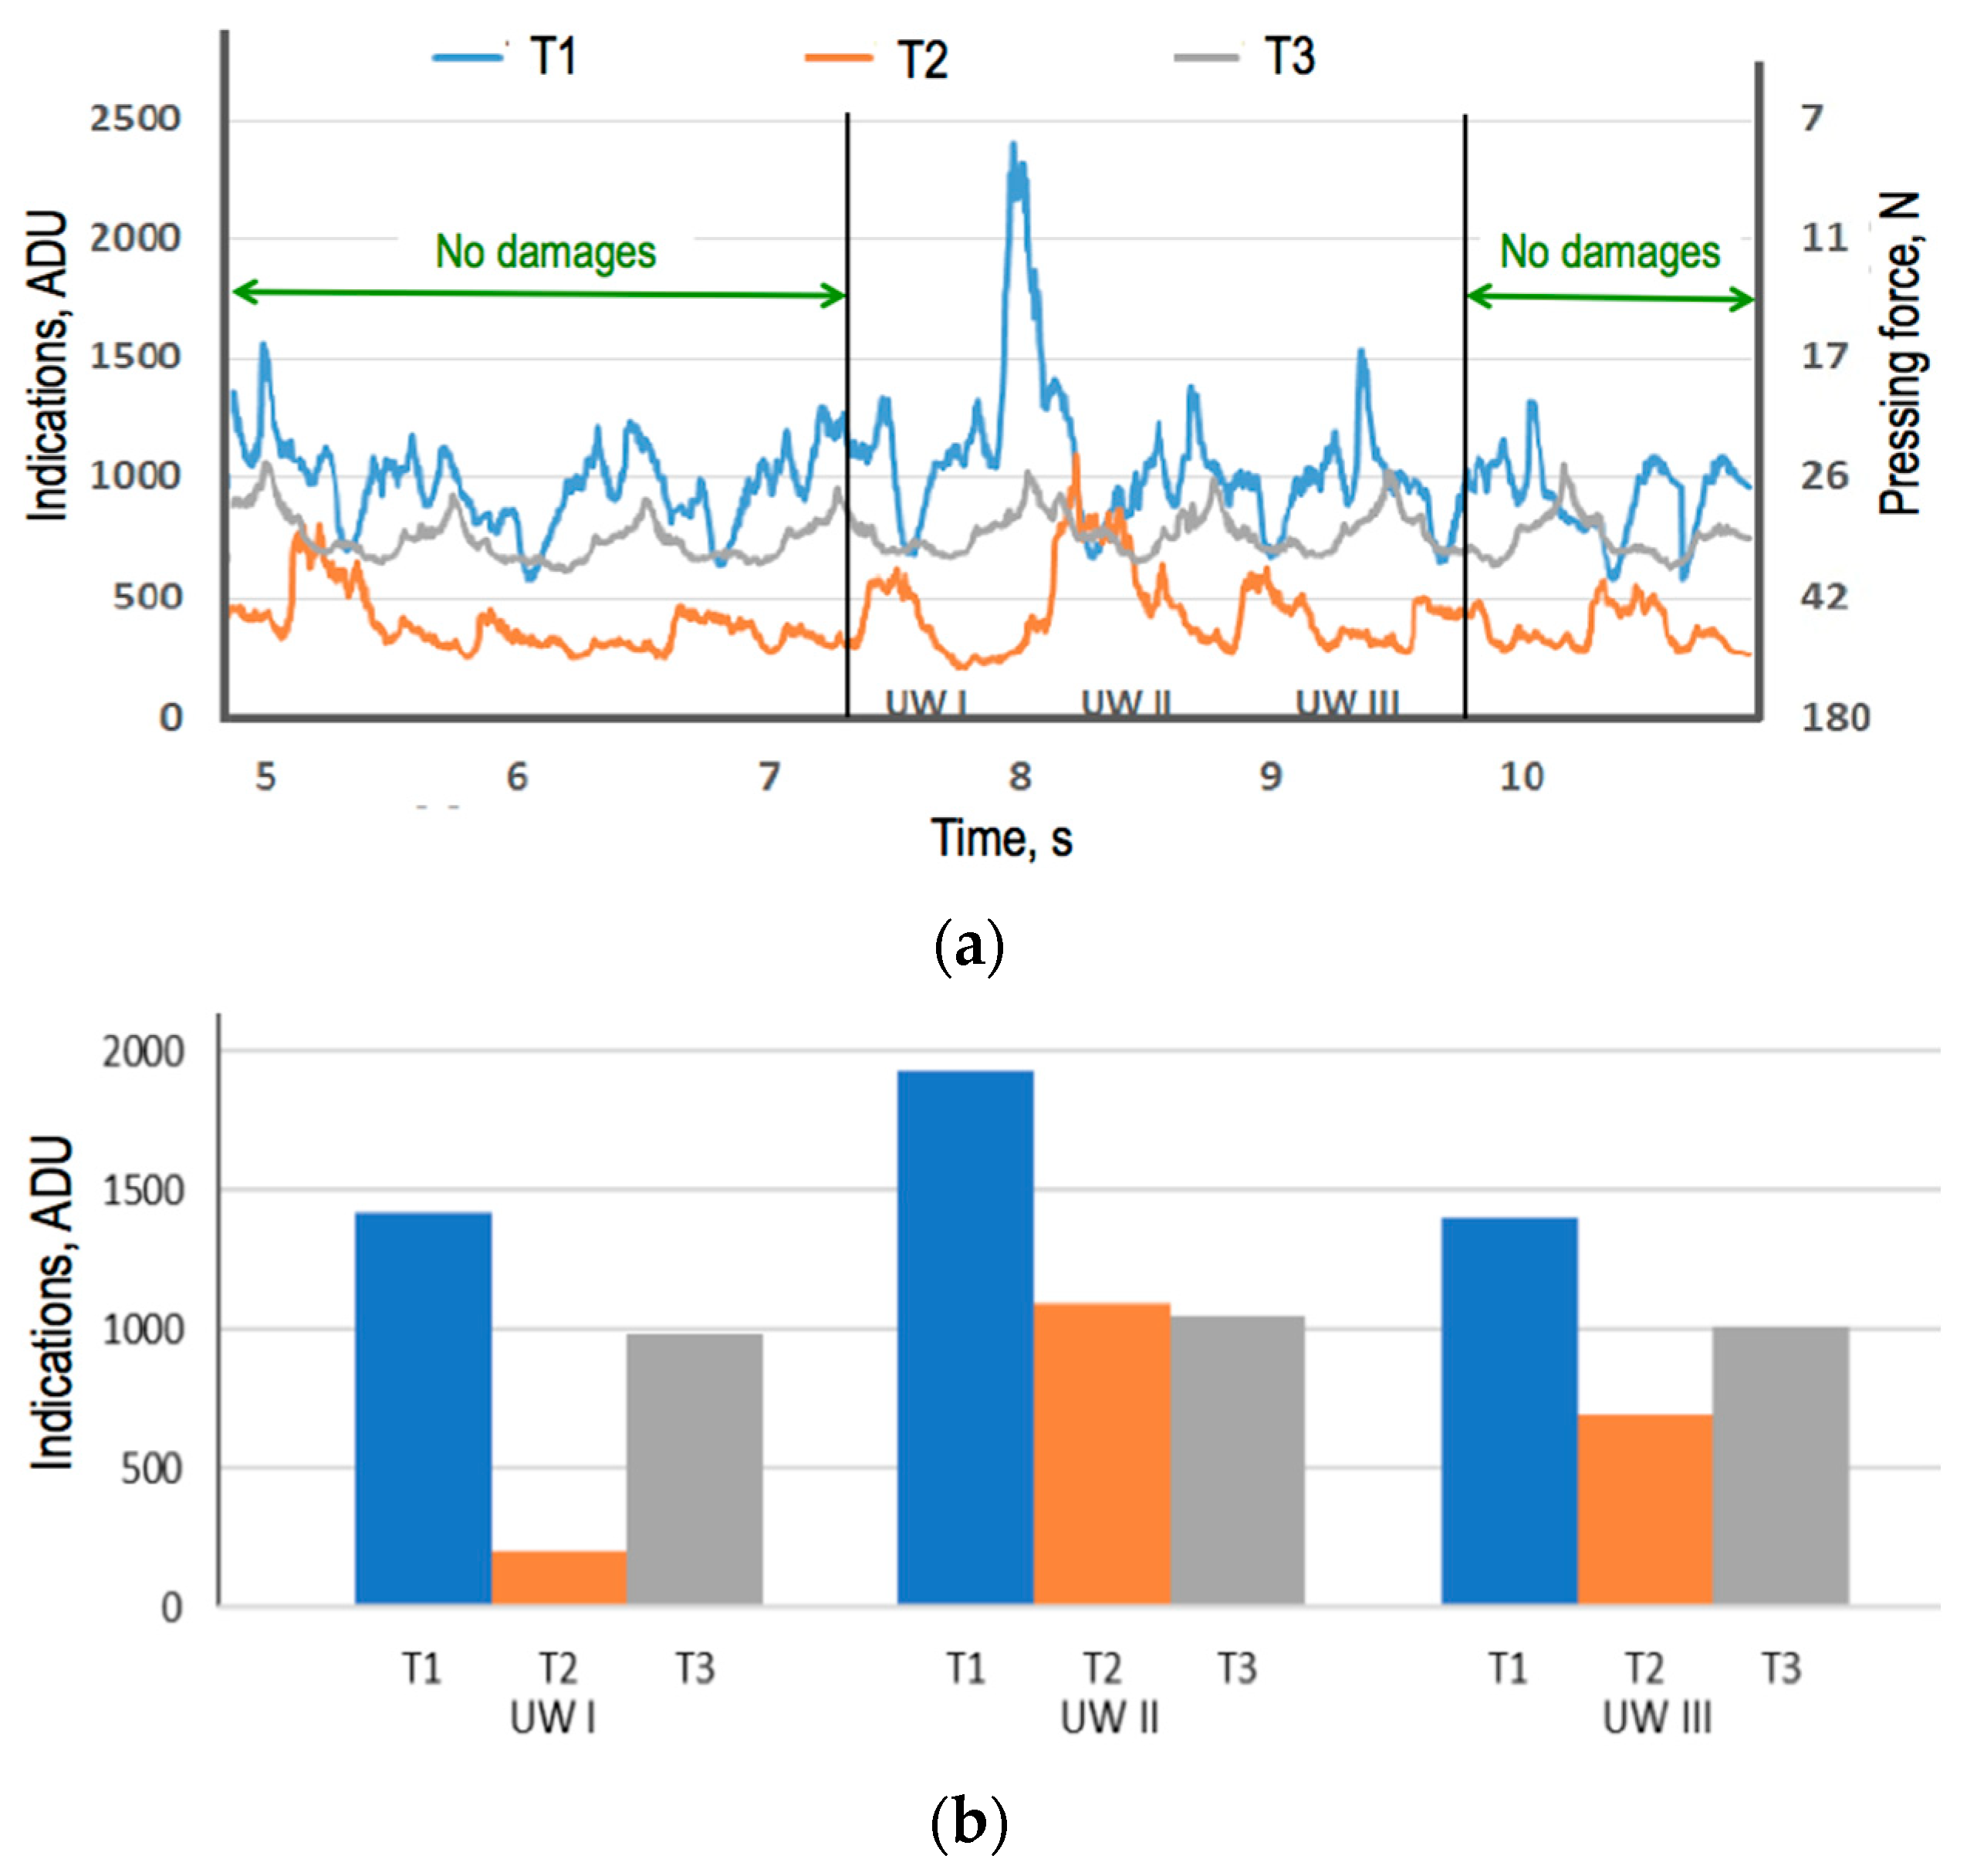
Dependent on the position of the damage, the combination of three signals from the three strain gauges formed some sort of pattern, allowing for damage identification. Figure 4 illustrates the registered real-time signals from T1, T2, and T3 and the respective combinations of values corresponding with the preset damages on the belt. Since the strain gauges are placed on the surface of the pulley, the presence of the damage is detected when the respective section of the belt is pressing directly on the pulley. After the full rotation of the pulley, the preset damage runs away from the pulley surface and thus its impact is not registered anymore.
Important features of the patterns shown in Figure 4b should be noted. All the three preset damages caused asymmetrical pressing forces on the pulley, but the largest difference between three strain gauges signals generated damage UW I. In that case, T2 indicated the lowest ADU signal corresponding with the highest pressing force. In turn, damage UW II generated almost similar indications T2 and T3 with almost two times higher indication of T1. The damage denoted UW III caused the same patter as UW I did, but with higher indication of T2.
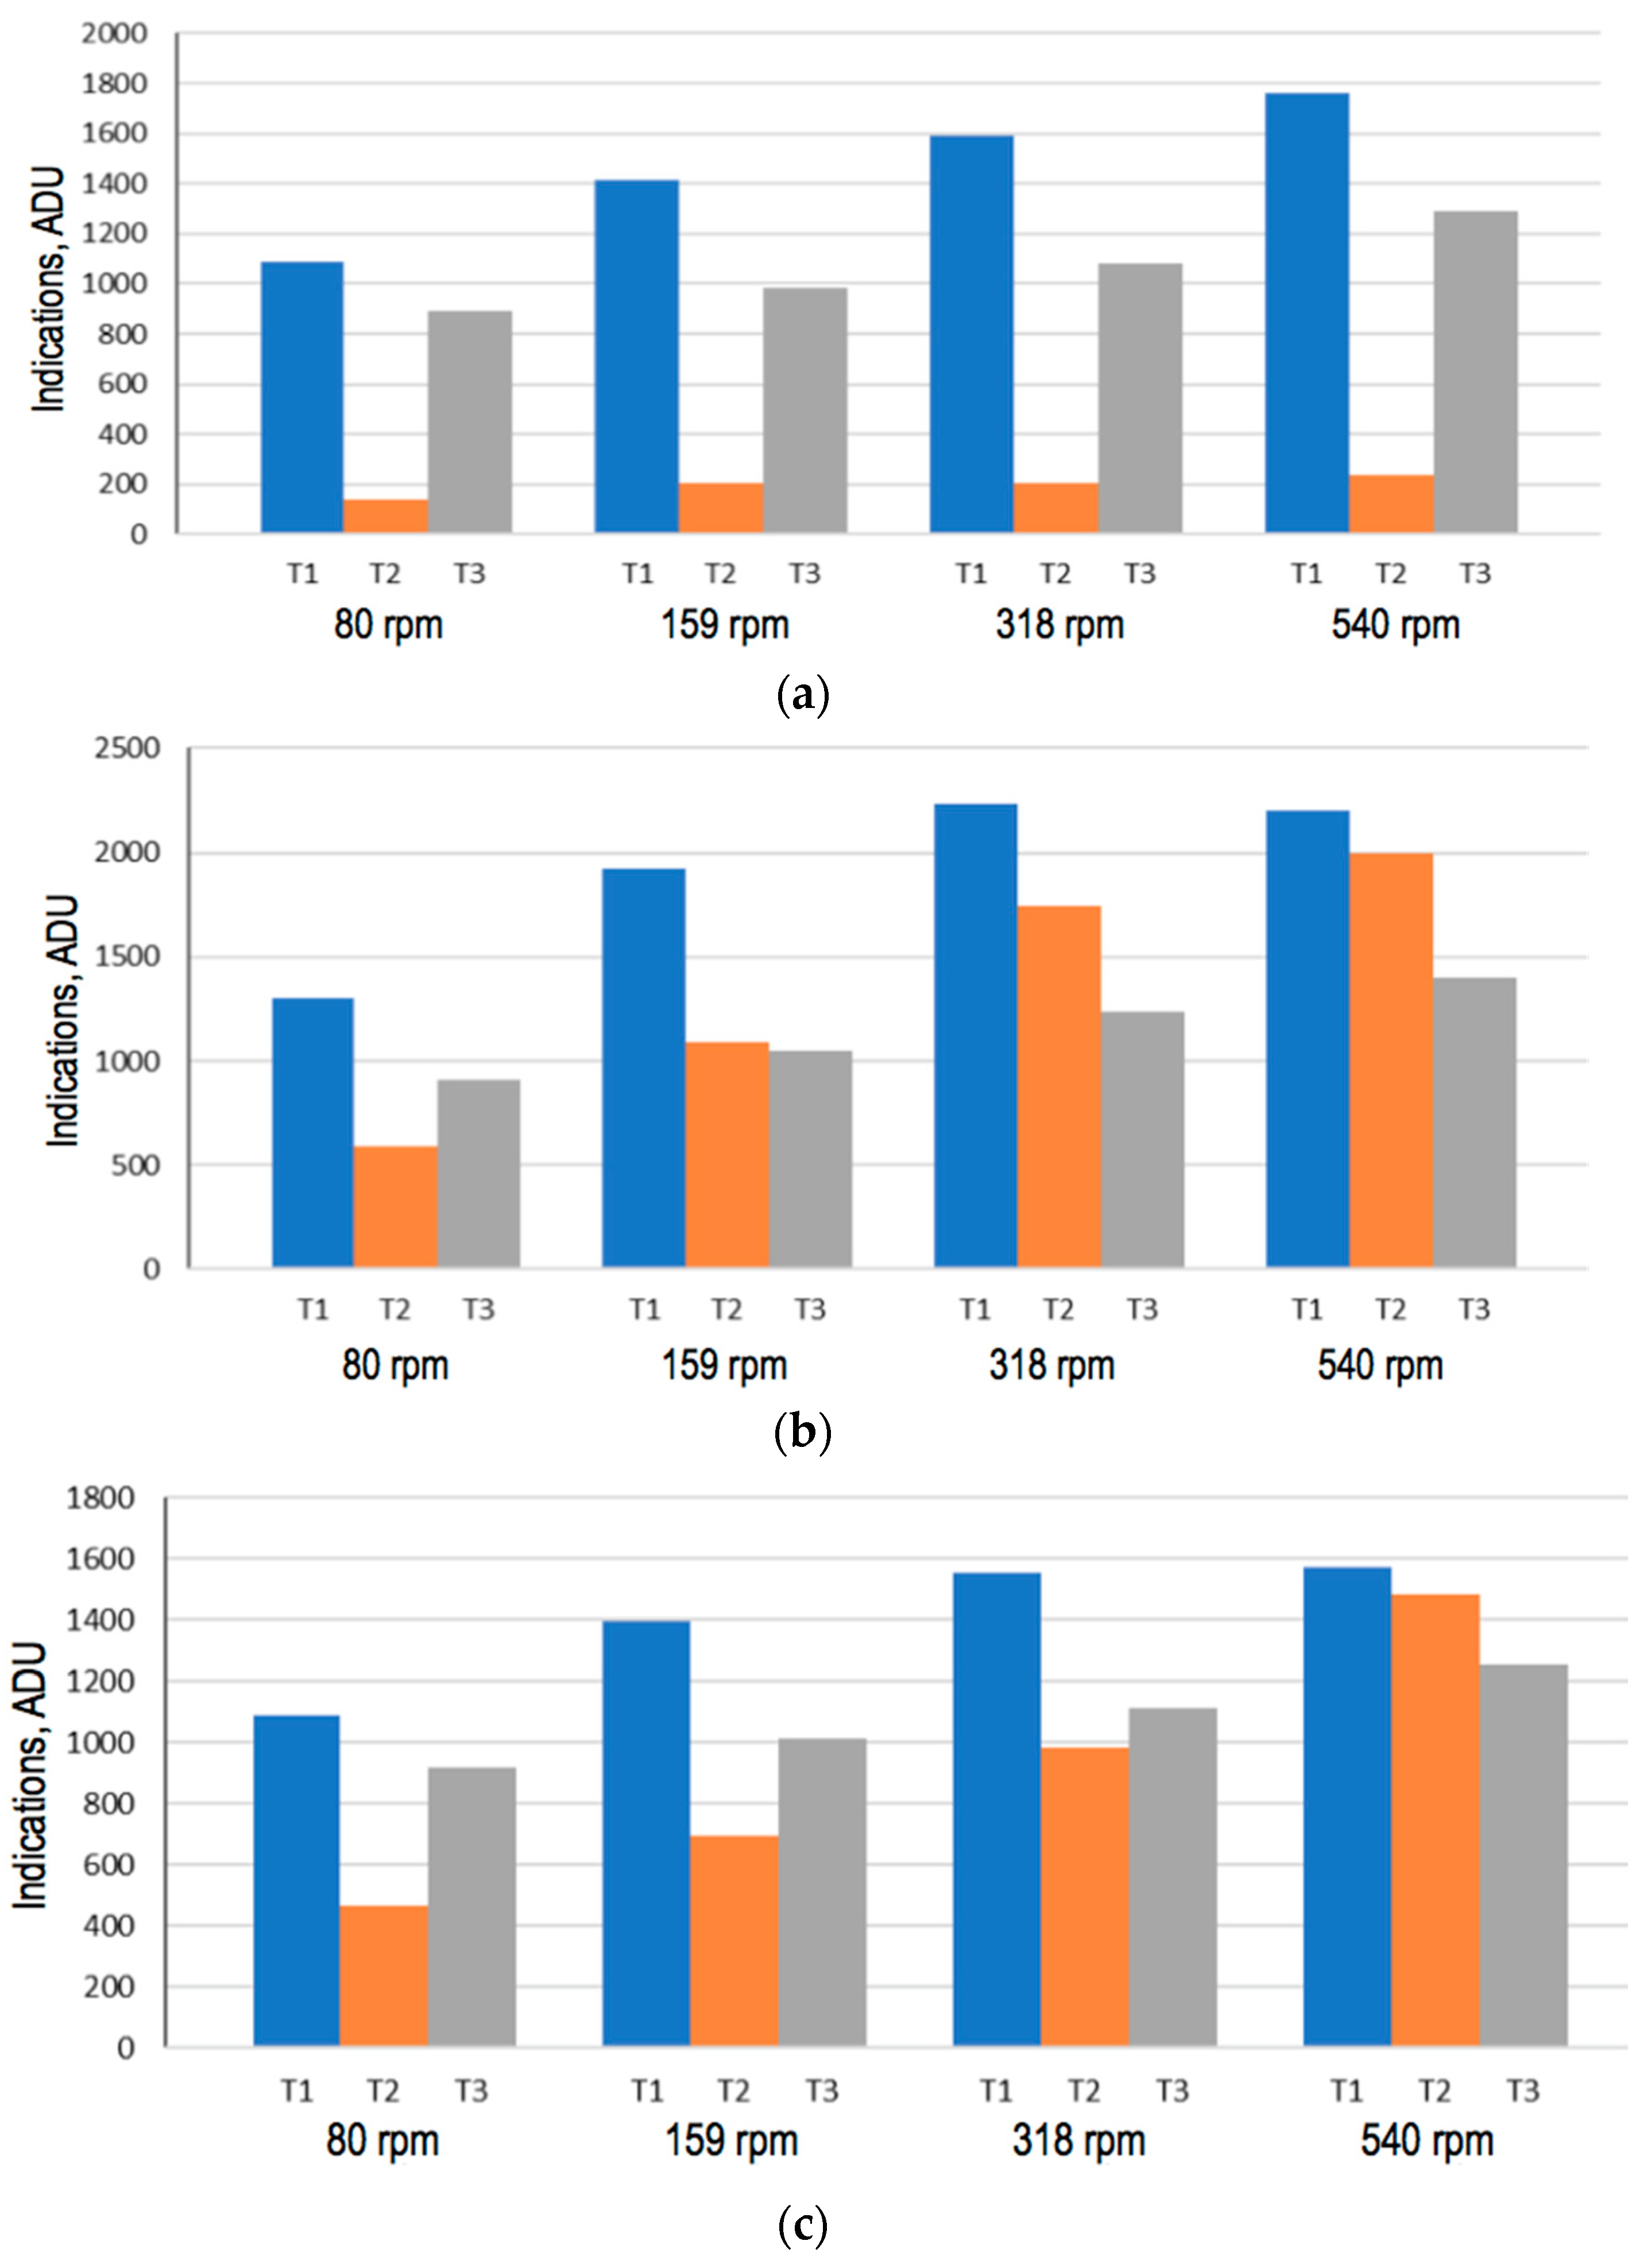
The pattern generated by damage UW I remained similar at all tested values of the belt speed, only the values of indications increased due to the reduces pressing forces at higher speeds. At the same time, UW II and UW III exhibited the lowest value of signal T2 at the slowest speed, and both tended to form pattern T1 > T2 > T3 as the speed increased. This can be seen in Figure 5.
Importantly, these patterns remained essentially the same after addition of two new damages, UW IV and UP I. The diagrams for the pulley rotational speeds 159 rpm and 540 rpm are presented in Figure 6.
In the present study, the effect of the belt speed on the signal pattern was found to be the most important parameter to be identified. However, we also plan on checking the signal patterns under the loads in order to analyze the ability of the system to recognize potential overload, especially in combination with actual belt speed.

3.2. Statistical Analysis

The main statistical parameters were calculated from the registered signal. The parameters for each strain gauge T1, T2, and T3 were analyzed for the undamaged belt, then for the one with three damages UW I, UW II, and UW III, and, after the addition of UP I and UW IV for the belt with five damages. The following statistical parameters were calculated:
  • Arithmetic mean x ¯ for each strain gauge was calculated from 20 repetitions;
  • Minimum and maximum values were pointed out;
  • Mean square values Xms were calculated for each strain gauge;
  • Standard deviations σ were considered;
  • Kurtosis Xkurt was discussed.
Full table with the data specifying each repetition results is attached in a Supplementary File, while in Table 3, only the average values are presented.
It is worth noting that kurtosis tended to increase after the damages were added. In particular, values Xkurt of the T2 signal turned from platykurtic to leptokurtic types, indicating the presence of long tails (outliers) and peaks. For the strain gauge T3, both kurtosis and standard deviation remained almost unchanged after three damages were added, and a slight increase was noted after the addition of two more damages. This effect took place due to the position of the strain gauge T3 far from longitudinal damages, and at the opposite side from the transversal damage UP I.
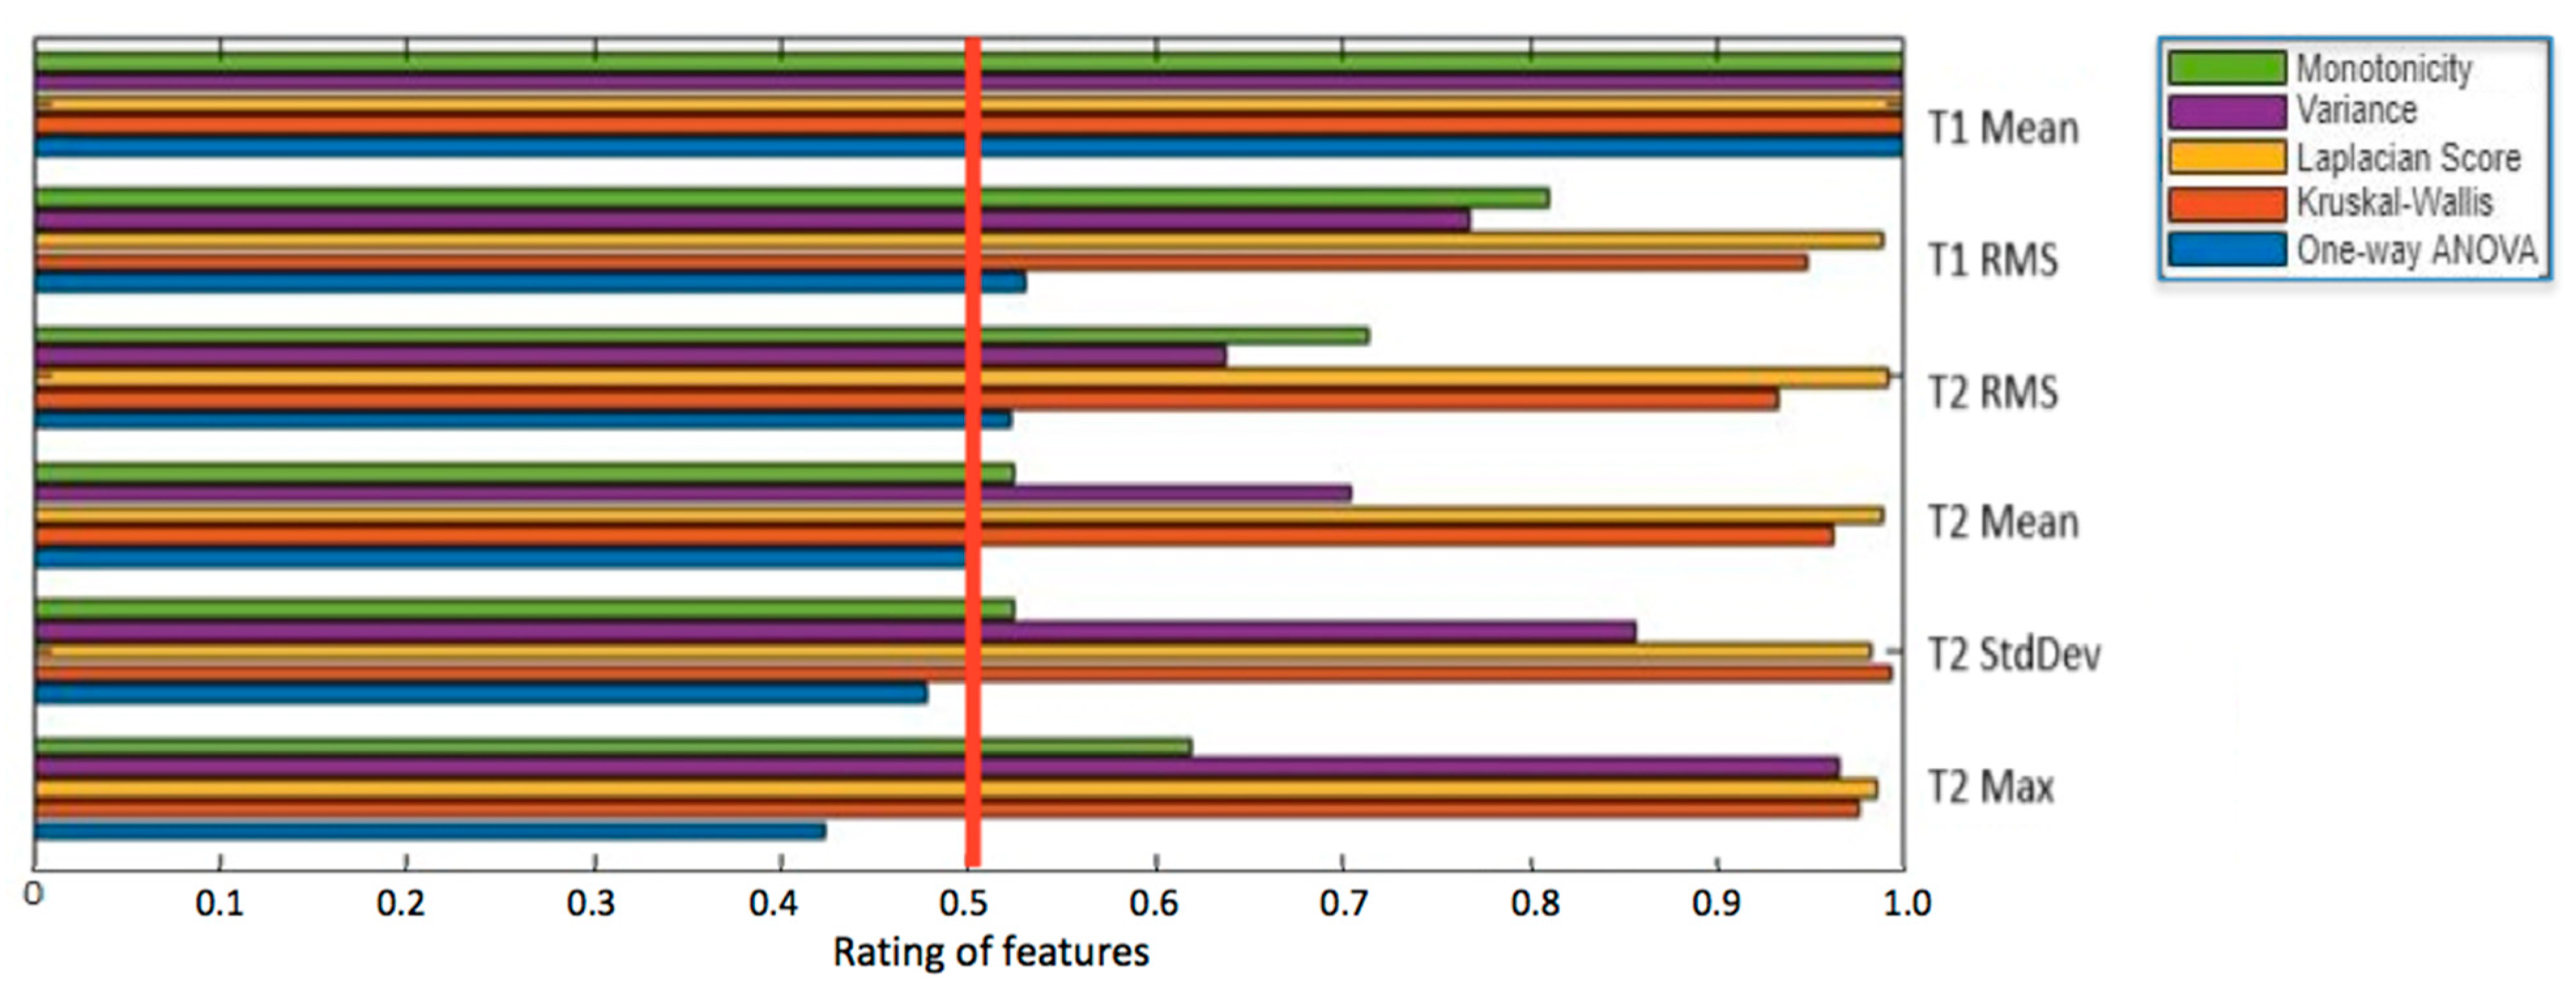
To keep consistence and comparability with the previously reported results [22], further analysis was performed with Diagnostic Feature Designer using the same five models, namely, Kruskal–Wallis, Variance, Laplacian Score, and Monotonicity tests, as well as one-way ANOVA. While different models indicated different significance of the tested features, the arithmetic mean of the T1 strain gauge signal was identified as the most significant one by all five models, as seen in Figure 7.
All the tested models indicated significance above 0.5 for the Root Mean Square of T1 and T2 signals, as well as for the arithmetic mean of the T2 strain gauge. Maximum T2 and the Standard Deviation T2 signal can be considered as less significant, since the one-way ANOVA model indicated values ca. 0.45. This model emphasized the impact of the single tested factor on the results and requires a normal distribution and variance homogeneity [31]. However, for all other tested features, two or more models indicated significance below 0.5.

3.3. Tests of ML Algorithms

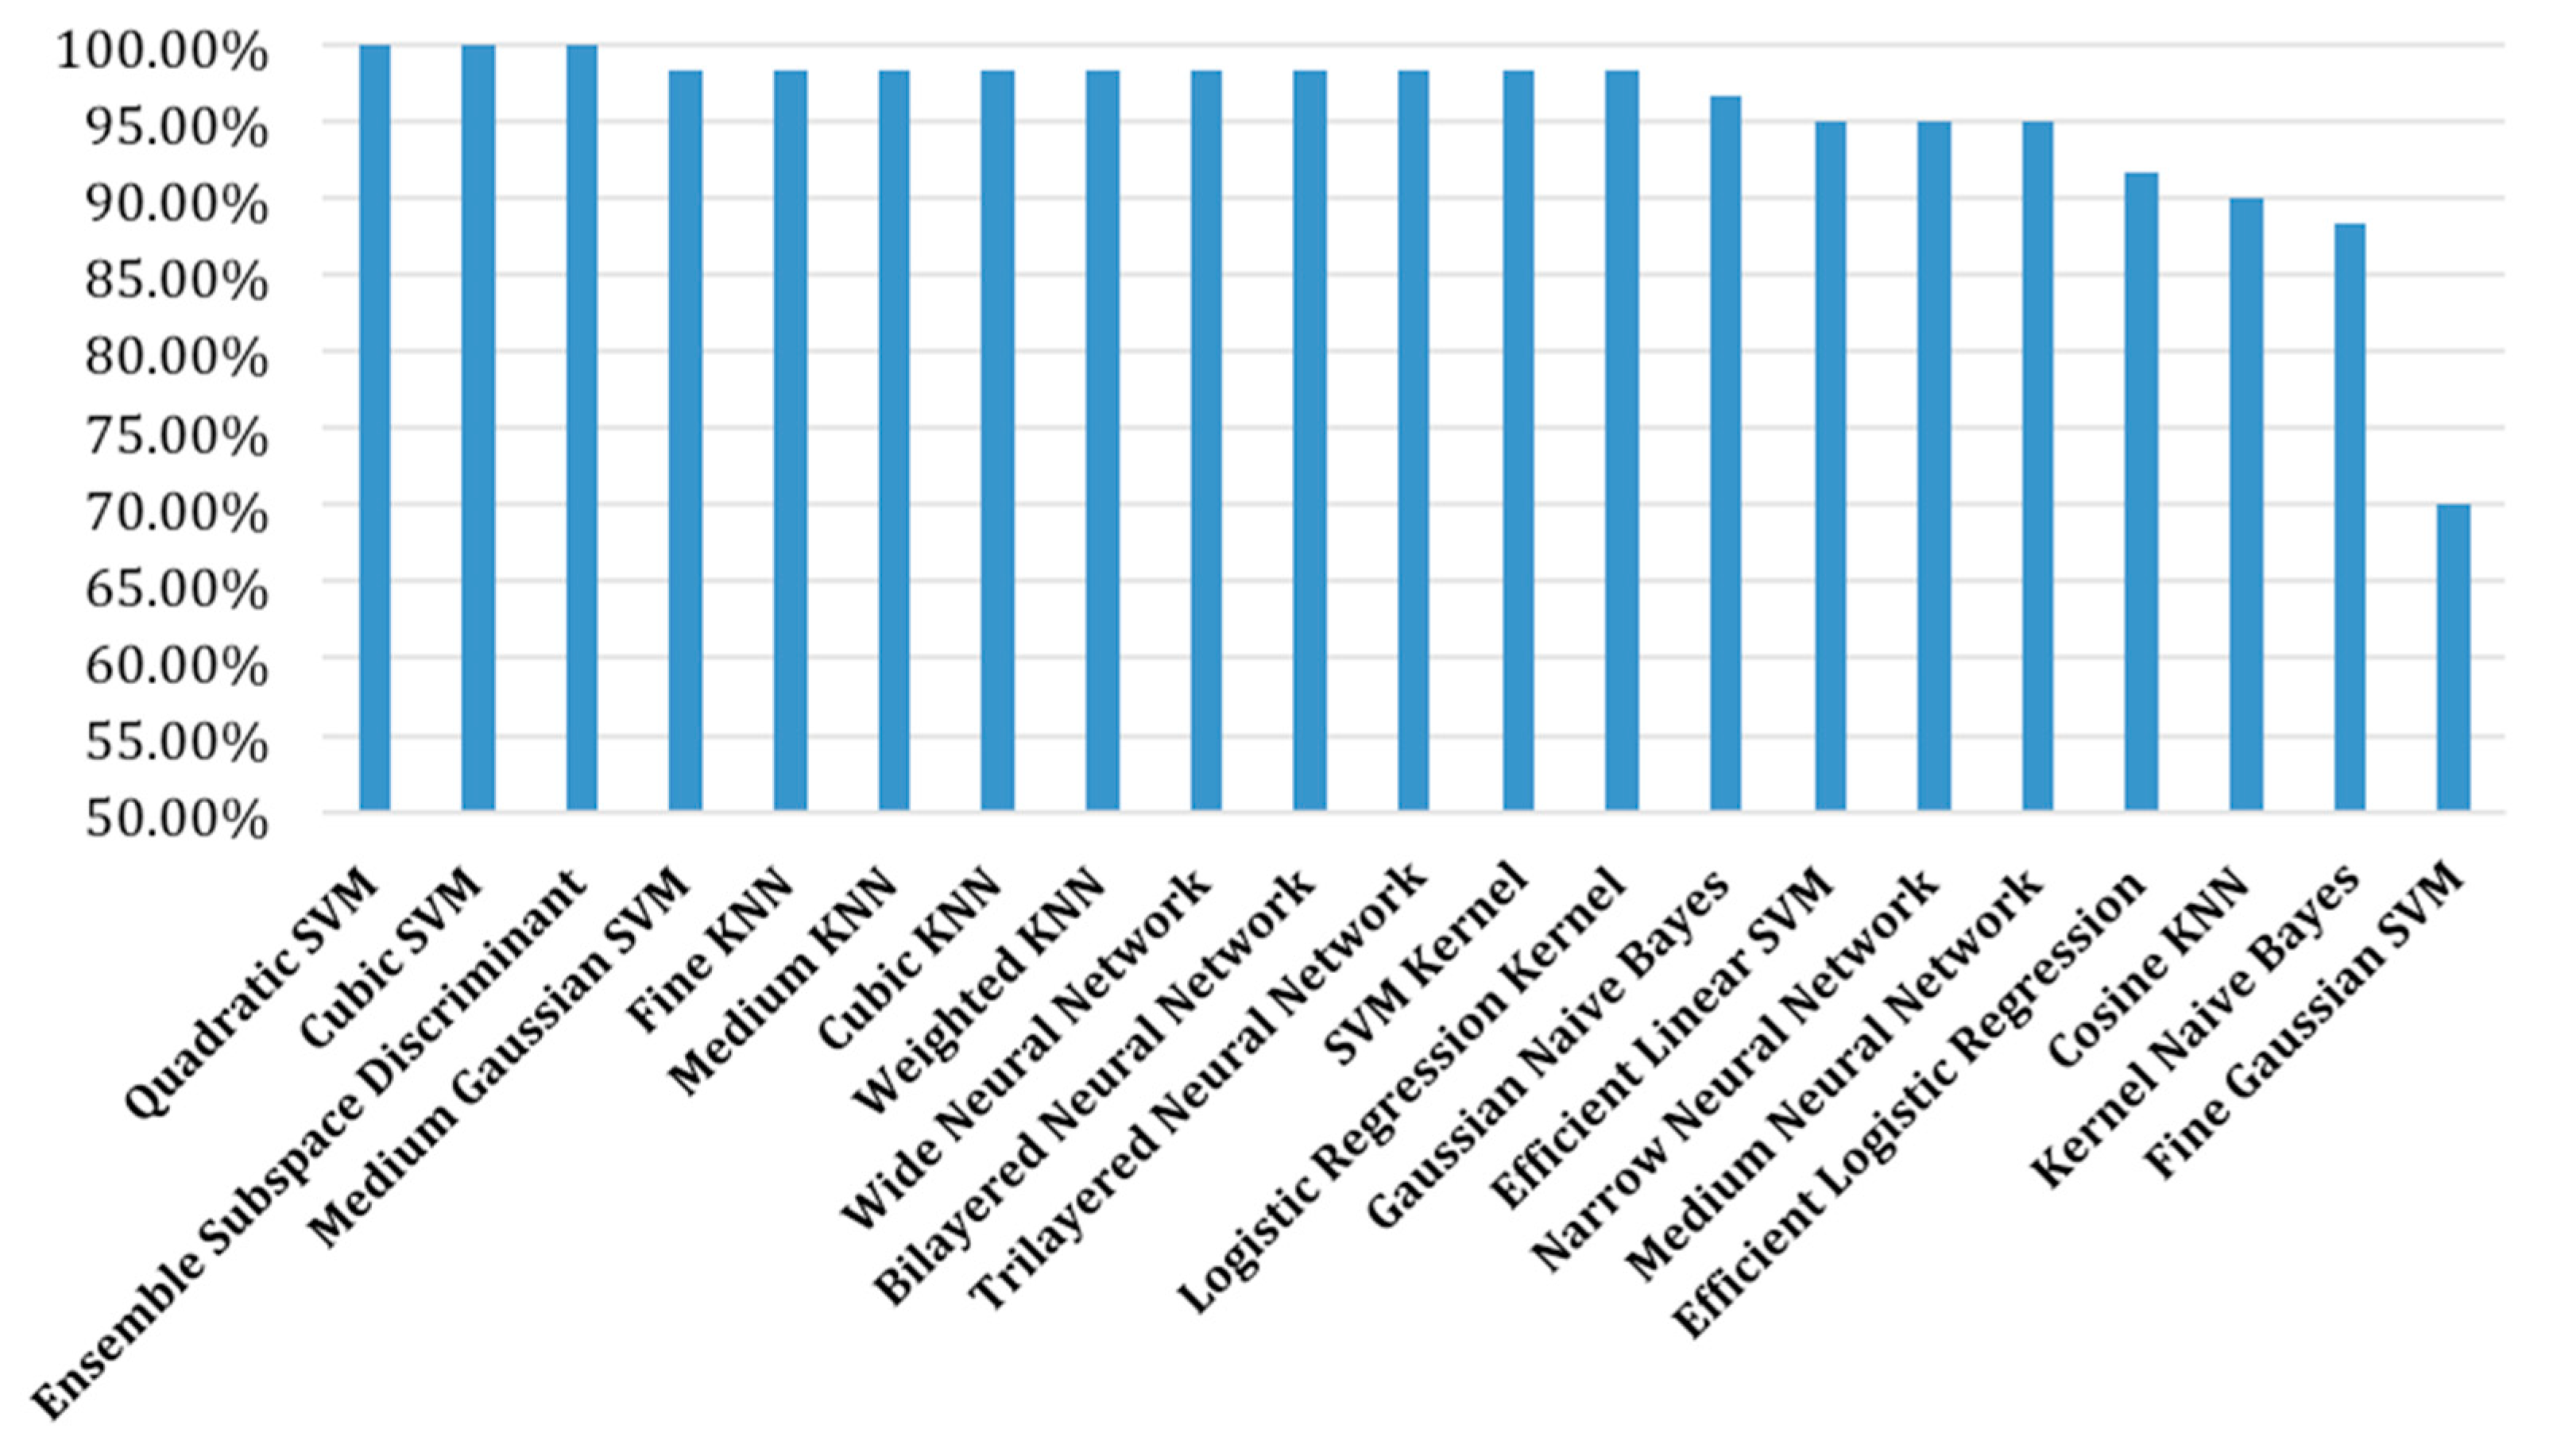
The statistical parameters specified in Table 3 and in the Supplement were tested from the perspective of identification of the damages for the three states of the belt, namely, undamaged, with three damages, and with five damages. In Table 4 are the tested algorithms presented along with the achieved accuracy of damage classification and the cases erroneously classified. Comparative visualization of the algorithm performance in the form of a bar chart is shown in Figure 8.
In the previous study [22], four decision-tree-based methods exhibited 100% classification accuracy. In Table 4, two out of three algorithms that exhibited 100% classification result belonged to the Support Vector Machines (SVM) group. Kernel parameters were set as polynomial = 3, C = 1, while Gamma value had an auto setting, so that MATLAB automatically calculated the optimal Gamma value based on the predictors.
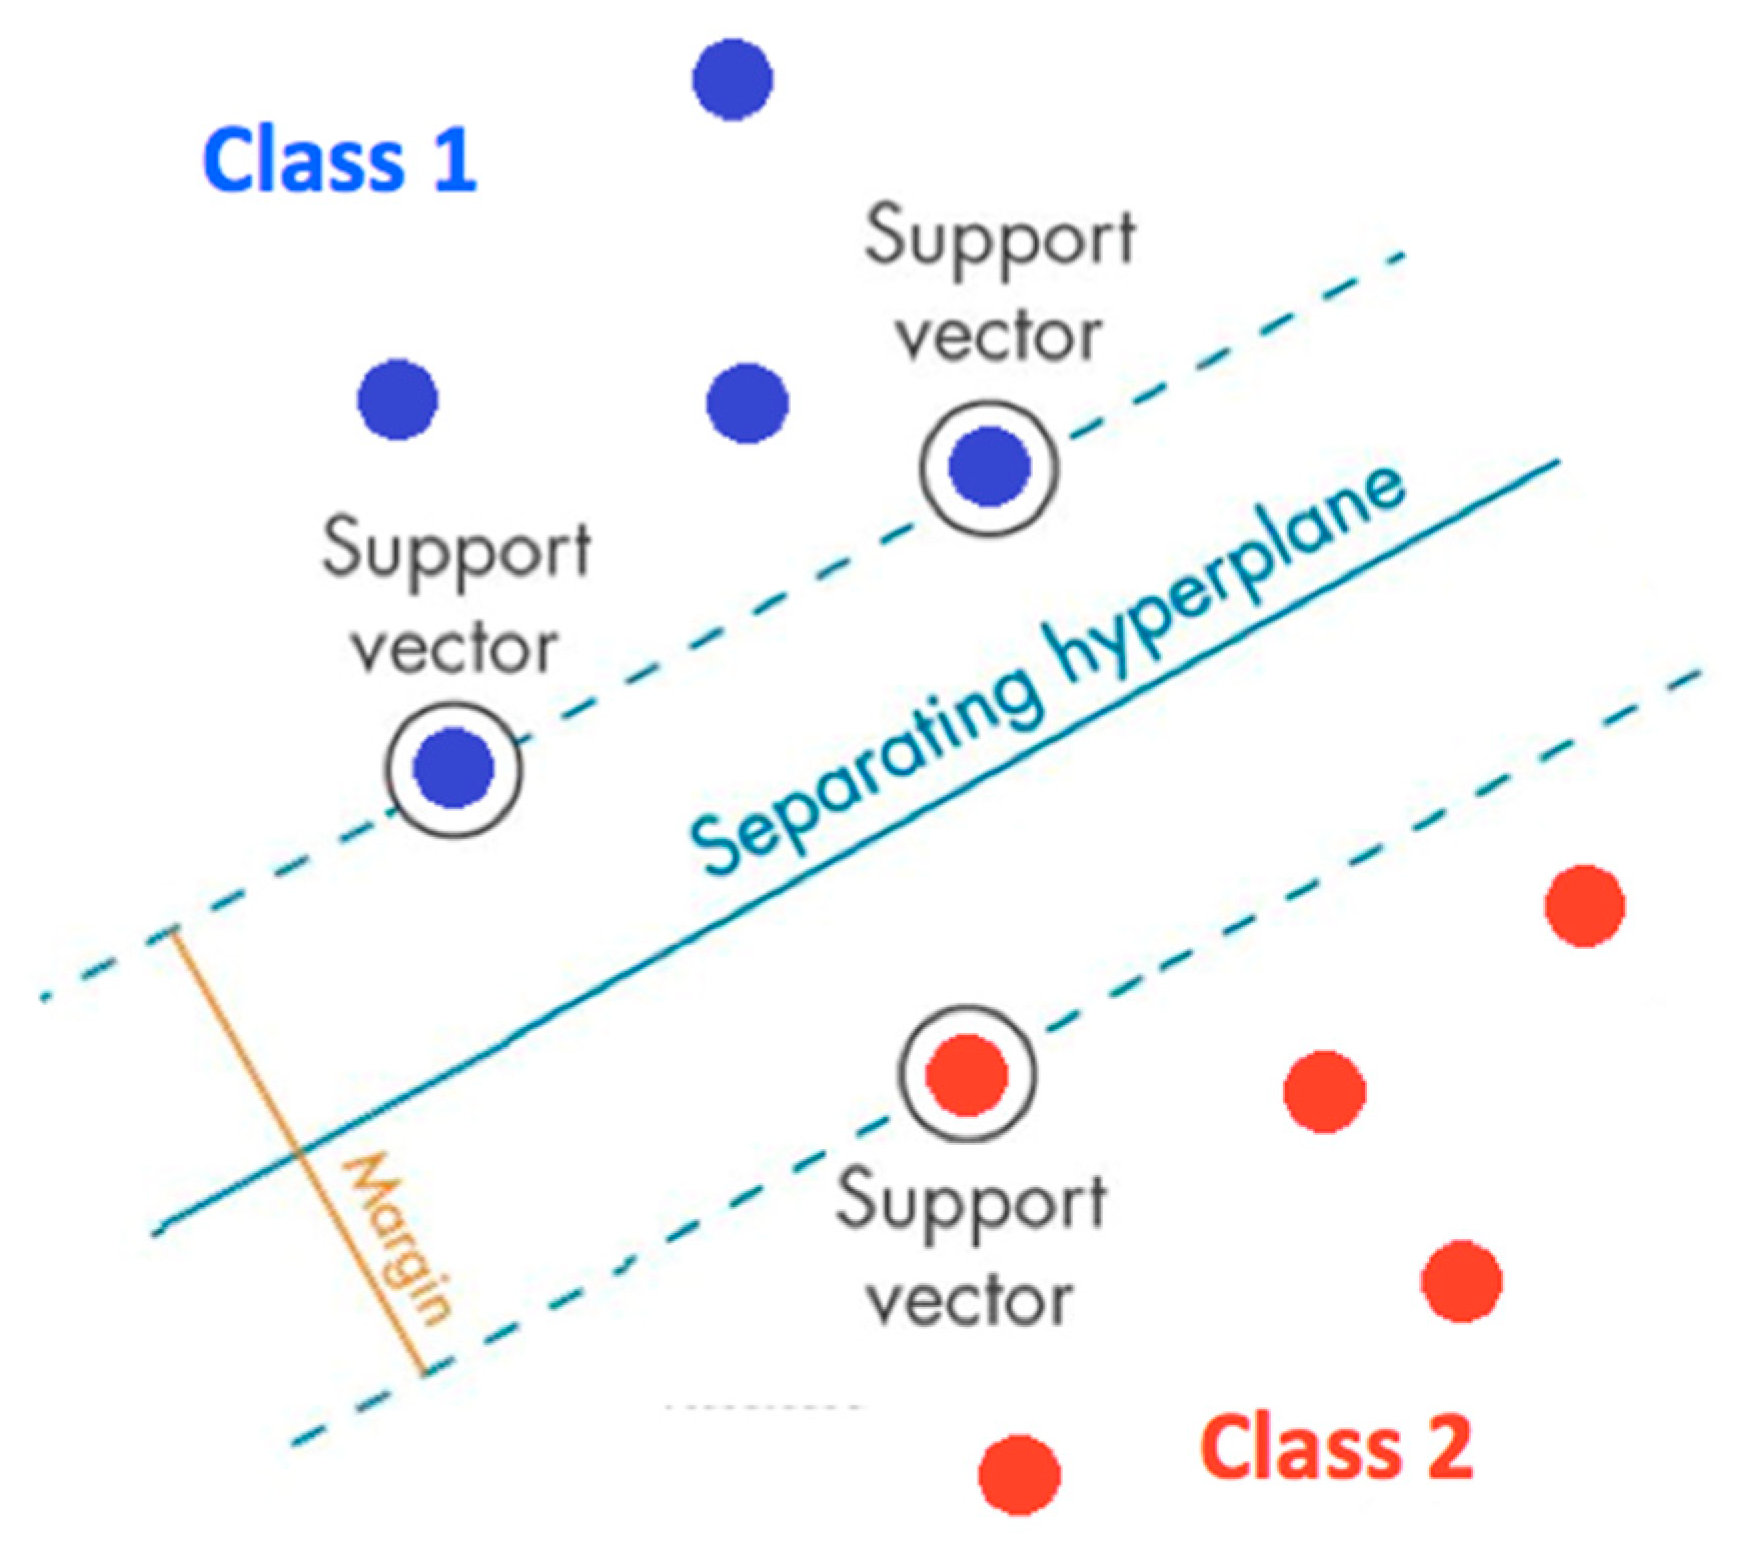
This algorithm classifies data by determination of the best hyperplane with the largest margin separating all the points of one class from those belonging to the other class [32], as illustrated in Figure 9. SVM’s main notion is a convex quadratic programming problem of optimization of the margin simultaneously minimizing misclassification errors. Usually, SVM is solved in dual space, outperforming other ML algorithms in terms of generalization, and it suffers less from overfitting or local minima [33]. Perhaps this feature is behind the better performance of SVM algorithms with the analyzed dataset and it can be expected to be successful with expanded datasets with higher level of noise. Among published works, Santhi and Srinivasan [34] reported efficiency of the technique based on combination of a sparse autoencoder and SVM algorithm in the detection of false data injection attacks when monitoring a conveyor belt system. Similarly, Hao and Liang [35] demonstrated the feasibility of SVM for detection of surface damage in a real-time conveyor belts monitoring system based on visual saliency.
On the other hand, none of the k-nearest neighbors (KNN) classifiers or neural networks achieved that level of accuracy. Recently published reports have studied the application of KNN analysis of audio data in order to enhance fault diagnosis for conveyor rollers [36], where the system achieved 97% accuracy. In our study, KNN exhibited high classification accuracy above 98%, but unlike SVM, it did not reach 100%.
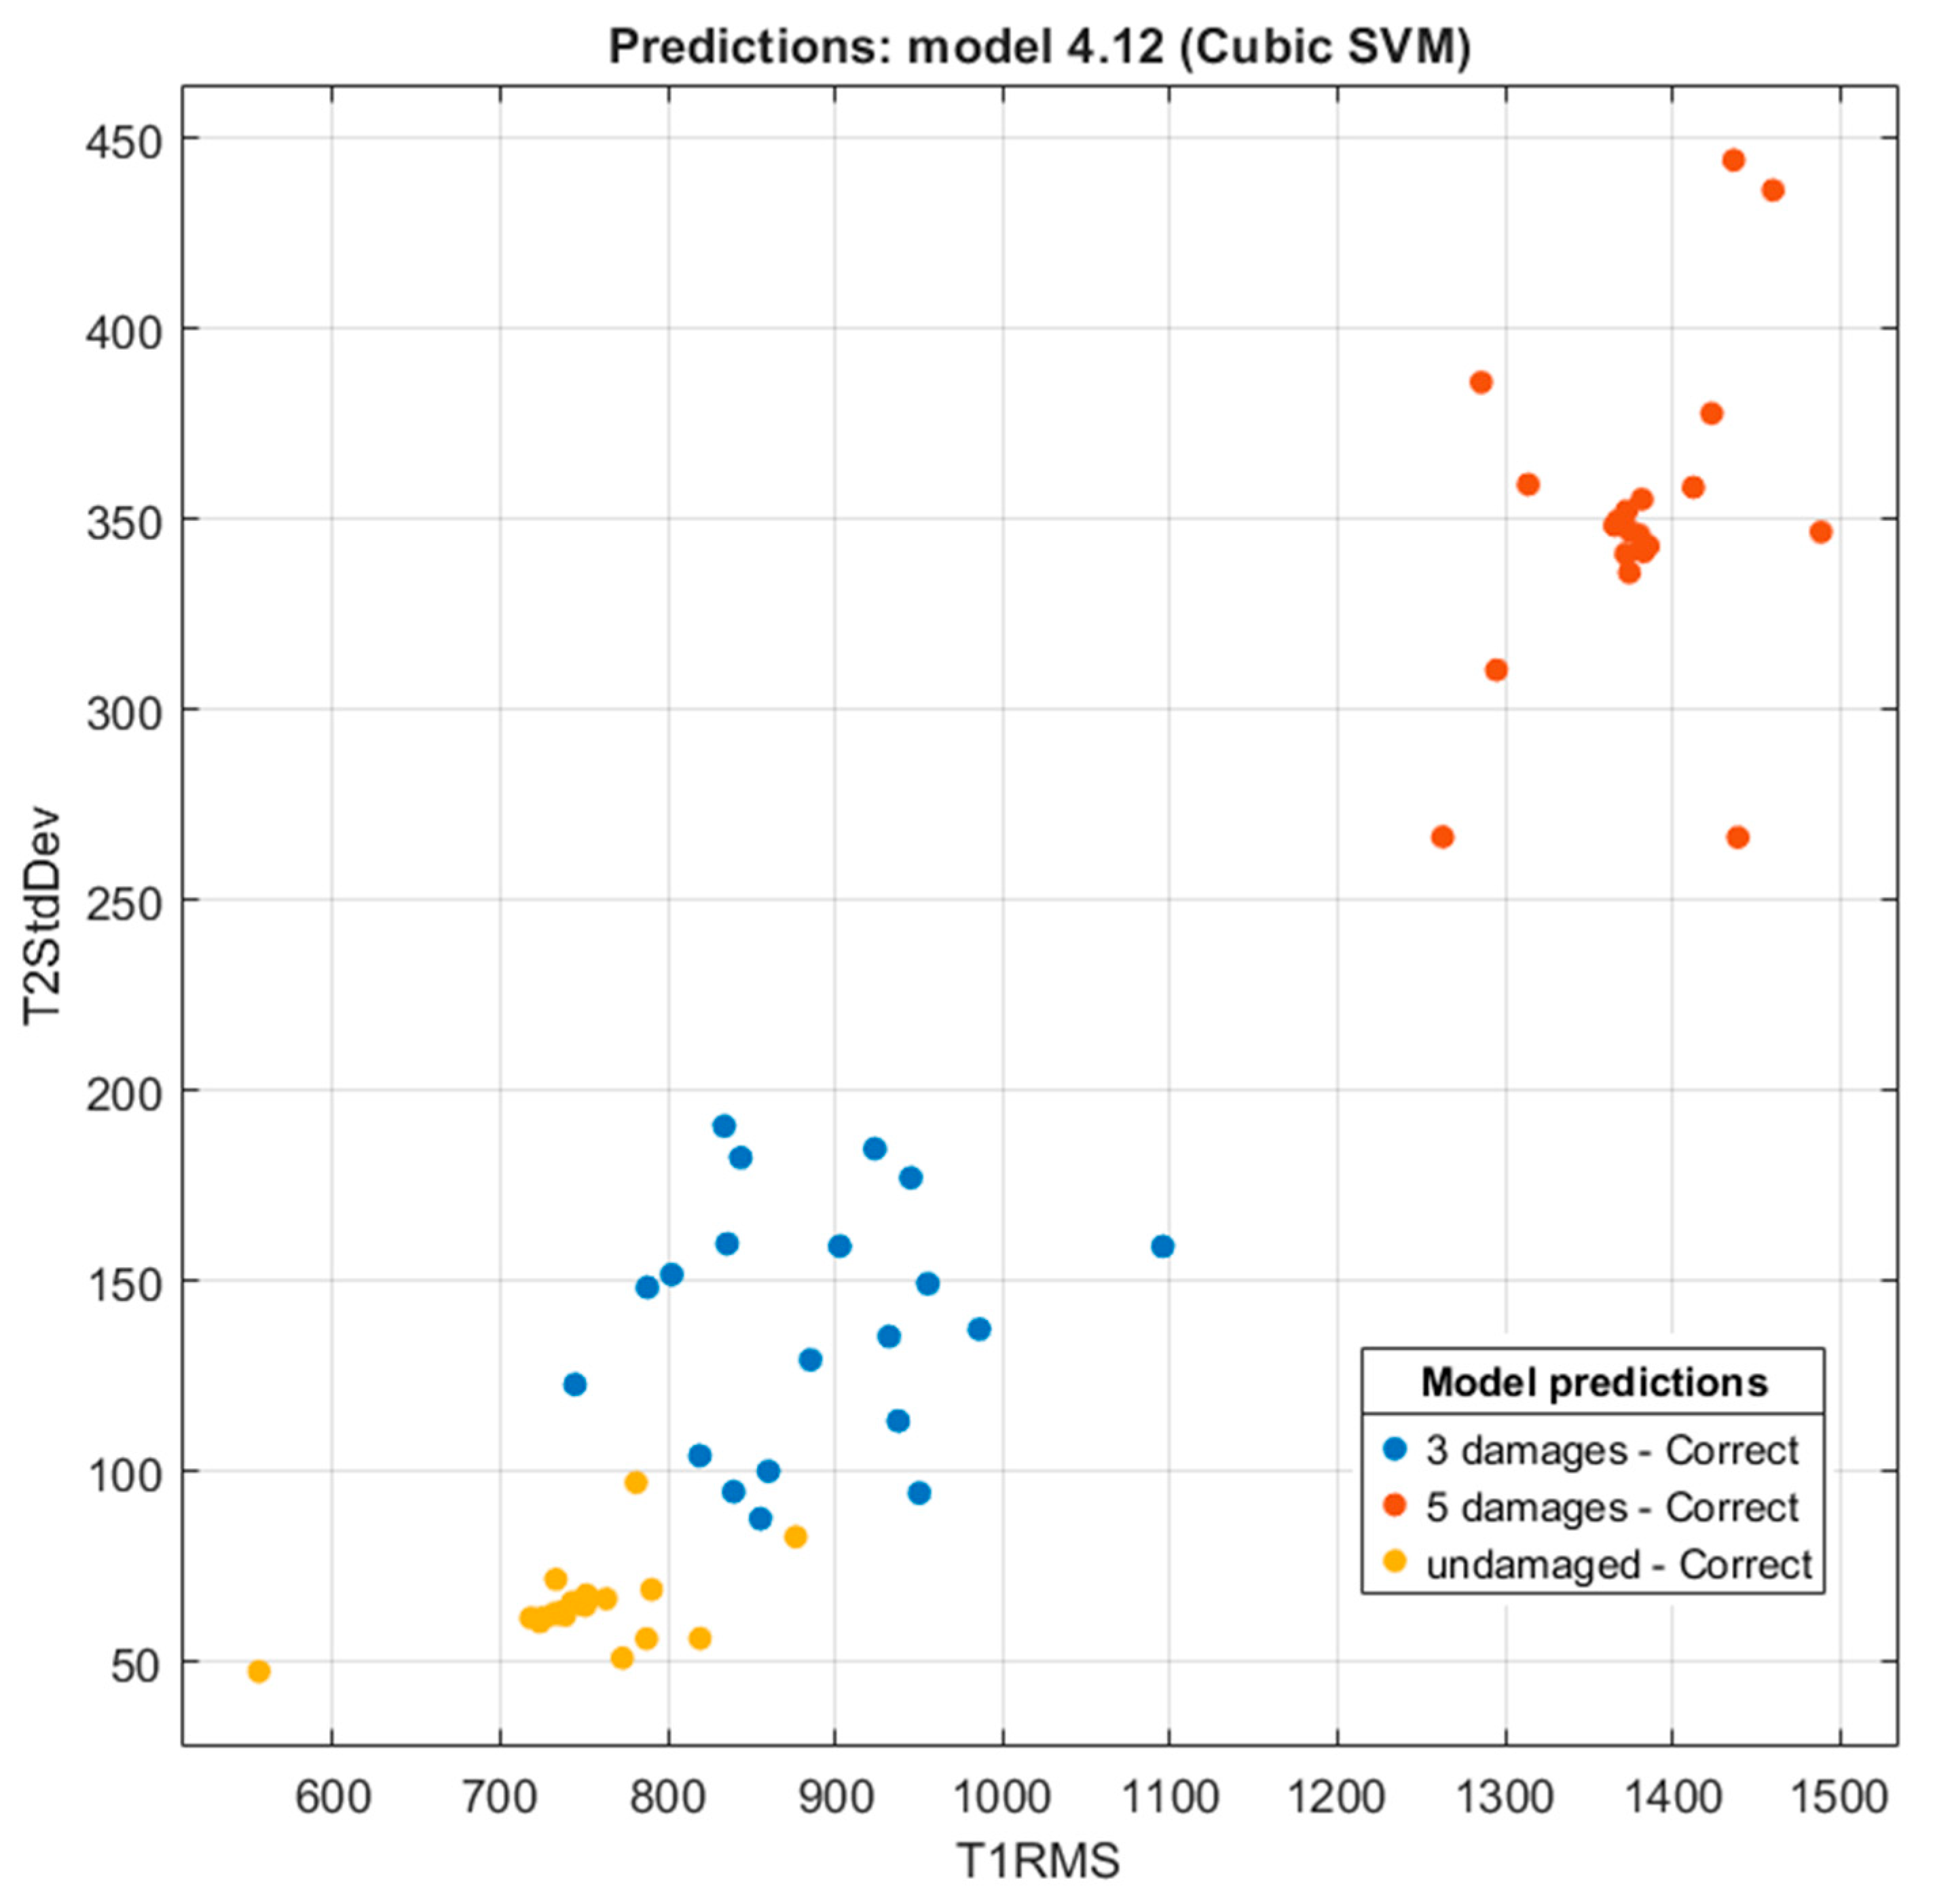
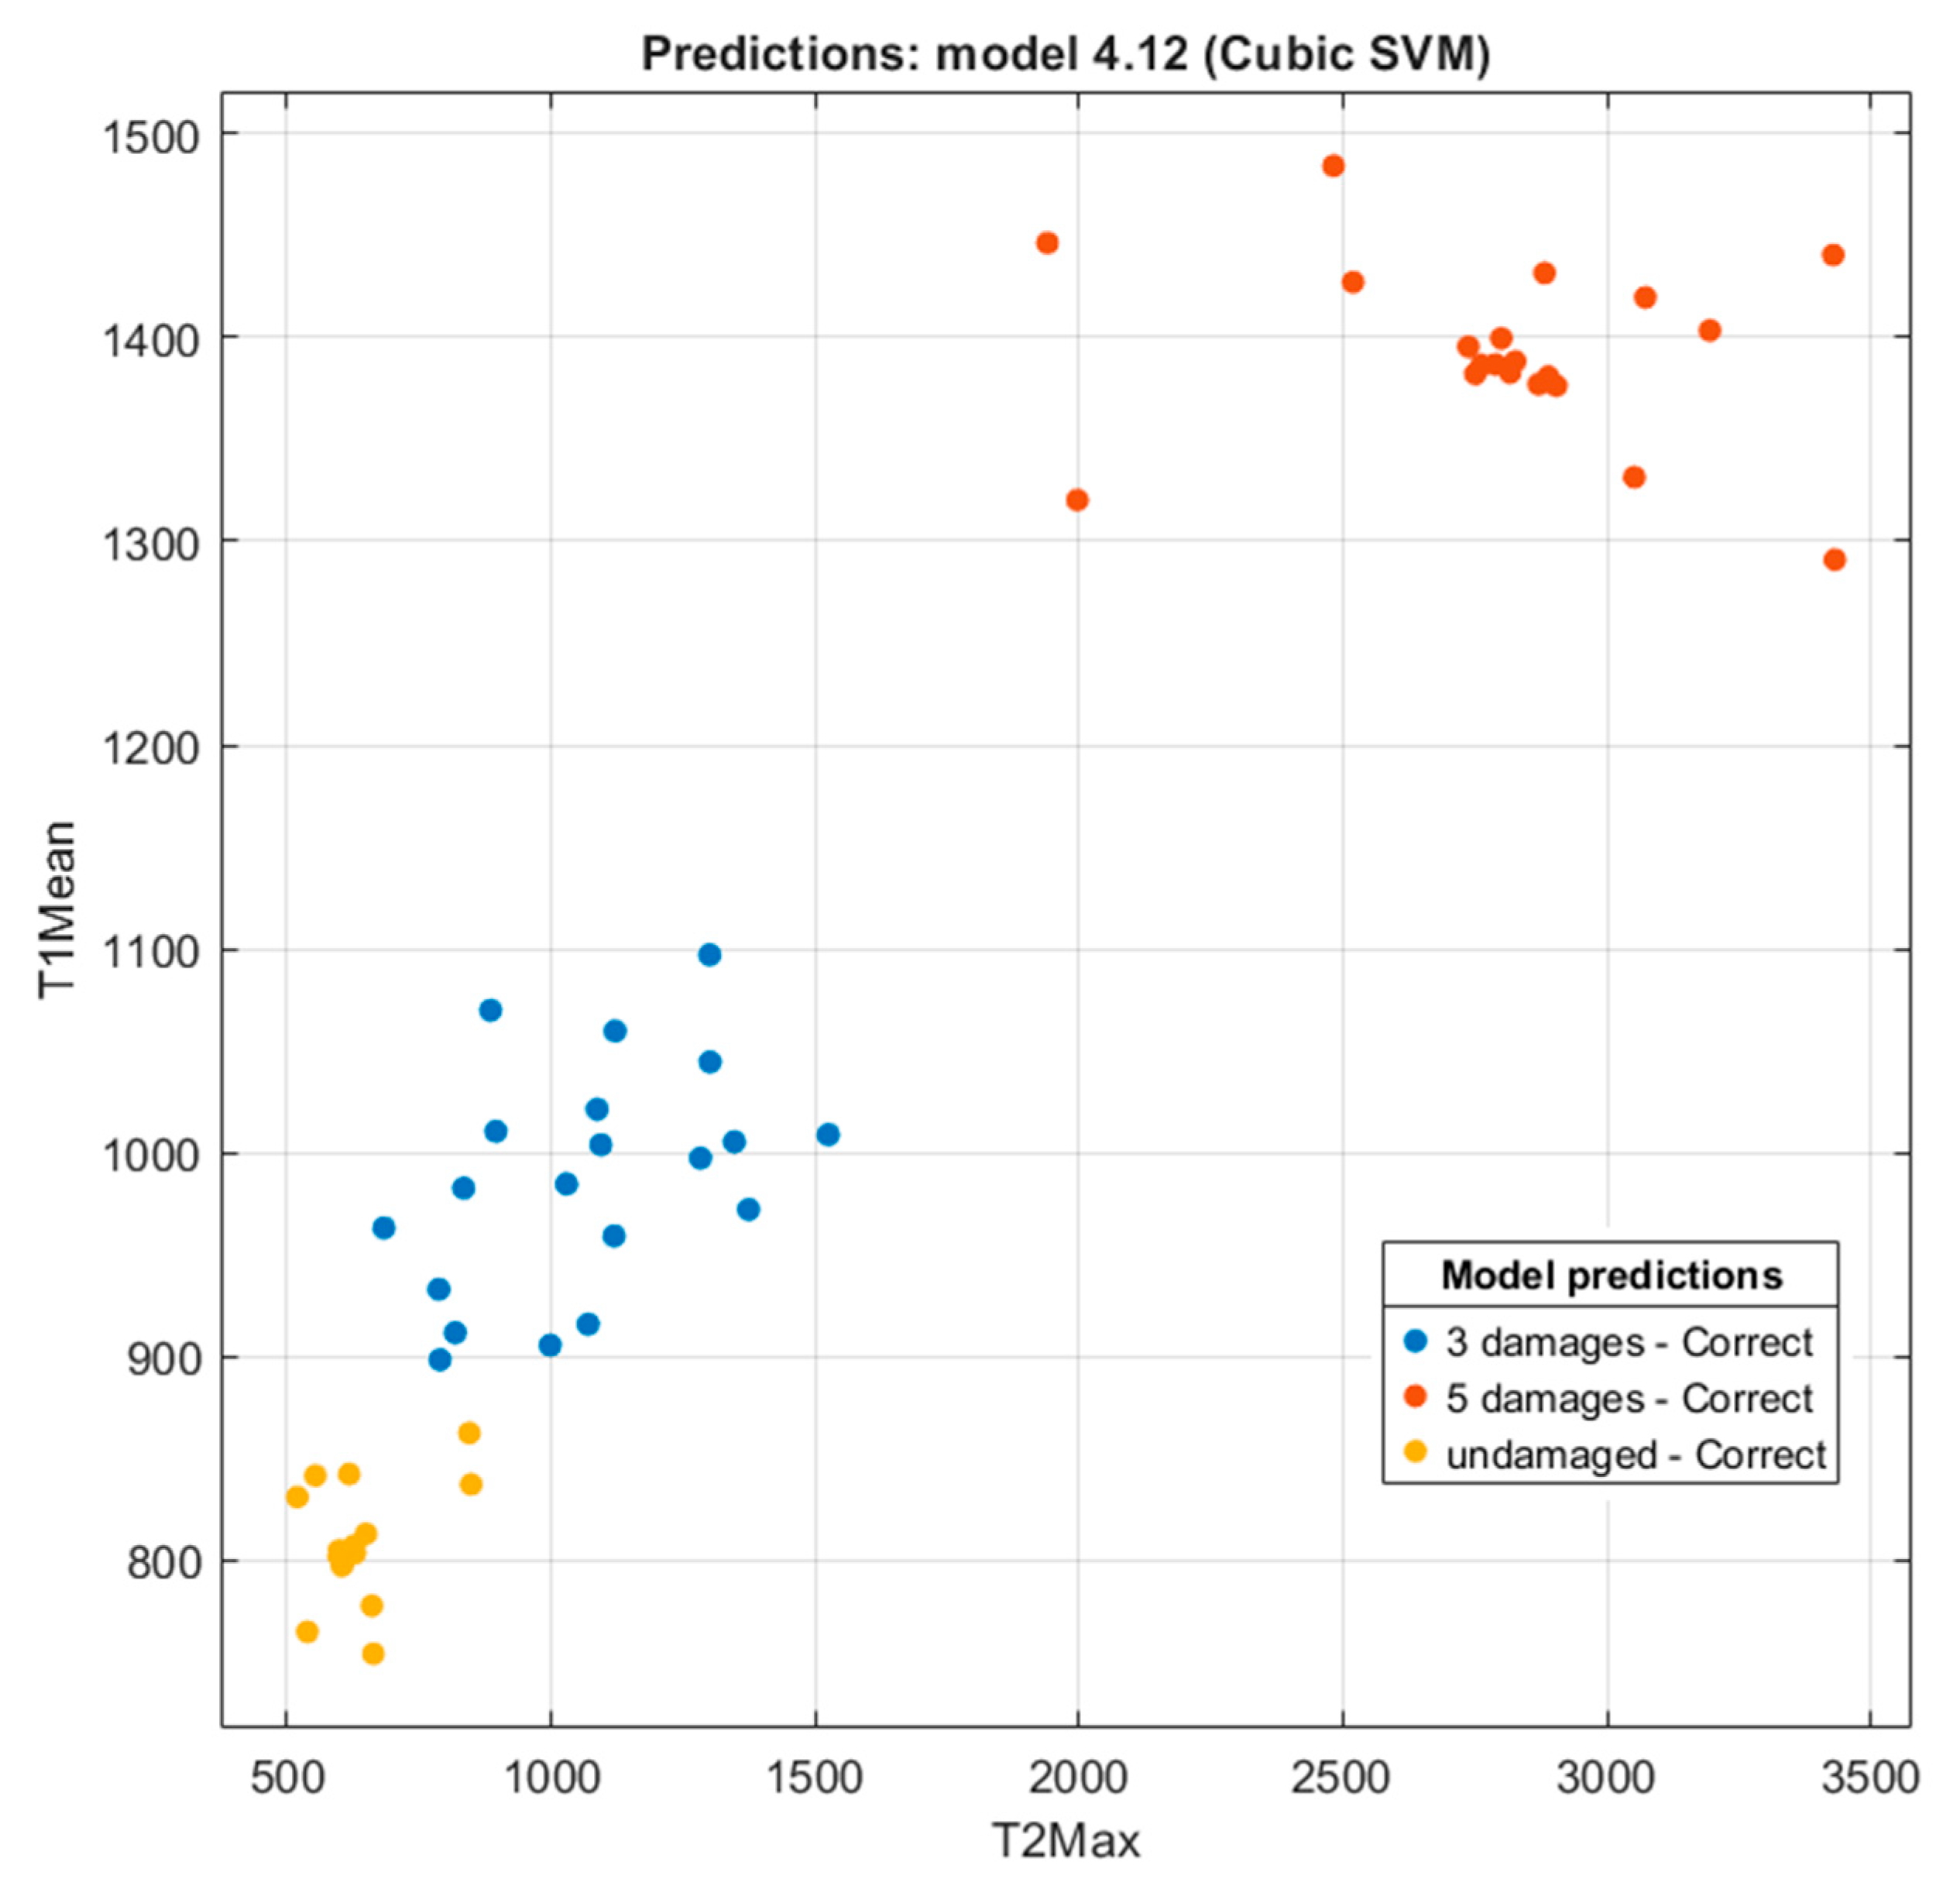
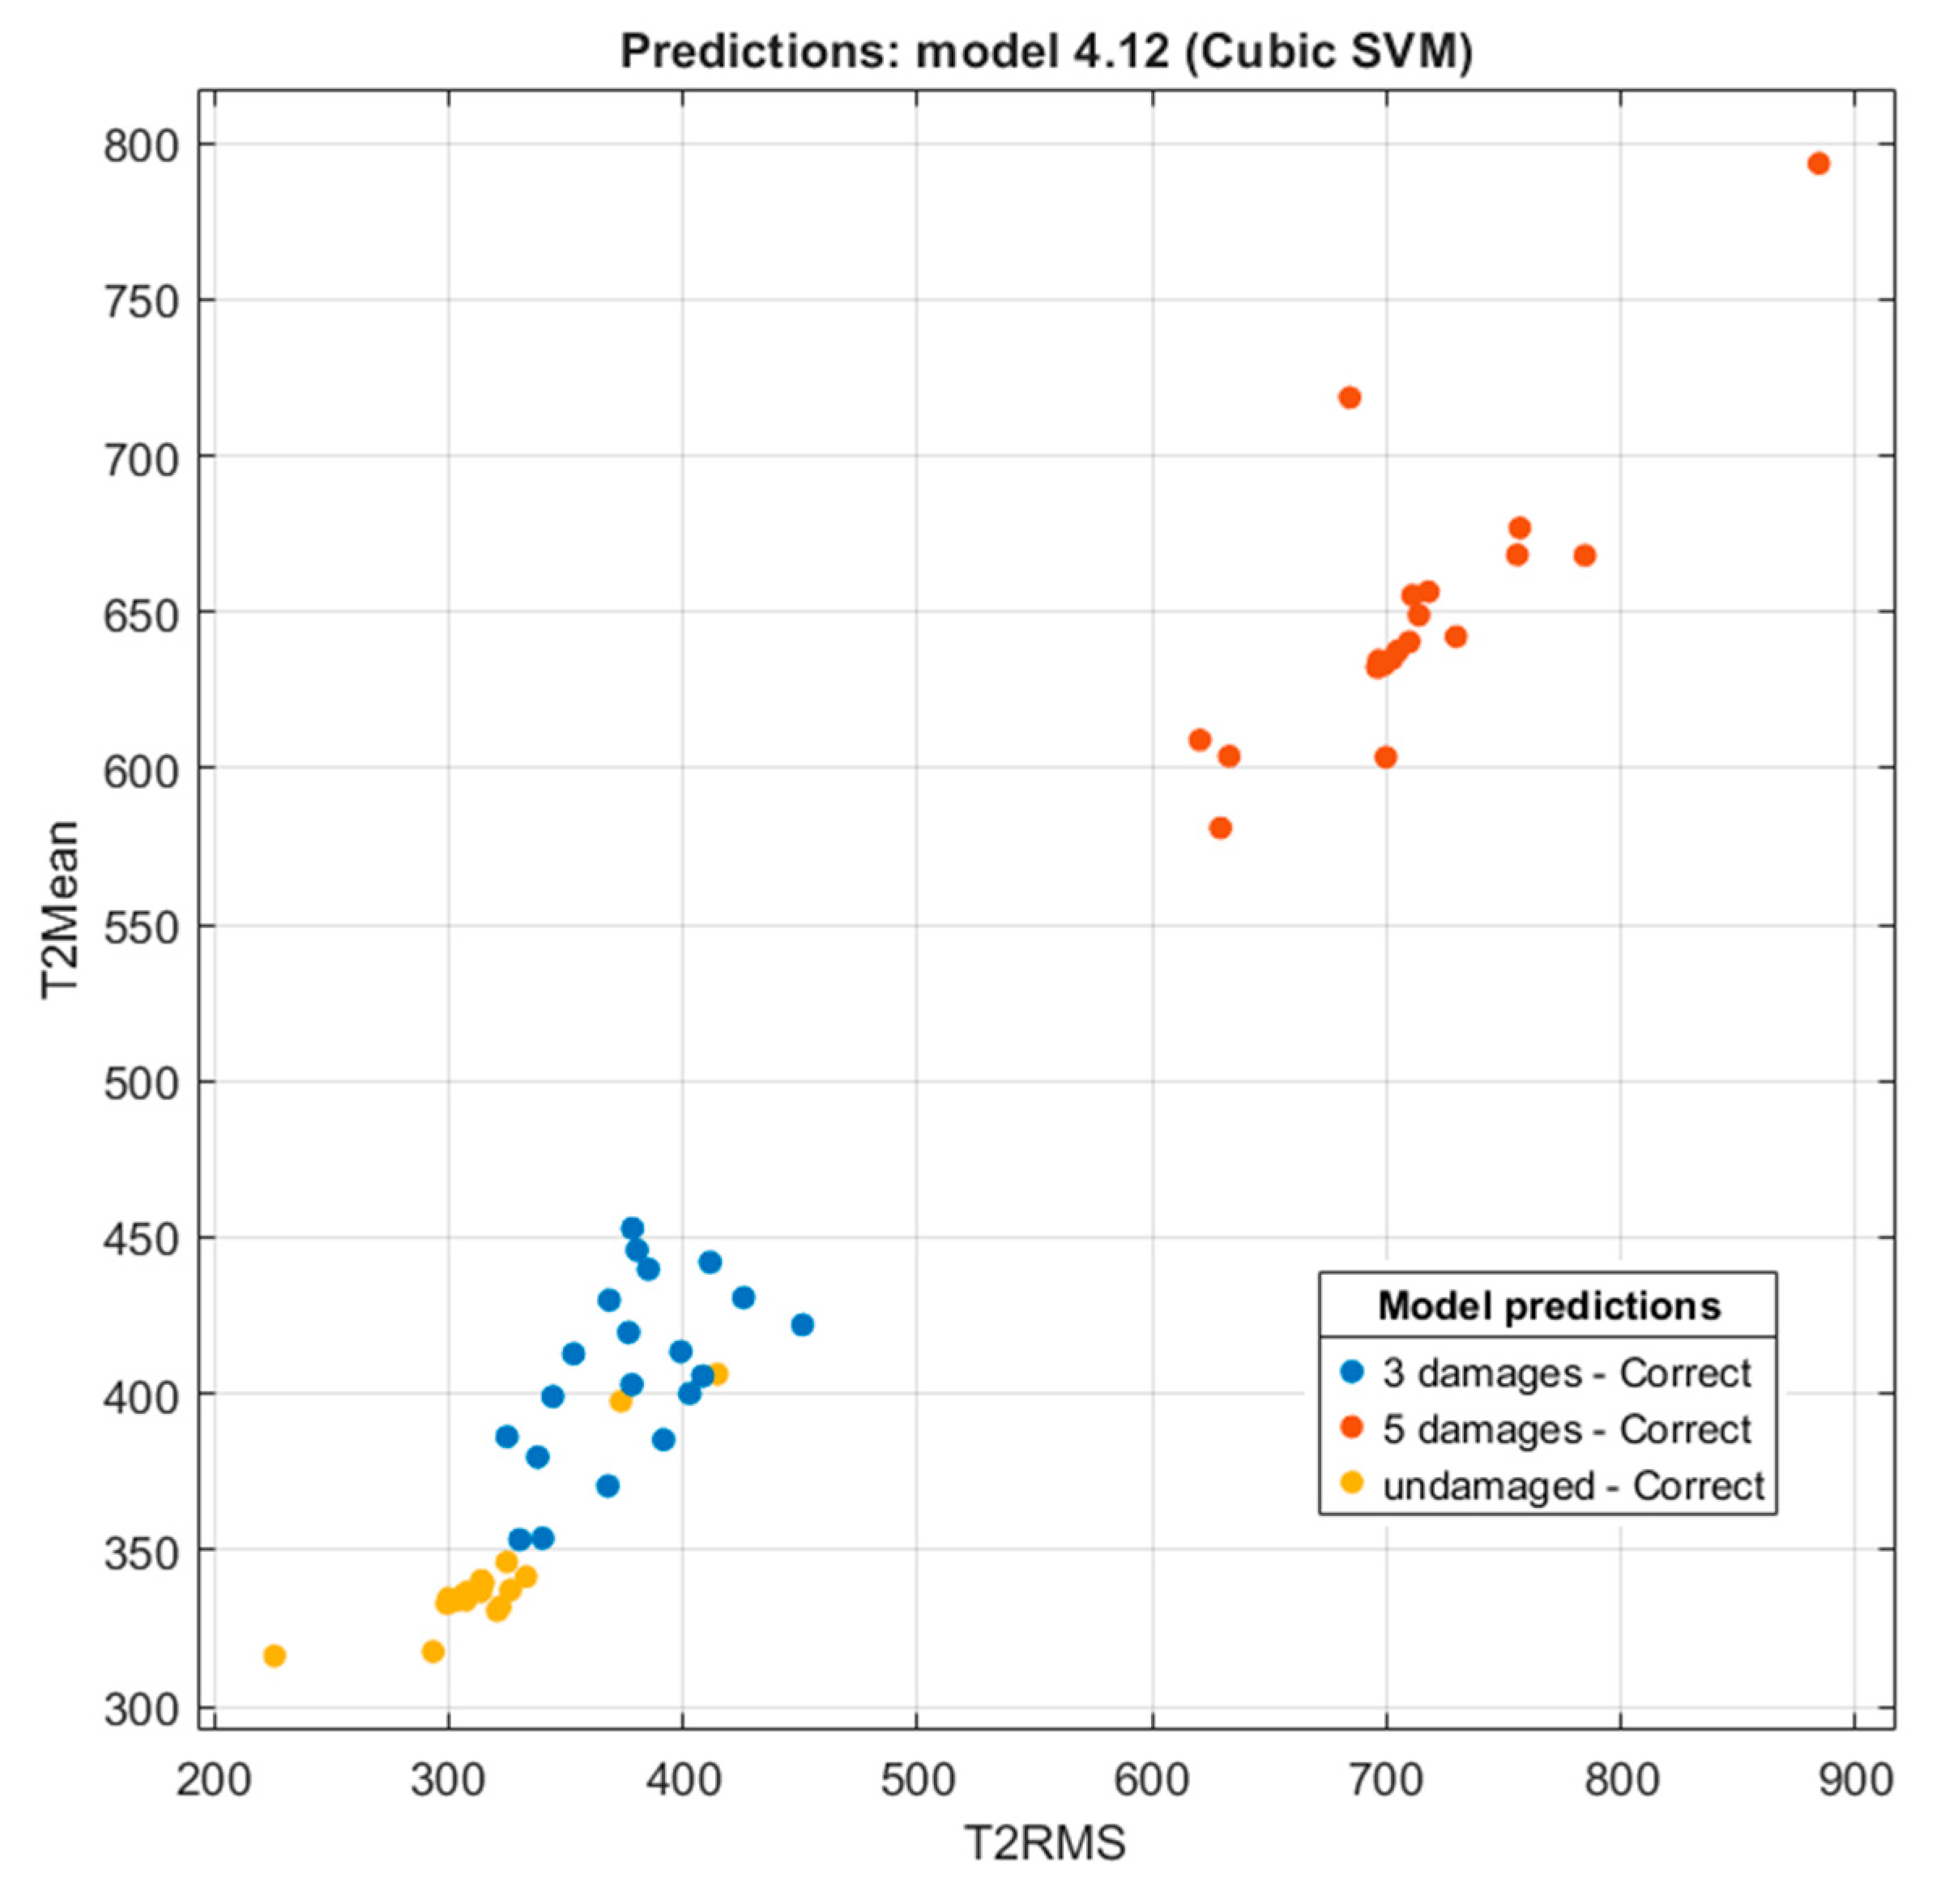
The scatterplots presented in Figure 10, Figure 11 and Figure 12 present the mutual dependence of two significant features. In the plots, the cluster areas of the analyzed points can be clearly recognized and used for identification of one of the conveyor belt conditions.
As it was noted, the smallest ADU values correspond with higher pressing force on the strain gauges. In this respect, damages seemed to loosen the belt tension so that the values related to the undamaged belt are grouped in the lower left corner of the plots in Figure 10, Figure 11 and Figure 12. At the same time, the points corresponding with the five damages are more scattered. This corresponds with the data presented in Table 3 and is more detailed in Supplementary Table S1.
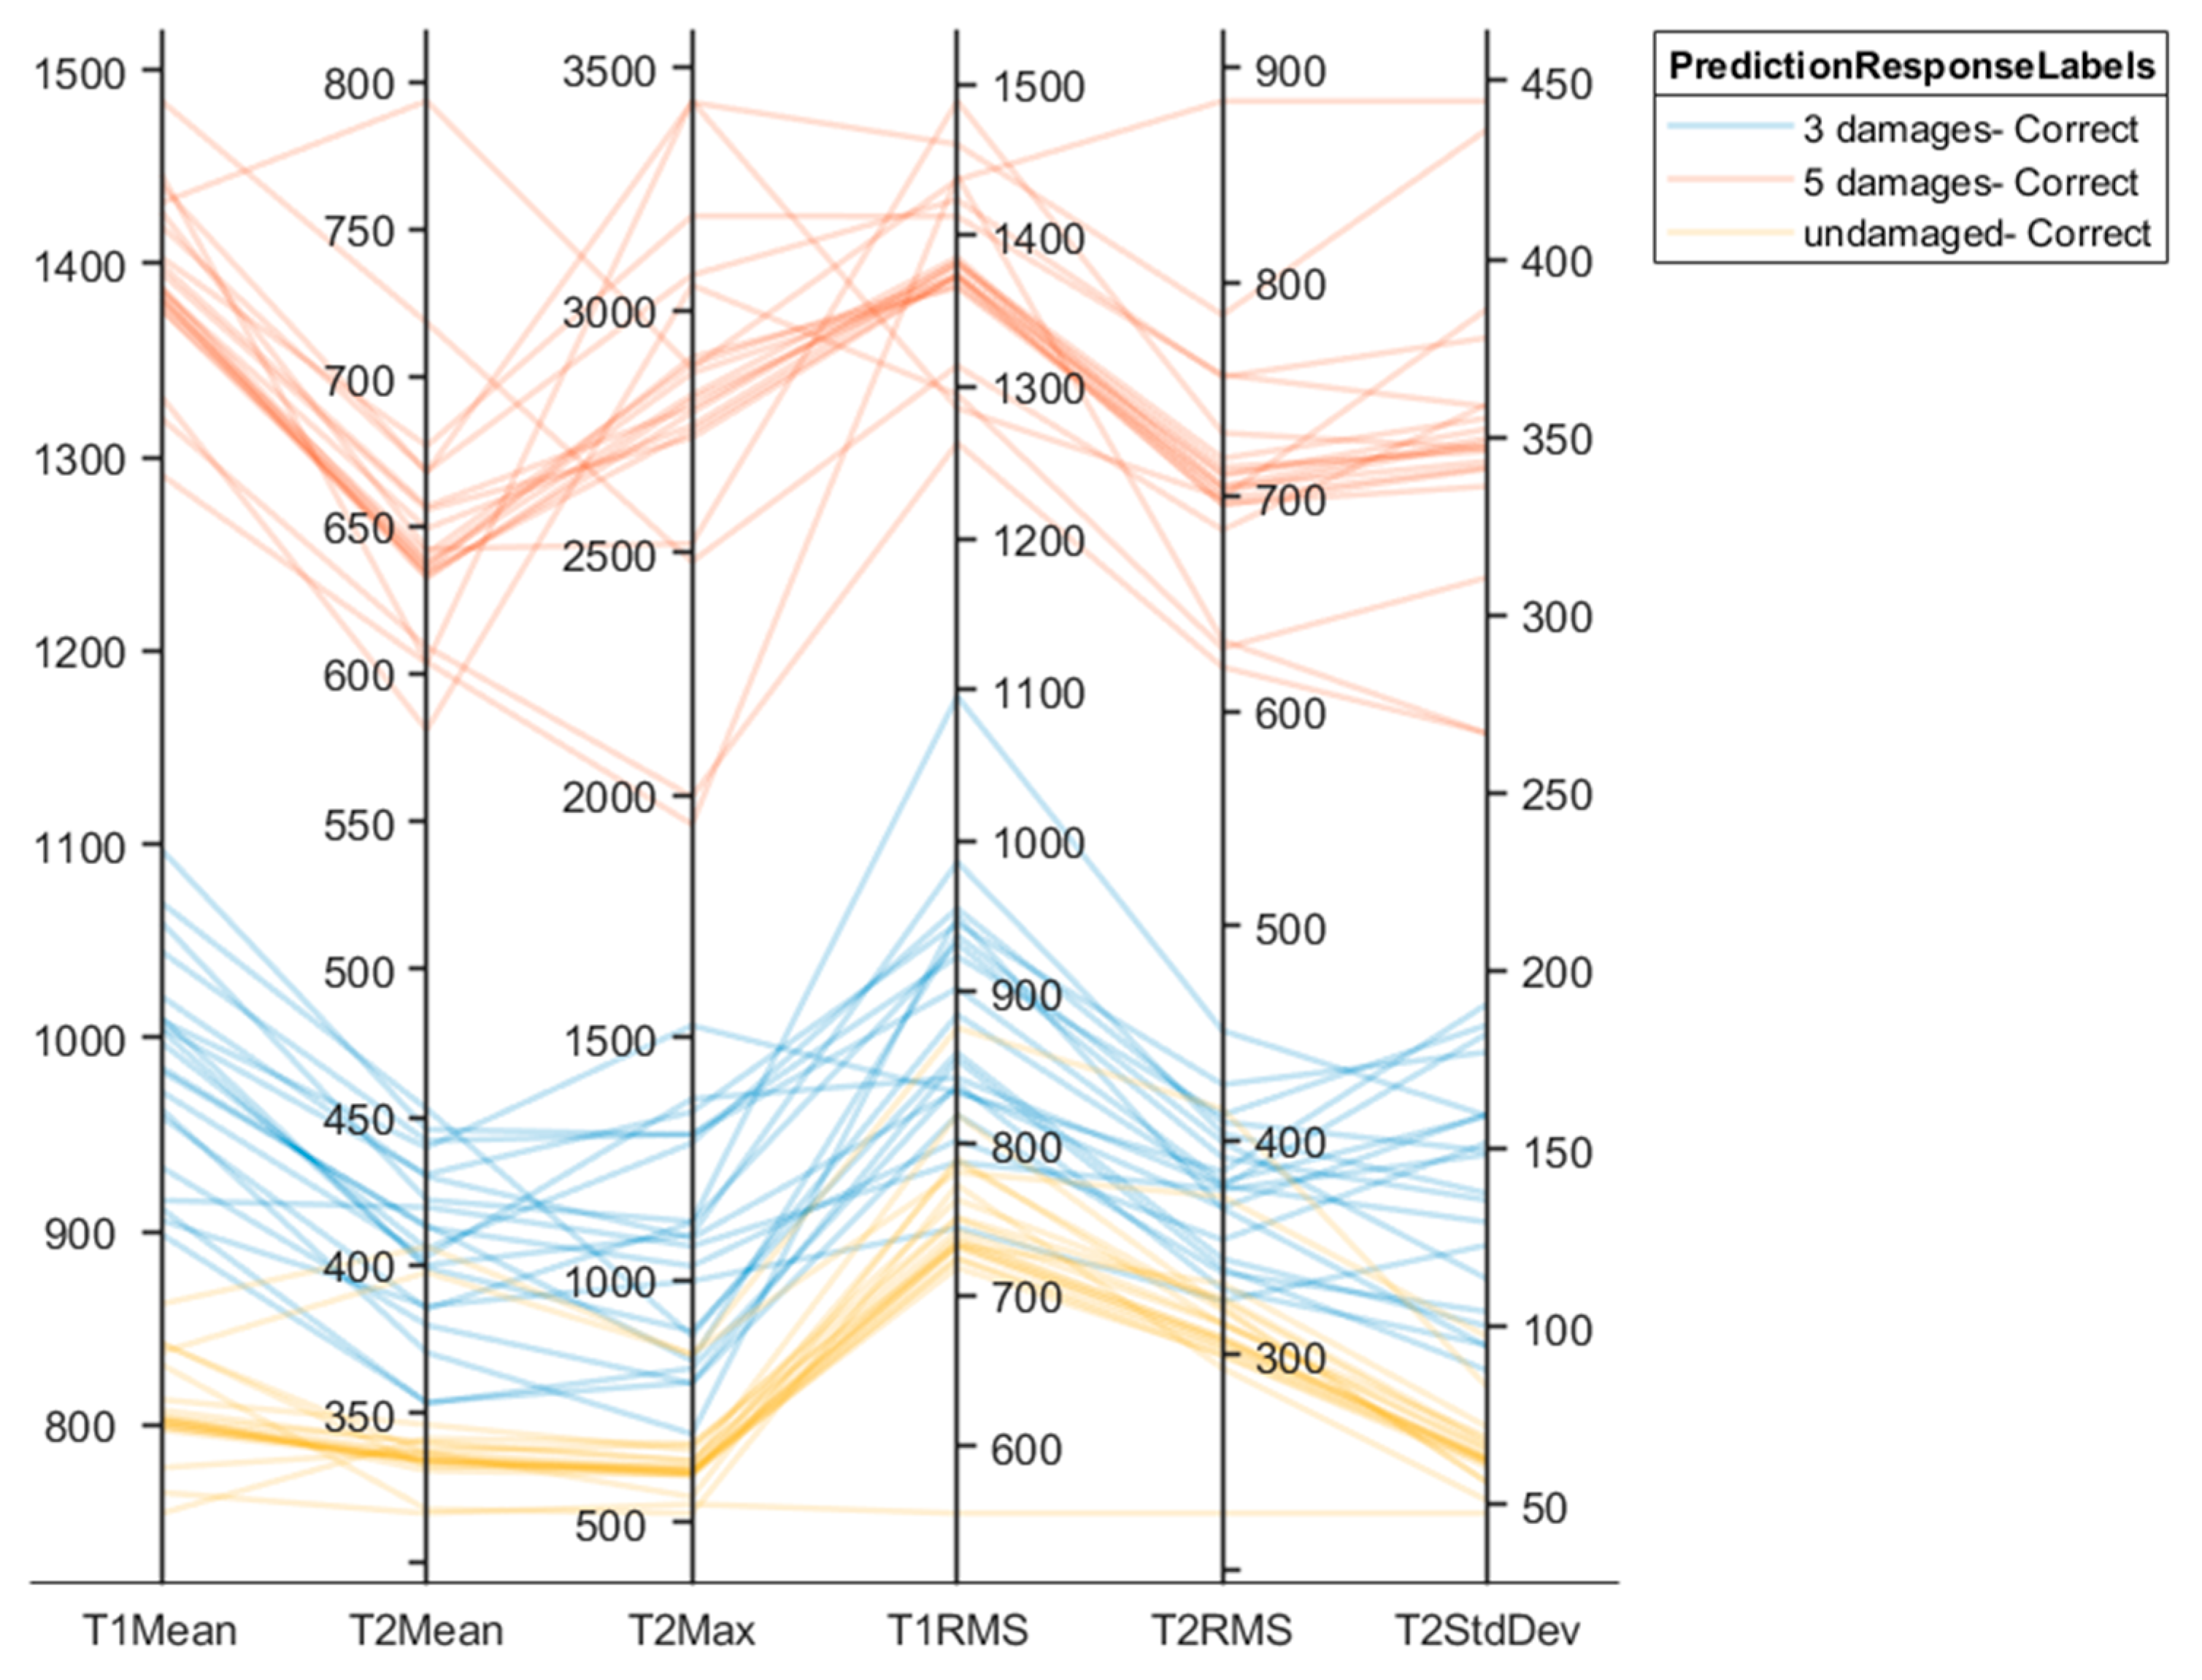
In order to illustrate the relationships between the specified six most important features, a parallel coordinates plot (PCP) was built and presented in Figure 13. The data was processed using the Cubic SVM algorithm.
In Figure 13, the PCP indicates the ranges of significant feature values related to the certain state of the tested belt. The values of T1Mean and T1RMS tend to exhibit the highest values in all three tested states, while T2Mean and T2StdDev tend to be the lowest ones. Even though the five-damage state exhibited the largest dispersion, clear densification of the red lines indicated the main trend. In the tested conditions, areas covered by the five-damage state did not overlap with any other area, and only a slight overlapping area can be noted between the three-damage state and undamaged one.
The authors are fully aware that the dataset used for the analysis was relatively small. Nevertheless, from the perspective of the initial validation, it is sufficient and may be used for some generalization. In particular, the precise identification of three or five damages indicated that the system with appropriately applied ML algorithms is able to reveal the damage at the early stage of its appearance. In the industrial conditions, as soon as damage is found, it is necessary to stop the conveyor to avoid critical failure. However, in a wider research perspective, it is not planned to rely on the strain gauge signals only. It is more about including the tested system in the predictive maintenance framework with several heterogeneous data sources, designed for a specific industrial environment [37]. In light of the successful test results, this direction of further investigation appears to be promising.

4. Conclusions

The analysis on rubber conveyor belt health monitoring was performed using the patented strain gauge measurement system. The strain gauges provided a reliable interdependent sequence of signals that formed certain patterns related to the belt damages. The data generated by the system underwent analysis with the application of 22 machine learning (ML) algorithms. The signals from three strain gauges T1, T2, and T3 were collected for the undamaged belt, for the belt with three preset damages, and the belt with five damages. Through performing 20 repetitions of each configuration, statistical parameters were calculated and the most significant features were pointed out. The most significant feature indicated by the five tested models was T1 arithmetic mean. Other significant values were T1 and T2 Root Mean Square, and T2 Mean. T2 Standard Deviation and T2 Max were less significant, and the other features gained a significance of less than 0.5 from two or more models. A total of 3 out of 22 tested ML algorithms were able to classify three states of the conveyor belt correctly, exhibiting 100% prediction accuracy. The k-nearest neighbors (KNN) classifiers and neural networks failed to achieve that level of accuracy.
Thus, it can be concluded that the tested system was feasible for the real-time health monitoring and detection of the belt damages during the conveyor operation. In future research, we plan to test the performance of ML algorithms under the scenario of a loaded belt, considering loads combined with damages.

5. Patents

The Polish patent No. P.447569 [38] was registered as a result of the work performed in this manuscript.

Supplementary Materials

The following supporting information can be downloaded at https://www.mdpi.com/article/10.3390/app151910449/s1: Table S1: Statistical features of the signals from the strain gauges T1, T2, and T3, ADU.

Author Contributions

Conceptualization, T.R. and A.K.; methodology, D.B., T.R., and M.R.; software, T.R.; validation, A.K.; formal analysis, M.R.; investigation, T.R.; resources, A.K.; data curation, D.B.; writing—original draft preparation, M.R.; writing—review and editing, all authors.; visualization, M.R.; supervision, M.R.; project administration, M.R.; funding acquisition, D.B. All authors have read and agreed to the published version of the manuscript.

Funding

This research received no external funding.

Institutional Review Board Statement

Not applicable.

Informed Consent Statement

Not applicable.

Data Availability Statement

Data is included in the paper and the Supplementary Materials File. The raw data supporting the conclusions of this article will be made available by the authors on request.

Conflicts of Interest

The authors declare no conflicts of interest.

References

  1. Mypati, O.; Mukherjee, A.; Mishra, D.; Pal, K.S.; Chakrabarti, P.P.; Pal, A. A critical review on applications of artificial intelligence in manufacturing. Artif. Intell. Rev. 2023, 56, 661–768. [Google Scholar] [CrossRef]
  2. Bortnowski, P.; Kawalec, W.; Król, R.; Ozdoba, M. Types and causes of damage to the conveyor belt—Review, classification and mutual relations. Eng. Fail. Anal. 2022, 140, 106520. [Google Scholar] [CrossRef]
  3. Kozłowski, T.; Wodecki, J.; Zimroz, R.; Błażej, R.; Hardygóra, M. A Diagnostics of Conveyor Belt Splices. Appl. Sci. 2020, 10, 6259. [Google Scholar] [CrossRef]
  4. Zuperl, U.; Stepien, K.; Munđar, G.; Kovačič, M. A Cloud-Based System for the Optical Monitoring of Tool Conditions during Milling through the Detection of Chip Surface Size and Identification of Cutting Force Trends. Processes 2022, 10, 671. [Google Scholar] [CrossRef]
  5. Yang, R.; Qiao, T.; Pang, Y.; Yang, Y.; Zhang, H.; Yan, G. Infrared spectrum analysis method for detection and early warning of longitudinal tear of mine conveyor belt. Measurement 2020, 165, 107856. [Google Scholar] [CrossRef]
  6. Lv, Z.; Zhang, X.; Hu, J.; Lin, K. Visual detection method based online lasers for the detection of longitudinal tears in conveyor belts. Measurement 2021, 183, 109800. [Google Scholar] [CrossRef]
  7. Kirjanów-Błażej, A.; Jurdziak, L.; Błażej, R.; Rzeszowska, A. Calibration procedure for ultrasonic sensors for precise thickness measurement. Measurement 2023, 214, 112744. [Google Scholar] [CrossRef]
  8. Parmar, P.; Rzeszowska, A.; Burduk, A.; Jurdziak, L. Forecasting Conveyor Belt Performance in Future Using Pre-trained Models Based on Historical Failure Data. In Intelligent Systems in Production Engineering and Maintenance IV. ISPEM 2025. Lecture Notes in Mechanical Engineering; Burduk, A., Xavior, M.A., Machado, J., Butdee, S., Krot, K., Srikhumsuk, P., Lapczynska, D., Eds.; Springer: Cham, Switzerland, 2025; pp. 389–402. [Google Scholar] [CrossRef]
  9. Andrejiova, M.; Grincova, A.; Marasova, D. Identification with machine learning techniques of a classification model for the degree of damage to rubber-textile conveyor belts with the aim to achieve sustainability. Eng. Fail. Anal. 2021, 127, 105564. [Google Scholar] [CrossRef]
  10. Gunckel, P.V.; Lobos, G.; Kristjanpoller, F.; Bustos, R.M.; Godoy, D. Methodology proposal for the development of failure prediction models applied to conveyor belts of mining material using machine learning. Reliab. Eng. Syst. Saf. 2025, 256, 110709. [Google Scholar] [CrossRef]
  11. Guo, X.; Liu, X.; Królczyk, G.; Sulowicz, M.; Glowacz, A.; Gardoni, P.; Li, Z. Damage Detection for Conveyor Belt Surface Based on Conditional Cycle Generative Adversarial Network. Sensors 2022, 22, 3485. [Google Scholar] [CrossRef]
  12. Komorska, I.; Puchalski, A.; Bzinkowski, D. Localization of Conveyor Belt Damages Using a Deep Neural Network and a Hybrid Method for 1D Sequential Data Augmentation. Appl. Sci. 2025, 15, 6784. [Google Scholar] [CrossRef]
  13. Yuan, Y.; Li, Y.; Gao, B.; Bai, Y.; Wang, M.; Wang, H.; Zhou, L. Conveyor belt damage detection based on machine learning. J. Comput. Methods Sci. Eng. 2025, 25, 438–454. [Google Scholar] [CrossRef]
  14. Rzeszowska, A.; Jurdziak, L.; Błażej, R. Feasibility Study of Neural Network-based Classification of Conveyor Belt Damage Using Partial DiagBelt Data. Civ. Environ. Eng. Rep. 2025, 35, 313–325. [Google Scholar] [CrossRef]
  15. Liu, W.; Tao, Q.; Wang, N.; Xiao, W.; Pan, C. YOLO-STOD: An industrial conveyor belt tear detection model based on Yolov5 algorithm. Sci. Rep. 2025, 15, 1659. [Google Scholar] [CrossRef] [PubMed]
  16. Hu, Y.; Zhang, Y.; Shen, J.; Wang, G. Real-time conveyor belt damage detection method based on improved YOLO. Eng. Res. Express 2025, 7, 025513. [Google Scholar] [CrossRef]
  17. Wu, T.; Zhou, H.; Sun, K. Real-time damage detection network for mine conveyor belts based on knowledge distillation. Measurement 2025, 249, 116976. [Google Scholar] [CrossRef]
  18. Chen, Y.; Zhou, M.; Hu, F.; Wen, Y. A framework integrating multispectral imaging and deep learning for accurate detection of conveyor belt surface damage. Measurement 2025, 256 (Part C), 118353. [Google Scholar] [CrossRef]
  19. Pulcini, V.; Modoni, G. Machine learning-based digital twin of a conveyor belt for predictive maintenance. Int. J. Adv. Manuf. Technol. 2024, 133, 6095–6110. [Google Scholar] [CrossRef]
  20. Bujna, M.; Prístavka, M.; Lee, C.K.; Borusiewicz, A.; Samociuk, W.; Beloev, I.; Malaga-Toboła, U. Reducing the Probability of Failure in Manufacturing Equipment by Quantitative FTA Analysis. Agric. Eng. 2023, 27, 255–272. [Google Scholar] [CrossRef]
  21. Wang, L.; Li, B.; Zhao, X. Multi-objective predictive maintenance scheduling models integrating remaining useful life prediction and maintenance decisions. Comput. Ind. Eng. 2024, 197, 110581. [Google Scholar] [CrossRef]
  22. Bzinkowski, D.; Rucki, M.; Chalko, L.; Kilikevicius, A.; Matijosius, J.; Cepova, L.; Ryba, T. Application of Machine Learning Algorithms in Real-Time Monitoring of Conveyor Belt Damage. Appl. Sci. 2024, 14, 10464. [Google Scholar] [CrossRef]
  23. Ryba, T.; Rucki, M.; Siemiątkowski, Z. A Device for Strain Gauges Calibration. Polish Patent No. 245288, 21 June 2024. [Google Scholar]
  24. Ryba, T.; Rucki, M.; Siemiątkowski, Z.; Bzinkowski, D.; Solecki, M. Design and calibration of the system supervising belt tension and wear in an industrial feeder. Facta Univ. Ser. Mech. Eng. 2022, 20, 167–176. [Google Scholar] [CrossRef]
  25. Bzinkowski, D.; Ryba, T.; Siemiatkowski, Z.; Rucki, M. Real-time monitoring of the rubber belt tension in an industrial conveyor. Rep. Mech. Eng. 2022, 3, 1–10. [Google Scholar] [CrossRef]
  26. JCGM 100:2008; Evaluation of Measurement Data—Guide to the Expression of Uncertainty in Measurement. Bureau International des Poids et Mesures: Sèvres, France, 2008.
  27. Ryba, T.; Bzinkowski, D.; Siemiątkowski, Z.; Rucki, M.; Stawarz, S.; Caban, J.; Samociuk, W. Monitoring of Rubber Belt Material Performance and Damage. Materials 2024, 17, 765. [Google Scholar] [CrossRef]
  28. Wang, G.; Wang, Y.; Sun, H.; Yue, Q.; Zhou, Q. Study on Visual Detection Method of Multi-scale Damage to Conveyor Belt Under Complex Background. J. Fail. Anal. Prev. 2024, 24, 896–908. [Google Scholar] [CrossRef]
  29. Beyerer, J.; Richter, M.; Nagel, M. Pattern Recognition: Introduction, Features, Classifiers and Principles; De Gruyter: Berlin, Germany, 2018. [Google Scholar] [CrossRef]
  30. Fox, W.P.; Sturdivant, R.X. Probability and Statistics for Engineering and the Sciences with Modeling Using R; CRC Press: Boca Raton, FL, USA, 2023. [Google Scholar]
  31. Nowakowski, M. The ANOVA method as a popular research tool. Stud. I Pr. WNEiZ 2019, 55, 67–77. [Google Scholar] [CrossRef]
  32. Support Vector Machines for Binary Classification. Available online: https://uk.mathworks.com/help/stats/support-vector-machines-for-binary-classification.html (accessed on 28 August 2025).
  33. Verma, R.N.; Deo, R.; Srivastava, R.; Subbarao, N.; Singh, G.P. A new fuzzy support vector machine with pinball loss. Discov Artif Intell 2023, 3, 14. [Google Scholar] [CrossRef]
  34. Santhi, T.M.; Srinivasan, K. A Duo Autoencoder-SVM based Approach for Secure Performance Monitoring of Industrial Conveyor Belt System. Comput. Chem. Eng. 2023, 177, 108359. [Google Scholar] [CrossRef]
  35. Hao, X.; Liang, H. A multi-class support vector machine real-time detection system for surface damage of conveyor belts based on visual saliency. Measurement 2019, 146, 125–132. [Google Scholar] [CrossRef]
  36. Liu, J.; Fu, S.; Liu, F.; Cheng, X. Intelligent fault diagnosis of belt conveyor rollers using a polar KNN algorithm with audio features. Eng. Fail. Anal. 2025, 168, 109101. [Google Scholar] [CrossRef]
  37. Velasco-Loera, F.; Alcaraz-Mejia, M.; Chavez-Hurtado, J.L. An Interpretable Hybrid Fault Prediction Framework Using XGBoost and a Probabilistic Graphical Model for Predictive Maintenance: A Case Study in Textile Manufacturing. Appl. Sci. 2025, 15, 10164. [Google Scholar] [CrossRef]
  38. Ryba, T.; Bzinkowski, D.; Rucki, M. Method and device for supervision of the tension and wear of the conveyor rubber belts. Polish Patent Application No. P.447569, 22 January 2024. [Google Scholar]
Figure 1. Arrangement of the devices on the tail pulley in the conveyor belt monitoring system: (a) Schematic positions of the strain gauges and electronic unit; (b) photo of the electronic unit; (c) photo of the tail pulley with the rubber belt.
Applsci 15 10449 g001
Figure 2. Flowchart of the experimental research.
Applsci 15 10449 g002
Figure 3. Positions of the preset damages on the belt in relation to the strain gauges.
Applsci 15 10449 g003
Figure 4. Example of signal patterns related to the damages: (a) registered sequences from three strain gauges, T1, T2, and T3; (b) signal combinations for each of three damages, UW I, UW II, and UW III. The measurement was made at the pulley rotational speed 159 rpm.
Applsci 15 10449 g004
Figure 5. Effect of the belt speed on the signal patterns related to the damages: (a) UW I; (b) UW II; (c) UW III.
Applsci 15 10449 g005
Figure 6. Examples of signal patterns related to the set of five damages: (a) The pulley rotational speed 159 rpm; (b) rotational speed 540 rpm.
Applsci 15 10449 g006
Figure 7. Rating of six most significant features.
Applsci 15 10449 g007
Figure 8. Performance of the tested algorithms.
Applsci 15 10449 g008
Figure 9. Separating hyperplane and margin in Support Vector Machines (SVM) algorithm.
Applsci 15 10449 g009
Figure 10. Scatterplot for the features T1 Mean Square and T2 Standard Deviation.
Applsci 15 10449 g010
Figure 11. Scatterplot for the features T1 Mean and T2 Max.
Applsci 15 10449 g011
Figure 12. Scatterplot for the features T2 Mean Square and T2 Mean.
Applsci 15 10449 g012
Figure 13. The parallel coordinates plot for the Cubic SVM model.
Applsci 15 10449 g013
Table 1. The speeds used in experiments.
No.Pulley Rotational Speed n, rpmBelt Linear Speed V, m/s
1800.25
21590.50
33181.00
45201.60
Table 2. Description of the preset damages.
Stage of ExperimentDamage DenotationDirectionLength, mmDepthPosition
1UW ILongitudinal50Crosscut170 mm from the belt edge
UW IILongitudinal70Crosscut175 mm from the belt edge
UW IIILongitudinal451.0175 mm from the belt edge
2UW IVLongitudinal501.5115 mm from the belt edge
UP ITransverse10Crosscut170–180 mm from the belt edge
Table 3. Statistics of the signals from the strain gauges T1, T2, and T3 for 20 repetitions, ADU.
StatisticsStrain GaugeBelt with no DamageBelt with 3 Damages Belt with 5 Damages
Mean x ¯ T1807.4987.41392.4
T2340.9407.3648.8
T3729.8767.3862.7
MinT1473.0485.0664.0
T2209.0144.0198.0
T3552.0598.0592.0
MaxT11511.02594.03398.0
T2848.01525.03432.0
T31147.01411.01603.0
Mean square XmsT1748.2886.81378.7
T2315.7378.0711.8
T3666.4679.4842.7
Std. dev. σT1166.0207.3325.5
T264.7139.1350.7
T3100.295.8141.1
Kurtosis XkurtT1–0.61.72.4
T22.04.210.4
T30.40.40.6
Table 4. Results achieved by different ML algorithms.
AlgorithmClassification AccuracyNumber of Erroneously Classified Cases
Quadratic SVM100.00%0
Cubic SVM100.00%0
Ensemble Subspace Discriminant100.00%0
Linear SVM98.33%1
Medium Gaussian SVM98.33%1
Fine KNN98.33%1
Medium KNN98.33%1
Cubic KNN98.33%1
Weighted KNN98.33%1
Wide Neural Network98.33%1
Bilayered Neural Network98.33%1
Trilayered Neural Network98.33%1
SVM Kernel98.33%1
Logistic Regression Kernel98.33%1
Gaussian Naive Bayes96.67%2
Efficient Linear SVM95.00%3
Narrow Neural Network95.00%3
Medium Neural Network95.00%3
Efficient Logistic Regression91.67%5
Cosine KNN90.00%6
Kernel Naive Bayes 88.33%7
Fine Gaussian SVM70.00%18
Disclaimer/Publisher’s Note: The statements, opinions and data contained in all publications are solely those of the individual author(s) and contributor(s) and not of MDPI and/or the editor(s). MDPI and/or the editor(s) disclaim responsibility for any injury to people or property resulting from any ideas, methods, instructions or products referred to in the content.