Article

Node Classification of Imbalanced Data Using Ensemble Graph Neural Networks

1
Information Engineering College, Suqian University, Suqian 223800, China
2
Guangxi Key Laboratory of Trusted Software, Guilin University of Electronic Technology, Guilin 541004, China
Appl. Sci. 2025, 15(19), 10440; https://doi.org/10.3390/app151910440
Submission received: 11 August 2025 / Revised: 10 September 2025 / Accepted: 19 September 2025 / Published: 26 September 2025

Abstract

In real-world scenarios, many datasets suffer from class imbalance. For example, on online review platforms, the proportion of fake and genuine comments is often highly skewed. Although existing graph neural network (GNN) models have achieved notable progress in classification tasks, their performance tends to rely on relatively balanced data distributions. To tackle this challenge, we propose an ensemble graph neural network framework designed for imbalanced node classification. Specifically, we employ spectral-based graph convolutional neural networks as base classifiers and train multiple models in parallel. We then adopt a bagging ensemble strategy to integrate the predictions of these classifiers and determine the final classification results through majority voting. Furthermore, we extend this approach to fake review detection tasks. Extensive experiments conducted on imbalanced node classification datasets (Cora and BlogCatalog), as well as fake review detection (YelpChi), demonstrate that our method consistently outperforms state-of-the-art baselines, achieving significant gains in accuracy, AUC, and Macro-F1. Notably, on the Cora dataset, our model improves accuracy and Macro-F1 by 3.4% and 2.3%, respectively, while on the BlogCatalog dataset, it achieves improvements of 2.5%, 1.8%, and 0.5% in accuracy, AUC, and Macro-F1, respectively.

1. Introduction

Class imbalance is a common phenomenon across various domains, for instance, in online comment platforms, where genuine reviews substantially outnumber fraudulent ones. With the rapid expansion of the internet services industry, users now engage in diverse activities such as online shopping, product purchases, and accommodation booking. Applications like Dianping, Meituan, and Taobao have greatly facilitated daily life. Nevertheless, this convenience also gives rise to numerous fraudulent behaviors, including fake online reviews. The YelpChi dataset [1], widely used for fake review detection, consists of authentic online comments, of which 14.5% are fraudulent, thereby forming an imbalanced dataset. In practical applications, imbalanced class distributions are pervasive and pose significant challenges, as seen in credit card fraud detection [2,3], medical diagnosis [4], and beyond. Similar issues exist in graph-structured datasets; for example, in the BlogCatalog dataset, 14 categories contain fewer than 100 samples, while 8 categories exceed 500, clearly demonstrating a severe imbalance. Therefore, addressing node classification under class imbalance in graph data is of considerable importance.
In recent years, methods for detecting fake reviews have transitioned from traditional machine learning algorithms and neural network techniques to deep learning-based classification approaches [5]. Nonetheless, these methods assume that samples are independently and identically distributed. In reality, various entities exhibit intricate correlations, often characterized by rich behavioral interactions. These interactions can be represented as graph-like data, where graph-structured data efficiently capture and convey multifaceted relationships between distinct samples, offering diverse information for node classification. Moreover, graph data are inherently irregular, posing a challenge for traditional deep learning methods that primarily deal with structured data, thereby struggling to harness the wealth of information encapsulated in node and edge relationships within graph data. Consequently, employing graph neural networks to address imbalanced data is a promising research direction.
With the rise in graph neural networks (GNNs), graph representation learning has advanced quickly. Semi-supervised node classification has become a standard benchmark on which GNNs perform strongly. Representative models highlight complementary design choices: GCNs apply first-order localized spectral filters, while GraphSAGE aggregates features in the spatial domain and scales across diverse topologies. Nevertheless, most studies assume class balance. In many real datasets, labels are scarce and minority classes are under-represented, especially in semi-supervised settings, so the loss is dominated by majority classes, biasing the model and hurting predictions for rare categories. Managing class imbalance, therefore, remains a key challenge for GNN-based node classification.
While significant research has addressed imbalanced classification in traditional data, the study of imbalanced problems within graph neural network algorithms remains relatively limited. DRGCN [6], an early work in tackling class imbalance on graphs, introduces a class-conditional adversarial regularizer and a latent N-distribution regularizer. However, its scalability to large graphs is limited. GraphSMOTE [7] extends SMOTE [8] to the graph domain by training edge generators to introduce new synthetic nodes with relational information from SMOTE. Nonetheless, computing similarities between all node pairs and pre-training edge generators can be computationally intensive. Furthermore, a single model struggles to accurately predict rare and minority points on imbalanced datasets, leading to overall limited performance.
To mitigate these issues, we present an ensemble GNN framework for class-imbalanced node classification. Following a bootstrap-aggregating (bagging) strategy, we train several independent base models concurrently, and combine their outputs through majority voting to determine the final label. We also construct three relation-specific graphs from the YelpChi dataset https://www.datafountain.cn/datasets/5787 (accessed on 25 Marth 2023) and apply the framework for fake-review detection under class-imbalanced conditions.
Our key contributions can be summarized as follows:
(1)
First, we propose an ensemble graph-neural approach tailored to class-imbalanced node classification. By randomly undersampling majority-class samples, multiple balanced training subsets are created. Several GCN base classifiers are trained in parallel, and their predictions are aggregated through a majority voting scheme.
(2)
We build an online comment relational graph and perform fake-review detection using graph convolutional networks. The framework explicitly tackles the challenge of imbalanced class distributions within graph data, reducing the tendency of traditional GCNs to favor majority classes.
(3)
We conduct the framework’s effectiveness across two different types of tasks (node classification and fake review detection) and three real-world datasets, consistently demonstrating performance improvements.

2. Related Work

We group prior studies into two strands: (i) methods for handling class imbalance and (ii) GNN-based approaches for imbalanced node classification.

2.1. Imbalanced Data

Class imbalance widely exists in real-world applications and has remained a fundamental challenge in machine learning [9,10]. Remedies are commonly divided into two families. Data-level strategies manipulate the training set, e.g., undersampling [11,12] or oversampling [13].
Within data-level methods, SMOTE [8] improves upon naive random oversampling by synthesizing minority examples: for each minority sample, K nearest neighbors are located, and synthetic instances are created by interpolating along the connecting line segments. This approach increases minority coverage but can also introduce class overlap because each seed generates an equal number of synthetic points. Numerous variants alleviate this issue. Borderline-SMOTE [14] concentrates generation near decision boundaries; Simplicial SMOTE [15] refines SMOTE outputs using rough-set selection, and generates synthetic data within a controlled region around each seed; QDGS [16] allocates more synthetic points to difficult-to-learn minority samples based on local density.
Random undersampling balances the sample ratio by discarding instances from the majority class. Kumar [17] introduced an undersampling approach based on k-nearest neighbors, known as KNN-Near Miss. To tackle data imbalance, several researchers have presented cluster-based undersampling methods. KSS combines k-means with stratified random sampling for undersampling, while KMD integrates k-means and Manhattan distance for undersampling.
On the other hand, some researchers mitigate class imbalance by employing reweighting techniques that assign different weights to each class. For instance, Cui et al. [18] introduced a novel representation for data overlapping and employed a model and loss-agnostic approach to calculate the effective number of samples. They introduced an inversely proportional effective sample count and a class balance reweighting term in the loss function, thus designing a more effective class-balanced loss. Lin et al. [19] redefined the standard cross-entropy loss from the perspective of handling class imbalance and assigned lower loss weights to correctly classified samples. Li et al. [20] proposed an improved technique that reduces the weight of samples with extremely small or large gradients, and they adjust sample weights according to the gradient distribution, effectively addressing class imbalance and outliers.
Single classifiers often fail to capture rare patterns, so their performance degrades on skewed datasets. In such settings, ensembles are typically more robust. Classical strategies include bagging, boosting, and stacking. Bagging [21] trains multiple base learners on bootstrap samples (sampling with replacement) in parallel and aggregates their predictions, usually by majority vote; random forest is a canonical example. Boosting trains learners sequentially: it begins with uniform weights, then increases the weight of misclassified instances so later learners focus on hard cases; combining these weak learners yields a strong model [22], with AdaBoost [23] and XGBoost as well-known realizations. Stacking [24] performs hierarchical model fusion by fitting a meta-learner on the out-of-fold (or held-out) predictions of base models. While this can improve accuracy, it also raises the risk of overfitting if regularization and validation are not carefully handled.
Existing imbalanced node classification methods suffer from several major limitations. Firstly, traditional graph neural network architectures (e.g., GCN and GAT) tend to rely excessively on samples from the majority class in training, which leads to weaker recognition performance for minority classes. Secondly, although some methods like GraphSMOTE attempt to alleviate the imbalance issue by synthesizing minority class samples, they fail to adequately capture the local and global structural information of the graph when generating new nodes, while the synthesis process also incurs high computational costs.
Moreover, although some methods employing regularization mechanisms (such as DRGCN) improve model stability to some extent [25,26], adversarial training-based frameworks are prone to overfitting on minority classes, thereby weakening the model’s generalization ability on unseen data. Lastly, some methods, such as those based on generative adversarial networks (GANs), are difficult to scale to large graph data due to their high computational complexity and memory requirements, limiting their practicality in real-world applications.
In imbalanced graph data, common category types typically correspond to those in the real world that [27,28], despite having scarce samples, are of high value or high risk. For instance, in the field of fraud detection, such categories may include fake reviews, fraudulent users, and anomalous transactions; in medical diagnosis, they often involve the identification of rare diseases or abnormal physiological states; in social network environments, niche interest groups or users with anomalous behaviors become key categories; in academic networks, researching niche fields or high-impact papers also constitutes typical minority classes. Although these categories have limited data volume, they hold significant identification importance and practical value in specific applications.

2.2. Imbalanced Node Classification Methods Based on GNN

GNNs operate natively on graphs, and node classification is a canonical task achieved by aggregating multi-hop neighborhood information to learn node representations and predict labels [29,30]. Class imbalance occurs when the majority class vastly outnumbers the minority class.
A growing line of work adapts GNNs to this setting [31,32,33,34,35]. DRGCN [36] employs conditional adversarial regularization together with distribution-alignment training to balance class-wise features, but GAN-style training can overfit minority nodes and hurt generalization. GraphSMOTE [7] first builds an embedding space to measure inter-node similarity, then synthesizes minority nodes and edges to form balanced graphs; the procedure is computationally expensive and only partially exploits semantic cues and local/global structural information.
Other strategies include generative and sampling approaches. ImGAGN [37] creates synthetic minority nodes that mimic attribute and topology distributions to equalize class sizes. PC-GNN [38] uses a label-balanced sampler to construct training subgraphs and a neighborhood selector for each node, followed by aggregation across relations to obtain final representations. GraphMixup [39] mixes samples/structures to regularize training and improve performance under class imbalance.
In particular, Li et al. [40] introduced the re-weighted adversarial graph convolutional network (RAGCN), which automatically and dynamically weights samples for each class to address class imbalance, enhance classification performance, and prevent overemphasizing any specific class. Sun et al. [41] proposed an ensemble model called AdaGCN, which uses graph convolutional networks (GCN) as the base estimator in the adaptive boosting process. In AdaGCN, higher weights are assigned to instances misclassified by earlier learners so that subsequent models focus on hard cases; additionally, transfer learning reduces computational overhead and enhances generalization.
Furthermore, Hamilton et al. [42] proposed GraphSAGE, a spatial GNN for inductive inference. Instead of learning an embedding for every vertex, GraphSAGE learns parametric aggregators over fixed-size neighborhoods and combines the aggregated neighbor information with the node’s own attributes; a subsequent nonlinearity yields representations that generalize to unseen nodes. To improve scalability, Zeng et al. [43] introduced a graph-sampling paradigm in which each mini-batch is a sampled subgraph; a full GCN is executed on this subgraph at every iteration, and the outputs are fused, enabling efficient training on large graphs. In addition, GraphConsis [44] mitigates context, feature, and relation inconsistencies in heterogeneous GNNs, improving robustness on multi-relation data.
Unlike methods that directly modify the network architecture (e.g., DRGCN and GraphSMOTE) or employ cost-sensitive learning, this paper proposes a lightweight and efficient solution from the perspective of training data resampling and model ensemble. This approach does not increase model complexity or rely on generative adversarial training, making it particularly suitable for large-scale graph data.

3. Methodology

In this section, we start by presenting the problem definition. Following that, we introduce the base classifier model based on GCN. Subsequently, we delve into the ensemble graph neural network model known as Bagging-GCN. Finally, we employ the Bagging-GCN model to detect fake reviews.

3.1. Problem Definition

We represent an attributed network as G = { V , A , F } , where V = { v 1 , , v n } denotes the set of nodes, A R n × n is the adjacency matrix, and F R n × d is the matrix containing node features. Each row F [ j , : ] R 1 × d corresponds to the feature vector of node v j , and d represents the number of features. In the dataset, V L represents the set of labeled nodes with corresponding labels Y L , while V U and Y U represent the set of unlabeled nodes and their (unknown) labels. The label space consists of m distinct classes, C = { C 1 , , C m } , where | C i | is the number of nodes in class i. The degree of class imbalance is measured using the imbalance ratio:
i r = min i ( | C i | ) max i ( | C i | ) .
This ratio measures how skewed the dataset is. Imagine two baskets of apples and oranges: if one basket has 100 apples and the other has only 10 oranges, the ratio is 10/100 = 0.110/100 = 0.110/100 = 0.1. A ratio close to 1 means the classes are balanced; closer to 0 means highly imbalanced.
Given an attributed graph G with imbalanced class distributions and labels for a subset V L , our goal is to develop a classifier f that maps ( V , A , F ) to Y while ensuring balanced performance across both majority and minority nodes, i.e., f ( V , A , F ) Y .

3.2. Base Classifier Model Based on GCN

Consider the input undirected graph G = { V , A , F } , where V = { v 1 , , v n } is the set of nodes, and A R n × n represents the sparse adjacency matrix. For any two nodes i and j, a i j = 1 if an edge exists, and 0 otherwise (note that A is symmetric for undirected graphs). Let D = diag ( d 1 , , d n ) denote the degree matrix, where d i = j a i j . Each node is associated with an F-dimensional feature vector, and stacking all nodes gives the feature matrix X R n × F .
Nodes update their knowledge by aggregating information from their neighbors, followed by applying a transformation (weights) and a filter (nonlinear activation). This process is analogous to a person forming an opinion after hearing from their friends, then refining it based on their own perspective.
We use a two-layer semi-supervised GCN as the base classifier, with layer-wise computation provided in Equation (2).
H ( l + 1 ) = σ ( Z ( l + 1 ) ) , Z ( l + 1 ) = A ^ H ( l ) W ( l ) ,
where A ^ = D 1 2 A D 1 2 is the symmetrically normalized adjacency matrix; H ( l ) R n × d l represents the input activation of layer l (with its j-th row being the d l -dimensional embedding of node v j ); W ( l ) denotes the learnable weight matrix for that layer; σ ( · ) is the elementwise nonlinearity (ReLU by default). The initialization uses the raw features, i.e., H ( 0 ) = X , as in Equation (3).
H ( 0 ) = X .
Given X and the normalized adjacency A ^ , the two-layer GCN is formulated as in Equation (4):
Z = softmax ( A ^ · ReLU ( A ^ X W ( 0 ) ) · W ( l ) ) .
Here, the process is applied twice; therefore, a node learns not only from its direct friends but also from its friends-of-friends. Finally, a softmax function is used to make a prediction, like choosing the most likely category from all possible ones.
GCN is trained via the backpropagation algorithm. The final layer utilizes the softmax function for classification and calculates the cross-entropy loss across all labeled nodes, as shown in Equation (5).
Loss = i = 1 N f = 1 F Y i F ln Z i F ,
where N denotes the number of training samples and F indicates the number of classes. This loss function measures the discrepancy between the model’s predictions and the actual labels. A smaller penalty is assigned when the predicted probability is closer to the true label.
The message passing in GCN involves aggregating neighboring features on the graph structure for message propagation. The two-layer GCN model enables message passing through two layers of neighborhoods.

3.3. Bagging-GCN Model

Class imbalance often leads models to favor the majority class, overlooking rare cases. We address this by undersampling the majority class and combining it with minority examples to create balanced training datasets, reducing the impact of class imbalance during learning. Since a single classifier still faces challenges with rare patterns, we adopt a bagging-based ensemble method over GCNs to enhance stability and predictive performance.
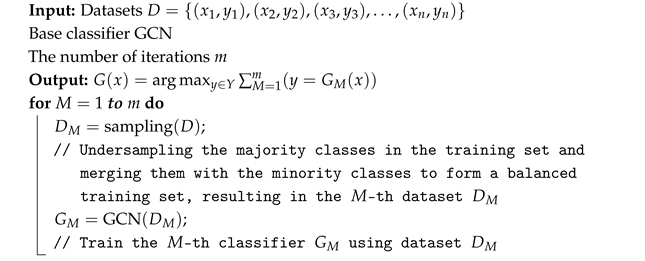
To this end, we propose Bagging-GCN, which integrates random sampling with parallel ensembling. The approach works as follows: (i) repeatedly generate M balanced subsets by undersampling the majority class while keeping all minority samples; (ii) train M GCN base learners (one for each subset) in parallel; (iii) aggregate the predictions through majority voting to determine the final label. The overall training pipeline is depicted in Figure 1.
While the base classifiers within the ensemble model utilize the same original dataset, the random sampling of the majority class data creates diversity across the datasets used for each base classifier’s training. This variation in training data leads to differences in classification capabilities among the base classifiers. By combining the classification outputs from these base classifiers, the final prediction category is determined. The goal of constructing an ensemble graph neural network (GNN) model is to reduce classification errors and improve the model’s ability to generalize. The implementation process is as follows:
(1)
Divide the dataset into training, validation, and test subsets following the experimental protocol.
(2)
On the training split, randomly undersample the majority class and merge it with all minority samples to obtain a balanced training subset; repeat this procedure M times to generate M distinct balanced training sets.
(3)
Train a GCN base classifier using each of the balanced training sets, resulting in M different GCN base classifiers.
(4)
Compose the M different GCN base classifiers into the Bagging-GCN ensemble classifier.
(5)
During prediction, input the samples from the test set into the GCN ensemble classifier. Based on the voting outcomes of the individual GCN base classifiers, the final predicted class of each sample is determined.
Throughout each iteration of the training process, train a base classifier with the corresponding training data. After M base classifiers have been trained in parallel, the output of the ensemble model is determined based on the voting results. The fundamental algorithm of the ensemble model is outlined in Algorithm 1.
Instead of training just one model that may be biased toward the majority class, we train several models, each on a different “balanced” view of the data. Think of it like asking multiple doctors for an opinion: each doctor sees a slightly different group of patients, and the final diagnosis is based on majority vote.
Algorithm 1: Bagging-GCN algorithm.
Applsci 15 10440 i001

3.4. Detecting Fake Reviews Using Bagging-GCN

Nowadays, people often refer to online reviews on platforms such as Yelp or TripAdvisor before making consumer decisions. However, driven by various interests, a significant number of fake reviews are generated, impeding people’s judgment. In light of this, we detect fake reviews on various review platforms or websites hold significant real-world implications, contributing to the creation of a fair business environment.
Reviews are treated as “people” in a social network, where links connect them if they share the same user, product, or time period. By analyzing these networks, the model can spot unusual patterns that indicate fake reviews, much like identifying suspicious cliques in a community.
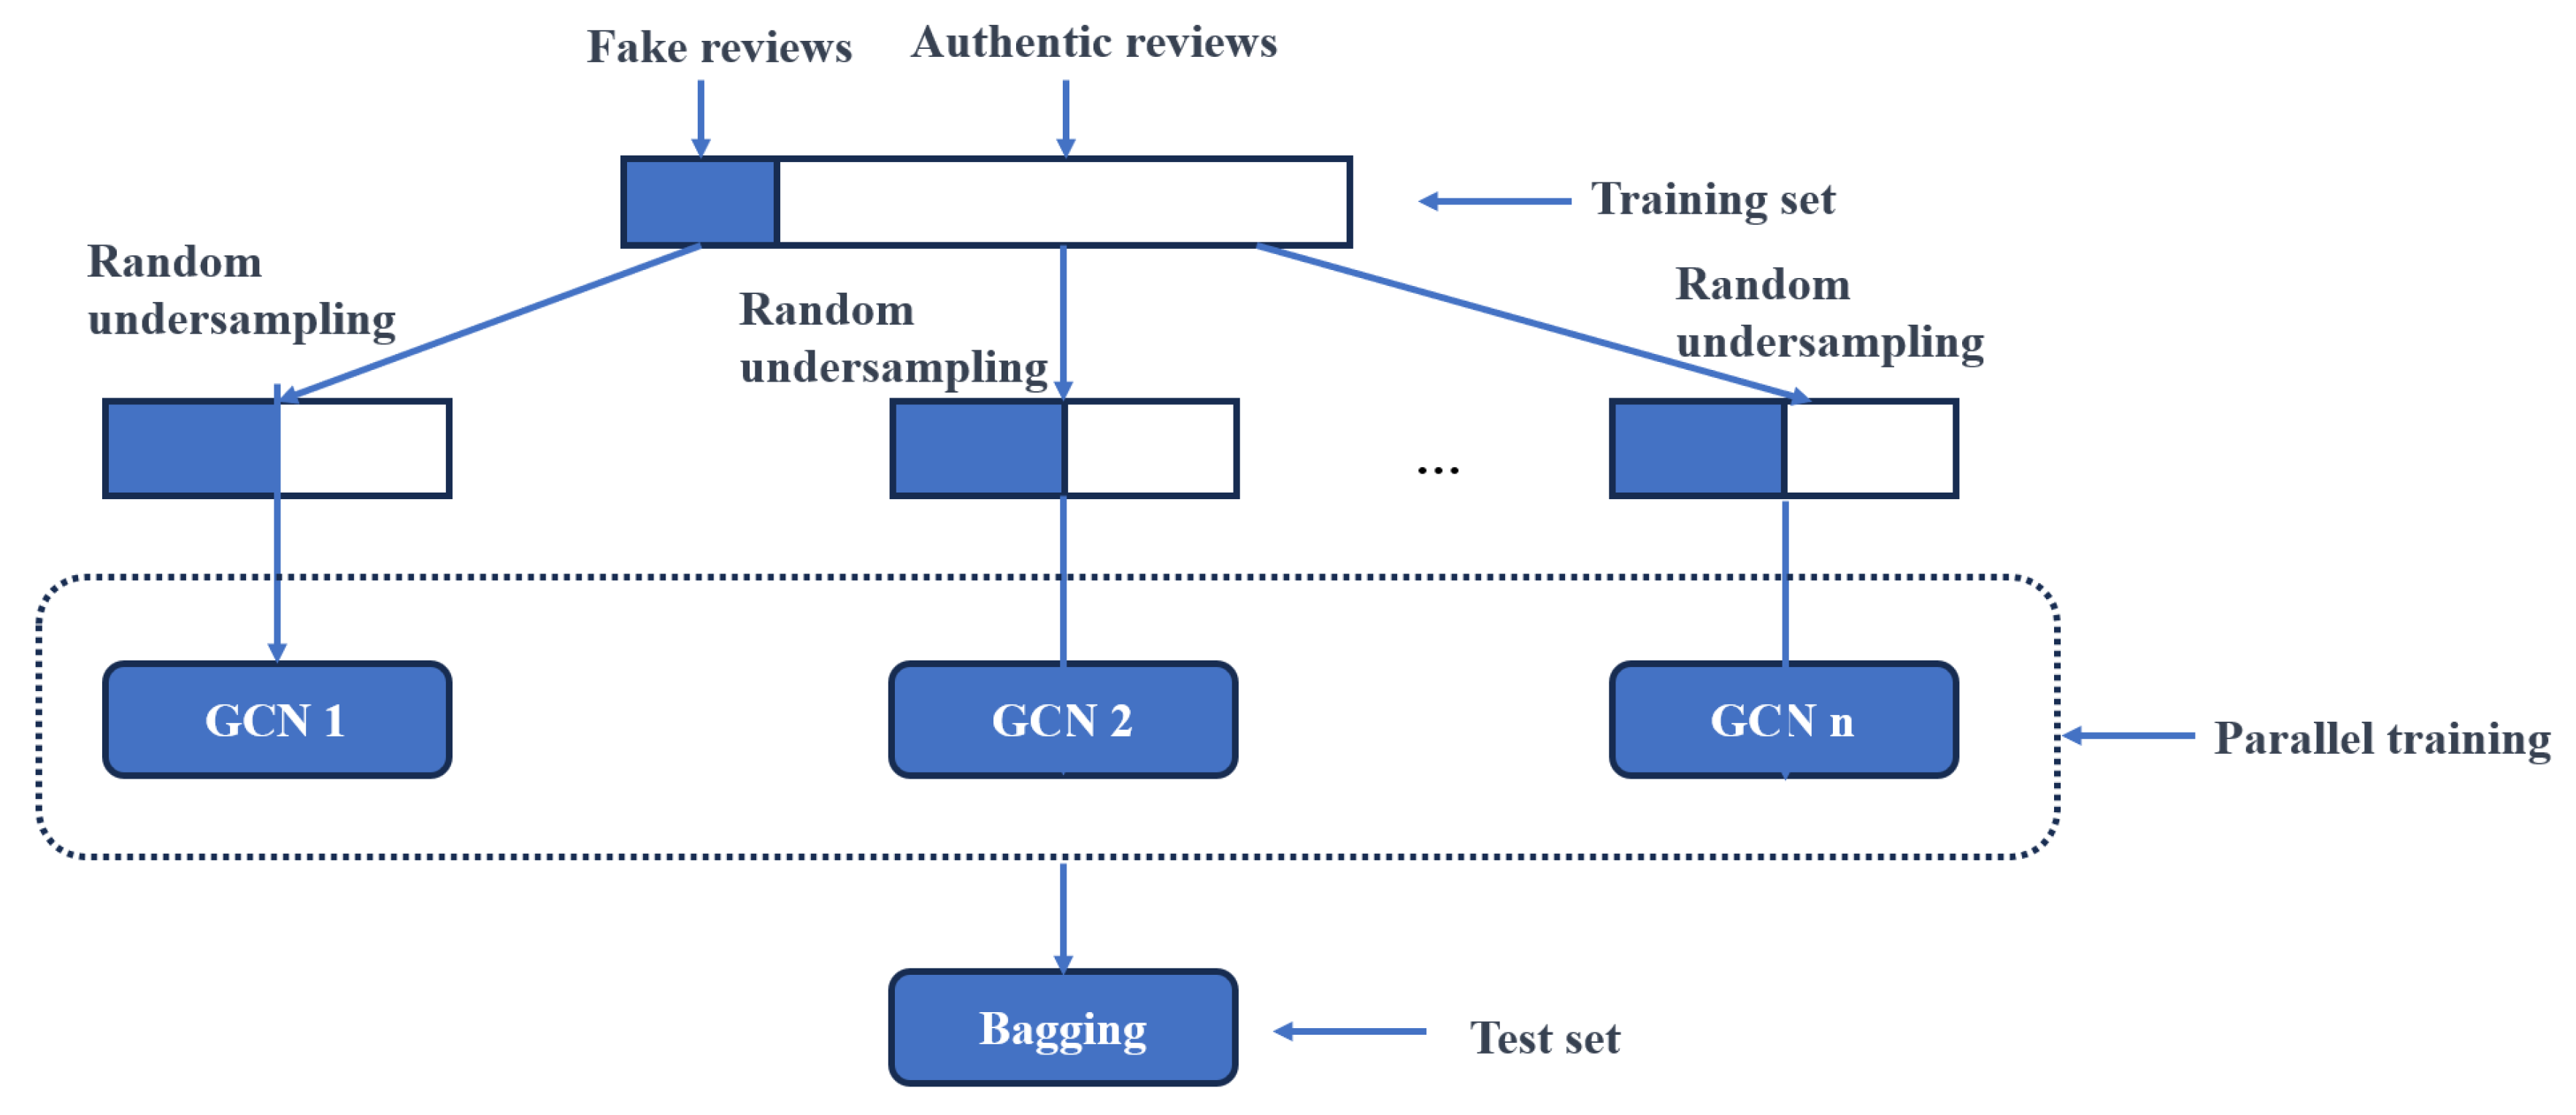
To tackle the problem of data imbalance in graph neural networks, we propose an ensemble graph neural network model for imbalanced node classification. Initially, authentic reviews are randomly undersampled and merged with fake review data to create a training set. This process is repeated several times, resulting in distinct training sets. Multiple base classifiers are then trained in parallel, and the final predictions are combined using the Bagging ensemble method. Each training process operates independently on different subsets of samples, and the prediction set is used to assess the classification accuracy of the final ensemble model. Bagging-GCN is employed to detect fake reviews, and the process is shown in Figure 2.
In the Bagging-GCN approach, each review is represented as a node in a graph. Subgraphs are formed based on three different relationships within the online review dataset, and these subgraphs are merged. The combined data are then fed into our proposed classification model. Finally, a combination of random undersampling and parallel training using ensemble learning techniques is utilized to predict the classification of target nodes. The specific steps of the Bagging-GCN are as follows:
(1)
Preprocess the original online review dataset, standardizing all features to improve classification performance in subsequent classifiers.
(2)
Represent each review as a node and combine three relation-specific subgraphs derived from the dataset: R–U–R, R–S–R, and R–T–R.
(3)
Perform a stratified split of the processed data into training, validation, and test sets with a 40 % / 20 % / 40 % distribution for each class.
(4)
Due to class imbalance, the resulting training set is skewed. Apply random undersampling to the genuine review samples and combine them with fake review samples to form a balanced training set, improving the training of models and their classification performance.
(5)
Train the training set using GCN-based base classifiers. Optimize the base classification model using gradient descent and backpropagation.
(6)
Repeat step 4 to obtain multiple distinct training sets. Train GCN-based base classifiers in parallel on these sets to independently extract and learn data features.
(7)
Integrate multiple base classifiers into a strong classifier. Aggregate the predictions from various base classifiers using majority voting to obtain the final prediction.
(8)
Evaluate the proposed Bagging-GCN based on the final prediction results.

4. Experimental Evaluation

We first outline the datasets used in our study, then specify the evaluation metrics for imbalanced node classification. Next, we report comparative experiments and analysis, and finally, we present a case study on fake review detection.

4.1. Datasets

4.1.1. Node Classification Datasets

We evaluate on two widely used benchmarks, Cora and BlogCatalog. A brief summary is provided below.
Cora is a citation network where nodes represent papers, and edges represent citation relationships. The graph consists of 2708 nodes from 7 research domains, 5429 edges, and a 1433-dimensional bag-of-words feature vector for each node. The original labels are nearly balanced. To introduce imbalance, we randomly select three classes as minority classes and classify the rest as majority classes. For training, each majority class contributes 20 nodes, while each minority class contributes 20 × IR nodes (with the default imbalance ratio IR = 0.5 ). We reserve 500 nodes for validation and evaluate the model using a test set of 1000 labeled nodes.
BlogCatalog is a social network graph with 10,312 user nodes, 38 categories, and 333,983 edges. Since raw node attributes are unavailable, we compute 64-dimensional DeepWalk embeddings and use them as features. The labels are highly imbalanced: 14 classes contain fewer than 100 instances, while 8 classes have more than 500. We apply a stratified split of 25%/25%/50% per class for training, validation, and testing, respectively.

4.1.2. Fake Review Detection Dataset

The fake review detection dataset used in our study is based on real-world online review data from the Yelp website. The YelpChi dataset consists of reviews for hotels and restaurants in the Chicago area. We carry out the fake review detection classification task on this dataset, where 14.5% of the reviews are labeled as fake, and the remaining reviews are considered genuine. This dataset exhibits an imbalanced distribution.
To manage computational complexity, we filtered out products with more than 800 reviews. The preprocessed dataset consists of 29,431 users, 182 products, and 45,954 reviews. Fake reviews are associated with users, products, and timestamps. We treat each review as a node in the graph, with the initial features for each node being the embedded representation of the review text using Word2Vec. Each review was embedded into a 100-dimensional vector using the standard skip-gram model implemented in gensim. We trained Word2Vec on the raw YelpChi review texts with the following parameters: window size = 5, negative sampling = 5, minimum word count = 5, and training epochs = 10.
The 100-dimensional review embeddings were further reduced to 32 dimensions using the SPEAGLE framework with default hyperparameters (number of layers = 2, latent dimension = 32, learning rate = 0.001, and training epochs = 200).
We define three relation types: R–U–R links reviews authored by the same user; R–S–R connects reviews for the same product with identical star ratings; R–T–R links reviews of the same product posted within the same month. The combination of these relations forms the complete graph. Summary statistics for the YelpChi dataset are presented in Table 1, where “Node” refers to the number of vertices, and “Edge” indicates the number of edges.

4.2. Evaluation Metrics

(1)
Confusion Matrix
The confusion matrix (also known as the error matrix) compares predicted labels with the ground truth. For the binary fake review task, it records the counts of true/false positives and true/false negatives. Its standard layout is shown in Table 2.
(2)
Accuracy (Acc)
Accuracy is the proportion of correctly classified instances in the test set:
Acc = T P + T N T P + F P + F N + T N .
(3)
F1 Score
The F1 score combines precision and recall via their harmonic mean:
F 1 = 2 × Precision × Recall Precision + Recall .
Here, precision is the proportion of predicted positives that are correct, and recall is the proportion of actual positives that are retrieved:
Precision = T P T P + F P , Recall = T P T P + F N .
Macro-F1 computes the F1 score for each class and then averages them. Due to its calculation method, which is more favorable to minority class samples, Macro-F1 is commonly used as an evaluation metric for imbalanced data classification.
(4)
AUC
The area under the receiver-operating characteristic curve (AUC) provides a scalar summary of classifier performance by integrating the ROC curve, which plots the true-positive rate versus the false-positive rate. For effective classifiers, AUC generally ranges from [0.5, 1], with higher values indicating better performance. Since the ROC curve is itself a curve and difficult to compare across models, especially in multi-class settings, we report AUC as a more concise, comparable metric.

4.3. Experiments on Imbalanced Node Classification

4.3.1. Experimental Setup

For the imbalanced node classification experiments, we used an ensemble of 7 base learners. Each base learner is a two-layer GCN configured with learning rate 0.01 , weight decay 5 × 10 4 (L2), 16 hidden units, and dropout 0.5 . Models were optimized with Adam and trained to convergence with a cap of 5000 epochs. All experiments were run on a single workstation using PyTorch v2.8.0 and Python 3.8.
We evaluate methods with three metrics: accuracy (Acc), area under the ROC curve (AUC), and Macro-F1. Acc measures overall correctness on test nodes; AUC integrates the ROC curve (larger is better); Macro-F1 is the unweighted mean of per-class F1 scores and is well suited to imbalanced data.
To assess effectiveness, we compare our approach with eight baselines on Cora and BlogCatalog: GraphENS [45], Over-Sampling [14], Re-weight [28], SMOTE [8], Embed-SMOTE [46], RECT [47], DRGCN [6], and GraphSMOTE [7].

4.3.2. Experimental Results and Analysis

(1)
Comparison Between Bagging-GCN and Baseline Methods
Table 2 reports the results on Cora and BlogCatalog. We run each method ten times and report the mean to reduce randomness. Bagging-GCN consistently outperforms the competitors on Acc, AUC, and Macro-F1. Compared with the strongest baseline (GraphSMOTE), Bagging-GCN improves Acc and Macro-F1 by 3.4 % and 2.3 % on Cora; on BlogCatalog it yields gains of 2.5 % , 1.8 % , and 0.5 % in Acc, AUC, and Macro-F1, respectively. These results confirm the effectiveness of the proposed approach.
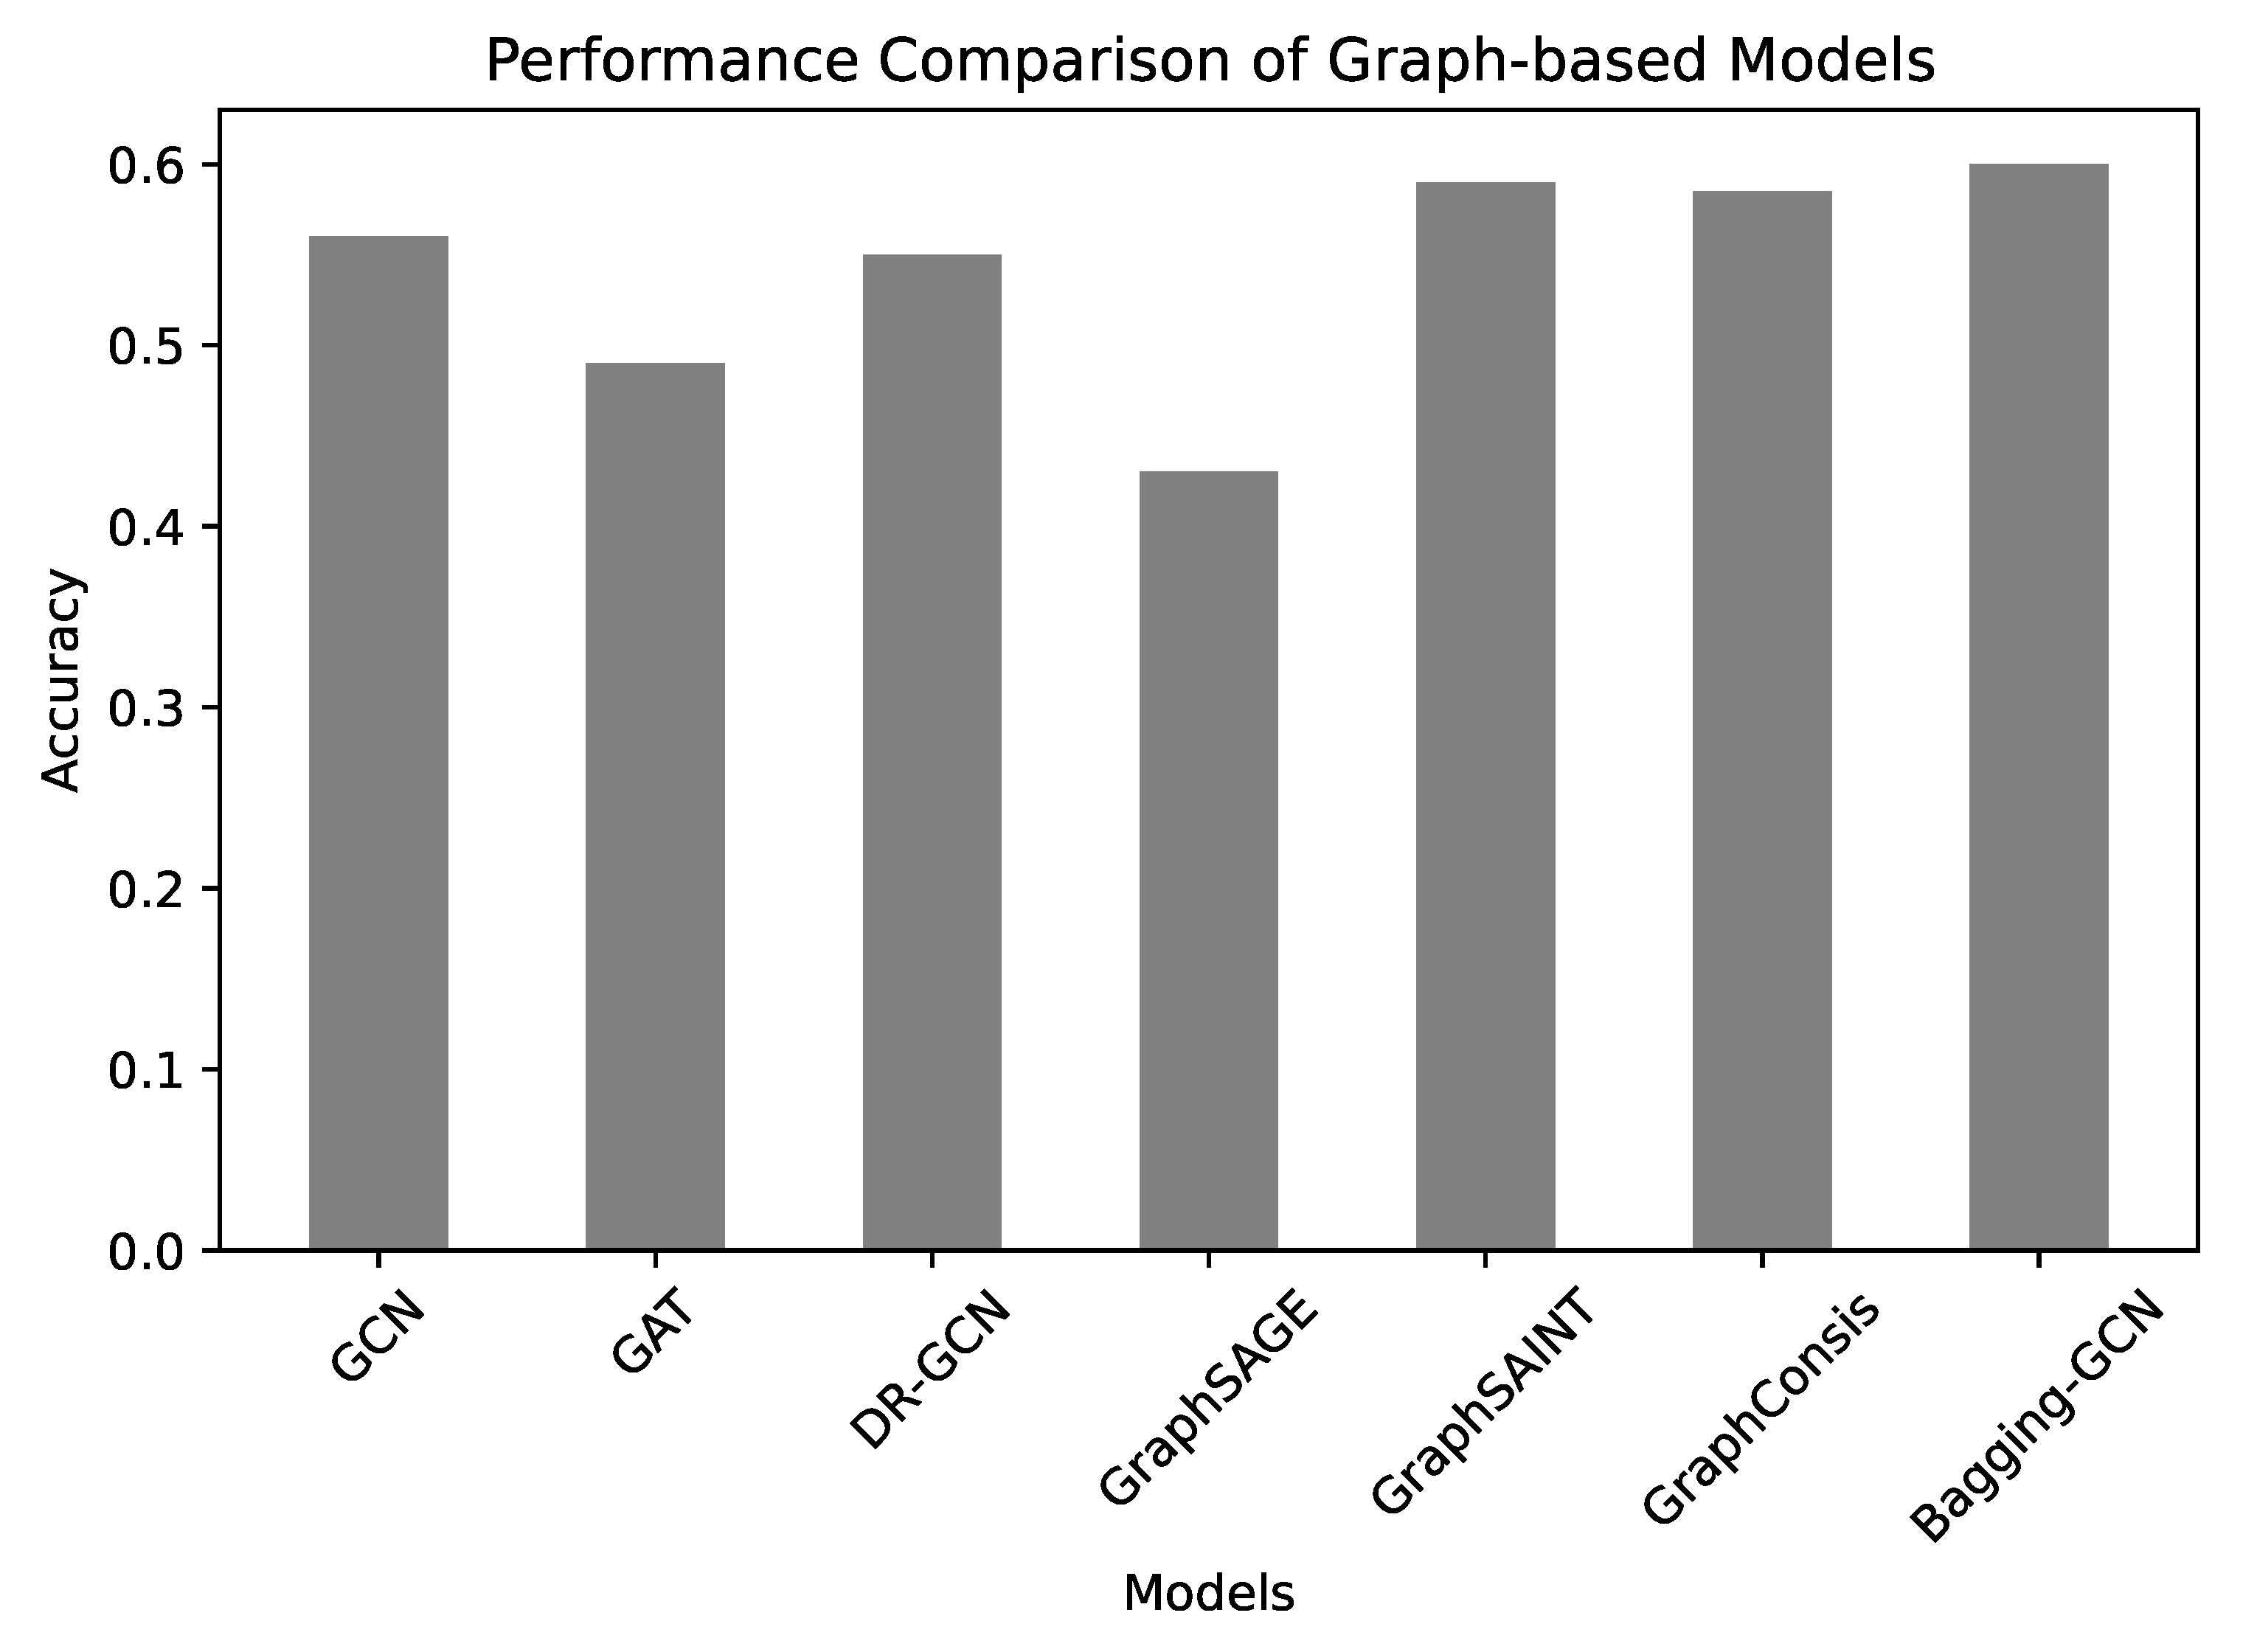
In the BlogCatalog dataset, there are 38 categories, 14 of which have fewer than 100 samples, and 8 categories have over 500 samples. This is a typical “long-tail distribution” problem. Under such conditions, even a naive random-guess model would achieve very low accuracy.
In the YelpChi fake review detection dataset, fake reviews account for only 14.5.
Therefore, the absolute accuracy values of all baseline models (including the most advanced methods currently available) on these datasets are relatively low. Our experimental results indicate that this reflects a challenge that has not yet been fully resolved in the research field, rather than a flaw of any specific model.
(2)
Impact of the Number of Base Classifiers
Table 3 studies the effect of the ensemble size by varying the number of base learners from 3 to 11. We adopt the same data splits as above and train each base GCN for 200 epochs; the table shows averages over ten runs. Performance improves as the ensemble grows, peaking at 7 base classifiers; beyond this point, accuracy degrades, likely due to overfitting and increased variance. Thus, the optimal ensemble size in our setting is 7.
We have converted the numerical data from Table 2 (performance comparison with baseline methods) and Table 3 (ablation study on the number of base classifiers) into two new and clear Figure 3a and Figure 3b. These bar and line charts provide an intuitive performance comparison across different methods and parameters.

4.4. Result on Fake Review Detection Dataset

For fake review detection, we evaluate on the complete YelpChi graph. We perform a stratified split of 40 % / 20 % / 40 % for training, validation, and test sets. For GraphSAINT [43], each mini-batch samples a subgraph with 5000 nodes; for GraphSAGE [48], the neighborhood fan-out is set to 5. Our Bagging-GCN model uses seven base learners. Each base learner is a two-layer GCN with a learning rate of 0.01 , weight decay of 5 × 10 4 (L2), 16 hidden units, and a dropout rate of 0.5. Models are optimized using Adam [49] and trained to convergence, with a maximum of 5000 epochs.
For the fake review detection experiments, we employed two evaluation metrics to assess the performance of all compared methods: AUC and Macro-F1. Since accuracy (Acc) may not fully capture classifier performance on datasets with imbalanced distributions, it was not used in these experiments. AUC represents the area under the ROC curve, with higher values indicating better performance. Macro-F1 is a widely used metric for imbalanced data classification, calculating the average of F1 scores for each class.
To demonstrate the effectiveness of our proposed model for fake review detection, we compared it against 6 baseline methods on the YelpChi dataset. These baseline methods include: GCN [50], GAT [51], DR-GCN [36], GraphSAGE [42], GraphSAINT [43], and GraphConsis [44].

Experimental Results and Analysis

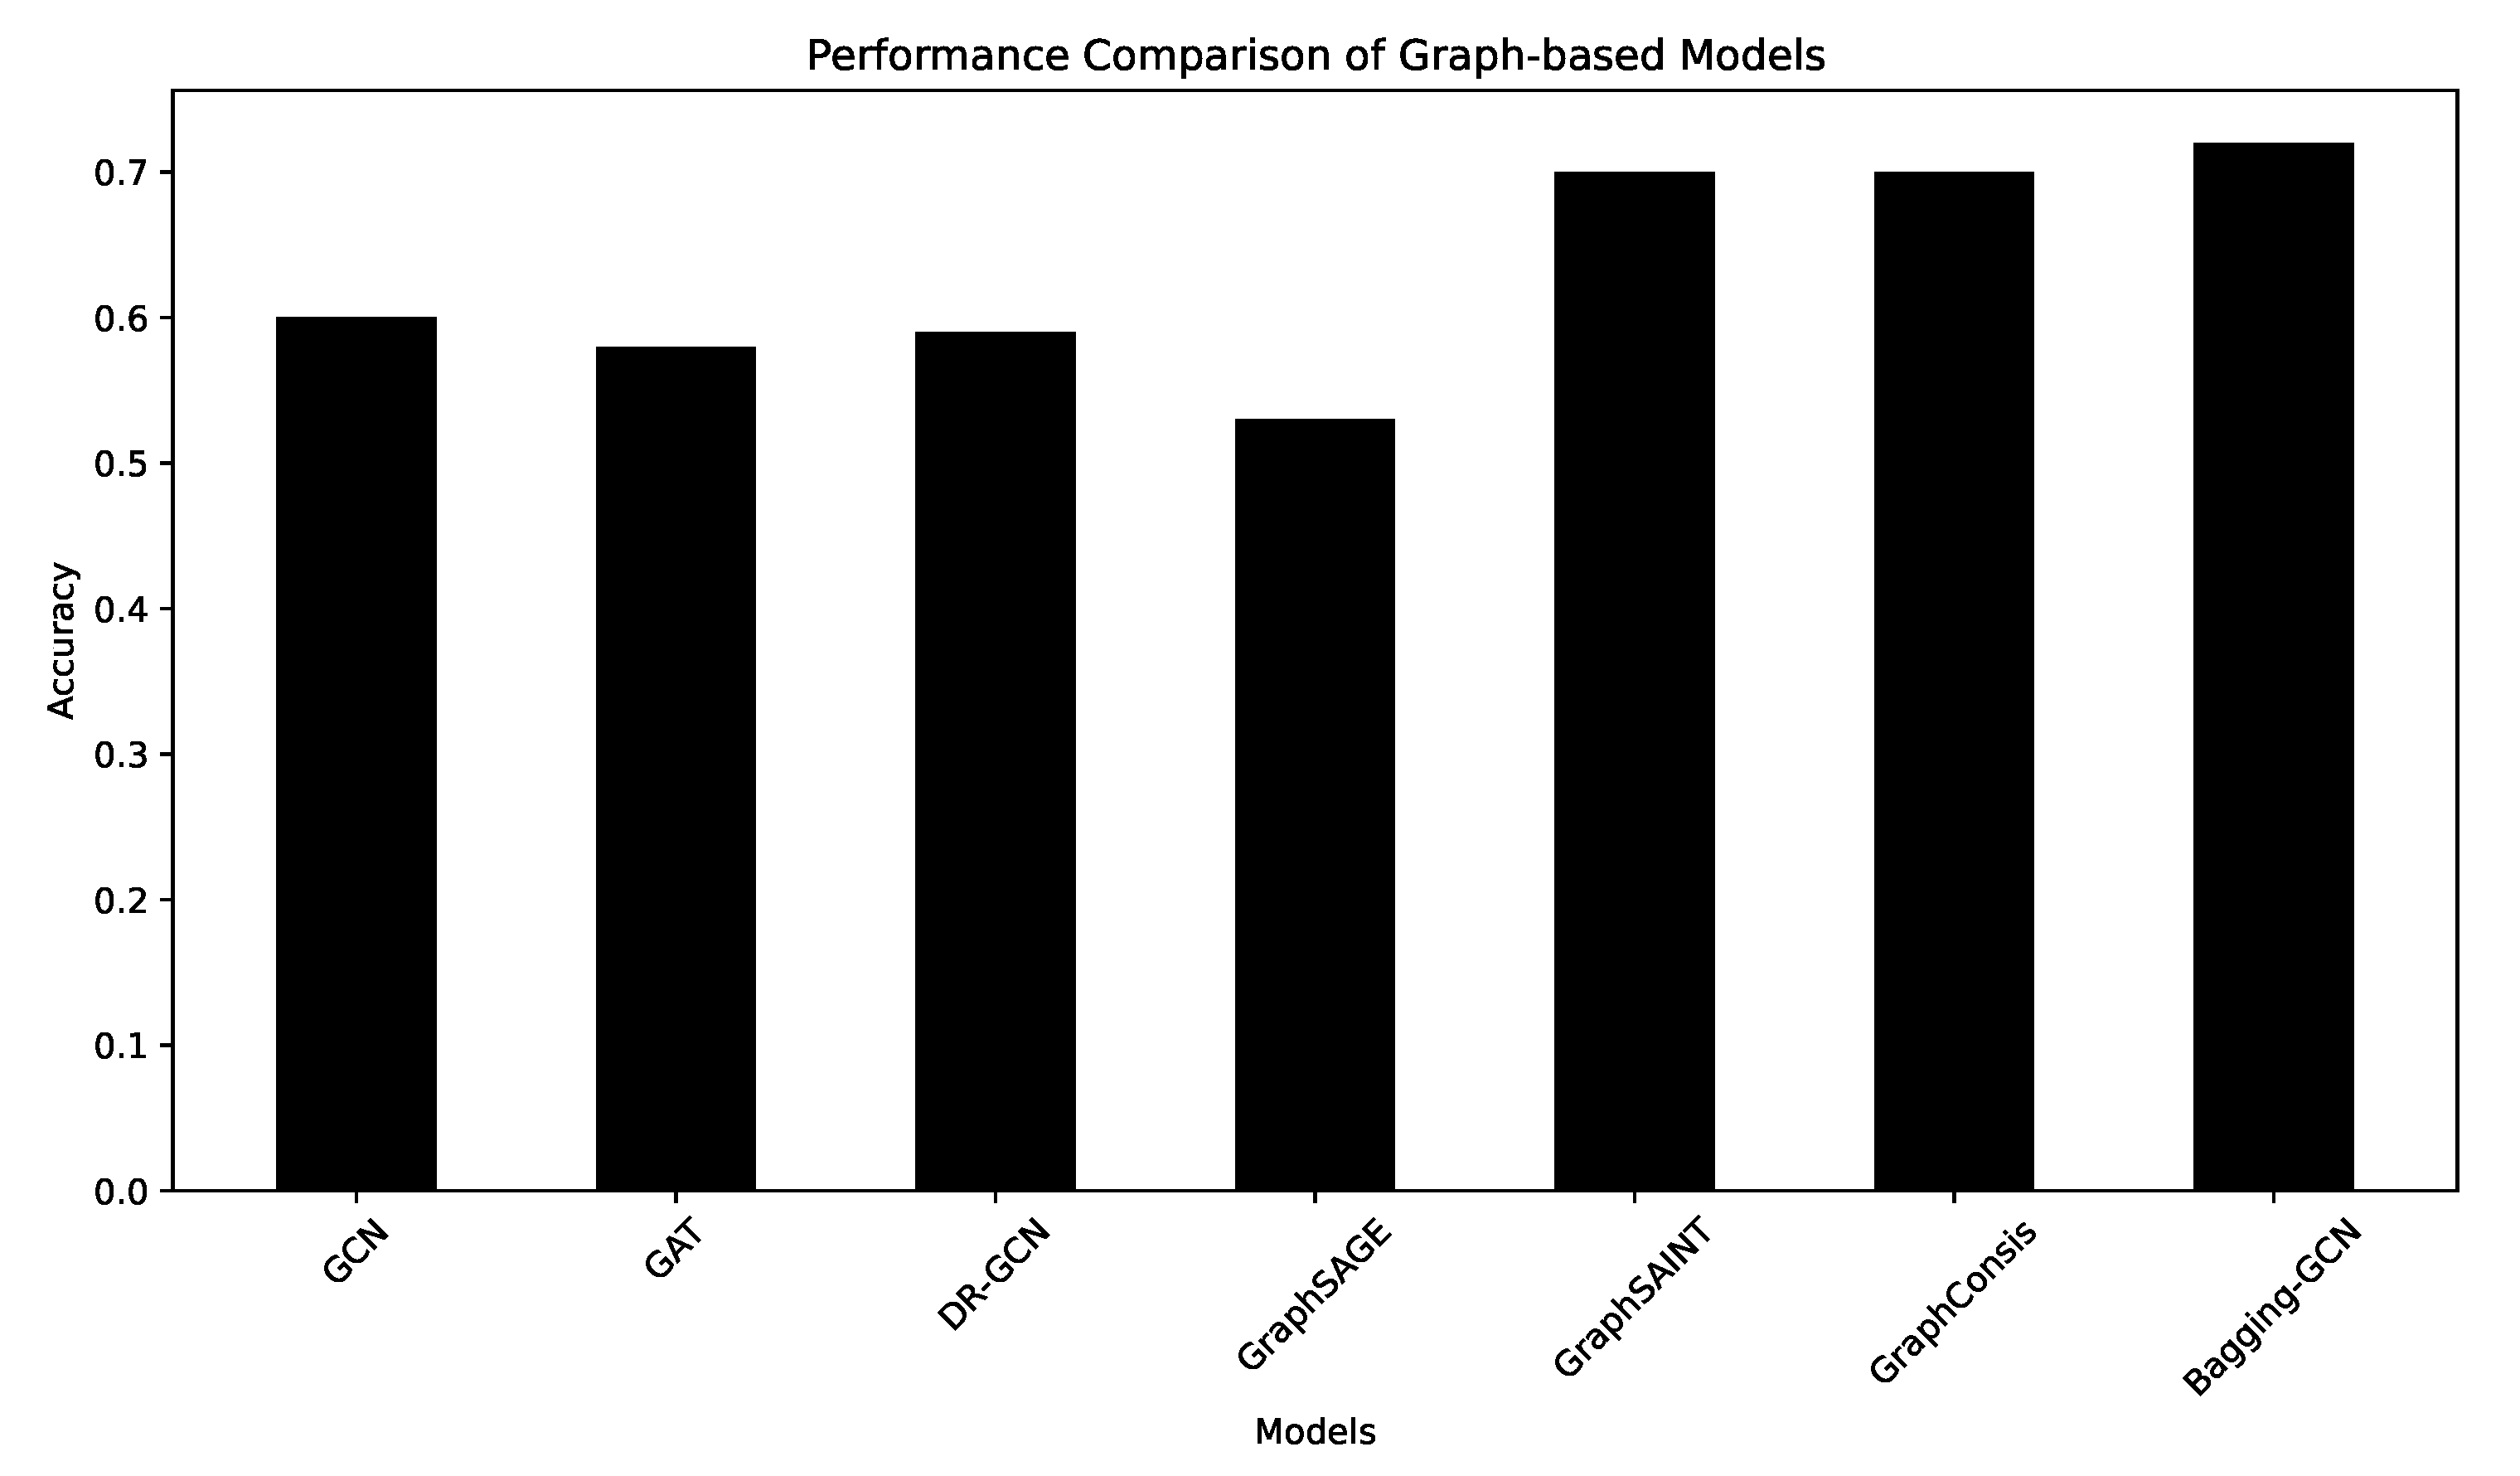
To assess the effectiveness of our model for fake review detection, we benchmark it against six baselines on the YelpChi dataset. Each setting is repeated ten times to reduce randomness. Figure 4 summarizes Macro-F1, and Figure 5 reports AUC.
From the results, Bagging-GCN consistently surpasses all competing methods on both metrics. Relative to GraphConsis, a strong fraud–detection approach that targets inconsistency, our ensemble yields gains of about 2%–3% in AUC and Macro-F1, indicating more reliable classification. GraphSAGE and GraphSAINT, typical sampling-based GNNs using node and graph sampling, respectively, do not account for label distribution during sampling, which limits their performance under imbalance. Moreover, GraphSAGE trails GraphSAINT because its fixed fan-out truncates large neighborhoods, causing information loss.
On the other hand, GCN, GAT, and DR-GCN are conventional graph neural network methods. DR-GCN is designed for multi-class imbalanced classification using a double-regularized GCN. In these benchmark methods, performance tends to be poorer for minority classes due to insufficient training on fewer samples. Among these, GAT performs the worst, as its attention mechanism has the highest number of parameters, but the minority class lacks enough data for effective training. In conclusion, these experimental results confirm the rationale and effectiveness of the Bagging-GCN model.

4.5. Parameter Values Used in Our Experiments

In our simulations, we used the parameters shown in Table 4.
The number of base classifiers (M = 7) was determined through an ablation study (Table 3), where we tested values in the range [3, 5, 7, 9, 11] and found M = 7 to be optimal for performance without overfitting. Other hyperparameters (learning rate, weight decay, hidden units, and dropout) were set to values commonly used in the GCN literature to ensure fair comparison and stability.
The imbalance ratio (IR) was explicitly controlled only in the Cora dataset (IR = 0.5) to simulate imbalance. For BlogCatalog and YelpChi, we used their natural imbalance ratios. The number of base classifiers M was set to 7 based on an ablation study (see Table 4). Each GCN base classifier was configured with a learning rate of 0.01, weight decay of 5 × 10 4 , 16 hidden units, and a dropout rate of 0.5. Models were trained for a maximum of 5000 epochs or until convergence.

4.6. Rationale for Synthetic Imbalance and Generalizability

First, the original Cora dataset is relatively balanced and does not reflect the class-imbalance scenario we aim to study. By artificially introducing imbalance, we are able to control the imbalance ratio (IR) and systematically evaluate the robustness of our method under different degrees of skewness. This enables fair and reproducible comparisons with baseline methods under consistent imbalance conditions.
Second, we also conducted evaluations on the BlogCatalog dataset, which naturally exhibits class imbalance. The combination of a synthetically imbalanced dataset (Cora) and a naturally imbalanced dataset (BlogCatalog) strengthens our experimental design by covering both controlled and real-world imbalance scenarios.
In addition, this practice is consistent with prior studies on imbalanced node classification (e.g., GraphSMOTE, DRGCN), where synthetic imbalance is often introduced into balanced benchmarks to simulate real-world skewness and facilitate methodological comparison. We acknowledge that a synthetic imbalance may not fully capture the complexity of natural imbalance, such as nuanced topological structures or feature distributions unique to minority classes in real-world graphs. Therefore, the results on Cora should be understood as demonstrating methodological effectiveness under controlled imbalance, whereas the results on BlogCatalog and YelpChi provide evidence of performance in realistic settings.
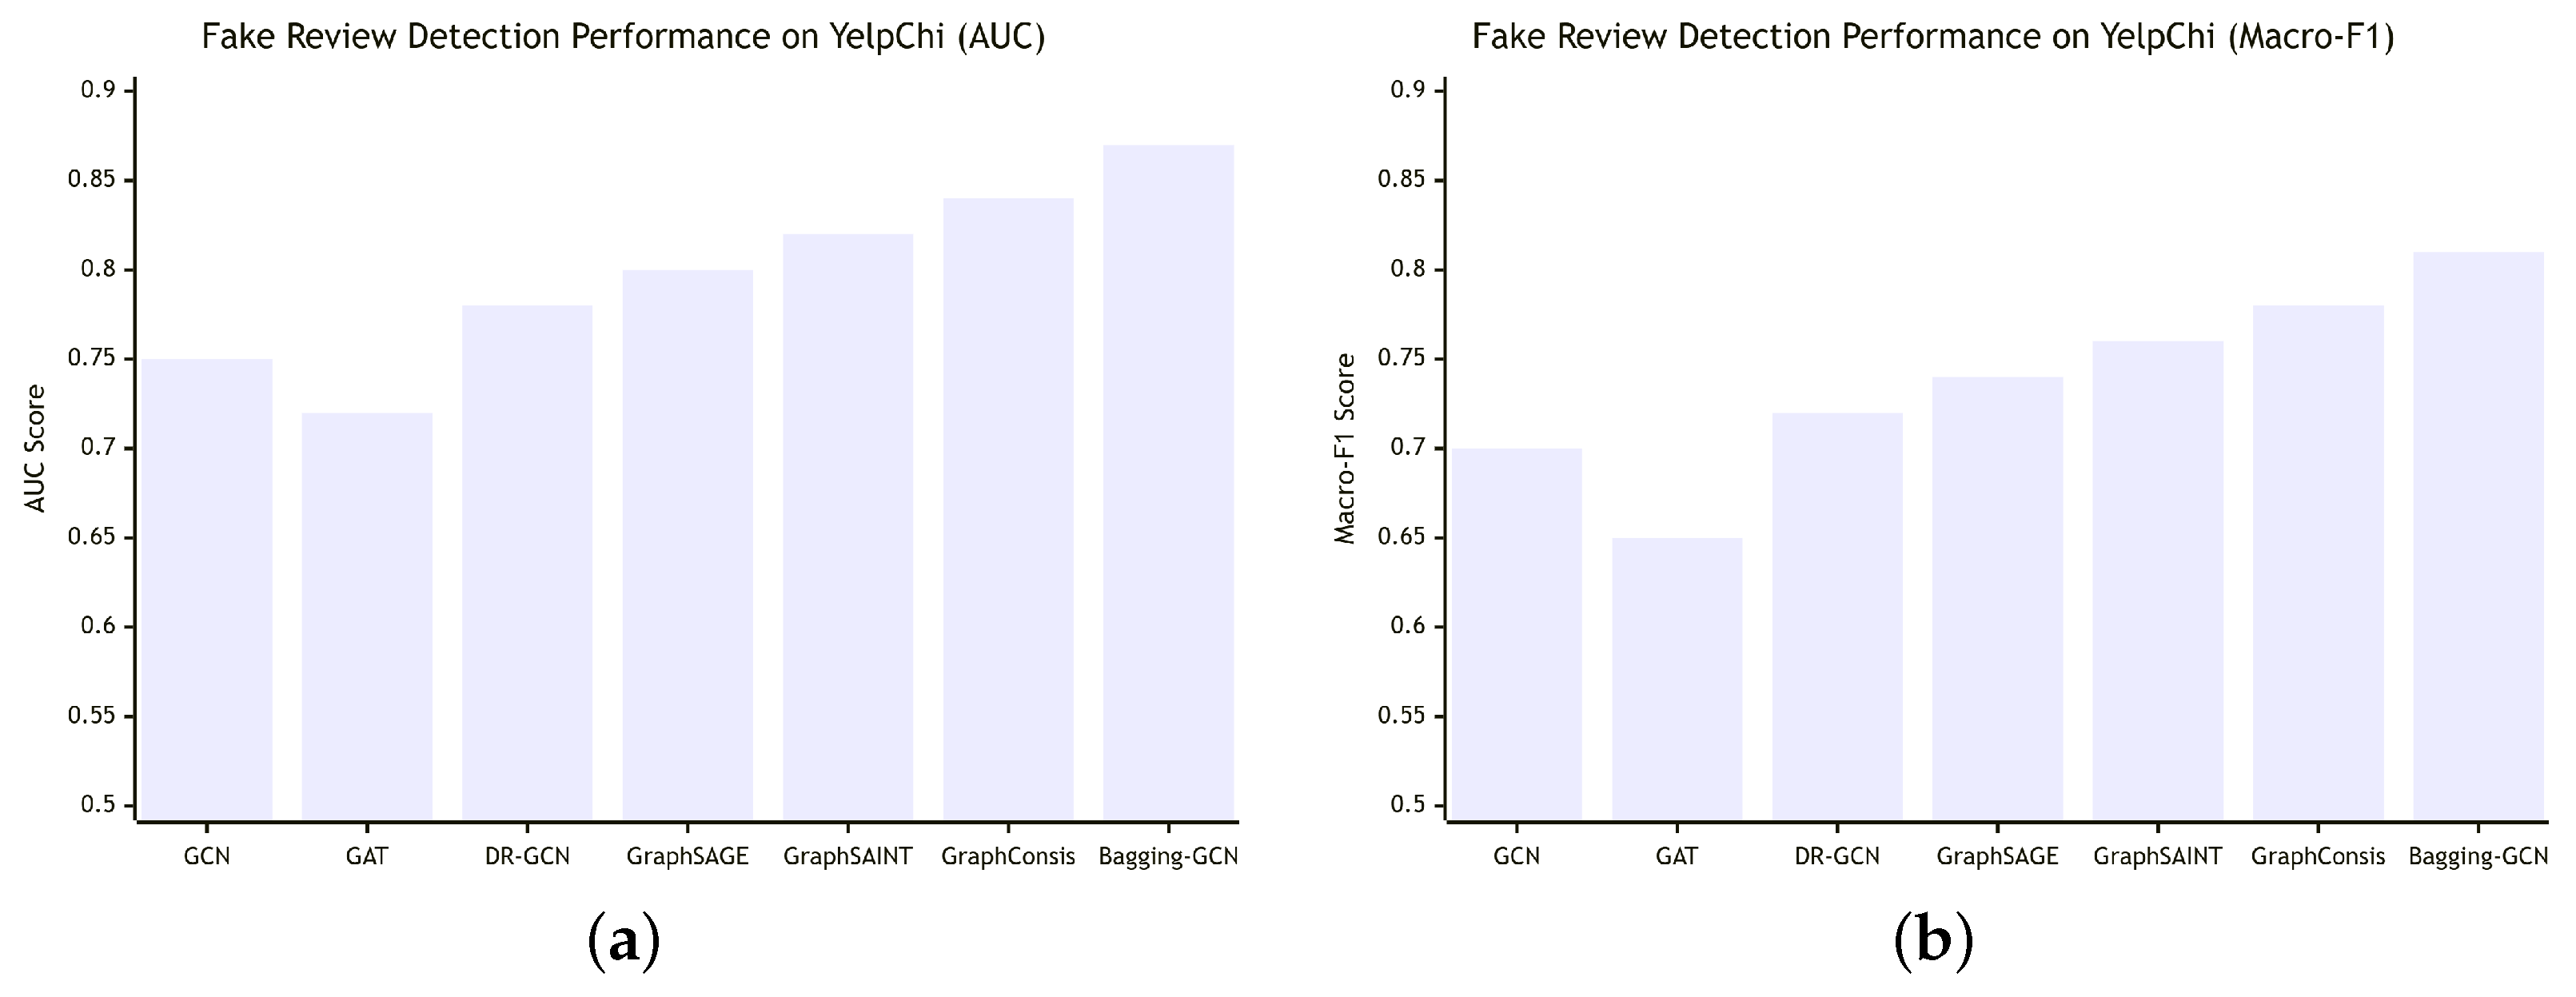
To address this limitation, we performed additional experiments on naturally imbalanced datasets (BlogCatalog and YelpChi) and incorporated multiple evaluation metrics robust to imbalance (AUC and Macro-F1) in the results section, as shown in Figure 6. The comparative results on the YelpChi dataset are summarized in Figure 6. It is clear that our Bagging-GCN framework consistently achieves the highest scores in both AUC and Macro-F1, outperforming all other baseline methods. This highlights the strong capability of our ensemble approach in real-world imbalanced graph scenarios, such as fake review detection.
Summary. The experiments demonstrate that the Bagging-GCN method outperforms other baseline methods in terms of accuracy, AUC, and Macro-F1, effectively addressing imbalanced node classification issues in graphs. Furthermore, in terms of Macro-F1 and AUC, the Bagging-GCN model surpasses other baseline methods on the fake review detection dataset, effectively tackling fake review detection problems and confirming the effectiveness of the Bagging-GCN model.

5. Conclusions and Future Work

To tackle the problem of class imbalance in node classification, we have developed an ensemble GNN framework named Bagging-GCN. This approach strategically combines random undersampling of majority classes with parallel training of multiple GCN base learners. The predictions from these diverse classifiers are aggregated through majority voting to form a strong and robust final model. We validated the effectiveness of Bagging-GCN on two standard node classification benchmarks (Cora and BlogCatalog) and demonstrated its practical utility in fake review detection on the YelpChi dataset. Across all experiments, our approach consistently outperformed a variety of state-of-the-art baselines, achieving superior performance in accuracy (Acc), area under the curve (AUC), and Macro-F1 scores.
Despite its effectiveness, we acknowledge that the proposed Bagging-GCN framework has some limitations. First, the parallel training of multiple base classifiers introduces higher computational and memory overhead compared to a single model, which could be a challenge for very large-scale graphs. Second, the random undersampling strategy, while essential for balancing the class distribution, may discard useful samples from the majority class, leading to a potential loss of information that could otherwise contribute to a more robust decision boundary.
These limitations naturally point to valuable directions for future research. First, exploring weighted ensemble strategies, where base classifiers are assigned votes based on their confidence or performance on validation data, could further enhance prediction accuracy and potentially allow for a smaller, more efficient ensemble size. Second, investigating more sophisticated sampling techniques that preserve the structural and feature-based integrity of the majority class could mitigate information loss. Techniques inspired by core-set selection or informed by graph topology warrant exploration. Finally, integrating our ensemble approach with other complementary strategies for imbalanced learning, such as cost-sensitive loss functions or advanced oversampling techniques like GraphSMOTE, could lead to even more powerful and versatile models for handling graph-based imbalanced data across various domains.

Funding

This research was funded by the Suqian Sci&Tech Program (Grant No. K202415), and the Guangxi Key Laboratory of Trusted Software (no. KX202037).

Data Availability Statement

The datasets analyzed in this study are publicly available. The Cora and BlogCatalog datasets can be accessed from commonly used benchmark repositories in graph learning research. The YelpChi dataset is available at DataFountain (https://www.datafountain.cn/datasets/5787, accessed on 10 August 2025).

Conflicts of Interest

The author declares no conflict of interest.

References

  1. Zhang, S.; Yin, H.; Chen, T.; Nguyen, Q.V.H.; Huang, Z.; Cui, L. GCN-Based User Representation Learning for Unifying Robust Recommendation and Fraudster Detection. In Proceedings of the 43rd international ACM SIGIR Conference on Research and Development in Information Retrieval, Virtual Event, China, 25–30 July 2020; pp. 689–698. [Google Scholar]
  2. Hafez, I.Y.; Hafez, A.Y.; Saleh, A.; El-Mageed, A.A.A.; Abohany, A.A. A systematic review of AI-enhanced techniques in credit card fraud detection. J. Big Data 2025, 12, 6. [Google Scholar] [CrossRef]
  3. Zhong, Q.; Liu, Y.; Ao, X.; Hu, B.; Feng, J.; Tang, J.; He, Q. Financial Defaulter Detection on Online Credit Payment via Multi-view Attributed Heterogeneous Information Network. In Proceedings of the Web Conference 2020, Taipei, Taiwan, 20–24 April 2020; pp. 785–795. [Google Scholar]
  4. Yang, Y.; Sun, Y.; Li, F.; Guan, B.; Liu, J.; Shang, J. MGCNRF: Prediction of Disease-Related miRNAs Based on Multiple Graph Convolutional Networks and Random Forest. IEEE Trans. Neural Netw. Learn. Syst. 2024, 35, 15701–15709. [Google Scholar] [CrossRef] [PubMed]
  5. Xie, B.; Ma, X.; Xue, S.; Beheshti, A.; Yang, J.; Fan, H.; Wu, J. Multiknowledge and LLM-Inspired Heterogeneous Graph Neural Network for Fake News Detection. IEEE Trans. Comput. Soc. Syst. 2025, 12, 682–694. [Google Scholar] [CrossRef]
  6. Chen, R.; Li, G.; Dai, C. DRGCN: Dual Residual Graph Convolutional Network for Hyperspectral Image Classification. IEEE Geosci. Remote Sens. Lett. 2022, 19, 1–5. [Google Scholar] [CrossRef]
  7. Zhao, T.; Zhang, X.; Wang, S. GraphSMOTE: Imbalanced Node Classification on Graphs with Graph Neural Networks. In Proceedings of the 14th ACM International Conference on Web Search and Data Mining, Virtual Event, Israel, 8–12 March 2021; pp. 833–841. [Google Scholar]
  8. Chawla, N.V.; Bowyer, K.W.; Hall, L.O.; Kegelmeyer, W.P. SMOTE: Synthetic Minority Over-sampling Technique. J. Artif. Intell. Res. 2002, 16, 321–357. [Google Scholar] [CrossRef]
  9. Xu, L. Machine Learning Solutions for Classification and Regions of Interest Analysis on Imbalanced Datasets. Ph.D. Thesis, University of Tampere, Tampere, Finland, 2024. [Google Scholar]
  10. Shah, K.A.; Halim, Z.; Anwar, S.; Hsu, C.; Rida, I. Multi-sensor data fusion for smart healthcare: Optimizing specialty-based classification of imbalanced EMRs. Inf. Fusion 2026, 125, 103503. [Google Scholar] [CrossRef]
  11. Luo, J.; Liu, L.; He, Y.; Tan, K. An efficient boundary prediction method based on multi-fidelity Gaussian classification process for class-imbalance. Eng. Appl. Artif. Intell. 2025, 149, 110549. [Google Scholar] [CrossRef]
  12. Mildenberger, D.; Hager, P.; Rueckert, D.; Menten, M.J. A Tale of Two Classes: Adapting Supervised Contrastive Learning to Binary Imbalanced Datasets. In Proceedings of the Computer Vision and Pattern Recognition Conference, Nashville, Tennessee, 10–17 June 2025; pp. 10305–10314. [Google Scholar]
  13. Chen, W.; Yang, K.; Yu, Z.; Shi, Y.; Chen, C.L.P. A survey on imbalanced learning: Latest research, applications and future directions. Artif. Intell. Rev. 2024, 57, 137. [Google Scholar] [CrossRef]
  14. Sun, H.; Li, J.; Zhu, X. A Novel Expandable Borderline Smote Over-Sampling Method for Class Imbalance Problem. IEEE Trans. Knowl. Data Eng. 2025, 37, 2183–2199. [Google Scholar] [CrossRef]
  15. Kachan, O.; Savchenko, A.V.; Gusev, G. Simplicial SMOTE: Oversampling Solution to the Imbalanced Learning Problem. In Proceedings of the KDD, Toronto, ON, Canada, 3–7 August 2025; pp. 625–635. [Google Scholar]
  16. Chang, A.; Fontaine, M.C.; Booth, S.; Mataric, M.J.; Nikolaidis, S. Quality-Diversity Generative Sampling for Learning with Synthetic Data. In Proceedings of the AAAI Conference on Artificial Intelligence, Philadelphia, PA, USA, 25 February–4 March 2025; pp. 19805–19812. [Google Scholar]
  17. Kumar, N.S.; Rao, K.N.; Govardhan, A.; Reddy, K.S.; Mahmood, A.M. Undersampled K-means approach for handling imbalanced distributed data. Prog. Artif. Intell. 2014, 3, 29–38. [Google Scholar] [CrossRef]
  18. Cui, Y.; Jia, M.; Lin, T.; Song, Y.; Belongie, S.J. Class-Balanced Loss Based on Effective Number of Samples. In Proceedings of the IEEE/CVF Conference on Computer Vision and Pattern Recognition, Long Beach, CA, USA, 15–20 June 2019; pp. 9268–9277. [Google Scholar]
  19. Lin, T.; Goyal, P.; Girshick, R.B.; He, K.; Dollár, P. Focal Loss for Dense Object Detection. In Proceedings of the IEEE International Conference on Computer Vision, Venice, Italy, 22–29 October 2017; pp. 2999–3007. [Google Scholar]
  20. Li, B.; Liu, Y.; Wang, X. Gradient Harmonized Single-Stage Detector. In Proceedings of the AAAI Conference on Artificial Intelligence, Honolulu, HI, USA, 29–31 January 2019; pp. 8577–8584. [Google Scholar]
  21. Klikowski, J.; Wozniak, M. Deterministic Sampling Classifier with weighted Bagging for drifted imbalanced data stream classification. Appl. Soft Comput. 2022, 122, 108855. [Google Scholar] [CrossRef]
  22. Jafarzadeh, H.; MahdianPari, M.; Gill, E.; Mohammadimanesh, F.; Homayouni, S. Bagging and Boosting Ensemble Classifiers for Classification of Multispectral, Hyperspectral and PolSAR Data: A Comparative Evaluation. Remote. Sens. 2021, 13, 4405. [Google Scholar] [CrossRef]
  23. Li, J.; Zhu, X.; Wang, J. AdaBoost.C2: Boosting Classifiers Chains for Multi-Label Classification. In Proceedings of the AAAI Conference on Artificial Intelligence, Washington, DC, USA, 7–14 February 2023; pp. 8580–8587. [Google Scholar]
  24. Parthasarathy, S.; Lakshminarayanan, A.R. BS-SC Model: A Novel Method for Predicting Child Abuse Using Borderline-SMOTE Enabled Stacking Classifier. Comput. Syst. Sci. Eng. 2023, 46, 1311–1336. [Google Scholar]
  25. Sharma, N.; Joshi, D. DRGCN-BiLSTM: An Electrocardiogram Heartbeat Classification Using Dynamic Spatial-Temporal Graph Convolutional and Bidirectional Long-Short Term Memory Technique. IEEE Trans. Consum. Electron. 2025, 71, 579–593. [Google Scholar] [CrossRef]
  26. Zhang, L.; Yan, X.; He, J.; Li, R.; Chu, W. DRGCN: Dynamic Evolving Initial Residual for Deep Graph Convolutional Networks. In Proceedings of the AAAI Conference on Artificial Intelligence, Washington, DC, USA, 7–14 February 2023; pp. 11254–11261. [Google Scholar]
  27. Liu, Z.; Li, Y.; Chen, N.; Wang, Q.; Hooi, B.; He, B. A Survey of Imbalanced Learning on Graphs: Problems, Techniques, and Future Directions. IEEE Trans. Knowl. Data Eng. 2025, 37, 3132–3152. [Google Scholar] [CrossRef]
  28. Ju, W.; Mao, Z.; Yi, S.; Qin, Y.; Gu, Y.; Xiao, Z.; Shen, J.; Qiao, Z.; Zhang, M. Cluster-guided Contrastive Class-imbalanced Graph Classification. In Proceedings of the AAAI Conference on Artificial Intelligence, Philadelphia, PA, USA, 25 February 25–4 March 2025; pp. 11924–11932. [Google Scholar]
  29. Wu, Z.; Pan, S.; Chen, F.; Long, G.; Zhang, C.; Yu, P.S. A Comprehensive Survey on Graph Neural Networks. IEEE Trans. Neural Networks Learn. Syst. 2021, 32, 4–24. [Google Scholar]
  30. Li, S.; Li, Y.; Wu, X.; Otaibi, S.A.; Tian, Z. Imbalanced Malware Family Classification Using Multimodal Fusion and Weight Self-Learning. IEEE Trans. Intell. Transp. Syst. 2023, 24, 7642–7652. [Google Scholar]
  31. Zeng, L.; Li, L.; Gao, Z.; Zhao, P.; Li, J. ImGCL: Revisiting Graph Contrastive Learning on Imbalanced Node Classification. In Proceedings of the AAAI conference on Artificial Intelligence, Washington, DC, USA, 7–14 February 2023; pp. 11138–11146. [Google Scholar]
  32. Zhou, M.; Gong, Z. GraphSR: A Data Augmentation Algorithm for Imbalanced Node Classification. In Proceedings of the AAAI Conference on Artificial Intelligence, Washington, DC, USA, 7–14 February 2023; pp. 4954–4962. [Google Scholar]
  33. Pang, Y.; Peng, L.; Zhang, H.; Chen, Z.; Yang, B. Imbalanced ensemble learning leveraging a novel data-level diversity metric. Pattern Recognit. 2025, 157, 110886. [Google Scholar]
  34. Han, M.; Guo, H.; Wang, W. A new data complexity measure for multi-class imbalanced classification tasks. Pattern Recognit. 2025, 157, 110881. [Google Scholar]
  35. Xia, F.; Wang, L.; Tang, T.; Chen, X.; Kong, X.; Oatley, G.; King, I. CenGCN: Centralized Convolutional Networks with Vertex Imbalance for Scale-Free Graphs. IEEE Trans. Knowl. Data Eng. 2023, 35, 4555–4569. [Google Scholar] [CrossRef]
  36. Chen, Y.; Lu, C. RankMix: Data Augmentation for Weakly Supervised Learning of Classifying Whole Slide Images with Diverse Sizes and Imbalanced Categories. In Proceedings of the IEEE/CVF Conference on Computer Vision and Pattern Recognition, Vancouver, BC, Canada, 17–24 June 2023; pp. 23936–23945. [Google Scholar]
  37. Qu, L.; Zhu, H.; Zheng, R.; Shi, Y.; Yin, H. ImGAGN: Imbalanced Network Embedding via Generative Adversarial Graph Networks. In Proceedings of the 27th ACM SIGKDD Conference on Knowledge Discovery & Data Mining, Singapore, 14–18 August 2021; pp. 1390–1398. [Google Scholar]
  38. Liu, Y.; Ao, X.; Qin, Z.; Chi, J.; Feng, J.; Yang, H.; He, Q. Pick and Choose: A GNN-based Imbalanced Learning Approach for Fraud Detection. In Proceedings of the Web Conference 2021, Ljubljana, Slovenia, 19–23 April 2021; pp. 3168–3177. [Google Scholar]
  39. Wu, L.; Lin, H.; Gao, Z.; Tan, C.; Li, S.Z. GraphMixup: Improving Class-Imbalanced Node Classification on Graphs by Self-supervised Context Prediction. In Joint European Conference on Machine Learning and Knowledge Discovery in Databases; Springer Nature: Cham, Switzerland, 2022. [Google Scholar]
  40. Li, X.; Jiang, Y.; Liu, Y.; Zhang, J.; Yin, S.; Luo, H. RAGCN: Region Aggregation Graph Convolutional Network for Bone Age Assessment From X-Ray Images. IEEE Trans. Instrum. Meas. 2022, 71, 1–12. [Google Scholar] [CrossRef]
  41. Sun, K.; Zhu, Z.; Lin, Z. AdaGCN: Adaboosting Graph Convolutional Networks into Deep Models. In Proceedings of the ICLR, Virtual Event, Austria, 3–7 May 2021. [Google Scholar]
  42. Hamilton, W.L.; Ying, Z.; Leskovec, J. Inductive Representation Learning on Large Graphs. In Proceedings of the NIPS, Long Beach, CA, USA, 4–9 December 2017; pp. 1024–1034. [Google Scholar]
  43. Zeng, H.; Zhou, H.; Srivastava, A.; Kannan, R.; Prasanna, V.K. GraphSAINT: Graph Sampling Based Inductive Learning Method. arXiv 2020, arXiv:1907.04931. [Google Scholar] [CrossRef]
  44. Liu, Z.; Dou, Y.; Yu, P.S.; Deng, Y.; Peng, H. Alleviating the Inconsistency Problem of Applying Graph Neural Network to Fraud Detection. In Proceedings of the 43rd International ACM SIGIR Conference on Research and Development in Information Retrieval, Virtual Event, China, 25–30 July 2020; pp. 1569–1572. [Google Scholar]
  45. Park, J.; Song, J.; Yang, E. GraphENS: Neighbor-Aware Ego Network Synthesis for Class-Imbalanced Node Classification. 2022. Available online: https://openreview.net/forum?id=MXEl7i-iru (accessed on 28 January 2022).
  46. Makansi, O.; Ilg, E.; Çiçek, Ö.; Brox, T. Overcoming Limitations of Mixture Density Networks: A Sampling and Fitting Framework for Multimodal Future Prediction. In Proceedings of the IEEE/CVF Conference on Computer Vision and Pattern Recognition, Long Beach, CA, USA, 16–17 June 2019; pp. 7144–7153. [Google Scholar]
  47. Wang, Z.; Ye, X.; Wang, C.; Cui, J.; Yu, P.S. Network Embedding with Completely-Imbalanced Labels. IEEE Trans. Knowl. Data Eng. 2021, 33, 3634–3647. [Google Scholar] [CrossRef]
  48. Oh, J.; Cho, K.; Bruna, J. Advancing GraphSAGE with A Data-Driven Node Sampling. arXiv 2019, arXiv:1904.12935. [Google Scholar]
  49. Barakat, A.; Bianchi, P. Convergence Rates of a Momentum Algorithm with Bounded Adaptive Step Size for Nonconvex Optimization. In Proceedings of the Asian Conference on Machine Learning, Bangkok, Thailand, 18–20 November 2020; Volume 129, pp. 225–240. [Google Scholar]
  50. Kipf, T.N.; Welling, M. Semi-Supervised Classification with Graph Convolutional Networks. In Proceedings of the ICLR, Toulon, France, 24–26 April 2017. [Google Scholar]
  51. Velickovic, P.; Cucurull, G.; Casanova, A.; Romero, A.; Liò, P.; Bengio, Y. Graph Attention Networks. arXiv 2017, arXiv:1710.10903. [Google Scholar]
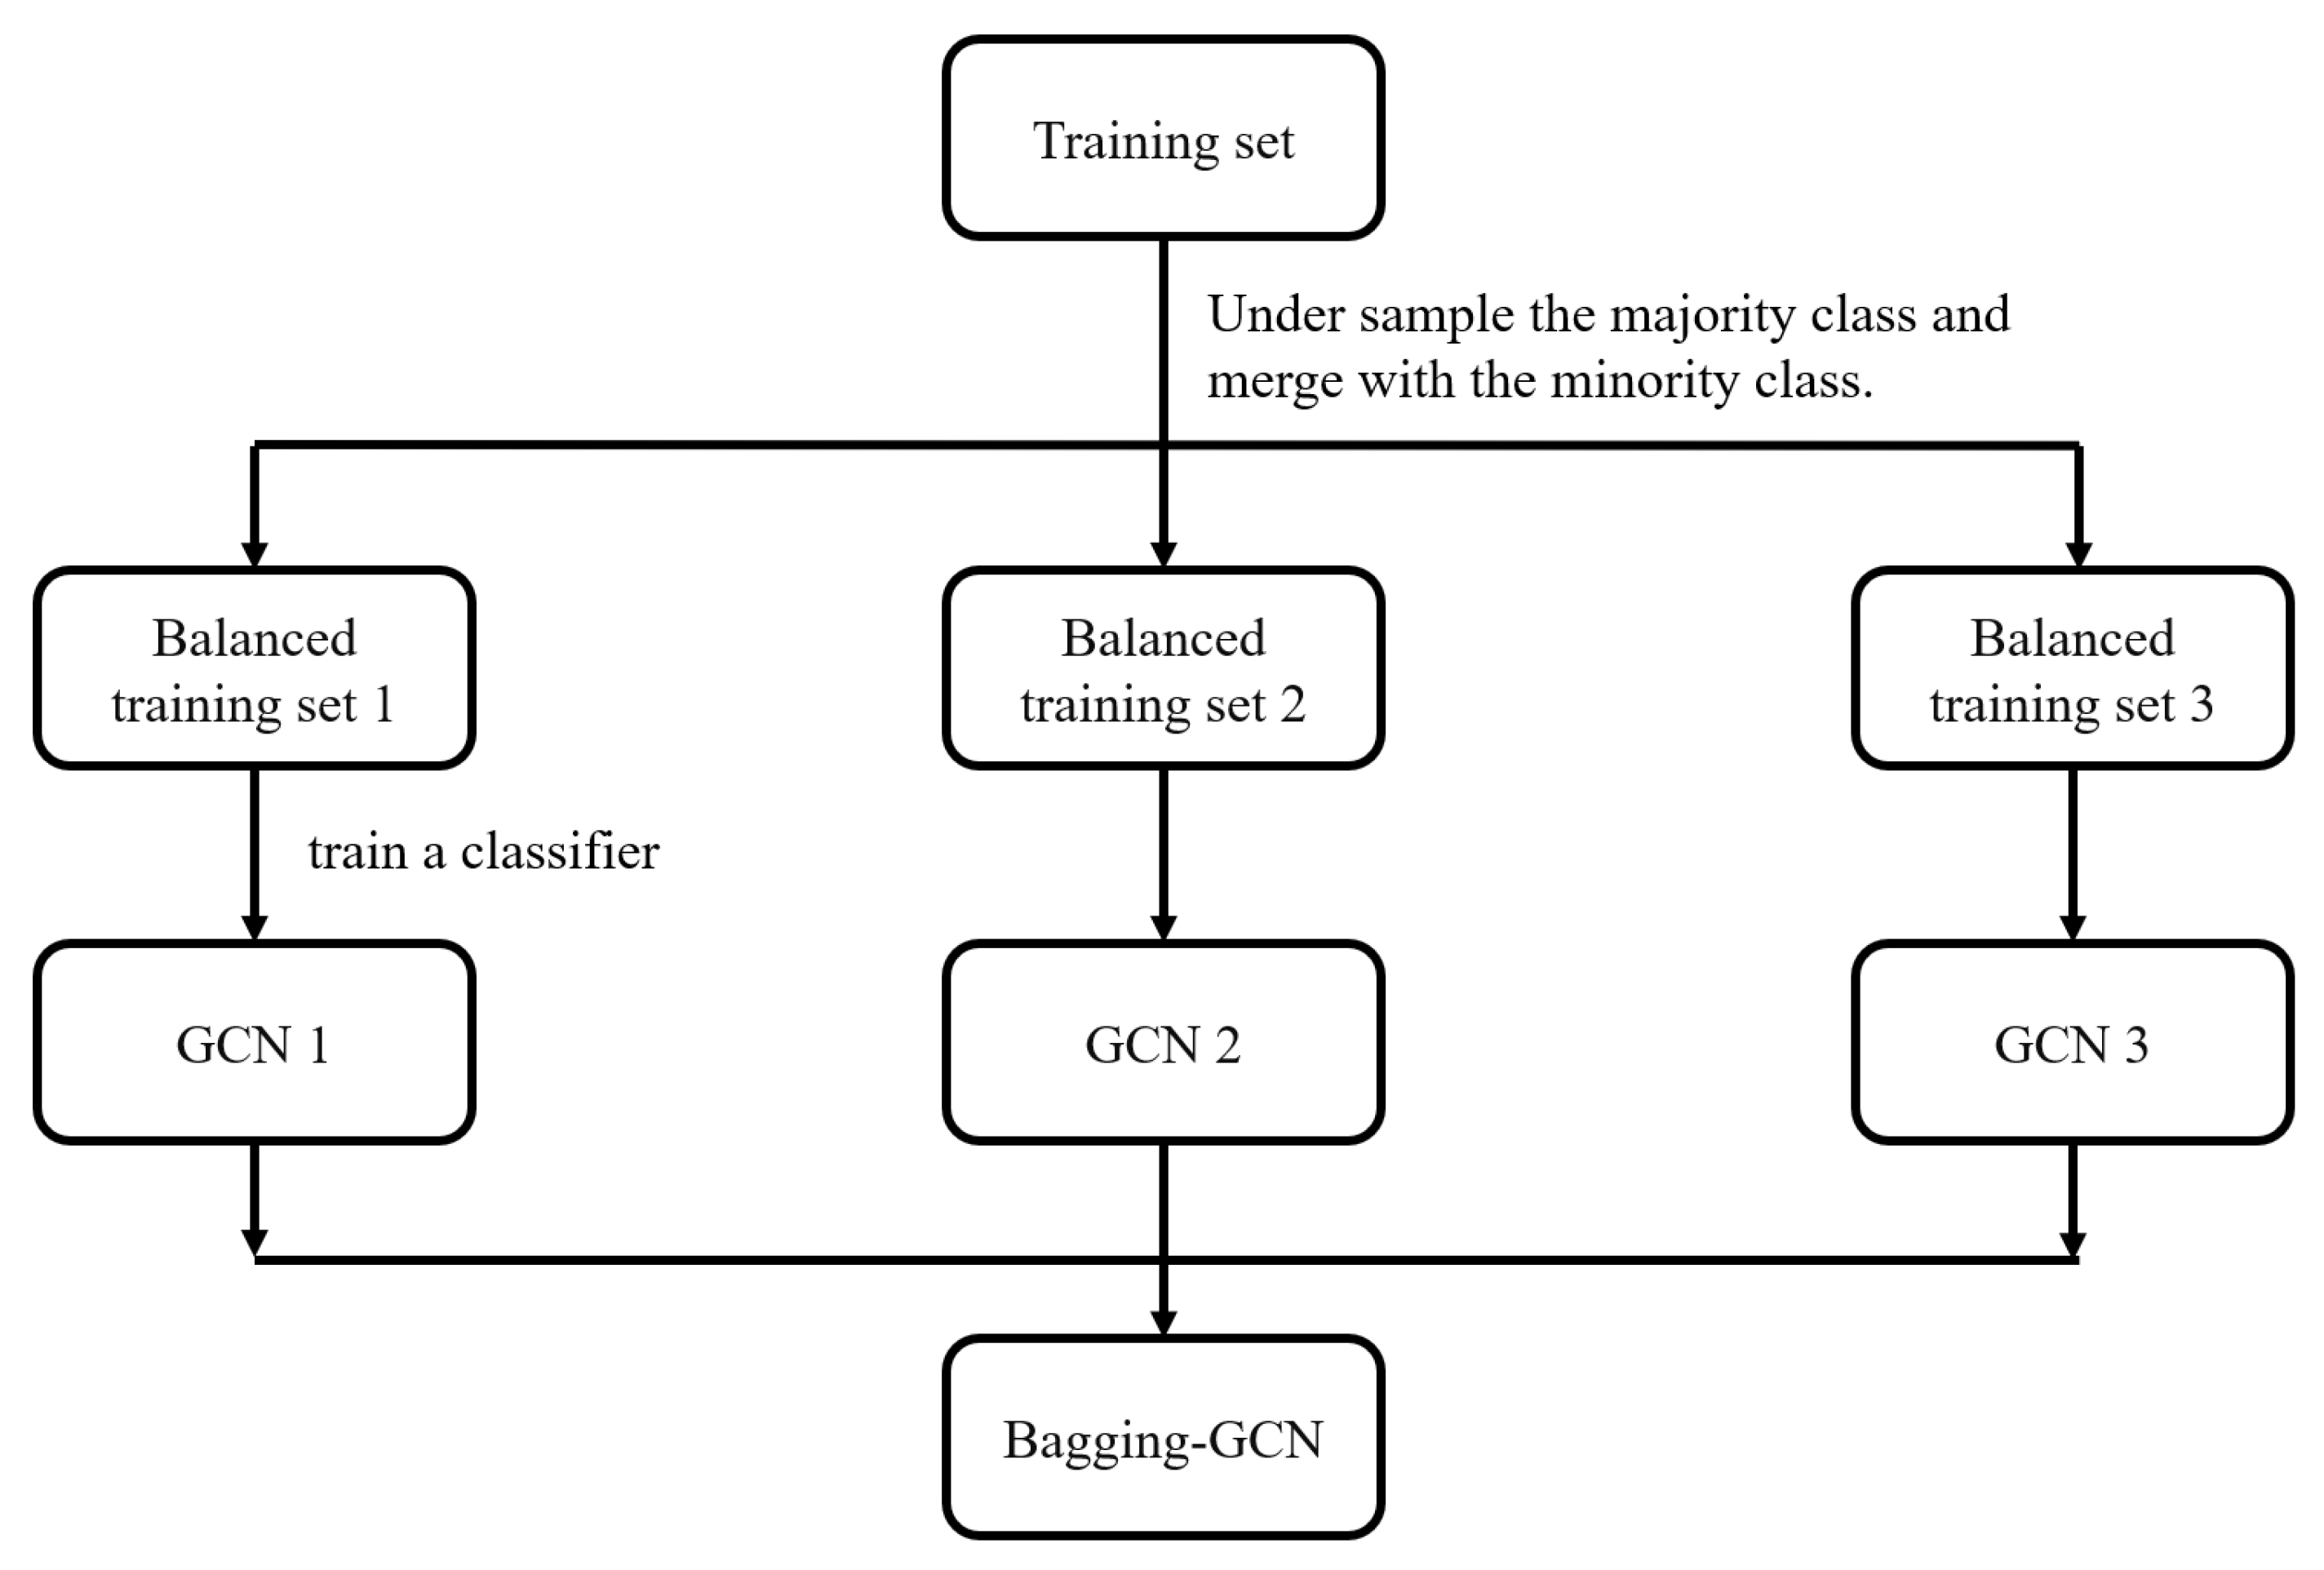
Figure 1. The overall pipeline of the Bagging-GCN training process. The majority class is repeatedly undersampled and merged with all minority samples to generate several balanced training sets. A GCN base classifier is trained on each subset in parallel. The final prediction is derived by majority voting among all base classifiers.
Applsci 15 10440 g001
Figure 2. Workflow of fake review detection with Bagging-GCN. (1) Genuine reviews (majority class) are undersampled, while all fake reviews (minority class) are retained to form balanced training sets. (2) Multiple GCN base classifiers are trained in parallel on these sets. (3) Predictions from all classifiers are aggregated via majority voting to detect fake reviews in the test set.
Applsci 15 10440 g002
Figure 3. Performance comparison across different methods and parameters. (a) Performance comparison with baseline methods; (b) ablation study on the number of base classifiers.
Applsci 15 10440 g003
Figure 4. Result on Macro-F1 in fake review detection dataset.
Applsci 15 10440 g004
Figure 5. Result on AUC in the fake review detection dataset.
Applsci 15 10440 g005
Figure 6. Fake review detection performance comparison on the YelpChi dataset. (a) Fake review detection performance on YelpChi (AUC). (b) Fake review detection performance on YelpChi (Macro-F1).
Applsci 15 10440 g006
Table 1. Yelpchi dataset.
DatasetNodeEdgeIRRelations#Relations
Yelpchi45,9543,846,9795.9R-U-R49,315
R-S-R3,402,743
R-T-R573,616
Table 2. Comparison results between Bagging GCN and 8 baselines.
MethodsCoraBlogCatalog
AccAUCMacro-F1AccAUCMacro-F1
GraphENS0.681 ± 0.0030.914 ± 0.0020.684 ± 0.0030.210 ± 0.0040.586 ± 0.0020.074 ± 0.002
Over-sampling0.692 ± 0.0090.918 ± 0.0050.666 ± 0.0080.203 ± 0.0040.599 ± 0.0030.077 ± 0.001
Re-weight0.697 ± 0.0080.928 ± 0.0050.684 ± 0.0040.206 ± 0.0050.587 ± 0.0030.075 ± 0.003
SMOTE0.696 ± 0.0010.920± 0.0080.673 ± 0.0030.205 ± 0.0040.595 ± 0.0030.077 ± 0.001
Embed-SMOTE0.683 ± 0.0070.913 ± 0.0020.673 ± 0.0020.205 ± 0.0030.588 ± 0.0020.076 ± 0.001
RECT0.685 ± 0.00130.921 ± 0.0070.689 ± 0.0060.202 ± 0.0070.593 ± 0.0040.073 ± 0.003
DRGCN0.694 ± 0.00110.932 ± 0.0060.691 ± 0.0070.208 ± 0.0060.603 ± 0.0050.078 ± 0.004
GraphSMOTE0.736 ± 0.0010.934 ± 0.0020.727 ± 0.0010.215 ± 0.010.591 ± 0.010.080 ± 0.005
Bagging-GCN0.770 ± 0.0010.932 ± 0.0090.750 ± 0.0090.240 ± 0.0050.609 ± 0.0020.085 ± 0.002
Table 3. Impact of the number of base classifiers.
Base ClassifiersAccAUCMacro-F1
30.752 ± 0.0010.912 ± 0.0050.719 ± 0.004
50.768 ± 0.0010.928 ± 0.0020.732 ± 0.009
70.770 ± 0.0010.932 ± 0.0090.750 ± 0.009
90.737 ± 0.0020.923 ± 0.0060.704 ± 0.008
110.737 ± 0.0050.921 ± 0.0080.701 ± 0.002
Table 4. Model parameters and configurations.
ParameterValue(s) Used
Number of Base Classifiers (M)7 (optimal after ablation)
Learning Rate0.01
Weight Decay 5 × 10 4
Hidden Units16
Dropout Rate0.5
Training EpochsUp to 5000 (until convergence)
Imbalance Ratio (IR)0.5 (for Cora); natural imbalance (others)
Disclaimer/Publisher’s Note: The statements, opinions and data contained in all publications are solely those of the individual author(s) and contributor(s) and not of MDPI and/or the editor(s). MDPI and/or the editor(s) disclaim responsibility for any injury to people or property resulting from any ideas, methods, instructions or products referred to in the content.