Abstract
Over the past decade, researchers have advanced traffic monitoring using surveillance cameras, unmanned aerial vehicles (UAVs), loop detectors, LiDAR, microwave sensors, and sensor fusion. These technologies effectively detect and track vehicles, enabling robust safety assessments. However, pedestrian detection remains challenging due to diverse motion patterns, varying clothing colors, occlusions, and positional differences. This study introduces an innovative approach that integrates multiple surveillance cameras at signalized intersections, regardless of their types or resolutions. Two distinct convolutional neural network (CNN)-based detection algorithms accurately track road users across multiple views. The resulting trajectories undergo analysis, smoothing, and integration, enabling detailed traffic scene reconstruction and precise identification of vehicle–pedestrian conflicts. The proposed framework achieved 97.73% detection precision and an average intersection over union (IoU) of 0.912 for pedestrians, compared to 68.36% and 0.743 with a single camera. For vehicles, it achieved 98.2% detection precision and an average IoU of 0.955, versus 58.78% and 0.516 with a single camera. These findings highlight significant improvements in detecting and analyzing traffic conflicts, enhancing the identification and mitigation of potential hazards.
1. Introduction
The assessment of intersection safety has emerged as a critical focus in the realm of traffic safety in the United States (US), where over 50% of total crashes occur at intersections across various types of roadways [1]. This heightened risk is attributed to the intricate movements involving diverse road users [2]. Contributing factors to intersection crashes encompass the inadequate geometric design of intersection approaches, road user misperceptions during traffic encounters, and deficient signal phase plans that fail to meet traffic flow demands throughout the day. Recent analyses of crash frequencies and distributions reveal a significant increase in crashes involving vulnerable road users at intersections [3]. Consequently, there is an active research focus on developing an assessment tool capable of accurately monitoring intersections, detecting diverse road users, and providing a reliable estimation of safety performance within these critical areas.
The conventional method for assessing crash risk relies on accumulated crash frequencies, constituting a reactive approach that necessitates a substantial number of actual crashes to be included in the assessment process [4,5,6]. However, this method has notable shortcomings, primarily relying on police reports that often lack sufficient information for thorough analysis. Furthermore, under-reported crashes are not accounted for in this procedure. To expedite the safety assessment process, an alternative approach involves the analysis of traffic conflicts, offering a more streamlined and robust technique within specific time periods [7,8].
Recent research further demonstrates the value of advanced approaches in supporting proactive intersection safety analysis. Ištoka Otković et al. applied microsimulation to reconstruct pedestrian conflict zones, showing how operational changes can reduce risks for vulnerable users [9]. Kan et al. advanced digital twin frameworks by integrating YOLOv5 and DeepSORT for real-time vehicle detection and trajectory tracking in urban traffic environments [10]. Similarly, Xue and Yao improved pedestrian re-identification under occlusions using a MotionBlur augmentation module, enhancing detection robustness in crowded conditions [11]. Together, these studies highlight the potential of combining simulation, digital twins, and advanced computer vision as proactive alternatives to crash-based methods. Building on this foundation, the present study contributes a multi-camera detection and trajectory reconstruction framework designed to improve road user identification and support conflict evaluation at signalized intersections.
In this study, traffic conflicts are defined as situations where two or more road users move in such a way that their paths would intersect and a collision would occur unless one or both take evasive action [12,13]. Previous research has extended this concept by introducing surrogate safety measures such as time-to-collision (TTC) and post-encroachment time (PET), as well as other traffic conflict indicators, to evaluate the likelihood and severity of potential collisions. In contrast, the present study concentrates on the foundational step of detecting conflicts by accurately identifying road users and reconstructing their trajectories through multi-camera integration. By establishing this scope, the framework contributes to established traffic conflict research by delivering reliable detection and tracking outputs as the essential basis for subsequent safety analyses.
Building on this definition, the present study analyzes pedestrians’ and vehicles’ trajectories at signalized intersections by integrating the fields of view (FOVs) of the implemented surveillance cameras at intersections regardless of their types or output resolutions. A detection framework is proposed based on the integration between two computer vision algorithms to improve the detection accuracy of road users for better safety assessment.
The organization of this study is as follows: The next section presents a literature review on road user detection techniques. Following this, the methodology for collecting video data, the observation process, and the proposed framework are detailed. The subsequent sections cover data preparation, algorithm formulation, and the post-processing phase, including camera calibration and the concatenation of outputs. The framework is then applied to an extensive example in order to analyze a traffic conflict and a summary of pedestrian conflict statistics. Finally, the summary and conclusions are presented.
2. Background
The rapid advancement of connected and automated vehicles (CAVs) has been accompanied by significant improvements to their on-board perception systems and detection algorithms [14,15]. As these capabilities continue to evolve, it becomes increasingly important for infrastructure-based monitoring systems to achieve comparable levels of accuracy in order to complement vehicle-based sensing and ensure consistent safety management across the roadway environment. In parallel, the field of computer vision has advanced rapidly, producing increasingly sophisticated algorithms for detecting and tracking road users. These developments provide a strong foundation for enhancing vision-based monitoring frameworks that support proactive safety assessment and traffic management.
In light of these continuous advancements in computer vision, tracking techniques for road users using various devices have undergone significant development [16]. Computational algorithms play a key role in tracking road users across different roadway sections [17,18]. Commonly developed object tracking techniques include region-based tracking [19,20,21,22], 3D model-based tracking [23], contour-based tracking [24], and feature-based tracking [25,26]. These advancements have greatly enhanced the precision and effectiveness of road user-monitoring systems. Moving forward, integrating these tracking methodologies with emerging technologies and improved computational models will be crucial for further optimizing traffic safety and management.
2.1. Pedestrians Detection
Based on the ongoing progression in computer vision, robotics, and autonomous vehicles development and testing, detection of vulnerable road users is gaining huge momentum. In [27], the authors presented an overview of both methodological and experimental aspects in this field. The study involved a survey portion that covered essential elements of pedestrian-detection systems and their underlying models followed by experimental analysis sections. The utilized dataset encompassed numerous training samples and a 27-min test sequence featuring over 20,000 images with annotated pedestrian positions. The evaluation considered both a general assessment setting and one tailored to pedestrian detection within a vehicle. The results showed that histogram-oriented gradient (HOG) and linear support vector machine (linSVM) models proved their superiority in high-resolution, slow processing scenarios, while AdaBoost cascades had better performance in low-resolution, near real-time contexts.
In [28], a total of 16 types of pedestrian detectors were evaluated on the Caltech pedestrian dataset. The imagery dataset included 350,000 labeled pedestrian bounding boxes with a total of 250,000 frames. The annotation process included occlusions and temporal correspondences. The authors avoided retraining the detectors or modifying their original structure in order to evaluate and rank them based on unbiased procedure. Several metrics were adopted in the evaluation process including features, learning rates, and detection details. The general notices on overall performance stated that 80% of pedestrians that appeared in the video image with a size between 30 to 80 pixels were missed, while nearly all pedestrians were undetected when their size went under 30 pixels and their partial occlusion reached 35%.
Another imagery dataset entitled CityPersons was introduced in [29]. The person annotations were built on a high-quality dataset, Cityscapes, that enables semantic understanding of urban street scenes in computer vision research. The study empowered faster region convolutional neural network (R-CNN) to evaluate the detection results by running the algorithm on both the Caltech and CityPersons datasets. The diversity of CityPersons allows training a single CNN model that generalizes effectively across various benchmarks. With additional training using CityPersons, Faster R-CNN achieves top performance on Caltech, notably improving for challenging scenarios like heavy occlusion and small scale, leading to enhanced localization quality.
A vision-based system was introduced in [30] to identify pedestrians that pass in front of vehicles and prevent hazardous traffic encounters. The system employed low-resolution cameras mounted on vehicles and leveraged information from fixed cameras in the environment. A cascade of compact binary strings was developed to model pedestrians’ appearances and match them across cameras. This system is tailored to practical transportation needs, operating in real-time with minimal memory usage and bandwidth consumption. The system’s performance was evaluated under degraded feature extraction conditions and when using low-quality sensing devices, showcasing the viability of this collaborative vision-based approach.
Extensive literature reviews were performed to examine the existing algorithms for pedestrian detection through image processing, utilizing images sourced from video surveillance or standard cameras [31,32]. The focus of most reviewed papers is on verifying pedestrian presence and determining their positions within the scene. These studies covered a spectrum of innovative algorithms ranging from traditional detection methods to advanced deep learning techniques. Consequently, the performance of pedestrian detection methodologies was tested in both controlled and uncontrolled settings. These studies revealed that the advent of deep learning-based architectures, coupled with the availability of efficient and cost-effective processors, enables researchers to enhance system performance in two distinct ways: (a) crafting resilient feature sets, and (b) reducing processing time compared to conventional models.
A recent study introduced a sensor fusion method called Fully Convolutional Neural Networks for LIDAR–camera fusion [33]. The approach combined LIDAR data with multiple camera images, improving pedestrian detection accuracy. The proposed system involved a distinct algorithm for image fusion in pedestrian detection. An architecture and framework were designed for Fully Convolutional Neural Networks for LIDAR–camera fusion in pedestrian detection. Additionally, a functional algorithm for precise pedestrian detection and identification within a range of 10 to 30 m was presented. Performance indices confirmed the effectiveness of the proposed model.
2.2. Vehicles Detection
One of the earliest studies that identified vehicles features and tracked them at freeway sections was presented in [34]. A hybrid technique that integrates Kalman filtering and a Kanade–Lucas–Tomasi feature tracker has been developed for feature-based tracking on highway sections. This approach enabled the computation of traffic parameters such as flow rate, average speed, and average spatial headway for each lane separately using the proposed methodology in [35]. The approach was further extended by [26] to include vehicle tracking at intersections. The tracking algorithm was adopted from [34], while the transformation homography was changed to accommodate the spatial geometric features at intersections. However, several errors were identified in feature grouping at long distances, along with errors caused by camera jitter, issues arising from over-segmentation of trucks and buses, and instances of over-grouping. To address these common challenges in tracking systems, ref. [25] proposed a hybrid strategy to resolve problems related to appearance and disappearance, splitting, and partial occlusion by leveraging the interaction between objects and regions’ characteristics. A combination of low-level image-based tracking and a high-level Kalman filter was employed for position and shape estimation in [20] to investigate traffic conflicts at intersections using video monitoring. The image segmentation process utilized a mixture of Gaussian models as described in [36]. The tracking process involved determining the bounding box for each moving object at each frame based on timestamps, labels, velocities, and other features. A conflict detection module accompanied by a friendly user interface was utilized to predict potential collisions between vehicles by comparing the measured distances between bounding boxes to a minimum threshold value.
Drones have been utilized in vehicles detection and safety analysis in [37]. A valuable imagery dataset, CitySim, that included drone-derived vehicle trajectories was utilized. CitySim encompasses a total of 1140 min of video footage that was recorded at 12 different sites. Various intersection configurations and different road layouts were included in the dataset to provide valuable insight for the safety assessment process conduction. Expanding upon this foundation, Wu et al. introduced an innovative automated system to detect traffic conflicts entitled “Automated Roadway Conflict Identification System” (ARCIS) [38]. The method involved the utilization of a Mask R-CNN within the system to increase the precision of vehicle detection within unmanned aerial vehicle (UAV) video footage. Following this, a channel and spatial reliability tracking algorithm was implemented to effectively monitor the identified vehicles and subsequently derive their trajectories. Subsequently, dimensions and location information were extracted utilizing pixel-to-pixel masks. The study is notably centered around the computation of PET at a granular pixel level, thereby enabling the detection of potential conflicts through a comparison of the computed PET values against a predefined threshold.
A recent study by Abdel-Aty et al. utilized extracted video footage from closed-circuit television (CCTV) to identify vehicle-to vehicle conflicts [39]. Their integrated framework consists of a Mask-RCNN for bounding box detection and the Occlusion-Net algorithm for key point detection. The detection accuracy was evaluated by comparing the results after transformation to top-down view with ground truth data obtained from a drone video camera installed at the center of the intersection, providing a bird’s-eye perspective. The results showed that the proposed framework significantly enhanced the precision of localization from the 2D plan view, whereas PET values were successfully utilized to identify traffic conflicts between vehicles. However, the assessment process utilizing the intersection over union (IoU) metric showed that only 28% of the vehicles were accurately detected by the integrated framework.
Another distinct study proposed an integrated detection system aimed at addressing the previously mentioned constraints. This solution combined the functionalities of CCTV cameras and LIDAR technology using sensor fusion techniques and trajectory derivation [40]. The system encompassed concurrent real-time detection using both CCTV cameras and LIDAR. The outcomes of these detections were subsequently subjected to processing within a sensor fusion module to produce comprehensive vehicle trajectories. Remarkably, this methodology showcased its capability for real-time detection and tracking. The evaluation metrics indicated precision rates of 90.32% for camera-based detection and 97% for LIDAR-based detection, while the fusion approach accurately identified 97.38% of the tracked vehicles. Nevertheless, it is important to note that this study exhibited certain limitations, including a relatively lower recall percentage for the LIDAR component. Furthermore, the study’s scope did not encompass pedestrians and bicyclists, which regrettably led to the omission of conflicts involving these vulnerable road users.
These recent studies demonstrate the ongoing efforts to leverage CCTV cameras, drones, LIDAR, and sensor fusion techniques for traffic monitoring, vehicle detection, tracking, and safety analysis. By combining multiple data sources and advanced algorithms, researchers aim to improve the accuracy and efficiency of existing systems and address the challenges associated with occlusions, over-segmentation, and over-grouping. However, limitations related to restricted drone height, real-time surveillance duration, and challenges posed by adverse weather conditions, in addition the limitations posed by the data fusion process needed to match the extracted data from LIDARs and surveillance cameras as well as the high cost of implementation and calibration of these techniques, are the main restrictions impeding the widespread use of these techniques in the safety assessment process. Moreover, using a single camera at an intersection limits the field of view, and it may miss critical angles, leading to incomplete detection of traffic conflicts between vehicles and pedestrians. In contrast, utilizing multiple cameras can provide comprehensive coverage, capturing diverse angles and perspectives, thereby enhancing the accuracy and reliability of identifying traffic conflicts and improving overall intersection safety.
Our research aims to address existing gaps by presenting a detailed framework that integrates video footage from multiple cameras (i.e., three) at signalized intersections. The framework employs CNN-based algorithms to detect key points of road users, including pedestrians and vehicles. Subsequently, a comprehensive post-processing technique is established to project output coordinates to a top-down view, integrating extracted key points from each camera simultaneously. This allows for the reconstruction of vehicle polygons and pedestrians, extraction of road user trajectories, and accurate analysis of traffic conflict instances.
3. Methodology
A comprehensive methodology was employed consisting of sequenced steps. The first step involved collecting video footage from multiple cameras mounted at the study site. These recordings were conducted simultaneously across all cameras to ensure frame alignment and covered both weekdays and weekends, including morning and evening peak periods, thereby providing a well-distributed sample. The coverage of each camera was evaluated, and overlapping FOVs were established.
The second step focused on video analytics using two CNN-based algorithms. Pedestrians were detected with YOLOv7-human-pose-estimation, which identifies 17 key points per person, while vehicles were detected with the Open Pose in Full Pose Articulation Framework (OpenPifPaf), which extracts 24 vehicle key points based on a pre-trained model. Regions of interest were defined through preliminary trials to optimize detection, after which the full dataset was analyzed using these calibrated settings.
In the final step, a post-processing framework transformed the extracted coordinates of road users into a top-down view and integrated detections across cameras on a frame-by-frame basis. Within overlapping FOVs, missing vehicle key points from one camera were restored using detections from other cameras; if an object was captured by only one camera, missing key points were inferred using average vehicle dimensions. TTC was then calculated to identify instances of traffic conflicts. The overall framework for multi-camera conflict identification is illustrated in Figure 1.
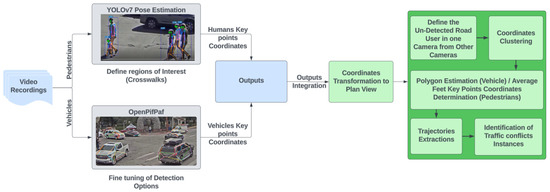
Figure 1.
Traffic conflicts identification framework.
3.1. Data Preparation
A total of 72 h of real-time and previously recorded video footage was extracted from three CCTV cameras mounted at a rural signalized intersection in Jackson Hole, Wyoming, known as the Town Square intersection. This data served two main tasks: (a) examining the strengths and weaknesses of the proposed detection algorithms and (b) extracting a set of pedestrian-involved traffic conflicts to assess the framework’s performance in identifying conflict instances. Notably, the identification of traffic conflicts followed a structured methodology outlined in “Traffic Conflict Techniques for Safety and Operations” by the Federal Highway Administration (FHWA) [41]. Table 1 presents the distribution of the 72 h of video recordings and the corresponding number of overall observed conflicts across weekdays and weekends, separated by morning peak, evening peak, and off-peak periods.

Table 1.
Temporal distribution of video recording hours and conflict observations by day classification and time-of-day periods.
Table 2 shows the distribution of the observed conflicts. The pedestrian-involved conflicts will be utilized in the validation process of the framework. The Surrogate Safety Assessment Model (SSAM) defines the standard conflict to have occurred at a TTC of 1.50 s and the serious conflict at 1.0 s. Hence, a threshold of 1.50 s is selected for TTC values in the observation process.

Table 2.
Observed conflict set.
Figure 2 illustrates the distribution of the three surveillance cameras, their coverage areas, and the zones of obstruction for each. It also shows the intersecting fields of view and the relative positions of the crosswalks from each camera’s perspective.
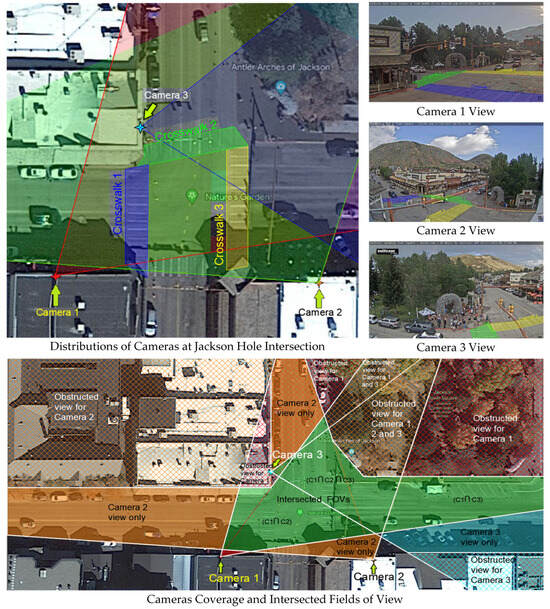
Figure 2.
Cameras positions and views at study intersection.
3.2. Algorithms Formulations
The analysis of the collected data involved a comparative evaluation to assess the effectiveness of each chosen algorithm in addressing the primary challenges associated with vehicle and pedestrian detection methodologies.
Ground truth data for validation was generated through manual annotation. A representative subset of frames (1200 for pedestrians and 1050 for vehicles) was extracted across different environmental conditions. For each frame, pedestrians and vehicles were annotated with bounding boxes and key points by trained research assistants. Annotations were independently reviewed and reconciled by a second annotator to ensure consistency. This manual approach provided a reliable baseline for calculating Precision, Recall, F1-score, and IoU.
3.2.1. Pedestrians Detection (YOLOv7 Human-Pose-Estimation Algorithm)
The common challenges that hinder pedestrian detection methodologies include: (a) differentiating between the movement patterns of pedestrians, (b) restoring undetected pedestrian coordinates due to partial occlusion or color blending with the background, and (c) tracking a single pedestrian from entry to exit within the region of interest. To address these challenges, a key point detection algorithm was proposed to improve pedestrian representation.
The human pose estimation algorithm, available on Rizwan Munawar’s GitHub repository under “YOLOv7-pose-estimation”, provides a bounding box for each detected person and identifies 17 key points distributed across human joints and facial features. A detailed description of these key points can be found in Serge Retkowsky’s GitHub repository.
Initially, the recorded video footage was synchronized for each camera viewpoint to ensure the same number of frames and timestamps. Sample videos were then analyzed to assess detection accuracy and identify regions of interest, such as crosswalks where pedestrian and vehicle interactions commonly occur. The original footage from each camera did not yield optimal detection results, so video images were cropped to focus specifically on the crosswalks. Video analysis was subsequently performed on these cropped videos.
While single-camera analysis accurately detected most pedestrians passing through the regions of interest, a small number of pedestrians at the entrances and exits of each camera’s field of view remained undetected. Additionally, partial occlusions and color blending with the background further constrained detection accuracy. The integration of multiple cameras helps address these issues by restoring undetected pedestrians’ coordinates at the entrance and exit points of each camera’s field of view, differentiating movement patterns, and overcoming color blending challenges at various video resolutions.
Pedestrian Detection Assessment
The detection accuracy of the integrated three-camera framework was evaluated using 1200 frames across different environmental conditions. The combined framework consistently achieved the highest accuracy, with average IoU values ranging from 0.868 to 0.956.
When assessed individually, Camera 1 performed best under clear daytime conditions (IoU = 0.879), with slightly reduced accuracy during snowy congestion (0.826) and further decline under rainy/nighttime scenarios (0.453). Camera 2 also showed strong performance, with IoU of 0.866 in clear daytime, 0.812 in snowy congestion, and 0.411 in rainy/nighttime conditions. Camera 3, due to its limited field of view and top-down perspective, consistently exhibited the lowest accuracy, with IoUs of 0.570 in clear daytime, 0.428 in snowy congestion, and 0.283–0.397 in rainy/nighttime conditions.
Despite these limitations, the multi-camera integration substantially enhanced overall detection performance. The complementary use of Cameras 1 and 2 mitigated the effects of occlusions and adverse conditions, while Camera 3, although weaker in isolation, contributed additional coverage that improved robustness in congested areas.
The reduced performance of Camera 3 can be attributed to both its field of view and its positioning. Specifically, Camera 3 provided only partial coverage of Crosswalks 2 and 3 and no coverage of Crosswalk 1, restricting its effectiveness in supporting detection and trajectory correction when integrated with the other two cameras. Furthermore, its top-down perspective led to occasional false detections and distorted outputs for pedestrians located directly beneath the camera, reflecting a limitation of the pose estimation algorithm under that configuration. Despite these drawbacks, Camera 3 still added complementary value in congested situations at Crosswalk 2. In such cases, its additional perspective helped compensate for partial occlusions encountered by Cameras 1 and 2, enabling the recovery of pedestrian trajectories that would otherwise have been lost. Accordingly, while Camera 3 demonstrated lower standalone accuracy, it contributed to strengthening the robustness of the overall multi-camera framework.
To provide a more comprehensive evaluation, Recall and F1-score were also computed in addition to IoU. As summarized in Table 3, Camera 1 and Camera 2 achieved relatively high Precision, Recall, and F1-score values, while Camera 3 lagged due to its limited coverage and perspective. The integrated framework consistently outperformed the individual cameras across all metrics, achieving an F1-score above 94%, which demonstrates the effectiveness of multi-camera fusion in mitigating occlusion effects and enhancing detection reliability.

Table 3.
Pedestrian detection metrics across multiple cameras.
The following figures illustrate how multi-camera integration resolves common challenges. Figure 3 demonstrates the recovery of undetected pedestrian feet key points at the exit of a crosswalk by employing multi-camera coverage. In the upper image from Camera 1, pedestrian feet key points are not detected once the pedestrian moves beyond the camera’s FOV. The red frame in the trajectory plot from Camera 1 highlights the specific area where these detections are missing. In the lower image from Camera 2, the same region is covered, allowing the recovery of the missing detections and ensuring continuous monitoring along Crosswalk 1. Figure 4 addresses the color-blending issue, where Camera 2 failed to detect a pedestrian under poor lighting and resolution, while Camera 1 successfully captured the pedestrian. The numbers (1–4) denote the sequential progression of the pedestrian over time as observed in both cameras, highlighting the difference between steady detections in Camera 1 and unsteady detections in Camera 2. Figure 5 highlights how the integration of all three cameras mitigates partial occlusions during congestion, reducing the likelihood of misdetections. Finally, Figure 6 illustrates movement pattern analysis, comparing a pedestrian pulling a suitcase at a steady pace with a teenager crossing more rapidly, with the extracted walking speed profiles effectively capturing these differences.
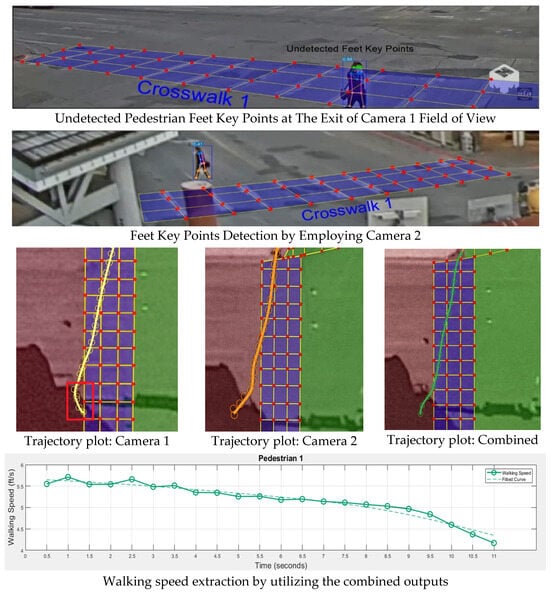
Figure 3.
Restore the undetected key points at region’s exit of a single camera.
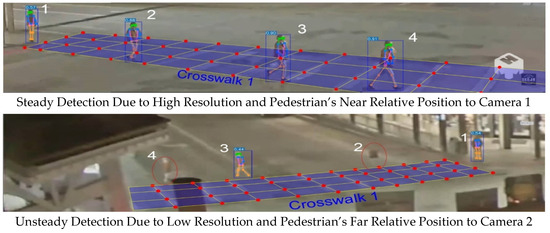
Figure 4.
Addressing color blend issue and low image resolution by integrating multiple cameras for detection.
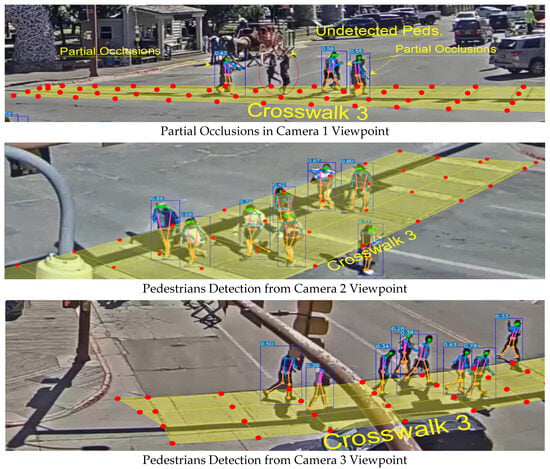
Figure 5.
Integration of three cameras to detect pedestrians at congestions.
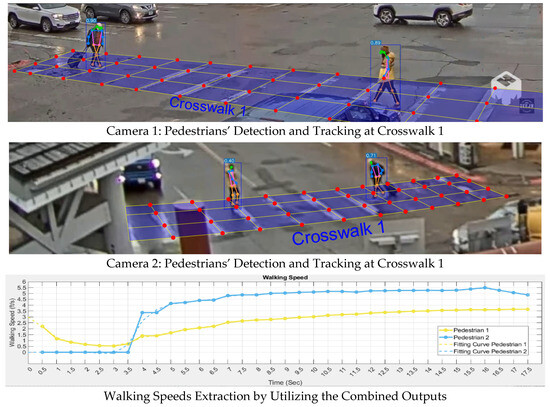
Figure 6.
Detection of pedestrians using the proposed framework [42].
Consequently, the integration between the detected pedestrians’ coordinates will be performed on the extracted outputs after transformation to plan view to validate the results, improve their accuracy, and detect the missing pedestrians from one of the cameras by employing the detection from other cameras. While for the undetected pedestrians that are located in a single camera’s field of view, the localization for them in the missing frames will be restored in the post process phase by employing their relative positions in the frames that they were detected in.
3.2.2. Vehicles Detection (OpenPifPaf Algorithm)
Vehicle detection was initially evaluated using three algorithms. The first, YOLOv7, provides bounding boxes for detected vehicles and was trained on the COCO dataset, which includes 80 object categories, demonstrating strong performance in large-scale training environments [43]. The second, CenterTrack, was developed for autonomous driving applications and produces 3D bounding boxes using point-level annotations. It offers an end-to-end solution for monocular 3D detection and tracking, achieving competitive accuracy and processing speed compared to Faster R-CNN and RetinaNet [44]. The third, OpenPifPaf, extends a bottom-up pose estimation framework [45] to vehicle detection, predicting 24 key points per vehicle based on the ApolloCar3D dataset, which contains over 60,000 labeled cars in high resolution. The pretrained ShuffleNet model was applied for inference, providing a geometric representation of vehicles beyond bounding boxes [46]. Figure 7 illustrates example outputs from the three algorithms for the same vehicles.

Figure 7.
Video analytics outputs for vehicle detection algorithms.
The analysis of vehicle detection results indicates that YOLOv7 provides accurate bounding-box detections; however, these outputs are less effective for analyzing vehicle trajectories once transformed into a plan view. In contrast, CenterTrack performs well in handling occluded vehicle parts but is constrained by its design, which is optimized for in-vehicle camera perspectives at lower elevations [47]. This limitation prevents CenterTrack from adequately covering entire intersection approaches, including entrance and exit zones, when relying on a single overhead camera. A common limitation of both YOLOv7 and CenterTrack is that their detection outputs do not accurately represent the actual dimensions of detected vehicles, which can lead to inconsistencies in trajectory estimation and potentially inflate false warnings when applied in safety assessment tools.
OpenPifPaf, by contrast, yields accurate detection of vehicle key points, offering stronger geometric representation of vehicle outlines. Its primary limitation lies in detecting heavily occluded key points; however, this challenge can be mitigated by integrating additional cameras with varied viewpoints or by estimating missing points using detected ones and inferring from average vehicle dimensions.
To validate the choice of OpenPifPaf, its performance is compared with YOLOv7 and CenterTrack on the same 1050-frame test set. OpenPifPaf achieved a Precision of 98.2%, Recall of 96.4%, an average IoU of 0.955, and an F1-score of 97.3%, outperforming YOLOv7 (Precision = 92.1%, Recall = 91.5%, IoU = 0.78, F1-score = 91.5%) and CenterTrack (Precision = 90.3%, Recall = 89.6%, IoU = 0.81, F1-score = 89.9%). These findings are consistent with earlier comparative study [48], which confirmed the superior robustness of OpenPifPaf for vehicle safety assessment tasks.
In this study, vehicle key-point detection was performed using OpenPifPaf with the standard command predict and the flag --checkpoint=shufflenetv2k16-apollo-24, which identifies vehicles with 24 key points. As the framework is designed for multi-camera integration and top-down transformation, only key points near ground level were utilized for consistent geometric representation. Figure 8 illustrates the detection process for a vehicle appearing in the overlapping fields of view of all three cameras. Cameras 1 and 2 provide extensive coverage of vehicle approaches, including entrance, interior, and exit areas of the intersection, while Camera 3 partially covers the east approach and Crosswalks 2 and 3.

Figure 8.
Vehicle key points detection using three cameras.
Vehicle Detection Assessment
The evaluation of the proposed vehicle detection framework using 1050 frames demonstrated strong overall performance, achieving a Precision of 98.2%, Recall of 96.4%, an F1-score of 97.3%, and an average IoU of 0.955, with a false detection rate of 2.35%. When examined individually, clear daytime conditions consistently yielded the highest IoU values across cameras, followed by snowy daytime and then rainy nighttime scenarios. Specifically, Camera 1 detected 8785 vehicles with an IoU of 0.447 in clear daytime, compared to 0.427 in snowy daytime and 0.374 in rainy nighttime. Camera 2 performed the strongest overall, with 8995 vehicles detected at an IoU of 0.519 in clear daytime, 0.474 in snowy daytime, and 0.460 in rainy nighttime. Camera 3 showed the weakest performance, with IoUs of 0.303 in clear daytime, 0.302 in snowy daytime, and 0.299 in rainy nighttime. Despite these limitations, the integrated multi-camera framework consistently outperformed the individual cameras, maintaining high accuracy across conditions and closely aligning with ground truth values. These results underscore the advantage of multi-camera fusion in mitigating environmental and positional constraints.
4. Post Processing
In this stage, transformation matrices were calculated to project detected key points from each camera into a common plan view. Once projected, these points were clustered and tracked frame by frame, enabling the calculation of traffic flow parameters and TTC.
4.1. Camera Calibration
A Google Earth image of the intersection served as the plan view reference. However, direct mapping was challenging due to limited feature points and camera distortions: Camera 1 exhibited linear distortion, while Cameras 2 and 3 showed curvilinear distortion from fisheye lenses. To address these issues, a correction procedure based on perspective geometry was applied [42]. This involved identifying vanishing points, redrawing crosswalk lines, and constructing modified grids across all camera views, as shown in Figure 9. These grids ensured that pedestrian key points from different cameras could be aligned accurately.
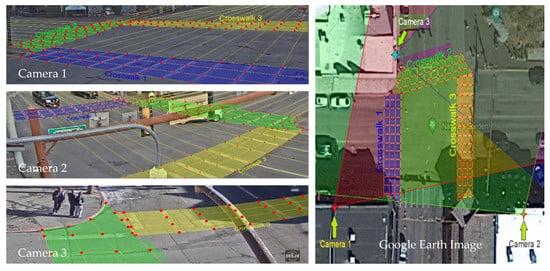
Figure 9.
Unified grid points for crosswalks.
For vehicles, the intersection was divided into distinct regions corresponding to each camera’s view. Within each region, feature points were extracted separately to ensure accurate projection of vehicle key points into the plan view, as illustrated in Figure 10.

Figure 10.
Regions identification for vehicle key points transformation from Camera 2.
4.2. Outputs Concatenation and Trajectories Extraction
To analyze interactions between road users, the outputs of both pedestrian and vehicle detection algorithms were extracted, synchronized across camera viewpoints, and consistently linked throughout the video sequence.
For pedestrians, YOLOv7-pose estimation provided key points, with the ground-level references being the left and right feet (IDs 15 and 16). After projecting these onto the plan view (using the Google Earth reference image), the center point between the feet was calculated for each camera. A threshold of 10 pixels was then applied to associate center points across cameras and generate averaged coordinates. Pedestrian trajectories were constructed through an additional tracking loop across successive frames, using a positional threshold to maintain continuity. The resulting trajectories were plotted on the plan view with respect to time, ensuring consistent detection even under partial occlusion.
For vehicles, OpenPifPaf was used to detect eight ground-level key points, including wheel centers, headlights, and taillights (IDs 5, 6, 8, 9, 15, 16, 19, and 20). As not all key points were visible in a single camera, coordinates from multiple cameras were integrated. A 25-pixel threshold was applied to associate and track vehicle key points across frames, resulting in robust trajectory reconstruction.
This concatenation process ensures that both pedestrian and vehicle trajectories are accurately maintained over time and across cameras, forming the foundation for reliable traffic conflict analysis in the subsequent framework application.
4.3. Framework Application
Based on the observed pedestrian-involved conflicts at the case study intersection (Table 2), it was found that 19 conflicts involved eastbound right-turning vehicles at Crosswalk 1, while 14 involved northbound left-turn vehicles with Crosswalk 2. The detection framework was applied to this conflict set to calculate the minimum TTC value with respect to the timestamp.
Analysis of a pedestrian conflict with a right-turning vehicle is demonstrated in Figure 11. Initially, the driver of a silver sports utility vehicle (SUV) failed to notice the crossing pedestrians due to an obstructive wooden fence. As the SUV approached Crosswalk 1, the driver noticed the two elderly pedestrians and applied the brakes sharply to avoid a collision.
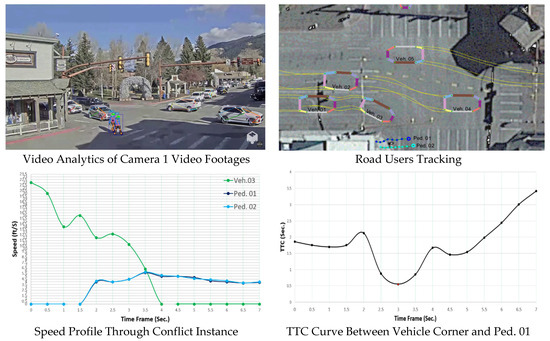
Figure 11.
Application of conflict detection framework.
The speed profile for the two pedestrians shows a relative increase in their walking speeds between the third and fourth seconds as they realized the potential collision with the vehicle. In response, they attempted to move quickly to avoid an accident. Simultaneously, the vehicle driver applied the brakes abruptly within the same timeframe upon noticing the pedestrians crossing the intersection. Notably, the pedestrians’ speed profile indicates they were moving at the same pace, as they were walking side by side.
To identify traffic conflicts, the spatial distribution of vehicle key points relative to pedestrians’ positions is analyzed to determine the nearest points over time. Subsequently, a TTC curve is plotted to pinpoint the minimum TTC value versus the timestamp. This curve can also highlight the relative increase in the TTC value as the driver slows down before making the right turn and then the sudden decrease just before recognizing the two pedestrians and applying the brakes sharply.
The analysis of the 33 observed conflicts revealed distinct patterns for eastbound right-turn and northbound left-turn vehicles. For eastbound right-turn conflicts, it was noted that most vehicles initiated the turn from the second lane, influenced by on-street parking, resulting in a sharper turn radius. Furthermore, the obstruction caused by a wooden entrance on the sidewalk significantly impairs drivers’ ability to detect pedestrians at Crosswalk 1. The minimum TTC values for these 21 conflicts ranged between 0.65 and 1.18 s with a standard deviation of 0.167.
In the case of northbound left-turn conflicts, it was frequently observed that vehicles abruptly applied brakes due to pedestrians undetected at Crosswalk 2, moving northbound. This sudden braking behavior increases the risk of rear-end collisions with following vehicles. The TTC values for these conflicts ranged from 0.55 to 0.944 s and a standard deviation of 0.124, underscoring the higher severity due to the relatively greater speed of left-turning vehicles compared to right-turning vehicles, Figure 12.
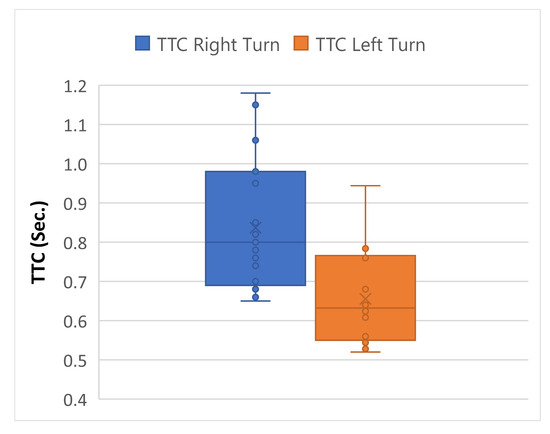
Figure 12.
Box plot of two pedestrian-involved conflicts statistics.
5. Discussions
This study successfully analyzed pedestrian and vehicle trajectories at signalized intersections by integrating the FOVs of three surveillance cameras, irrespective of their types or output resolutions. A detection framework was proposed based on the integration of two pose estimation computer vision algorithms to enhance the detection accuracy of road users, thereby improving safety assessments. The integration of multi-camera systems with intersecting FOVs effectively addressed issues such as pedestrian clothing blending with the background, partial occlusions, and inconsistent tracking from the entrance to the exit of the area of interest. This integration also facilitated the recovery of undetected vehicle key points from a single camera, aiding in the accurate localization of vehicle polygons within the intersection area.
The selection of three cameras in this study was informed by principles of multi-view image reconstruction. From a geometric standpoint, two cameras are theoretically sufficient to relocate a point in 3D space; however, a third camera ensures that each targeted key point is observed by at least two cameras under most conditions, thereby improving detection reliability. Given that the key points of interest lie on the ground plane, the reference geometry provides an additional validation layer that further enhances spatial accuracy. Thus, the use of three cameras offers a practical balance, as it provides robust overlapping FOVs to minimize the risk of relying on a single camera, while avoiding the complexity and diminishing returns associated with integrating larger numbers of cameras.
Comparable studies have investigated conflict detection and multi-camera systems at intersections, though often with limited configurations. For instance, double-camera setups have been shown to reduce occlusion errors and improve continuity in trajectory reconstruction, but residual blind spots remain at the periphery of the FOV [9]. Other recent approaches have explored digital twin frameworks integrating YOLOv5 and DeepSORT for real-time vehicle detection and trajectory tracking [10] as well as enhanced pedestrian re-identification methods using MotionBlur augmentation to mitigate occlusions [11]. Compared with these strands, the proposed multi-camera integration provides both redundancy and broader spatial coverage, ensuring that most key points are visible in at least two views. This not only improves robustness relative to two-camera systems but also establishes a deployable framework for consistent plan-view trajectory reconstruction suitable for conflict analysis.
To project the detected key points onto the intersection plan, a correction procedure was implemented to mitigate distortions in the camera perspectives, based on the examination of linear and curvilinear principles. The projected key points for both vehicles and pedestrians were clustered and concatenated, allowing for the reconstruction of their trajectories. A pixel threshold of 10 pixels was selected for tracking pedestrian feet key points through successive frames. Similarly, for vehicle key points at or near ground level, a 25-pixel threshold was set for consistent tracking.
In the validation process, the 33 pedestrian conflicts were analyzed by selecting the nearest key points to pedestrian trajectories based on minimum distance calculations. Speed profiles and TTC values versus timestamps were plotted to evaluate the framework’s accuracy. The conflict set included two types of pedestrian conflicts: eastbound right-turning vehicles and northbound left-turning vehicles.
The analysis revealed that TTC values for left-turning vehicles ranged from 0.55 to 0.944 s, which represented a 28% average decrease compared to right-turning movements. Additionally, left-turning vehicles exhibited a 43% increase in speed and a higher likelihood of secondary rear-end conflicts due to abrupt braking.
Beyond the baseline results, the framework also demonstrates opportunities for optimization to strengthen its applicability in real-world deployments. For pedestrian detection, YOLOv7 performance can be enhanced through site-specific fine-tuning, data augmentation for low-light and adverse weather scenarios, and focusing on cropped regions of interest such as crosswalks to reduce background noise. For vehicles, OpenPifPaf’s limitation under occlusion is addressed in the post-processing stage, where missing key points projected to the plan view are reconstructed using the geometry of detected points and average vehicle dimensions. This occlusion recovery step improves the completeness and reliability of vehicle trajectories, particularly under congested or obstructed conditions. Together with the multi-camera fusion, which mitigates single-camera weaknesses, these adaptations reinforce the robustness of the framework and highlight its potential for diverse urban traffic environments.
It should be noted that the framework developed here represents the first step in a multi-level safety assessment process. By providing reliable detection and trajectory reconstruction of road users, the system establishes a basis for subsequent conflict identification. Although this study does not evaluate surrogate safety measures directly, the detected interactions and associated kinematics can, in future work, be integrated into higher-level severity estimation approaches to provide deeper insights into crash likelihood and risk.
In summary, this study advances traffic safety research by introducing a three-camera fusion framework specifically tailored to intersections, ensuring redundancy and robustness beyond conventional camera systems. By integrating pose-estimation algorithms for both pedestrians and vehicles, the framework reconstructs precise trajectories that are then corrected into a unified plan view, bridging raw computer vision outputs with conflict analysis requirements. The approach is designed for deployment within existing surveillance infrastructure, underscoring its practical value for transportation agencies. Moreover, by establishing detection and trajectory reconstruction as the foundational layer for severity estimation, the framework sets the stage for integrating conflict kinematics into higher-level crash simulation models, thereby paving the way toward replacing traditional crash-based assessments with proactive conflict-based safety analysis.
6. Conclusions
This work introduced a multi-camera framework that enhances the detection and tracking of road users at signalized intersections. The approach not only improves accuracy under challenging conditions such as occlusion and background blending but also produces trajectory data that can be directly applied to safety evaluation, with particular relevance for vulnerable road users. The framework has clear value for agencies and practitioners, as it can be deployed with existing surveillance infrastructure to generate reliable evidence for diagnosing safety issues at intersections and guiding targeted countermeasures. Its compatibility with conventional infrastructure also supports the design of next-generation intelligent monitoring systems, linking established traffic engineering practice with advanced data-driven safety management.
While the study was conducted under controlled video conditions, which minimized the need to account for stochastic sensor faults and cybersecurity concerns, these aspects will be important to consider for real-world deployments. Future work will therefore focus on integrating surrogate safety measures, severity estimation, and basic safeguards against cyber vulnerabilities to further extend the framework’s applicability in proactive traffic safety analysis.
Author Contributions
Study conception and design, A.M. and M.M.A.; data preparation and reduction, A.M.; analysis and interpretation of results, A.M. and M.M.A.; draft manuscript preparation, A.M. All authors have read and agreed to the published version of the manuscript.
Funding
This work was initially supported by the Wyoming Department of Transportation (WYDOT) under Grant No. RS04221 and was subsequently continued with support from the Federal Highway Administration (FHWA) and the University of Cincinnati’s Center for Safe, Intelligent, Equitable, and Sustainable Transportation.
Institutional Review Board Statement
Not applicable.
Informed Consent Statement
Not applicable.
Data Availability Statement
The data supporting the findings of this study is available from the corresponding author upon reasonable request.
Acknowledgments
This work was supported in part by the FHWA and the Center for Safe, Intelligent, Equitable & Sustainable Transportation at the University of Cincinnati. The writing was enhanced by using ChatGPT (GPT-5), which helped in checking for grammatical errors and paraphrasing sentences in a more concise manner.
Conflicts of Interest
The authors declare no competing interests.
References
- Federal Highway Administration, U.S. Department of Transportation. Traffic Safety Facts. 2024. Available online: https://highways.dot.gov/research/research-programs/safety/intersection-safety (accessed on 14 June 2025).
- Kim, D.-G.; Washington, S.; Oh, J. Modeling Crash Types: New Insights into the Effects of Covariates on Crashes at Rural Intersections. J. Transp. Eng. 2006, 132, 282–292. [Google Scholar] [CrossRef]
- Cicchino, J.B. Effects of Automatic Emergency Braking Systems on Pedestrian Crash Risk. Accid. Anal. Prev. 2022, 172, 106686. [Google Scholar] [CrossRef]
- Mohanty, M.; Panda, R.; Gandupalli, S.R.; Arya, R.R.; Lenka, S.K. Factors Propelling Fatalities during Road Crashes: A Detailed Investigation and Modelling of Historical Crash Data with Field Studies. Heliyon 2022, 8, e11531. [Google Scholar] [CrossRef] [PubMed]
- Diaz-Corro, K.J.; Moreno, L.C.; Mitra, S.; Hernandez, S. Assessment of Crash Occurrence Using Historical Crash Data and a Random Effect Negative Binomial Model: A Case Study for a Rural State. Transp. Res. Rec. J. Transp. Res. Board 2021, 2675, 38–52. [Google Scholar] [CrossRef]
- Wu, H.; Gao, L.; Zhang, Z. Analysis of Crash Data Using Quantile Regression for Counts. J. Transp. Eng. 2014, 140, 04013025. [Google Scholar] [CrossRef]
- Sayed, T.; Brown, G.; Navin, F. Simulation of traffic conflicts at unsignalized intersections with TSC-Sim. Accid. Anal. Prev. 1994, 26, 593–607. [Google Scholar] [CrossRef]
- Sayed, T.; Zein, S. Traffic conflict standards for intersections. Transp. Plan. Technol. 1999, 22, 309–323. [Google Scholar] [CrossRef]
- Otković, I.I.; Deluka-Tibljaš, A.; Zečević, Đ.; Šimunović, M. Reconstructing Intersection Conflict Zones: Microsimulation-Based Analysis of Traffic Safety for Pedestrians. Infrastructures 2024, 9, 215. [Google Scholar] [CrossRef]
- Kan, H.; Li, C.; Wang, Z. Enhancing Urban Traffic Management through YOLOv5 and DeepSORT Algorithms within Digital Twin Frameworks. Mechatron. Intell. Transp. Syst. 2024, 3, 39–54. [Google Scholar] [CrossRef]
- Xue, Z.; Yao, T. Enhancing Occluded Pedestrian Re-Identification with the MotionBlur Data Augmentation Module. Mechatron. Intell. Transp. Syst. 2024, 3, 73–84. [Google Scholar] [CrossRef]
- Amundsen, F.H.; Hydén, C. The Swedish Traffic Conflicts Technique. In International Calibration Study of Traffic Conflict Techniques; Institute of Transport Economics: Oslo, Norway, 1977. [Google Scholar]
- Federal Highway Administration (FHWA). Traffic Conflict Technique for Safety and Operations—Observers Manual; Report No. FHWA-IP-88-027; U.S. Department of Transportation: Washington, DC, USA, 2019. [Google Scholar]
- Liang, J.; Li, Y.; Yin, G.; Xu, L.; Lu, Y.; Feng, J.; Shen, T.; Cai, G. A MAS-Based Hierarchical Architecture for the Cooperation Control of Connected and Automated Vehicles. IEEE Trans. Veh. Technol. 2022, 72, 1559–1573. [Google Scholar] [CrossRef]
- Liang, J.; Yang, K.; Tan, C.; Wang, J.; Yin, G. Enhancing High-Speed Cruising Performance of Autonomous Vehicles through Integrated Deep Reinforcement Learning Framework. IEEE Trans. Intell. Transp. Syst. 2024, 26, 835–848. [Google Scholar] [CrossRef]
- Ismail, K.A. Application of Computer Vision Techniques for Automated Road Safety Analysis and Traffic Data Collection. Ph.D. Thesis, University of British Columbia, Vancouver, BC, Canada, 2010. [Google Scholar]
- Essa, M.; Sayed, T. Simulated Traffic Conflicts: Do They Accurately Represent Field-Measured Conflicts? Transp. Res. Rec. J. Transp. Res. Board 2015, 2514, 48–57. [Google Scholar] [CrossRef]
- Hou, J.; List, G.F.; Guo, X. New Algorithms for Computing the Time-to-Collision in Freeway Traffic Simulation Models. Comput. Intell. Neurosci. 2014, 2014, 761047. [Google Scholar] [CrossRef] [PubMed]
- Magee, D.R. Tracking Multiple Vehicles Using Foreground, Background and Motion Models. Image Vis. Comput. 2004, 22, 143–155. [Google Scholar] [CrossRef]
- Maurin, B.; Masoud, O.; Papanikolopoulos, N. Tracking All Traffic—Computer Vision Algorithms for Monitoring Vehicles, Individuals, and Crowds. IEEE Robot. Autom. Mag. 2005, 12, 29–36. [Google Scholar] [CrossRef]
- Stauffer, C.; Grimson, W. Learning Patterns of Activity Using Real-Time Tracking. IEEE Trans. Pattern Anal. Mach. Intell. 2000, 22, 747–757. [Google Scholar] [CrossRef]
- Veeraraghavan, H.; Masoud, O.; Papanikolopoulos, N. Computer Vision Algorithms for Intersection Monitoring. IEEE Trans. Intell. Transp. Syst. 2003, 4, 78–89. [Google Scholar] [CrossRef]
- Dahlkamp, H.; Pece, A.E.C.; Ottlik, A.; Nagel, H.-H. Differential Analysis of Two Model-Based Vehicle Tracking Approaches. In Proceedings of the Pattern Recognition, 26th DAGM Symposium, Tübingen, Germany, 30 August–1 September 2004. [Google Scholar]
- Koler, D.; Weber, J.; Malik, J. Robust Multiple Car Tracking with Occlusion Reasoning. UC Berkeley Working Paper No. UCB/CSD-93-780, 1993. Available online: https://escholarship.org/uc/item/49c0g7p8 (accessed on 14 June 2025).
- Cavallaro, A.; Steiger, O.; Ebrahimi, T. Tracking Video Objects in Cluttered Background. IEEE Trans. Circuits Syst. Video Technol. 2005, 15, 575–584. [Google Scholar] [CrossRef]
- Saunier, N.; Sayed, T. A Feature-Based Tracking Algorithm for Vehicles in Intersections. In Proceedings of the 3rd Canadian Conference on Computer and Robot Vision (CRV’06), Quebec, QC, Canada, 7–9 June 2006; p. 59. [Google Scholar]
- Enzweiler, M.; Gavrila, D.M. Monocular Pedestrian Detection: Survey and Experiments. IEEE Trans. Pattern Anal. Mach. Intell. 2009, 31, 2179–2195. [Google Scholar] [CrossRef]
- Dollar, P.; Wojek, C.; Schiele, B.; Perona, P. Pedestrian Detection: An Evaluation of the State of the Art. IEEE Trans. Pattern Anal. Mach. Intell. 2012, 34, 743–761. [Google Scholar] [CrossRef]
- Zhang, S.; Benenson, R.; Schiele, B. CityPersons: A Diverse Dataset for Pedestrian Detection. In Proceedings of the 2017 IEEE Conference on Computer Vision and Pattern Recognition (CVPR), Honolulu, HI, USA, 21–26 July 2017. [Google Scholar]
- Alahi, A.; Bierlaire, M.; Vandergheynst, P. Robust Real-Time Pedestrians Detection in Urban Environments with Low-Resolution Cameras. Transp. Res. Part C Emerg. Technol. 2014, 39, 113–128. [Google Scholar] [CrossRef]
- Antonio, J.A.; Romero, M. Pedestrians’ Detection Methods in Video Images: A Literature Review. In Proceedings of the 2018 International Conference on Computational Science and Computational Intelligence (CSCI), Las Vegas, NV, USA, 12–14 December 2018. [Google Scholar]
- Brunetti, A.; Buongiorno, D.; Trotta, G.F.; Bevilacqua, V. Computer Vision and Deep Learning Techniques for Pedestrian Detection and Tracking: A Survey. Neurocomputing 2018, 300, 17–33. [Google Scholar] [CrossRef]
- Daniel, J.A.; Vignesh, C.C.; Muthu, B.A.; Kumar, R.S.; Sivaparthipan, C.; Marin, C.E.M. Fully Convolutional Neural Networks for LIDAR–Camera Fusion for Pedestrian Detection in Autonomous vehicle. Multimedia Tools Appl. 2023, 82, 25107–25130. [Google Scholar] [CrossRef]
- Beymer, D.; McLauchlan, P.; Coifman, B.; Malik, J. A real-time computer vision system for measuring traffic parameters. In Proceedings of the IEEE Computer Society Conference on Computer Vision and Pattern Recognition, San Juan, PR, USA, 17–19 June 1997; pp. 495–501. [Google Scholar] [CrossRef]
- Gazis, D.; Edie, L. Traffic flow theory. Proc. IEEE 1968, 56, 458–471. [Google Scholar] [CrossRef]
- Stauffer, C.; Grimson, W. Adaptive background mixture models for real-time tracking. In Proceedings of the 1999 IEEE Computer Society Conference on Computer Vision and Pattern Recognition, Fort Collins, CO, USA, 23–25 June 1999; Volume 2, pp. 246–252. [Google Scholar] [CrossRef]
- Zheng, O.; Abdel-Aty, M.; Yue, L.; Abdelraouf, A.; Wang, Z.; Mahmoud, N. CitySim: A Drone-Based Vehicle Trajectory Dataset for Safety-Oriented Research and Digital Twins. Transp. Res. Rec. J. Transp. Res. Board 2024, 2678, 606–621. [Google Scholar] [CrossRef]
- Wu, Y.; Abdel-Aty, M.; Zheng, O.; Cai, Q.; Zhang, S. Automated Safety Diagnosis Based on Unmanned Aerial Vehicle Video and Deep Learning Algorithm. Transp. Res. Rec. J. Transp. Res. Board 2020, 2674, 350–359. [Google Scholar] [CrossRef]
- Abdel-Aty, M.; Wu, Y.; Zheng, O.; Yuan, J. Using Closed-Circuit Television Cameras to Analyze Traffic Safety at Intersections Based on Vehicle Key Points Detection. Accid. Anal. Prev. 2022, 176, 106794. [Google Scholar] [CrossRef] [PubMed]
- Anisha, A.M.; Abdel-Aty, M.; Abdelraouf, A.; Islam, Z.; Zheng, O. Automated Vehicle to Vehicle Conflict Analysis at Signalized Intersections by Camera and LiDAR Sensor Fusion. Transp. Res. Rec. J. Transp. Res. Board 2023, 2677, 117–132. [Google Scholar] [CrossRef]
- Parker, M.R., Jr.; Zegeer, C.V. Traffic Conflict Techniques for Safety and Operations: Observers Manual; No. FHWA-IP-88-027, NCP 3A9C0093; United States Federal Highway Administration: Washington, DC, USA, 1989. [Google Scholar]
- Mohamed, A.; Ahmed, M.M. Pedestrian Tracking at Signalized Intersections Leveraging Multi-Camera Field of Views Using Convolutional Neural Network-Based Pose Estimation Algorithm. In Proceedings of the International Conference on Transportation and Development (ICTD), Atlanta, Georgia, 15–18 June 2024; pp. 490–501. [Google Scholar] [CrossRef]
- Wang, C.-Y.; Bochkovskiy, A.; Liao, H.-Y.M. YOLOv7: Trainable Bag-of-Freebies Sets New State-of-the-Art for Real-Time Object Detectors. arXiv 2022, arXiv:2207.02696. [Google Scholar]
- Zhou, X.; Wang, D.; Krähenbühl, P. Objects as Points. arXiv 2019, arXiv:1904.07850. [Google Scholar] [CrossRef] [PubMed]
- Kreiss, S.; Bertoni, L.; Alahi, A. PifPaf: Composite Fields for Human Pose Estimation. arXiv 2019, arXiv:1903.06593. [Google Scholar] [CrossRef]
- Kreiss, S.; Bertoni, L.; Alahi, A. OpenPifPaf: Composite Fields for Semantic Keypoint Detection and Spatio-Temporal Association. arXiv 2021, arXiv:2103.02440. [Google Scholar] [CrossRef]
- Mohamed, A.; Li, L.; Ahmed, M.M. Automated Traffic Safety Assessment Tool Utilizing Monocular 3D Convolutional Neural Network Based Detection Algorithm at Signalized Intersections. In Proceedings of the International Conference on Transportation and Development (ICTD), Atlanta, GA, USA, 15–18 June 2024; pp. 456–467. [Google Scholar] [CrossRef]
- Mohamed, A.; Ahmed, M. Towards rapid safety assessment of signalized intersections: An in-depth comparison of computer vision algorithms. Adv. Transp. Stud. 2024, 4, 101–116. [Google Scholar]
Disclaimer/Publisher’s Note: The statements, opinions and data contained in all publications are solely those of the individual author(s) and contributor(s) and not of MDPI and/or the editor(s). MDPI and/or the editor(s) disclaim responsibility for any injury to people or property resulting from any ideas, methods, instructions or products referred to in the content. |
© 2025 by the authors. Licensee MDPI, Basel, Switzerland. This article is an open access article distributed under the terms and conditions of the Creative Commons Attribution (CC BY) license (https://creativecommons.org/licenses/by/4.0/).