Abstract
In the absence of standard procedures for testing 3D-printed soft polymers, an experimental protocol was proposed to assess the suitability of Flexible 80A Resin for a pediatric trachea anatomical 3D model for surgical simulation. Eighteen specimens printed via stereolithography are involved, including anatomical, cylindrical, and dog-bone shapes, to investigate the geometry effect on measured properties. Static tensile tests revealed that using standardized dog-bone specimens as a reference for the material’s Young’s modulus leads to a mean absolute percentage error (MAPE) up to 50% compared to anatomical specimens. Measurement uncertainty combined repeatability with input errors, and the ANOVA test confirmed the need for dedicated mechanical measurements when evaluating complex 3D-printed geometries. The study concludes the suitability of selected material: the average elastic modulus of anatomical specimens was 4.75 MPa, closely matching values reported for tracheal tissue in the literature, with a MAPE of only 2%. Dynamic mechanical tests showed trachea-like viscoelasticity: anatomical specimens were consistently stiffer and more dissipative than cylindrical ones. Creep tests confirmed the viscoelastic behavior simulating airway time scales. The anatomical specimens exhibit faster local relaxation, while cylindrical ones show slower long-term relaxation, both modeled by a two-element generalized Maxwell model (R2 = 0.99 and 0.98).
1. Introduction
Additive Manufacturing (AM) technologies are increasingly used in various fields due to their ability to produce customized and complex objects with high geometric precision [1,2,3]. In recent years, the use of soft and flexible materials in AM has opened up new possibilities in the biomedical sector, particularly for the production of anatomical models for surgical planning, training and simulation [4,5]. These 3D models allow for clinicians to practice procedures in a realistic and safe environment, improving both learning and patient safety [6,7]. A primary challenge in replicating complex anatomical structures for clinical use is representing not only the geometry but also the mechanical behavior of the real biological tissue [8]. In particular, the dimensional congruence of 3D-printed (3DP) models to the patient’s actual anatomy is critical for safe and effective clinical decision-making [9]: studies consistently report that models which preserve local geometry (e.g., lumen caliber, wall thickness, curvature, and branching) improve procedure and tool–tissue interaction [10]. High-fidelity shape is essential in a simulation environment: recent studies have proposed the 3D printing of tracheal models to simulate procedures such as tracheotomy, intubation and tracheal resection, demonstrating their usefulness in improving clinical safety [11,12]. In this study, the pediatric trachea was specifically selected as the target model, since airway management in children is particularly critical due to their smaller and more compliant anatomy, making realistic simulation tools especially valuable for clinical training and preoperative planning [13]. Several studies have also evaluated the geometric and volumetric fidelity of 3D-printed models by comparing them with the original datasets, confirming the need to detect minimal deviations between the printed geometry and diagnostic imaging [14,15].
Regarding the geometric issue, stereolithography (SLA) is one of the most suitable methods for biomedical applications, thanks to its ability to create high-resolution parts using photopolymer resins [16,17]. However, reproducing only the external shape is not enough [18]: for the model to be useful in realistic clinical simulations, the mechanical response of the printed material must be as close as possible to that of the biological tissue [19]. This requires a detailed mechanical characterization of the material under different loading conditions, to understand how it behaves during manipulation, deformation, or prolonged use [20,21]. Complementarily, studies directly linking 3D printer configuration to mechanical properties show that parameters such as nozzle temperature and specimen filet radius can significantly alter tensile strength and the apparent elastic modulus, reinforcing the need to control and report process settings when comparing measured properties [22]. Recent advances also highlight the relevance of predictive and data-driven approaches for assessing time-dependent or fatigue-related behavior in biological tissues [23], further underscoring the need for robust experimental mechanical characterization of 3D-printed models intended for these biomedical applications. As a related example, another study developed a dedicated device for static and dynamic torsion and fatigue testing of Ni–Ti endodontic instruments, illustrating how targeted protocols can quantify clinically relevant mechanical properties [24].
To date, there is no standard method for testing the mechanical properties of soft 3D-printed photopolymers used in biomedical models. The quality assessment of 3D-printed biomedical models requires careful control of parameters such as material formulation, layer thickness, and structural integrity to comply with medical standards and regulatory guidelines, including those established by agencies such as the U.S. Food and Drug Administration (FDA) [25]. Similarly, the European Medicines Agency (EMA) recognizes 3D-printed anatomical models as medical devices, thus involving them in regulatory pathways [26]. Nevertheless, despite the growing role and clinical potential of biomedical 3D printing, there is still a lack of clear and comprehensive regulations for quality control in point-of-care applications [27,28]. This gap highlights the urgent need for standardized testing protocols and regulatory frameworks to guarantee the safety, effectiveness, and reliability of 3D-printed models in medical practice [29]. For the assessment of the mechanical properties, existing standards for elastomers can be partially applied, but they are often not adequate, especially when considering the effects of sample geometry, printing orientation and post-processing conditions [30,31], as well as the effect of infill pattern and infill density on the mechanical behavior of 3D-printed parts [32]. These factors can significantly affect the final mechanical performance of the printed parts as well as their interaction in the assembled anatomical structures of interest. Among the human organs, the trachea is especially challenging to reproduce due to the combination of stiff cartilage and soft connective tissue.
In this study, a comprehensive experimental protocol is proposed for the mechanical characterization of a soft photopolymer resin (Flexible 80A) used to fabricate pediatric trachea models. The main objective is to evaluate the mechanical properties of the material with a focus on its applicability in realistic medical simulations. Three complementary test modalities were adopted: (a) static tensile tests to determine elastic properties, (b) dynamic mechanical analysis to evaluate viscoelastic parameters and frequency-dependent behavior and (c) creep tests to characterize time-dependent deformation under constant load. The results obtained from static tests are compared with those relating to native tissue according to the mechanical reference ranges for the human trachea. The literature reports an elastic modulus between 3.3 and 6.5 MPa, whose average value of 4.7 MPa has been adopted as the reference range for comparison [33,34,35]. In terms of viscoelasticity, airway tissues exhibit frequency-dependent stiffening with a broad peak in the loss factor in the low tens of hertz band and creep/relaxation governed by two time scales, with the slower process being about an order of magnitude longer than the faster one [36,37,38]. The results of dynamic mechanical analysis and creep test are therefore interpreted with respect to these published ranges.
Tests were conducted on three specimen geometries: (a) the anatomical shape faithful to the pediatric trachea simulator, used to directly characterize the printed model under realistic conditions; (b) a simplified but dimensionally equivalent geometry, introduced to isolate material from geometric effects and facilitate comparison, following the approach adopted in [39], and (c) a standard dog-bone specimen, designed according to ISO 527 [iso1] [40] to enable benchmarking against established testing protocols. The experimental protocol was chosen with the dual aim of investigating whether geometry significantly affects the measured mechanical properties and contributing to the development of a repeatable, standardized method for quality control of 3D-printed anatomical models. As an innovative contribution with respect to the existing literature [41], this study specifically included the design and testing of specimens faithfully reproducing the tracheal anatomy in the region of clinical interest. Unlike most previous works, which mainly rely on standardized geometries, this approach directly addresses the mechanical behavior of anatomically accurate shapes, thus providing novel insights into how complex geometries influence the performance of 3D-printed soft tissue materials. This approach also contributes to the identification of the most appropriate specimen geometry for reliable material selection in biomedical AM. In particular, the study assesses whether a dimensionally equivalent but simplified geometry can yield mechanical responses comparable to those of anatomically faithful specimens. By comparing the experimental results with literature data for human tracheal tissue, the study aims to determine the suitability of the selected resin for producing functionally realistic airway models. The proposed methodology also provides a replicable framework for validating 3D-printed soft materials in other biomedical contexts, supporting the development of tailored quality control protocols for additive manufacturing in healthcare applications.
The paper is organized as follows: Section 2 describes the materials and methods, including the acquisition of diagnostic CT data, selection of the printing material, design of the three specimen geometries and 3D printing process. Section 3 details the mechanical testing procedures (static, dynamic and creep tests) and the experimental setup. Section 4 presents the results of the mechanical characterization, including elastic modulus evaluation, frequency-dependent viscoelastic parameters and creep modeling. Section 5 outlines the measurement uncertainty analysis associated with the measured quantities. Section 6 discusses the results in the context of geometry effects, comparison with manufacturer data and literature values for human tracheal tissue. Finally, Section 7 reports the main conclusions and suggests directions for future work.
2. Materials and Methods
2.1. Sample Preparation
The preparation of the test specimens involved three main stages. First, the anatomical geometry of the trachea was reconstructed from diagnostic medical imaging data. Next, the material and specimen shapes were selected to meet the requirements of both anatomical fidelity and standardized mechanical testing. Finally, the models were processed and fabricated using SLA printing technology in consistent production conditions. In particular, three specimen types were designed: anatomical trachea shape, simplified cylindrical specimens replicating the average cross-section of the anatomical sample, and ISO-standard tensile bars, to enable a comparative evaluation of mechanical performance.
2.2. Diagnostic CT Data
The anatomical model used in this study was based on real diagnostic imaging data of a pediatric patient. The tracheal region was extracted from high-resolution CT scans and processed using Materialise Mimics (Mimics Innovation Suite 26) [42], a specialized software for medical image segmentation (Figure 1a). Through segmentation procedures, the region of interest was isolated and reconstructed in 3D to serve as the basis for model fabrication. The resulting model was then integrated into a commercially available pediatric airway simulator, replacing the original airway component to enable realistic mechanical and functional testing (Figure 1b). For the purpose of evaluating its suitability for simulator integration, the anatomical portion considered included only the tracheal segment; the larynx and bronchial branches were excluded to focus on the region most commonly involved in surgical procedures.
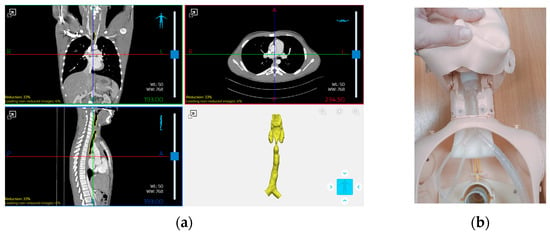
Figure 1.
(a) Segmentation of the tracheal region from high-resolution CT scans of a pediatric patient using Materialise Mimics (Mimics Innovation Suite 26) and (b) integration of the 3D-printed tracheal model into a pediatric airway simulator for mechanical testing.
2.3. Material and Shape Selection
The selection of the printing material was the result of an iterative process combining clinical feedback and mechanical performance requirements. Among the commercial resins compatible with the stereolithography (SLA) printer used, two soft photopolymers were initially considered for the production of anatomical models: Elastic 50A Resin and Flexible 80A Resin. These materials were selected based on their elastomeric behavior and nominal Shore hardness, which made them suitable candidates for simulating soft biological tissues. To ensure clinical suitability, preliminary prototypes were printed using both materials and evaluated by a group of medical professionals during simulated surgical procedures. The evaluation focused on tactile response, deformation under manual pressure and the realism of interaction with surgical tools. Based on this qualitative feedback, the clinicians unanimously selected Flexible 80A Resin as the more appropriate material, due to its better balance between elasticity and structural consistency during manipulation. For this reason, Elastic 50A Resin was discarded at an early stage, avoiding unnecessary resource consumption in the subsequent testing campaign. The focus of this study was therefore to evaluate the suitability of the selected material for surgical simulation, rather than to compare different materials. Following this selection, all samples used for mechanical testing described in the following sections were printed in Flexible 80A Resin, whose datasheet characteristics are shown in Table 1.

Table 1.
Mechanical properties of the material as reported in the datasheet (ASTM D 412-06).
In addition to material selection, three types of specimen geometries were designed to enable a comprehensive mechanical characterization: (a) anatomical specimens reproducing the actual tracheal geometry derived from patient imaging data; (b) cylindrical specimens with the same cross-sectional area and length as the anatomical ones, intended to investigate whether mechanical properties obtained under identical testing parameters vary as a function of geometry variability; and (c) ISO 527-1A standard tensile specimens [iso1], allowing comparison with standard testing protocols. The three geometries are shown in Figure 2.
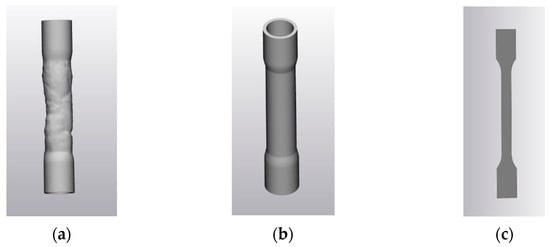
Figure 2.
Specimen geometries: (a) anatomical; (b) cylindrical and (c) dog-bone shape of ISO 527-1A [iso1].
In detail, the three geometries were obtained as follows:
- Anatomical Specimens: these models replicate the true geometry of the pediatric trachea based on the CT-derived 3D reconstruction. To enable mechanical testing, external cylindrical connectors were added at both ends of the model to ensure stable clamping within the DMA system (Figure 2a). These connectors have a nominal internal diameter of 18 mm, an external diameter of 20 mm, and a height of 20 mm. The connection to the tracheal structure was obtained via a loft operation and an external hollowing of 2 mm thickness was applied to obtain a uniformly thin-walled structure. To achieve a symmetrical configuration and avoid asymmetric loading during dynamic testing, the distance between each cylindrical connector and the trachea was carefully designed. A symmetry axis was defined using the mesh geometry to align both connectors, thereby minimizing the risk of undesired resonances during dynamic loading.
- Cylindrical Specimens: a second set of specimens was designed using an idealized cylindrical geometry based on the average cross-section of the original tracheal segment (Figure 2b). Seven cross-sections were extracted along the central axis of the trachea, spaced 11 mm apart, and the corresponding diameters were measured. The average radius was computed as 6.7 ± 0.1 mm, and the cylinder height was adjusted to 7.0 ± 0.1 mm to match the vertical dimension of the anatomical model. The resulting cylindrical model was then hollowed externally with a 2 mm wall thickness, in a uniform thin-walled cylindrical shell.
- Standard Specimens (ISO 527-1A [iso1]): the third group of samples was designed according to the ISO standard (Figure 2c) with a nominal length of 170 mm, width of 10 mm and thickness of 4 mm, which is commonly used for tensile testing of plastic materials. This configuration enabled a standardized assessment of the material’s mechanical properties, allowing for reliable benchmarking and comparison with existing literature and reference values.
2.4. Three-Dimensional Printing
All specimens were fabricated using the Form 3BL 3D printer (Formlabs, Somerville, MA, USA), using SLA technology, which ensures high-resolution printing suitable for biomedical applications. The printing process was carried out using Flexible 80A Resin, selected after clinical evaluation for its suitable properties, as described in Section 2.3. The design phase was completed in Materialise 3-matic, allowing geometric optimization of the STL file for mechanical testing. The three specimen geometries are shown in Figure 3.

Figure 3.
3D-printed specimens: (a) anatomical; (b) cylindrical and (c) dog-bone shape of ISO 527-1A [iso1].
All models were oriented horizontally relative to the build platform to ensure uniform mechanical performance and to optimize structural homogeneity and minimize anisotropy due to layer orientation. Anatomical and cylindrical specimens were printed with a layer thickness of 0.1 mm, resulting in 267 layers and an average print time of approximately 8 h per batch. For the ISO 527-1A specimens, the same resin, layer thickness, and print orientation were used, but only 40 layers were required, with an estimated print time of approximately 1 h and 30 min. The supports, identical for all anatomical, cylindrical, and dog-bone shape specimens belonging, respectively, to the same print batch, were carefully removed manually by the same operator, following the standard procedures recommended for this material and technology. This ensured consistency in the post-processing phase and minimized variability due to support handling.
After printing, samples were subjected to a post-processing protocol recommended by the manufacturer of the printer and the material, including: washing in 98% isopropyl alcohol for 10 min, post-curing in the Form Cure unit at 60 °C for 10 min.
3. Mechanical Tests
Mechanical tests were performed on six specimens for each configuration, which represents the minimum sample size recommended by standards for polymer tensile testing (e.g., ISO 527-1A requires at least five specimens). Furthermore, this choice ensures statistical robustness while maintaining experimental feasibility according to principles of error analysis [43,44]. The experimental campaign, with the aim of evaluating the mechanical response of the 3D-printed material under loading conditions, comprised three distinct protocols: quasi-static tensile testing, dynamic frequency sweep tests, and long-duration creep tests.
Quasi-static tensile tests were performed on all specimen geometries, including the ISO 527-1A samples, to determine their elastic properties. On the other hand, dynamic and creep tests were conducted on the anatomical and cylindrical specimens only. This choice was motivated by two main considerations: (a) these geometries more closely replicate the actual conditions and mechanical constraints expected in clinical applications, and (b) their robust structure offers greater stability during long-duration testing, reducing the risk of misalignment or failure under constant load. The aim was to investigate how the airway model would respond to oscillatory and long-term loading conditions, replicating the types of mechanical stresses that may occur during simulated surgical procedures or extended handling.
The following subsections describe the testing setup and procedures in detail, along with the data acquired for each test. Section 3.1 outlines the testing machine characteristics and instrumentation used; Section 3.2 presents the quasi-static tensile test methodology to the derivation of elastic modulus values; Section 3.3 covers the determination of storage and loss moduli from dynamic tests and Section 3.4 details the creep tests to the extraction of viscoelastic parameters.
3.1. Testing Machine
Mechanical characterization was carried out using the ElectroForce TA3300 load frame (TA Instruments, New Castle, DE, USA), a Dynamic Mechanical Analysis (DMA) system. According to the manufacturer’s specifications, the instrument can perform tests over a frequency range from 0.00001 Hz to 100 Hz, with a frequency accuracy of ±0.1% of the operating value. This capability enables the execution of static, quasi-static and dynamic tensile tests, as well as creep analysis, within a single experimental platform. The testing machine is equipped with a 3 kN ± 1% load cell and a temperature-controlled chamber. The chamber was monitored via a type K thermocouple, with a measurement uncertainty of ±0.5 °C. The main technical specifications of the ElectroForce TA3300 system and its instrumentation are summarized in Table 2.

Table 2.
Main technical specifications of the ElectroForce TA3300 testing system.
Tests were performed at a controlled temperature of 23.0 ± 0.5 °C, replicating the ambient conditions typically found in clinical settings, especially during surgical simulation and preoperative training scenarios. Due to the non-standard geometries of the anatomical and cylindrical specimens, clamps were used to gently secure them to the machine handles. Particular care was taken during assembly to avoid excessive force or damage to the specimens. The initial gauge length (i.e., the distance between the handles in the unformed state) was 75.0 ± 0.5 mm and no pre-tension was applied before testing. For the ISO 527-1A specimens, initial conditions and testing procedures were set according to the standard; in particular, the clamping length was set to 115.0 ± 0.5 mm. No pre-conditioning was required. The choice of no pre-tension is consistent with the reference standards ISO 527 (tensile tests on plastics), ISO 37 (tensile tests on elastomers) [iso2] [45], and ISO 899-1 (creep tests on plastics) [iso3] [46], none of which prescribe the use of a mandatory pre-load. For consistency, all static, dynamic, and creep tests in this study were therefore performed without applying any initial load, starting from the specimen’s undeformed state.
Once the initial length was set, the displacement between the grips was monitored by a High-Aspect-ratio Dielectric Sensor (HADS) installed directly on the machine with a measurement uncertainty of ±0.025 mm. All specimens were positioned in the testing machine in vertical orientation, with their longitudinal axis aligned with the direction of applied tensile load. Figure 4 shows the clamping arrangement for the three geometries.
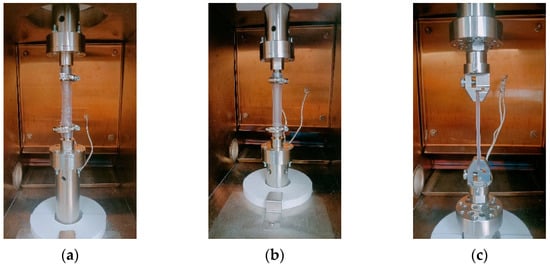
Figure 4.
Test setup for the three specimen geometries: (a) anatomical, (b) cylindrical, and (c) ISO 527-1A specimens in the ElectroForce TA3300 testing machine.
3.2. Static Test
Static tensile tests were performed to evaluate the elastic and deformation behavior of the materials under low-rate loading conditions. A maximum elongation of 12 mm was applied to each specimen, in accordance with the stroke limitations of the testing machine. This elongation corresponds to a strain of less than 20% of each initial specimen length, ensuring consistency with values reported in the literature for similar applications and avoiding failure of the specimens during testing [47]. In particular, a strain of approximately 16% for both the anatomical and cylindrical specimens, and approximately 10% for the standard one were achieved. The latter has a lower percentage elongation due to the higher initial length of the test sample. The elongation was applied at a constant rate of 0.16 mm/s.
Force and displacement data were continuously recorded during each test, as shown in Figure 5, allowing the derivation of stress–strain curves for all specimen types. From the average stress–strain response, the elastic modulus was estimated.

Figure 5.
Raw load–displacement data from quasi-static tensile tests for the six specimens of each geometry: (a) anatomical, (b) cylindrical, and (c) ISO 527-1A dog-bone shape.
3.3. Dynamic Test
Dynamic mechanical testing was carried out on anatomically shaped and cylindrical specimens to evaluate their viscoelastic behavior over a range of excitation frequencies. The test was configured as a sinusoidal tension–compression sweep around a defined mean strain level. The nominal test parameters were set as follows:
- Mean strain level: 2 mm;
- Dynamic amplitude: ±1 mm;
- Frequency range: from 1 Hz to 36 Hz, in increments of 5 Hz.
This frequency sweep allowed the evaluation of the storage modulus (E′), loss modulus (E″), and loss factor (tan δ), which are the indicators of the material energy dissipation capacity and stiffness variation with frequency. The frequency sweep aimed to characterize the viscoelastic response of the printed material rather than replicate physiological tracheal loading. In line with ISO 6721-4 [iso4] [48], which recommends testing polymers in the range 0.01–100 Hz, the selected frequency window of 1–36 Hz ensures a representative evaluation of frequency-dependent behavior. The upper limit was set below 40 Hz, as suggested by the instrument manufacturer, to avoid potential resonance effects related to the relatively large moving masses of the testing system when operated with the temperature-controlled chamber.
The raw data acquired during these tests are reported in Figure 6, Figure 7 and Figure 8, from which average values and their dispersions were subsequently computed. These viscoelastic parameters are particularly relevant for applications such as surgical simulation, where tissues may experience repetitive or oscillatory forces during clinical procedures.
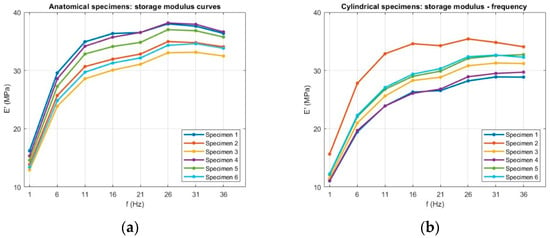
Figure 6.
Raw storage modulus (E′) data as a function of frequency for (a) anatomical and (b) cylindrical specimens.
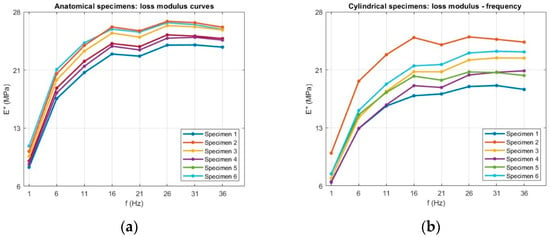
Figure 7.
Raw loss modulus (E″) data as a function of frequency for (a) anatomical and (b) cylindrical specimens.
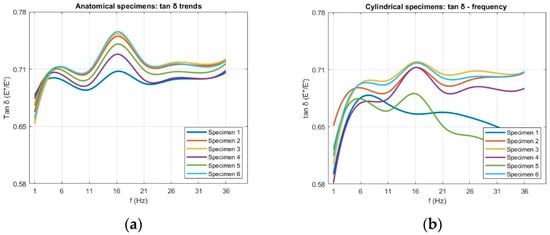
Figure 8.
Raw loss factor (tan δ) data as a function of frequency for (a) anatomical and (b) cylindrical specimens.
3.4. Creep Test
Creep tests were carried out to evaluate the time-dependent viscoelastic behavior of the material under sustained mechanical loading, simulating conditions such as prolonged tissue manipulation or extended handling during surgical training.
To enable a direct comparison of the viscoelastic behavior of the real trachea, the tests were performed under replicated loading conditions [36]. Consequently, a constant tensile load of 10 N ± 1% was applied and maintained via the closed-loop control of the testing machine for both anatomical and cylindrical specimens.
The experimental protocol consisted of two sequential stages, designed to capture both the immediate and the long-term components of the creep response. The first stage was a short-term, high-frequency acquisition performed immediately after load application, with the objective of resolving the instantaneous elastic deformation. Test parameters for this step were: scan time of 1 s and 1200 points acquired per scan (sampling frequency of 1200 Hz). This high temporal resolution ensured that the rapid strain change upon loading could be captured safely. The data acquired for this first stage are reported in Figure 9.
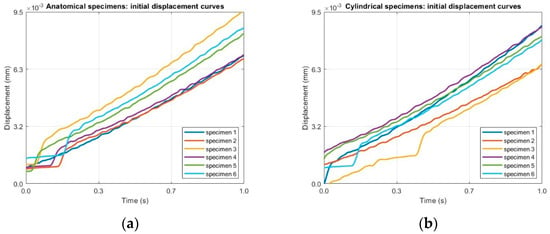
Figure 9.
Raw displacement–time data under a constant tensile load of 10 N from Step 1 (high-frequency acquisition at 1200 Hz for 1 s) for (a) anatomical specimens and (b) for cylindrical specimens.
The second stage involved a long-duration creep test. Test parameters for this step were: 2400 s (40 min), and displacement data were recorded at regular intervals of 100 s (sampling frequency of 0.01 Hz). The data acquired for this first stage are reported in Figure 10. Since the duration of the test is 40 min, the experiment falls within the primary creep, with decreasing strain rate, and secondary creep regime, where the strain rate becomes nearly constant. No tertiary creep stage was observed, as the specimens did not reach failure under the applied load.
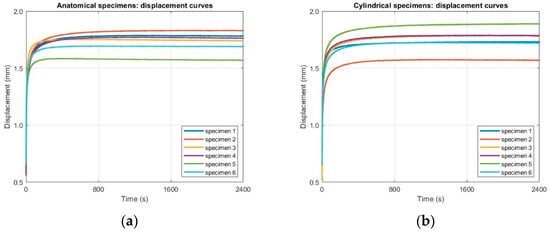
Figure 10.
Raw displacement–time data from Step 2 (long-duration acquisition at 0.01 Hz over 2400 s) for (a) anatomical specimens and (b) cylindrical specimens.
The combination of high-resolution initial data and long-term creep tests will provide a comprehensive experimental basis for describing the viscoelastic response of the tested specimens.
4. Mechanical Characterization
This section presents the mechanical properties derived from the experimental data collected during the mechanical testing campaign. These properties describe the elastic, viscoelastic, and time-dependent behavior of the tested material under different loading conditions. Specifically, the estimation of the Young’s modulus, which quantifies the initial elastic response of the material under quasi-static loading, the evaluation of storage and loss moduli, extracted from dynamic tests and used to characterize the frequency-dependent viscoelastic behavior and the primary and secondary creep behavior, based on long-duration constant-load tests, providing insights into the material performance under prolonged mechanical stress.
4.1. Young’s Modulus
Stress–strain curves were obtained from the data recorded during quasi-static tensile tests using the WinTest®(WinTest 7 Software) proprietary software of the testing machine. Post-processing was conducted in MATLAB 2023a to analyze and quantify the material’s elastic response. To estimate the Young’s modulus, an average stress–strain curve was computed from the six individual curves by interpolating stress values at equal strain intervals. The variability among samples was quantified by computing the standard deviation (SD) of stress at each strain level, allowing assessment of the test repeatability. A weighted linear regression approach [43] was employed to approximate the average curve with a series of linear segments. The weighting was based on the measured SD of stress for each sample, ensuring that data with lower uncertainty contributed more significantly to the fit. From this piecewise linear approximation, the Young’s modulus was estimated as the slope of each segment. Specifically, a polynomial function of degree m was first fitted to the average curve to identify n optimal intervals, each corresponding to a distinct segment. From each segment, the elastic modulus value Ei (i = 1, …, n) was extracted as a function of the corresponding strain range.
4.2. Storage Modulus, Loss Modulus and Loss Factor
For anatomical and cylindrical specimen type, dynamic mechanical data were acquired from six individual tests using the WinTest® proprietary software. During each test, the system imposed the sinusoidal displacement profile as indicated in Section 3.3. and, based on the input geometrical parameters of the specimens, directly computed the storage modulus (E′) and loss modulus (E″). The loss factor (tan δ) was obtained as the ratio E″/E′.
The raw values of E′, E″, and tan δ from the six repetitions for each specimen type were then processed in MATLAB. For each frequency, an average value was estimated for each viscoelastic parameter by aligning the datasets to equal frequency values, while the variability between samples was quantified using standard deviation, providing an estimate of the dispersion of the results.
4.3. Creep Analysis
To characterize the material viscoelastic behavior, the creep test data were analyzed in two distinct stages, corresponding to the experimental protocol outlined in Section 3.4. For each specimen type, the analysis was performed on a mean creep curve and its associated dispersion, which were calculated from the six experimental curves obtained for that specific geometry.
The instantaneous elastic strain, which represents the material response at the precise moment of load application, was determined from the high-frequency acquisition data (Stage 1). This value was calculated as the intercept of the creep curve and is a key parameter for the subsequent modeling. It corresponds to the initial elastic element of a Burgers model, composed of a spring and dashpot in parallel with a second spring and dashpot in series, but this was only used to determine the initial strain response [47].
For the long-term creep behavior (Stage 2), a Generalized Maxwell model was adopted to fit the time-dependent strain data. This model was chosen for its ability to accurately describe both the transient (primary creep) and steady-state (secondary creep) phases observed during the 40 min test duration. The model is composed of a purely elastic spring (E0) in parallel with a number of Maxwell elements. Each Maxwell element consists of a spring (Ei) and a dashpot (ηi) in series [49].
The total creep strain ε(t), starting from the instantaneous deformation, is described as follows:
where
- is the instantaneous elastic strain determined from the initial loading phase;
- is the constant applied stress;
- represents the relaxation time for the ith Maxwell element, which governs the rate of creep.
The experimental data from Stage 2 were fitted to this equation to determine the viscoelastic parameters (Ei and τi) that best describe the material’s time-dependent response. This dual-stage approach ensured that both instantaneous and long-term behaviors were captured and modeled. The methodology for obtaining the viscoelastic parameters of elastomers through the Burgers model and generalized Maxwell model is detailed in [50].
The fitting procedure was performed using a non-linear regression algorithm within dedicated data analysis software, with the goal of minimizing the difference between the model curve and the experimental data points. The goodness of fit was evaluated using standard statistical metrics. The coefficient of determination R2 was used to quantify the correlation between the model and the experimental data. Additionally, the Root Mean Square Error (RMSE) was calculated to measure the average magnitude of the difference between the predicted and observed values.
5. Measurement Uncertainty Analysis
In this section, the measurement uncertainties associated with the experimental results are described. The analysis follows the principles of the uncertainty propagation law, taking into account the main sources of errors. For each investigated mechanical property, the combined uncertainty was obtained by considering: (a) the repeatability of the tests; (b) the instrumental and dimensional uncertainties associated with the measurement system; and (c) the influence of data processing methods, such as curve fitting or derived quantities.
5.1. Specimen Geometry
The uncertainty associated with specimen geometry was estimated based on the dimensional accuracy of the 3D printer (±0.025 mm), which was taken as the standard uncertainty for each linear dimension. For quantities derived from multiple measured dimensions (e.g., cross-sectional area), the uncertainties were propagated according to the uncertainty propagation law.
5.2. Displacement and Strain
Uncertainty about displacement measurements was determined from two contributions: (a) the resolution displacement of the testing machine transducer, as reported in the calibration certificate (0.025 mm), and (b) the variability in the displacement data recorded during repeated tests.
Strain uncertainty was obtained by propagating the displacement uncertainty together with the uncertainty in the initial gauge length of the specimen, estimated according to the protocol described in Section 3.1.
5.3. Load and Stress
Uncertainty in the applied load was estimated from two sources: (a) the calibration certificate of the testing machine’s load cell, which has a nominal capacity of 3 kN and an accuracy of ±1% of the indicated value, and (b) the variability in the load data recorded during repeated tests. The uncertainty in stress was then obtained by propagating the load uncertainty together with the uncertainty in the specimen’s cross-sectional area, as described in Section 5.1.
5.4. Young’s Modulus
The measurement uncertainty of Young’s modulus was estimated by applying the uncertainty propagation law, considering: (a) the repeatability of the tests, which influences the estimated slope of the stress–strain curve as determined through weighted linear regression; and (b) the uncertainties in stress and strain, derived according to Section 5.2 and Section 5.3, respectively, in line with the definition of the elastic modulus as the ratio between these two quantities.
5.5. Storage Modulus, Loss Modulus and Loss Factor
Given that E′, E″ and tan δ are directly computed by the testing system from the measured force, displacement and specimen dimensions under sinusoidal loading, the associated uncertainties for E′ and E″ were quantified from the dispersion of results across the six specimens for each geometry.
For the loss factor (tan δ), a derived quantity defined as the ratio E″/E′, the combined standard uncertainty was obtained by propagating the uncertainties of E′ and E″ in accordance with the uncertainty propagation law and by adding the contribution from the dispersion observed in the repeated tests.
5.6. Creep Test
The first sources of uncertainty considered were those associated with the recorded displacement and the constant stress applied, estimated as described in Section 5.2 and Section 5.3. To estimate the uncertainty associated with material constants, except for that associated with the instantaneous elastic modulus (E0), which was estimated as described in Section 5.4, a Monte Carlo simulation with 105 iterations was carried out, which is particularly suitable for propagating uncertainties in non-linear regression models [51,52]. Starting from the uncertainties expressed as standard deviations for the quantities described above (strain and applied stress), the Monte Carlo simulation was carried out as follows: at each iteration, a new, simulated set of strain data was generated by adding random noise to the average experimental strain curve. This noise was drawn from a normal distribution with a mean of zero and a SD equal to the estimated uncertainty in terms of standard deviation associated with strain. Additionally, for the most complete analysis, a simulated value of the applied stress was also generated from a normal distribution defined by its mean and its SD. Each simulated dataset was then fitted to the generalized Maxwell model, yielding a new set of parameters. The final uncertainty for each parameter was then determined as the standard deviation of the 105 parameter values obtained from the simulation.
6. Results and Discussion
6.1. Static Test
Young’s Modulus
From the load–displacement data recorded during the static tensile tests, stress–strain curves were obtained for all six specimens of each geometry (Figure 11). To determine the Young’s modulus, an average stress–strain curve was calculated for each geometry and approximated using a piecewise weighted linear regression. Starting from the third-degree polynomial that best fit the average stress–strain curve for each specimen type, three linear segments were identified. For the anatomical and cylindrical specimens, these corresponded to up to 2% strain, up to 10% and up to the maximum strain reached (16%). For the dog-bone specimens, the intervals were instead defined as up to 2%, up to 6% and up to the maximum strain reached (10.4%), due to their shorter deformation range compared to the other geometries (Figure 12). All linear segments exhibited a high correlation coefficient (r = 0.99), confirming the robustness of the fitting method.

Figure 11.
Stress–strain curves obtained from static tensile tests for the six specimens of each geometry: (a) anatomical; (b) cylindrical and (c) ISO 527-1A dog-bone shape.

Figure 12.
Average stress–strain curves with corresponding stress dispersion (dashed red lines) and piecewise weighted linear regressions used for Young’s modulus estimation for specimen geometry: (a) anatomical; (b) cylindrical and (c) ISO 527-1A dog-bone shape.
The resulting values of stress and Young’s modulus, reported as mean ± SD, are summarized in Table 3. A progressive reduction in modulus with increasing strain was observed for all geometries, consistent with the non-linear elastic behavior typical of elastomeric materials.

Table 3.
Stress and Young’s modulus values, expressed as mean ± standard deviation (SD), obtained for the three specimen geometries over specific strain intervals from static tensile tests.
Among the tested geometries, dog-bone specimens showed the highest initial modulus (9.9 ± 0.4 MPa at 2% strain), while anatomical and cylindrical specimens displayed very similar values (6.1 ± 0.3 MPa and 6.2 ± 0.3 MPa at 2% strain, respectively). This increased stiffness appears to be due to their standardized length, shorter effective deformation range and compact rectangular cross-section, which differs from the hollow cylindrical cross-section of other geometries. Considering the average elastic modulus values, the mean absolute percentage error (MAPE) between the dog-bone and anatomical specimens, taking the latter as the reference, is 51.3%.
The comparison between the anatomical and cylindrical specimens shows that, for the same strain intervals, the elastic modulus values are very similar. The differences observed, 0.1 MPa at 2% strain, 0.11 MPa at 10%, and 0.16 MPa at 16%, are all smaller than or comparable to their measurement uncertainty, indicating that, under the present testing conditions, specimen geometry has only a marginal influence on the elastic response. This indicates that the observed stiffness is primarily governed by the intrinsic material properties rather than by geometric effects. These conclusions are further supported by a one-way ANOVA test. For anatomical versus cylindrical specimens, at all strain intervals, results p ≥ 0.05, indicating no statistically significant effect of geometry. Because the dog-bone geometry was characterized over a more limited strain range, the ANOVA comparison including dog-bone specimens could be conducted only for the first interval common to all three specimen types: in this case, results p < 0.01 demonstrating a statistically significant geometric effect.
When compared with the manufacturer’s datasheet values for Flexible 80A Resin (Table 1), the experimental stress values are substantially lower. This difference can be reasonably attributed to a combination of factors, including the specific geometry of the test samples, which differs from the standard sample geometry used in manufacturer testing, as well as the printing process parameters (orientation, print settings, post-processing), which can significantly affect the final mechanical properties of 3DP parts.
To provide a more relevant comparison, elastic modulus values for human tracheal tissue reported in the scientific literature were considered. Specifically, three studies performing experimental measurements on real tracheal tissues were analyzed, reporting mean Young’s modulus values of 6.5 MPa [33], 4.4 MPa [34] and 3.3 MPa [35]. Comparison with the experimental Young’s modulus obtained in this study (Table 3) indicates that the selected material exhibits mechanical characteristics consistent with those of native tracheal tissue, supporting its suitability for biomechanical simulation purposes. The average elastic modulus of the anatomical printed specimens was 4.75 MPa, in close agreement with values reported for human tracheal tissue in the literature, with a mean absolute percentage error of only 2%.
6.2. Dynamic Test
6.2.1. Storage Modulus
The average trends of the storage modulus (E′) for both anatomical and cylindrical specimens are shown in Figure 13. The anatomical samples show an initial E′ of 14.4 ± 1.2 MPa at 1 Hz, which increases to 33.3 ± 2.5 MPa at 16 Hz and then plateaus. Similarly, the cylindrical samples increase from 12.3 ± 1.7 MPa to 29 ± 3 MPa over the same frequency range. For both specimens, the storage modulus increased sharply from 1 Hz to approximately 16 Hz, indicating a pronounced stiffening of the material with frequency, after which the values plateaued or slightly decreased. This trend reflects the reduced time available for molecular rearrangements at higher loading rates, resulting in a more elastic-like response. Above 16 Hz, E′ values plateaued, suggesting that the material had reached a stiffness regime that no longer varied with frequency.
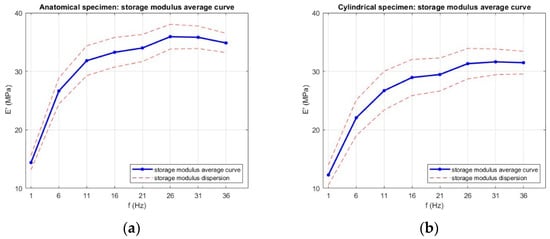
Figure 13.
Average storage modulus (E′) as a function of frequency for (a) anatomical specimens and (b) cylindrical specimens. Data are presented as mean values with error bars representing the standard deviation across six replicates for each geometry.
Anatomical specimens consistently exhibited higher E′ values across the tested frequency range, reaching 35.9 ± 2.1 MPa at the maximum, compared to 31.6 ± 2.2 MPa for cylindrical specimens. The storage modulus exhibited a clear dependence on specimen geometry, with anatomical specimens consistently showing higher E′ values across the entire frequency range compared to cylindrical specimens. This difference can be attributed to several factors. Firstly, the more complex geometry of the anatomical specimens likely enhances structural stiffness by distributing the applied load over regions with varying cross-sectional areas, resulting in a higher apparent elastic response. Secondly, the printing layer arrangement in the anatomical geometry may have promoted more favorable load-bearing paths, reducing the influence of local defects and improving elastic energy storage under dynamic loading. Since the storage modulus quantifies the material’s capacity to store elastic energy during each cycle of deformation, the higher values observed for anatomical specimens point to an overall stiffer structural response, despite being made from the same material. In contrast, the cylindrical specimens, with their uniform cross-section, are more likely to develop a homogeneous stress field, resulting in a lower apparent stiffness under dynamic loading. The dispersion in E′ values was moderate, with greater variability in cylindrical specimens. This may be linked to their uniform geometry being more sensitive to slight misalignments or micro-slippage at the grips, which can disproportionately affect the measured stiffness. In contrast, the complex anatomy of the trachea specimens may provide additional geometric constraints that stabilize the load distribution during testing, thereby reducing variability. The effect of geometry is further supported by a one-way ANOVA test on the storage modulus E′ at each frequency, with the results shown in Figure 14; p-values were ≤0.03 at all frequencies, confirming that specimen geometry has a statistically significant influence.
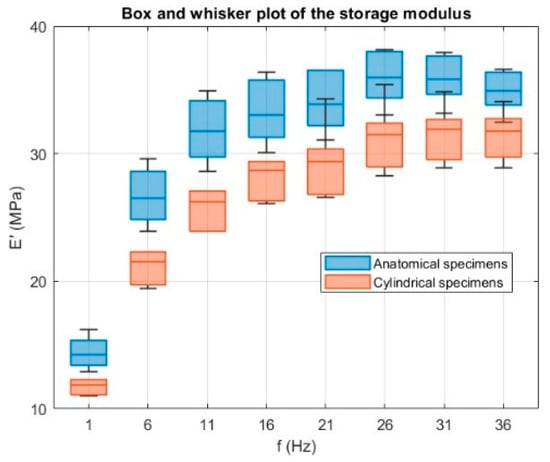
Figure 14.
Box and whisker plots of the storage modulus E′ (MPa) as a function of frequency f (Hz) for anatomical (blue) and cylindrical (orange) specimens. A one-way ANOVA test carried out at each frequency shows a significant effect of specimen geometry on E′ (p ≤ 0.03 at all frequencies), confirming the geometric influence on the specimen’s response.
6.2.2. Loss Modulus
The corresponding trends for the loss modulus (E″) are presented in Figure 15. The loss modulus exhibited a frequency-dependent trend closely mirroring that of the storage modulus. For both geometries, E″ increased markedly between 1 Hz and approximately 16 Hz, indicating a rise in the material energy dissipation capability with increasing loading frequency. For anatomical specimens, E″ rose from 9.6 ± 1.1 MPa at 1 Hz to 24.6 ± 1.4 MPa at 16 Hz, while cylindrical specimens increased from 7.5 ± 1.4 MPa to 20.4 ± 2.5 MPa over the same range. This initial growth reflects the reduced time for molecular rearrangements at higher excitation rates, which increases internal friction and, consequently, the viscous component of the viscoelastic response.
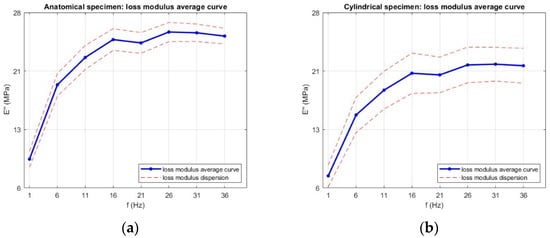
Figure 15.
Average loss modulus (E″) as a function of frequency for (a) anatomical specimens and (b) cylindrical specimens. Data are presented as mean values with error bars representing the standard deviation across six replicates for each geometry.
Beyond 16 Hz, the loss modulus values approached a plateau, consistent with the behavior of many elastomeric materials, where further increases in frequency produce minimal changes in viscous damping. The slightly higher loss modulus observed for the anatomical geometry suggests a greater capacity for energy dissipation, likely due to the complex cross-sectional variation, which may promote localized strain concentrations and enhance internal friction during oscillatory loading.
As with the storage modulus, geometry had a clear influence on the loss modulus across the entire frequency range. The slightly higher E″ values observed for the anatomical samples suggest a greater capacity for energy dissipation, probably associated with their complex geometry and the resulting potential for non-uniform stress distribution during oscillatory loading. In contrast, cylindrical samples tended to show greater dispersion in E″. This can be explained, once again, by their uniform cross-section, which offers fewer geometric constraints. Consequently, small differences in effective diameter and small surface defects due to the printing process or post-processing can have a proportionally greater effect on the viscous response, amplifying the variability of the loss modulus values. Consistently, a one-way ANOVA test was performed on the loss modulus E″ at each frequency, with results shown in Figure 16, yielding p-values ≤ 0.01 across all frequencies, confirming that geometry has a statistically significant effect on the viscous response.
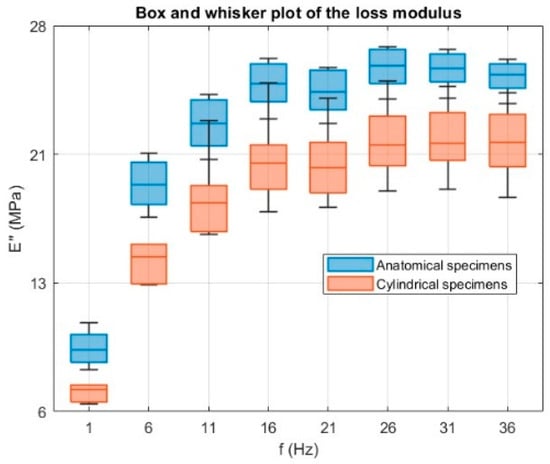
Figure 16.
Box and whisker plots of the loss modulus E″ (MPa) as a function of frequency for anatomical (blue) and cylindrical (orange) specimens. A one-way ANOVA performed at each frequency shows a significant effect of specimen geometry (p ≤ 0.01 at all frequencies), confirming that geometry influences the viscous response.
6.2.3. Loss Factor
The loss factor (tan δ) results are shown in Figure 17. For both specimen types, tan δ increased to a well-defined peak at approximately 16 Hz, followed by a gradual decrease or plateau at higher frequencies. Anatomical specimens reached a maximum of 0.74 ± 0.07, while cylindrical specimens peaked at 0.71 ± 0.11 before leveling off above 21 Hz. A peak in tan δ indicates the frequency range at which the material maximizes energy dissipation relative to energy storage. From a mechanical standpoint, this corresponds to a condition where internal molecular motions and microstructural rearrangements are optimally synchronized with the loading cycle, allowing viscous mechanisms to dominate over elastic ones at room temperature. Beyond this range, the reduced time available for molecular movement leads to a more elastic-like response and lower tan δ values. As observed for E′ and E″, specimen geometry influenced the magnitude and stability of tan δ across the frequency range, with anatomical specimens showing slightly higher average values. The greater data dispersion found in cylindrical specimens for E′ and E″ was also reflected in their tan δ values.
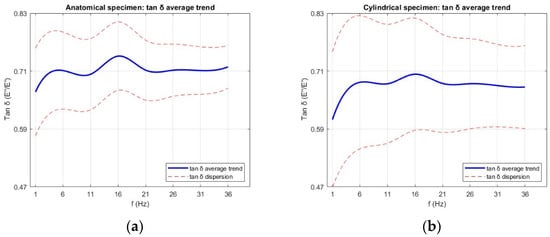
Figure 17.
Average loss factor (tan δ) as a function of frequency for (a) anatomical specimens and (b) cylindrical specimens. Data are presented as mean values with error bars representing the standard deviation across six replicates for each geometry.
The tables below summarize the viscoelastic parameters obtained for the anatomical specimens (Table 4) and cylindrical specimens (Table 5), expressed as the mean value and standard deviation.

Table 4.
Summary of viscoelastic parameters for the anatomical specimens, expressed as mean ± standard deviation (SD).

Table 5.
Summary of viscoelastic parameters for the cylindrical specimens, expressed as mean ± standard deviation (SD).
This behavior aligns with the typical viscoelastic response of elastomeric materials, where stiffness increases with excitation frequency due to reduced time for molecular rearrangements [53,54,55]. A similar trend has been reported for real human airways in [37], where the storage modulus likewise increased with frequency, reflecting the intrinsic time-dependent response of airway tissue under oscillatory loading.
6.3. Creep Test
The experimental data of creep response was fitted to a two-element generalized Maxwell model to characterize the material viscoelastic behavior. This configuration was not assumed a priori but determined from the shape of the experimental curves, where two distinct relaxation processes, one fast and one slow, were evident. The fit curves obtained from the interpolation of experimental data for both are shown in Figure 18. The fit quality was high for both geometries, with R2 values of 0.99 for anatomical specimens and 0.98 for cylindrical specimens, and RMSE values in the order of 10−4, confirming that the model robustly reproduces the experimental slip curves. In addition, this modeling strategy is commonly used in biomechanical studies to describe the time-dependent mechanical behavior of soft biological tissues [56].
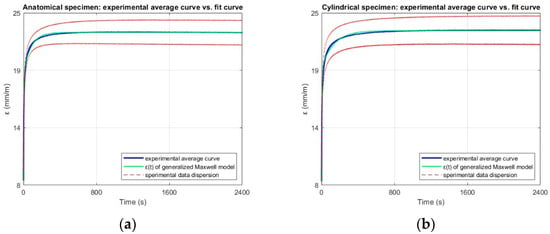
Figure 18.
Experimental average strain–time curve (blue), fit obtained from the two-element Generalized Maxwell model (green), and experimental data dispersion (red dashed lines), for (a) anatomical and (b) cylindrical specimens.
From data processing, therefore, following the methodology described in Section 4.3, the mathematical model that best represents the experimental trend of the data is:
where the fitted coefficients (A0, A1, A2, B1 and B2) obtained from non-linear regression are reported in Table 6. Using the relationships in Section 4.3, these coefficients were converted into the characteristic viscoelastic parameters (E0, E1, E2, τ1, τ2, η1, η2) listed in Table 7.

Table 6.
Coefficients obtained from the non-linear regression of the experimental creep data using the two-element Generalized Maxwell model, along with the coefficient of determination R2 and Root Mean Square Error (RMSE). Values are expressed as mean ± standard deviation (SD).

Table 7.
Viscoelastic parameters of the two-element Generalized Maxwell model for anatomical and cylindrical specimens, calculated from the regression coefficients in Table 6. Values are expressed as mean ± standard deviation (SD).
The instantaneous modulus (E0) was the same for both specimen types (9.9 MPa), indicating comparable initial elastic stiffness under sudden loading. Differences emerged in the Maxwell branch parameters. This suggests that anatomical specimens may dissipate a slightly larger portion of the applied strain through the faster relaxation process (τ1 = 4.16 s anatomical, 4.91 s cylindrical), whereas cylindrical specimens exhibit a slower long-term relaxation (τ2 = 134 s compared to 82 s for anatomical specimens). The viscosity values reflect these differences, with cylindrical specimens showing a notably higher (η2 = 30.6∙102 MPa·s compared to 17∙102 MPa·s), consistent with their longer secondary relaxation time. This behavior can be attributed to geometric effects: the uniform cross-section of the cylindrical samples may promote a more homogeneous stress distribution, leading to slower redistribution of internal stresses during the steady-state phase, while the complex geometry of the anatomical specimens facilitates faster local relaxation mechanisms. Overall, the creep analysis confirms that geometry plays a measurable role not only in the instantaneous elastic response but also in the balance between fast and slow relaxation processes. In general, the trends observed are consistent with those reported for elastomers of similar hardness, in which the relative contributions of rapid and slow relaxation processes, as well as the stability of elastic parameters beyond a deformation threshold, have been consistently documented [57]. When compared with published data on human trachea mechanical behavior [36,38], a similar relationship between short- and long-term relaxation times is found, with τ2 consistently about one order of magnitude greater than τ1. This suggests that the material used in this study suitably reproduces the characteristic time-dependent viscoelastic response of the human trachea.
7. Conclusions
In the absence of standardized procedures for the mechanical testing of 3D-printed polymeric materials and established quality control protocols for soft 3DP components in biomedical applications, this study developed and applied a dedicated experimental method to assess the suitability of Flexible 80A Resin for reproducing a pediatric trachea model intended for integration into a commercial airway simulator. The approach involved comparative testing of three specimen geometries (anatomical, cylindrical and standardized dog-bone) under static, dynamic and creep loading conditions to comprehensively evaluate the elastic, viscoelastic and time-dependent behavior of the printed material.
Static tests showed that anatomical and cylindrical specimens had comparable elastic moduli, indicating that simplified geometries can provide representative small-strain stiffness data in some cases. In contrast, dog-bone specimens consistently exhibited higher stiffness, reflecting the influence of standardized geometry that differs from the hollow cross-section of the application. This suggests the importance of establishing a dedicated protocol for biomedical 3D printing, where complex geometries are common, printing orientation may vary and reliance on standard specimen testing may be insufficient.
Dynamic tests revealed comparable frequency-dependent viscoelastic trends for anatomical and cylindrical specimens; however, anatomical geometries exhibited slightly higher stiffness and energy dissipation, indicating an enhanced capability to replicate complex load distributions under realistic use conditions. Similarly, creep tests showed that the complex geometry of the anatomical specimens facilitated faster local relaxation mechanisms. Fitting the experimental creep data with a two-element generalized Maxwell model captured both fast and slow relaxation processes, in agreement with time-dependent stress relaxation behaviors reported for human tracheal tissue in the literature.
These results confirm the suitability of the selected material for reproducing the biomechanical response of a pediatric trachea in surgical simulation, although this study is limited by the use of a single printing material. While this choice allowed for a rapid and controlled evaluation of the proposed protocol, future studies should explore multi-material printing, assigning different soft materials to mimic muscle, cartilage, and connective tissue of the trachea. Furthermore, multi-cycle fatigue testing will be incorporated in the protocol to assess long-term performance and durability of the 3D-printed models. Finally, future studies will be needed to systematically assess the impact of printing orientation and post-processing parameters, varying them, which may further contribute to the discrepancies observed with manufacturer data. In addition, future work will focus on refining this protocol for other soft tissue applications, contributing to the development of standardized quality control methods for biomedical 3D printing.
Author Contributions
Conceptualization, M.C.; methodology, M.C.; software, M.C.; validation, M.C. and G.F.; formal analysis, M.C., G.F. and A.S. (Andrea Scorza); investigation, M.C. and A.G.; resources, J.G., A.S. (Aurelio Secinaro), M.B. and S.A.S.; data curation, M.C.; writing—original draft preparation, M.C.; writing—review and editing, M.C., G.F., A.G., M.B., L.B., J.G., A.S. (Aurelio Secinaro), S.A.S. and A.S. (Andrea Scorza); visualization, M.C.; supervision, A.S. (Andrea Scorza); project administration, L.B., A.S. (Aurelio Secinaro) and A.S. (Andrea Scorza); funding acquisition, M.B., A.S. (Aurelio Secinaro) and S.A.S. All authors have read and agreed to the published version of the manuscript.
Funding
This research was also supported by the Italian Ministry of Health with “Current Research funds”.
Institutional Review Board Statement
Fully and irreversibly anonymized diagnostic data were used for research purposes only; therefore, Ethics Approval is not required, as indicated in Regulation (EU) 2016/679 (GDPR).
Informed Consent Statement
No genetic or biometric data, nor data concerning health, were maintained from the diagnostic examination, which was fully and irreversibly anonymized; therefore, the Informed Consent Statement does not apply to this research study, as indicated in Regulation (EU) 2016/679 (GDPR).
Data Availability Statement
The original contributions presented in this study are included in the article. Further inquiries can be directed to the corresponding author.
Acknowledgments
This work was partially supported by Rome Technopole, PNRR grant M4-C2-Inv. 1.5 (CUP F83B22000040006). In particular, the mechanical testing phase and data analysis were funded by Rome Technopole.
Conflicts of Interest
The authors declare no conflicts of interest.
References
- Rouf, S.; Malik, A.; Singh, N.; Raina, A.; Naveed, N.; Siddiqui, M.I.H.; Haq, M.I.U. Additive Manufacturing Technologies: Industrial and Medical Applications. Sustain. Oper. Comput. 2022, 3, 258–274. [Google Scholar] [CrossRef]
- Cecchitelli, M.; Fiori, G.; Bocchetta, G.; Filippi, F.; Leccese, F.; Galo, J.; Sciuto, S.A.; Scorza, A. Quality Control of 3D Printing in Bioarchaeology: A Case Study on Dimensional Assessment of Cranial Models. Acta IMEKO 2024, 13, 1–7. [Google Scholar] [CrossRef]
- Cecchitelli, M.; Fiori, G.; Bocchetta, G.; Filippi, F.; Leccese, F.; Galo, J.; Sciuto, S.A.; Scorza, A. Dimensional Assessment in Bioarchaeology Applications: A Preliminary Study on Quality Controls in 3D Printing of Human Skulls. In Proceedings of the 2023 IMEKO TC4 International Conference on Metrology for Archaeology and Cultural Heritage, Rome, Italy, 19–21 October 2023; TC4 MetroArchaeo 2023. pp. 98–103. [Google Scholar]
- Tom, T.; Sreenilayam, S.P.; Brabazon, D.; Jose, J.P.; Joseph, B.; Madanan, K.; Thomas, S. Additive Manufacturing in the Biomedical Field-Recent Research Developments. Results Eng. 2022, 16, 100661. [Google Scholar] [CrossRef]
- Arif, Z.U.; Khalid, M.Y.; Noroozi, R.; Hossain, M.; Shi, H.H.; Tariq, A.; Ramakrishna, S.; Umer, R. Additive Manufacturing of Sustainable Biomaterials for Biomedical Applications. Asian J. Pharm. Sci. 2023, 18, 100812. [Google Scholar] [CrossRef]
- Salazar, D.; Thompson, M.; Rosen, A.; Zuniga, J. Using 3D Printing to Improve Student Education of Complex Anatomy: A Systematic Review and Meta-Analysis. Med. Sci. Educ. 2022, 32, 1209–1218. [Google Scholar] [CrossRef] [PubMed]
- Tejo-Otero, A.; Lustig-Gainza, P.; Fenollosa-Artés, F.; Valls, A.; Krauel, L.; Buj-Corral, I. 3D Printed Soft Surgical Planning Prototype for a Biliary Tract Rhabdomyosarcoma. J. Mech. Behav. Biomed. Mater. 2020, 109, 103844. [Google Scholar] [CrossRef]
- Estermann, S.-J.; Pahr, D.H.; Reisinger, A. Quantifying Tactile Properties of Liver Tissue, Silicone Elastomers, and a 3D Printed Polymer for Manufacturing Realistic Organ Models. J. Mech. Behav. Biomed. Mater. 2020, 104, 103630. [Google Scholar] [CrossRef]
- Nguyen, P.; Stanislaus, I.; McGahon, C.; Pattabathula, K.; Bryant, S.; Pinto, N.; Jenkins, J.; Meinert, C. Quality Assurance in 3D-Printing: A Dimensional Accuracy Study of Patient-Specific 3D-Printed Vascular Anatomical Models. Front. Med. Technol. 2023, 5, 1097850. [Google Scholar] [CrossRef]
- Flaxman, T.E.; Cooke, C.M.; Miguel, O.X.; Sheikh, A.; McInnes, M.; Duigenan, S.; Singh, S.S. The Value of Using Patient-Specific 3D-Printed Anatomical Models in Surgical Planning for Patients With Complex Multifibroid Uteri. J. Obstet. Gynaecol. Can. 2024, 46, 102435. [Google Scholar] [CrossRef]
- Shimojima, N.; Shimotakahara, A.; Tomita, H.; Maeda, Y.; Ito, Y.; Miyaguni, K.; Tsukizaki, A.; Abe, K.; Hashimoto, M.; Ishikawa, M. Simulated Slide Tracheoplasty for Congenital Tracheal Stenosis Using Three-Dimensional Printed Models. Pediatr. Surg. Int. 2022, 38, 1895–1902. [Google Scholar] [CrossRef]
- Ramella, A.; Migliavacca, F.; Rodriguez Matas, J.F.; Heim, F.; Dedola, F.; Marconi, S.; Conti, M.; Allievi, S.; Mandigers, T.J.; Bissacco, D.; et al. Validation and Verification of High-Fidelity Simulations of Thoracic Stent-Graft Implantation. Ann. Biomed. Eng. 2022, 50, 1941–1953. [Google Scholar] [CrossRef]
- Carter, J.C.; Broadbent, J.; Murphy, E.C.; Guy, B.; Baguley, K.E.; Young, J. A Three-Dimensional (3D) Printed Paediatric Trachea for Airway Management Training. Anaesth. Intensive Care 2020, 48, 243–245. [Google Scholar] [CrossRef]
- Cecchitelli, M.; Fiori, G.; Galo, J.; Sciuto, S.A.; Scorza, A. Quality Control for 3D Printing in Biomedical Applications: A Case Study on Dimensional Assessment of Skull Models. In Proceedings of the 2024 IEEE International Workshop on Metrology for Industry 4.0 & IoT (MetroInd4.0 & IoT), Firenze, Italy, 29–31 May 2024; pp. 609–613. [Google Scholar]
- Cecchitelli, M.; Fiori, G.; Luchetti, A.; Galo, J.; Sciuto, S.A.; Scorza, A. Volumetric Assessment for Quality Control in 3D Printed Bone Models: A Preliminary Investigation. In Proceedings of the 2025 IEEE International Workshop on Metrology for Industry 4.0 & IoT (MetroInd4.0 & IoT), Castelldefels, Spain, 1–3 July 2025; pp. 101–105. [Google Scholar]
- Msallem, B.; Vavrina, J.J.; Beyer, M.; Halbeisen, F.S.; Lauer, G.; Dragu, A.; Thieringer, F.M. Dimensional Accuracy in 3D Printed Medical Models: A Follow-Up Study on SLA and SLS Technology. J. Clin. Med. 2024, 13, 5848. [Google Scholar] [CrossRef]
- Lakkala, P.; Munnangi, S.R.; Bandari, S.; Repka, M. Additive Manufacturing Technologies with Emphasis on Stereolithography 3D Printing in Pharmaceutical and Medical Applications: A Review. Int. J. Pharm. X 2023, 5, 100159. [Google Scholar] [CrossRef]
- Jaksa, L.; Aryeetey, O.J.; Hatamikia, S.; Nägl, K.; Buschmann, M.; Pahr, D.; Kronreif, G.; Lorenz, A. 3D-Printed Multi-Material Liver Model with Simultaneous Mechanical and Radiological Tissue-Mimicking Features for Improved Realism. Int. J. Bioprinting 2023, 9, 721. [Google Scholar] [CrossRef] [PubMed]
- Ornaghi, H.L.; Monticeli, F.M.; Agnol, L.D. A Review on Polymers for Biomedical Applications on Hard and Soft Tissues and Prosthetic Limbs. Polymers 2023, 15, 4034. [Google Scholar] [CrossRef] [PubMed]
- Cecchitelli, M.; Giorgia, F.; Annalisa, G.; Massimiliano, B.; Jan, G.; Andrea, S.; Salvatore, A.S. Mechanical Properties of Soft Materials in 3D Printing: A Preliminary Quality Assessment. In Proceedings of the 2025 IEEE International Workshop on Metrology for Industry 4.0 & IoT (MetroInd4.0 & IoT), Castelldefels, Spain, 1–3 July 2025; pp. 106–110. [Google Scholar]
- Wikło, M.; Byczuk, B.H.; Skrzek, K. Mechanical Characterization of FDM 3D-Printed Components Using Advanced Measurement and Modeling Techniques. Materials 2025, 18, 1086. [Google Scholar] [CrossRef] [PubMed]
- Sierra, J.; Villa, D.S.; Velasquez, A.M.; Villaneda, W. Relation between Mechanical Properties and 3D Printer Configurations Parameters Using PLA at Open-Source Prusa I3. Int. J. Integr. Eng. 2020, 12, 97–108. [Google Scholar] [CrossRef]
- Xu, D.; Zhou, H.; Jie, T.; Zhou, Z.; Yuan, Y.; Jemni, M.; Quan, W.; Gao, Z.; Xiang, L.; Gusztav, F.; et al. Data-Driven Deep Learning for Predicting Ligament Fatigue Failure Risk Mechanisms. Int. J. Mech. Sci. 2025, 301, 110519. [Google Scholar] [CrossRef]
- La Rosa, G.; Savio, F.L.; Pedullà, E.; Rapisarda, E. Developing of a New Device for Static and Dynamic Tests of Ni-Ti Instruments for Root Canal Treatment. Procedia Struct. Integr. 2016, 2, 1303–1310. [Google Scholar] [CrossRef]
- Health, C. For D. and R. 3D Printing of Medical Devices. Available online: https://www.fda.gov/medical-devices/products-and-medical-procedures/3d-printing-medical-devices (accessed on 8 September 2025).
- Medical Devices|European Medicines Agency (EMA). Available online: https://www.ema.europa.eu/en/human-regulatory-overview/medical-devices (accessed on 8 September 2025).
- Sears, V.A.; Morris, J.M. Establishing a Point-of-Care Virtual Planning and 3D Printing Program. Semin. Plast. Surg. 2022, 36, 133–148. [Google Scholar] [CrossRef] [PubMed]
- Ganapathy, A.; Chen, D.; Elumalai, A.; Albers, B.; Tappa, K.; Jammalamadaka, U.; Hoegger, M.J.; Ballard, D.H. Guide for Starting or Optimizing a 3D Printing Clinical Service. Methods 2022, 206, 41–52. [Google Scholar] [CrossRef] [PubMed]
- Shim, K.W. Medical Applications of 3D Printing and Standardization Issues. Brain Tumor Res. Treat. 2023, 11, 159–165. [Google Scholar] [CrossRef]
- Phillips, C.; Kortschot, M.; Azhari, F. Towards Standardizing the Preparation of Test Specimens Made with Material Extrusion: Review of Current Techniques for Tensile Testing. Addit. Manuf. 2022, 58, 103050. [Google Scholar] [CrossRef]
- Bachtiar, E.O.; Erol, O.; Millrod, M.; Tao, R.; Gracias, D.H.; Romer, L.H.; Kang, S.H. 3D Printing and Characterization of a Soft and Biostable Elastomer with High Flexibility and Strength for Biomedical Applications. J. Mech. Behav. Biomed. Mater. 2020, 104, 103649. [Google Scholar] [CrossRef]
- Tanveer, M.Q.; Mishra, G.; Mishra, S.; Sharma, R. Effect of Infill Pattern and Infill Density on Mechanical Behaviour of FDM 3D Printed Parts-a Current Review. Mater. Today Proc. 2022, 62, 100–108. [Google Scholar] [CrossRef]
- Rains, J.K.; Bert, J.L.; Roberts, C.R.; Pare, P.D. Mechanical Properties of Human Tracheal Cartilage. J. Appl. Physiol. 1992, 72, 219–225. [Google Scholar] [CrossRef]
- Lambert, R.K.; Baile, E.M.; Moreno, R.; Bert, J.; Pare, P.D. A Method for Estimating the Young’s Modulus of Complete Tracheal Cartilage Rings. J. Appl. Physiol. 1991, 70, 1152–1159. [Google Scholar] [CrossRef] [PubMed]
- Trabelsi, O.; Del Palomar, A.P.; López-villalobos, J.L.; Ginel, A.; Doblaré, M. Experimental Characterization and Constitutive Modeling of the Mechanical Behavior of the Human Trachea. Med. Eng. Phys. 2010, 32, 76–82. [Google Scholar] [CrossRef]
- Eskandari, M.; Arvayo, A.L.; Levenston, M.E. Mechanical Properties of the Airway Tree: Heterogeneous and Anisotropic Pseudoelastic and Viscoelastic Tissue Responses. J. Appl. Physiol. 2018, 125, 878–888. [Google Scholar] [CrossRef]
- Wang, J.-Y.; Mesquida, P.; Pallai, P.; Corrigan, C.J.; Lee, T.H. Dynamic Properties of Human Bronchial Airway Tissues. arXiv 2011. [Google Scholar] [CrossRef]
- Safshekan, F.; Tafazzoli-Shadpour, M.; Abdouss, M.; Shadmehr, M.B. Viscoelastic Properties of Human Tracheal Tissues. J. Biomech. Eng. 2017, 139, 011007. [Google Scholar] [CrossRef]
- Chai, Q.; Huang, S.; Wan, F.; Wu, F.; Feng, L. A New Experimental Method to Measure and Calculate the Tensile Strength of Concrete. Front. Mater. 2023, 10, 1216747. [Google Scholar] [CrossRef]
- ISO 527-1:2019; Plastics—Determination of Tensile Properties—Part 1: General Principles. ISO—International Organization for Standardization: Vernier, Switzerland, 2019.
- Razavi, N.; Hooreweder, B.V.; Berto, F. Effect of Build Thickness and Geometry on Quasi-Static and Fatigue Behavior of Ti-6Al-4V Produced by Electron Beam Melting. Addit. Manuf. 2020, 36, 101426. [Google Scholar] [CrossRef]
- Materialise Mimics|Healthcare Software Platform. Available online: https://www.materialise.com/en/healthcare/mimics (accessed on 18 September 2025).
- Taylor, J.R. An Introduction to Error Analysis: The Study of Uncertainties in Physical Measurements; University Science Books: Sausalito, CA, USA, 1997; ISBN 978-0935702422. [Google Scholar]
- Navidi, W. Statistics for Engineers and Scientists; McGraw-Hill Education: New York, NY, USA, 2019; ISBN 1-259-71760-7. [Google Scholar]
- ISO 37:2024; Rubber, Vulcanized or Thermoplastic—Determination of Tensile Stress-Strain Properties. ISO—International Organization for Standardization: Vernier, Switzerland, 2024.
- ISO 899-1:2018; Plastics—Determination of Creep Behaviour—Part 1: Tensile Creep. ISO—International Organization for Standardization: Vernier, Switzerland, 2018.
- Safshekan, F.; Tafazzoli-Shadpour, M.; Abdouss, M.; Shadmehr, M.B.; Ghorbani, F. Investigation of the Mechanical Properties of the Human Tracheal Cartilage. Tanaffos 2017, 16, 107. [Google Scholar]
- ISO 6721-4:2019; Plastics—Determination of Dynamic Mechanical Properties—Part 4: Tensile Vibration—Non-Resonance Method. ISO—International Organization for Standardization: Vernier, Switzerland, 2019.
- Bonkile, M.P.; Awasthi, A.; Lakshmi, C.; Mukundan, V.; Aswin, V.S. A Systematic Literature Review of Burgers’ Equation with Recent Advances. Pramana 2018, 90, 69. [Google Scholar] [CrossRef]
- Chen, P. Creep Response Of A Generalized Maxwell Model. Int. Agrophysics 1994, 8, 555–558. [Google Scholar]
- Findley, W.N.; Lai, J.S.; Onaran, K. (Eds.) Creep and Relaxation of Nonlinear Viscoelastic Materials: With an Introduction to Linear Viscoelasticity; Dover Books on Engineering; Dover: New York, NY, USA, 2010; ISBN 978-0-486-66016-5. [Google Scholar]
- ISO/IEC Guide 98-3:2008; Uncertainty of Measurement-Part 3: Guide to the Expression of Uncertainty in Measurement (GUM: 1995). International Organization for Standardization: Vernier, Switzerland, 2008.
- Shimaoka, K.; Kinoshita, M.; Fujii, K.; Tosaka, T. Evaluation of Measurement Data—Supplement 1 to the “Guide to the Expression of Uncertainty in Measurement”—Propagation of Distributions Using a Monte Carlo Method. JCGM 2008, 101, 1–82. [Google Scholar]
- Dunson, D. Characterization of Polymers Using Dynamic Mechanical Analysis (DMA). EAG Appl. Note 2017, 1–8. [Google Scholar]
- Cortazar-Noguerol, J.; Cortés, F.; Sarría, I.; Elejabarrieta, M.J. Preload Influence on the Dynamic Properties of a Polyurethane Elastomeric Foam. Polymers 2024, 16, 1844. [Google Scholar] [CrossRef] [PubMed]
- Wang, X.; Schoen, J.A.; Rentschler, M.E. A Quantitative Comparison of Soft Tissue Compressive Viscoelastic Model Accuracy. J. Mech. Behav. Biomed. Mater. 2013, 20, 126–136. [Google Scholar] [CrossRef] [PubMed]
- Zielonka, P.; Junik, K.; Duda, S.; Socha, T.; Kula, K.; Denisiewicz, A.; Olaleye, K.; Macek, W.; Lesiuk, G.; Błażejewski, W. Stress Relaxation Behaviour Modeling in Rigid Polyurethane (PU) Elastomeric Materials. Materials 2023, 16, 3156. [Google Scholar] [CrossRef] [PubMed]
Disclaimer/Publisher’s Note: The statements, opinions and data contained in all publications are solely those of the individual author(s) and contributor(s) and not of MDPI and/or the editor(s). MDPI and/or the editor(s) disclaim responsibility for any injury to people or property resulting from any ideas, methods, instructions or products referred to in the content. |
© 2025 by the authors. Licensee MDPI, Basel, Switzerland. This article is an open access article distributed under the terms and conditions of the Creative Commons Attribution (CC BY) license (https://creativecommons.org/licenses/by/4.0/).