Article

GNN-MFF: A Multi-View Graph-Based Model for RTL Hardware Trojan Detection

1
School of Aeronautics and Astronautics, University of Chinese Academy of Sciences, Beijing 101408, China
2
Technology and Engineering Center for Space Utilization, Chinese Academy of Sciences, Beijing 100094, China
*
Author to whom correspondence should be addressed.
Appl. Sci. 2025, 15(19), 10324; https://doi.org/10.3390/app151910324
Submission received: 18 August 2025 / Revised: 14 September 2025 / Accepted: 20 September 2025 / Published: 23 September 2025

Abstract

The globalization of hardware design flows has increased the risk of Hardware Trojan (HT) insertion during the design phase. Graph-based learning methods have shown promise for HT detection at the Register Transfer Level (RTL). However, most existing approaches rely on representing RTL designs through a single graph structure. This single-view modeling paradigm inherently constrains the model’s ability to perceive complex behavioral patterns, consequently limiting detection performance. To address these limitations, we propose GNN-MFF, an innovative multi-view feature fusion model based on Graph Neural Networks (GNNs). Our approach centers on joint multi-view modeling of RTL designs to achieve a more comprehensive representation. Specifically, we construct complementary graph-structural views: the Abstract Syntax Tree (AST) capturing structure information, and the Data Flow Graph (DFG) modeling logical dependency relationships. For each graph structure, customized GNN architectures are designed to effectively extract its features. Furthermore, we develop a feature fusion framework that leverages a multi-head attention mechanism to deeply explore and integrate heterogeneous features from distinct views, thereby enhancing the model’s capacity to structurally perceive anomalous logic patterns. Evaluated on an extended Trust-Hub-based HT benchmark dataset, our model achieves an average F1-score of 97.08% in automated detection of unseen HTs, surpassing current state-of-the-art methods.

1. Introduction

As the scale and complexity of integrated circuits continue to grow, so do the cost and time required for design and manufacturing. To reduce expenses and accelerate time-to-market, integrated circuit design and fabrication are increasingly distributed across global teams, spanning specification, design, layout, fabrication, testing, and assembly. While this globalized process improves efficiency, it also introduces significant security vulnerabilities in hardware, particularly for embedded systems, IoT devices, and sensor networks, where reliability and trustworthiness are critical.
Among these threats, Hardware Trojans (HTs)—malicious modifications stealthily embedded within logic designs that can be activated under specific conditions—have emerged as one of the most severe challenges to modern chip security. HTs can compromise device functionality, leak sensitive information, or disrupt system operations, posing serious risks to the integrity of sensor networks and connected devices. Therefore, effective detection of HTs during the design and testing stages is essential to ensure the security, trustworthiness, and resilience of modern interconnected hardware systems.
Currently, a significant amount of research has been conducted on HT detection, which can be classified into pre-silicon detection [1,2,3,4,5,6,7] and post-silicon detection [8,9] based on the timing of detection. Pre-silicon detection is mainly performed before the manufacturing process, while post-silicon detection is conducted after the completion of hardware device manufacturing. Compared to post-silicon detection, detecting HTs in the early stages of design, such as register transfer level (RTL) design, is crucial. On the one hand, HTs are inserted during the processes of synthesis, placement, and routing, making the security threats increasingly sophisticated and covert, thereby increasing the difficulty of detection. On the other hand, HTs inserted at the RTL stage can often be removed by modifying the source code, which provides a more flexible remediation opportunity. Currently, pre-silicon HT detection methods mainly include function-based testing [1], code/structure-based approaches [2,3,4], and formal verification [5,6,7]. Function-based testing typically detects only a limited range of HT types and incurs high time costs. Code/structure-based methods are primarily used to detect known HTs and require manual code review. Formal verification methods are constrained by the need for predefined security properties and face scalability issues such as state space explosion. With the remarkable success of machine learning in various research fields, its potential to address HT detections has gained attention. Machine learning methods are currently applied in the extraction of circuit features and behaviors for RTL code HT detection [10,11,12,13]. Among them, Graph Neural Networks (GNNs) have garnered significant attention due to their strong ability to model structural dependencies in graph-based data. Nevertheless, existing GNN-based methods [14,15,16] face two critical limitations in the context of RTL HT detection: (1) Limited modeling perspectives: Most approaches adopt a single graph representation of RTL designs, which fails to capture the diverse semantic and behavioral dimensions present in RTL code. (2) Inadequate feature fusion: There is a lack of mechanisms to jointly model and integrate heterogeneous structural information, resulting in poor generalization to complex or previously unseen HTs.
To address these challenges, we propose GNN-MFF, a novel multi-view feature fusion model based on GNNs for RTL HT detection. Our approach constructs two distinct and complementary graph perspectives: an Abstract Syntax Tree (AST) to capture the syntactic hierarchy and control structure of the RTL code, and a Data Flow Graph (DFG) to model the logical dependencies and signal propagation paths. This combined representation of AST and DFG constitutes a homogeneous origin yet semantically heterogeneous graph system, as both views are extracted from the same underlying RTL design graph. This ensures structural consistency across views while enabling a multi-dimensional characterization of circuit behavior. To accommodate the differences in structural characteristics between AST and DFG, we design view-specific GNN encoders: a Graph Attention Network (GAT) is applied to the AST to highlight syntactically important nodes, while a Graph Convolutional Network (GCN) is used for the DFG to extract topological dependencies. We further develop an adaptive feature fusion module based on a multi-head attention mechanism, which performs deep alignment and integration of features from both graph views. This mechanism enhances the model’s structural awareness and improves its robustness in detecting diverse and stealthy Trojan behaviors.
Our main contributions are summarized as follows:
  • We propose a multi-view graph modeling framework that jointly represents RTL code using AST and DFG. Each graph is processed by a dedicated GNN architecture tailored to its structural characteristics, enabling complementary modeling of syntactic structures and logical dependencies in RTL designs.
  • We design a multi-head attention-based feature fusion strategy to effectively align and integrate heterogeneous features from AST and DFG, enhancing the model’s capacity to detect subtle and abnormal logic behaviors across perspectives.
  • We construct an extended HT dataset based on Trust-Hub [17], encompassing diverse HT variants, and evaluate our model on this dataset. Our method achieves an average F1-score of approximately 97.08% in detecting previously unseen HTs, outperforming state-of-the-art methods.
The rest of this paper is organized as follows. Section 2 introduces the main methods of HT detection, including traditional testing methods and machine learning-based methods. Section 3 introduces our model GNN-MFF. Section 4 introduces our experiments. Finally, the conclusions are provided in Section 5.

2. Related Work

2.1. Traditional Trojan Detection

In the field of pre-silicon including RTL HT detection, the main methods to verify the existence of HTs are function-based testing, code/structure analysis, or formal verification methods. (1) Function-based testing involves using automated testing tools to check if the chip’s output matches the expected logic, thereby determining if the chip is implanted with HTs. For example, Sullivan et al. proposed the use of functional recognition to detect HTs in IP cores [1]. However, this method cannot detect HTs that do not modify the original design functionality. Furthermore, due to the low activation probability of HTs, this method often suffers from low efficiency. (2) Code/structure analysis techniques focus on detecting HTs in RTL code or netlists. One approach is to analyze the circuit based on the low triggering probability of HTs. For instance, Hicks et al. proposed detecting circuits that are not used in any design verification test or activated in any other way to determine whether there is an HT implanted [2]. Another approach attempts to extract HT features from known HTs and establish a feature library for comparison with the target circuit. For example, Oya et al. proposed extracting features from known HT benchmarks, scoring the circuits based on the extracted features and determining the score threshold, and finally identifying HT circuits based on the calculated scores [3]. Although these methods have achieved certain effectiveness, they are often used for detecting known HTs, making it difficult to detect new and unknown HTs. Yu et al. proposed an efficient HT detection method using canonical correlation analysis (CCA) to analyze suspicious integrated circuits with side-channel attack countermeasures (SCACs). By exploring the correlations among random SC leakages induced by the same SCAC, CCA identifies critical features of the SCAC. The method compares eigenvalues derived from a trusted IC and the suspicious IC, enabling detection of embedded HTs, which alter these eigenvalues [18]. Islam et al. introduced a social network analysis-inspired approach for RTL HT detection by analyzing both node-level and graph-level interactions to identify vulnerable trigger and payload nets [4]. However, the method involves complex modeling and computation, which may increase the difficulty of implementation. (3) Formal verification involves checking if the chip satisfies a series of predefined security property rules to determine the presence of HTs. For example, He et al. proposed security properties for information leakage-type HTs and used formal verification methods to detect them [5]. However, this method does not directly detect HTs but relies on the setting of security properties, making it difficult to cope with various types of HTs and potentially leading to state space explosion. Another approach uses information flow tracking techniques [6,7]. By adding labels to the original inputs, the label values are also propagated during signal transmission, using formal verification to determine if information leakage has occurred and thus detect information leakage-based HTs.

2.2. Machine Learning-Based Trojan Detection

However, as the expertise of HT designers continues to improve, HTs are becoming increasingly complex and covert, making it difficult for traditional techniques to effectively detect these new types of HTs. In addition, as the scale of hardware systems increases, the scalability of traditional technologies in large-scale systems is also limited [19]. With the significant success of machine learning in various research fields, there has been a growing interest in exploring its potential for detecting HTs. Therefore, a portion of the research now focuses on using machine learning methods to detect HTs in RTL code. For example, Yang et al. proposed a detection method for HTs at RTL. They analyze suspicious structures or signal characteristics at RTL and build mathematical models. Then, they train and generate classifiers using the random forest algorithm to verify the presence of HTs in the circuit [10]. Choo et al. introduced a machine learning-based HT detection method that extracts four RTL features from branching statements. These features are then used to design supervised machine-learning models, including decision trees, logistic regression, support vector machines, and k-nearest neighbors [11]. Sutikno et al. proposed a machine learning-based RTL HT detection method that uses conditional statements in Verilog/VHDL code as machine learning features [12]. Meng et al. detect HTs by leveraging bit flip patterns induced through overclocking and applying machine learning techniques to distinguish deviations from baseline circuit behavior [13].

2.3. Graph-Based Trojan Detection

Recently, graph-based methods for HT detection have attracted growing attention due to their ability to model structural dependencies within RTL designs. For example, Zareen et al. applied Artificial Immune System (AIS)-based machine learning to detect malicious or unsafe behaviors in hardware descriptions by analyzing control and data-flow graphs, achieving HT detection without requiring a golden reference model [20]. Han et al. constructed a graph from RTL code and manually extracted circuit-level features to train an XGBoost-based classifier using labeled HT data [21]. Hassan et al. proposed a GNN-based approach that incorporates vaccination techniques using overclocking scenarios and circuit topology-aware graph-level features to detect anomalies [22]. While their method showed promising performance, it heavily relies on expert-driven feature engineering, limiting its scalability and generalization. To overcome these limitations, recent studies have increasingly adopted automatic feature extraction techniques. Muralidhar et al. designed a trigger detection framework that combines contrastive learning with GCNs, demonstrating the effectiveness of graph representation learning in identifying HT triggers [14].
Building on the structural modeling capabilities of graphs, some studies transform RTL designs into graph representations for downstream analysis. Yasaei et al. proposed a fully automated pipeline that transforms RTL code into a single graph structure and applies a GNN model for graph-level HT detection [15]. Zhang et al. proposed B-HTRecognizer, a novel method that leverages bit-level edge-featured data flow graphs and GAT to accurately and automatically localize HTs in unknown IC designs [16]. However, both approaches rely solely on a single-view representation, which limits their ability to capture the diverse structural and semantic information in RTL designs, leading to incomplete modeling of circuit behavior.
Moreover, Knowledge Graphs (KGs), as an effective tool for representation and reasoning, have gradually been introduced into HT detection research. A knowledge graph is a technology for storing and representing knowledge through a graph structure, where nodes represent entities and edges represent relationships between entities. By using Knowledge Graph Embedding (KGE) techniques, a knowledge graph can embed entities and their relationships into a low-dimensional space, automatically capturing complex relational structures within the graph, thereby supporting efficient reasoning and querying. Some studies have attempted to apply knowledge graphs to HT detection. For example, Utyamishev et al. first treated the netlist of a hardware design as a knowledge graph, constructing it from gate-level units and their interconnections. Node representations were then generated using graph embedding algorithms, and clustering methods were employed for Trojan detection [23]. Additionally, for RTL designs, Popryho et al. proposed a method that first constructs a variable dependency graph and leverages the dependencies among variables for reasoning [24]. Subsequently, vectors preserving the original graph structure are generated using knowledge graph embedding algorithms, and deep learning methods are applied for training and detection. Although these knowledge graph-based methods have achieved some success in HT detection, they typically rely on a single graph representation, and their feature representation capability is usually limited to the embedding algorithm, making it difficult to fully capture the diverse and complex logical behaviors in hardware designs.
To overcome this limitation, we propose a multi-view graph-based model that explicitly distinguishes and encodes both the syntactic structure and the logical dependencies of RTL code through ASTs and DFGs, respectively. By integrating these complementary views, our method enables circuit semantics to be captured from multiple perspectives. Furthermore, we design an automated feature extraction and fusion framework, which leverages dedicated GNN architectures and a multi-head attention mechanism to effectively learn and integrate heterogeneous features. This enables our model to generalize well to complex or previously unseen HTs.

3. Methodology

In this section, we introduce our proposed HT detection model, GNN-MFF. We define the HT detection problem as a graph-based classification problem. The overall architecture of GNN-MFF, as illustrated in Figure 1, consists of several key steps: graph construction, graph feature extraction, feature fusion, and prediction results. Firstly, the hardware source code is transformed into two types of graph representations—AST and DFG (detailed in Section 3.1). Then, different GNNs are employed to extract features separately from the AST and DFG (Section 3.2). Subsequently, a multi-head attention mechanism is used to adaptively fuse the multi-view features (Section 3.3). Finally, the fused features are fed into a multi-layer perceptron (MLP) followed by a softmax classifier to perform HT detection (Section 3.4). Our implementation of the GNN-MFF model is publicly available at https://github.com/zsj736543/GNN-MFF (accessed on 19 September 2025).

3.1. Threat Model

This paper focuses on HT detection at the RTL, independent of the specific insertion methods. We primarily consider three typical scenarios in which HTs may be inserted into RTL code: (1) Untrusted designers: directly inserting HTs while writing RTL source code; (2) Untrusted third-party IP vendors: RTL-format IP cores provided may contain hidden HTs; (3) Tampered EDA tools (such as high-level synthesis tools or IP core generators): if attacked, these tools could automatically insert HTs during the RTL design phase.
In all three scenarios, the RTL code entering the design process already contains HTs. Since our detection method takes RTL code as input and extracts syntax structure and logical dependency features through multi-view modeling, it is capable of covering the potential risks posed by these three scenarios.

3.2. Graph Construction

Given that RTL code can be represented from multiple perspectives, we adopt a multi-view graph modeling strategy that captures both the syntactic structure and logical dependencies of the circuit. These complementary representations jointly provide a more comprehensive understanding of circuit behavior and design intent. Specifically, on the one hand, to obtain the structural information of the code, we build an AST based on the RTL code. This is because the AST represents the syntactic structure of the code and showcases the hierarchical relationships among syntax elements in the source code. On the other hand, to obtain the data flow information of the code, we construct a DFG based on the RTL code. This is because the DFG represents the flow and transformation of data in the program. It describes the dependency relationships among data in the computation process using nodes and edges. Each node represents an operation, while the edges represent the flow of data. The DFG provides data flow information, reflecting the data dependency and variable usage in the code.

3.2.1. AST Generation

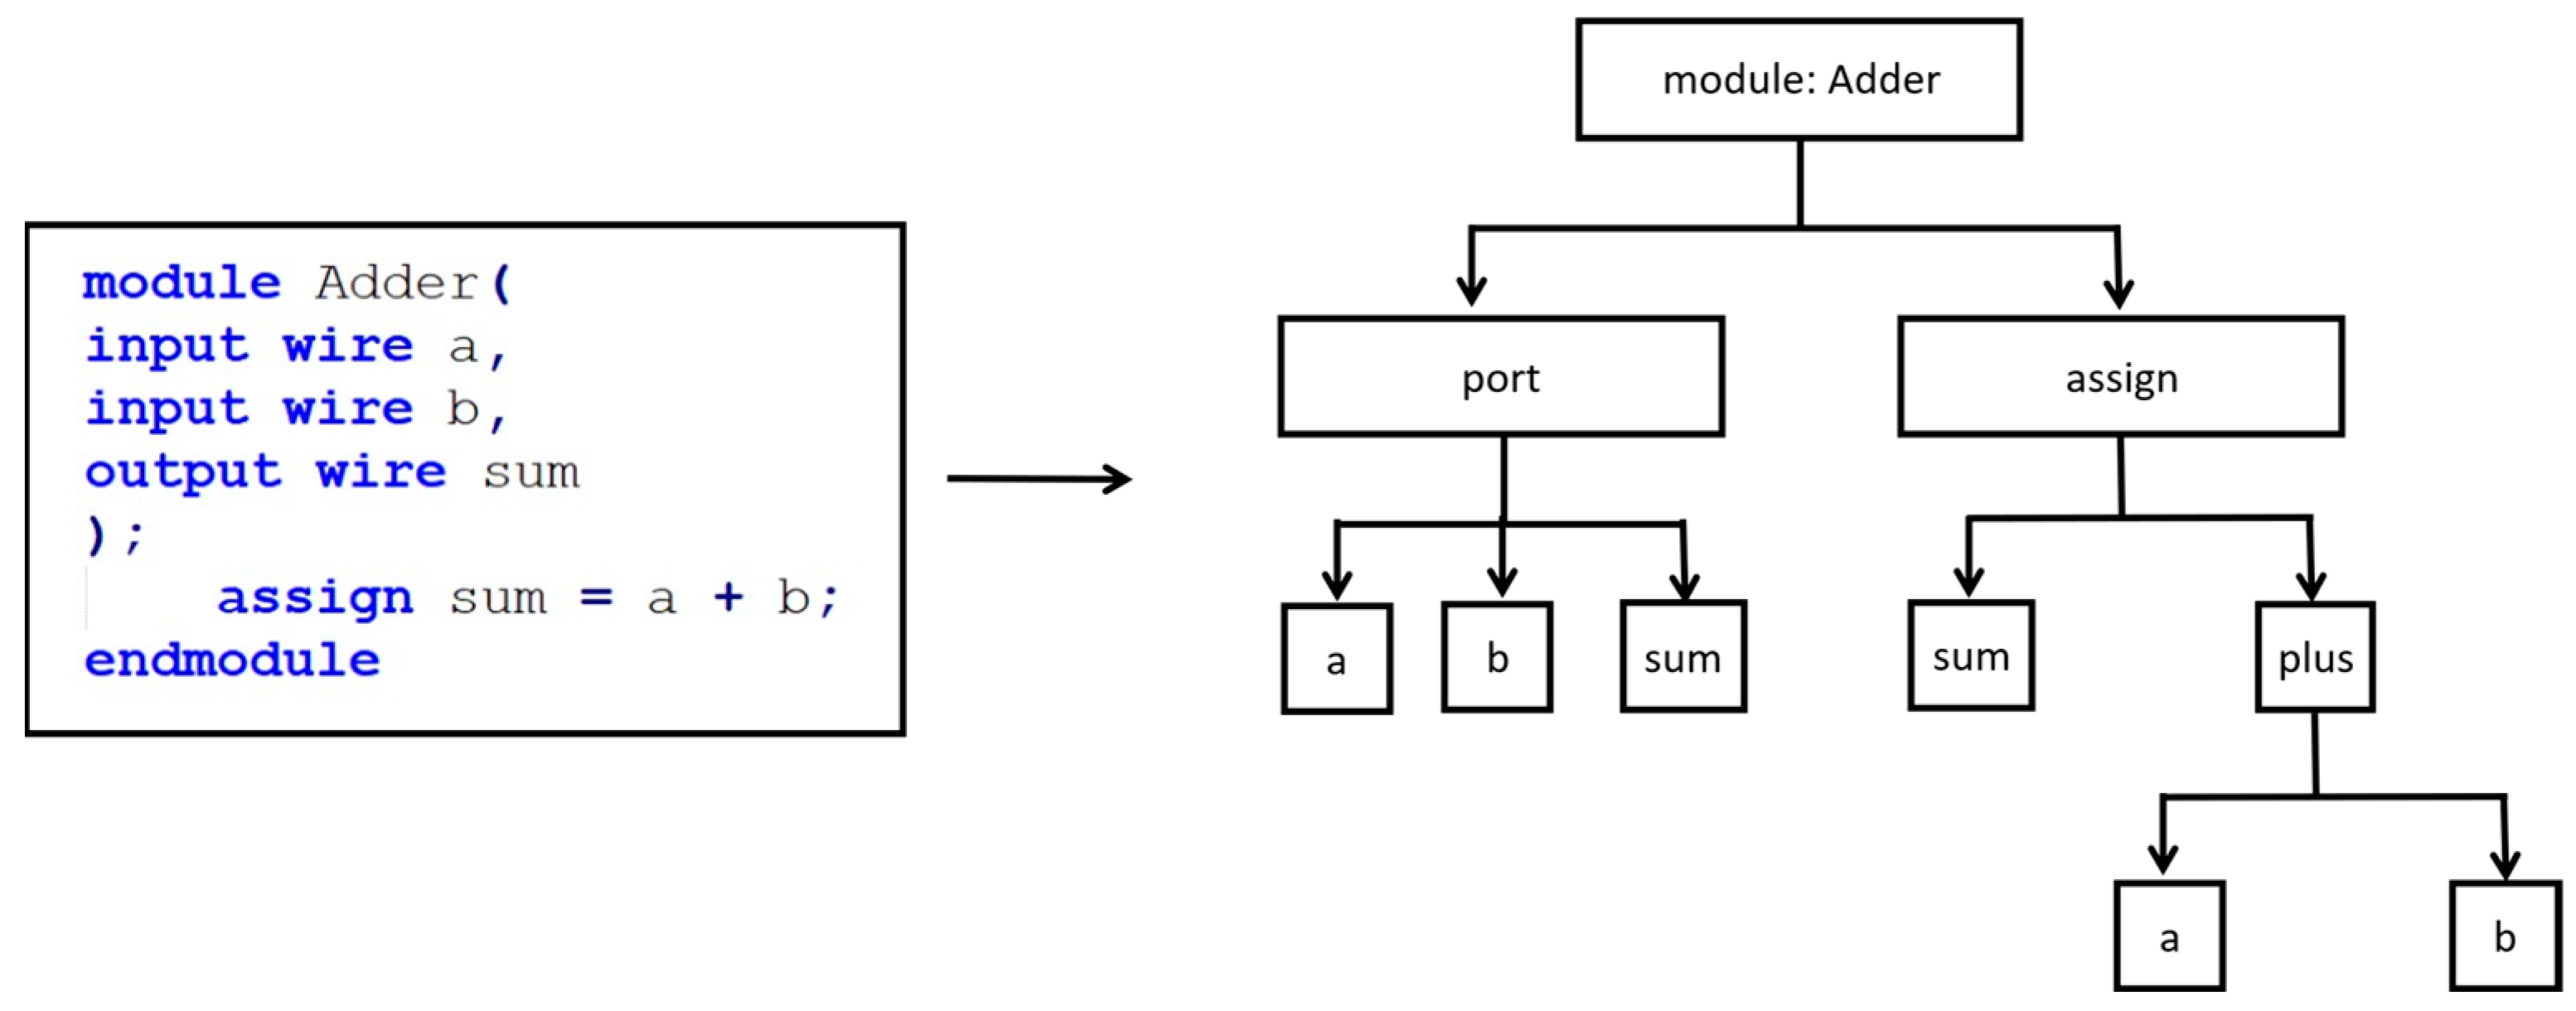
We first extract the AST from the RTL codes. Since RTL codes are typically composed of modules in multiple files, flattening of the files is required. Any Verilog code can be parsed into an AST. Each node in the AST represents a syntactic structure or unit in the code. The nodes are connected through parent–child relationships, forming a tree structure where the root node represents the highest-level structure of the code, and the leaf nodes represent the smallest syntactic units. The role of the AST is to aid in understanding and analyzing the syntax structure of the code. It provides a hierarchical representation of the code, making the syntax hierarchy and logical relationships clearer and more visible. Figure 2 provides an example of a combinational logic circuit, where the left side shows a simple Verilog code and the right side shows the corresponding AST.
In this example, it can be observed that the root node of the AST is “module”, representing a module declaration. The module is named “Adder”. The module node has a subnode “port”, representing the declaration of module ports. The identifiers “a”, “b”, and “sum” are the input and output port identifiers. The module node also has a subnode “assign”, representing an assignment statement. The assignment statement adds “a” and “b” together and assigns the result to “sum”. In this example, the structure and semantic information of the Verilog code can be seen. Each node represents a part of the code, such as a module declaration, a port declaration, and an assignment statement. The hierarchical relationships between nodes reflect the nested structure of the code.
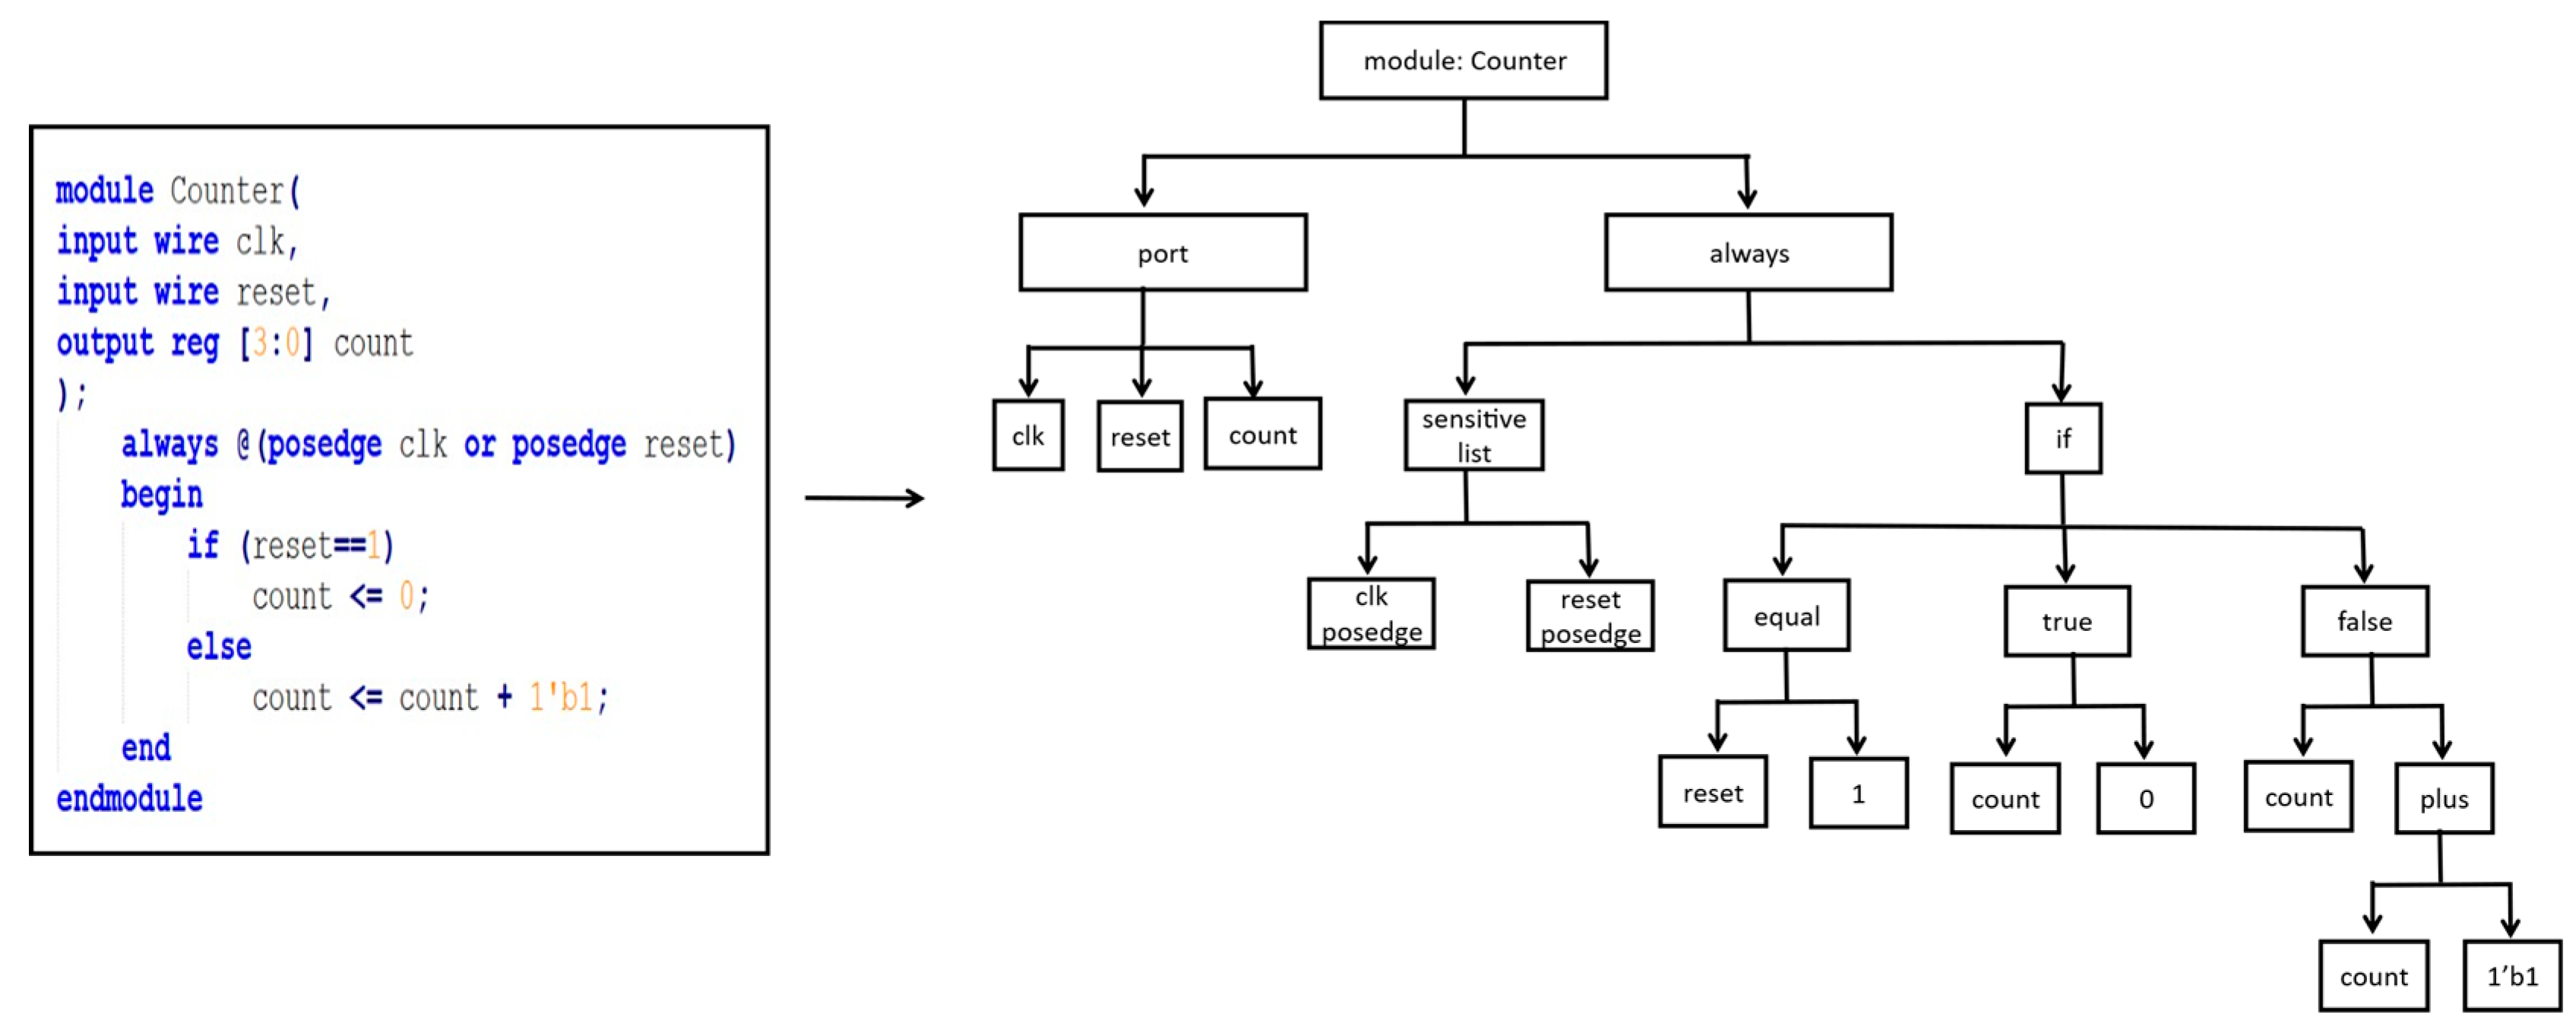
Similarly, Figure 3 illustrates an example of a sequential logic circuit. The left side shows the Verilog code of a sequential circuit, and the right side shows the corresponding AST.
In this example of a sequential logic circuit, it can be observed that each node represents different parts of the code, such as module declaration, port declaration, always block, if statement, etc. The connections between nodes represent their hierarchical and dependency relationships. The root node is the “module”, representing the declaration of the entire module. The module contains a subnode “port”, representing the declaration of module ports. The module node has a subnode “always”, representing the block that is always executed. The “always” node has a subnode “sensitive list”, which includes “clk” and “reset” signals. The “always” node also has a subnode “if”, representing the conditional statement. The node “if” first contains a node “equal”, which is used to check if “reset” is equal to 1. Then, there are two branches: one branch is executed when the condition is true, and the other branch is executed when the condition is false. In the true condition, “count” is assigned as 0. In the false condition, “count” is assigned as “count + 1′b1”.
With the constructed AST, each node and connection correspond to different parts and semantic relationships of the code, providing a more intuitive understanding of the hierarchical structure and syntactic relationships in the code.

3.2.2. DFG Generation

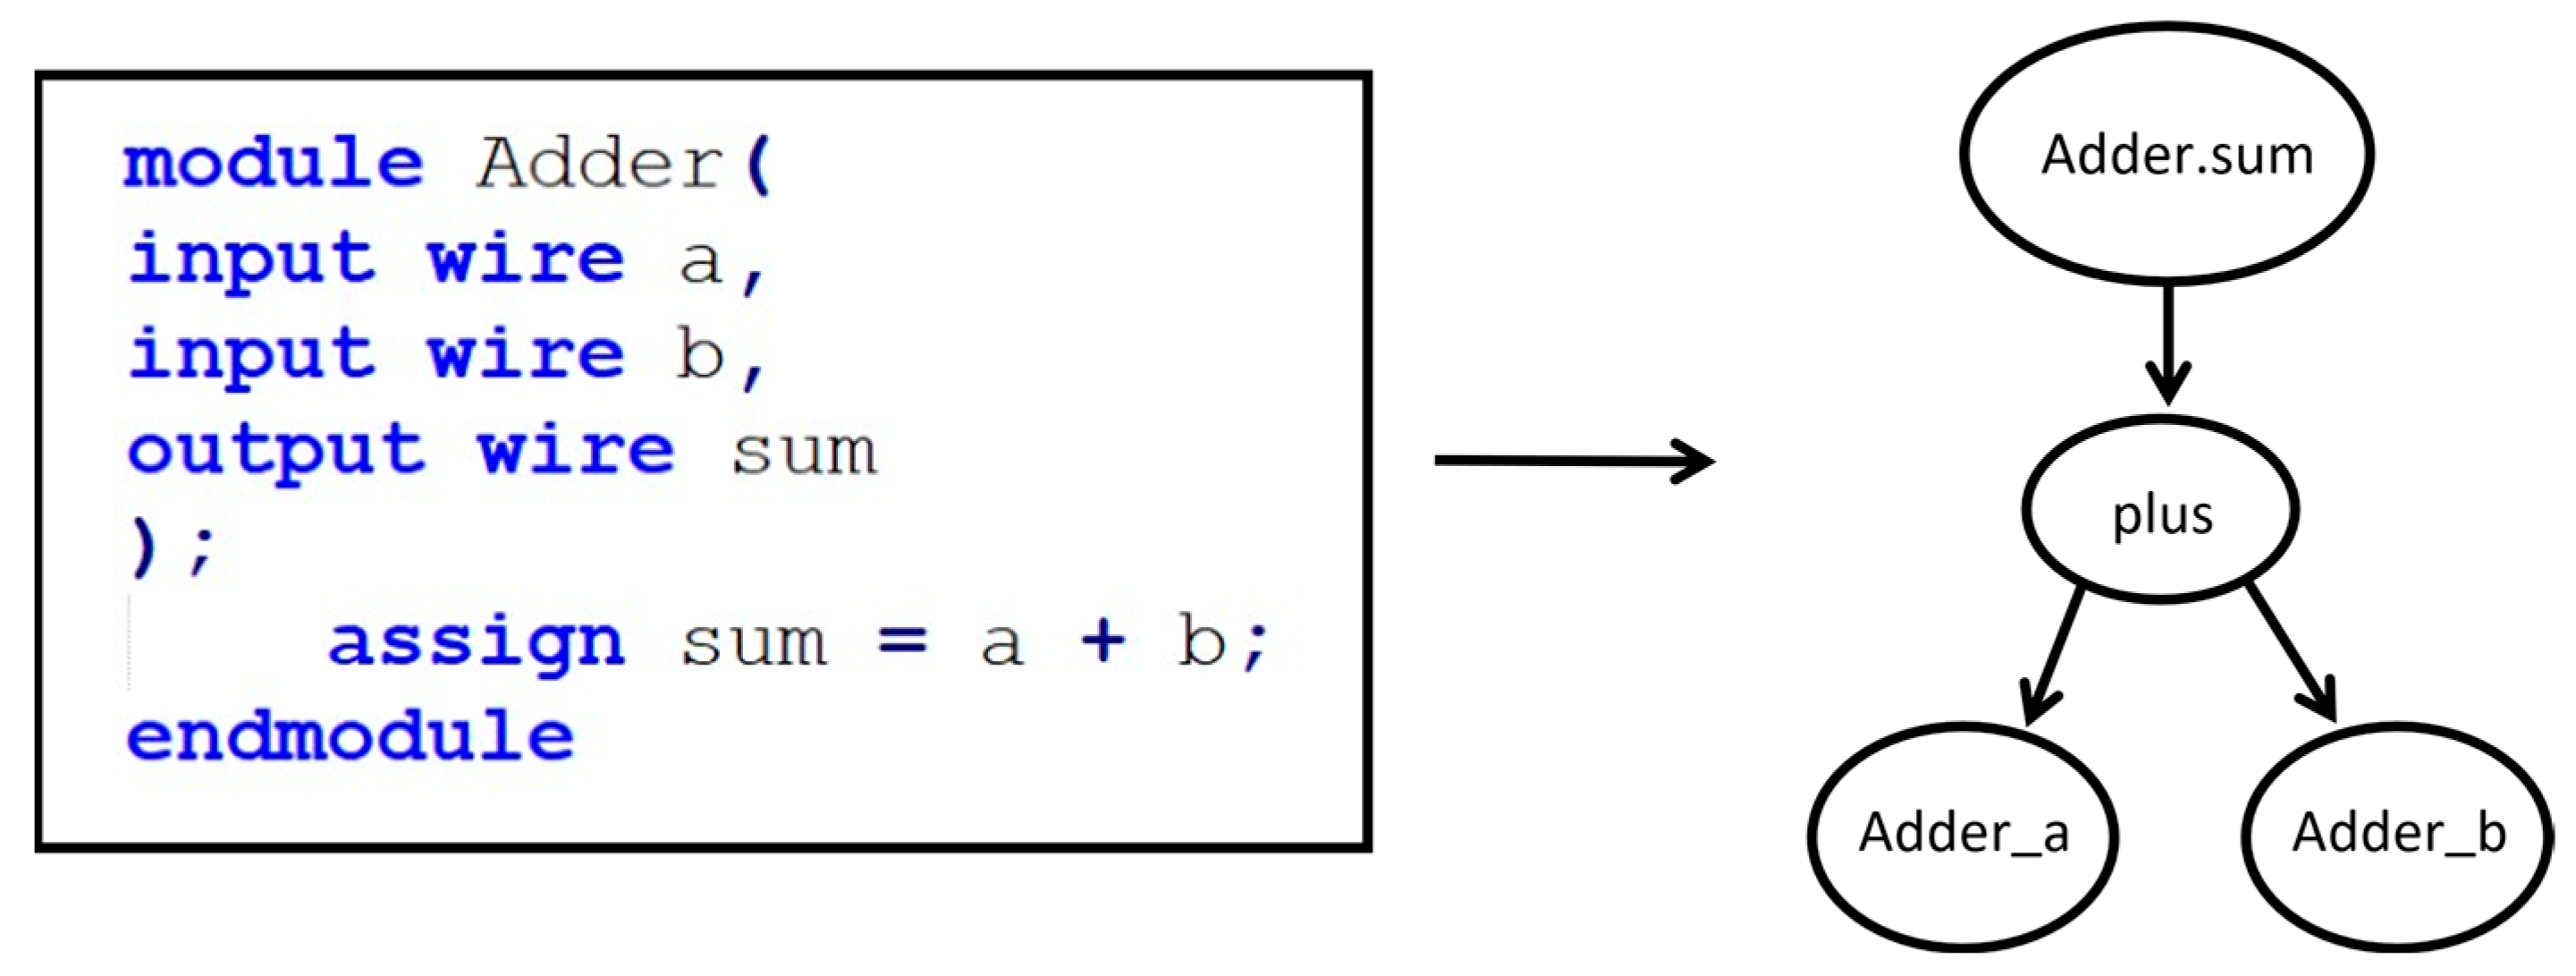
We extract the DFG from the RTL codes. Since RTL codes are typically composed of modules in multiple files, flattening of the files is required. The basic structure of the DFG consists of nodes and edges, where nodes represent operations, constants, and signals (including variables, inputs, and outputs) in the code, and edges represent the flow and dependency relationships of data. For complex RTL designs, multiple DFGs may be generated from different modules or signals. To obtain a single graph representation of the entire circuit, we combine all individual signal DFGs. During the merge phase, disconnected subgraphs and redundant nodes are trimmed. The role of the DFG is to aid in the analysis of data flow and dependencies in the code. Taking the two circuits mentioned earlier as examples, Figure 4 shows the Verilog code and its corresponding DFG for a combinational logic circuit.
In this DFG, nodes represent variables or operations in the code, and arrows represent the direction of data flow. The value of the output port “sum” depends on the values of the input ports “a” and “b”. The DFG illustrates the data flow and dependency relationships in the code.
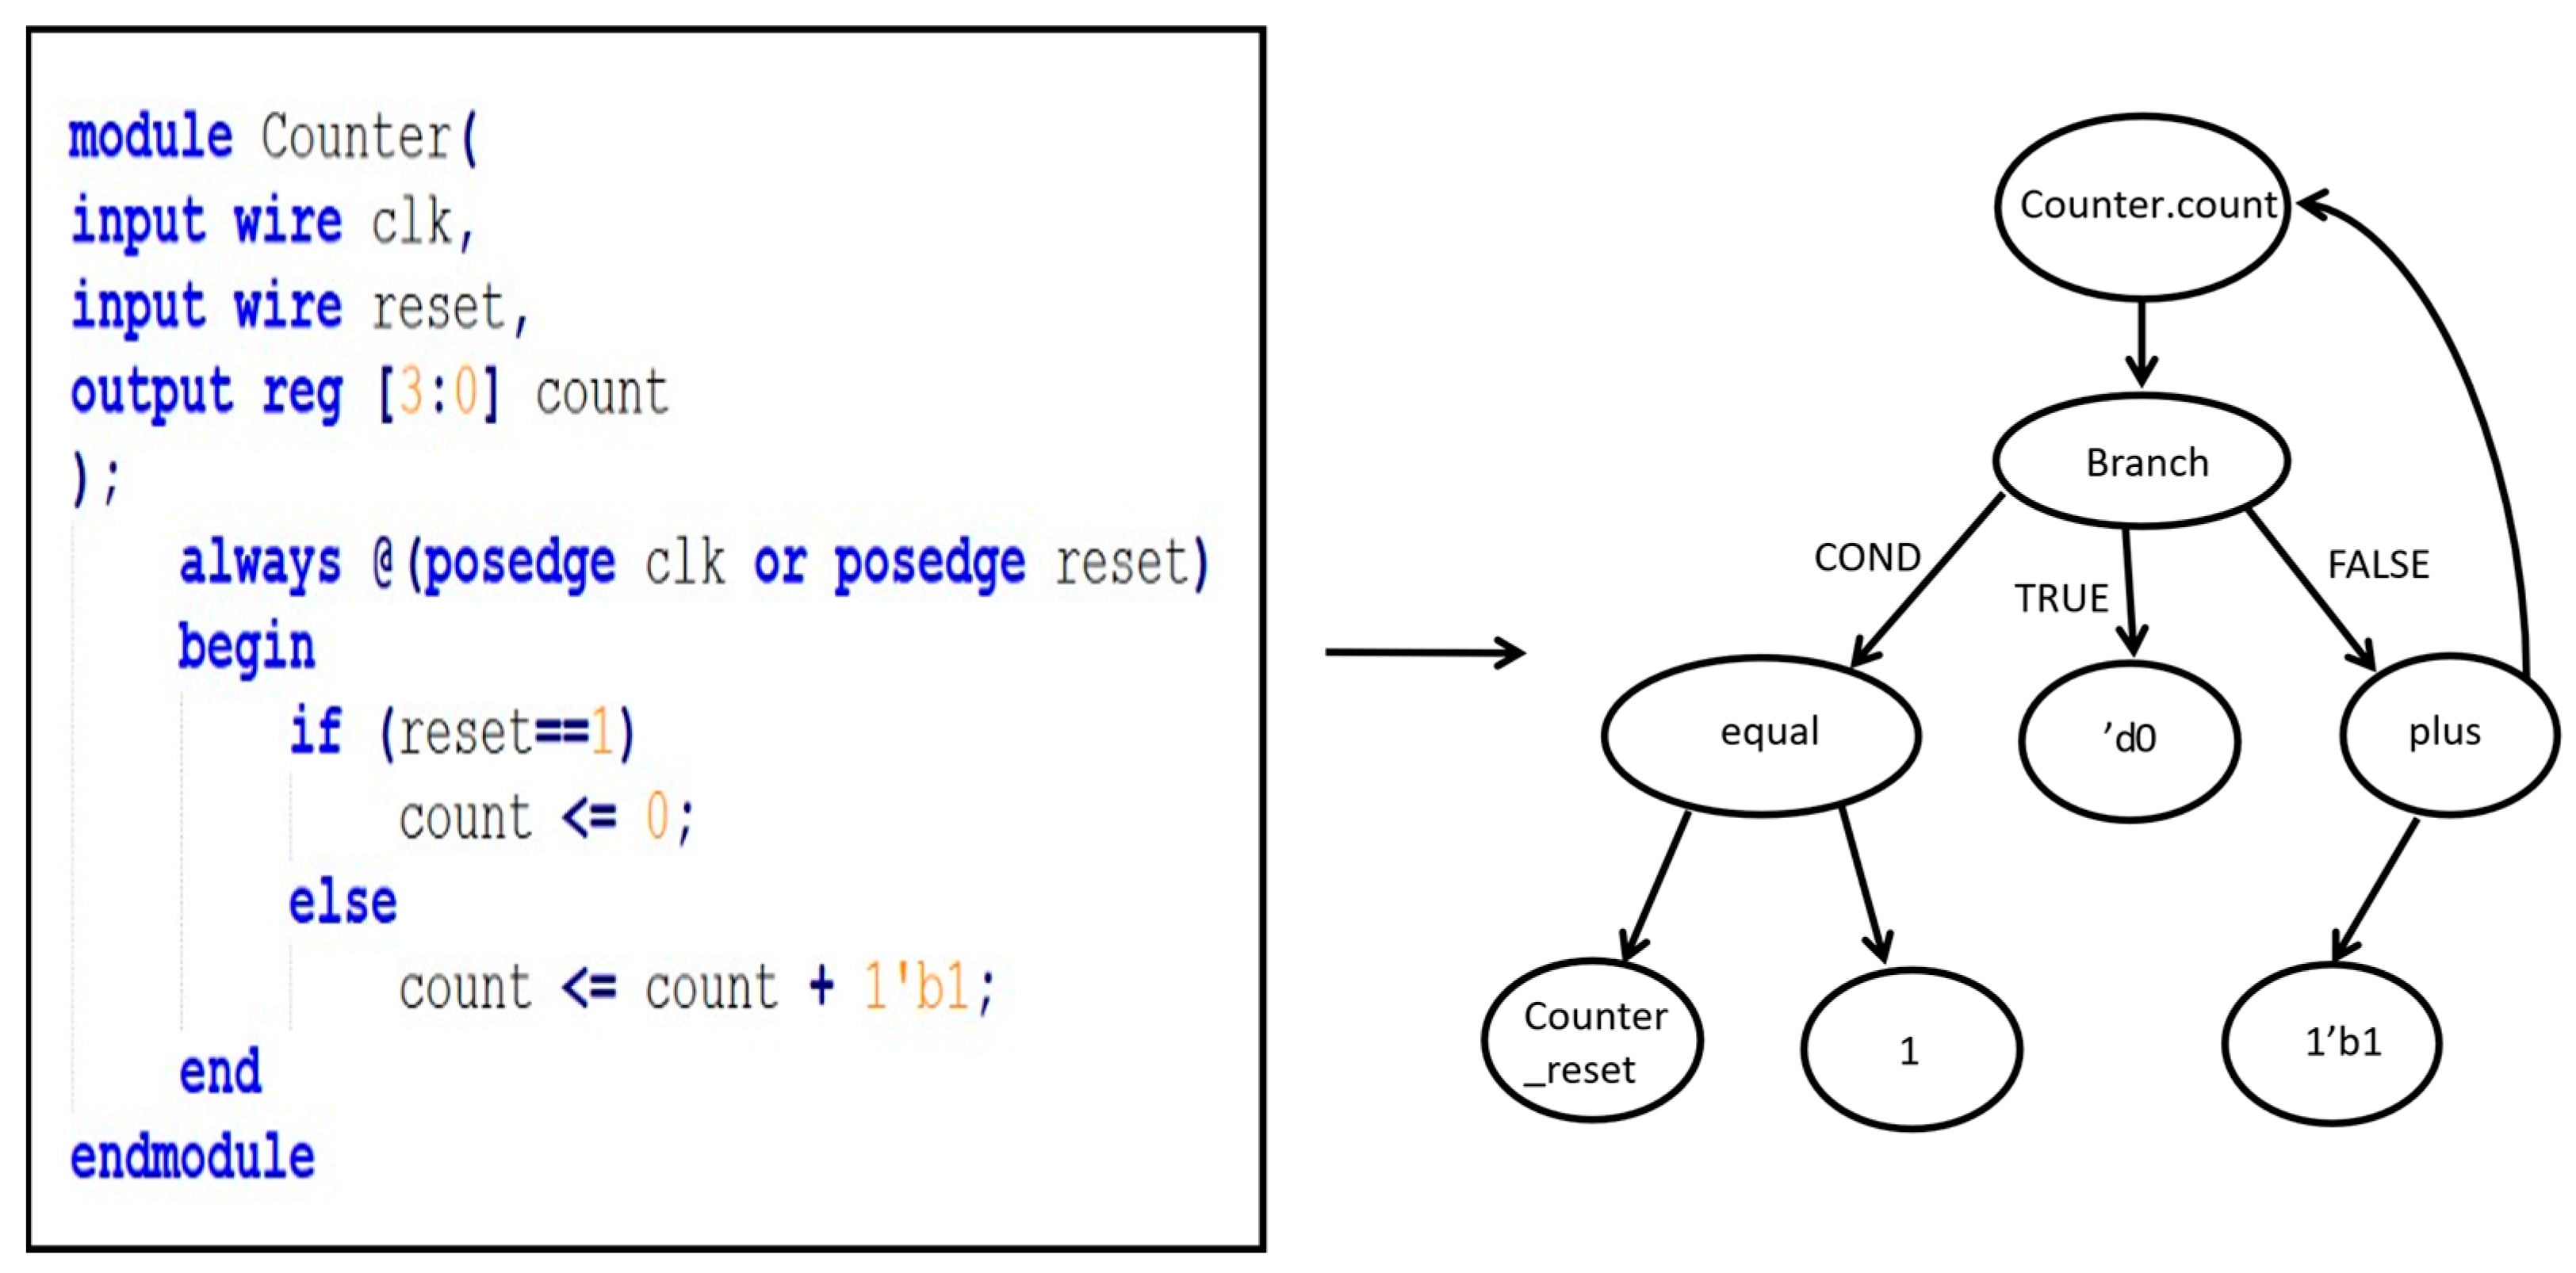
Figure 5 shows a sequential logic circuit and its DFG. It can be observed that each node in the graph represents variables or operations in the code, and the arrows represent the direction of data flow. The graph illustrates the paths of data flow for the output signal “count” and the dependency relationships between variables.

3.3. Graph Feature Extraction

In Section 3.2, we model RTL code as a non-Euclidean data structure and perform feature extraction through graph learning techniques. Given that the AST and DFG representations exhibit distinct structural characteristics, we adopt different GNN architectures tailored to each view. The AST captures the syntactic structure of the code, where connections between nodes are explicitly defined by grammar rules and exhibit strong hierarchical and deterministic properties. These fixed structures benefit from adaptive attention mechanisms that can differentiate the relative importance of connected nodes. Therefore, we employ the GAT to process ASTs, as it allows the model to dynamically assign attention weights to neighboring nodes and better capture the nuanced syntactic dependencies embedded in the code hierarchy. In contrast, the DFG reflects the dynamic data dependencies and signal propagation paths within the circuit. Unlike ASTs, the connections in DFGs are not strictly governed by syntax but are instead determined by runtime data relationships, which can be sparse and irregular. To effectively capture such local structural patterns, we apply the GCN, which aggregates feature information from immediate neighbors and is well-suited for modeling flow-based interactions and dependency structures. By leveraging GAT for ASTs and GCN for DFGs, our framework ensures that each graph representation is processed with an architecture that aligns with its underlying semantics and connectivity patterns, leading to more expressive and discriminative feature representations.

3.3.1. GAT-Based Feature Extraction for AST

We first generate initial node feature vectors by one-hot encoding the node types, which convey the basic information of each node. Simultaneously, an adjacency matrix is constructed based on the hierarchical and connectivity relationships in the AST to represent the topological structure among nodes. The GAT, a type of GNN, leverages these initial features and the adjacency matrix to perform attention-guided information aggregation. Specifically, GAT calculates attention scores between nodes to quantify the importance of their relationships. These attention scores are then used as weights to guide the aggregation process, allowing each node to adaptively incorporate information from its neighbors based on both its own features and the relative importance of its neighbors.
Assuming a graph has N nodes, the F -dimensional feature set of the nodes can be represented as h = { h 1 , h 2 , , h N } , h i R F . After calculation by the GAT layer, a new set of node features is output as h = { h 1 , h 2 , , h N }, h i R F , where the number of nodes N remains unchanged, and the number of features for each node changes to F . Then, after passing through the pooling layer and readout layer, the graph representation h g is output.
Step 1: calculates the attention coefficient between node i and its neighboring node j according to (1).
α i j = e x p ( L e a k y R e L U ( a ( [ W h i | W h j ) ) ) k N i e x p ( L e a k y R e L U ( a ( [ W h i | W h k ) ) )
where α i j represents the attention coefficient from node j to node i , N i represents the neighboring nodes of node i . a ( · ) is a single-layer feedforward neural network represented by a weight vector: a R 2 F , which maps the concatenated high-dimensional features with a length of 2 F to a real number as the attention coefficient. W is the weight parameter for node feature transformation. | | denotes concatenation operation. Finally, the process concludes with the utilization of softmax for normalization purposes, while also incorporating LeakyReLU to introduce nonlinearity.
Step 2: obtain the output characteristics of the node according to (2).
h i = σ ( j N i α i j W h j )
where h i represents the output of new node features. σ ( · ) is a nonlinear activation function.
To further enhance the expression ability of the attention layer, we have added the multi-head attention mechanism. We called K-independent attention mechanisms for (2) and then concatenated the output results together. As shown in (3).
h i = | | k = 1 K σ ( j N i α i j k W k h j )
where h i represents the output of new node features. α i j k is the weight coefficient calculated by the k-th attention mechanism. W k is the learning parameter corresponding to the k-th group of attention mechanisms. The operator | | k = 1 K denotes the concatenation of outputs from K independent attention heads.
Step 3, further processing is achieved through the graph pooling layer of the attention mechanism. Firstly, calculate the node importance score Z based on (4).
Z = σ ( G N N ( X , A ) )
where X represents the node feature matrix, and A represents the adjacency matrix. G N N ( · ) represents its passing through the GNN layer (see Section 3.3.2)) for GCN layer details). σ ( · ) is a nonlinear activation function.
Secondly, based on the importance score, the top-k nodes are selected as the pooling result to obtain the final reserved nodes. As shown in (5).
i d x = t o p r a n k ( Z , [ k N ] ) , Z m a s k = Z i d x
where k represents the pooling ratio, which determines the number of nodes to be retained. N is the total number of nodes. t o p r a n k ( · ) is a function that returns the index of the t o p [ k N ] nodes. i d x denotes index operation.
Finally, based on i d x , the pooled node feature matrix X o u t and adjacency matrix A o u t are obtained. As shown in (6).
X = X i d x ,   X o u t = X Z m a s k ,   A o u t = A i d x , i d x
where X i d x is a feature matrix indexed by rows. X o u t is the new feature matrix. A o u t is a new adjacency matrix. A i d x , i d x is an adjacency matrix indexed by row and column.
Step 4: embed the aggregated node features into a graph-level representation by applying the readout function. The readout function we use is defined as follows: The readout function we use is shown in (7).
h g = 1 | N | i N h i
where h g is the graphical representation. h i is the feature vector of node i .

3.3.2. GCN-Based Feature Extraction for DFG

We first perform one-hot encoding on the node types to generate initial feature vectors, which convey the basic information of each node. Simultaneously, we construct an adjacency matrix based on the DFG to represent the topological structure among nodes. Using these initial features and the adjacency matrix, the GCN model aggregates information from neighboring nodes to update each node’s representation. The resulting node-level features are then passed through pooling and readout operations to produce a fixed-size graph-level representation that captures the logical dependencies within the DFG.
Assuming a graph has N nodes, each with its features, the features of these nodes can form an N × D dimensional matrix X , and the relationships between the nodes will also form an N × N dimensional adjacency matrix A .
Step 1: message dissemination. The propagation mode between layers of GCN follows the rule of (8).
H ( l + 1 ) = σ ( D ~ 1 / 2 A ~ D ~ 1 / 2 H ( l ) W ( l ) )
where H ( l ) is the feature matrix of the l-th layer, and for the input layer, H is X , A ~ = A + I , I is the identity matrix. D ~ is the degree matrix of A ~ and is represented by the equation D i i = j A i j . σ ( · ) is a nonlinear activation function. W ( l ) is the trainable weight matrix of the l-th layer.
Step 2: further processing is achieved through the graph pooling layer of the attention mechanism, as described in step 3 of Section 3.3.1.
Step 3: when the input graph has been processed through all GCN layers, the message is passed between all nodes, and the node features are updated. We embed and aggregate nodes into graph-level representations by applying the readout function, as described in step 4 of Section 3.3.1.

3.4. Feature Fusion

The AST and DFG capture different aspects of RTL codes, including syntactic structure and logical dependencies, respectively. The features extracted from them are complementary in representing RTL code. We fuse the separately extracted features based on the multi-head attention mechanism. The multi-head attention mechanism for feature fusion has distinct advantages. It can capture different feature dependency relationships simultaneously through multiple independent attention heads, integrating information from multiple feature subspaces to provide a more comprehensive and diverse feature representation. Furthermore, the multi-head attention mechanism enhances the robustness and noise resistance of the model. Through the interaction and fusion of multiple heads, it dynamically adjusts the importance and correlation of features, providing a more flexible feature expression. Therefore, the feature fusion method based on the multi-head attention mechanism is comprehensive, efficient, robust, and flexible. We perform feature fusion on the extracted features based on the multi-head attention mechanism. The specific computation process is as follows.
Firstly, the calculation of attention is shown in (9).
a t t e n t i o n ( Q , K , V ) = s o f t m a x ( Q · K T d k ) · V
where Q is the query matrix, K is the key matrix, and V is the value matrix. s o f t m a x ( · ) obtains attention weights by normalizing attention scores. d k is the dimension of the query and key vector. The dimensions of Q , K , and V are [batch_size, num_nodes, head_dim], and after concatenation across all heads, the output dimension becomes [batch_size, num_nodes, hidden_size].
Based on (9), the calculation of multi-attention can be obtained. As shown in (10) and (11).
m u l t i _ a t t e n t i o n ( Q , K , V ) = W o · c o n c a t e ( U 1 , , U h )
U i = a t t e n t i o n ( W Q ( i ) Q , W K ( i ) K , W V ( i ) V ) , i = 1 , , h
where h is the number of heads. U i is the attention calculation result of the i t h head. c o n c a t e ( · ) is the concatenation of matrix column vectors. W o is a linear transformation matrix. W Q ( i ) , W K ( i ) , W V ( i ) are the linear transformation matrices of the query matrix, key matrix, and value matrix for the i-th header, respectively, and a t t e n t i o n ( · ) is the attention function as shown in (9).

3.5. Prediction Results

Finally, we obtain the final prediction result y p r e d through the MLP layer and the softmax function. As shown in (12).
y p r e d = s o f t m a x ( M L P ( h f ) )
where h f represents the fused features. The MLP layer outputs a two-dimensional vector, representing the probabilities of two classifications. Additionally, the softmax function is used to normalize the predicted values and determine the class with the highest predicted value as the detection result.
During training, we calculate the loss value L between the predicted graph labels y p r e d and the true graph labels y t r u e using the cross-entropy loss function, as shown in (13).
L = y i y t r u e , y i ^ y p r e d y i l o g e ( y i ^ )
The cross-entropy function is a commonly used loss function that measures the difference between the model’s predicted results and the true labels. By minimizing the value of the cross-entropy loss, the model’s parameters can be adjusted to make the predicted results closer to the true labels.

4. Evaluation

In this section, we introduce the dataset and experimental settings used in our study, present the experimental results, and compare them with other works.

4.1. Dataset Creation

To comprehensively evaluate the proposed model, we constructed a dataset based on the Trust-Hub benchmark, which is widely used in the field of HT detection. We selected RTL circuits from multiple benchmark categories, including AES, RS232, and PIC. Specifically, the AES benchmark contains 28 circuits, including 1 HT-free and 27 HT-infected circuits. The RS232 benchmark contains 15 circuits, including 1 HT-free and 14 HT-infected circuits. The PIC benchmark contains 5 circuits, including 1 HT-free and 4 HT-infected circuits. In total, these benchmarks provide 45 HT-infected circuits and 3 HT-free circuits. The codes of the circuits are written in Verilog and contain different types of HTs. To further expand the dataset, we added the DES benchmark, which contains 5 circuits, including 1 HT-free and 4 HT-infected circuits. Additionally, to balance the dataset, we added open-source circuits such as DET, RC6, SPI, SYN-SRAM, VGA, and XTEA, as well as open-source circuits from Opencores.org [25], such as I2C, Median Filter, and Communication Controller circuits. We also added some self-developed circuits including UART, DECODER, and TINY-SPI, to increase the number of HT-free circuit samples. In the end, we generated a total of 104 circuit instances, including 55 HT-free circuits and 49 HT circuits.

4.2. Experimental Setting

The proposed model consists of two views, namely the AST reflecting the code structures and the DFG reflecting the logical dependencies. For the AST, we employed four GAT layers with hidden layer sizes of 160, 240, 160, and 240, respectively. Each layer uses the ReLU activation function. To prevent overfitting, we incorporated dropout layers with a rate of 0.5 after every two layers. For the DFG, we utilized two GCN layers, each with 240 hidden units. The ReLU activation function was applied to each layer. To prevent overfitting, dropout layers with a rate of 0.5 were added after each layer. After feature extraction, each graph is processed via SAGPooling with a pooling ratio of 0.8 and a readout operation to produce a fixed-size graph-level representation of dimension [batch_size, 240]. Multi-head attention with 8 heads is then applied to fuse these features, with each head having a dimension of head_dim = 30. The concatenated output remains a fixed-size vector [batch_size, 240], which is subsequently fed into a single MLP layer followed by a softmax function to produce the final prediction. Our model was implemented in PyTorch 2.0.1, trained for 150 epochs using the Adam optimizer with a learning rate of 0.00001.

4.3. Experimental Results and Analysis

To verify the detection effectiveness of our model for unknown HTs in different circuits, we conducted evaluations using the leave-one-out method. In each iteration, one base circuit was left out for testing, and the model was trained on the remaining circuits. In this experiment, the HT is unknown to the detection model, which means that the model has not seen any circuits with the HT or golden HT-free circuits of the tested circuit during training. For example, when validating the AES benchmark circuit, no AES-related circuits were used for training. To evaluate the model’s performance, we conducted evaluations using four distinct metrics: Accuracy (A), Precision (P), Recall (R), and F1-score. The formulas for these metrics are as follows.
A = T P + T N T P + T N + F N + F P
P = T P T P + F P
R = T P T P + F N
F 1 = 2 × P × R P + R
where TP represents True Positive, TN represents True Negative, FN represents False Negative, and FP represents False Positive. Accuracy measures the overall prediction accuracy of the model, calculated as the ratio of correctly classified samples to the total number of samples. Precision represents the proportion of true positive samples among the samples predicted as positive by the model. Recall measures the proportion of correctly predicted positive samples to the total number of true positive samples. The F1-score, which combines precision and recall, is a comprehensive performance metric used to assess the balance between the accuracy and recall of the model. In our evaluation, the F1-score is given greater importance.
We left out one HT benchmark and trained the model on the remaining benchmarks. After training the model, we tested it on the benchmark circuit that was left out. This approach also allows us to evaluate the model’s ability to identify unknown HTs. The results are shown in Table 1.
As shown in Table 1, after training on all other circuits except for the AES benchmark, we evaluated the model on the AES circuit and achieved an accuracy of 85.71%, a precision of 100%, a recall of 85.19%, and an F1-score of 92.00%. We then performed a leave-one-out evaluation on the remaining benchmarks, including RS232, PIC, and DES circuits. Across all benchmark circuits, the model demonstrated strong and consistent performance, with an average accuracy of 94.76%, precision of 100%, recall of 94.51%, and F1-score of 97.08%.
Overall, these results confirm that the proposed method generalizes well across different types of circuits, maintaining a balance between high detection completeness (recall) and zero false alarm rate (precision). The leave-one-out evaluation also demonstrates that the model can effectively transfer knowledge learned from other circuits to unseen circuits, which is critical for practical HT detection scenarios.
Additionally, Table 2 reports the Train time and Test time. The experiments were conducted on hardware with NVIDIA GeForce RTX 3090, Intel (R) Core (TM) i9-11900 CPU@2.50 GHz, and 16 GB of RAM. After a prolonged training period, detection can be completed in a relatively short amount of time.
The results show that the training time for AES is 670.19 s, while for PIC it reaches 1031.28 s, with an average training time of 886.04 s. In contrast, the testing time remains consistently low across all benchmarks, ranging from 3.91 s to 4.98 s, with an average of 4.57 s. These results indicate that, although model training is computationally intensive, the framework is highly efficient during inference, enabling rapid detection of HTs in RTL designs. The total number of trainable parameters in our model is 440,086. The graphs used in our experiments exhibit a wide range of scales, with AST nodes ranging from 64 to 9345 and DFG nodes ranging from 5 to 7953. The corresponding peak memory usage spans from 0.45 MB for the smallest graphs to 67.80 MB for the largest. These observations demonstrate that our model can efficiently handle circuits of varying complexity, from very small designs to large and intricate RTL implementations, while maintaining reasonable memory requirements.

4.4. Comparison with State of the Art

We compared our work with other studies. Table 3 shows the comparison between our method and state-of-the-art methods, including traditional pre-silicon detection methods [4,7].
On our constructed benchmark dataset, experimental results demonstrate that the proposed method achieves excellent performance, with an average F1-score of 97.08%. To compare with existing studies, Table 3 presents the performance metrics of our GNN-MFF model alongside several state-of-the-art methods. It should be noted that due to significant differences in datasets, circuit scales, and preprocessing pipelines adopted by each method, this comparison is intended for general reference rather than a strict one-to-one benchmark evaluation. Nevertheless, our method attains good performance on the benchmark we constructed, demonstrating its effectiveness.
We evaluate our model using the four metrics mentioned earlier. Among these, the F1-score provides a comprehensive measure of model performance, and therefore, we focus on reporting the F1-scores. Compared to [12,13,15,16,20,22,24], our proposed method achieves a higher F1-score for HT detection on our dataset. Compared to traditional pre-silicon detection methods, our detection performance is not as good as the socio-network method [4], but our model does not rely on golden chips. In addition, the benchmarks we used are completely different from theirs. The socio-network method only evaluated its HT detection model on smaller benchmark circuits. There is no discussion about the scalability of their model on larger circuits, and it only applies to the detection of combinational HTs, limiting its applicability. On the other hand, the information flow analysis method [7] can only detect information leakage HTs, lacks scalability, and has a high time and resource overhead.

4.5. Ablation Study

To evaluate the effectiveness of the individual components in our method, we employed several comparative strategies: utilizing features extracted only from the AST or DFG; concatenating AST and DFG features without employing multi-head attention mechanisms; extracting features from AST and DFG using GAT; extracting features using GCN; and comparing them with our method to evaluate the representation capabilities of each method. We continued to conduct ablation experiments using the dataset constructed in Section 4.1. The experimental results are shown in Table 4.
When using only the AST view, the model achieves an accuracy of 83.63% and an F1-score of 90.00%, indicating that syntactic structures alone can capture a portion of the HT patterns but are insufficient for complete detection. Using only the DFG view, the performance drops further (accuracy 73.63%, F1-score 82.63%), suggesting that logical dependencies alone are less informative than syntactic structures for HT identification.
Combining AST and DFG features through simple feature concatenation improves performance (accuracy 88.63%, F1-score 93.08%), demonstrating that integrating multiple views provides complementary information. When employing graph-based models on both AST and DFG, the AST + DFG only GAT and AST + DFG only GCN variants achieve further improvements, with F1-scores of 95.63% and 94.22%, respectively, highlighting the benefit of GNN architectures in capturing complex patterns.
Finally, the full GNN-MFF model, which incorporates multi-view feature fusion via a multi-head attention mechanism, achieves the highest performance (accuracy 94.76%, F1-score 97.08%). This confirms that multi-view graph feature fusion effectively leverages multidimensional information, and substantially enhances HT detection performance compared to single-view or naive combination strategies.

5. Conclusions

In this work, we proposed GNN-MFF, a novel GNN-based framework for detecting HTs at the RTL by leveraging multiple graph representations of circuit design. Specifically, we constructed both the AST and the DFG from RTL code to capture complementary aspects of circuit behavior—syntactic structure and logical dependencies, respectively. To adapt to the characteristics of each representation, we adopted GAT for ASTs, allowing the model to focus on key syntactic relationships, and GCN for DFGs to effectively aggregate data flow dependencies. The extracted features were then fused using a multi-head attention mechanism, enabling the model to learn a unified representation from heterogeneous structural information. The proposed approach is automated, scalable, and capable of detecting previously unseen HTs without relying on golden models or handcrafted features. We evaluated GNN-MFF on an extended dataset based on the Trust-Hub benchmark and achieved state-of-the-art performance, with an average F1-score of 97.08%, along with high precision and recall. These results demonstrate the effectiveness of our multi-graph modeling strategy and the ability of the fusion module to enhance detection robustness. Overall, GNN-MFF provides a practical and effective solution for RTL HT detection. In the future, we plan to explore more diverse and fine-grained structural representations of RTL code, and investigate how to effectively integrate these heterogeneous structures to further enhance the robustness and generalizability of HT detection models.

6. Future Work

The current experiments in this study are primarily based on circuit designs and benchmark datasets of relatively limited size and scale, which constrain the validation of the model’s performance on ultra-large-scale circuits and diverse scenarios. To address this challenge, we plan to extend future work along several directions: First, we will construct a larger and more diverse HT detection dataset, covering more complex circuit architectures and HT variants, to provide a stronger foundation for model training and evaluation. Second, to improve the model’s scalability, we will explore more efficient GNN architectures, feature fusion strategies, and distributed training techniques, significantly enhancing its ability to handle large-scale circuit graphs. Third, we intend to incorporate additional representative graph-structural information, such as control dependency graphs, and leverage multi-view deep fusion to further strengthen the model’s representation capability. Finally, we will investigate cross-circuit transfer learning techniques to improve the model’s generalization for unseen circuit types and HT variants, ultimately achieving broader applicability and stronger robustness.

Author Contributions

The authors confirm contribution to the paper as follows: Conceptualization, S.Z. (Senjie Zhang), S.Z. (Shan Zhou) and J.W.; Methodology, S.Z. (Senjie Zhang), S.Z. (Shan Zhou), P.X. and L.K.; Software, S.Z. (Senjie Zhang), P.X. and L.K.; Supervision, J.W.; Validation, S.Z. (Senjie Zhang), S.Z. (Shan Zhou) and P.X.; Writing—original draft, S.Z. (Senjie Zhang), P.X. and L.K.; Writing—review and editing, S.Z. (Shan Zhou) and J.W. All authors have read and agreed to the published version of the manuscript.

Funding

This work was supported by the Equipment Development Department under the Pre-Research Project, Project No. 61400020404.

Data Availability Statement

The data used to support the findings of this study are available and can be obtained by sending e-mail to the corresponding author.

Conflicts of Interest

The authors declare no conflicts of interest.

References

  1. Sullivan, D.; Biggers, J.; Zhu, G.; Zhang, S.; Jin, Y. FIGHT-metric: Functional identification of gate-level hardware trustworthiness. In Proceedings of the ACM/EDAC/IEEE Design Automation Conference (DAC), San Francisco, CA, USA, 2–5 June 2014; pp. 1–4. [Google Scholar]
  2. Hicks, M.; Finnicum, M.; King, S.T.; Martin, M.M.K.; Smith, J.M. Overcoming an Untrusted Computing Base: Detecting and Removing Malicious Hardware Automatically. In Proceedings of the IEEE Symposium on Security and Privacy, Oakland, CA, USA, 16–19 May 2010; pp. 159–172. [Google Scholar]
  3. Oya, M.; Shi, Y.; Yanagisawa, M.; Togawa, N. A score-based classification method for identifying Hardware-Trojans at gate-level netlists. In Proceedings of the Design, Automation & Test in Europe Conference & Exhibition (DATE), Grenoble, France, 9–13 March 2015; pp. 465–470. [Google Scholar]
  4. Islam, S.A.; Mime, F.I.; Asaduzzaman, S.M.; Islam, F. Socio-network Analysis of RTL Designs for Hardware Trojan Localization. In Proceedings of the International Conference on Computer and Information Technology (ICCIT), Dhaka, Bangladesh, 18–20 December 2019; pp. 1–6. [Google Scholar]
  5. He, J.; Guo, X.; Meade, T.; Dutta, R.G.; Zhao, Y.; Jin, Y. SoC interconnection protection through formal verification. Integration 2019, 64, 143–151. [Google Scholar] [CrossRef]
  6. Hu, W.; Ardeshiricham, A.; Gobulukoglu, M.S.; Wang, X.; Kastner, R. Property Specific Information Flow Analysis for Hardware Security Verification. In Proceedings of the IEEE/ACM International Conference on Computer-Aided Design (ICCAD), San Diego, CA, USA, 5–8 November 2018; pp. 1–8. [Google Scholar]
  7. Nahiyan, A.; Sadi, M.; Vittal, R.; Contreras, G.; Forte, D.; Tehranipoor, M. Hardware trojan detection through information flow security verification. In Proceedings of the IEEE International Test Conference (ITC), Fort Worth, TX, USA, 31 October–2 November 2017; pp. 1–10. [Google Scholar]
  8. Wang, J.; Li, Y. RDAMS: An Efficient Run-Time Approach for Memory Fault and Hardware Trojans Detection. Information 2021, 12, 169. [Google Scholar] [CrossRef]
  9. Zargari, A.H.A.; AshrafiAmiri, M.; Seo, M.; Pudukotai Dinakarrao, S.M.; Fouda, M.E.; Kurdahi, F. CAPTIVE: Constrained Adversarial Perturbations to Thwart IC Reverse Engineering. Information 2023, 14, 656. [Google Scholar] [CrossRef]
  10. Yang, J.; Zhang, Y.; Hua, Y.; Yao, J.; Mao, Z.; Chen, X. Hardware Trojans Detection Through RTL Features Extraction and Machine Learning. In Proceedings of the Asian Hardware Oriented Security and Trust Symposium (AsianHOST), Shanghai, China, 16–18 December 2021; pp. 1–4. [Google Scholar]
  11. Choo, H.S.; Ooi, C.-Y.; Inoue, M.; Ismail, N.; Moghbel, M.; Kok, C.H. Register-Transfer-Level Features for Machine-Learning-Based Hardware Trojan Detection. IEICE Trans. Fundam. Electron. Commun. Comput. Sci. 2020, E103.A, 502–509. [Google Scholar] [CrossRef]
  12. Sutikno, S.; Putra, S.D.; Wijitrisnanto, F.; Aminanto, M.E. Detecting Unknown Hardware Trojans in Register Transfer Level Leveraging Verilog Conditional Branching Features. IEEE Access 2023, 11, 46073–46083. [Google Scholar] [CrossRef]
  13. Meng, X.; Hassan, R.; Dinakrrao, S.M.P.; Basu, K. Can Overclocking Detect Hardware Trojans? In Proceedings of the IEEE International Symposium on Circuits and Systems (ISCAS), Daegu, Republic of Korea, 22–28 May 2021; pp. 1–5. [Google Scholar]
  14. Muralidhar, N.; Zubair, A.; Weidler, N.; Gerdes, R.; Ramakrishnan, N. Contrastive Graph Convolutional Networks for Hardware Trojan Detection in Third Party IP Cores. In Proceedings of the IEEE International Symposium on Hardware Oriented Security and Trust (HOST), Washington, DC, USA, 12–15 December 2021; pp. 181–191. [Google Scholar]
  15. Yasaei, R.; Yu, S.Y.; Faruque, M.A.A. GNN4TJ: Graph Neural Networks for Hardware Trojan Detection at Register Transfer Level. In Proceedings of the Design, Automation & Test in Europe Conference & Exhibition (DATE), Grenoble, France, 1–5 February 2021; pp. 1504–1509. [Google Scholar]
  16. Zhang, H.; Fan, Z.; Zhou, Y.; Li, Y. B-HTRecognizer: Bit-Wise Hardware Trojan Localization Using Graph Attention Networks. IEEE Trans. Comput.-Aided Des. Integr. Circuits Syst. 2024, 44, 2240–2252. [Google Scholar] [CrossRef]
  17. Trust-Hub.org. Available online: https://www.trust-hub.org/benchmarks (accessed on 19 September 2025).
  18. Yu, W.; Wang, Y. An efficient methodology for hardware Trojan detection based on canonical correlation analysis. Microelectron. J. 2021, 115, 105162. [Google Scholar] [CrossRef]
  19. Huang, Z.; Quan, W.; Chen, Y.; Jiang, X. A Survey on Machine Learning Against Hardware Trojan Attacks: Recent Advances and Challenges. IEEE Access 2020, 8, 10796–10826. [Google Scholar] [CrossRef]
  20. Zareen, F.; Karam, R. Detecting RTL Trojans using Artificial Immune Systems and High Level Behavior Classification. In Proceedings of the Asian Hardware Oriented Security and Trust Symposium (AsianHOST), Hong Kong, China, 17–18 December 2018; pp. 68–73. [Google Scholar]
  21. Han, T.; Wang, Y.; Liu, P. Hardware Trojans Detection at Register Transfer Level Based on Machine Learning. In Proceedings of the IEEE International Symposium on Circuits and Systems (ISCAS), Sapporo, Japan, 26–29 May 2019; pp. 1–5. [Google Scholar]
  22. Hassan, R.; Meng, X.; Basu, K.; Dinakarrao, S.M.P. Circuit Topology-Aware Vaccination-Based Hardware Trojan Detection. IEEE Trans. Comput.-Aided Des. Integr. Circuits Syst. 2023, 42, 2852–2862. [Google Scholar] [CrossRef]
  23. Utyamishev, D.; Partin-Vaisband, I. Knowledge Graph Embedding and Visualization for Pre-Silicon Detection of Hardware Trojans. In Proceedings of the 2022 IEEE International Symposium on Circuits and Systems (ISCAS), Austin, TX, USA, 27 May–1 June 2022; pp. 180–184. [Google Scholar] [CrossRef]
  24. Popryho, Y.; Pal, D.; Partin-Vaisband, I. NetVGE: Netwise Hardware Trojan Detection at RTL Using Variable Dependency and Knowledge Graph Embedding. IEEE Trans. Comput.-Aided Des. Integr. Circuits Syst. 2025. [Google Scholar] [CrossRef]
  25. Opencores. Available online: https://opencores.org/ (accessed on 19 September 2025).
Figure 1. The overall architecture of GNN-MFF.
Applsci 15 10324 g001
Figure 2. An example of a combinational logic circuit and its AST.
Applsci 15 10324 g002
Figure 3. An example of a sequential logic circuit and its AST.
Applsci 15 10324 g003
Figure 4. An example of a combinational logic circuit and its DFG.
Applsci 15 10324 g004
Figure 5. An example of a sequential logic circuit and its DFG.
Applsci 15 10324 g005
Table 1. The performance of GNN-MFF in HT detection.
Test CircuitA (%)P (%)R (%)F1-Score (%)
AES85.7110085.1992.00
RS23293.3310092.8696.30
PIC100100100100
DES100100100100
Average94.7610094.5197.08
Table 2. The train time and test time.
Test CircuitTrain Time (s)Test Time (s)
AES670.193.91
RS232871.164.44
PIC1031.284.98
DES971.524.94
Average886.044.57
Table 3. Comparing the performance of GNN-MFF with the state-of-the-art.
PaperA (%)P (%)R (%)F1-Score (%)
GNN-MFF94.7610094.5197.08
GNN4TJ [15]NA92.396.694
B-HTRecognizer [16]99.7084.1493.4186.71
Circuit-topology-aware [22]93.1593.3591.3891.28
NetVGE [24]NA939895.4
Conditional Branching [12]96.5710078.7988.13
Overclock [13]87.5889.338788
Artificial immune system [20]86.2385.5387.1986.32
Socio-network [4]97.398.297.998.0
Information flow analysis [7]NANA100NA
Table 4. The results of the ablation study.
MethodA (%)P (%)R (%)F1-Score (%)
AST only83.6397.7384.5390.00
DFG only73.6387.7380.9582.63
feature concatenation88.6310088.1093.08
AST + DFG only GAT92.2098.9692.7395.63
AST + DFG only GCN89.6496.9991.8094.22
GNN-MFF94.7610094.5197.08
Disclaimer/Publisher’s Note: The statements, opinions and data contained in all publications are solely those of the individual author(s) and contributor(s) and not of MDPI and/or the editor(s). MDPI and/or the editor(s) disclaim responsibility for any injury to people or property resulting from any ideas, methods, instructions or products referred to in the content.