1. Introduction
Blanking is one of the most economical processes within the manufacturing value chain. It is widely applied in large-scale production, particularly in the automotive and aerospace industries, due to its high material utilization, low energy consumption, and excellent dimensional consistency [
1,
2,
3]. In modern high-speed production environments where output rates exceed 100 parts per minute, tool wear can result in unplanned machine downtime or accelerated accumulation of non-conforming components. This poses significant financial risks to manufacturers [
2,
4].
In current industrial practice, monitoring is still often based on the experience of skilled machine operators and periodic random sampling, as these operators are usually responsible for supervising multiple production lines at the same time. To prevent such failures and ensure consistent product quality, real-time tool-condition monitoring has therefore become essential. Early studies proposed signal-based supervised methods, in which features were manually extracted from force [
5], accelerometers [
6], or acoustic emission sensors [
7] to monitor equipment conditions. These rule-based or threshold-driven approaches offered good interpretability and practical applicability and were sometimes supported by dimensionality-reduction techniques, such as Principal Component Analysis (PCA), to enhance feature processing [
8]. To this end, Jin et al. classified different process parameters based on force signals, which were transformed using PCA for dimensionality reduction [
9]. Unterberg et al. segmented AE signals based on domain knowledge and extracted statistical features for the indirect monitoring of punch wear. The wear state was estimated using ensemble learning and linear regression [
10].
However, methods based on feature engineering often struggle to adapt to variations in production, such as material fluctuations, changes in tool geometry, or environmental disturbances [
11]. With the advancement of deep learning, particularly the development of Convolutional Neural Networks (CNNs), research has gradually shifted toward automatic feature extraction through the hidden layers of deep neural networks, significantly improving model generalization and adaptability. When applied to production processes, these methods enable real-time state description, assessment, and prediction under high-speed production conditions [
12,
13,
14]. For instance, Huang et al. [
15] and Wang et al. [
16] achieved tool-wear detection by integrating vibration signals and image segmentation with neural networks. Molitor et al. [
17], on the other hand, employed pre-trained Convolutional Neural Networks (CNNs) to process workpiece images, demonstrating the potential of image-based approaches for tool-wear classification in blanking processes. In contrast, image data offers the advantage of directly monitoring the tool surface, allowing for a visual assessment of wear conditions. Time-series signals, such as force or acceleration, only provide indirect information about wear and require physical coupling and modeling for wear detection.
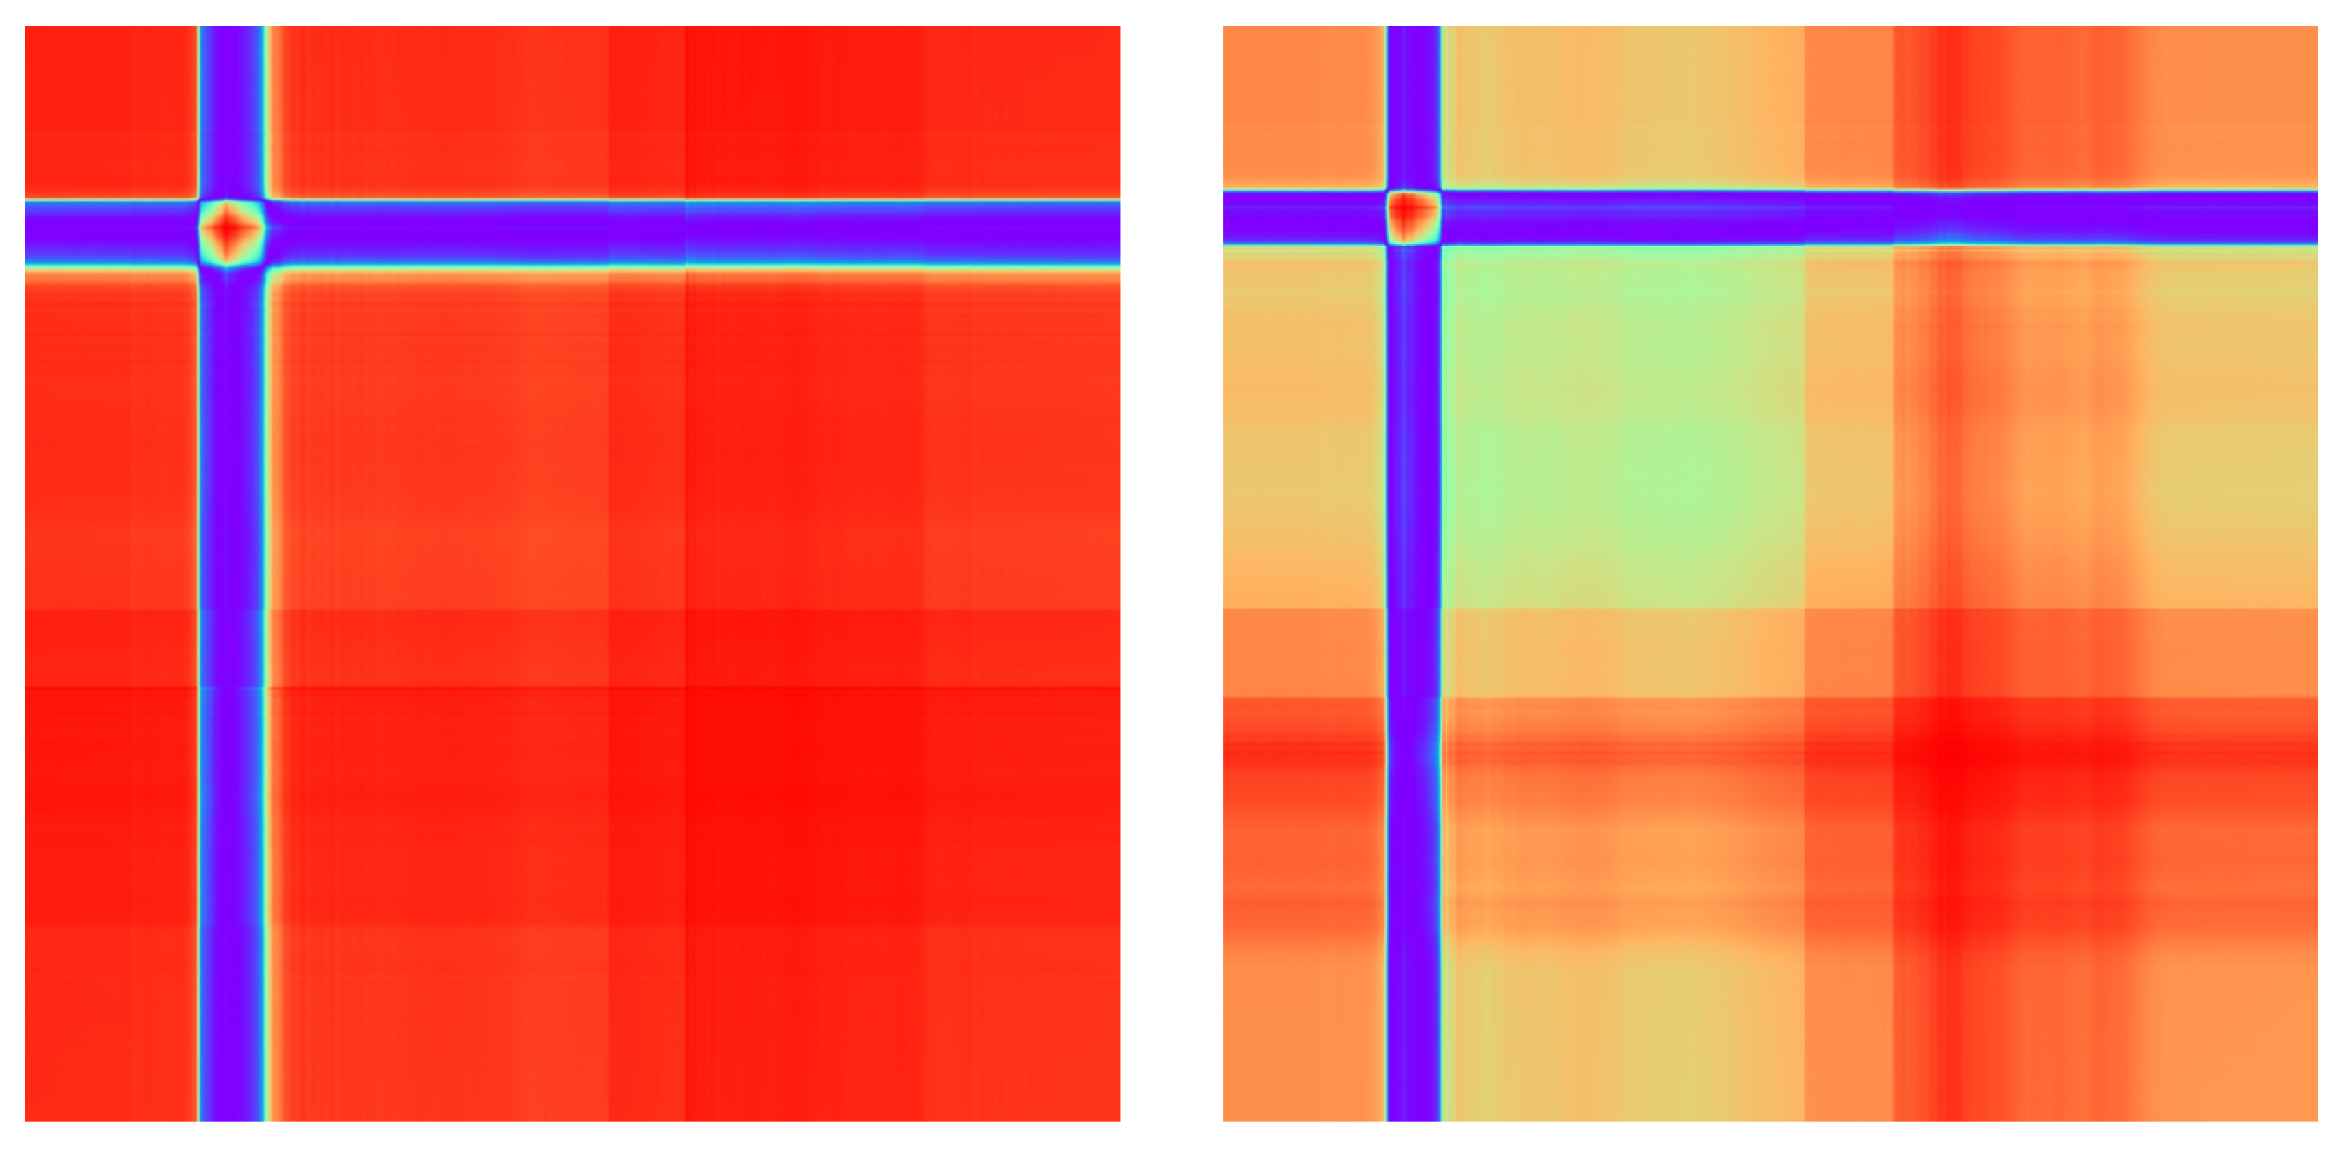
When time-series data is converted into two-dimensional data, such as Gramian Angular Field (GAF) [
18], the transformation can effectively extract temporal features and reveal hidden time-invariant patterns within the signal dynamics. Wang et al. [
19] and Zhou et al. [
20] successfully applied GAF-based feature extraction combined with machine learning to perform time-series-based condition monitoring in milling processes and bearing fault diagnosis, respectively. Martinez-Arellano et al. used GAF transformation to encode force signals and classify different tool conditions of a cutting process by using Convolutional Neural Network (CNN)s. Discussing their findings, the authors stated that the use of several different sensor types could contribute to improving model performance [
21]. Kou et al. extended this approach by using GAFs to transform acceleration and current signals, which were then processed with infrared images using CNNs to classify tool conditions in milling processes. The authors emphasized that the fusion of heterogeneous sensor signals enables higher model performance by linking complementary information [
22].
Following these results, signal-fusion techniques integrating sensor data (e.g., force, acceleration, and acoustic emission) have been adopted in smart manufacturing for data preprocessing, particularly in fault diagnosis and condition monitoring for different cutting and milling processes [
23]. Different types of sensors capture distinct aspects of the manufacturing process, and their fusion can enhance the robustness of predictive models in noisy environments. However, the application of different sensor types for condition monitoring in forming technology has not yet been adopted. Furthermore, the influence on model robustness has likewise not been demonstrated.
In this context, robustness refers not only to the model’s ability to maintain stable performance under process fluctuations and signal interference but also to its capacity to adapt to manufacturing scenarios such as variations in material thickness, production batches, or tool geometry. However, the application of such techniques remains relatively limited in high-speed manufacturing processes like blanking and is still in an active exploratory phase [
24,
25].
The feasibility of monitoring punching processes by employing data-driven models has thus been demonstrated in the literature by various authors. However, despite these advancements, two major challenges remain unresolved in industrial applications. First, models trained on data collected under specific signal conditions often experience significant performance degradation when applied to data from different signal sources or operating settings [
11]. This sensitivity to variations in signal characteristics severely limits the transferability and robustness of such models in practical scenarios. Second, acquiring large-scale, high-quality labeled datasets in industrial environments is expensive and disruptive to production, as it requires frequent machine downtime, comprehensive coverage of diverse tool-wear conditions, and extensive manual labeling efforts [
13,
24,
25,
26]. For this reason, new methods for robust and data-efficient monitoring must be developed for forming processes. To enable this, approaches from related domains, such as cutting processes, are adapted and modified.
Based on the aforementioned challenges, this study focuses on the following two key research questions:
RQ1: Can time-series image transformation improve model performance for small datasets in monitoring blanking processes under uncertain manufacturing conditions?
RQ2: Can data fusion improve the performance of process monitoring during blanking (either by reducing the required training data or by improving model robustness)?
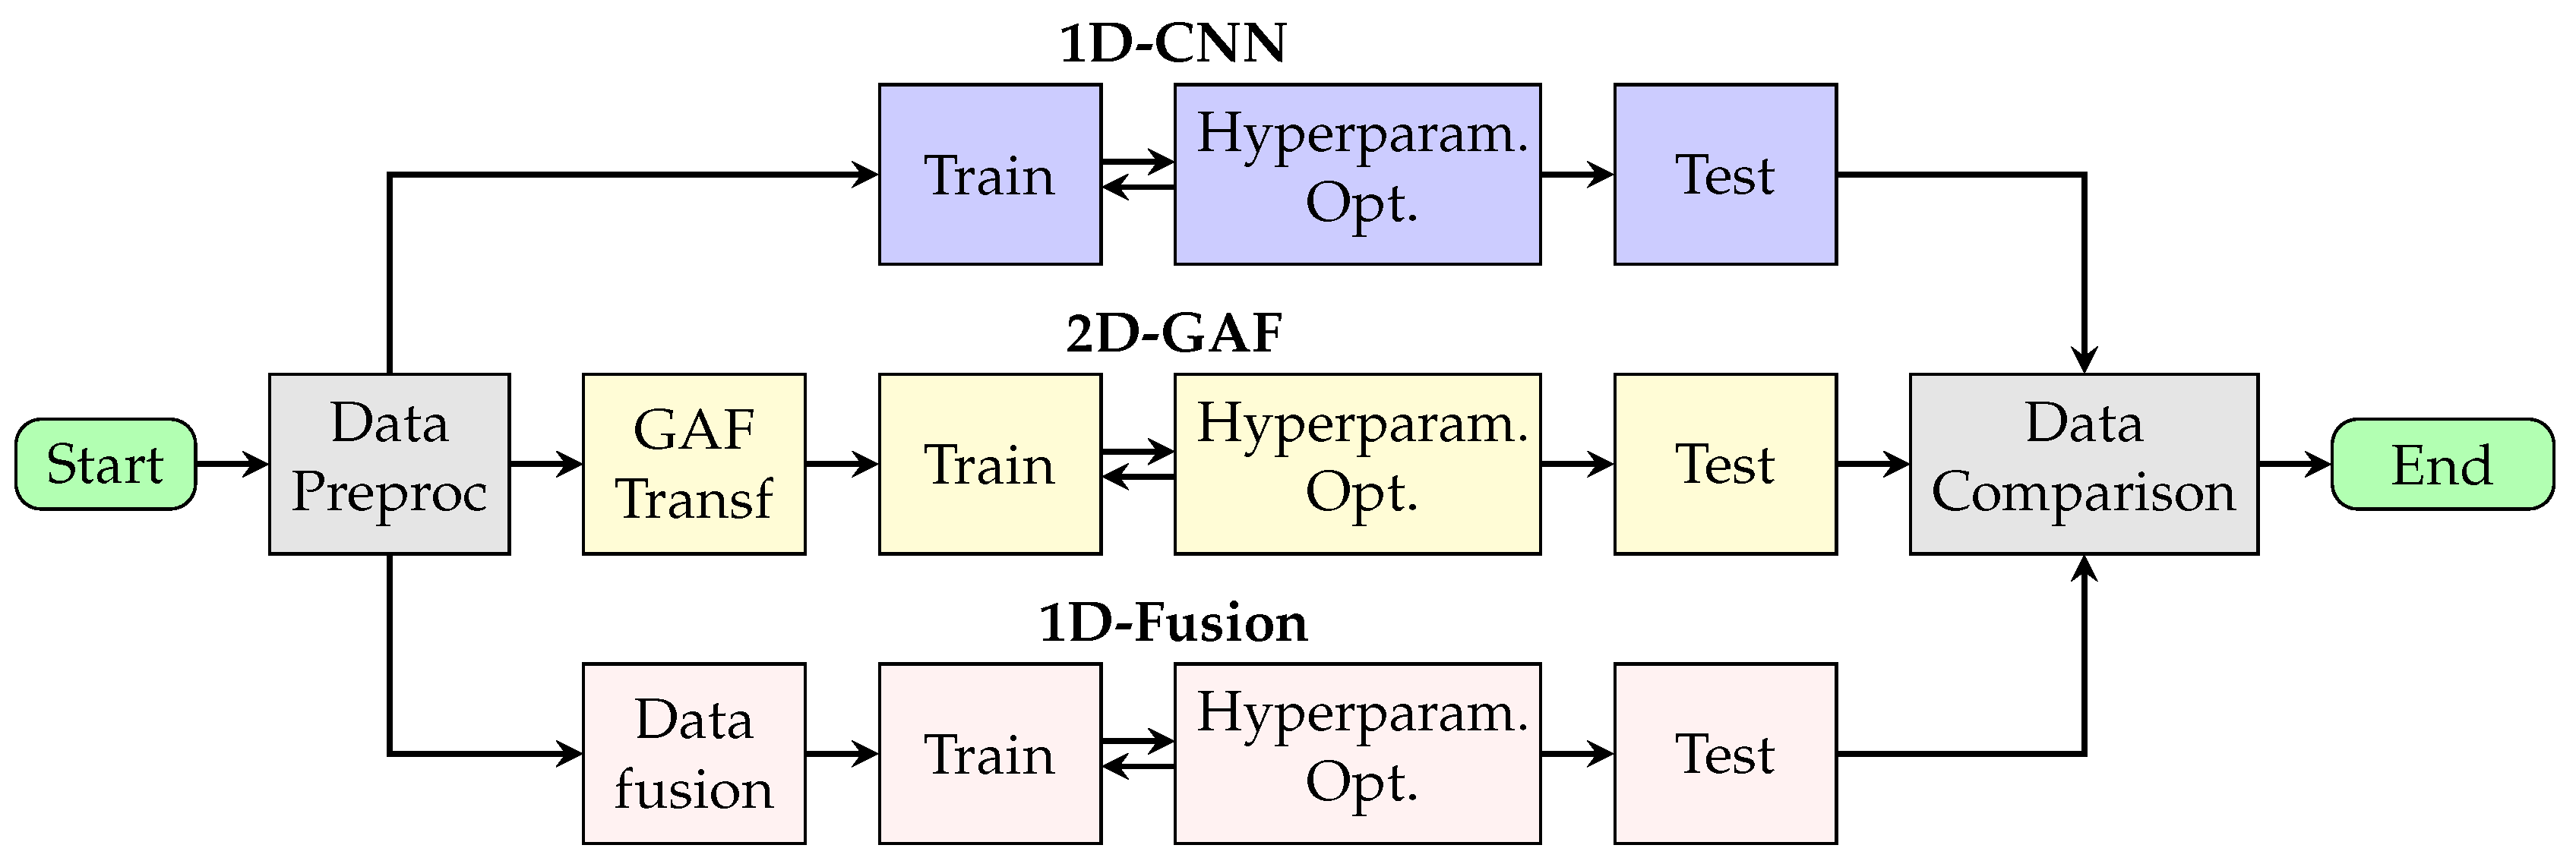
To this end, this study proposes a blanking tool-condition monitoring method that integrates time-series image transformation and multimodal signal fusion. This method aims to achieve high-accuracy, high-robustness process-state recognition under small-sample conditions.
3. Results Analysis
This section presents a comparison of the three modeling strategies with respect to the two research questions introduced in
Section 1. It first presents an evaluation of the baseline model before answering the research questions.
3.1. Baseline Performance of Two Signal Types
First, it is important to examine the performance of the baseline 1D-CNN models trained on individual time-series signals (e.g., acceleration or force). These results establish a reference point for evaluating the benefits of time-series transformation using GAFs and signal-fusion modeling.
Baseline performance:
Figure 5 illustrates the classification accuracy of the models trained on the data of material thickness 1.97 mm across varying training data proportions and tested on different material thicknesses
. The left subplot shows the results for acceleration, and the right subplot shows the results for force. Each color of the curve corresponds to a specific sheet thickness. As described in
Section 2, each point on the line chart represents the average test accuracy over 10 models trained on individually sampled subsets of the training data. The shaded areas represent how widely the accuracy results of the 10 models spread in the form of standard deviation.
Overall, the acceleration-based models consistently outperformed their force-based counterparts. With only 40 samples per wear state for training, the acceleration models achieved over 90% classification accuracy in the test of all material thicknesses. In contrast, the force-based models failed to achieve comparable performance, even with 200 samples per wear state. This indicates a higher informational value for the machine learning model in each sample per wear class of the training dataset, as well as a higher robustness in differentiating tool-wear classes under variations in sheet thickness. Although the signals were recorded at the same measurement frequency, the higher frequency components that dominate the acceleration signal appear to contain additional information for the model. This could explain the superior accuracy in data-scarce scenarios, as well as the lower overall accuracy. For trained machine operators, however, this is accompanied by a loss of physical interpretability that the force signal offers with a distinct punch, push, and withdraw phase in the cutting process. Nevertheless, this explains the high sensitivity of the force signals to a change in sheet thickness, as the maximum cutting force is physically directly linked to the sheet thickness. As a result, it is to be expected that the extracted features between the training and test domains shift with force signals, and that poor model performance is to be assumed.
In addition to superior overall accuracy, the acceleration-based models demonstrated greater consistency across repeated trials, as indicated by their lower standard deviations. This stability was especially pronounced under limited data conditions.
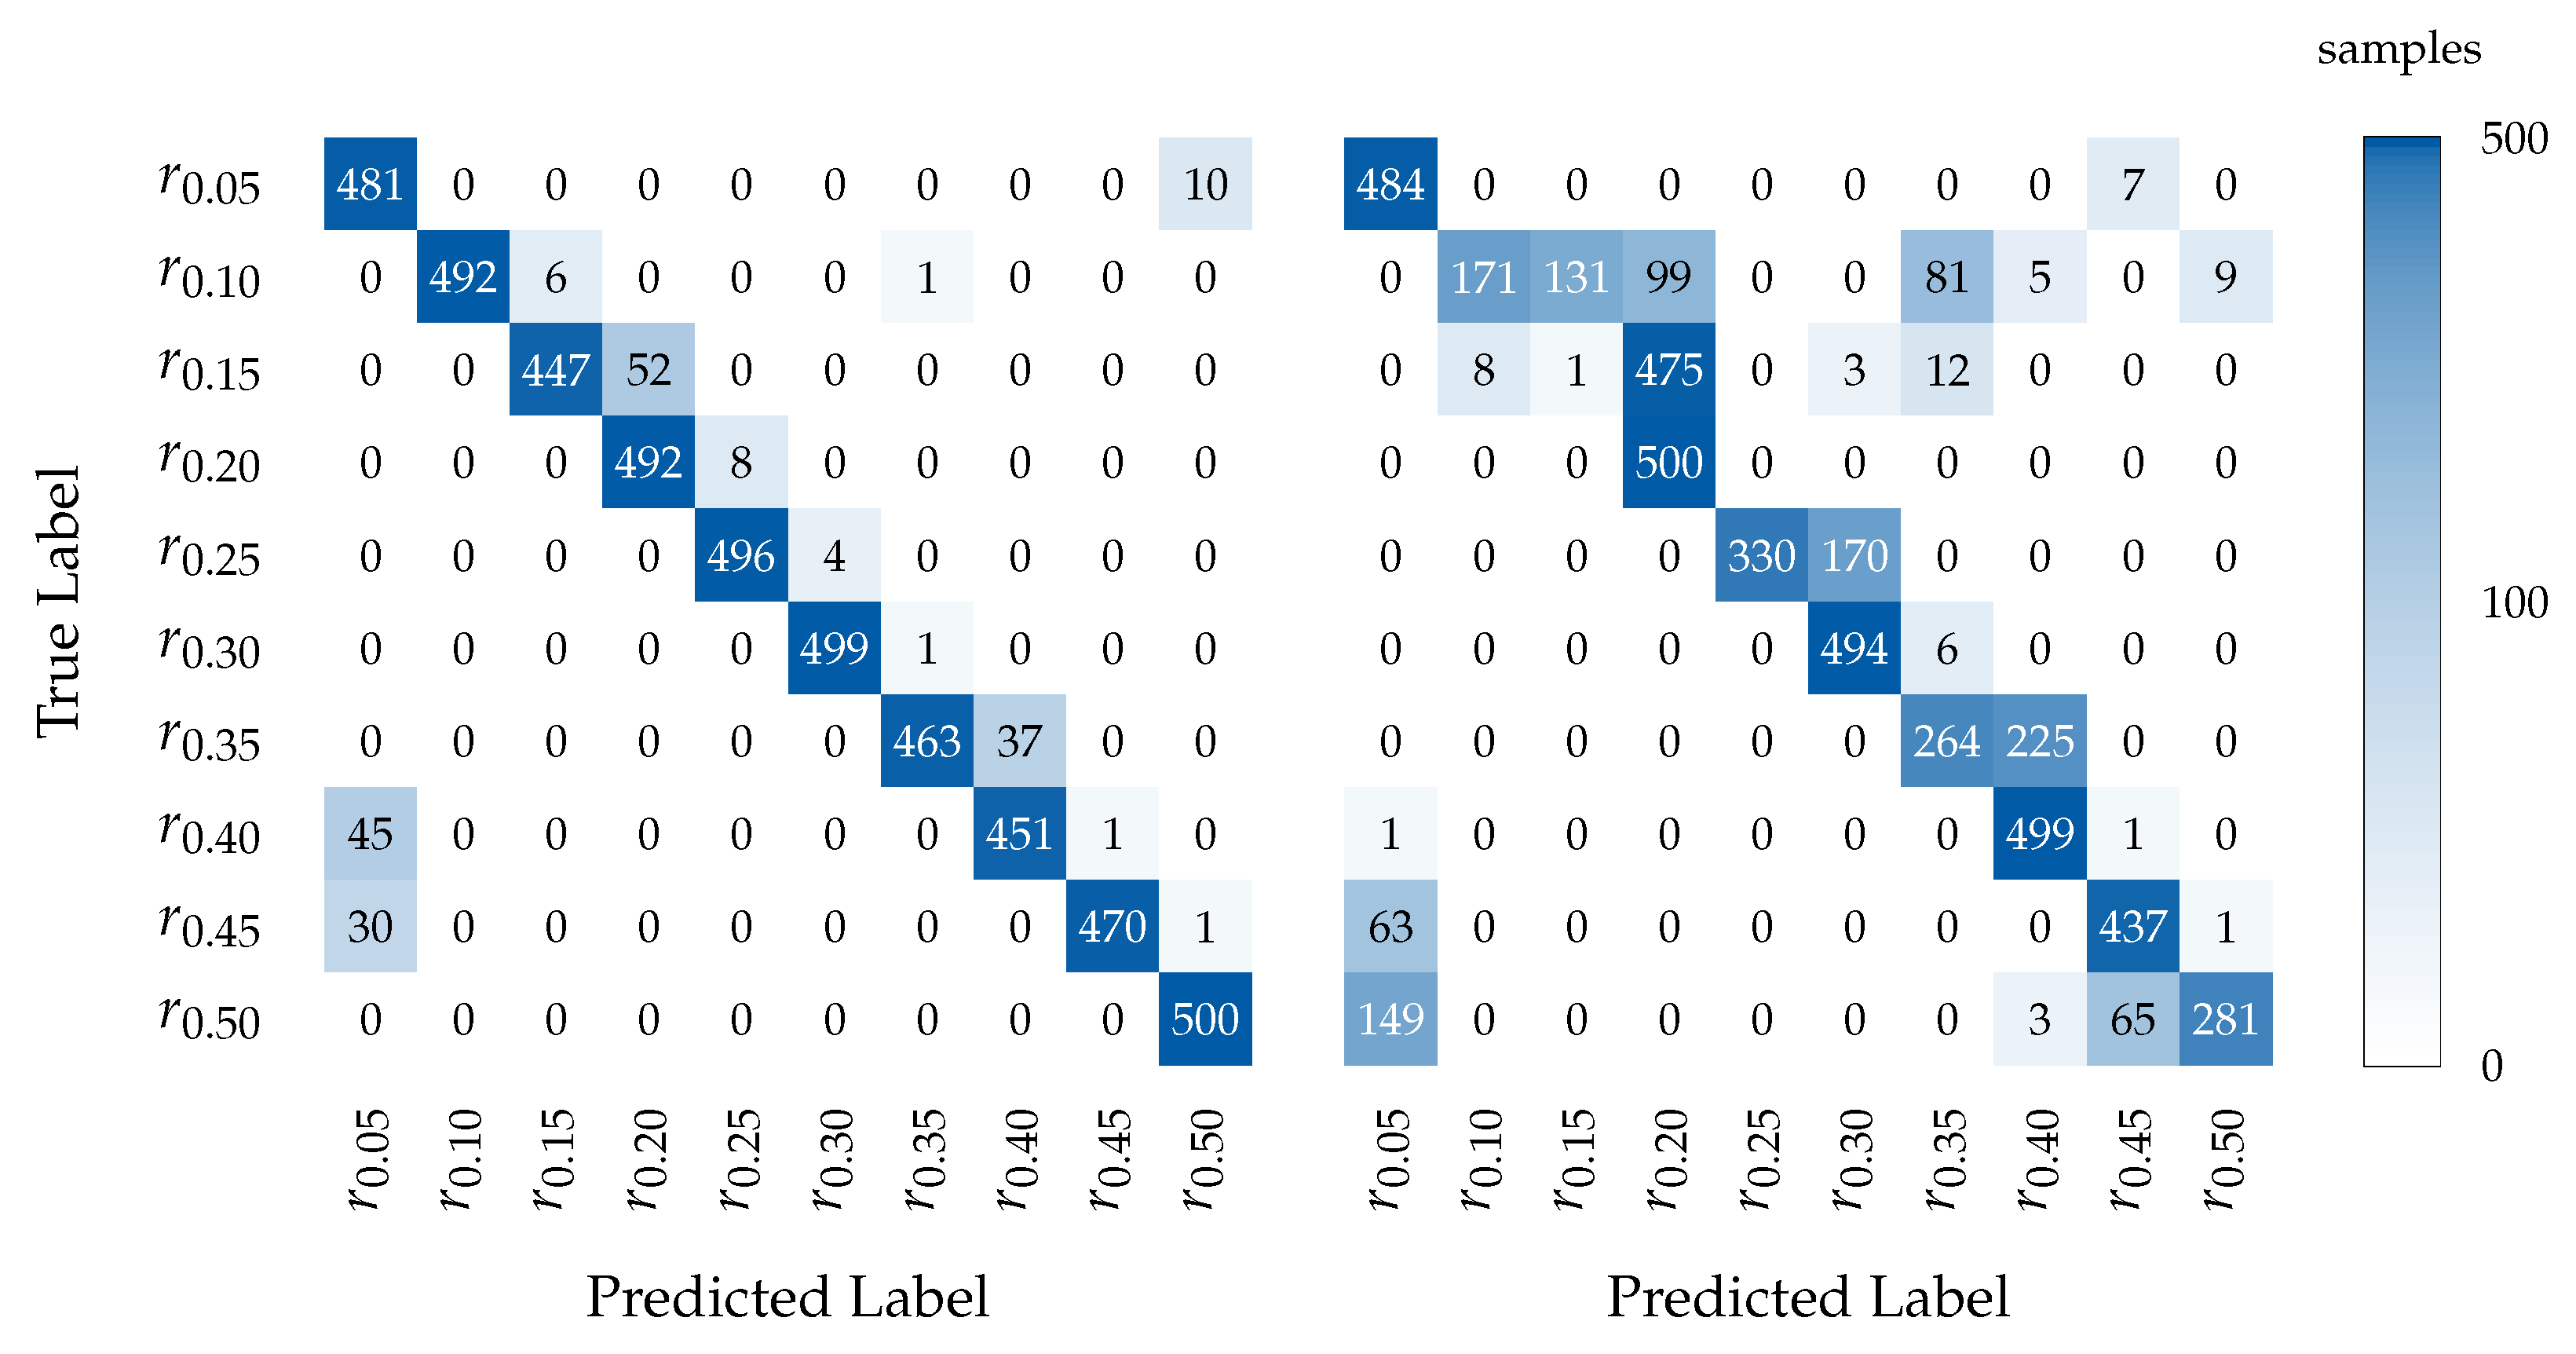
To further examine the per-class classification behavior, confusion matrices are presented in
Figure 6 for the models trained with 200 samples per wear state and tested on
.
The acceleration models presented strong diagonal dominance, with fewer errors across most classes. In contrast, the models trained on force signals showed a more widespread misclassification pattern. As seen in the confusion matrix, classes such as , , and were frequently confused with both neighboring and distant classes. For example, was often predicted as , , and even as and .
Due to the thickness difference between the training data and the test data , both models tended to misclassify severe wear conditions (–) as mild ones (–). The acceleration-signal-based models tended to misclassify a small number of higher wear classes such as and as , which can be attributed to the local similarity in transient vibrations. In industrial applications, it is essential to avoid misclassifying high wear conditions as low wear. Such misclassifications can result in severe tool wear being undetected, which may lead to tool breakage, prolonged downtime, and, consequently, significant economic losses. In addition, such failures pose a potential safety risk to machine operators. These critical misclassifications were observed in both baseline models.
3.2. Can GAF Transformation of Sensor Signals Improve Performance?
As described in
Section 2, GAFs transform time-series signals into image-like representations, enabling CNNs to exploit time-invariant structural features. To assess the impact of different feature representations on tool-wear classification, we compared a 2D-CNN GAF-based model with a 1D-CNN, using identical force signals as input. The force signals were selected for this analysis, as their lower classification performance offers greater potential for a differentiated evaluation of possible improvements. The results, as shown in
Figure 7, include the classification accuracies and standard deviations across all conditions.
Overall, transforming the force signals using GAFs led to a consistent improvement in classification performance. Using only 20 samples per wear state, the GAF transformation achieved 98.1% accuracy when the sheet thickness was not changed between the training and test sets, exceeding the 1D-CNN model’s 81%. Tested on
, using 20 samples per wear state, the GAF transformation achieved 79.5% accuracy, outperforming the 1D-CNN model at 76%. This trend continued for all training data sizes, eventually reaching 90.3%, compared to 86.5% for the 1D-CNN model. For the test sets
,
, and
, transforming time-series signals using GAFs did not demonstrate an overall improvement in accuracy. However, a significant improvement in the stability of the predictions, which was reflected in the standard deviation, was observed. The reduced standard deviation allows for a clearer definition of the operational boundaries within which the modeling approach can be applied in industrial settings. The findings of the investigations conducted on the various preprocessing methods for all sheet thicknesses are documented in
Appendix A.
Table A1 presents the mean accuracies of the models, while
Table A2 presents the standard deviations of these models.
The extraction of temporally inherent features through transformation enhanced the separability of individual classes. As a result, classification accuracy improved significantly for similar data and small data shifts. However, although the extracted features improved class separability, they did not necessarily increase the robustness of this separation against data shifts, as the extracted features between the training and test sets changed.
To investigate class-wise behavior,
Figure 8 presents confusion matrices for both models trained on 40 samples per wear state and evaluated on 1.94 mm.
The GAF-based model showed improved diagonal concentration, indicating stronger classification ability. Compared with the 1D-force model, which predicted as , the 2D-CNN also significantly reduced this misclassification behavior. While the 1D-CNN model misclassified 91 samples of as , the number of misclassifications by the 2D-CNN model in this case was only 8. In conclusion, GAF transformation, with its ability to leverage spatial feature extraction to overcome the limitations of the 1D-CNN model, can improve accuracy by significantly reducing the standard deviation between different samples. On the other hand, the confusion matrix shows a decline in the tendency for critical misclassifications between distant wear classes, while still showing critical misclassifications in both cases.
3.3. Can Fusion of Raw Signals Improve Performance?
Although the 2D-CNN achieved competitive performance under consistent conditions, its robustness under significant domain shifts (variations in material thickness) remained limited. Moreover, in some samples, the model exhibited critical misclassifications in predicting distant wear classes (e.g., classifying as ), undermining its practical applicability for predictive maintenance. To address this, a 1D-CNN architecture that fuses both acceleration and force signals as dual-channel inputs was investigated. This approach enables the model to learn joint patterns and leverage complementary features across modalities.
The acceleration-based 1D-CNN was used as the reference model due to its strong standalone performance.
Figure 9 compares the accuracy of the fusion model and the 1D-CNN across varying training data proportions. Each curve corresponds to a specific sheet thickness, and the shaded areas show the standard deviation of the test results.
Overall, the fusion model achieved consistently higher classification accuracy than the acceleration-only 1D-CNN across all material thicknesses and training data proportions. On the test set furthest from the training distribution , the fusion model reached an accuracy of 93.2% with only 20 samples per wear state for training, whereas the acceleration model lagged behind at 78.3%, marking a substantial improvement of nearly 15 percentage points. This advantage remained evident across all training sizes. When trained with 200 samples per wear state and tested on , the acceleration model only gradually approached 96.0%, while the fusion model exceeded this level, reaching 96.8%. In addition to higher accuracy, the fusion model also showed greater stability in repeated experiments. Furthermore, the acceleration model exhibited large fluctuations at low data levels when tested on , with a standard deviation of 10.96 for 20 training samples, which dropped to 4.49 at 100 training samples. In contrast, the fusion model remained much more stable, with the standard deviation staying below 2.0 throughout and falling to 1.15 at 200 training samples per wear state. Similar trends were observed across other test sets, where the fusion model maintained low variance. This indicates that the fusion model benefited from additional information in the training data, providing more accurate predictions. This is particularly important in scenarios with limited data or distribution shifts. By combining two signals, the fusion model benefited from a more comprehensive signal representation. The force signal captured the primary mechanical load during the cutting phase, characterized by a dominant peak in the punch phase, followed by less pronounced push and withdraw phases. In contrast, the acceleration signal reflected dynamic mechanical responses such as oscillations, impacts, and tool vibrations throughout the process. This combination enabled the model to learn both global load characteristics and transient structural responses, leading to higher prediction accuracy and improved robustness.
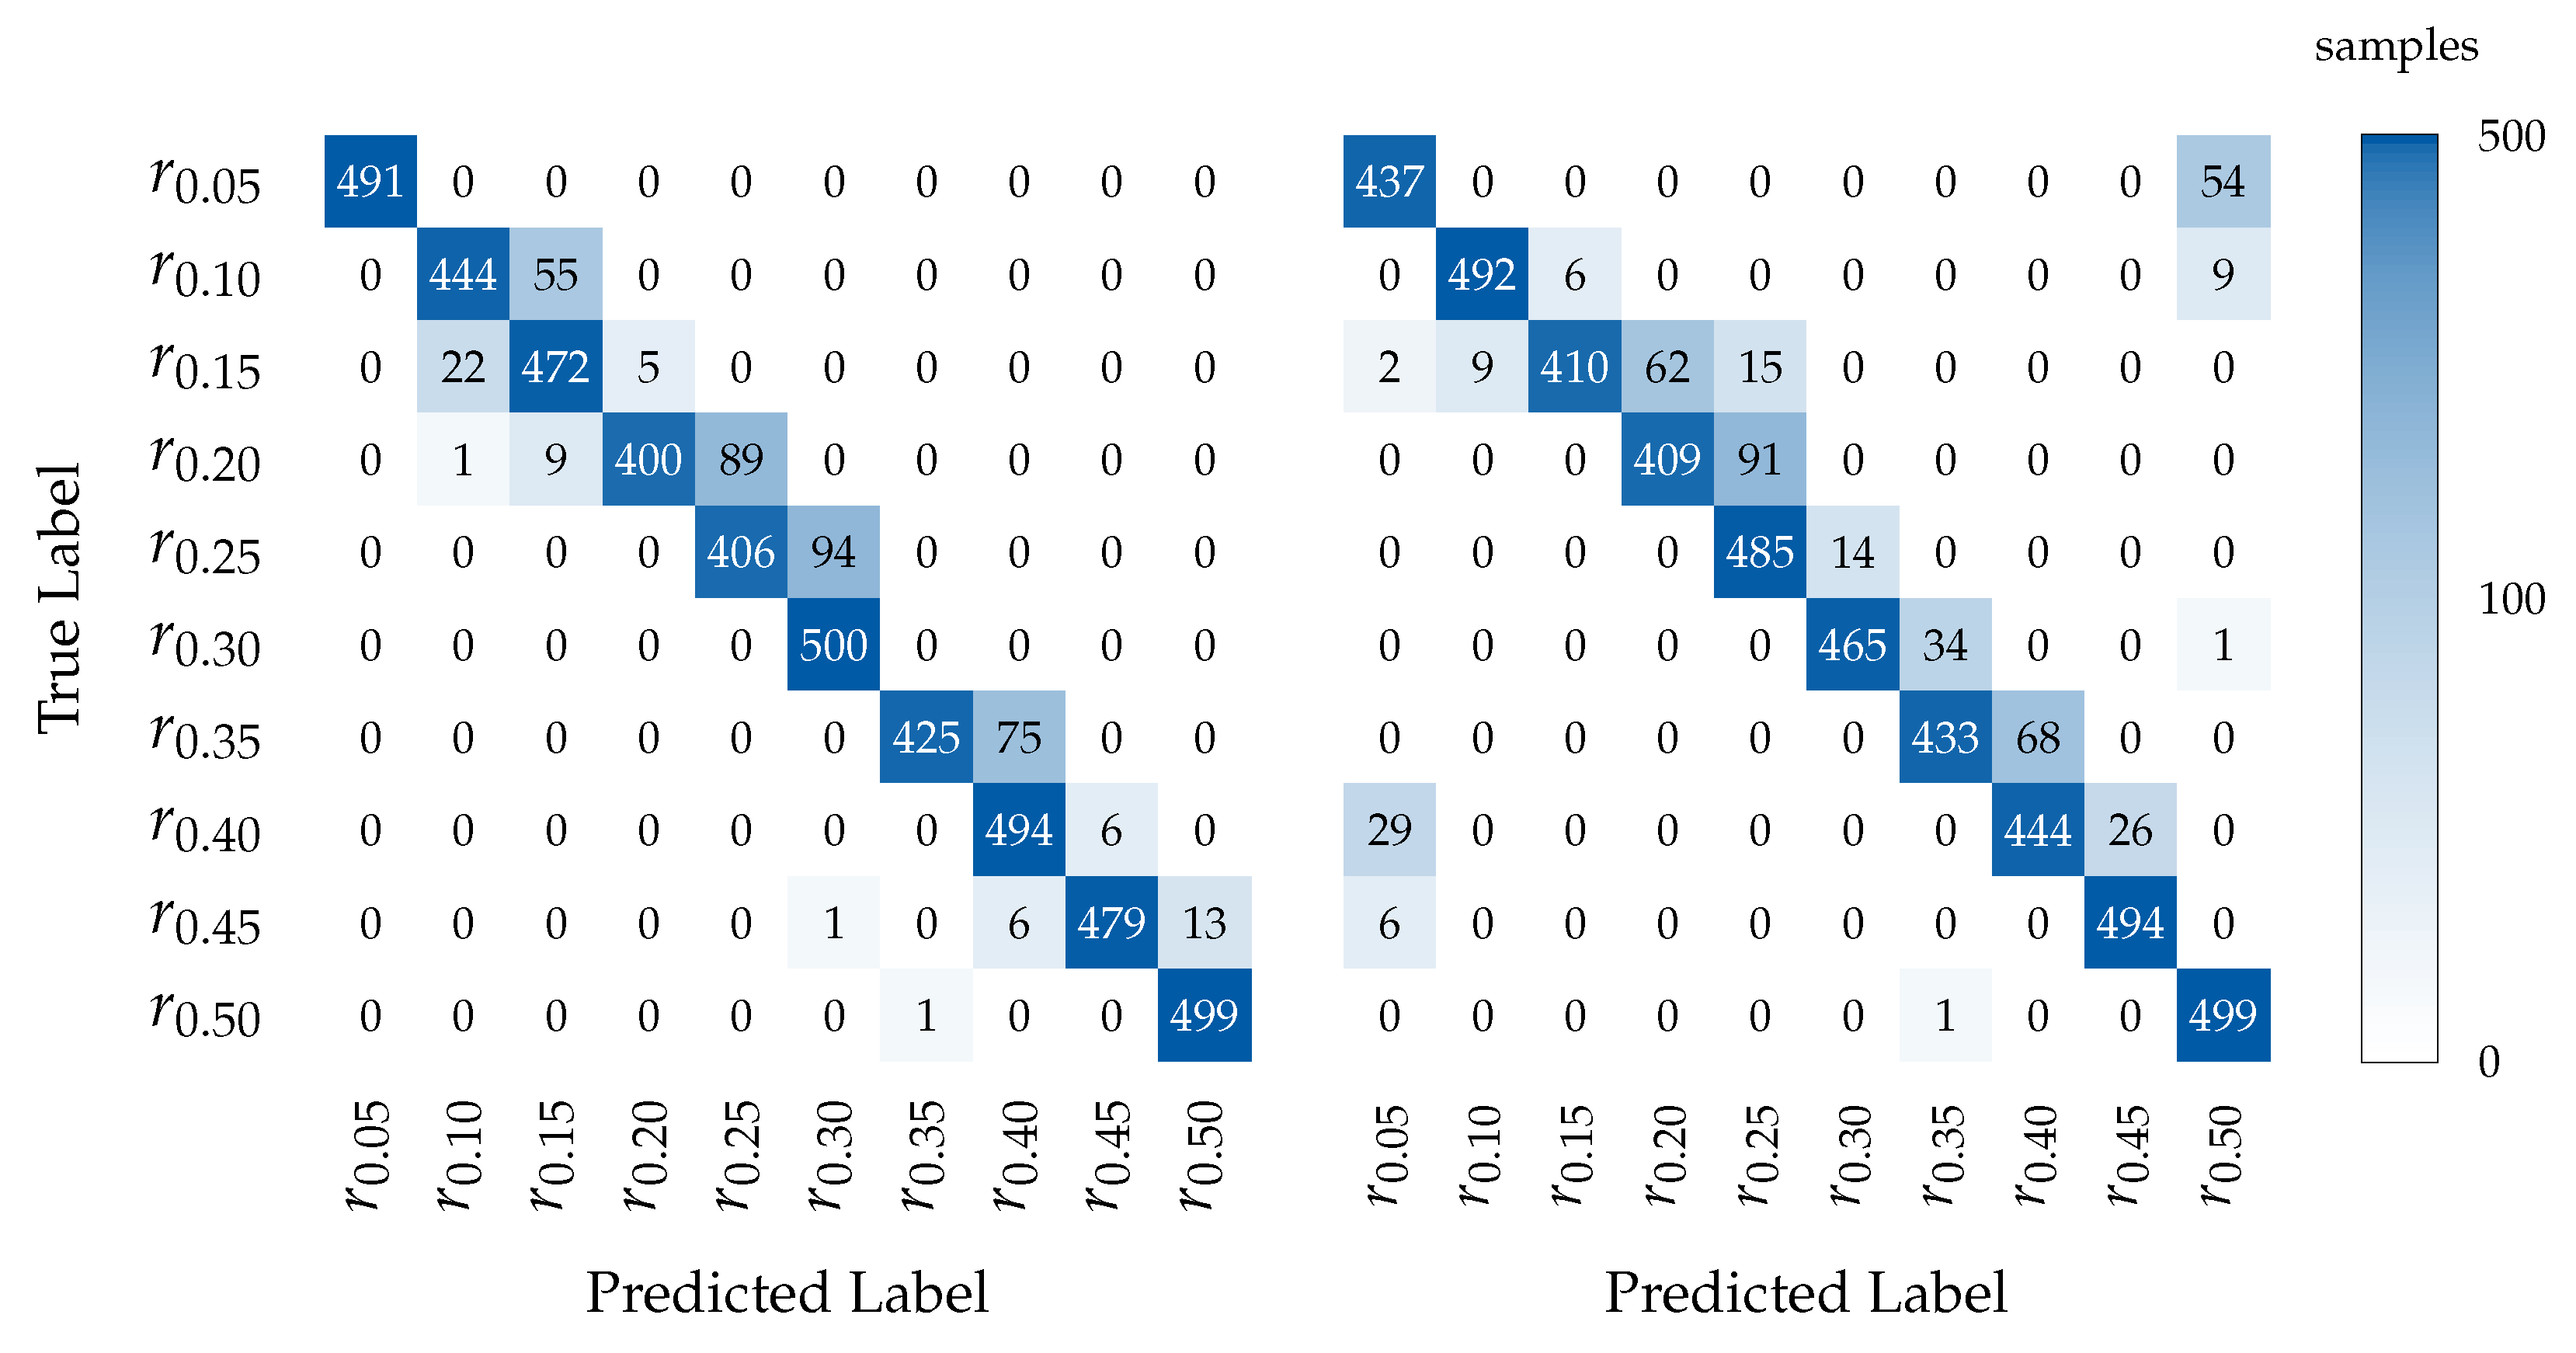
To investigate the specific benefits of fusion on class-level prediction,
Figure 10 displays the confusion matrices for both models trained with only 20 samples per wear state and evaluated on
.
The 1D-fusion model improved both overall accuracy and misclassification robustness, particularly in low-data settings. Fusion reduced critical misclassification errors that could lead to incorrect tool-wear decisions in practice. While the acceleration-based model misclassified distant classes, such as 54 samples of misclassified as and 29 samples of misclassified as , the 1D-fusion model tended to predict one wear condition as a close wear condition, such as predicting as . Although the benefit diminished with larger datasets, fusion still maintained a small edge in consistency and class stability.
4. Conclusions
Monitoring blanking processes in real production environments using data-driven approaches poses a challenge, as the availability of large labeled datasets is limited and the trained models must be robust to fluctuating uncertainties inherent in manufacturing processes. To this end, this study answers two research questions.
RQ1: Can time-series image transformation improve model performance for small datasets in monitoring blanking processes under uncertain manufacturing conditions?
This study showed that transforming force signals with Gramian Angular Fields enhances robustness by encoding temporal patterns into structured representations, reducing prediction variance across material batches for force signals. Although the GAF-based models failed to match the acceleration-based models in terms of accuracy, they may be effective if acceleration sensors are unavailable. Since data-driven monitoring of production processes often relies on retrofitting existing tools, not every sensor can be integrated due to spatial limitations. As a result, only a limited set of sensor signals may be available depending on the specific application. In these scenarios, the use of GAFs can contribute to improved robustness in model performance.
RQ2: Can data fusion improve the performance of process monitoring during blanking (either by reducing the required training data or by improving model robustness)?
The fusion models consistently achieved the highest performance. The combination of different sensors allowed for the acquisition of diverse process characteristics in punching operations, which could then be provided to the model. This additional information reduced misclassifications and improved robustness to distributional data shifts. However, their implementation requires greater integration effort and sensor alignment.
Future work will focus on enabling the application of trained models in data-scarce scenarios across different use cases, such as changes in sheet material. Fluctuating process uncertainties will be further investigated to ensure the transferability of the approach to real production environments. To this end, semi-supervised transfer learning methods will be explored to further reduce the requirements for labeled datasets in other application contexts. In addition, the integration of synthetic data will be part of future investigations in order to reduce the need for real process data. To this end, the use of model-based methods such as variational autoencoders, as well as direct signal-altering methods such as jittering, scaling, or interpolation, will be investigated. Furthermore, the integration of numerical data will be investigated.


