Coverage-Based Framework for Estimating Total Vehicle Travel Distance Using Point-to-Point Trajectory Data
Abstract
1. Introduction
2. Literature Review
2.1. Traditional Zone-to-Zone VKT Estimation
2.2. High-Resolution Trajectory Data Utilization Trends
2.3. Diverse Applications of Trajectory-Based Analysis
2.4. Limitations in Verifying the Reliability of Trajectory-Based Analysis
2.5. Research Gap and Contribution
3. Methodology
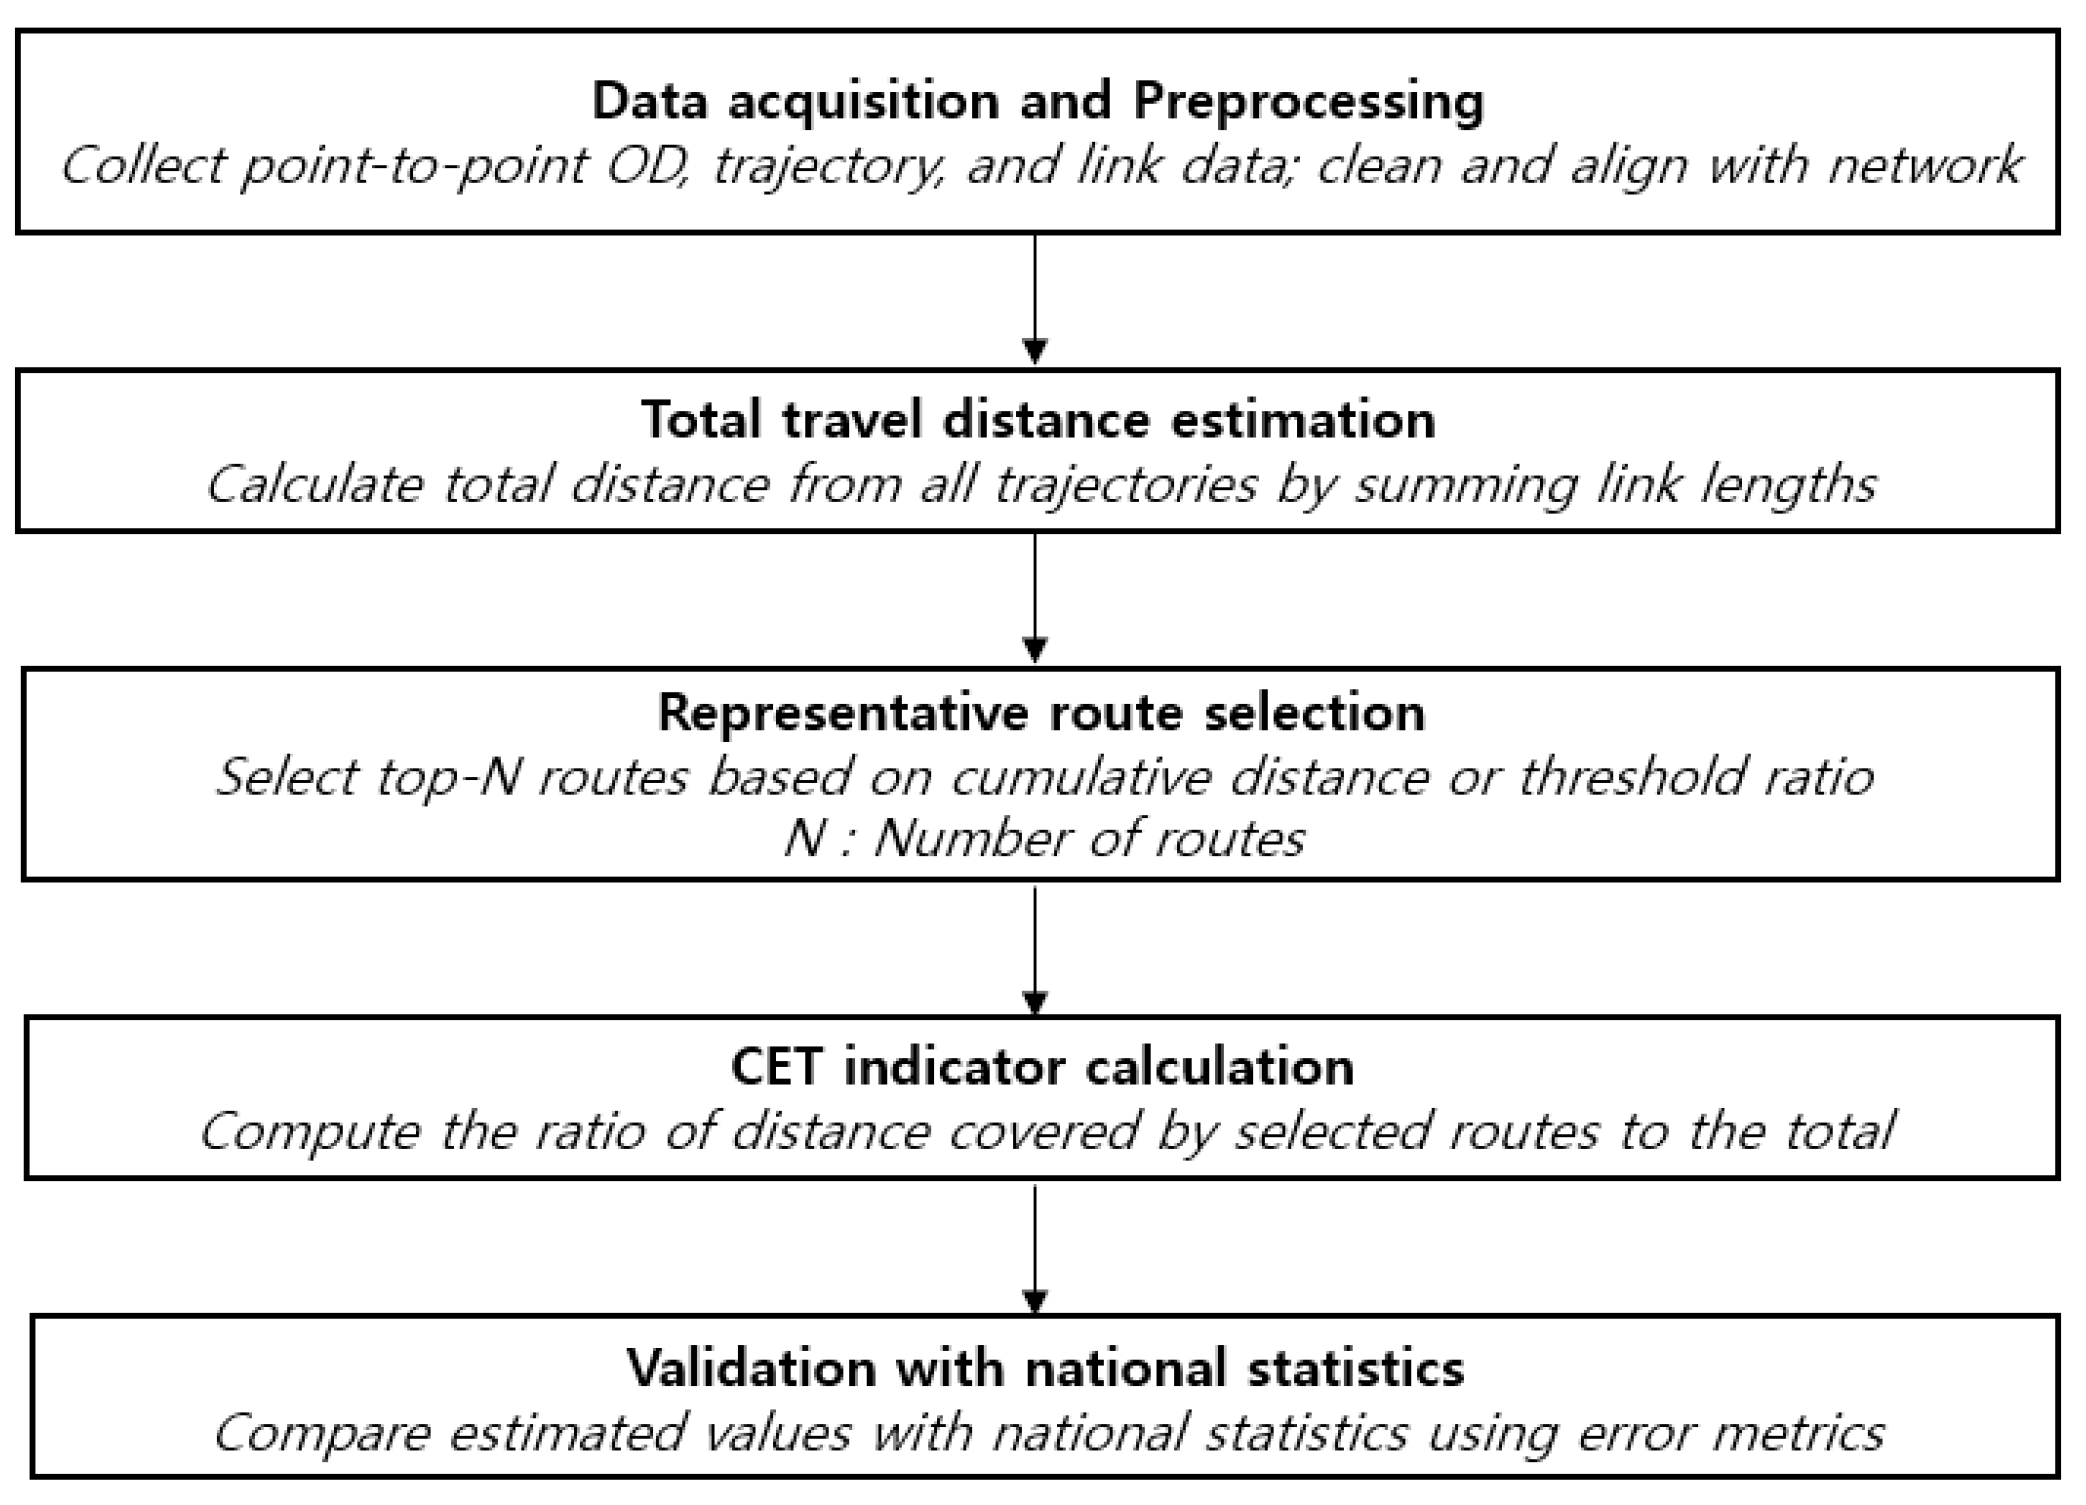
3.1. Framework Overview
- Data cleaning: Enhance data quality by removing erroneous or incomplete trajectory records.
- Network mapping: Map the link sequences onto a digital road network to accurately determine the length of each link.
- Aggregation: To ensure reproducibility and eliminate redundancy, duplicate OD trajectories defined as records with identical OD coordinates and the same ordered sequence of traversed road links were grouped and aggregated. The trip counts of these identical trajectories were summed, and the resulting unique OD pairs were used as input for route ranking and CET estimation.
3.2. CET Metric Calculation and Validation
3.3. Representative Route Selection Methodology
- Initialize the representative route set .
- The top-ranked route is selected from the remaining list and added to if its link overlap ratio with all the routes in is less than 70%.
- After adding each route, recalculate CET for .
- Continue the selection until either the target CET threshold (for example, ≥85%) is reached or the maximum number of routes is selected.
4. Analysis Results
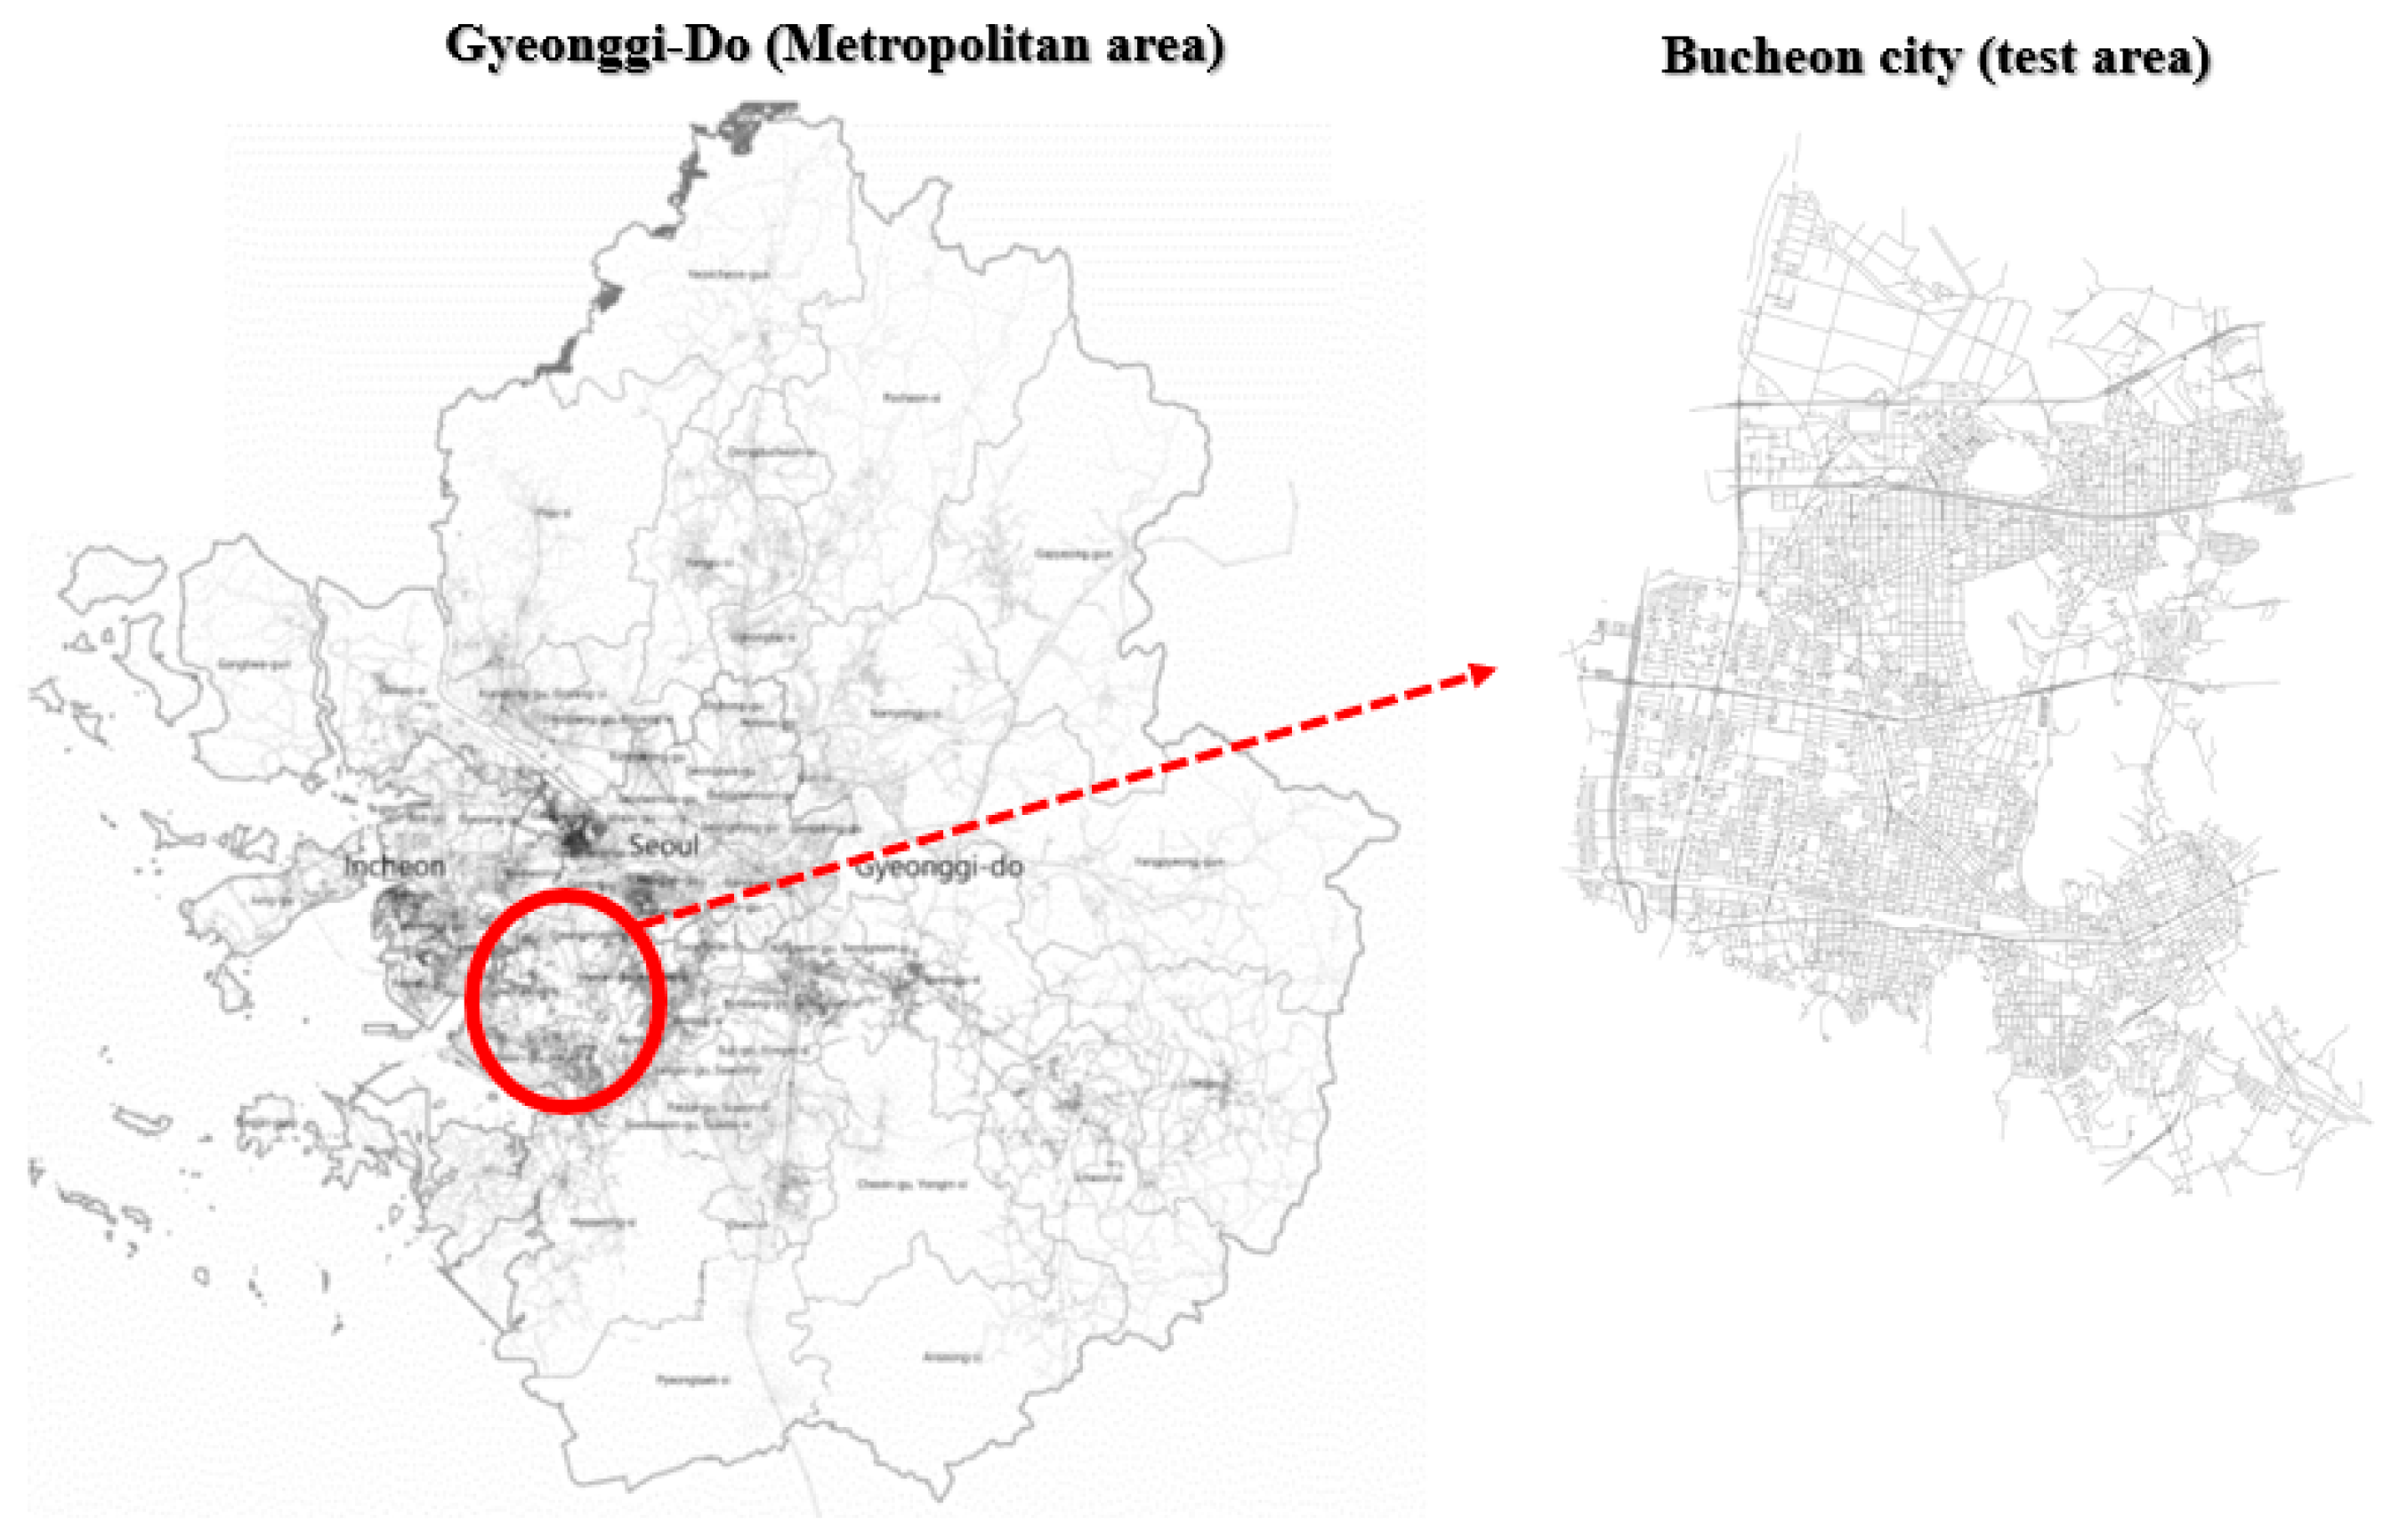
4.1. Data Acquisition and Analysis Environment
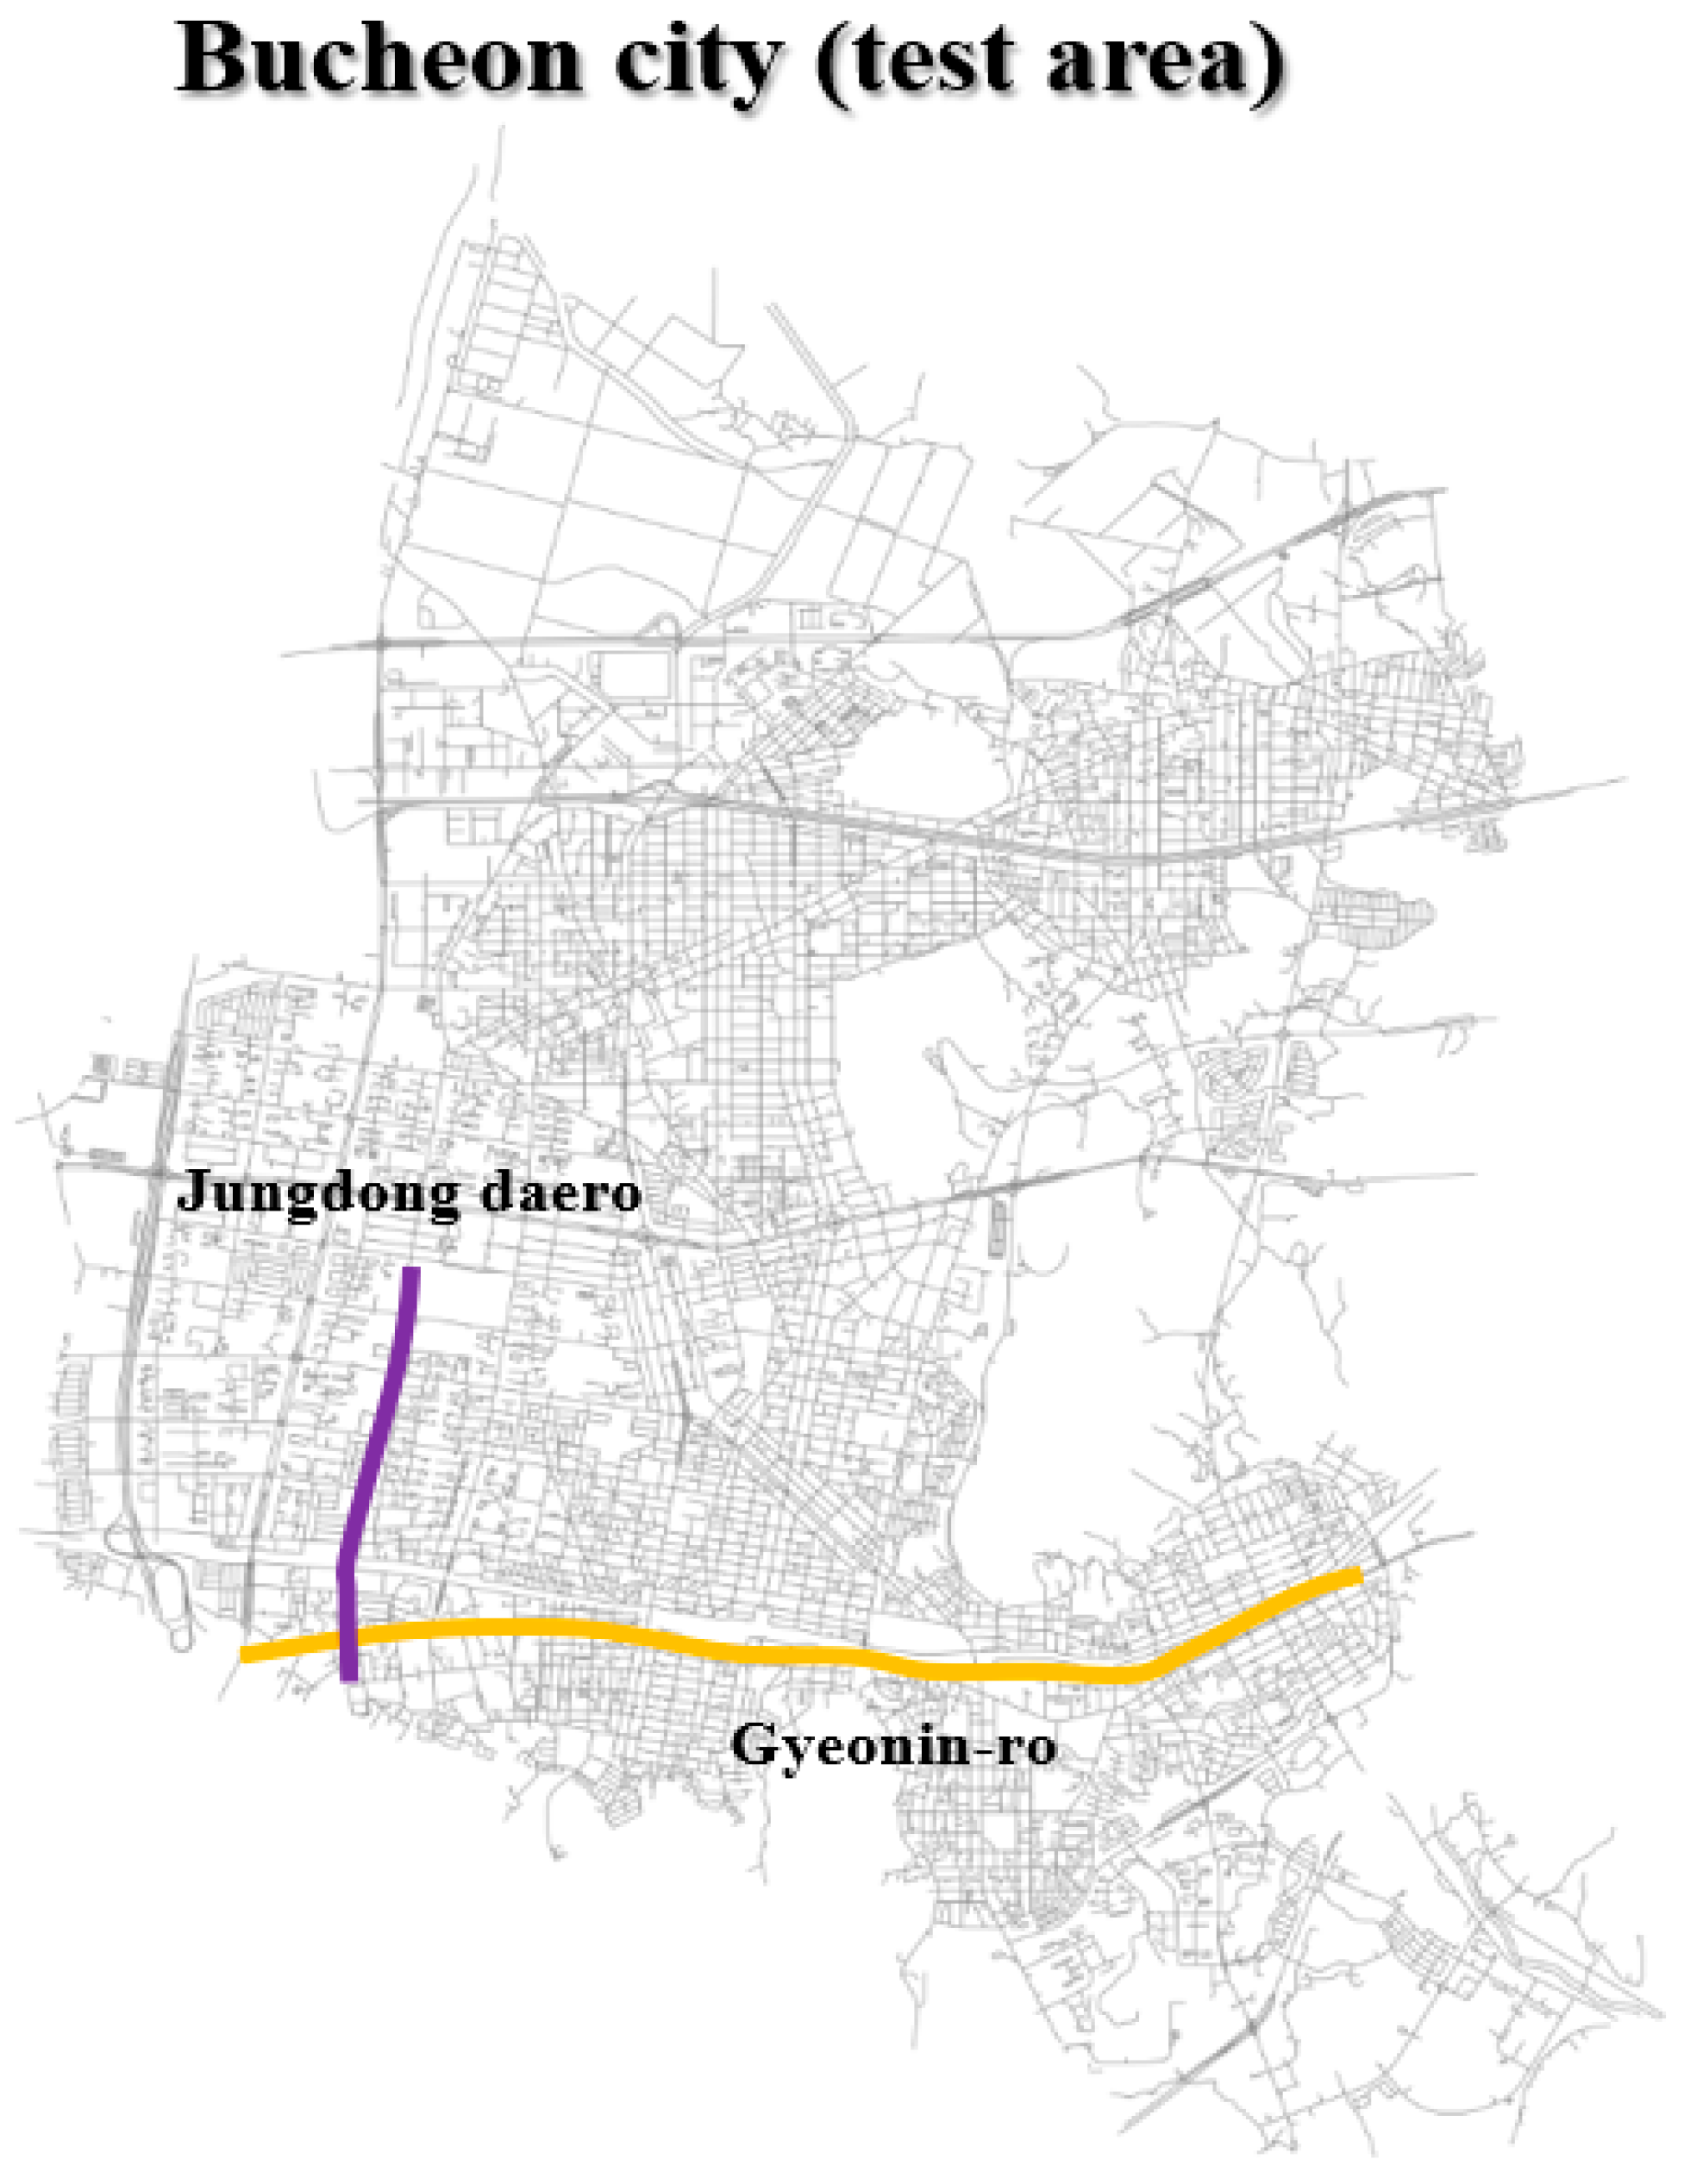
4.2. Results of Representative Path-Based VKT Analysis
4.3. CET Metric Calculation Results
4.4. Methodology Enhancement and Robustness Analysis
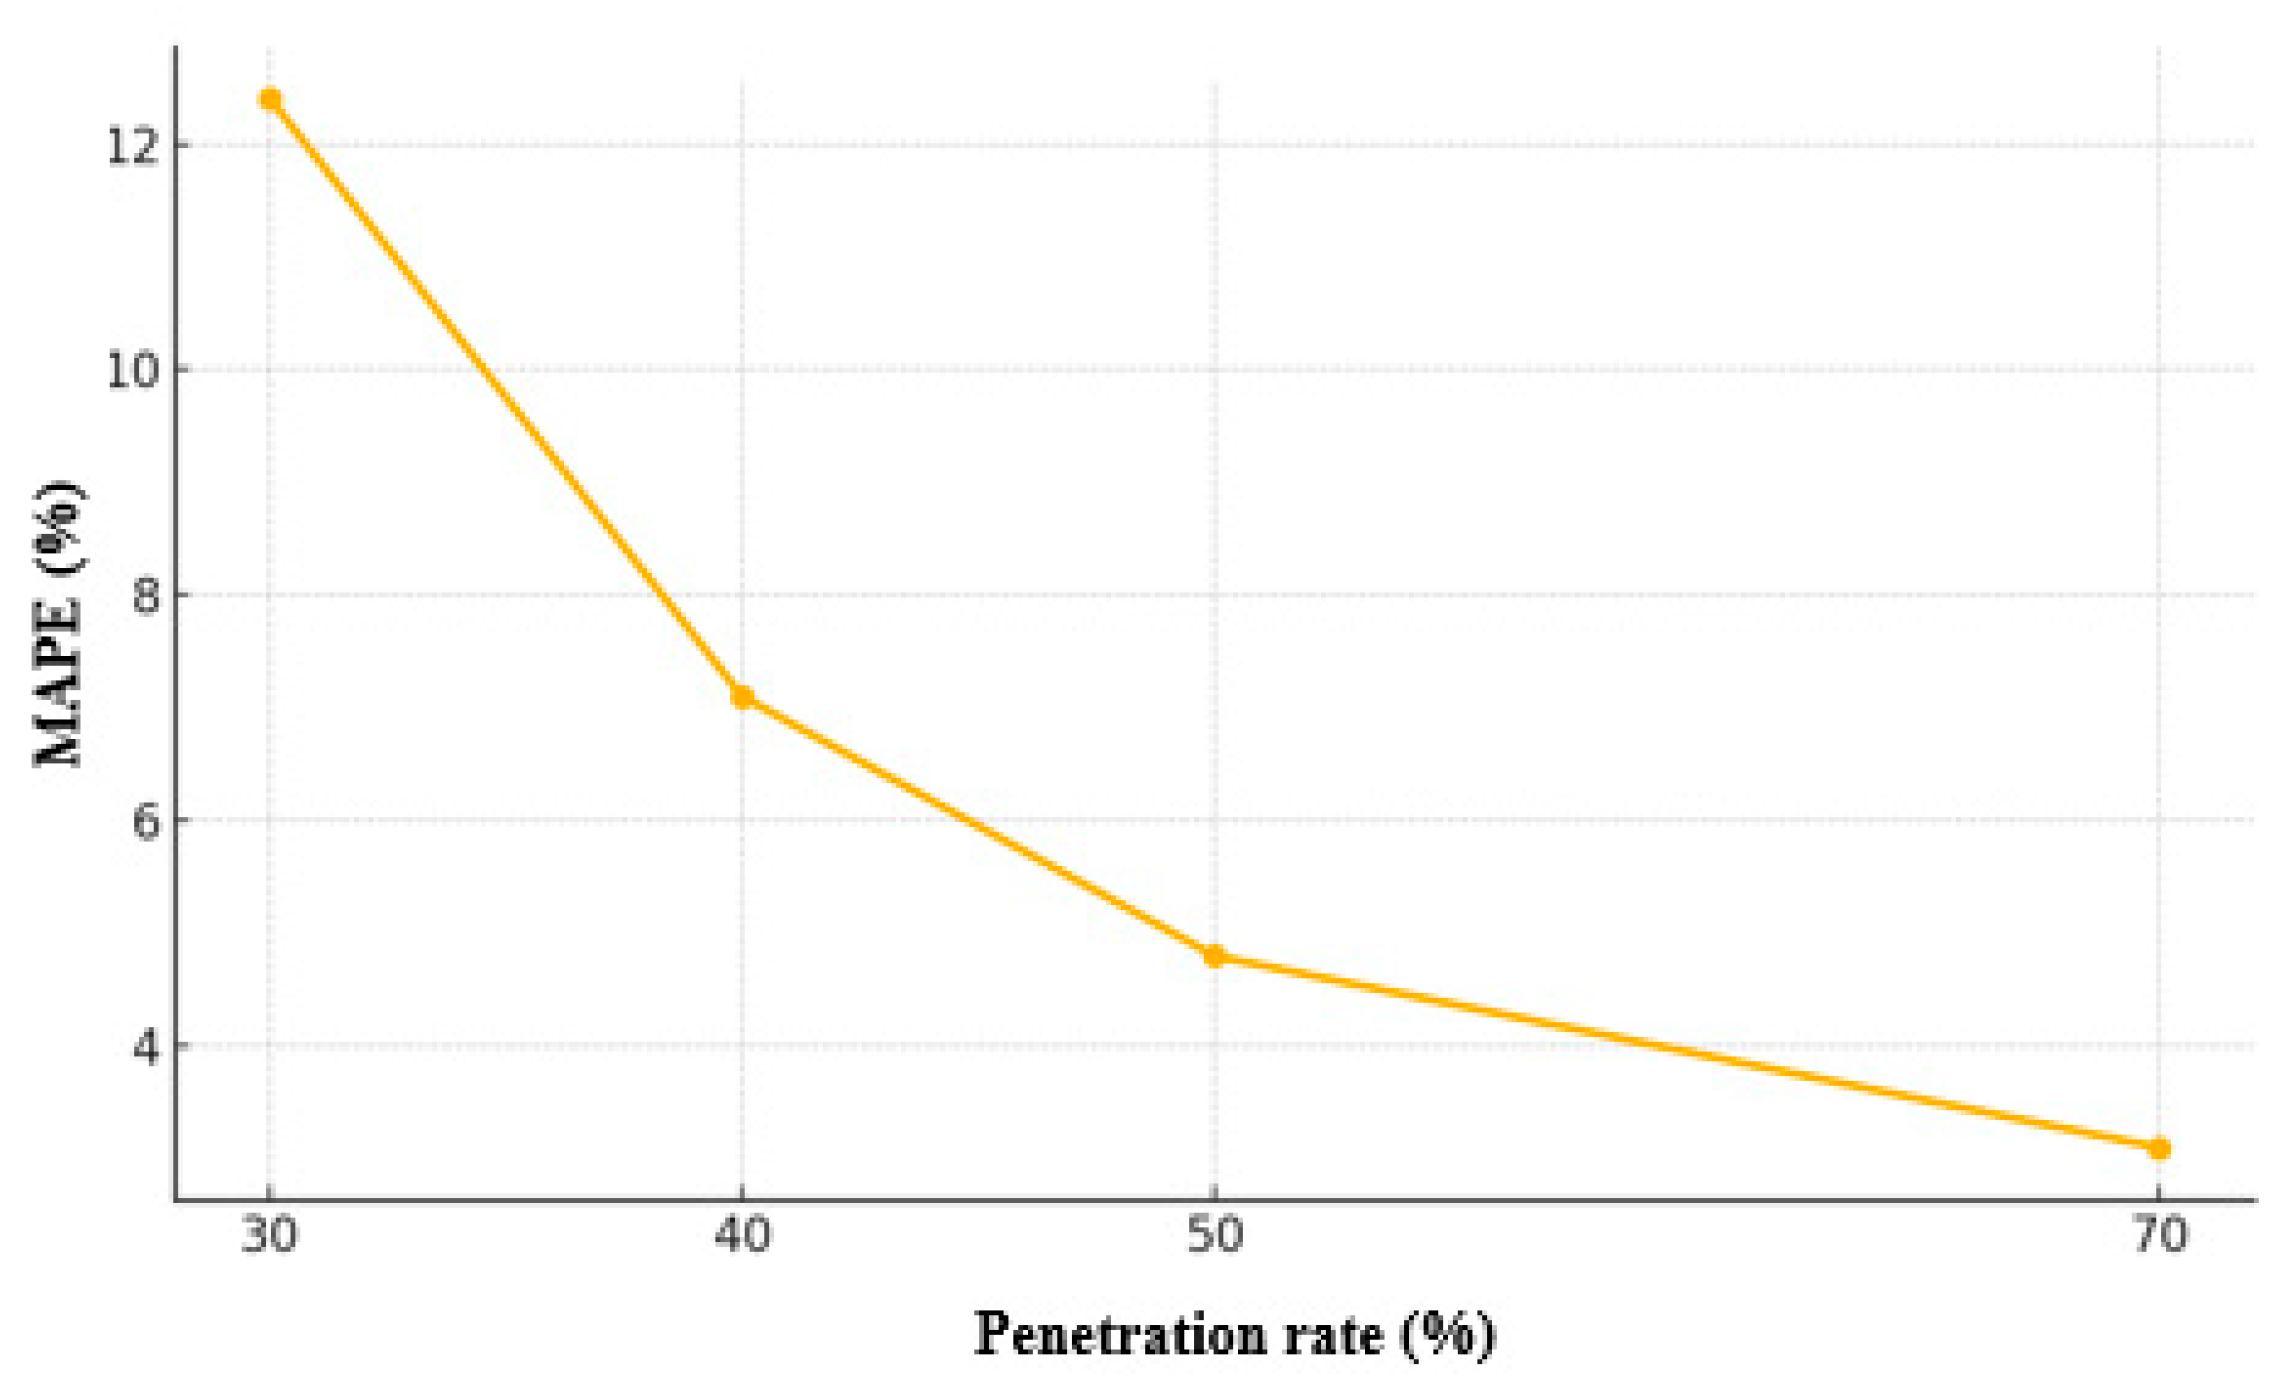
4.4.1. Sensitivity Analysis Based on Probe Data Penetration Rate
4.4.2. Correction Factor-Based VKT Estimation and Statistical Correction
4.4.3. Statistical Fitness Evaluation and Validation Results
- MAPE was calculated to evaluate the overall estimate accuracy. The results indicated a low error rate of 6.3%, demonstrating that the proposed estimation method exhibited stable performance with low average deviation from the actual statistical values.
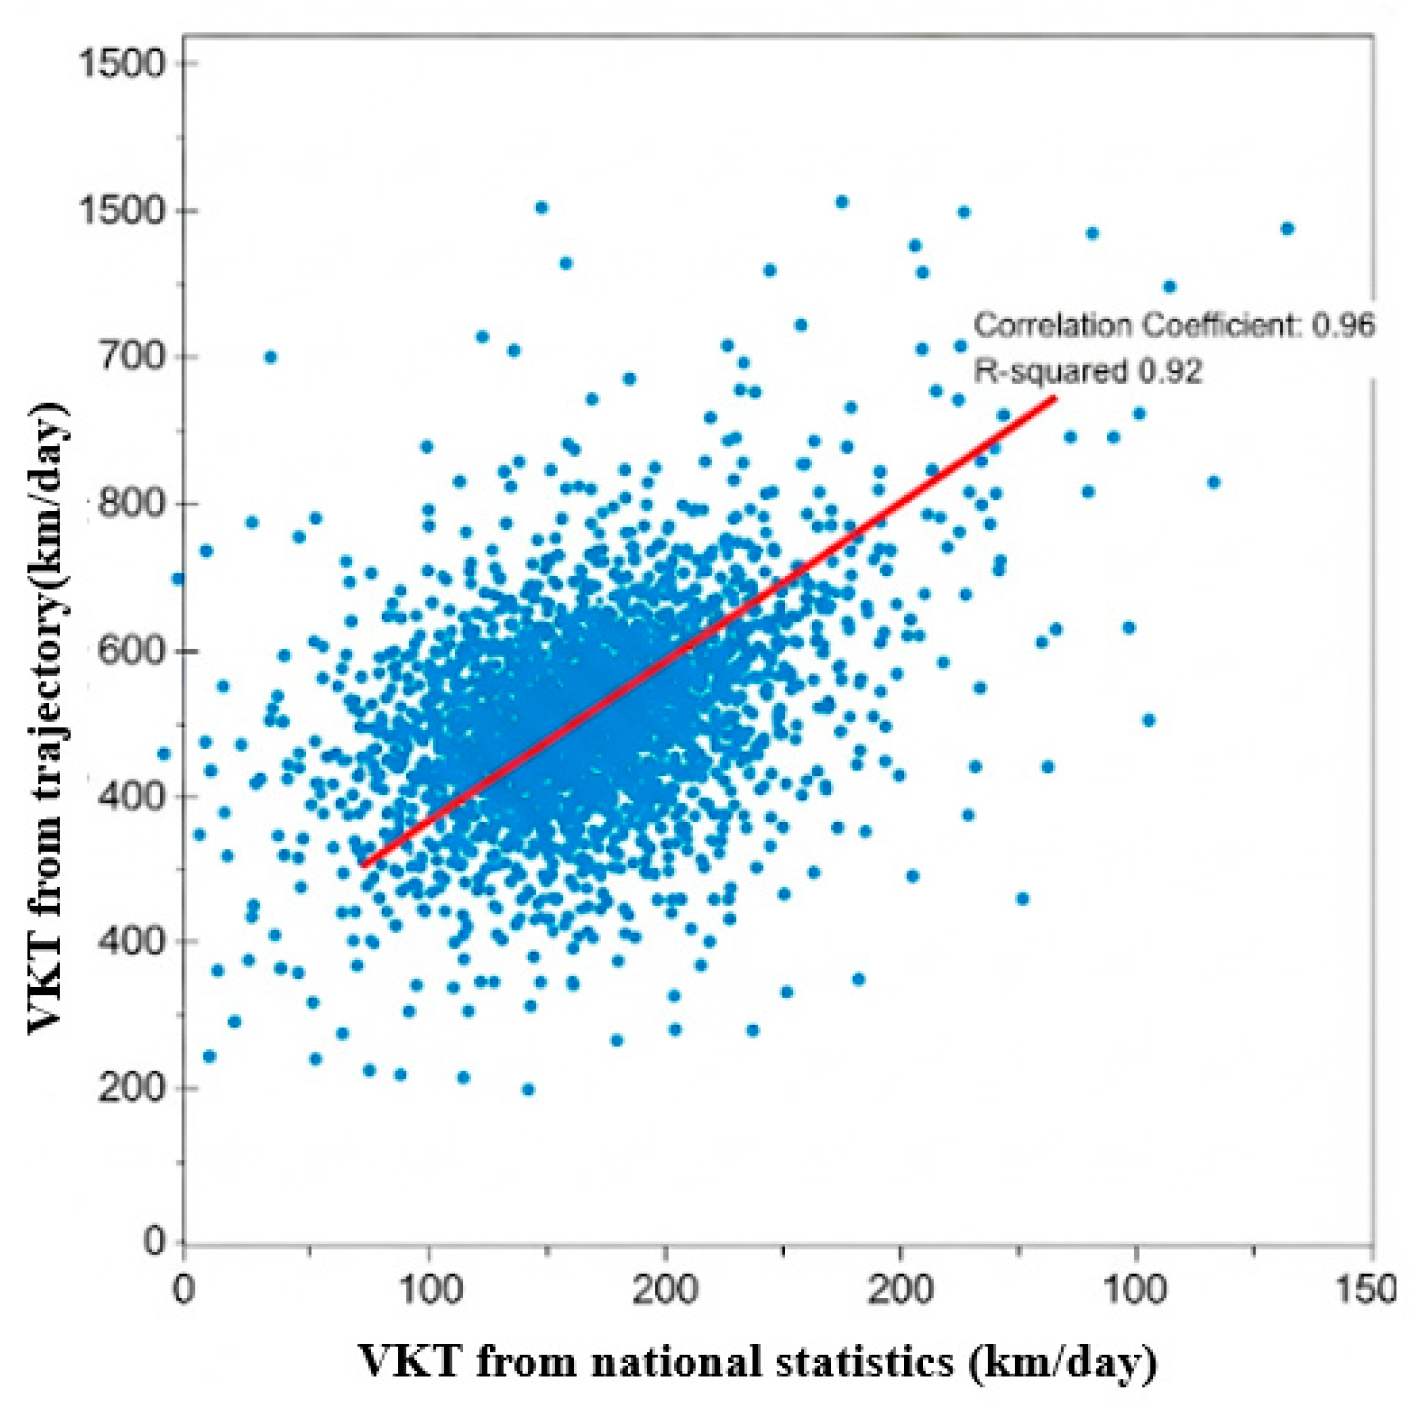
- The Pearson correlation coefficient (r) was calculated to assess the linear relationship between two datasets. The correlation of r = 0.96 reflected a close alignment of the daily variation patterns, as illustrated in the scatter plot in Figure 7. The coefficient of determination (R-squared value) was 0.92, indicating that 92% of the variance in the trajectory-based VKT was explained by the national statistical VKT. With a p-value of less than 0.001, the correlation was highly statistically significant.
- 3.
- A paired t-test was used to assess the significance of the mean difference between the estimated and actual values. The test yielded t = −0.57, with a p-value of 0.57. At a significance level of 0.05, the difference in the means was not statistically significant, suggesting that the representative path-based VKT estimates were comparable to the external statistical values.
- 4.
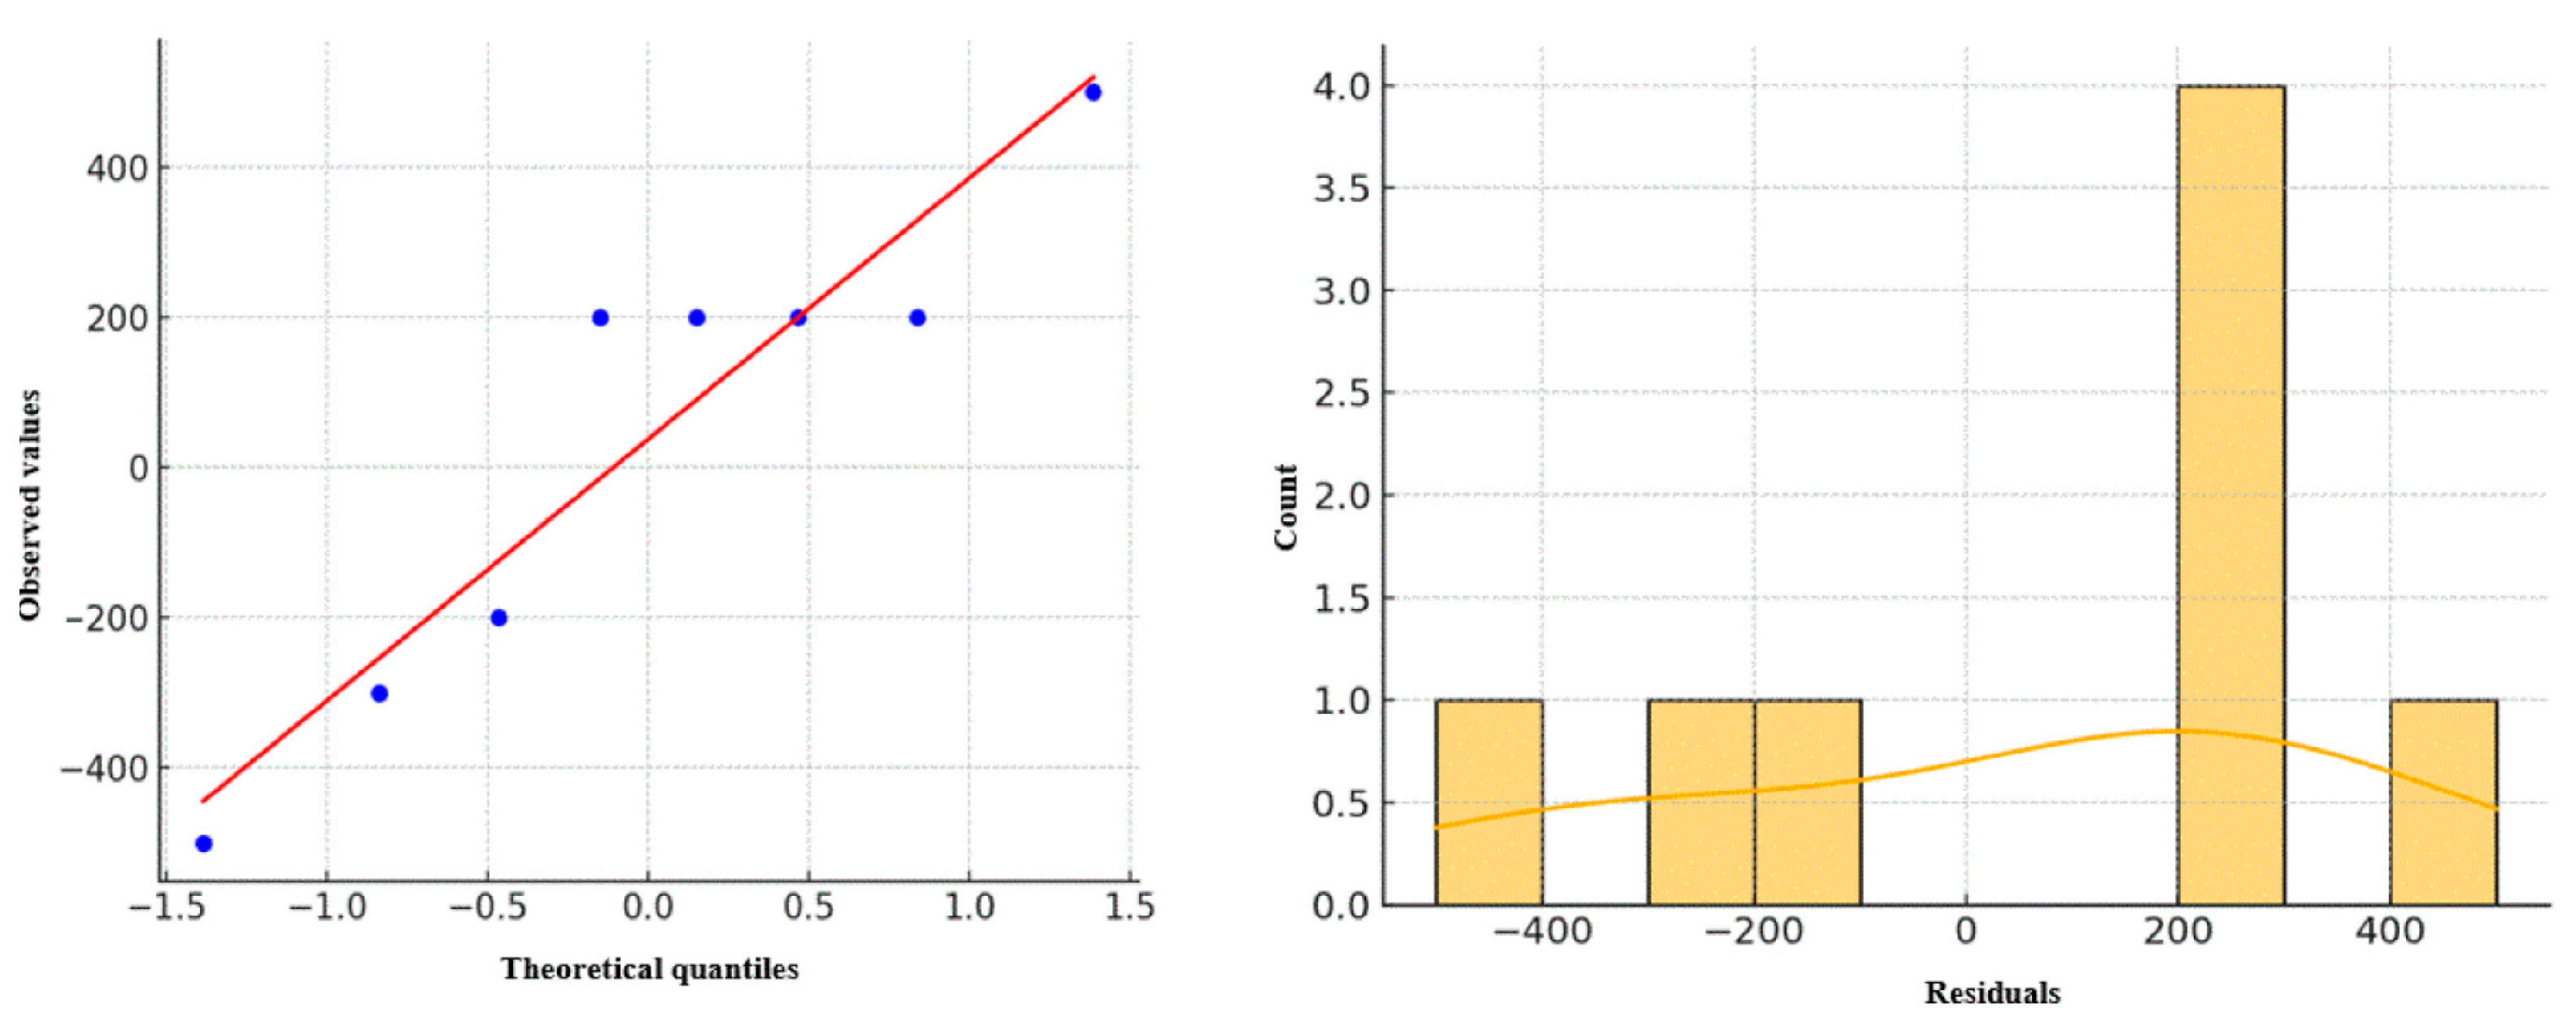
- Residual analysis was performed to further evaluate the predictive stability and validity of the model. The results showed that the prediction errors (residuals) were distributed approximately symmetrically around a mean of zero. The Q–Q plot in Figure 8 confirmed that the residuals satisfied the normality assumption: the red line represents the theoretical quantiles under perfect normality, while the blue dots denote the observed residual quantiles. Their close alignment demonstrates that the residuals closely follow a normal distribution. In addition, the histogram of residuals is displayed with yellow bars, and the overlaid yellow curve provides a kernel density estimation, offering a smooth approximation of the residual distribution. Overall, the prediction errors were randomly distributed without systematic bias, thereby supporting the stability and validity of the proposed estimation model.
4.5. Uncertainty and Sensitivity Analysis
4.5.1. Statistical Reliability Validation of the CET Metric
4.5.2. Correction and Sensitivity Analysis for Spatiotemporal Differences
4.5.3. Discussion and Implications
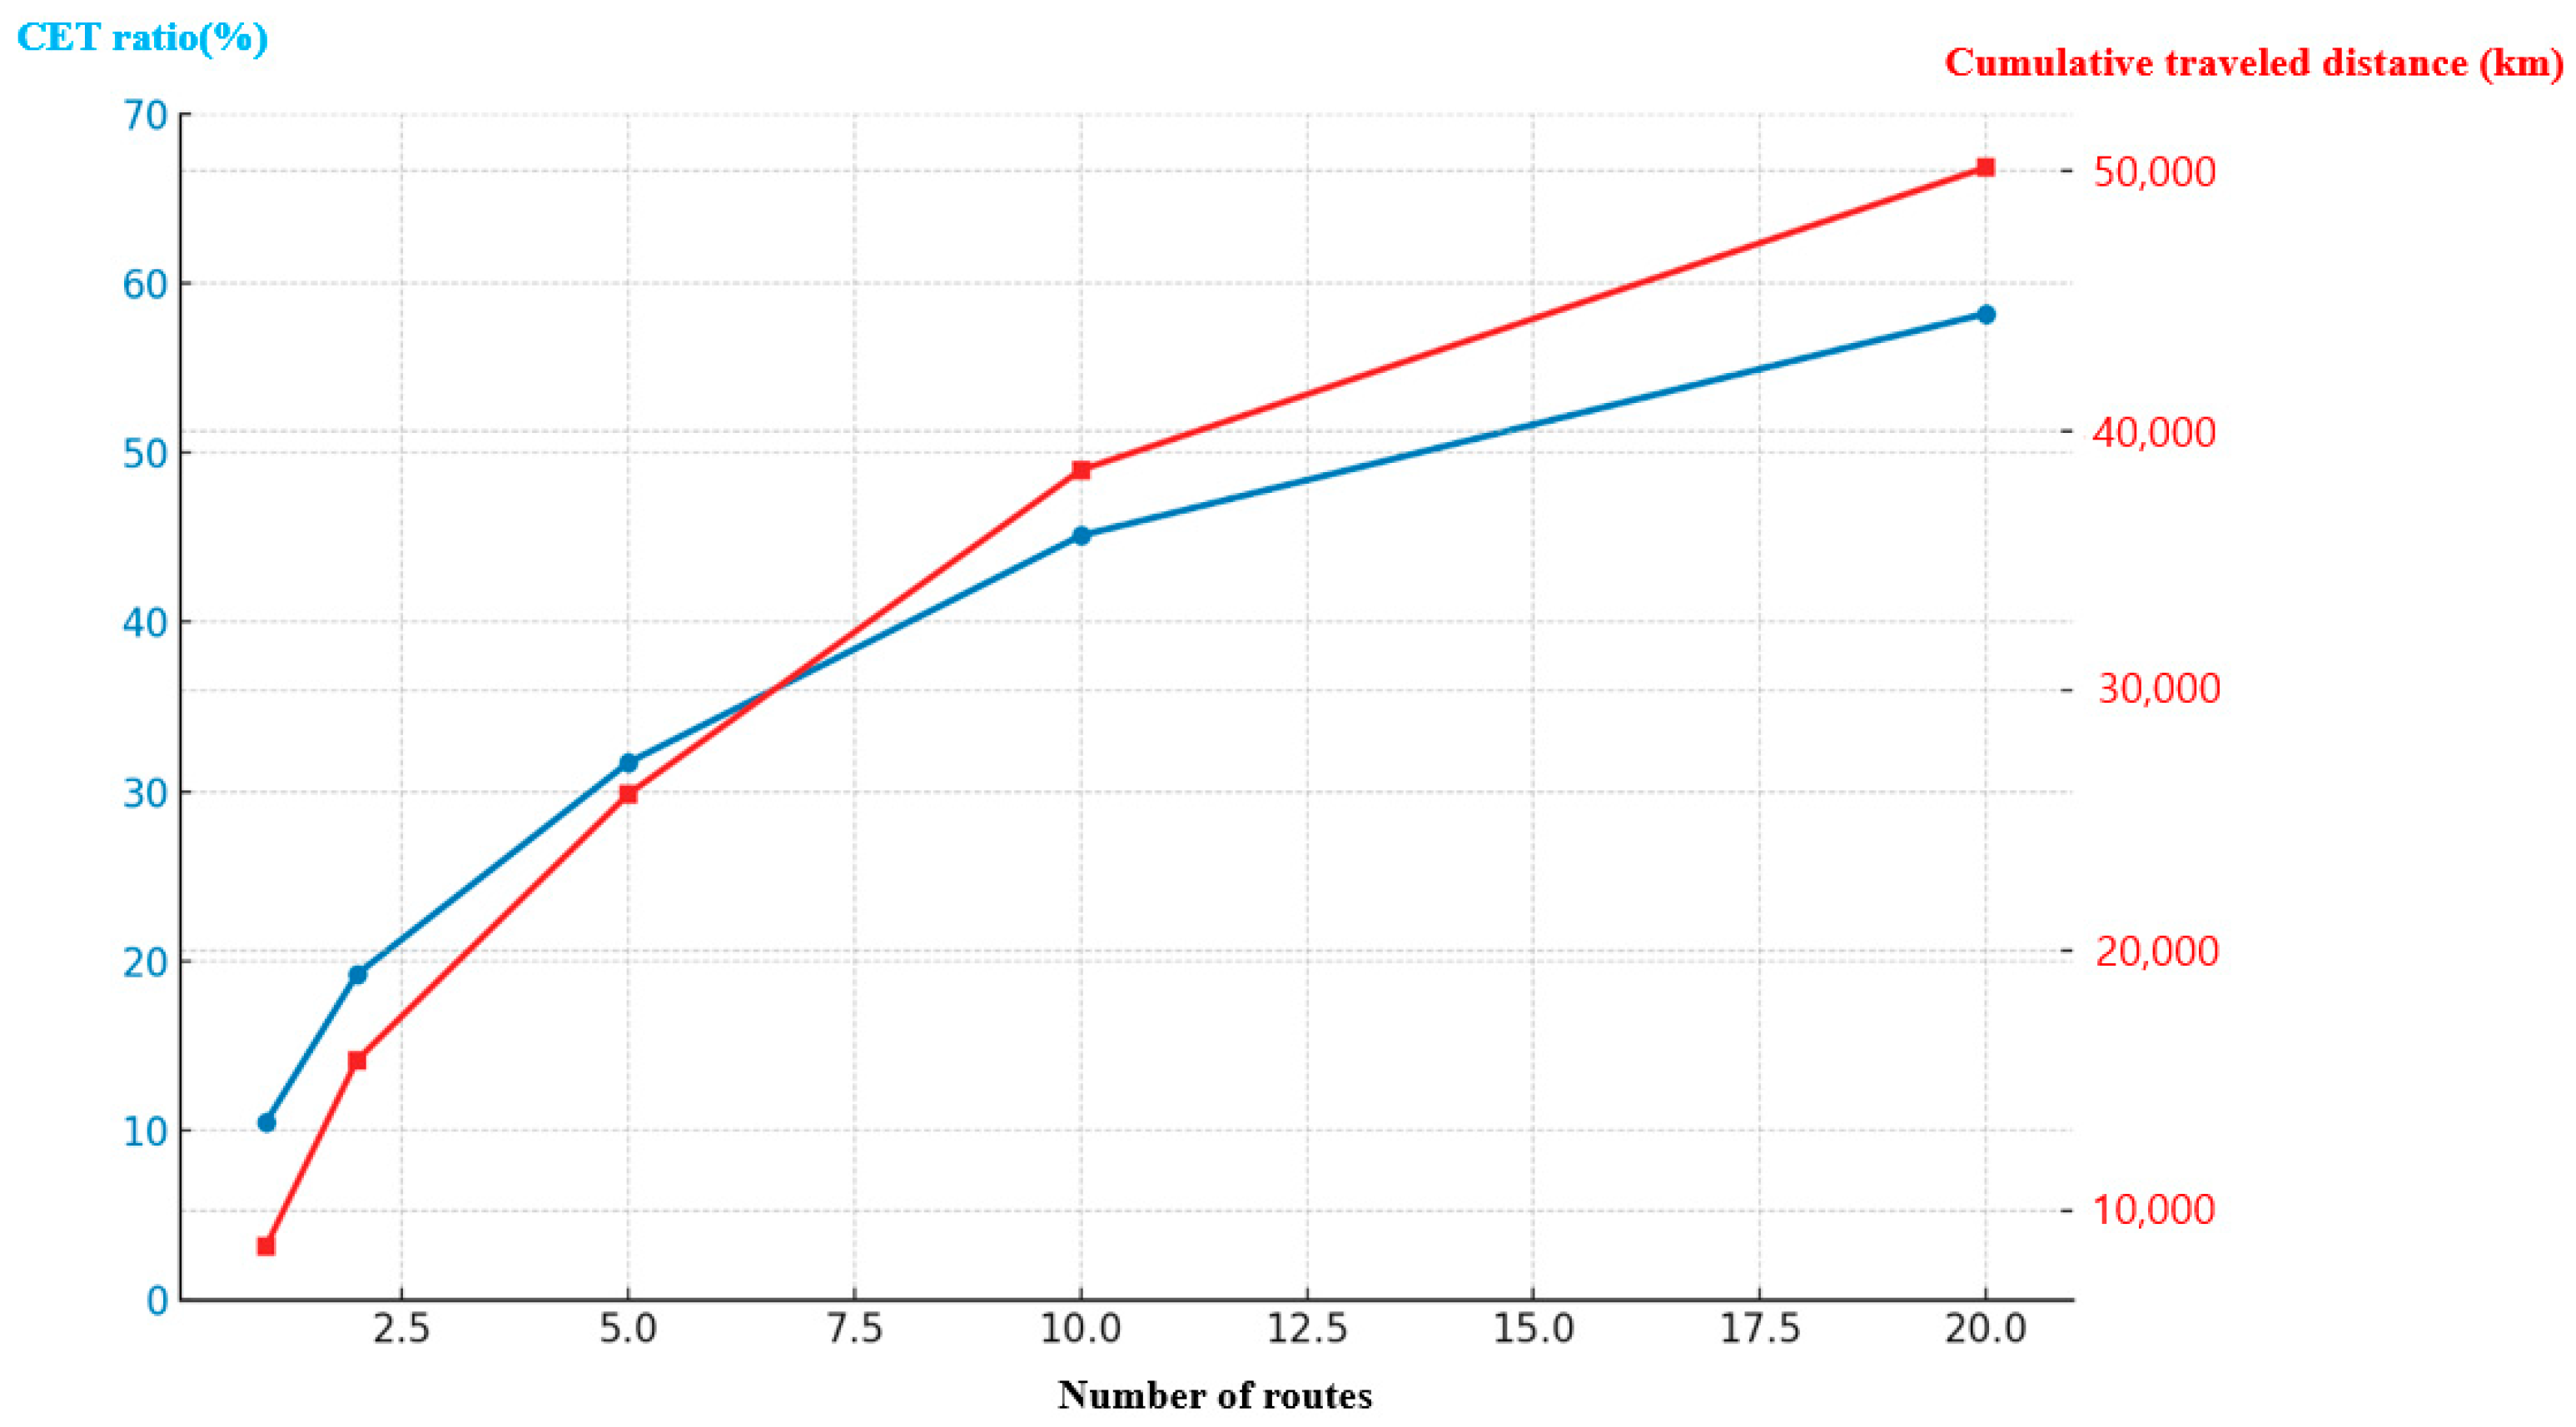
- This study formulated the CET metric to quantitatively evaluate the explanatory power of representative paths by measuring the proportion of actual VKT they account for. The analysis demonstrated that a small set of representative paths (N = 5) accounted for 83.3% of the total VKT, thereby significantly enhancing data efficiency and practical applicability.
- The total VKT estimates derived using the CET metric exhibited a low relative error rate of 1.7% and strong correlation (r = 0.96) with the 2023 national statistical values. These results validate the accuracy and stability of the representative path-based estimation method. They also indicate that trajectory data can serve as an effective alternative to traditional statistical approaches, while providing higher spatial resolution and greater potential for time-series analysis.
- High-resolution travel behavior-based analysis enables a microscopic understanding of urban mobility patterns. This capability has substantial potential for diverse applications, including smart traffic management, environmental emission tracking, and targeted policy formulation. In particular, the ability of the method to capture real-time traffic conditions and support policy simulations indicates its value as an innovative tool for urban traffic planning and environmental management.
5. Conclusions and Future Work
- (1)
- Refined temporal and vehicle-type analysis: Incorporate seasonal and time-of-day variations along with the distinct travel characteristics of different vehicle types using more granular trajectory data and vehicle classification methods.
- (2)
- Dynamic network integration: Enhance the framework to reflect changes in the road network, such as new road construction or closures to improve the long-term predictive accuracy.
- (3)
- Data fusion and correction techniques: Overcome the limitations of low penetration rates by combining trajectory data with other data sources and applying advanced correction methods.
- (4)
- Enhanced representative path selection: Move beyond a purely traffic volume-centric approach toward a multi-criteria decision-making framework incorporating factors such as travel time and congestion levels.
Funding
Institutional Review Board Statement
Informed Consent Statement
Data Availability Statement
Acknowledgments
Conflicts of Interest
Abbreviations
| CET | Coverage of estimated travel |
| CI | Confidence interval |
| FCD | Floating car data |
| GPS | Global positioning system |
| MAUP | Modifiable areal unit problem |
| MAPE | Mean absolute percentage error |
| MRE | Mean relative error |
| OD | Origin destination |
| ODD | Out-of-distribution |
| VKT | Vehicle kilometers traveled |
References
- Korea Transport Institute. Guidelines for Greenhouse Gas Emissions Estimation in the Transport Sector. Korea Transport Database (KTDB). 2020 in Korean. Available online: https://www.ktdb.go.kr/ (accessed on 10 August 2025).
- Federal Highway Administration. 2017 National Household Travel Survey: Summary of Travel Trends. 2017; U.S. Department of Transportation: Washington, DC, USA, 2017.
- Hillel, B.-G. Traffic assignment by paired alternative segments. Trans. Rec. Part B 2010, 44, 1022–1046. [Google Scholar] [CrossRef]
- Kumar, A.; Peeta, S. Entropy weighted average method for the determination of a single representative path flow solution for the static user equilibrium traffic assignment problem. Trans. Rec. Part B 2015, 71, 213–229. [Google Scholar] [CrossRef]
- Buzzelli, M. Modifiable areal unit problem. Int. Encycl. Hum. Geogr. 2019, 4, 169–173. [Google Scholar] [CrossRef]
- Chen, X.; Ye, X.; Widener, M.J.; Delmelle, E.; Kwan, M.; Shannon, J.; Racine, E.F.; Adams, A.; Liang, L.; Jia, P. A systematic review of the modifiable areal unit problem in community food environmental research. Urban Inform. 2022, 1, 22. [Google Scholar] [CrossRef]
- Fan, J.; Fu, C.; Stewart, K.; Zhang, L. Using big GPS trajectory data analytics for vehicle miles traveled estimation. Trans. Rec. Part C 2019, 103, 298–307. [Google Scholar] [CrossRef]
- Gurram, S.; Sivaraman, V.; Apple, J.T.; Pinjari, A.R. Agent-based modeling to simulate road travel using big data from smartphone GPS: An application to the continental United States. In Proceedings of the 2019 International Conference on Big Data (Big Data), Los Angeles, CA, USA, 9–12 December 2019; pp. 3553–3562. [Google Scholar]
- Aslanyan, T.; Jiang, S. Examining passenger vehicle miles traveled and carbon emissions in the Boston metropolitan area. In Urban Informatics and Future Cities; Geertman, S., Pettit, C., Goodspeed, R., Staffans, A., Eds.; Springer Nature: Cham, Switzerland, 2021; pp. 319–340. [Google Scholar] [CrossRef]
- Sunderrajan, A.; Viswanathan, V.; Cai, W.; Knoll, A. Traffic state estimation using floating car data. Procedia Comput. Sci. 2016, 80, 2008–2018. [Google Scholar] [CrossRef]
- Wang, T.; Huang, S.; Bao, Z.; Culpepper, J.S.; Arablouei, R. Representative routes discovery from massive trajectories. In Proceedings of the 28th ACM SIGKDD Conference on Knowledge Discovery and Data Mining, Walter E. Washington Convention Center, Washington, DC, USA, 14–15 August 2022; pp. 4059–4069. [Google Scholar]
- Nanne, J.; Van Der Zijpp, N. Dynamic origin-destination matrix estimation from traffic counts and automated vehicle identification data. Trans. Res. Rec. 1997, 1607, 87–94. [Google Scholar]
- McNally, M.G. The Four-Step Model; UC Irvine Institute of Transportation Studies, Center for Activity Systems Analysis, University of California: Irvine, CA, USA, 2008. [Google Scholar]
- Osorio, C. Dynamic origin-destination matrix calibration for large-scale network simulators. Trans. Rec. Part C 2019, 98, 186–206. [Google Scholar] [CrossRef]
- Yu, H.; Zhu, S.; Yang, J.; Guo, Y.; Tang, T. A Bayesian method for dynamic origin-destination demand estimation synthesizing multiple sources of data. Sensors 2021, 21, 4971. [Google Scholar] [CrossRef]
- Englezou, Y.; Timotheou, S.; Panayiotou, C.G. Dynamic origin-destination matrix estimation for networks operating under free-flow conditions using macroscopic flow dynamics. IFAC-PapersOnLine 2024, 58, 213–218. [Google Scholar] [CrossRef]
- Ma, W.; Pi, X.; Qian, S. Estimating multi-class dynamic origin-destination demand through a forward-backward algorithm on computational graphs. Trans. Res. Part C 2020, 119, 102747. [Google Scholar] [CrossRef]
- Ramussen, T.K.; Duncan, L.C.; Watling, D.P.; Nielsen, O.A. Local detourness: A new phenomenon for modeling route choice and traffic assignment. Trans. Res. Part B 2024, 190, 103052. [Google Scholar] [CrossRef]
- Tang, W.; Chen, J.; Sun, C.; Wang, H.; Li, G. Traffic demand estimations considering route trajectory reconstruction in congested networks. Algorithms 2022, 15, 307. [Google Scholar] [CrossRef]
- Mazimpaka, J.D.; Timpf, S. Trajectory data mining: A review of methods and applications. J. Spat. Inf. Sci. 2016, 13, 61–99. [Google Scholar] [CrossRef]
- Feng, Z.; Zhu, Y. A survey on trajectory data mining: Techniques and applications. IEEE Access 2016, 4, 2056–2067. [Google Scholar] [CrossRef]
- Wang, D.; Miwa, T.; Morikawa, T. Big trajectory data mining: A survey of methods, applications, and services. Sensors 2020, 20, 4571. [Google Scholar] [CrossRef] [PubMed]
- Toole, J.L.; Colak, S.; Sturt, B.; Alexander, L.P.; Evsukoff, A.; Gonzalez, M.C. The path most traveled: Travel demand estimation using big data resources. Trans. Res. Part B 2015, 58, 162–177. [Google Scholar] [CrossRef]
- Chong, K. Spatiotemporal influence analysis through traffic speed pattern analysis using spatial classification. Appl. Sci. 2025, 15, 196. [Google Scholar] [CrossRef]
- Kim, H.M.; Nam, D.; Cheon, S. Determination of representative path set from vehicle trajectory samples. J. Comput. Civ. Eng. 2016, 30, 04015052. [Google Scholar] [CrossRef]
- Liu, H.; Han, J.; Fu, Y.; Li, Y.; Chen, K.; Xiong, H. Unified route representation learning for multi-modal transportation recommendation with spatiotemporal pretraining. VLDB J. 2022, 32, 325–342. [Google Scholar] [CrossRef]
- Lu, C.C.; Mahmassani, H.S.; Zhou, X. A bi-criterion dynamic user equilibrium traffic assignment model and solution algorithm for evaluating dynamic road pricing strategies. Trans. Rec. Part C 2008, 16, 371–389. [Google Scholar] [CrossRef]
- Lan, S. Path optimization and logistics economic benefits based on sparsely sampled GPS trajectory data. Mob. Inf. Syst. 2022, 2022, 3350120. [Google Scholar] [CrossRef]
- Hu, Y.; Huang, H.; Lee, J.; Yuan, C.; Zou, G. A high-resolution trajectory data driven method for real-time evaluation of traffic safety. Accid. Anal. Prev. 2022, 165, 106503. [Google Scholar] [CrossRef]
- Wang, Y.; Qin, K.; Chen, Y.; Zhao, P. Detecting anomalous trajectories and behavior patterns using hierarchical clustering from taxi GPS data. ISPRS Int. J. Geo-Inf. 2018, 7, 25. [Google Scholar] [CrossRef]
- Liu, L.; Han, K.; Chen, X.; Ong, G.P. Spatial-temporal inference of urban traffic emissions based on taxi trajectories and multi-source urban data. Trans. Res. Part C 2019, 106, 145–165. [Google Scholar] [CrossRef]
- Sun, Z.; Hao, P.; Ban, X.; Yang, D. Trajectory-based vehicle energy/emissions estimation for signalized arterials using mobile sensing data. Trans. Res. Part D 2015, 34, 27–40. [Google Scholar] [CrossRef]
- Wang, X.; Jerome, Z.; Zhang, C.; Shen, S.; Kumar, V.V.; Liu, H.X. Trajectory data processing and mobility performance evaluation for urban traffic networks. Trans. Res. Rec. 2022, 2677, 355–370. [Google Scholar] [CrossRef]
- Aani, C.; Bhaskar, A.; Haque, M. Bi-level clustering of vehicle trajectories for path choice set and its nested structure identification. Trans. Res. Part C 2022, 144, 103895. [Google Scholar] [CrossRef]
- Kim, M.; Kwak, B.L.; Hou, J.; Kim, T. Robust long-term vehicle trajectory prediction using link projection and a situation-aware transformer. Sensors 2024, 24, 2398. [Google Scholar] [CrossRef]
- Yang, X.; Lu, Y.; Hao, W. Origin-destination estimation using probe vehicle trajectory and link counts. J. Adv. Transp. 2017, 2017, 4341532. [Google Scholar] [CrossRef]
- Cao, Y.; Tang, K.; Sun, J.; Ji, Y. Day-to-day dynamic origin-destination flow estimation using connected vehicle trajectories and automatic vehicle identification data. Trans. Rec. Part C 2021, 129, 103241. [Google Scholar] [CrossRef]
- Chen, Z.; Huang, H.-Z.; Deng, Z.; Wu, J. Shrinkage mamba relation network with out-of-distribution data augmentation for rotating machinery fault detection and localization under zero-faulty data. Mech. Syst. Signal Process 2025, 224, 112145. [Google Scholar] [CrossRef]
- Chen, Z.; Huang, H.-Z.; Wu, J.; Wang, Y. Zero-faulty sample machinery fault detection via relation network with out-of-distribution data augmentation. Eng. Appl. Artif. Intell. 2025, 141, 109753. [Google Scholar] [CrossRef]

| Data Source | Statistical Item | Value | Remarks |
|---|---|---|---|
| Statistics Korea (Bucheon) | Number of Registered Vehicles | Approximately 350,000 vehicles | As of May, 2023 |
| Ministry of Land, Infrastructure and Transport | Average Daily Driving Distance by Vehicle Type in Nationwide/Capital Area | Approximately 40 km/day | Average Value based on 2023 Data |
| This study (Estimate) | Estimated Total Daily Driving Distance | Approximately 14 million km | Calculated as 350,000 vehicles × 40 km/day |
| Statistical Item | Data Composition and Characteristics |
|---|---|
| OD data | The dataset consists of over 90,000 point-to-point OD pairs, each including information on origin, destination, travel time, and travel route. |
| Trajectory data | Road link sequences associated with each OD pair are provided, which allow for total travel distance estimation by summing the lengths of the constituent links. |
| Link information | Link IDs and their corresponding lengths are defined in the proprietary navigation road network, representing the comprehensive local road infrastructure of Bucheon. |
| Category | Detailed Description |
|---|---|
| Analysis tools | Python 3.11 (Pandas, GeoPandas), QGIS 3.36, PostgreSQL 14 (PostGIS). |
| System environment | Intel Core i9, 64 GB RAM, Windows 11. |
| Analysis period | May to July 2025. |
| Data Field | Description |
|---|---|
| Date of travel | Date on which the trip was made (for instance, 1 January 2025) |
| Origin information | Names of the origin city/province and district. |
| Destination information | Destination name and coordinates (X, Y) |
| Destination address | Street and lot number addresses of the destination |
| Arrival times | Arrival times for each destination (up to 3 destinations per trip) |
| Next destination details | Name of the next destination and the number of subsequent arrivals. |
| Data period | Year and month of the trip (for example, January 2025) |
Disclaimer/Publisher’s Note: The statements, opinions and data contained in all publications are solely those of the individual author(s) and contributor(s) and not of MDPI and/or the editor(s). MDPI and/or the editor(s) disclaim responsibility for any injury to people or property resulting from any ideas, methods, instructions or products referred to in the content. |
© 2025 by the author. Licensee MDPI, Basel, Switzerland. This article is an open access article distributed under the terms and conditions of the Creative Commons Attribution (CC BY) license (https://creativecommons.org/licenses/by/4.0/).
Share and Cite
Yang, C. Coverage-Based Framework for Estimating Total Vehicle Travel Distance Using Point-to-Point Trajectory Data. Appl. Sci. 2025, 15, 10325. https://doi.org/10.3390/app151910325
Yang C. Coverage-Based Framework for Estimating Total Vehicle Travel Distance Using Point-to-Point Trajectory Data. Applied Sciences. 2025; 15(19):10325. https://doi.org/10.3390/app151910325
Chicago/Turabian StyleYang, Choongheon. 2025. "Coverage-Based Framework for Estimating Total Vehicle Travel Distance Using Point-to-Point Trajectory Data" Applied Sciences 15, no. 19: 10325. https://doi.org/10.3390/app151910325
APA StyleYang, C. (2025). Coverage-Based Framework for Estimating Total Vehicle Travel Distance Using Point-to-Point Trajectory Data. Applied Sciences, 15(19), 10325. https://doi.org/10.3390/app151910325


