1. Introduction
Wind turbine blades and air-cooled condenser fan blades are typically made by composites, such as glass fiber reinforced polymer (GFRP) or carbon fiber reinforced polymer (CFRP), and are often subjected to complex loading conditions during the actual operation, including cyclic fatigue, thermal expansion, and other environmental or mechanical influences [
1]. These factors can give rise to a variety of damage forms, such as surface and subsurface cracks, inter-laminar delamination, and matrix micro cracks. If these defects cannot be detected and addressed in time, such defects can seriously affect the structural integrity and aerodynamic performance of the blades and even result in structural failure [
2]. Therefore, it is essential to evaluate and detect the severity of cracks on blades using non-destructive testing techniques and to classify the cracks as early, middle, and late stages. This classification can provide guidance for industry, enabling informed decisions on whether and when maintenance, repair or replacement actions are necessary.
Currently, several NDT/E techniques have been applied to the inspection of cracks in GFRP/CFRP composite materials, such as ultrasonic testing (UT) [
3,
4], X-ray radiography [
5], infrared thermography [
6], and eddy-current testing [
7]. For example, Tiwari et al. employed both contact and air-coupled ultrasonic guided wave testing to detect disbond and crack defects in GFRP wind turbine blades. By applying signal refinement techniques such as discrete wavelet transforms and spectral analysis, they were able to estimate defect size and location [
3]. A recent Special Issue in Applied Sciences edited by Darmon provides a comprehensive overview of current ultrasonic techniques for NDT, covering both methodological advances and diverse applications [
4]. Kupsch et al. employed in situ X-ray refraction imaging to track crack initiation and propagation in carbon fiber reinforced plastics (CFRP); the result demonstrated that crack behavior strongly depends on fabric architecture and this technique enables the detection of micro cracks not visible with conventional X-ray absorption techniques [
5]. Panella et al. applied an active infrared thermography technique combined with a novel local boundary contrast processing method to detect subsurface defects in GFRP materials, improving the capability in identifying defect boundaries with higher accuracy [
6]. Machado et al. developed a customized non-contact eddy-current probe for high-speed detection of delamination in unidirectional CFRP tension members. The probe used two in-line coils with opposite current at 1 MHz to force eddy currents perpendicular to the fibers, making the response sensitive to transverse-conductivity changes caused by delamination; the design was validated experimentally on real CFRP components [
7].
Although the ultrasonic method offers good depth resolution, it often requires point-by-point scanning and applying a couplant; this means that the ultrasonic technique is less suitable for inspection of large, complex structures and components. X-ray based techniques can detect internal features, but may involve safety concerns, high cost, and limited portability in field conditions. Infrared thermography, especially in its active form, provides rapid full-field assessment, but its sensitivity highly depends on thermal contrast and surface emissivity, while subsurface defects with small thermal gradients cannot be detected. For eddy-current testing, the probe’s operating principle requires establishing stable eddy-current loops in the sample, so it is limited to electrically conductive materials, e.g., metals, CFRP. Unlike CFRP, the GFRP materials we studied in this paper are electrically insulating composites; effective eddy currents cannot be induced, making the method essentially inapplicable.
Digital shearography, a laser interferometry-based nondestructive testing technology, allows non-contact, full-field measurement subsurface defects by visualizing strain anomalies under a small loading. Because of its ability to capture fine surface strain distribution, this technique is especially useful for detecting cracks and delaminations in composite materials without relying on physical contact, point-by-point scanning, or a radiation-based system. Digital shearography utilizes a digital camera integrated with real-time acquisition and a digital subtract as well as digital processing algorithms, such as temporal or spatial phase shift technologies, allowing for rapid detection and quantitative evaluation of surface strain distribution [
8,
9]. In the past two decades, this technique has been widely applied in the non-destructive testing of composite materials [
10,
11,
12,
13]. Typical applications include the detection of disbonds in honeycomb structures and the detection of interlaminar delaminations in fiber-reinforced composites such as GFRP and CFRP [
14,
15,
16,
17]. For composite made blades, such as wind turbine blades and air-cooled condenser fan blades, digital shearography serves as an effective method to detect the cracks on the surface and subsurface. Akbari and Soltani [
18] investigated the influence of crack length, orientation, and mechanical loading parameters on the detectability of cracks in composite materials using shearography. While the study was based on a tensile test, the results obtained may provide valuable insights for fundamental study, but are not suited for practical applications. This is because samples cannot be cut to fit the tensile machine in a practical application. Farshi and Akbari [
19] explored NDE of internal cracks in glass fiber-reinforced epoxy (GRE) pipes by integration of digital shearography and FEM. A model for quantitative evaluation of subsurface cracks on GRE pipes was developed. In this study, cracks were assumed to already generate obvious butterfly, i.e., the cracks in the research were assumed to already generate significant strain concentrations. It may be effective to find late-stage cracks but is not suited for finding early and middle stage cracks because the cracks in these stages may not have significant strain concentrations. Fröhlich et al. proposed a machine learning-assisted approach using convolutional neural networks (CNNs) to classify major and minor defects in shearography images of pipes repaired with glass fiber patches [
20]. Although their method achieved up to 79% classification accuracy, its applications are limited to specific applications. The most important aspect of conducting such a kind of study is that large quantities of training images with different materials, surface curvatures, loading methods, and shear directions, etc., are required to build a robust model. This may limit their practical applicability in our research/industrial scenarios as only limited samples and parameters can be provided.
In this research, a crack classification method based on digital shearography was proposed, where crack severity was determined based on the degree of localized strain concentration. First, artificial cracks with varying sizes and depths were inspected using digital shearography under thermal loading to observe the strain distribution in the shearograms at the early stage of the cracks. Subsequently, fatigue testing with dynamic three-point bending was conducted, and the shearographic testing was applied at the different fatigue cycles to observe the evolution of the strain distribution in shearograms at the middle and late stages. The results of the shearograms show that the strain concentration is not obvious in the early stage of cracks, but is particularly obvious and spreads widely in the late stage. The strain concentration is visible in the middle stage, but the spread is not large.
During the shearographic test, thermal loading was applied; the advantage of thermal loading is that it allows heat to penetrate to the internal cracks, making both shallow and deep cracks detectable through surface strain measured by shearography. To achieve this, the sample should be heated for a certain time which can be estimated by an introduced thermomechanical model. Based on the degree of the strain concentrations, cracks can be classified as early, middle, and late stages, respectively. The testing strategy was then applied to several parts of ACC fan blades made of GFRP from industry for NDE of crack classification. The testing principle and methodology are now described and demonstrated through case studies of non-destructive testing and evaluation (NDT/E) for various crack conditions.
2. Brief Introduction of Shearography
Shearography is an optical measurement method based on the principle of laser interference. The core of this technology is to set a shearing device (optical wedge, or Wollaston prism, or Michelson interferometer, etc.) in front of the camera so that the rays forming two adjacent points on the surface of the object can be imaged at the same point on the camera, resulting in the interference. Digital shearography is a digital version of shearography which has no difference in optical layout, but in digital shearography, all images are digitized, including recording, processing, and reconstruction through special software and algorithms, allowing for rapid detection and quantitative evaluation of surface strain distribution.
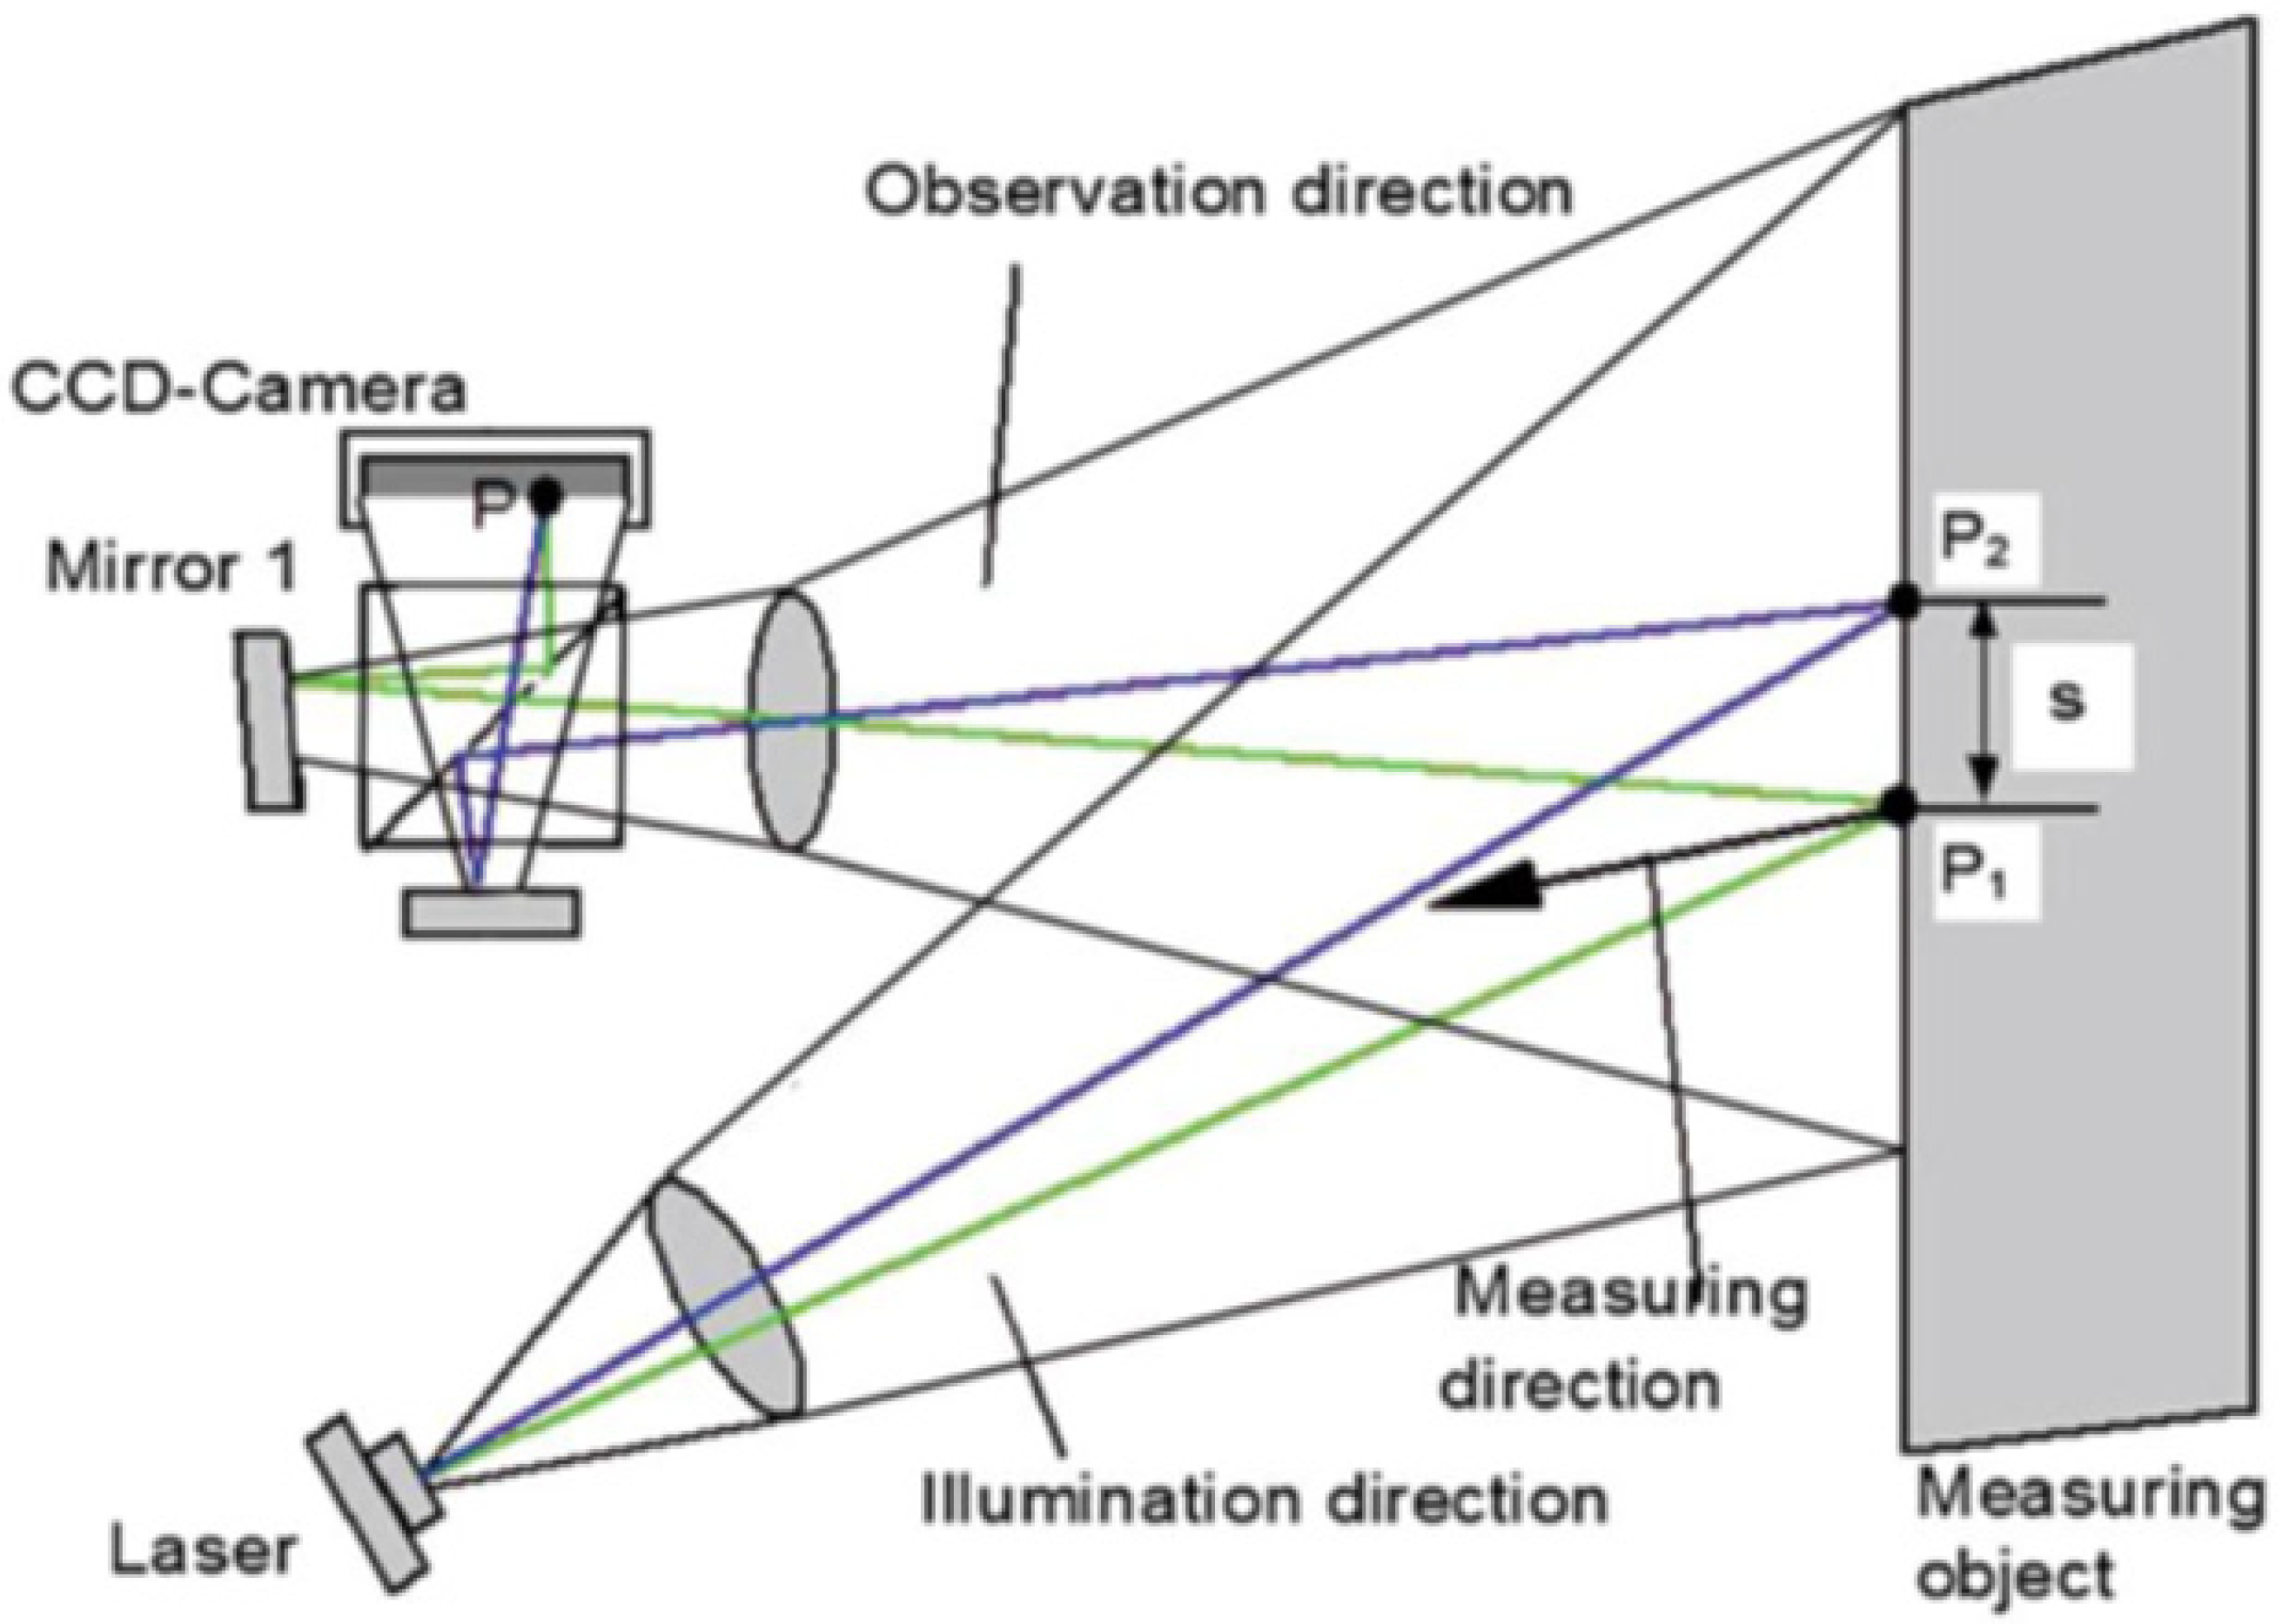
Figure 1 shows a typical shearographic system based on a modified Michelson interferometer as the shearing device. A coherent laser illuminates the rough surface of the object to form a speckle pattern. When the mirror 1 is tilted at a very small angle, the rays of light from two adjacent points (
and
) on the surface of the object will be guided to the same point on the image plane on the camera and interfere with each other, creating a granular pattern of bright and dark spots, called the speckle pattern or the speckle interferogram. The orientation of the two points is called the shearing direction and the distance between these two points is called the shearing amount. The intensity “
I” of the speckle pattern on the camera can be expressed as follows:
where
A is the background,
B is the modulated term which is related to the image contrast
, and
is the phase difference between two points. After an external loading is applied to the object, the phase difference between the two points changes to
, and the intensity became
I′ and is given by the following:
where
is called the relative phase difference which is related the relative deformation between the two points, and it is directly related to strain information because the strain is equal to the relative deformation between the two points divided by the distance of the two points.
In the digital shearography, intensity I and I’ are digitized which are measurable; however, the relative phase difference
is the quantity which needs to be measured. Methods to measure phase difference from the recorded intensity data are called phase shift technologies [
21,
22]. Temporal phase shifting is the most widely used method for extracting phase information in digital shearography due to its high accuracy and simplicity of implementation [
23,
24,
25,
26,
27]. Because there are three unknowns in the intensity equation as shown in Equations (1) or (2), the principle of temporal phase shifting to measure phases
φ and
φ′ is to capture three or more speckle interferograms in the time series to obtain three or more equations and to solve the phase value by multi-recorded intensity data. During the acquisition process, a known phase is introduced between each frame/image which is typically introduced by translating one of the two mirrors in the Michelson interferometer using a piezoelectric transducer (PZT). For example, in the widely used four-step algorithm, four interferograms are recorded with phase shifts of
,
,
,
, and the intensity can be expressed as follows:
From the four recorded intensities, the phase difference
φ can then be calculated:
Similarly, the phase distribution after deformation φ′ can also be determined by recording another four images. Therefore, the relative phase difference Δφ can quantitatively be determined by the digital subtraction of φ from φ′.
Figure 2 shows the principle of digital shearography for quantitative determination of the relative phase difference Δ
φ. The phase distributions before and after loading
φ and
φ′ measured by the phase shift technology are presented on the left and middle of
Figure 2, respectively. The testing result, i.e., the relative phase difference Δ
φ obtained by a digital subtraction of
φ from
φ′, also called the phase map of the shearogram, is shown on the right of
Figure 2. The sample to be tested is a composite material with two delaminations. The location and the size of the two delaminations are clearly demonstrated by two butter-fly patterns in the phase map of the shearogram.
As indicated above, the relative phase difference Δ
φ is related to the relative deformation between two points. Therefore, Δ
φ reflects the derivatives of the deformation as shown in Equations (5) and (6) [
28]:
where
is the wavelength of the laser,
w is the out-of-plane deformation, and
and
are the shearing amount.
Equations (5) and (6) present the fundamentals of shearography, i.e., shearography measures the gradient of the deformation, which is the strain information, not the deformation itself as occurs with holography. Therefore, the pattern in the defect area looks like a butterfly, rather than a circular pattern in the hologram. Due to the direct measurement of strain, this method has many advantages for NDT/E of industrial applications, such as direct measurement of strain concentration, easily finding defects, relatively insensitive to environmental disturbances, etc. It is well suited for NDT of delaminations and cracks in composite materials
3. Loading Method
In shearographic testing, loading is needed to lead to a surface deformation which allow shearography to find defects by identifying deformation or strain anomalies (strain concentration) caused by internal defects. Because shearography is a laser interferometric method, it has extremely high measuring sensitivity (down to dozens of nanometers), and only a small loading is needed so that the testing is a non-destructive testing. Different loading methods, such as thermal, mechanical, vacuum, acoustical, etc. have been used in shearographic testing. It has been reported that thermal loading is a good method to find both shallow and deep defects in composite materials, because the heat can be transferred inside after waiting for a certain time period [
29]. Furthermore, thermal loading is non-contact and can be easy implemented. Therefore, a thermal loaded digital shearography was employed in this study.
Different heating methods have already been applied in shearographic NDT testing [
30]. A typical heating method is to heat a sample at a constant temperature on the front side of the sample and to stop the heating until the heat has been transferred throughout the entire depth of the sample. The heating diffusion model introduced in the literature [
31] and given by Equation (7) has been used to estimate how high the heating temperature and how long a time are needed to reach a required temperature at the back side:
where
T(
z,
t) is the temperature at heating time
t and depth
z,
Ts and
T0 represent the heating temperature on the front surface and the environment temperature, i.e., the initial temperature on the sample surface, respectively, and erf(
x) is an error function which is used to describe the gradual diffusion of temperature in the depth direction, where
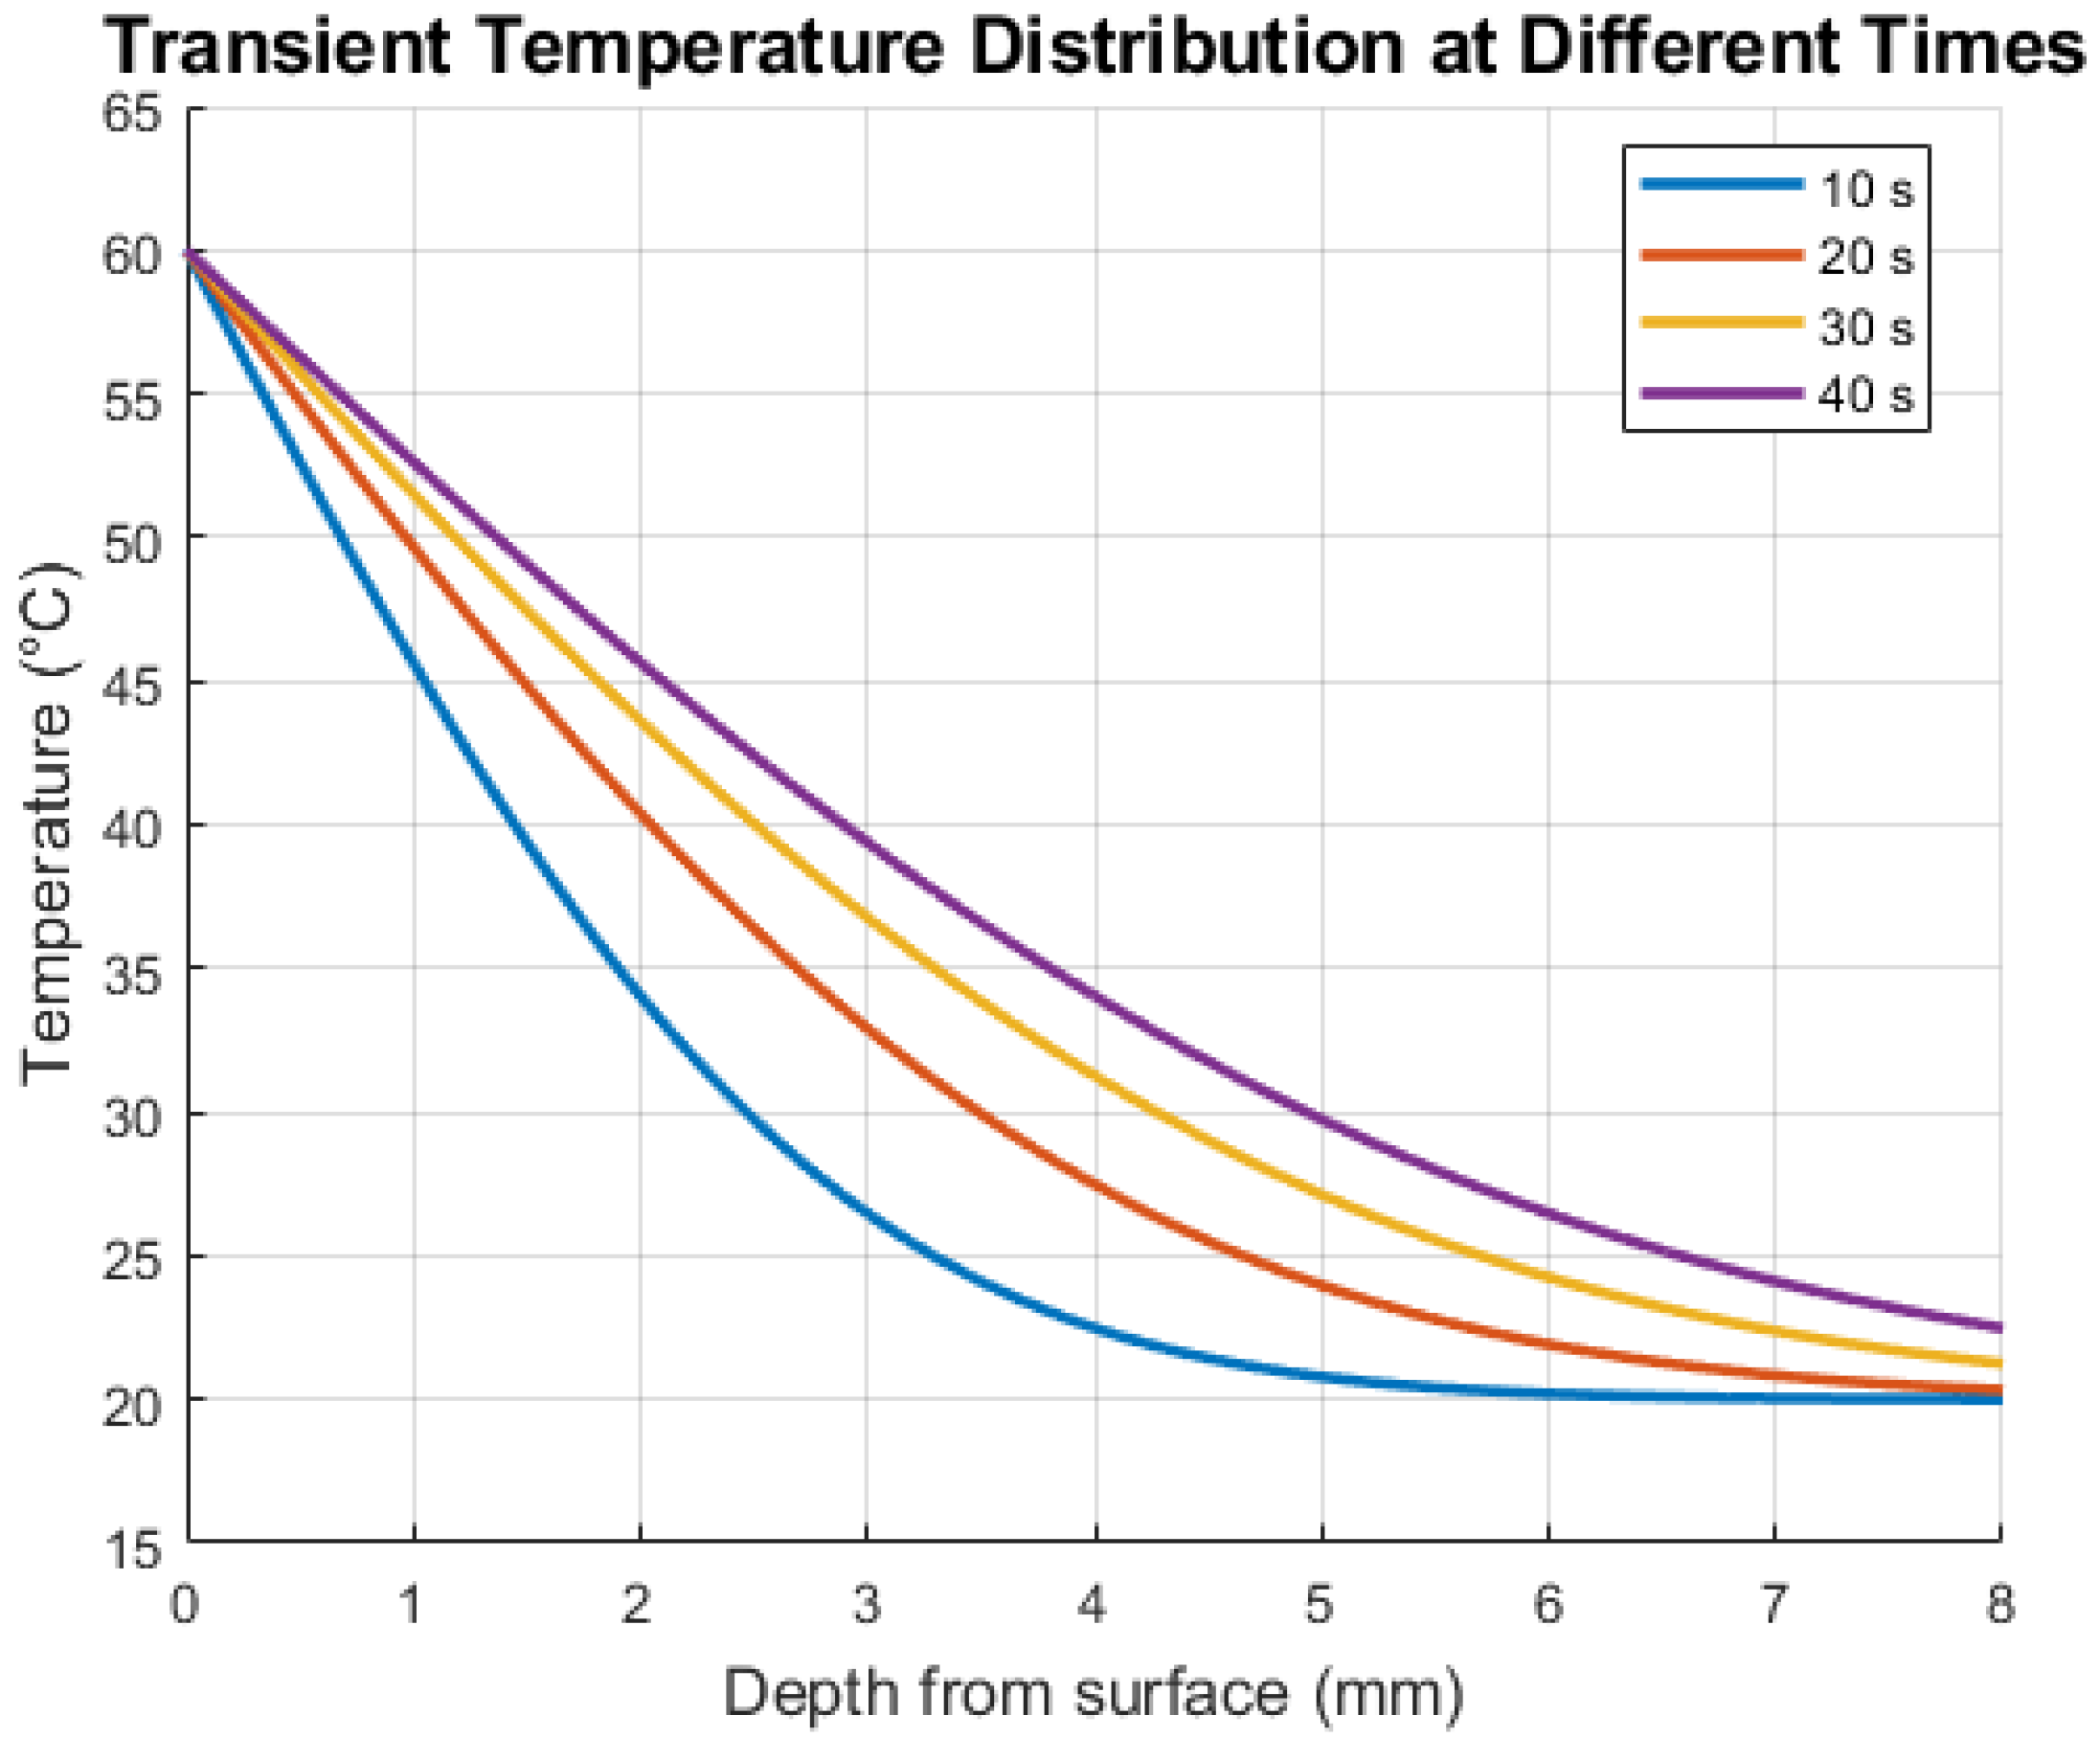
α is the thermal diffusivity of the material to be tested. For a known thermal diffusivity of GFRP (
), four curves which present a relationship between the temperature at a depth with four heating time periods of 10, 20, 30, and 40 s, respectively, are presented in
Figure 3. The curves are obtained at a heating temperature of 60 °C on the front surface. Because of a non-destructive test method and a high measurement sensitivity of shearography, the heating temperature ranging from 40 °C to 80 °C should not damage the GFRP materials but be enough to cause deformation which is measurable by shearography. In this study, a 60 °C heating temperature was used. If the sample thickness is 7 mm, the temperatures on the back surface with the four different heating times can be estimated. Watching the vertical line at the depth of 7 mm, the temperatures at a depth of 7 mm are about 20 (not having spread to the back yet), 21, 23, and 24 °C, corresponding to the heating times of 10, 20, 30, and 40 s, respectively. Of course, a different heating temperature (rather than 60 °C) on the front surface can be applied and will result in different temperatures at different depths. Usually, the thicker the sample, the higher the heating temperature needs to be.
The model and the curves provide a useful estimation of the required heating temperature and time for thermal loaded digital shearography for NDT/E. In the practical applications, proper adjustments are still needed by measuring the front and back surface temperatures using a laser thermometer or a thermocouple. When the heat has been transferred to the entire depth of the specimen, the heating can stop. If the testing is on the front surface where it is heated, the deformation at this time is mainly dominated by the deformation caused by the surface temperature. Thus, the shearography testing should be started later when the surface temperature has basically dissipated and the deformation caused by the internal defects has gradually been transferred to the surface. This process can easily be monitored using the real-time subtraction technology of digital shearography. Once the fringes caused by the surface temperature gradually disappear or reduce, the information caused by the internal defects becomes clear, and the shearography testing based on the phase shift method should start. Usually, the global deformation caused by the surface temperature cannot disappear completely, its information in the shearogram, however, can be eliminated by special experimental methods or numerical algorithms [
30,
32]. If the testing is on the back side of the heating surface, the waiting time to start the shearography testing could be much shorter or the testing can be immediately started once the heating stops. In the experimental investigations presented below, we use the model to estimate the heating temperature and required time and use real-time subtraction technology to control the waiting time before starting the shearographic testing.
4. Experimental Testing on Artificial Cracks
Cracks are one of the most common defects in composite materials, such as in GFRP and CFRP. The classification of cracks, i.e., identifying whether they are at early, middle, or late stages, is an important requisite in the relevant industries. The objective of the research was to utilize the advantages of digital shearography with full-field, quick, and practical inspection capabilities to determine the crack classification. Since shearography directly measures strain concentration information, the main task here is to correlate the strain concentration information in the shearograms with the cracks at different stages. Therefore, different artificial cracks were loaded by three-point bending fatigue testing. The samples were tested by thermal-loaded digital shearography at initial and different fatigue cycles to investigate the relationships between the strain distribution in shearography and the crack stages.
4.1. Experimental Setup
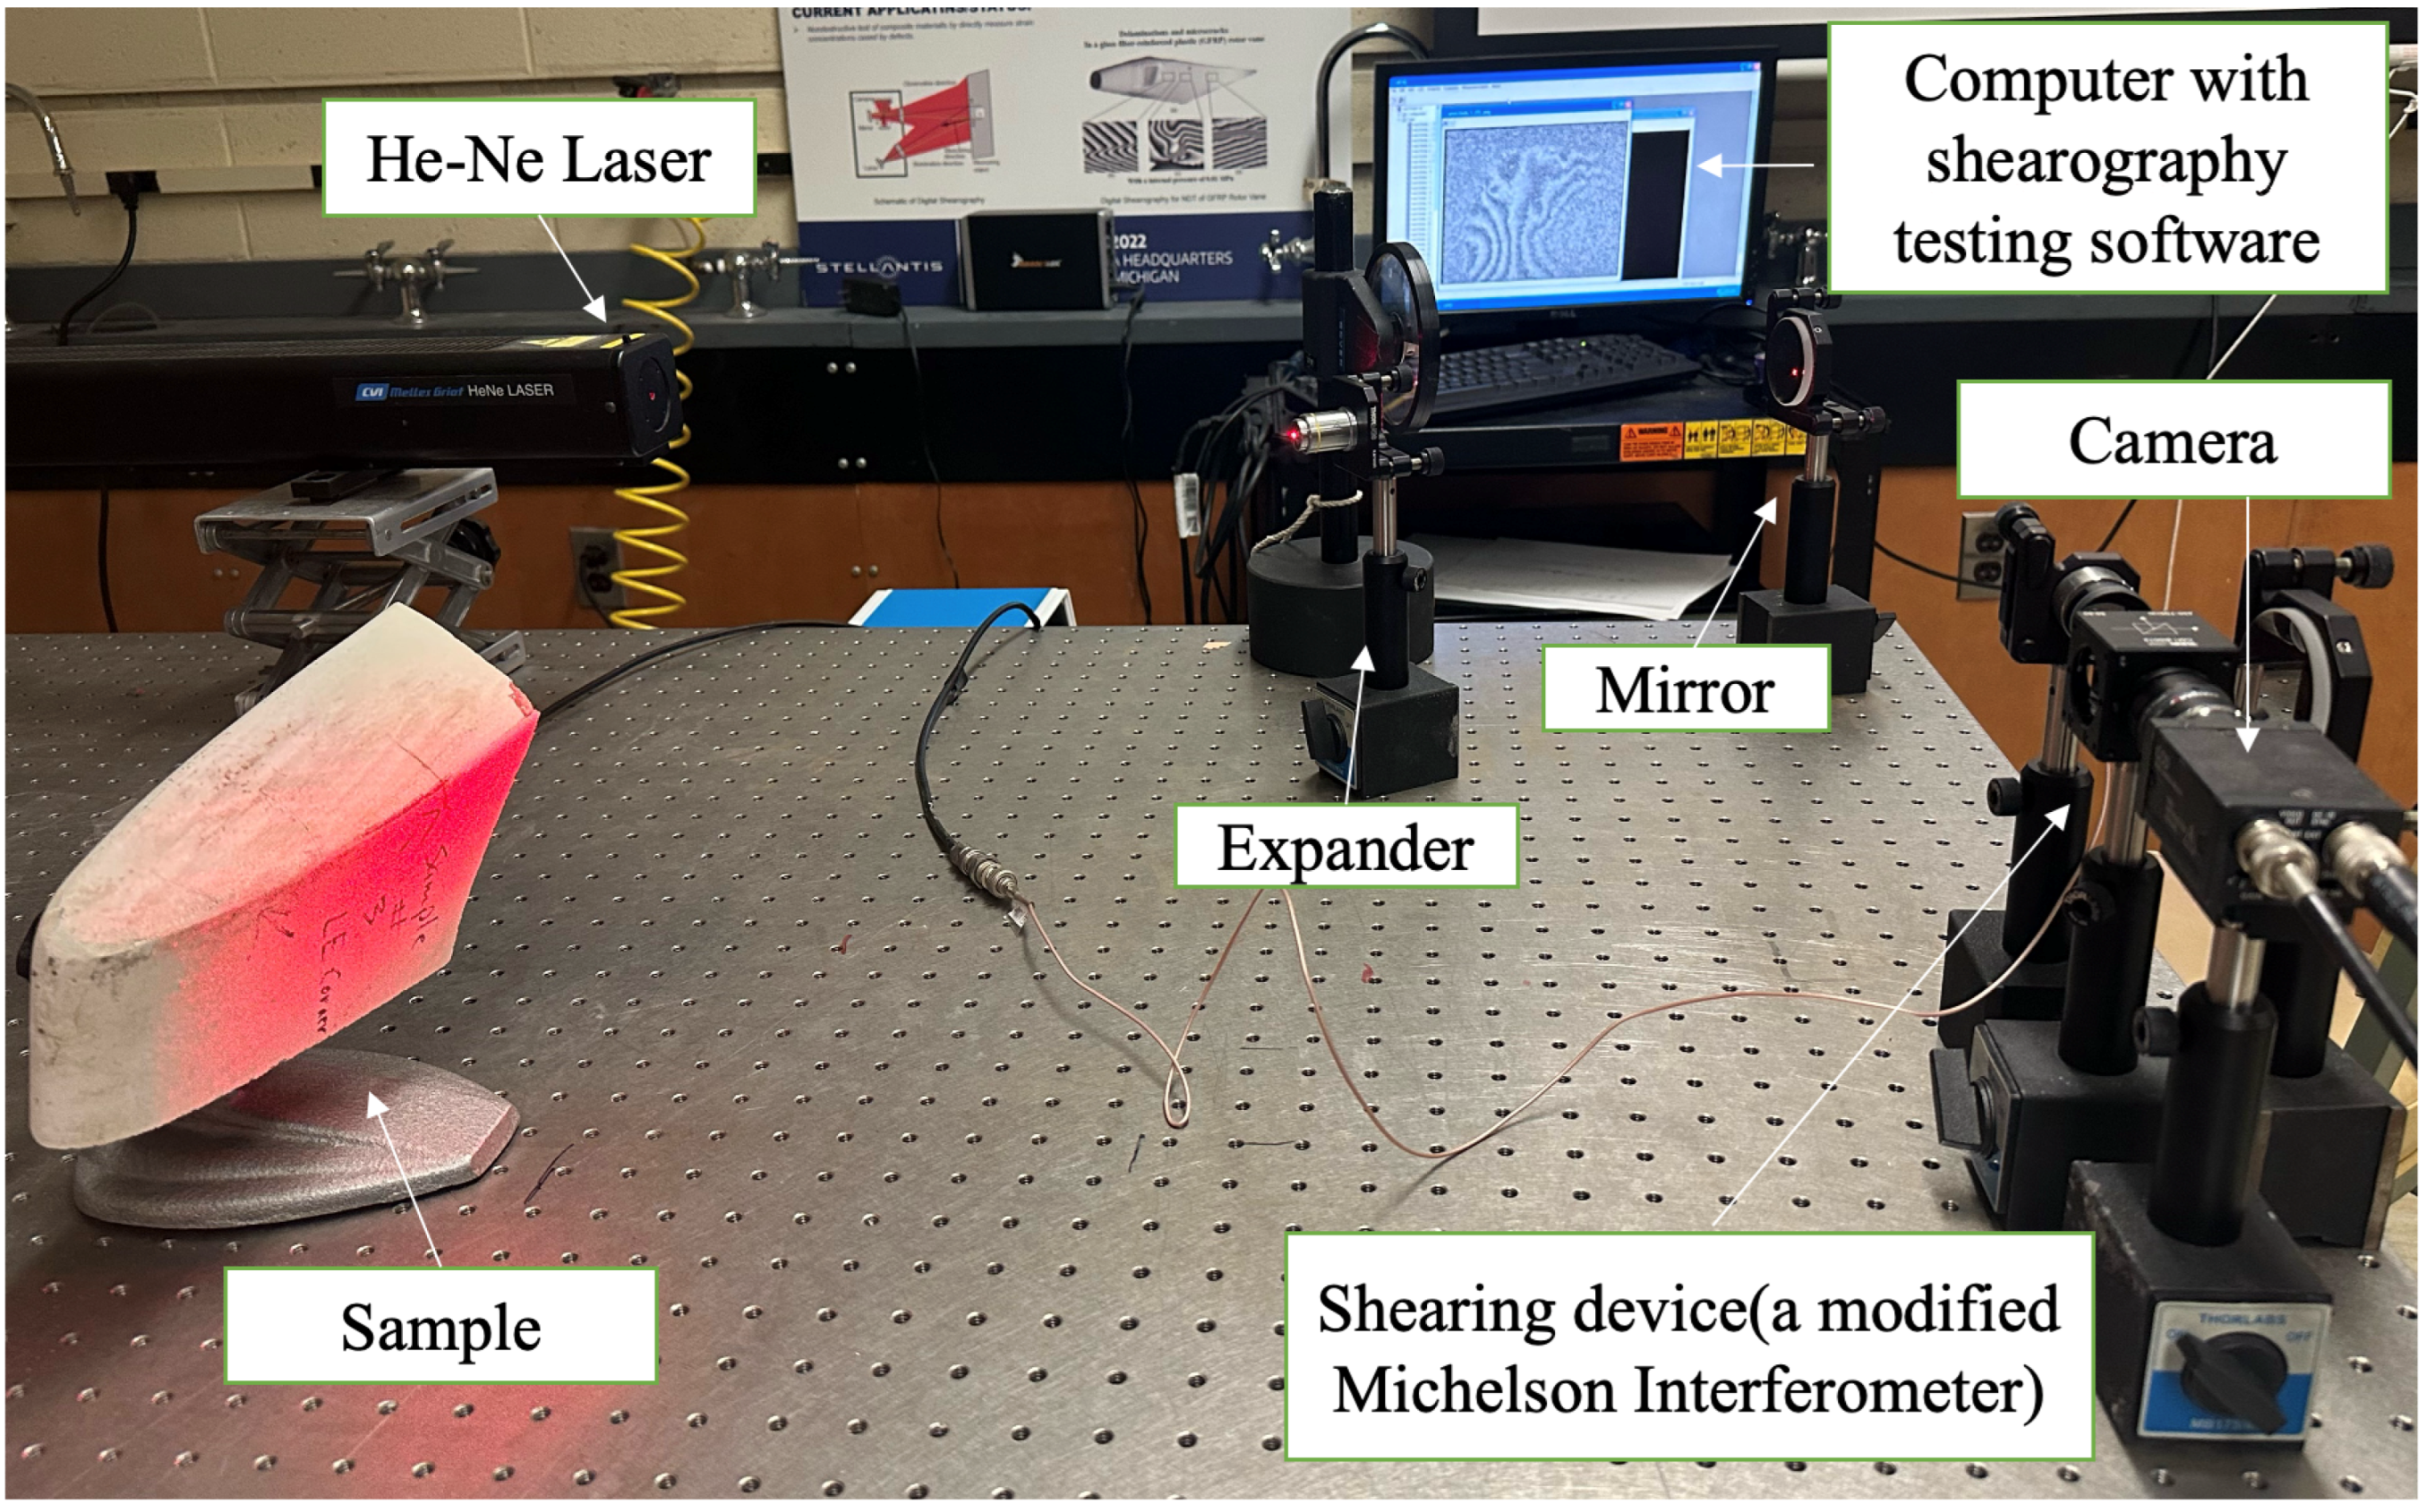
Figure 4 shows the experiment setup. The sample to be tested was set in a fixture on an optical table. The front surface of the sample was illuminated by an expanded He-Ne laser (50 mW) with a wavelength of 632.8 nm and tested by digital shearography with the temporal phase shift technique. The camera has one mega pixel, and the shearing device is a modified Michelson interferometer in which a piezoelectric transducer (PZT) driven mirror is used for the phase shift method. The shearing direction is in the x direction; please note that a shearing direction perpendicular to the crack’s orientation should be selected if cracks are visible because it is suited to show strain concentration [
33].
As described in the previous section, thermal loading was applied in the shearography testing. The sample was heated to approximately 60 °C, which can be measured by a thermocouple, and the heating was maintained for about 40 s, depending on the sample thickness. The entire testing procedure is described as follows:
Heat the sample to approximately 60 °C
Maintain this temperature and continue heating for 40 s, depending on the sample thickness (this allows the heat to transfer to the back side)
Stop the heating
Wait for about 50 s (this step is to reduce the effects of deformation caused by the surface temperature); during this time period, a real-time subtraction digital shearography can be used to monitor the fringe pattern of the shearogram
Start shearography testing with the temporal phase shift method; the front surface, i.e., heating side, was tested.
4.2. Experimental Testing of Artificial Cracks
To correlate the degrees of strain concentration in the shearograms with the stages of crack development, three independent experiments were conducted. In each case, artificial cracks with different sizes and depths were manually introduced onto intact composite samples. The samples were loaded under fatigue testing using a three-point bending setup and tested by thermal loaded digital shearography after different fatigue cycles. The experimental investigation enabled the evaluation of the detectability and progression of cracks with different depths under fatigue loading.
4.2.1. Detection of Early-Stage Cracks Without Fatigue Testing
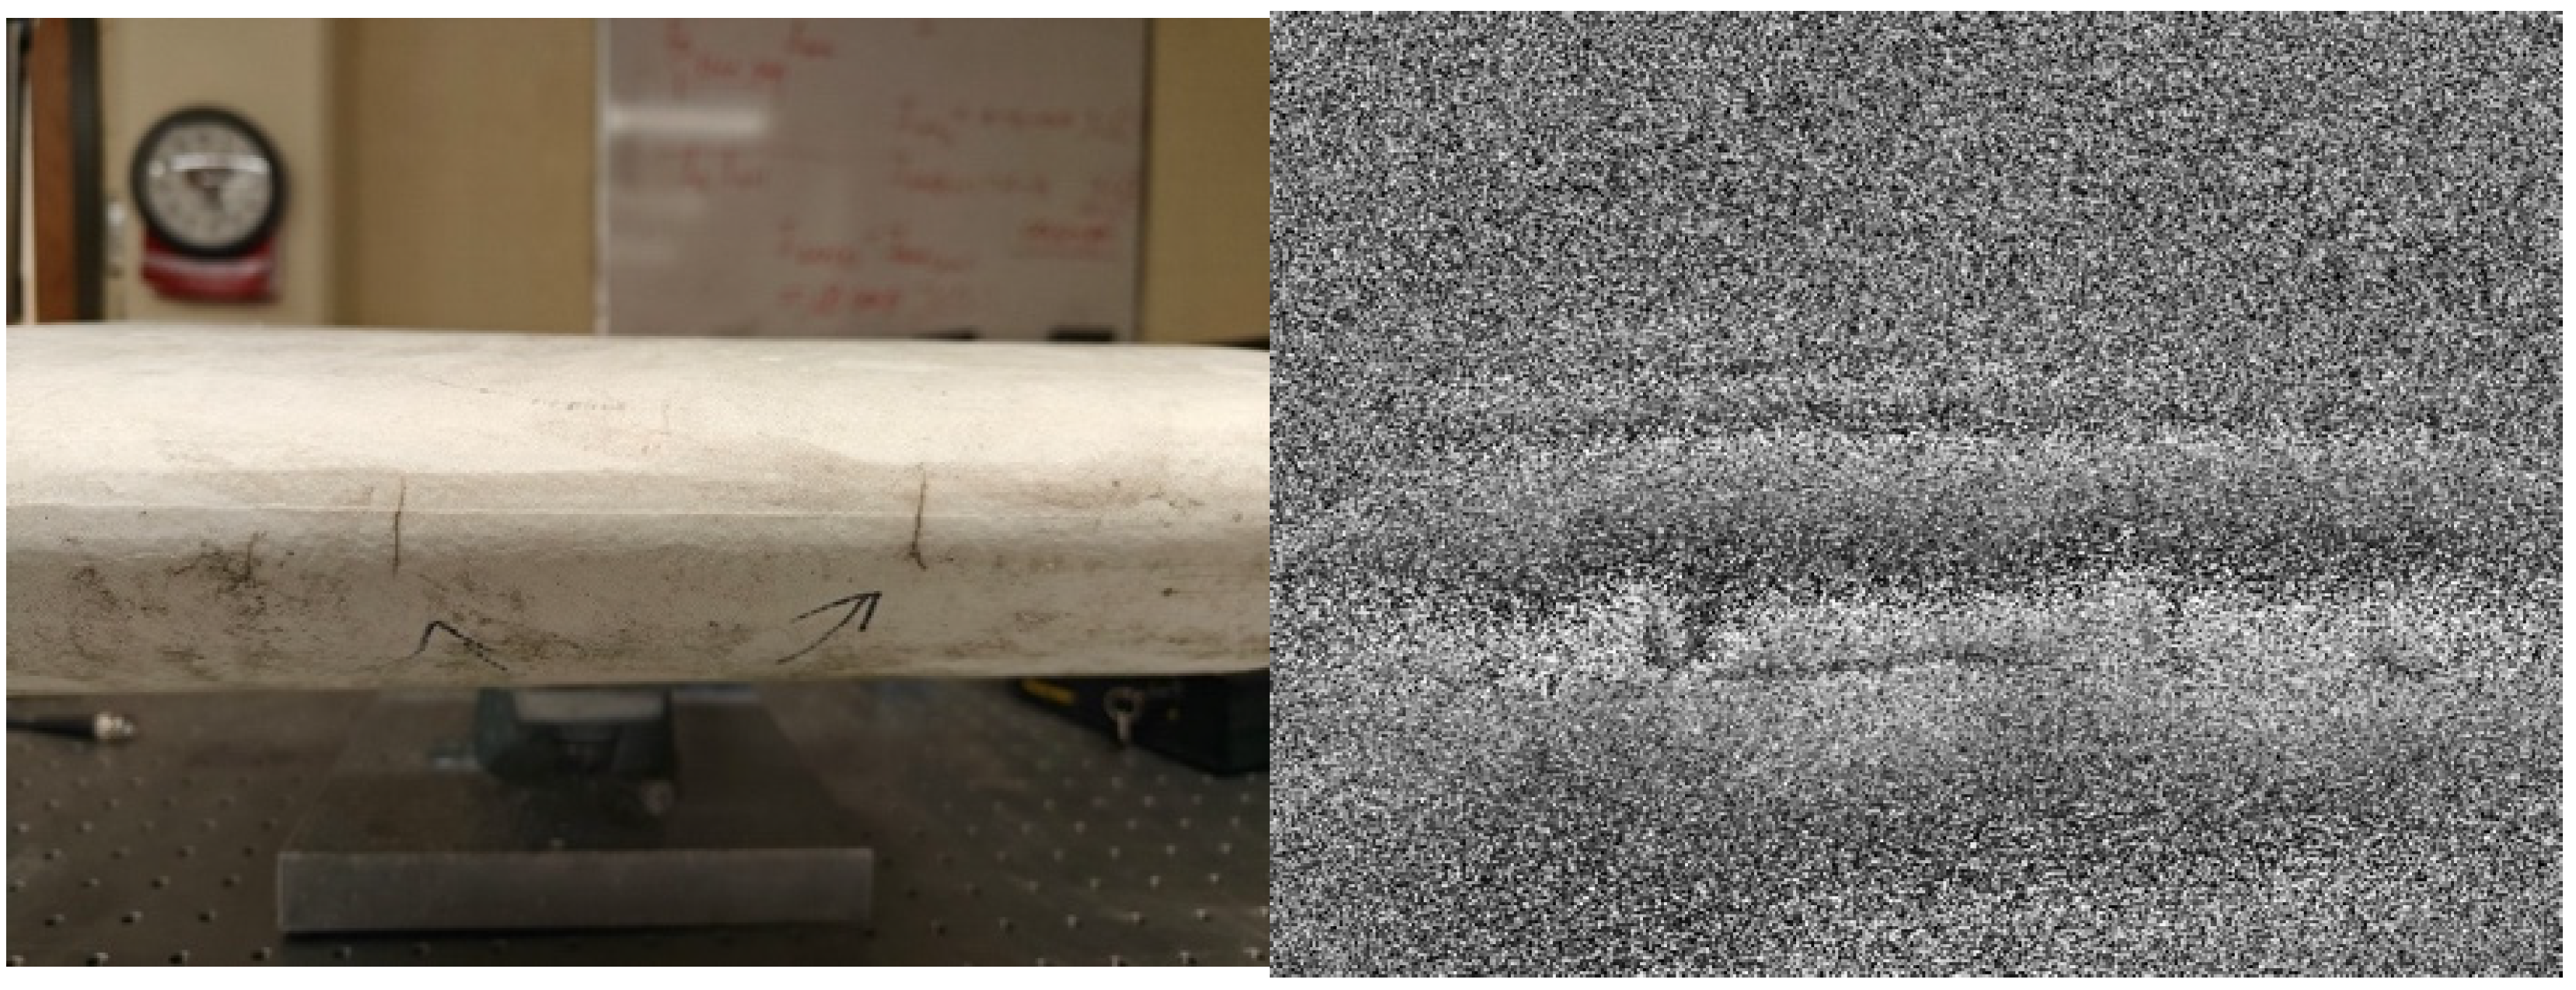
Three artificial cracks with depths of 1 mm, 2 mm, and 3 mm and lengths of 8 mm, 8 mm, and 12 mm, respectively, were introduced on the surface of a panel of a GFRP ACC fan blade (from left to right, as can be seen in the directions of the arrows in the image of
Figure 5). The cracks were generated by a heavy-duty utility blade, and the crack depth was then determined by measuring the penetration depth of the blade tip into the material. The thickness of the panel was about 7 mm. The shearographic test was conducted without applying fatigue testing on the sample, which indicates that the cracks are in the early stage. A thermal load was applied by heating the surface to approximately 60 °C for 40 s. After heating was stopped, the sample was allowed to cool for 50 s before shearography testing began. The testing result, i.e., the shearogram, shown on the right of
Figure 5, presents a derivative of deformation in the horizontal direction (because of a horizontal shearing direction). Besides some fringes caused by the surface temperature and a slight strain concentration (marked by a red arrow in the shearogram) for the 3 mm deep crack, the strain concentrations at the other two cracks are so small that they are less than the test sensitivity of digital shearography; therefore, no noticeable strain concentrations can be observed from the shearogram, which suggests these cracks are in the early stage.
What is the test sensitivity of digital shearography for strain measurement? As presented in Equations (5) and (6), shearography measures the strain information δ
w/δ
x, where δ
w is the relative deformation between two points with the shearing distance directly measured by shearography, and δ
x is the shearing amount. According to previous research [
17], shearography with a temporal phase shift method has a range between 50 nm and 100 nm measuring sensitivity for δ
w. Taking the middle value, i.e., 75 nm, for δw and 5 mm for δ
x (δ
x is the shearing amount which was 5 mm in this study). the measuring sensitivity of shearography for determining ∂
w/∂
x = 75 nm/5 mm = 15 × 10
−6. Considering speckle noise, etc., the actual measuring sensitivity of shearography should be between 20 × 10
−6 to 30 × 10
−6. That is to say, a crack cannot be detected by shearography if the strain value generated by a crack is smaller than 20 × 10
−6.
4.2.2. Detection of Crack Evolution Under Three-Point Bending Fatigue Loading
The second attempt was to test crack evolution under three-point bending fatigue loading. A rectangular GFRP plate (100 mm × 70 mm × 7 mm) was extracted from an ACC fan blade provided by an industrial company and an 18 mm long, 1.5 mm wide, and 2 mm deep crack was introduced as shown in the sample image of
Figure 6. The crack was introduced using a CNC milling machine. This method enabled a precise control over the crack dimensions. The plate was first measured by shearography without fatigue testing, i.e., at the zero cycle. The shearogram at the zero cycle, just as expected, does not show a noticeable strain concentration, which confirms no strain concentration can be observed in the shearogram for cracks in the early stage. Then the plate was subjected to three-point bending fatigue loading with a mean force of 500 N and an amplitude of 125 N. Shearography tests were performed at every 50 k cycles, i.e., at 50 k, 100 k, and 150 k cycles, respectively. The results are displayed in
Figure 6.
Figure 6 demonstrates that the shearograms show a clear progression of localized strain concentration with increasing loading cycles. At 0 cycles, no strain concentration was observed around the crack, indicating an early-stage crack. At 50 K and 100 K cycles, localized strain concentration began to appear around the crack area, suggesting the onset of the strain accumulation, indicating a middle-stage crack. After 150 K cycles, a significant and widespread strain concentration developed around the crack, indicating a late-stage crack. These findings indicate that cracks cannot display visible strain anomalies under shearography testing at the early stages. As the number of loading cycles increases, the development and spread of strain concentration becomes more pronounced. It confirms the reliability and sensitivity of shearography in identifying and classifying the development stages of cracks. A destructive test of the plate by cutting the plate perpendicular to the crack direction indicated the crack almost penetrated the plate at these conditions after 150 K cycles of the fatigue test.
4.2.3. Effect of Crack Depth on Crack Evolution Under Fatigue Testing
The third attempt was to study the effect of crack depth on crack evolution under fatigue testing. Again, another rectangular GFRP plate (100 mm × 70 mm × 7 mm) was extracted from the ACC fan blade. Instead of a 2 mm deep crack, an 18 mm long, 1.5 mm wide, and 4 mm deep crack was introduced in the plate as shown in the sample image of
Figure 7. As with the sample shown in
Figure 6, the crack was introduced using a CNC milling machine. Both the heating conditions for the shearographic testing and the mean value and the amplitude for the fatigue testing were the same as described in
Section 4.2.2.
As shown in
Figure 7, no obvious local strain concentration was detected before fatigue testing. However, after just 50,000 loading cycles, clear and widely spread strain concentration appeared around the crack, suggesting a transition to a late-stage crack. Compared to the 2 mm-deep crack, which required 150,000 cycles to exhibit a similar strain concentration, this result demonstrates that deeper crack depth accelerates the damage evolution process. These findings suggest that crack depth plays a significant role in reducing the fatigue life of the GFRP structure—the deeper cracks more readily develop into structurally critical defects under cyclic loading.
Three attempts were conducted to correlate the crack stages with the strain concentration in the shearograms. The fatigue tests clearly show how the strain concentration evolved in the shearograms while a crack developed from an early to late stage. The experimental results demonstrate that cracks in the early, middle, and late stages can be classified by shearography based on the degree of strain concentration. If we define the cycles number from the early state to the late state as the crack life, an initially deeper crack has a much shorter crack life than a shallow one. This suggests that crack depth is one of the key factors influencing crack life and the speed of crack development. Although shearography cannot quantitatively measure the depth of cracks, the strain concentration patterns in the shearograms can, however, quantitatively predicate the state of the cracks. When a strain concentration becomes visible, i.e., so called the middle stage, the crack is developing in depth and possibly in width as well. When a significant and widespread strain concentration is observed, i.e., so called the late stage, the crack has almost or already penetrated the sample, which means a repair or replacement must be performed immediately.
Using these rules obtained from the artificial samples, we applied digital shearography to classify the crack stages in the parts of ACC fan blades made of GFRP from an industrial company, and this is presented in the next section.
5. Applications for Crack Classification on Parts of Air-Cooled Condenser Fan Blades
In this section, we use digital shearography to classify the crack stages based on the degrees of the strain concentration and the experiences obtained from the testing on artificial samples. The samples used in this study were from GFRP ACC fan blades, provided by an industrial company. All of the blade samples had experienced actual industry service, and the cracks had naturally developed under complex service loading conditions. Again, the thermal loading as described in
Section 4.1 was applied to heating the samples for the shearographic testing. To simplify experimental detection and analysis, the blades were sorted into individual samples based on different regions of interest, which included the following: the blade tip, the blade edge, and the junction area between the blade and the root. Representative images of the cracks can be found in the subsequent figures. To systematically evaluate the crack classification, we categorized them into early, middle, and late stages based on the degrees of the strain concentrations in the shearograms—specifically, whether they spread significantly across the crack area and considered as important indicators in distinguishing crack stages.
Figure 8 shows the image of the tested part called the blade tip (left) and the shearographic testing result, i.e., the shearogram (right). The shearogram demonstrated significant and widespread strain concentrations in the areas of the three cracks which indicate these three cracks are in the critical stage, i.e., in the late stage. This result also implied that these critical cracks may already have penetrated the entire board in the depth direction. If these kinds of strain concentrations have been detected, and the part is still in service, action for repairing or replacement must be taken immediately.
To confirm the judgement made based on the significant strain concentrations from the shearogram, i.e., the cracks are in the late stage and may already have penetrated the entire specimen in the depth direction, the sample shown in
Figure 8 was further inspected by advanced computer tomography (CT) scan technology. The sample was scanned on a Rigaku CT Lab HX system(Rigaku Corporation, Tokyo, Japan) with a 200 mm field of view and measurement resolution of 35 µm/voxel. Volumes were reconstructed with an isotropic voxel size of 35 µm (Δx = Δy = Δz = 35 µm). Accordingly, the slice thickness equals the through-plane voxel spacing (35 µm).
The CT scan is one of the most accurate methods to inspect crack and crack depth. It can provide 3D images of internal structures and 2D images of any desired section. However, CT scans use ionizing radiation which suggests the technology can only be used in laboratory conditions. Furthermore, the CT scans can be more expensive and need a longer inspection time due to the scanning compared to shearography testing. This is why we are developing digital shearography, full field and suitable for field testing technology for crack classification. Despite some limitations for practical applications, the CT results can be used as a trustworthy validation for shearography testing.
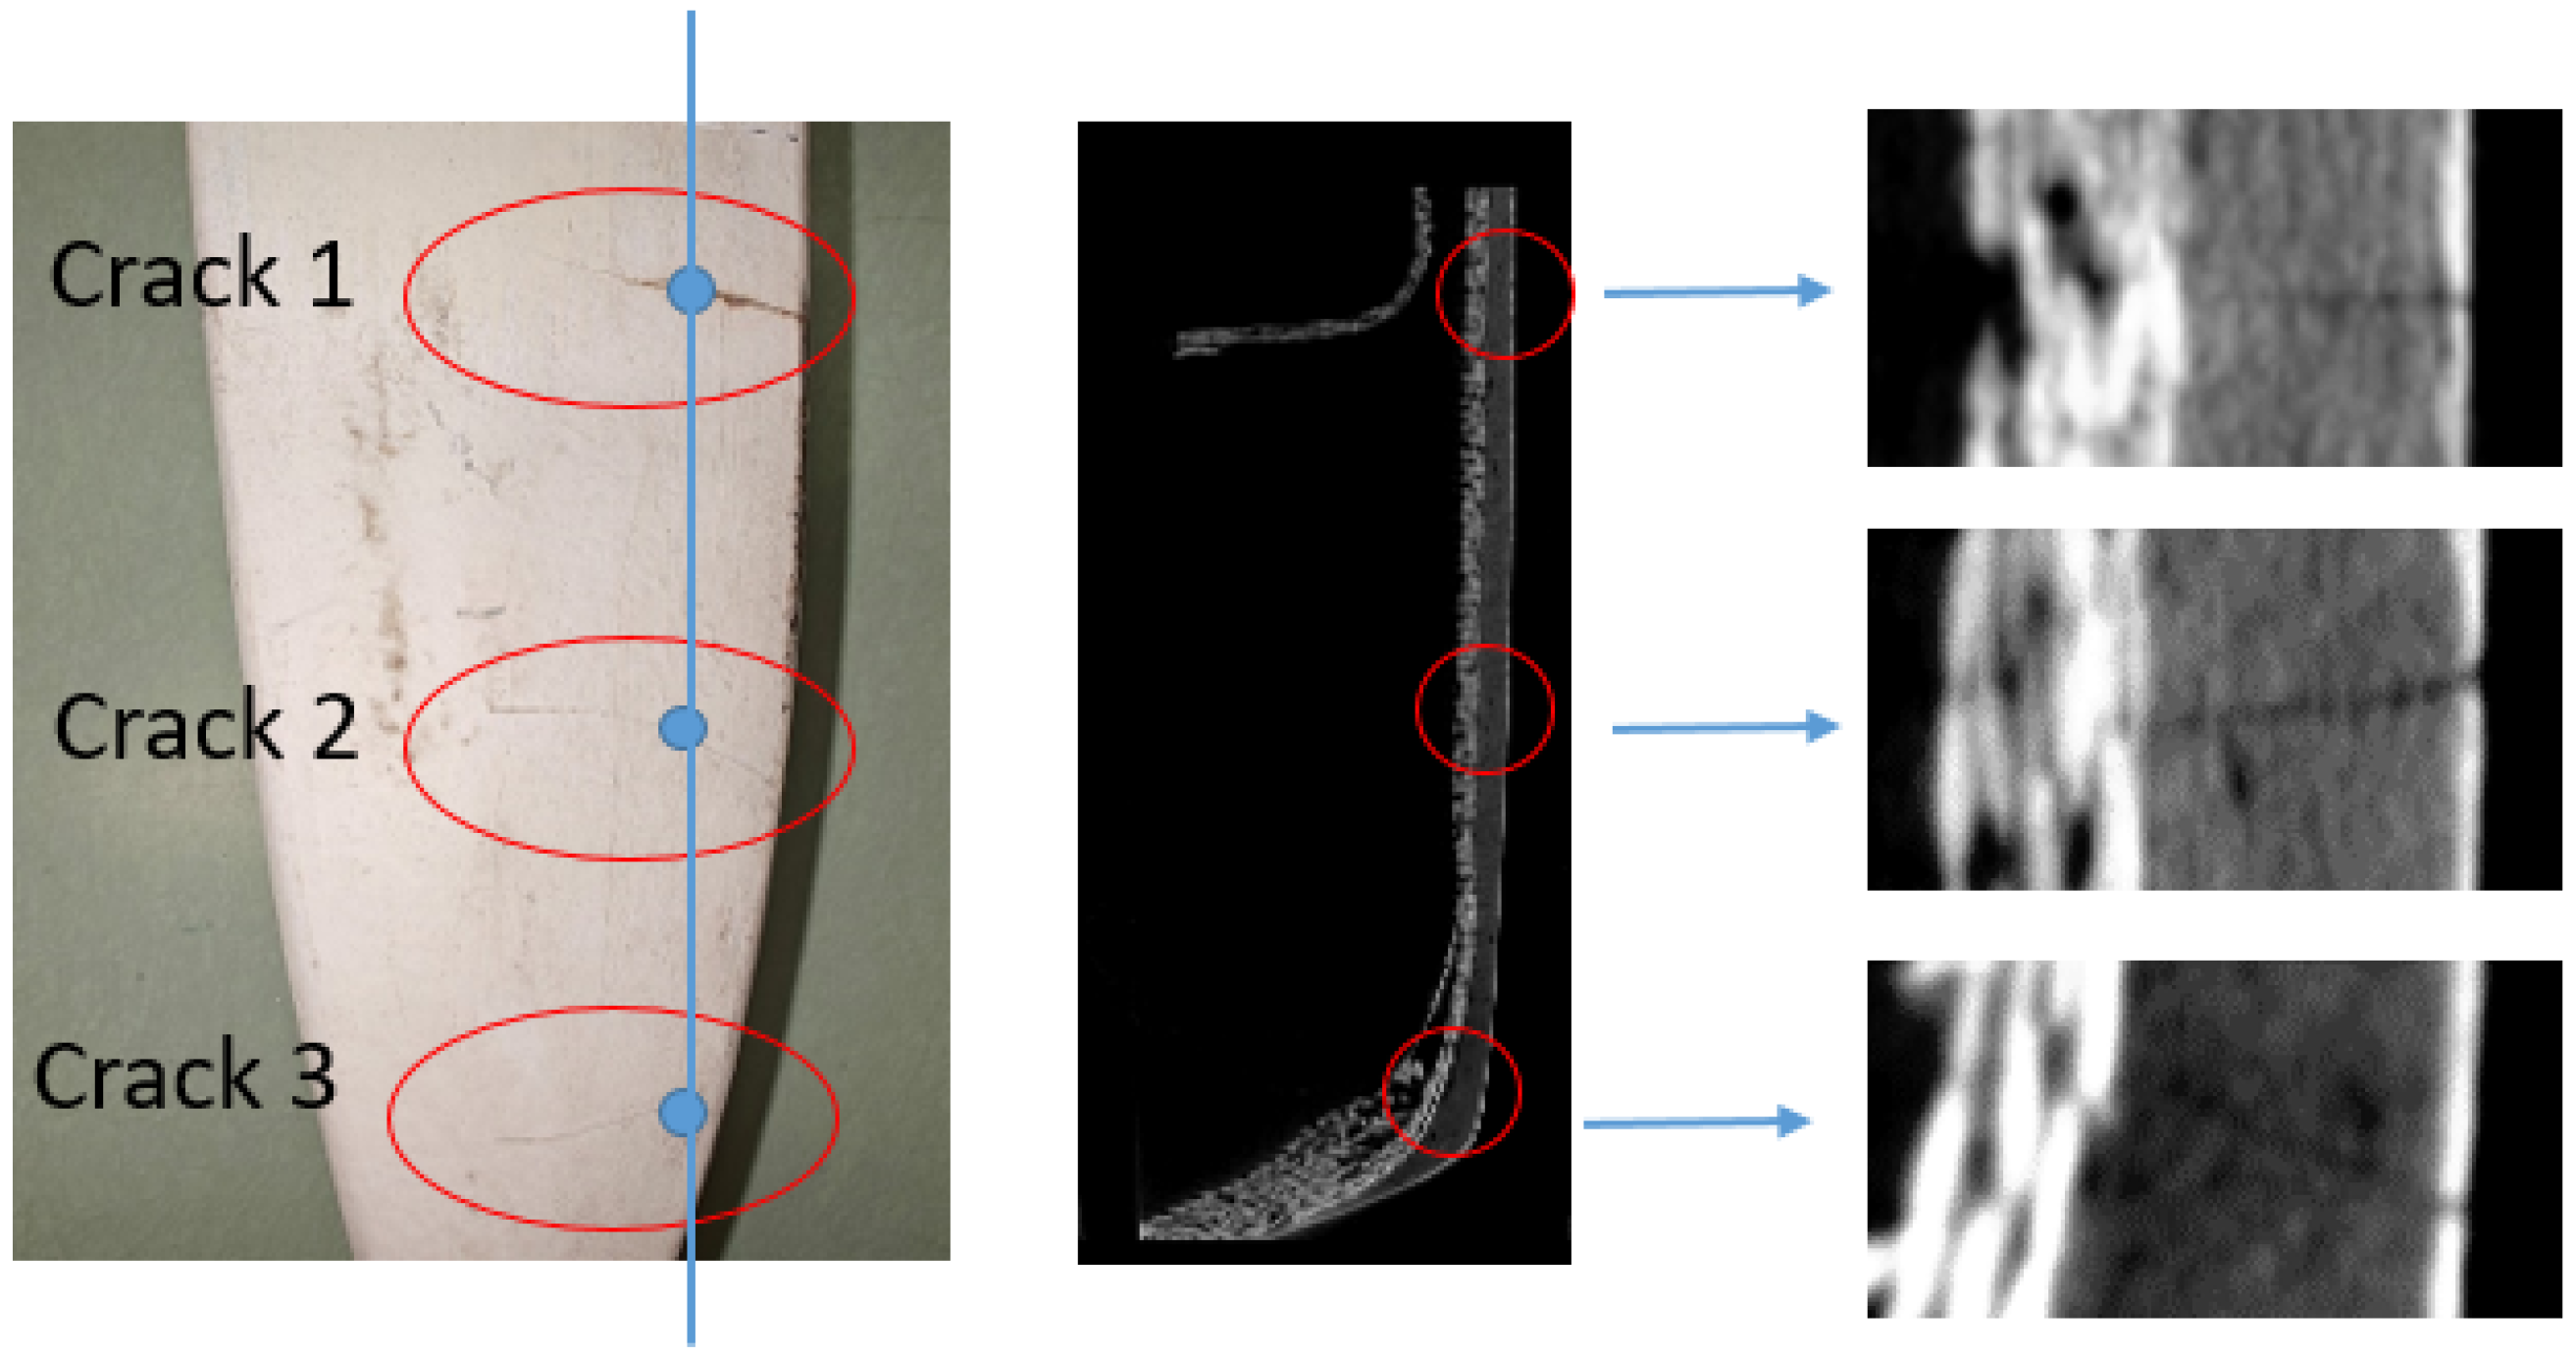
Figure 9 shows the scan results for the sample along the blue line indicated. Compared with the image shown in the left of
Figure 8, the image shown in
Figure 9 (left) was tilted about 90 degrees. Three cracks are now orientated in the vertical direction where they are in the horizontal direction in the left of
Figure 8. The section image along the blue line (middle) as well as enlarged images at the three crack positions (right) clearly demonstrate that these three cracks have already penetrated the entire specimen in the depth direction, presenting very good agreement with our judgement based on shearographic testing.
Figure 10 shows the image of the tested part called the blade edge 1 (left) and the corresponding shearogram (right). The shearogram clearly exhibits strain concentrations on the upper edge, but not yet widely spread. Because the strain concentrations are already clear, these cracks can be considered as middle to late stage cracks. At this stage, the structural integrity has begun to be damaged. Continuous monitoring is necessary to assess potential propagation and the associated risk to the component’s performance.
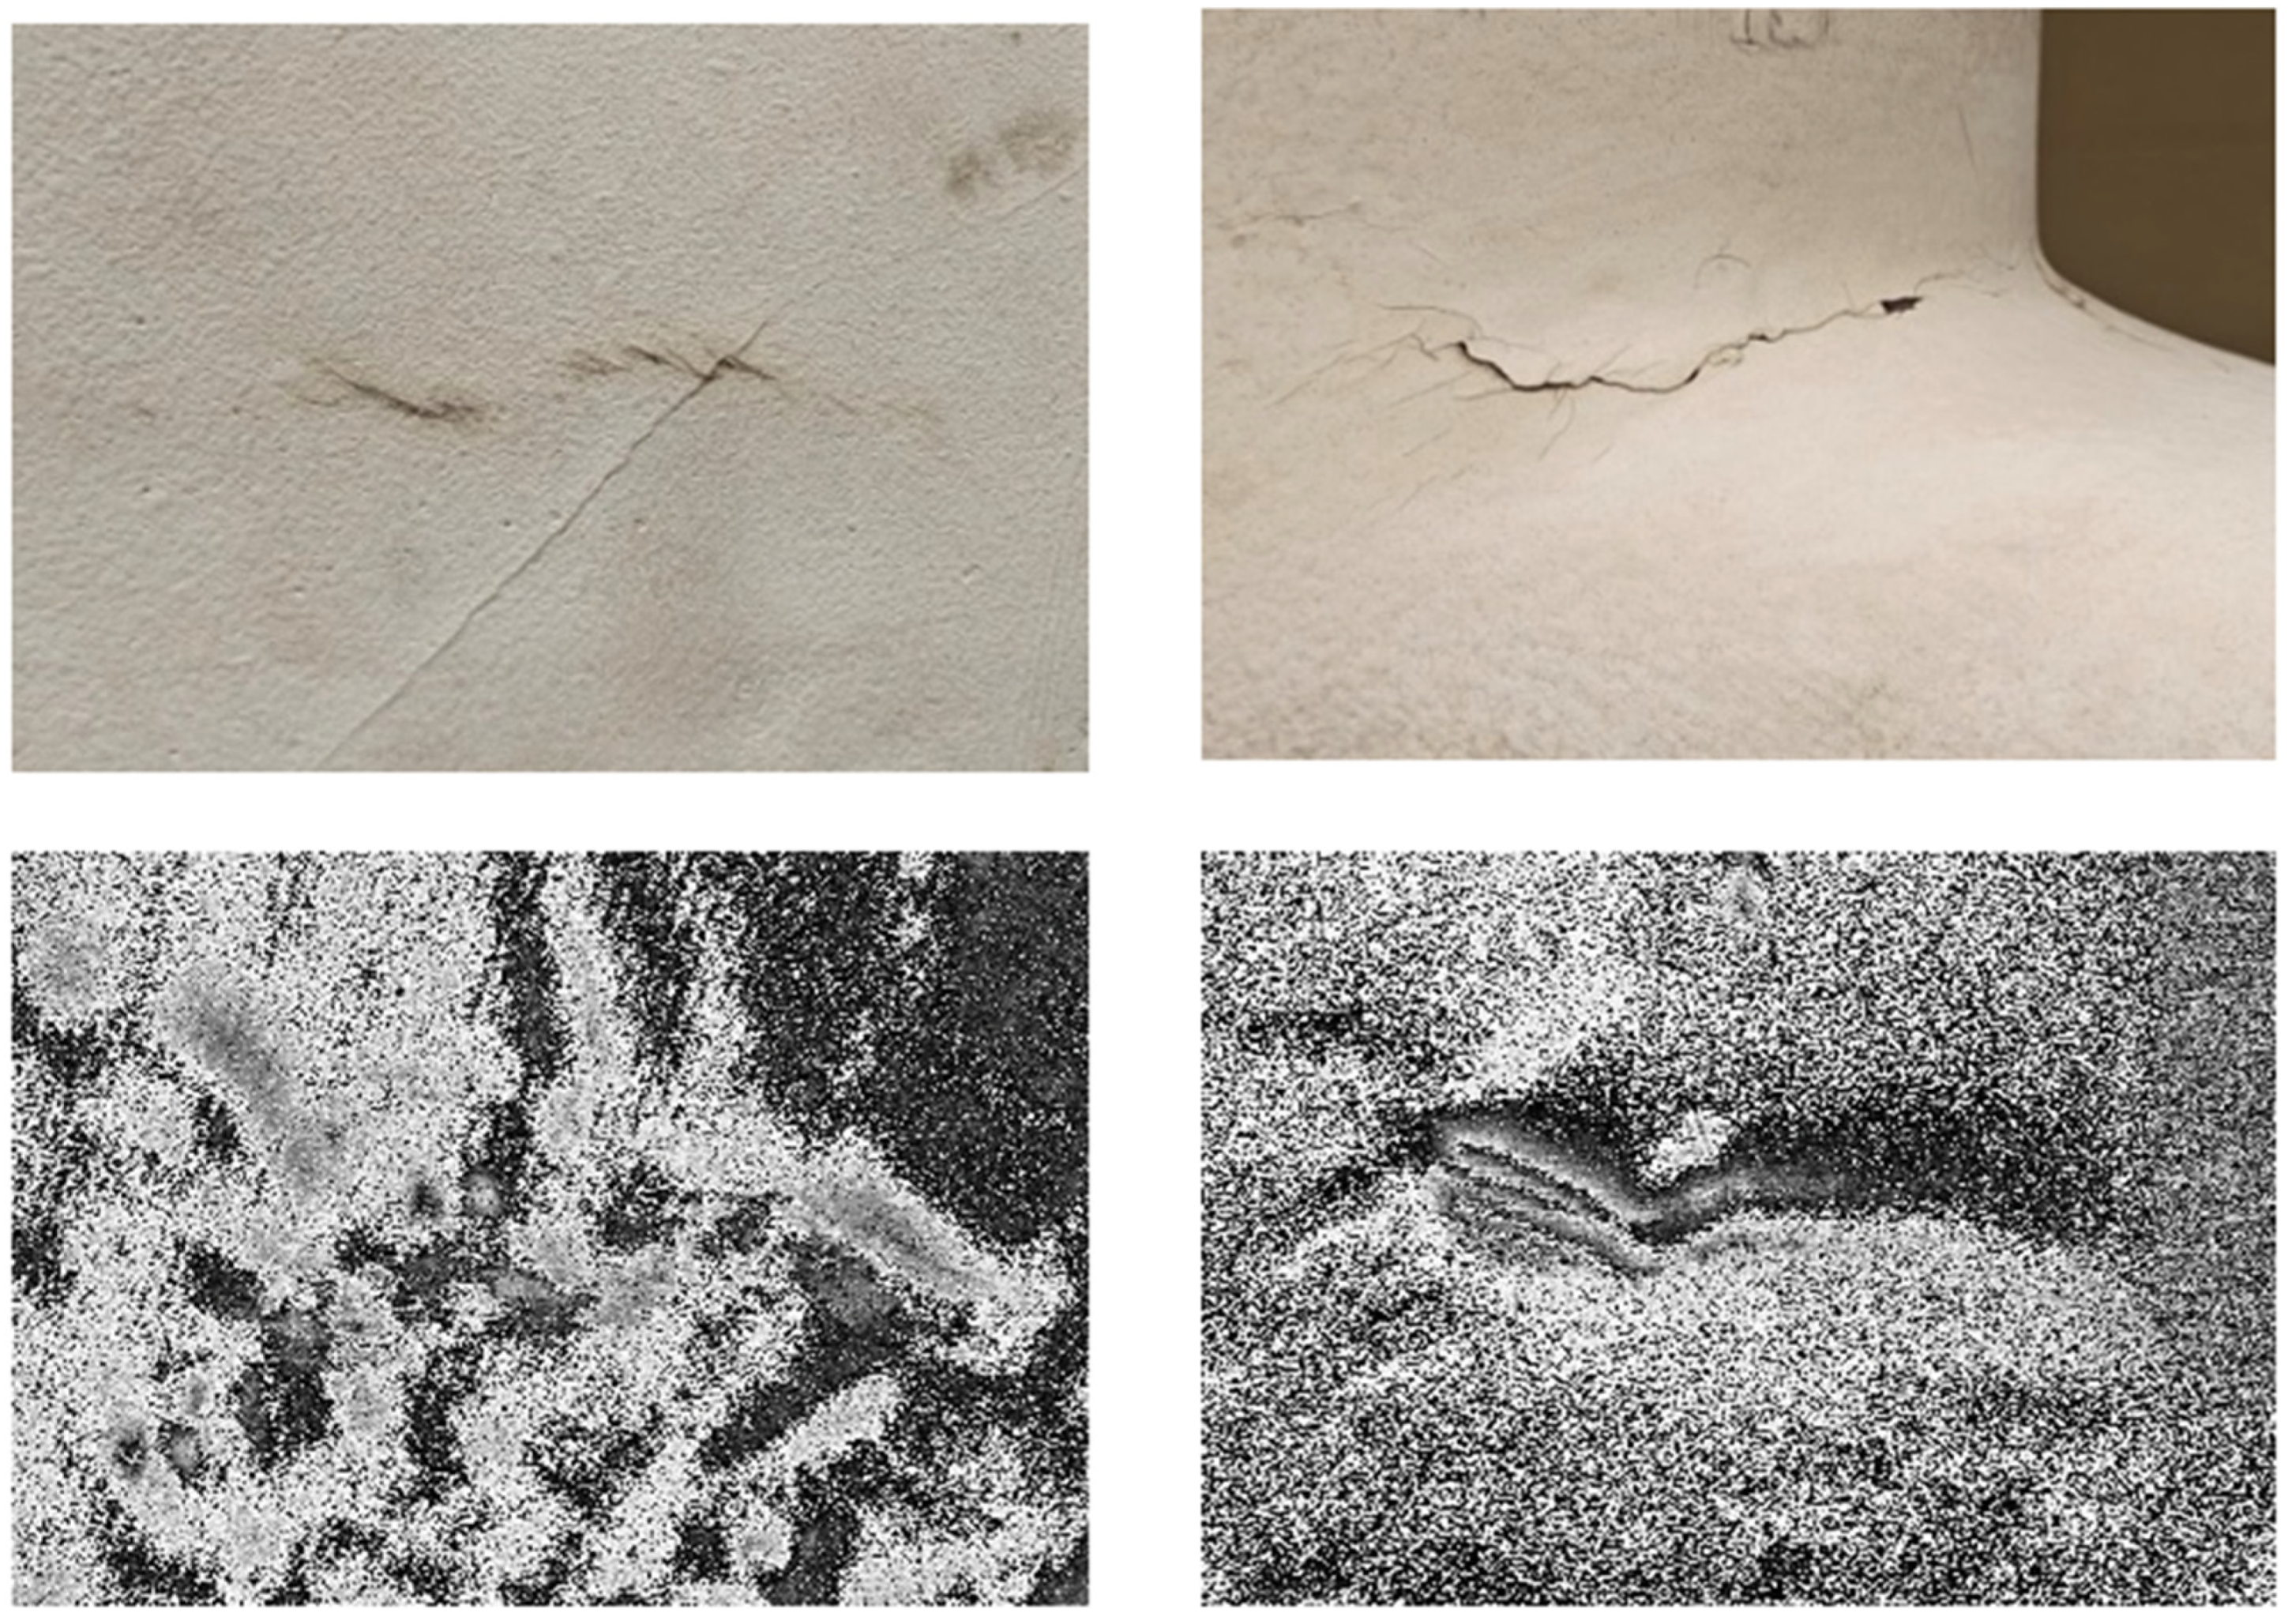
Figure 11 shows the images of the tested part, which is in the junction area between the blade and the root and has two cracks (top), and the corresponding shearograms (bottom). Because of the junction area, this region is easier to lead to strain concentration and potential crack formation because of its sharp curvature and structural complexity. Two visible cracks were tested using shearography. Crack 1 and the corresponding testing result (left) show no obvious strain concentration in the shearogram, indicating that it is likely in the early state and has not yet penetrated through the composite structure. In contrast, Crack 2 and the corresponding testing result (right) exhibit a significant localized strain concentration, suggesting Crack 2 is in the late-stage.
Figure 12 shows the image of the tested part, also called blade edge 2 (left) and the corresponding shearogram (right). Two cracks are visible, and they are tested by digital shearography. Only slight strain concentration information has been observed. This could result from (1) the cracks not being deep or (2) the sample being very thick in this area. Based on the strain concentration, we classify them as early to middle stage cracks. The sample may not need to be replaced immediately, but continuous monitoring is necessary to assess potential propagation.
6. Conclusions and Future Work
Thermal loaded digital shearography for quickly classifying cracks in the early, middle, and late stages was developed based on the degree of strain concentration in the shearograms. Fatigue testing on the artificial cracks combined with shearographic testing at different fatigue cycles clearly demonstrates the progression of the strain concentration of cracks in the shearograms from no noticeable strain concentration (early stage) to slight strain concentration (middle stage), and finally to significant and widespread strain concentration (late stage). This confirms that the evolution of strain concentration effectively reflects the severity of the structural damage. In the early stage, a crack occurs but the surrounding fiber structures have not yet been destroyed; the strain concentration is so small that it is less than the testing sensitivity of digital shearography, and therefore, no noticeable strain concentration can be observed from the shearogram. In the middle stage, the crack develops slowly and a local but not widespread strain concentration can be observed from the shearogram. In the late stage, significant and widespread strain concentrations can be observed from the shearogram, and in this stage, the cracks have already penetrated the entire specimen in the depth direction. The experiment tests showed that crack classification based on strain concentration in a shearogram is a quick and practical method and that the CT scan results demonstrated very good agreement with the assessment by shearographic testing, confirming that digital shearography is a promising method for crack classification. The proposed method offers a practical, full-field and non-contact approach for evaluating structural health, enabling informed decisions on whether and when maintenance or repair actions are necessary.
In order to make the classification framework more robust for industrial adoption, we will focus our future work on providing more quantitative metrics of crack severity classification by investigating, e.g., strain concentration thresholds or statistical correlation between fatigue cycles and shearographic intensity etc., and finally on standardizing the classification scheme (early/middle/late) and integrating it into maintenance guidelines.
