Article

Influence of Tiered Cyclic Shear Stress on Shear Friction and Instability Behavior of Marble Specimens with the Fractures

1
State Key Laboratory of Coal Resources and Safe Mining, China University of Mining and Technology, Xuzhou 221116, China
2
School of Mines, China University of Mining and Technology, Xuzhou 221116, China
*
Author to whom correspondence should be addressed.
Appl. Sci. 2025, 15(19), 10308; https://doi.org/10.3390/app151910308
Submission received: 16 August 2025 / Revised: 11 September 2025 / Accepted: 18 September 2025 / Published: 23 September 2025

Abstract

Fractured rock masses are susceptible to stress-induced disturbances, which can lead to severe geological disasters. In recent years, the shear deformation and failure characteristics of fractured rock under cyclic shear loading have become a frontier issue in rock mechanics and engineering. A thorough understanding of the failure mechanism of fractured rock masses is of great significance for the scientific evaluation of their long-term stability in engineering applications. In this study, experiments were conducted on marble specimens with artificial fractures under constant normal stress using the RDS-200 rock mechanics shear test system. The results reveal the following three key findings: First, the residual shear displacement increases linearly with cycling numbers, and the fractures demonstrate memory functions under pre-peak tiered cyclic shear loading, with shear displacement exhibiting hysteresis effects. Second, significant differences were observed between tiered cyclic shear (TCS) and direct shear test (DST) outcomes in terms of peak shear stress and failure patterns. The peak shear strength under TCS was 17.76–24.04% lower than under DST, with the strength-weakening effect increasing with normal stress. The fracture surfaces showed more severe damage and debris accumulation under TCS compared to DST, with the contour area ratio decline rate correlating with both normal stress and initial surface conditions. Third, energy evolution analysis indicates that as cyclic shear stress increases, the elastic energy release rate exceeds the dissipation rate, and the elastic energy index progressively rises through the loading cycles. The findings of this research contribute to a better understanding of the shear instability of rock fractures under pre-peak tiered cyclic shear loading with constant normal stress.

1. Introduction

A variety of rock slopes have been constructed for engineering projects such as open-pit mining, cutting excavation, and road construction (see Figure 1) [1]. Under the influence of external factors, these slopes often develop a network of fractures due to unloading, weathering, and blasting. Additional loads from events like earthquakes, fluctuations in river water levels, or changes in reservoir storage can subject these slopes to repeated vibrations and impacts. This leads to the widening of existing fractures and the generation of shear displacement. When the cumulative deformation reaches a critical point, the shear strength of the fractures decreases, potentially causing a complete loss of structural integrity and a reduction in slope stability, or even outright instability. Landslides are a primary form of rock slope instability.
Rock mass sliding along a structural plane is a common type of rock slope failure, typically involving deep-seated failure under gravity and external loads. When the sliding surface passes through brittle rock or possesses inherent shear strength, the rock can withstand high shear forces before failure. However, once sliding is imminent, its shear strength drops sharply, resulting in sudden, rapid sliding. As a common type of landslide, plane shear sliding is characterized by block movement along a planar surface. This type of failure frequently occurs where the strike of a geological weakness plane is parallel to the slope face.
In recent decades, the influence of cyclic loading on the mechanical properties of rock fractures has been a major research focus. Studies have shown that environmental factors significantly impact rock joints; for example, freeze-thaw cycles cause an exponential decrease in peak shear strength [2], while water immersion can reduce the peak shear strength of sandstone joints by approximately 50% [3]. The intrinsic properties of the rock material itself, such as the mineral grain size and microstructure of granite [4] and the interblock structure of Cobourg limestone [5], also affects joint mechanical behavior. The roughness and topographical parameters of joint surfaces are decisive factors in shear failure modes [6]. Under pre-peak cyclic loading, low cycle numbers primarily lead to damage to secondary roughness, whereas high cycle numbers promote fatigue crack propagation [7,8,9,10]. Rock joints exhibit unique mechanical responses under different loading modes: stress wave propagation is influenced by loading/unloading behavior [9], unloading normal stress can significantly reduce shear strength [10], and cyclic loading-unloading processes show distinct spatiotemporal evolution and cumulative effects in the displacement field [11]. From an energy perspective, shear processes concentrate energy on structural surfaces facing the shear direction [12], and complex relationships exist between deformation energy, normal stress, and loading cycles [13].
Research shows that both elastic and plastic deformation can occur simultaneously even under stress states beyond the yield point, where the subloading surface model is considered a comprehensive theory applicable to metals, soils, rocks, and concrete [14]. Previous studies investigated the fatigue failure behavior of rocks by applying loads exceeding the peak strength in each cycle, but the characteristic of this study is the application of loads just below the peak strength. This allows for a detailed observation of the process of fatigue accumulation. And Previous experimental and theoretical studies on rock fractures under cyclic shear load have mostly used a constant shear rate, with cyclic loads often exceeding the peak shear strength of the rock fractures in each cycle [15,16,17]. Compared to constant-rate shear tests, the slip and dislocation caused by tiered shear stress before the peak is less pronounced. The damage characteristics and mechanical properties of rock fractures under pre-peak tiered shear loading are therefore more representative of actual in-situ stress states [18]. In other words, the loading and unloading path significantly impacts the behavior of rock fractures.
Regarding damage evolution, rocks show distinct directional and anisotropic characteristics. Irreversible strains in principal stress directions vary linearly with cumulative damage [19], and damage variables increase exponentially with strain [20]. During cyclic loading-unloading, rocks exhibit significant hysteresis and energy dissipation [21], and a logarithmic relationship has been found between electromagnetic radiation energy and cumulative dissipated energy [22]. Concerning creep characteristics, experiments show that the decay creep time is longest at the first stress level, while the steady-state creep strain rate gradually increases with stress level [23]. For rock joints, the apparent dilation angle increases with roughness, but this effect diminishes with higher normal stress [24]. Environmental factors like wet-dry cycles lead to increases in instantaneous and stable strains, ultimately deteriorating the rock’s mechanical properties [25]. Furthermore, in the cyclic loading-unloading of coal-rock combinations, the strain phase gradually lags behind the stress phase due to the viscosity of mineral particles and interface friction [26]. Therefore, it is crucial to investigate the deformation and failure mechanisms of rock fractures under tiered cyclic shear loading and unloading conditions.
Although previous studies investigated roughness damage after 30% and 50% peak strength shear, this study adopts a distinct approach. To simulate a more realistic stress history, we propose new loading and unloading paths and conducted Tiered Cyclic Shear (TCS) tests. The objective was to investigate the shear mechanical behavior of marble fractures under loading and unloading shear stress. During the TCS tests, normal stress was kept constant while shear stress was loaded and unloaded until significant shear slip instability occurred. For comparison, Direct Shear Tests (DST) were performed on identical marble samples, where normal stress was also kept constant while shear stress was increased gradually until significant shear slip instability.

2. Sample Preparation, Equipment and Test Procedure

2.1. Marble Materials and Fracture Preparation

The rock used in this study was marble stone, which was sourced from a quarry of Fengxian county, located in Jiangsu Province. According to X-ray diffraction test results, the marble material was composed of calcite, dolomite and magnesite. The rock is gray with a uniform texture and a particle size ranging from 0.2 to 0.5 mm. In accordance with the procedures outlined by the International Society for Rock Mechanics (ISRM), cylindrical specimens with a diameter of 50 mm and a height of 100 mm were prepared by drilling, sawing, and grinding the marble stone to ensure good uniformity of the same group of specimens.
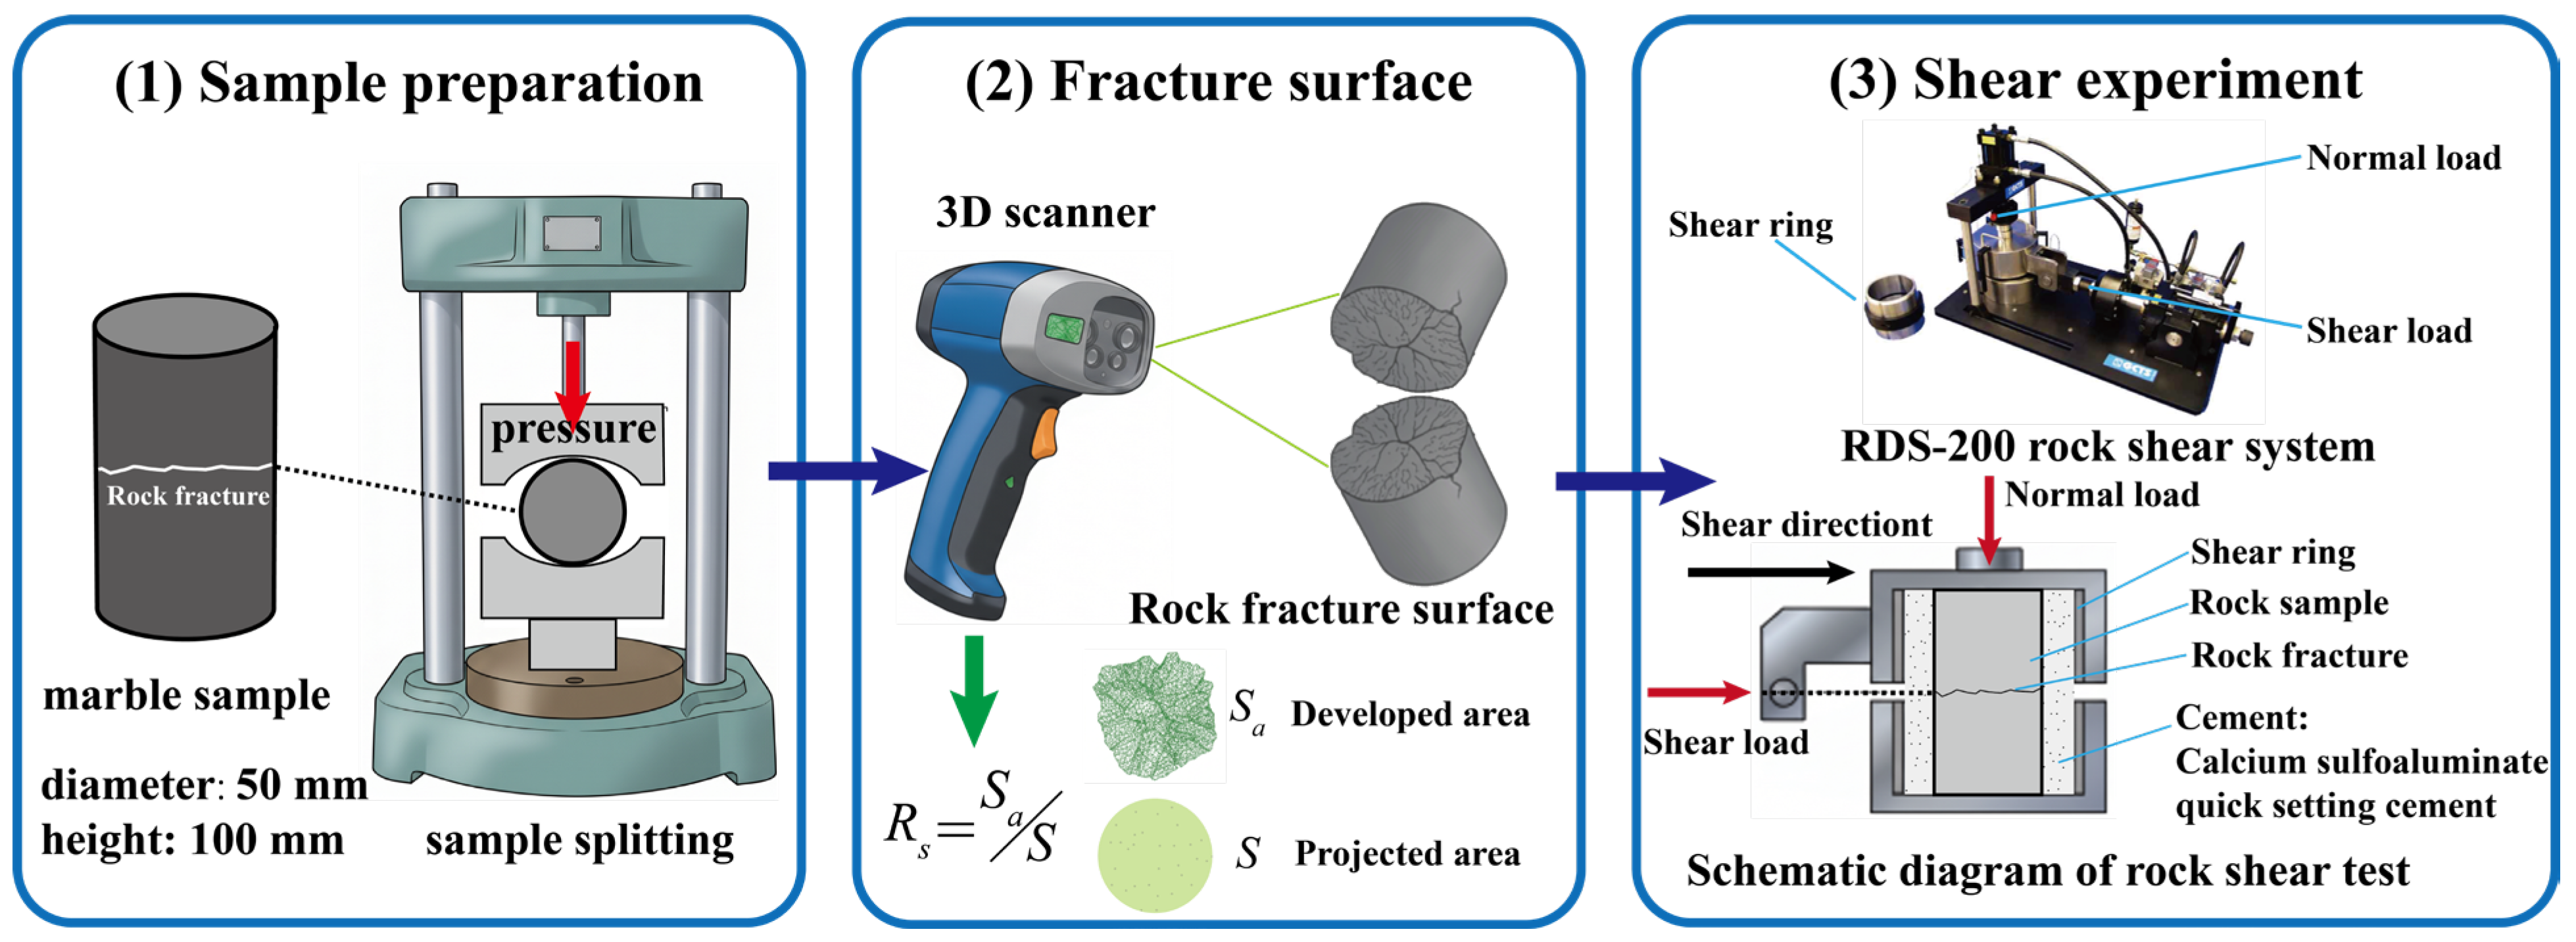
The intact marble sample was positioned in the self-made splitting grinding tool for the preparation of rock fracture, as shown in Figure 2. Under the action of the press machine, the formed fracture was parallel to the top and bottom faces of the sample and closely resembled a natural fracture.
After the preparation of marble fracture specimens examined in this study, The 3D morphologies of the fracture surfaces were obtained using a 3D scanner (Tianyun 3D Technology Co., Ltd., Guangzhou, China), as shown in Figure 2. The scanned morphology, when rendered by software, accurately captures the true shape of the fracture, which helps mitigate the dispersion of test results that can be caused by variations in fracture morphology [27]. An important parameter of 3D morphologies of the fracture surfaces, the contour area ratio, Rs, which is the ratio of the developed area (Sa) of the fracture contour surface to the projected area (S), reflects the roughness of the fracture surface. The closer Rs is to 1, the smoother the fracture surface is [28]. On the contrary, the rougher the fracture surface is. In this paper, Rs is taken as the mean value of the upper and lower fracture surfaces, as shown in Table 1.

2.2. Experimental Equipment

In this experiment, the RDS-200 rock mechanics shear test system manufactured by the American GCTS company (Tempe, AZ, USA) was utilized. Figure 2 shows both a photograph of the experimental apparatus and a simplified diagram of the test facility. The system is known for its high reliability and accuracy. It is controlled by an electro-hydraulic servo system, with maximum normal and shear loads of 100 kN and 50 kN, respectively. The system’s displacement and loading accuracies are 10−3 mm and 10−4 MPa, respectively.

2.3. Test Procedure

2.3.1. Direct Shear Test

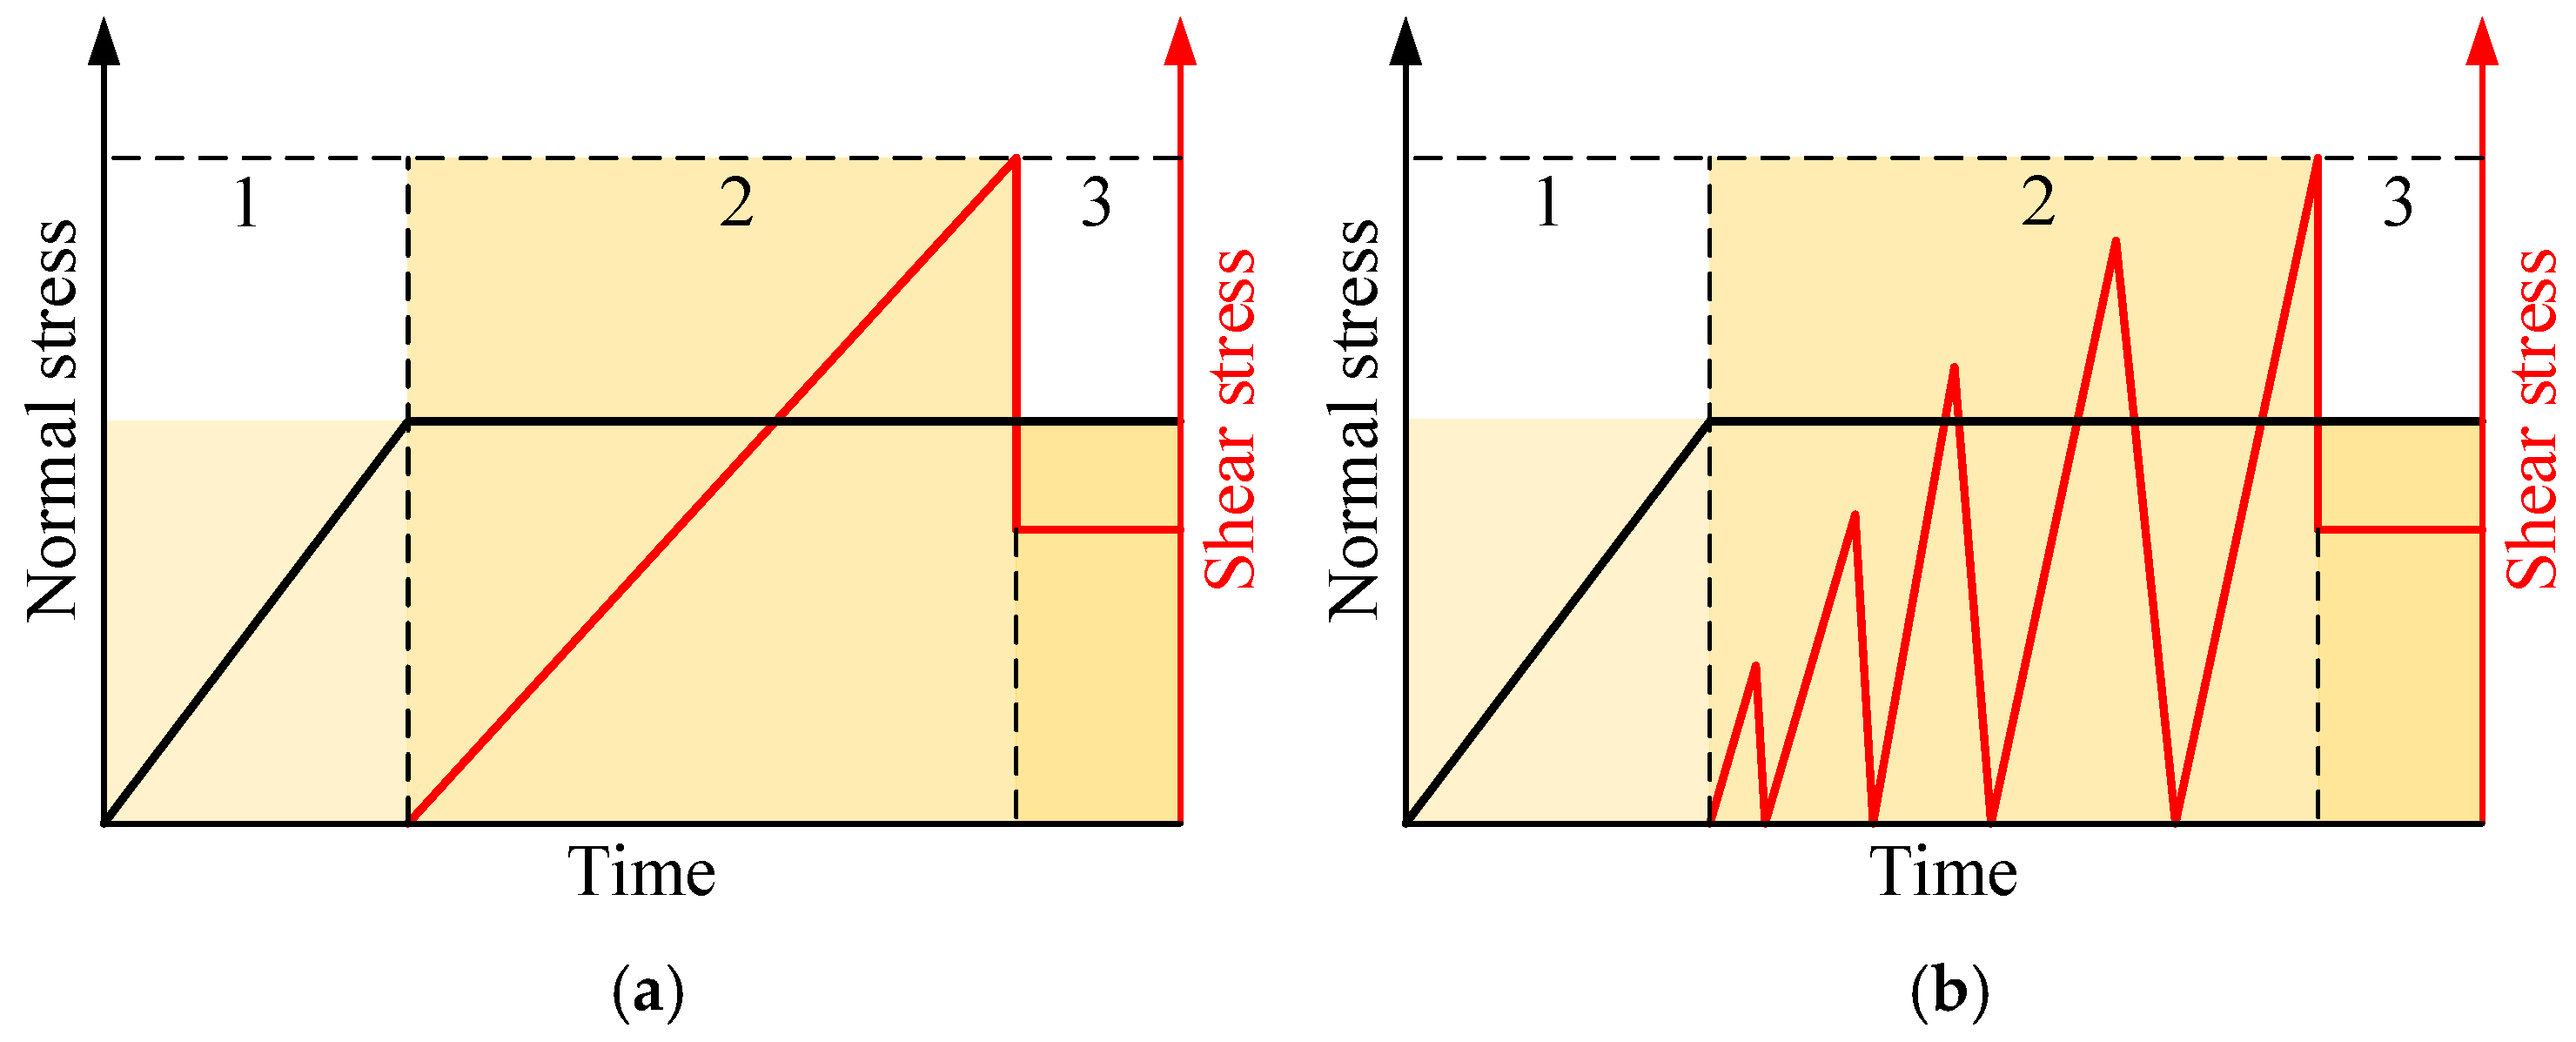
In this study, a total of six direct shear tests and six-tiered cyclic shear tests were carried out at a room temperature of 25 °C. Figure 3a illustrates the schematic diagrams of stress paths of the direct shear tests. The direct shear tests were performed as follows: (1) A normal stress was applied at a loading rate of 20 kPa/s until it reached a predetermined value (0.5 MPa, 1 MPa, 2 MPa, 3 MPa, 4 MPa, or 5 MPa). (2) Under constant normal stress, a shear stress was applied in a stress-controlled mode at a loading rate of 10 kPa/s. (3) The shear stress was continuously increased until a clear shear slip instability occurred in the rock fractures. During the loading phase, a slower rate (10 kPa/s) is used to provide sufficient time for the rock to undergo plastic deformation and microcrack propagation. This allows for a more accurate capture of its mechanical behavior, including deformation characteristics and damage accumulation. Conversely, a faster rate (20 kPa/s) is applied during the unloading phase. This is because plastic strain is irreversible, while elastic strain recovery occurs more rapidly. Table 1 presents the test data for the marble specimens with fractures subjected to direct shear stress.

2.3.2. Tiered Cyclic Shear Tests

In tiered cyclic shear tests, six samples were divided into two groups and subject to different normal stress of 1.5 MPa and 3 MPa, and the effect of tiered shear on marble specimens with the fractures under different normal stress was compared. To achieve a certain number of cycles in tiered cyclic shear tests, six samples were used for direct shear tests to determine the shear strength parameters of marble specimens with the fractures, providing a reference for the classification of shear stress in tiered cyclic shear tests under two normal stress conditions. According to the results of direct shear tests, the cohesion and internal friction angle of the rock fracture was 1.136 MPa and 48.4°. Therefore, in the TCS test of this study, the predicted shear strength was 2.826 MPa and 4.517 MPa at normal stresses of 1.5 MPa and 3 MPa, respectively. To avoid the excessive shear stress grades, the initial shear stress was set as 1.2 MPa and 2.0 MPa, and the corresponding increment was set as 0.3 MPa and 0.4 MPa per cycle, respectively. In this way, the enhanced damage effect of tiered cyclic loading on the fracture was considered, and specimens can be guaranteed to undergo four or five cycles of cyclic shear process.
The schematic diagram of stress paths of the tiered cyclic shear tests is shown in Figure 3b. The tiered cyclic shear tests were performed as follows: (1) Normal stress was applied at a loading rate of 20 kPa/s until the predetermined pressure (1.5 MPa or 3 MPa) was reached. (2) Under constant normal stress, a stress-controlled mode was used. The shear stress was loaded to a predetermined value at a rate of 10 kPa/s and then immediately unloaded at a rate of 20 kPa/s. This loading and unloading rate was maintained for each subsequent cycle, but the predetermined stress value for each tier was progressively increased. (3) The shear stress was continuously loaded and unloaded until a clear shear slip instability was observed in the rock fractures. The test data of marble specimens with the fractures under tiered cyclic shear conditions are listed in Table 1.

3. Experimental Results and Analysis

3.1. Shear Stress-Shear Displacement Curves

3.1.1. Changes of Shear Displacement

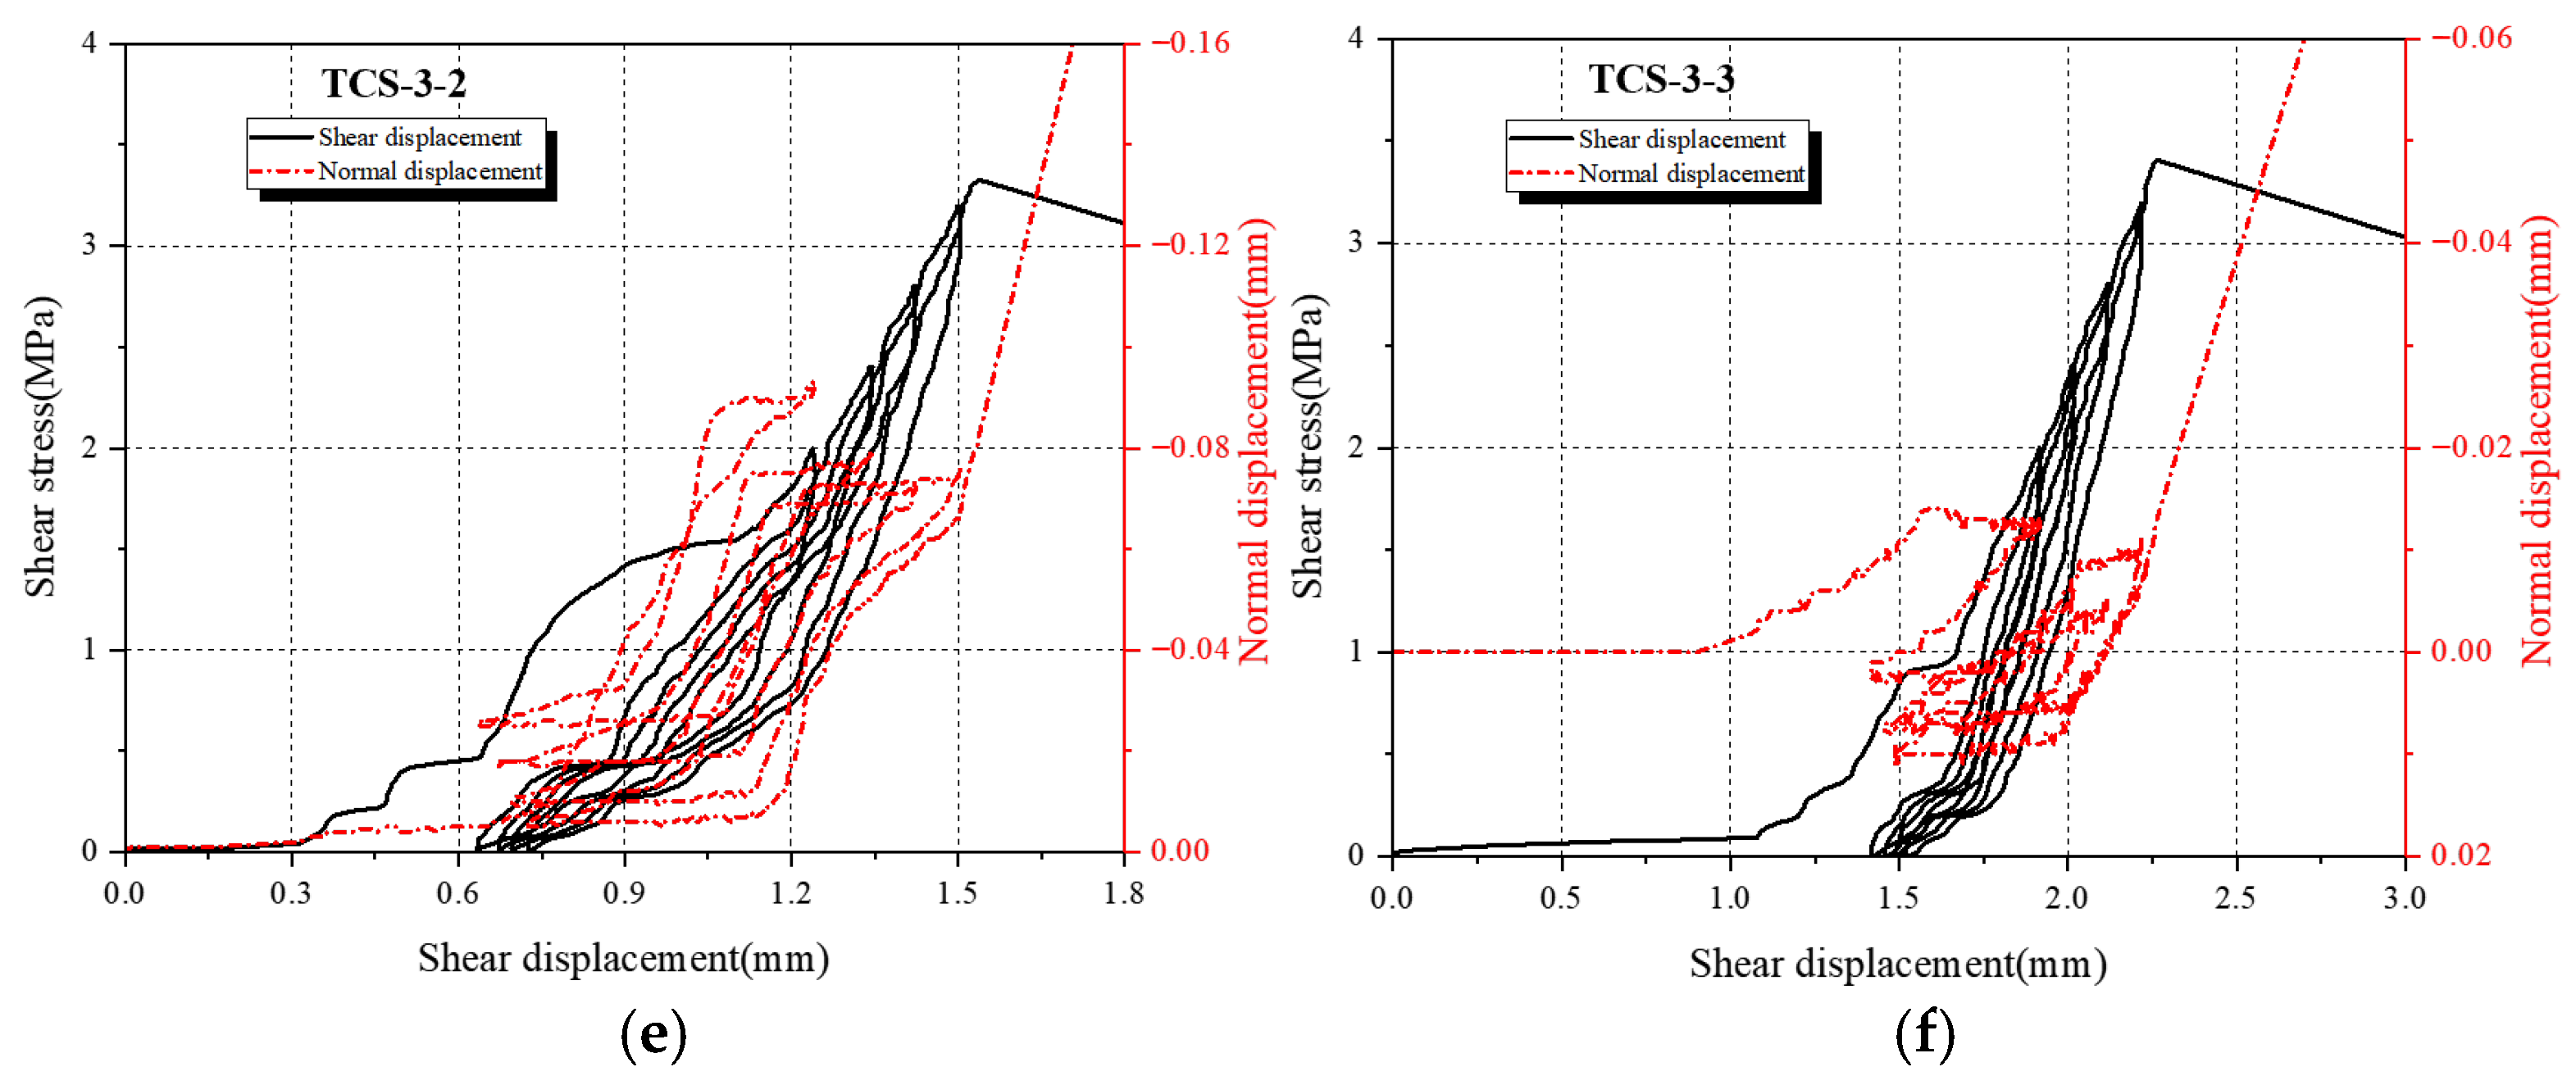
The variation of shear displacement and normal displacement with shear stress is shown in Figure 4. The shear and normal displacements before loading shear stress were normalized to zero (i.e., initial compression and shear plane glides are omitted in the first step of Figure 4). Since the shear stress linearly increased at the final loading level, a large shear displacement occurred quickly when the sample failed. Subsequently, the shear stress decreased rapidly because the fracture surface cannot bear such large shear stress.
In the second stage, the normal stress remains constant, while the shear stress linearly increases or decreases over time in each cycle. Thus, the shear displacement gradually increases or decreases in the stress-controlled mode.

3.1.2. Residual Shear Displacement

The residual shear displacement (RSD) is defined as the shear displacement when the shear stress is unloaded to 0 MPa in each cycle [13,18]. As presented in Figure 5, when the shear stress was unloaded to 0 MPa in the 1st cycle, a large RSD was observed, which was mainly caused by the coupling compaction of the major asperity with larger size and strength of rock fractures. The unrecoverable RSD from all tiered loading and unloading cycles was analyzed. It was found that the RSD increased linearly with the increasing number of cycles. This indicates that the damage to the fracture is affected by the tiered shear stress; specifically, the degree of fracture damage increases linearly as the number of tiered cyclic shear events rises. This is primarily attributed to the cumulative plastic deformation of the marble, which increases with the number of loading and unloading cycles. Its mechanical response under cyclic shear is closely related to its plastic properties, mineral composition, and initial defects.

3.1.3. Shear Slip During Loading and Unloading

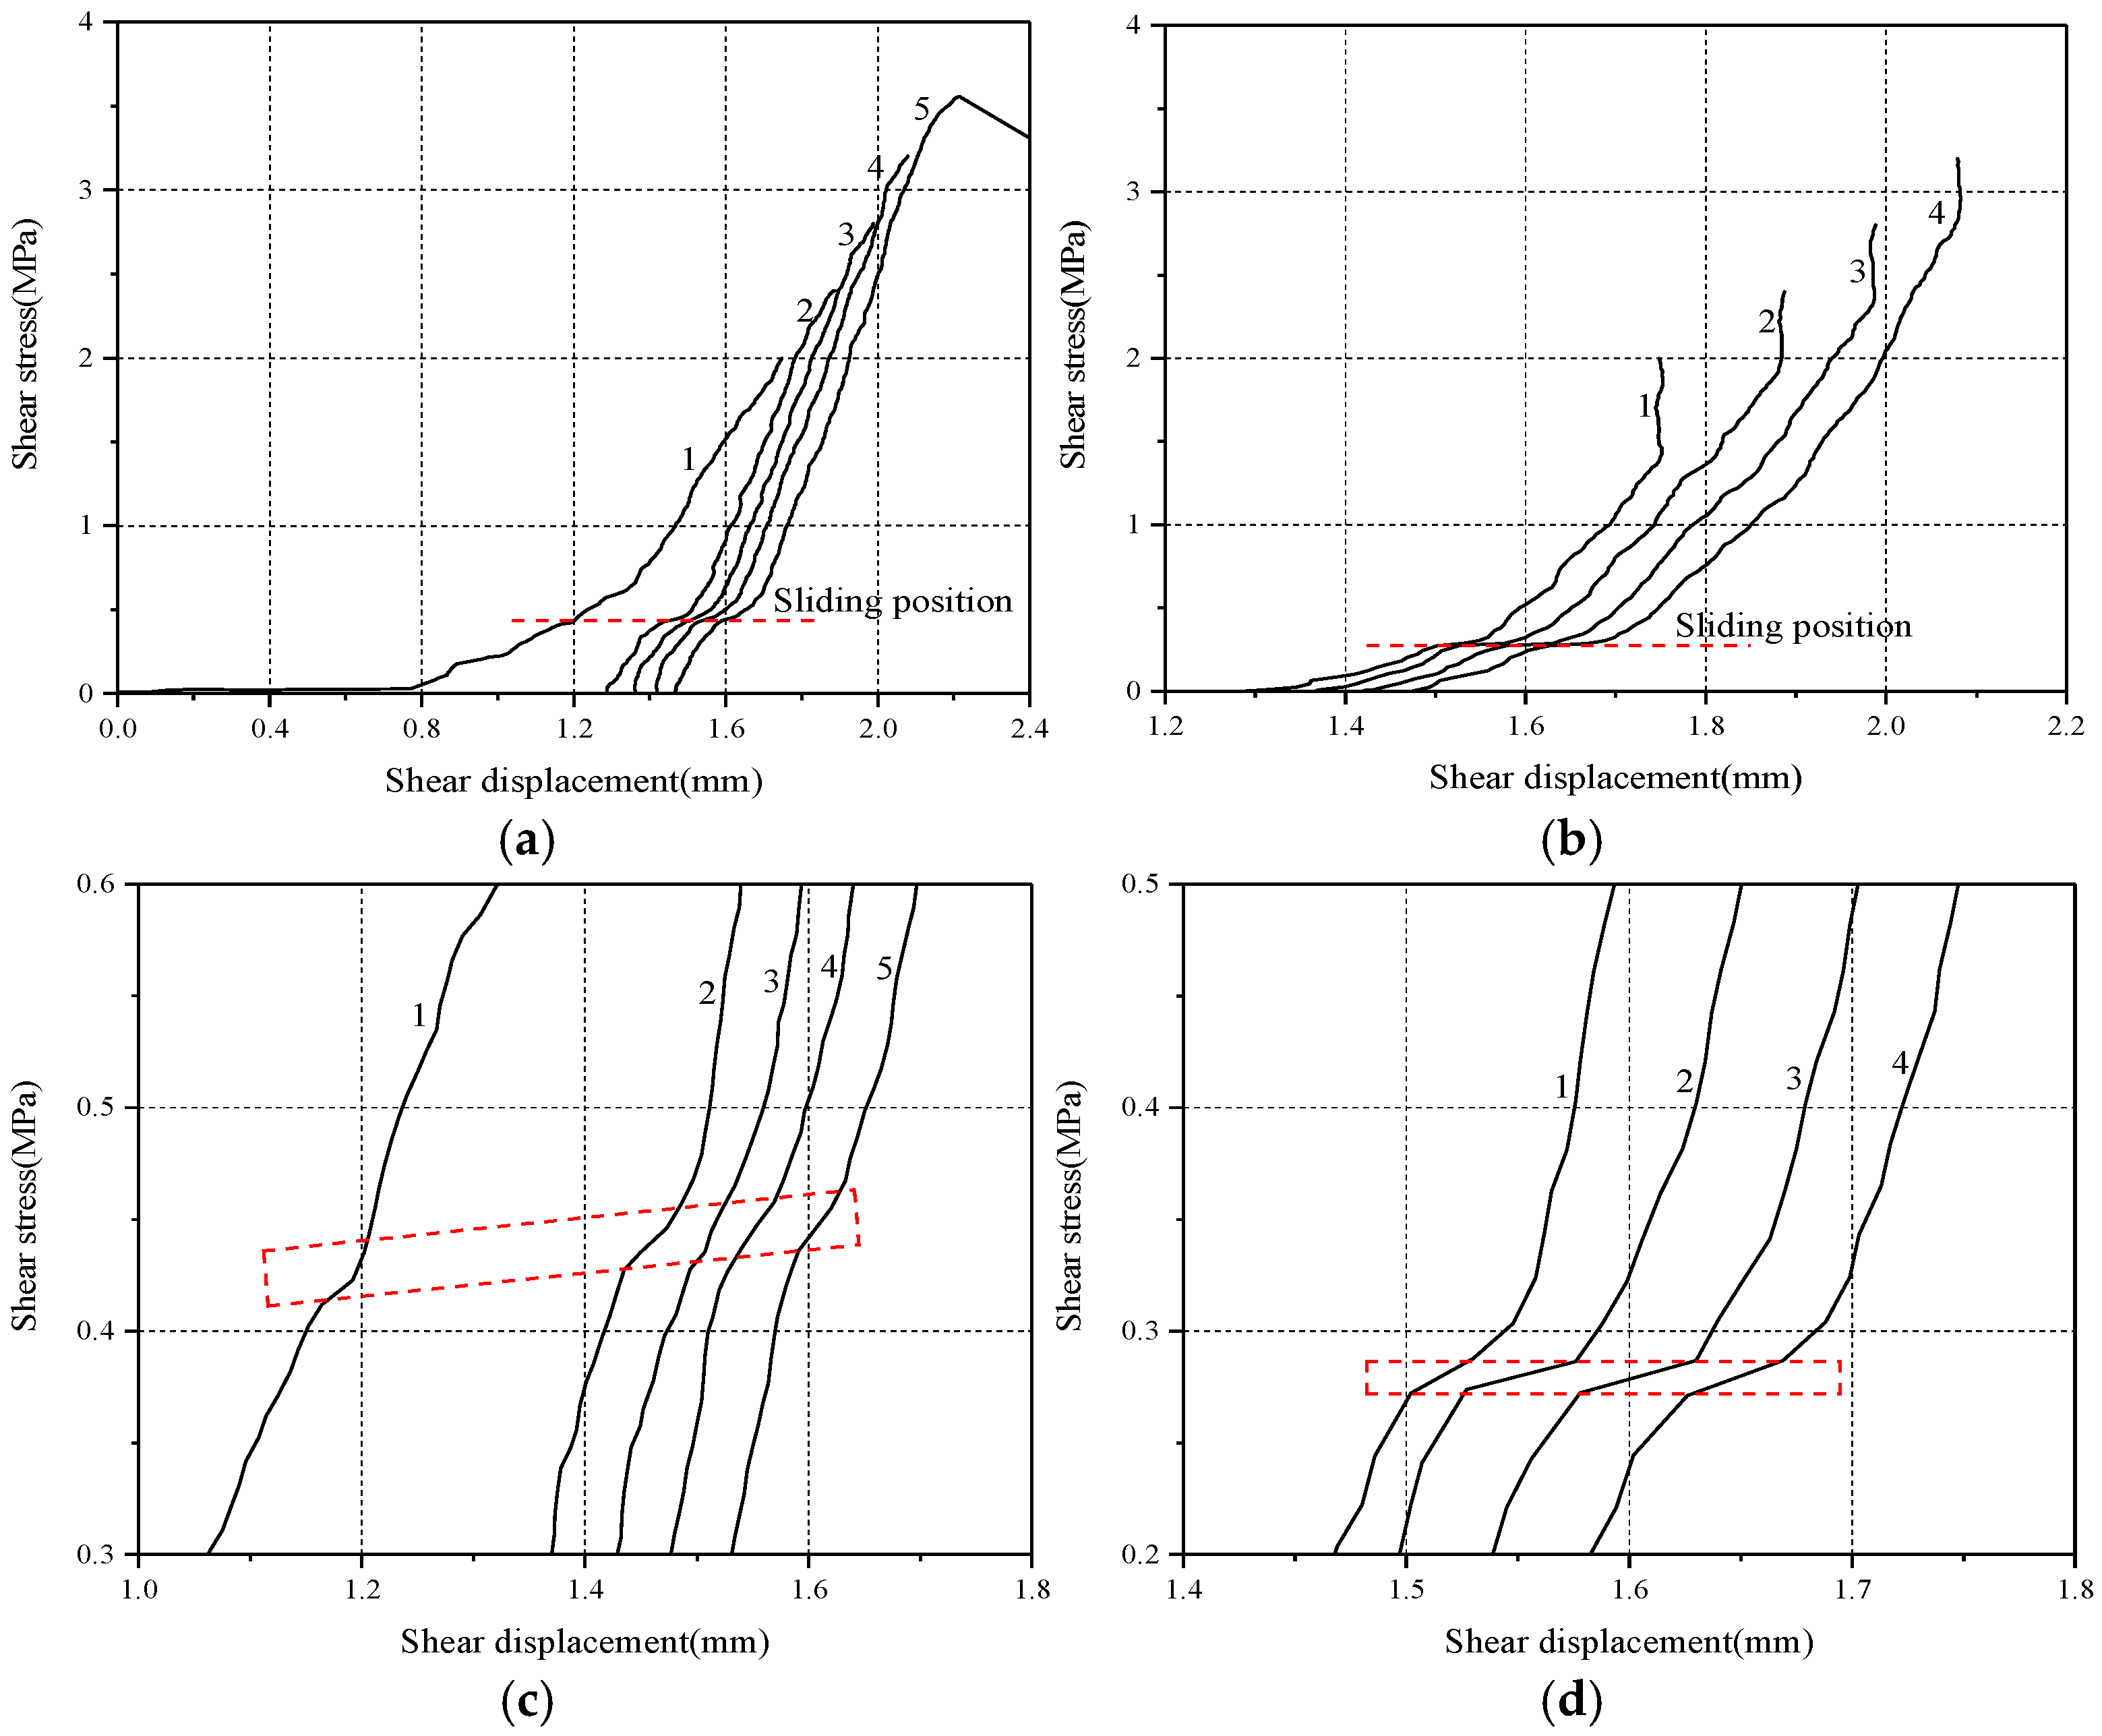
Figure 4 shows the typical tiered cyclic loading and unloading test curves. When the shear stress is reloaded more than the previous level, the shear displacement-shear stress curves continue to increase along the loading curve of the previous cycle [13]. It indicates that the shear displacement of rock fractures has memory functions under pre-peak tiered cyclic shear loading. It was proved that the linear characteristics of shear deformation are strengthened after cyclic loading and unloading progress. It can be seen from Figure 6 that the loading and unloading curves at all levels have linear characteristics, but the direct shear curves differ greatly from the unloaded curves. The loading process after unloading is named “reloading” and these reloading and unloading curves are analyzed separately.
Figure 6a shows the cyclic reloading shear displacement-shear stress curves of sample TCS-3-1. The reloading curves are approximately straight lines from the rising point to the descending inflection point of the curve, and the shear displacement-shear stress curves at each shear stress level have the same regularity and are almost parallel to each other. Each reloading curve can be roughly divided into two straight lines based on the shear slip position, as shown in Figure 6c. The shear stress of each curve is related to the cyclic series, and the shear slip stress increases with the increase in the cyclic series, as shown in the dotted bordered rectangle in Figure 6c. The slope of the reloading curves can be used to describe the deformation characteristics. Given the memory characteristics of rock fractures under tiered cyclic shear loading, when the maximum shear stress of reloading is lower than the instability stress of rock fractures, the reloading curve should also be a straight line.
For the duration of a slope engineering project’s service life, the rock mass, which contains interconnected fractures, is subject to cyclic loading. The load on these fractures is typically lower than their maximum shear strength. Therefore, when selecting parameters for a numerical simulation model, the parameters derived from the reloading shear stress-shear displacement curve are more representative of the actual deformation of rock fractures in engineering applications.
Figure 6b shows the shear displacement-shear stress curves of sample TCS-3-1 during the cyclic unloading. Generally, the shape characteristics of unloading curves of the four stages are similar, and these curves can be divided into two segments based on the position of shear slip, i.e., curve segment and straight segment. The shear stress of each curve is independent of the series and is almost parallel to the x-axis, as shown in the dotted bordered rectangle in Figure 6d.

3.1.4. Shear Displacement Hysteresis

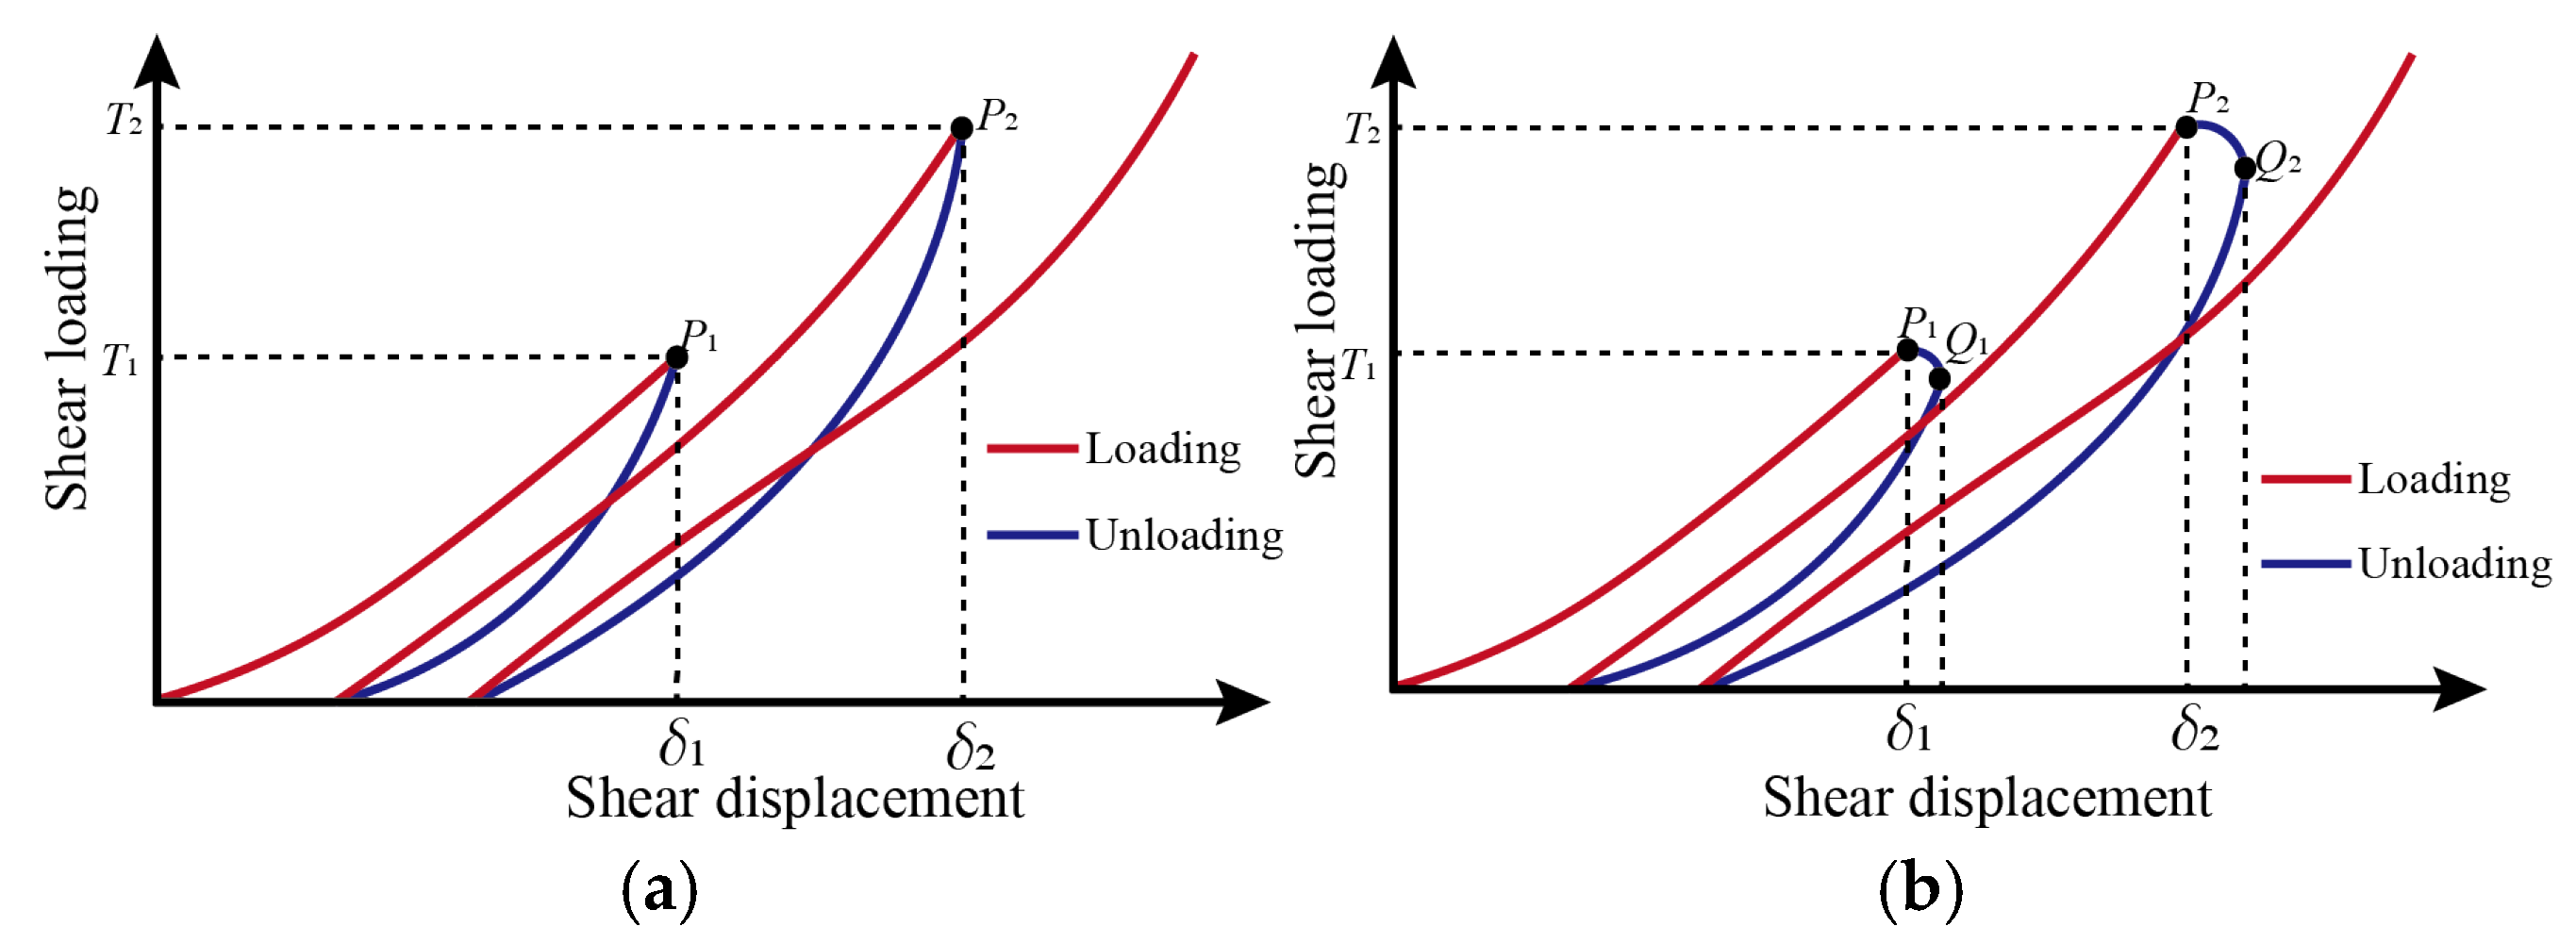
In tiered cyclic loading tests of intact coal and rock samples, the traditional view holds that the deformation will immediately increase or decrease with the loading or unloading progress [29,30,31,32,33,34,35,36]. As shown in Figure 7a, points P1 and P2 are the primary unloading point and the secondary loading point. In other words, the shear displacement decreases or increases at point P1 or P2. However, this expected outcome does not occur in this experiment. As shown in Figure 7b, the shear displacement does not decrease or increase immediately with the change in shear stress (P1Q1 and P2Q2). This is primarily due to the inherent flexibility of the testing machine, which stores elastic strain energy during loading. When the stress reaches the unloading point, this energy is momentarily released, causing the specimen to continue deforming briefly at the start of the unloading phase. Concurrently, there is a delay in the servo system’s response as it switches from loading to unloading, which also contributes to the initial increase in displacement. As shown in Figure 8, the errors are caused by the energy calculation. A more detailed description of the influence of shear displacement hysteresis on energy evolution is available in the literature.

3.2. Peak Shear Stress

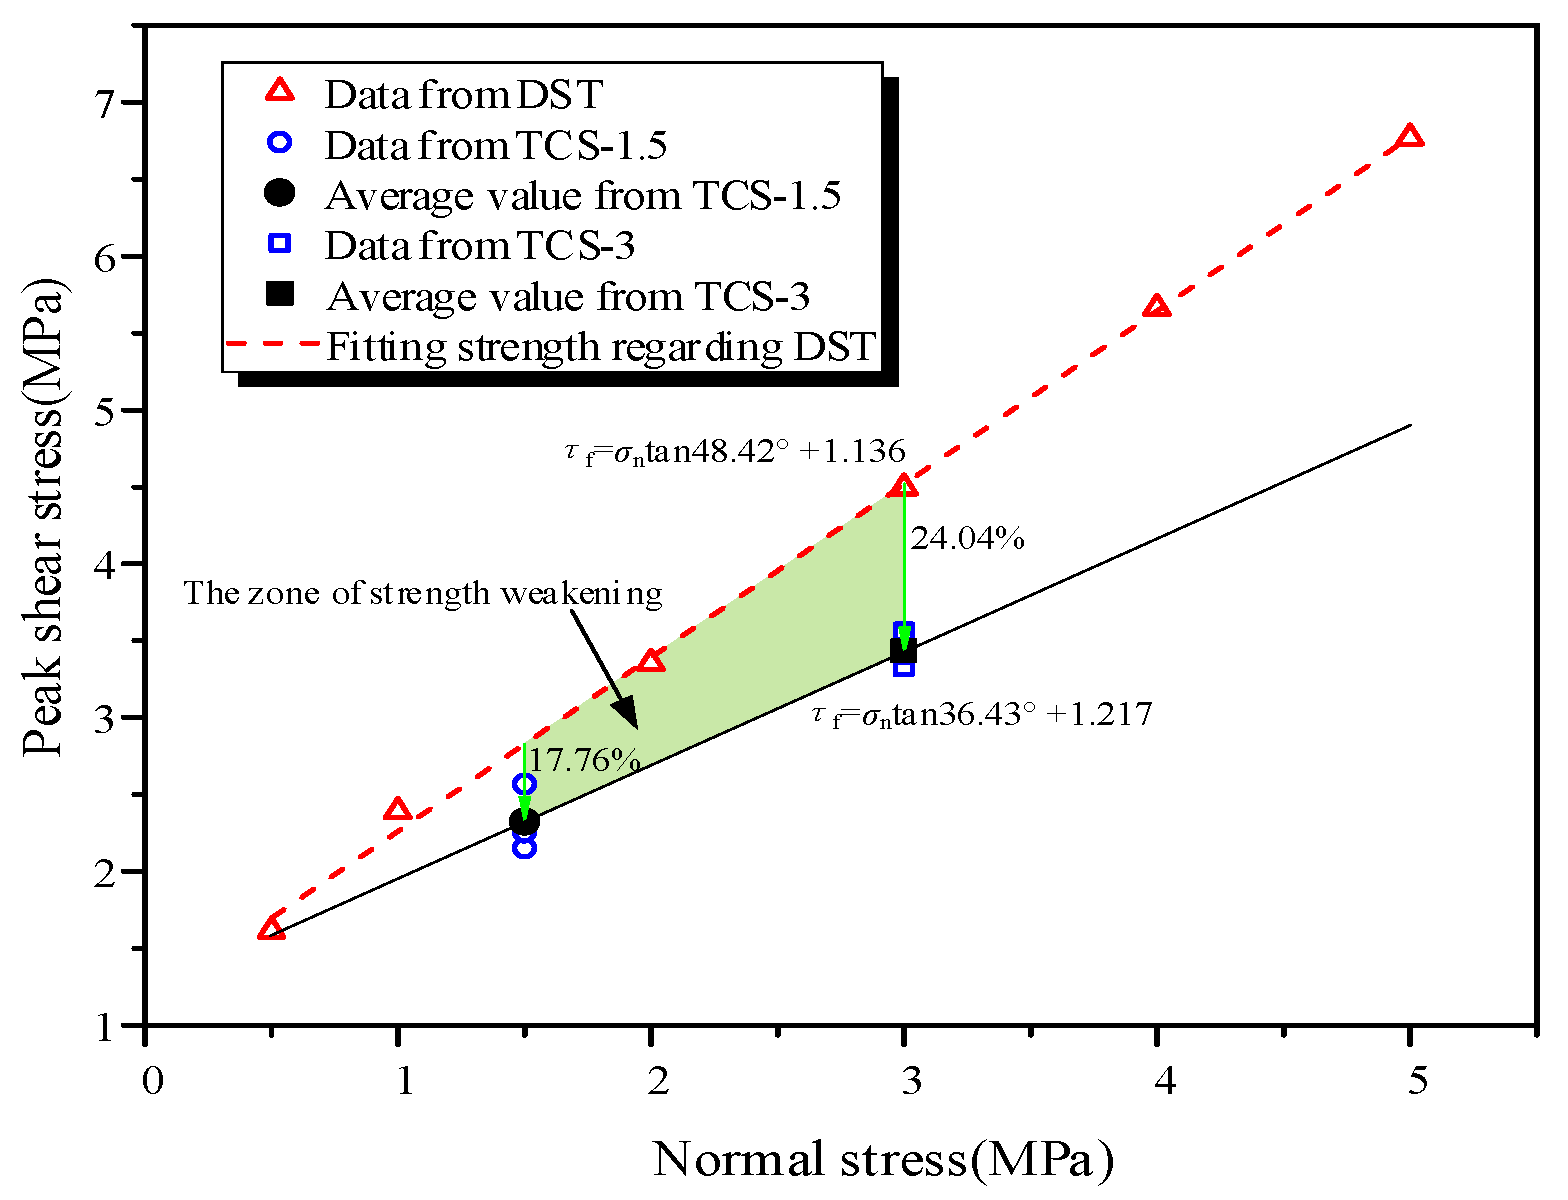
Figure 9 shows the peak shear strength tf and the fitting curves of specimens in the DST and the TCS. In the TCS tests, the internal friction angle (36.43°) was 24.76% lower than that in the DST tests (48.42°). However, the cohesion in the TCS tests (1.217 MPa) was 7.13% higher than that in the DST tests (1.136 MPa). It suggests that the stress path has an effect on the shear strength parameters. In addition, strength weakening can be observed in the process of TCS, while it is insignificant in the DST. As shown in Figure 9, the values of peak shear strength under the condition of TCS are 17.76% and 24.04%, which are less than those in the DST at the normal stress of 1.5 MPa and 3 MPa. The main reasons are as follows: (1) the friction and abrasion are intensified by the cyclic climbing along the inclined surface of the major asperity, and (2) the main crack is developed along with the potential shear band propagation, and the secondary cracks are generated rapidly [28].
In the TCS tests, the internal friction angle (36.43°) was 24.76% lower than that in the DST tests (48.42°). However, the cohesion in the TCS tests (1.217 MPa) was 7.13% higher than that in the DST tests (1.136 MPa).
The strength-weakening effect observed in the TCS tests suggests that cyclic tests can be a suitable method for determining the shear strength parameters in the stability evaluation of rocky slope engineering. The DST may lead to an excessive shear strength compared with the actual bearing strength. As shown in Figure 9, the two fitting curves of TCS and DST are not parallel. The weakening degree of shear strength is related to the normal stress and increases with the increase in normal stress. This is because large normal stress causes a friction and wear strengthening effect, which weakens the resistance to shear failure.
The above results are obtained based on the fitting of the curves. The strength-weakening effect of rock fracture under TCS can be used to predict the mechanical properties of other similar rock fractures. However, further study of different rock fractures is needed to make a more accurate prediction. The fitting equations can be used to predict whether the rock fractures in engineering will fail under tiered cyclic shear stress, which provides a reference for the evaluation of rock stability.

3.3. Failure Morphology

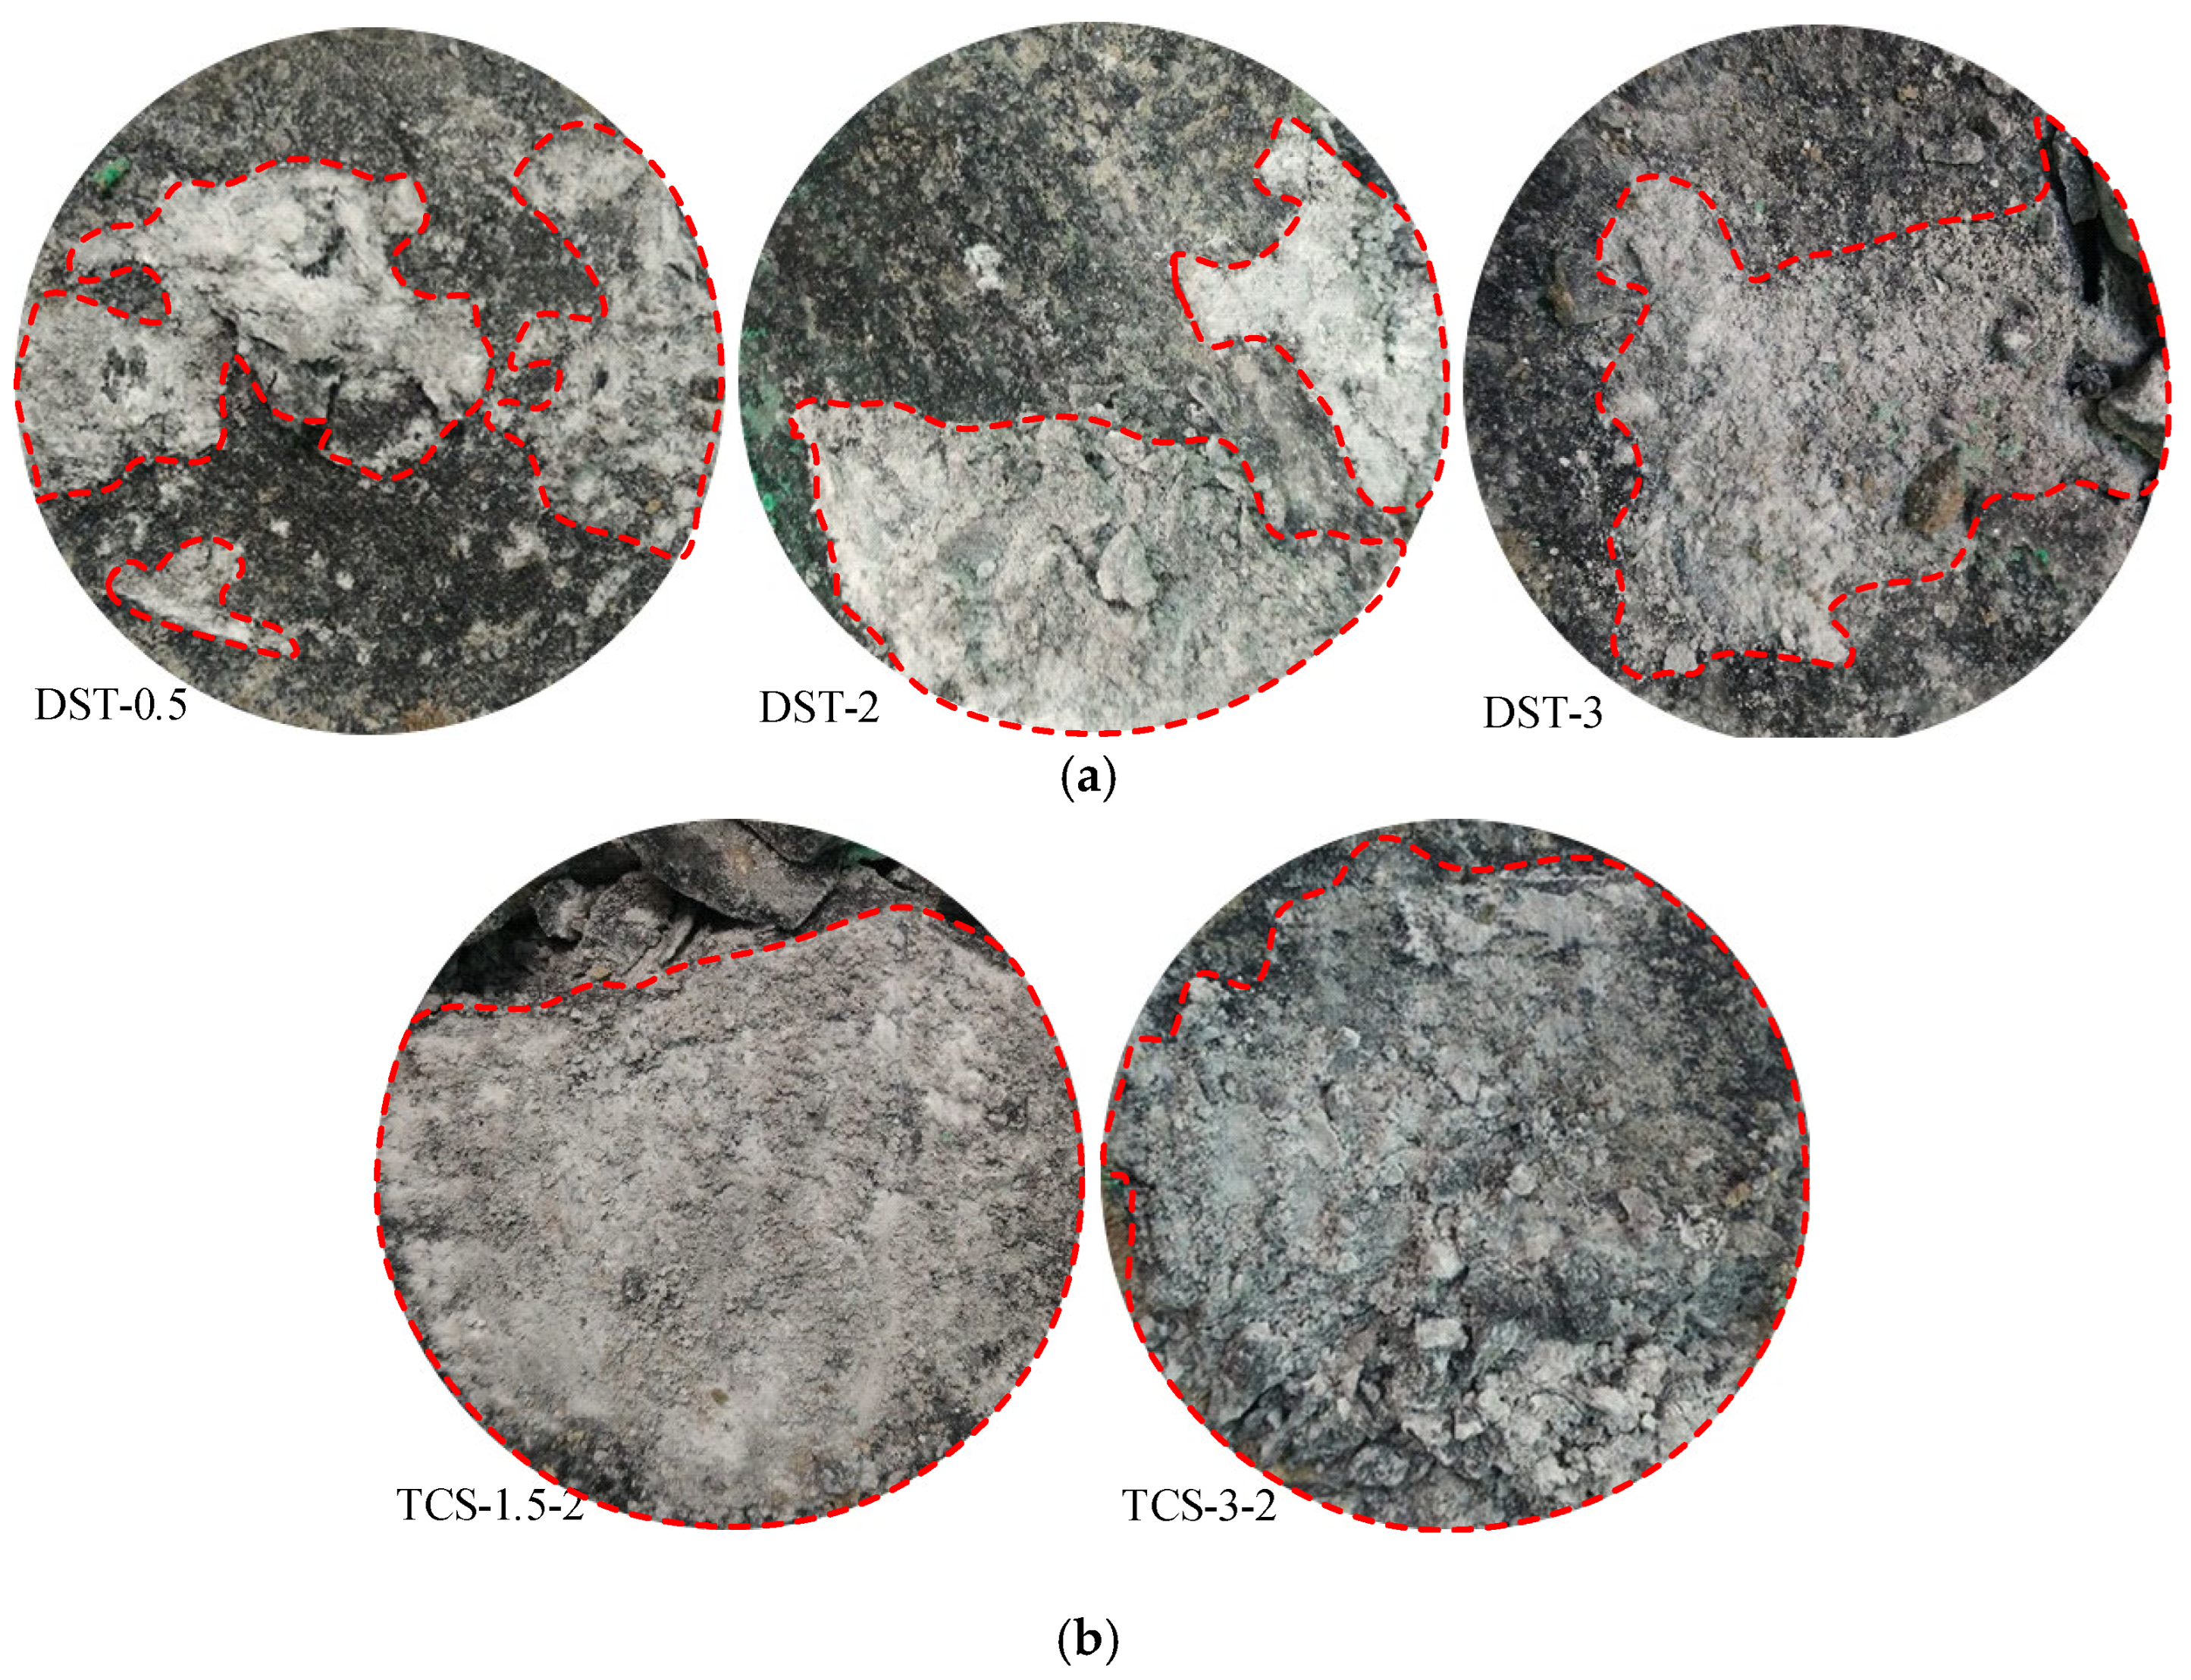
The failure morphology of marble specimens with the fractures in the DST and TCS is displayed in Figure 10. It can be found that the surface morphology of the fracture in the DST is clearer, and the local wear on the specimen can be found. However, the fracture surface morphology TCS is not significant, which is covered by rock debris. Thus, TCS has a greater effect on rock fractures. The analysis reveals that during the TCS, the major asperities repeatedly climb along the inclined surfaces, which leads to intensified friction and abrasion. Furthermore, the rapid initiation of secondary cracks makes the fracture surface more fragmented. If this phenomenon is extrapolated to the engineering failure of a rock slope, it would result in more crushed stone and debris rolling off the fracture, potentially causing secondary damage to structures located below the slopes. Therefore, this scenario should be fully considered in practical applications.
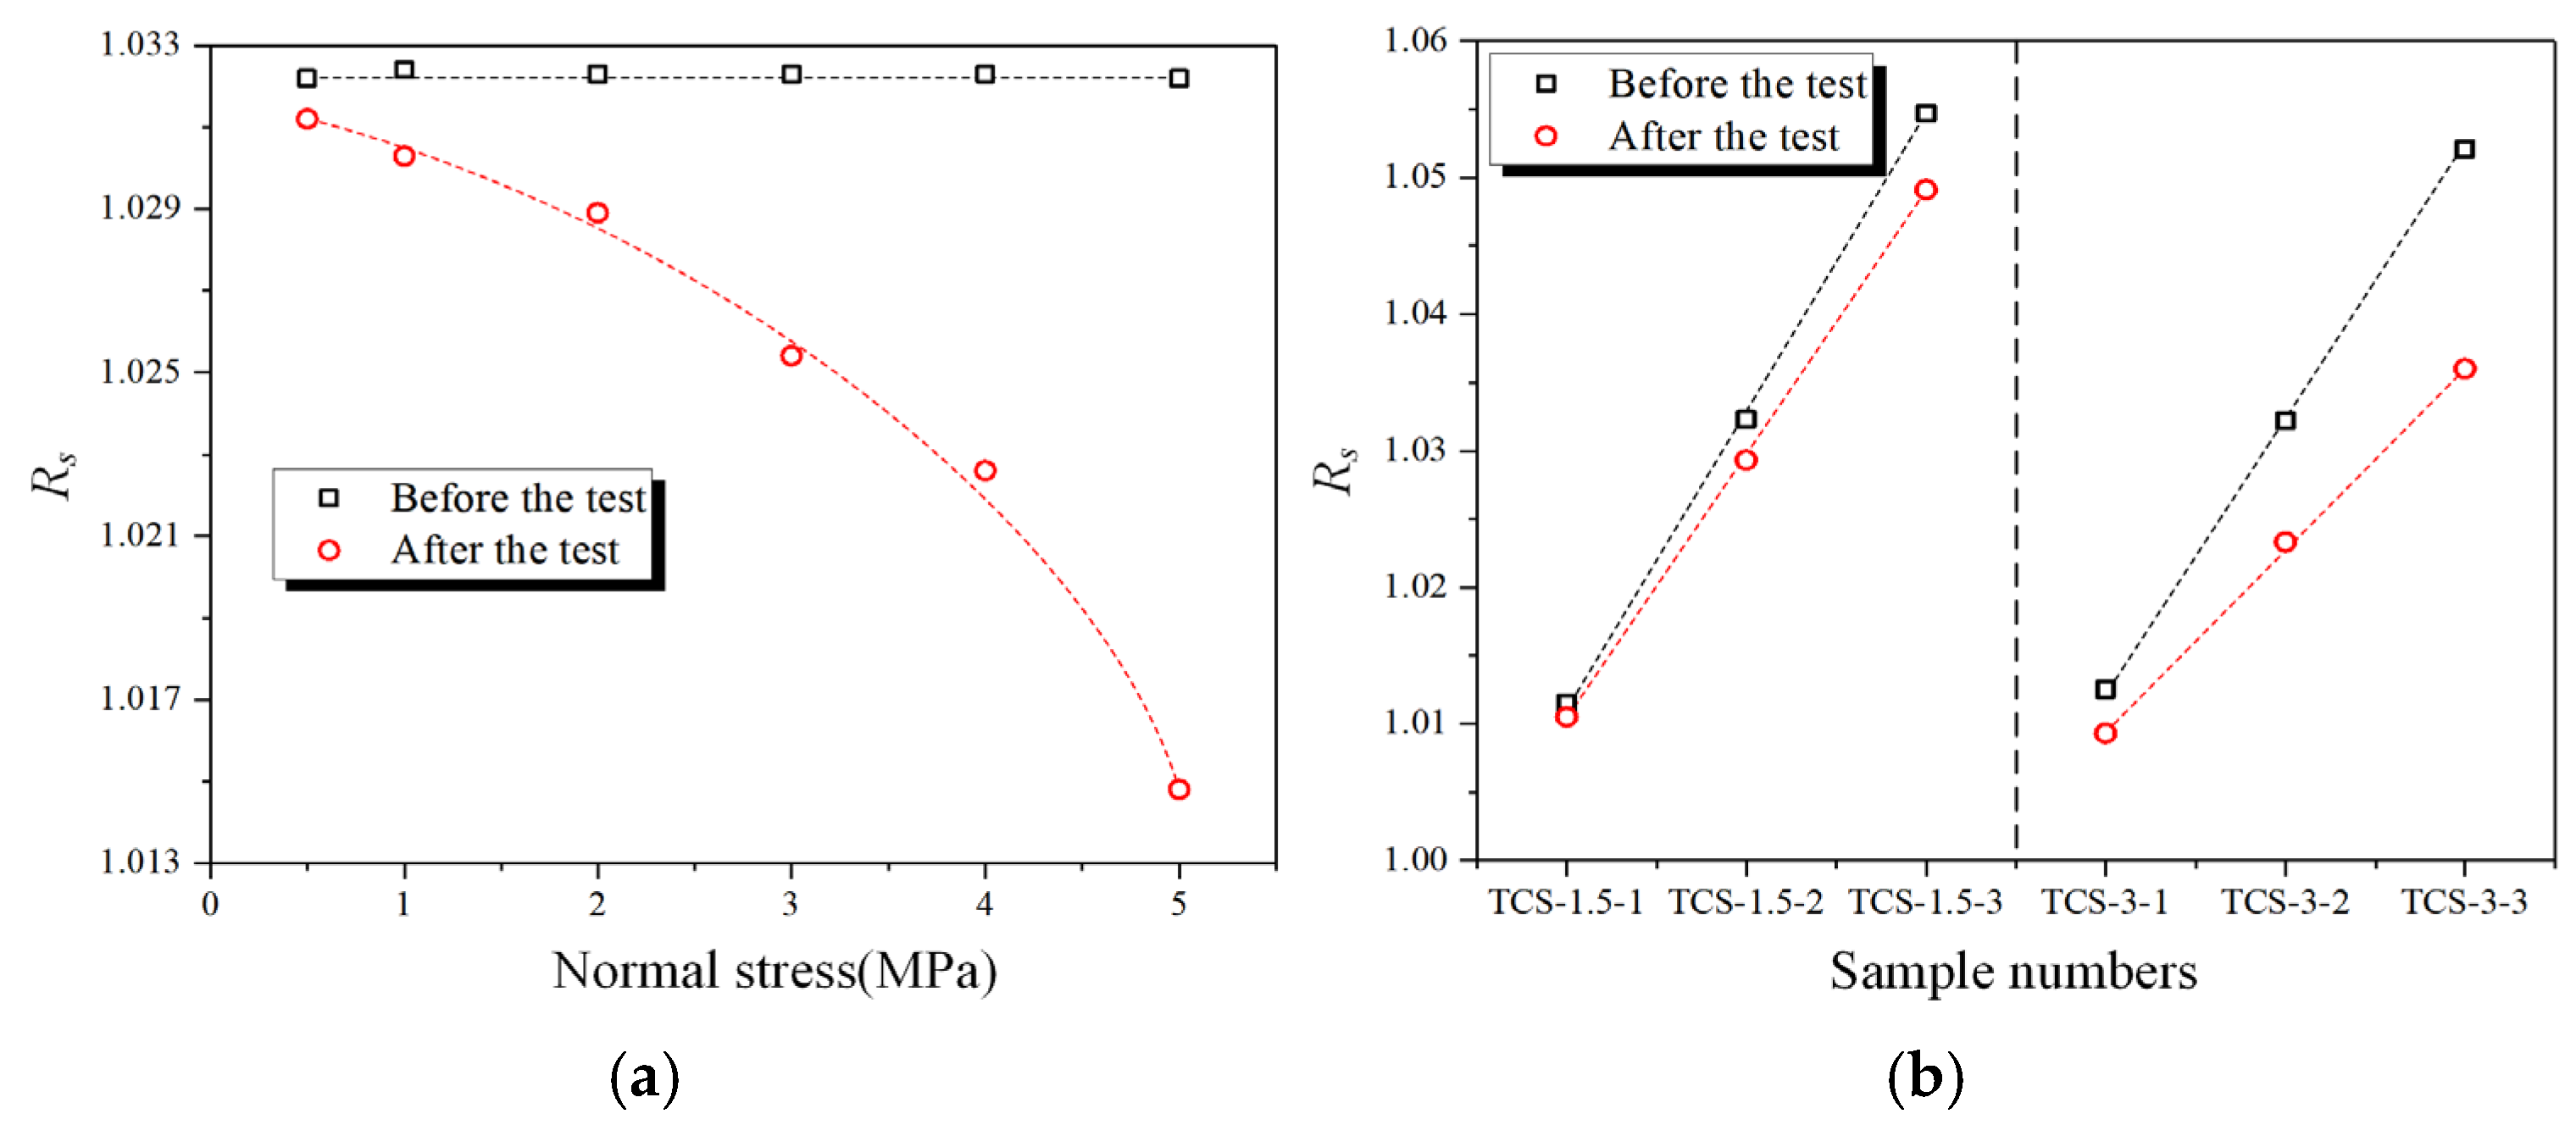
Figure 11 illustrates the variation of the contour area ratio with normal stress and initial contour area ratio. This value was obtained by direct measurement of the sheared surface without cleaning, thereby effectively accounting for the influence of rock fragments and broken particles generated during the shearing process. As shown in Figure 11a, the decline rate of Rs is associated with the value of normal stress. With the increases in normal stress, the values of the Rs after the DST decrease exponentially. As the normal stress increases from 0.5 MPa to 5 MPa, the Rs decreases from 1.0312 to 1.0148, decreasing by 15.91%. Therefore, higher normal stress can cause a greater decreasing rate of Rs.
Figure 11b shows the fitting curves of Rs before and after the TCS under two groups of different normal stress. The changes in Rs under the normal stress of 1.5 MPa agree well with those under normal stress of 3 MPa, presenting a significant decrease after the experiment. In addition, when the normal stress is 1.5 MPa and 3 MPa, the decreasing rate of Rs is related to the normal stress and the initial Rs. Under the same normal stress, the Rs after TCS decreases linearly with the increases in the initial Rs.

3.4. Energy Evolution

As the shear and normal displacement of rock fracture are strongly related to the energy dissipation and energy release [13,18,37,38,39,40,41,42,43]. The energy forms in the experimental process include elastic energy and dissipated energy. Elastic energy is the energy accumulated in the elastic deformation of the specimen, while dissipated energy is the energy released during rock fracture, serving as a key indicator for quantifying the accumulation of internal damage in the rock. The sum of these two is the total energy. Based on different loading conditions, the energy is categorized into energy from shear loading and energy from normal loading. Among these, shear loading energy is the core component of energy analysis. It consists of the total energy completed during the loading phase (corresponding to the total area under the loading curve), the recoverable shear elastic energy after unloading (the area under the unloading curve), and the irreversible shear dissipated energy (the area of the hysteresis loop). Meanwhile, due to shear dilation or consolidation during the shear process, the constant normal load also contributes to normal displacement. This portion of energy from normal loading is the product of the normal load and the change in normal displacement.
U i = 0 δ l 1 i T ( δ ) d δ + N ( d l 1 i d l 0 i ) U e i = δ l 1 i δ u 1 i T ( δ ) d δ + N ( d u 1 i d l 1 i ) U d i = U i U e i
where, d is the shear displacement value during the shearing process; U, Ue and Ud respectively represent the total energy, elastic energy, and dissipated energy in the i-th cycle. dl1i and du1i represent the final values of shear displacement in the loading and unloading stages of the i-th cycle; dl1i and du1i represent the final values of normal displacement in the loading and unloading stages of the i-th cycle; dl0i represent the initial value of normal displacement in the loading stage of the i-th cycle, and T(d) and N respectively represent the shear load and constant normal load during the loading and unloading process.
The relationship between total energy U, elastic energy Ue, dissipated energy Ud, and cycle number of specimens is plotted under the condition of tiered cyclic shear stress, as shown in Figure 12a–f. During the first cyclic shear stage, a significant portion of the total energy (U) is converted into dissipated energy (Ud) within the rock fractures. The dissipation at this stage is primarily a result of the compaction and compression of the rock fractures, and the proportion of elastic energy (Ue) is relatively small. With the increases of cyclic shear stress, most of the total energy U is transferred into elastic energy Ue, and the elastic energy can be used to recover shear displacement after shear unloading. As the cyclic shear stress continues, the space among fractures is totally compacted. The elastic energy Ue that can be released in rock fractures increases faster than the dissipated energy Ud. The increment of dissipated energy Ud is steady with a small increasing rate. This is because when the rock breaks, most of the total energy is stored in the rock failure in the form of elastic energy and is not destroyed. At the final cyclic shear stage, it can be clearly observed that the difference between U and Ue becomes larger accordingly.
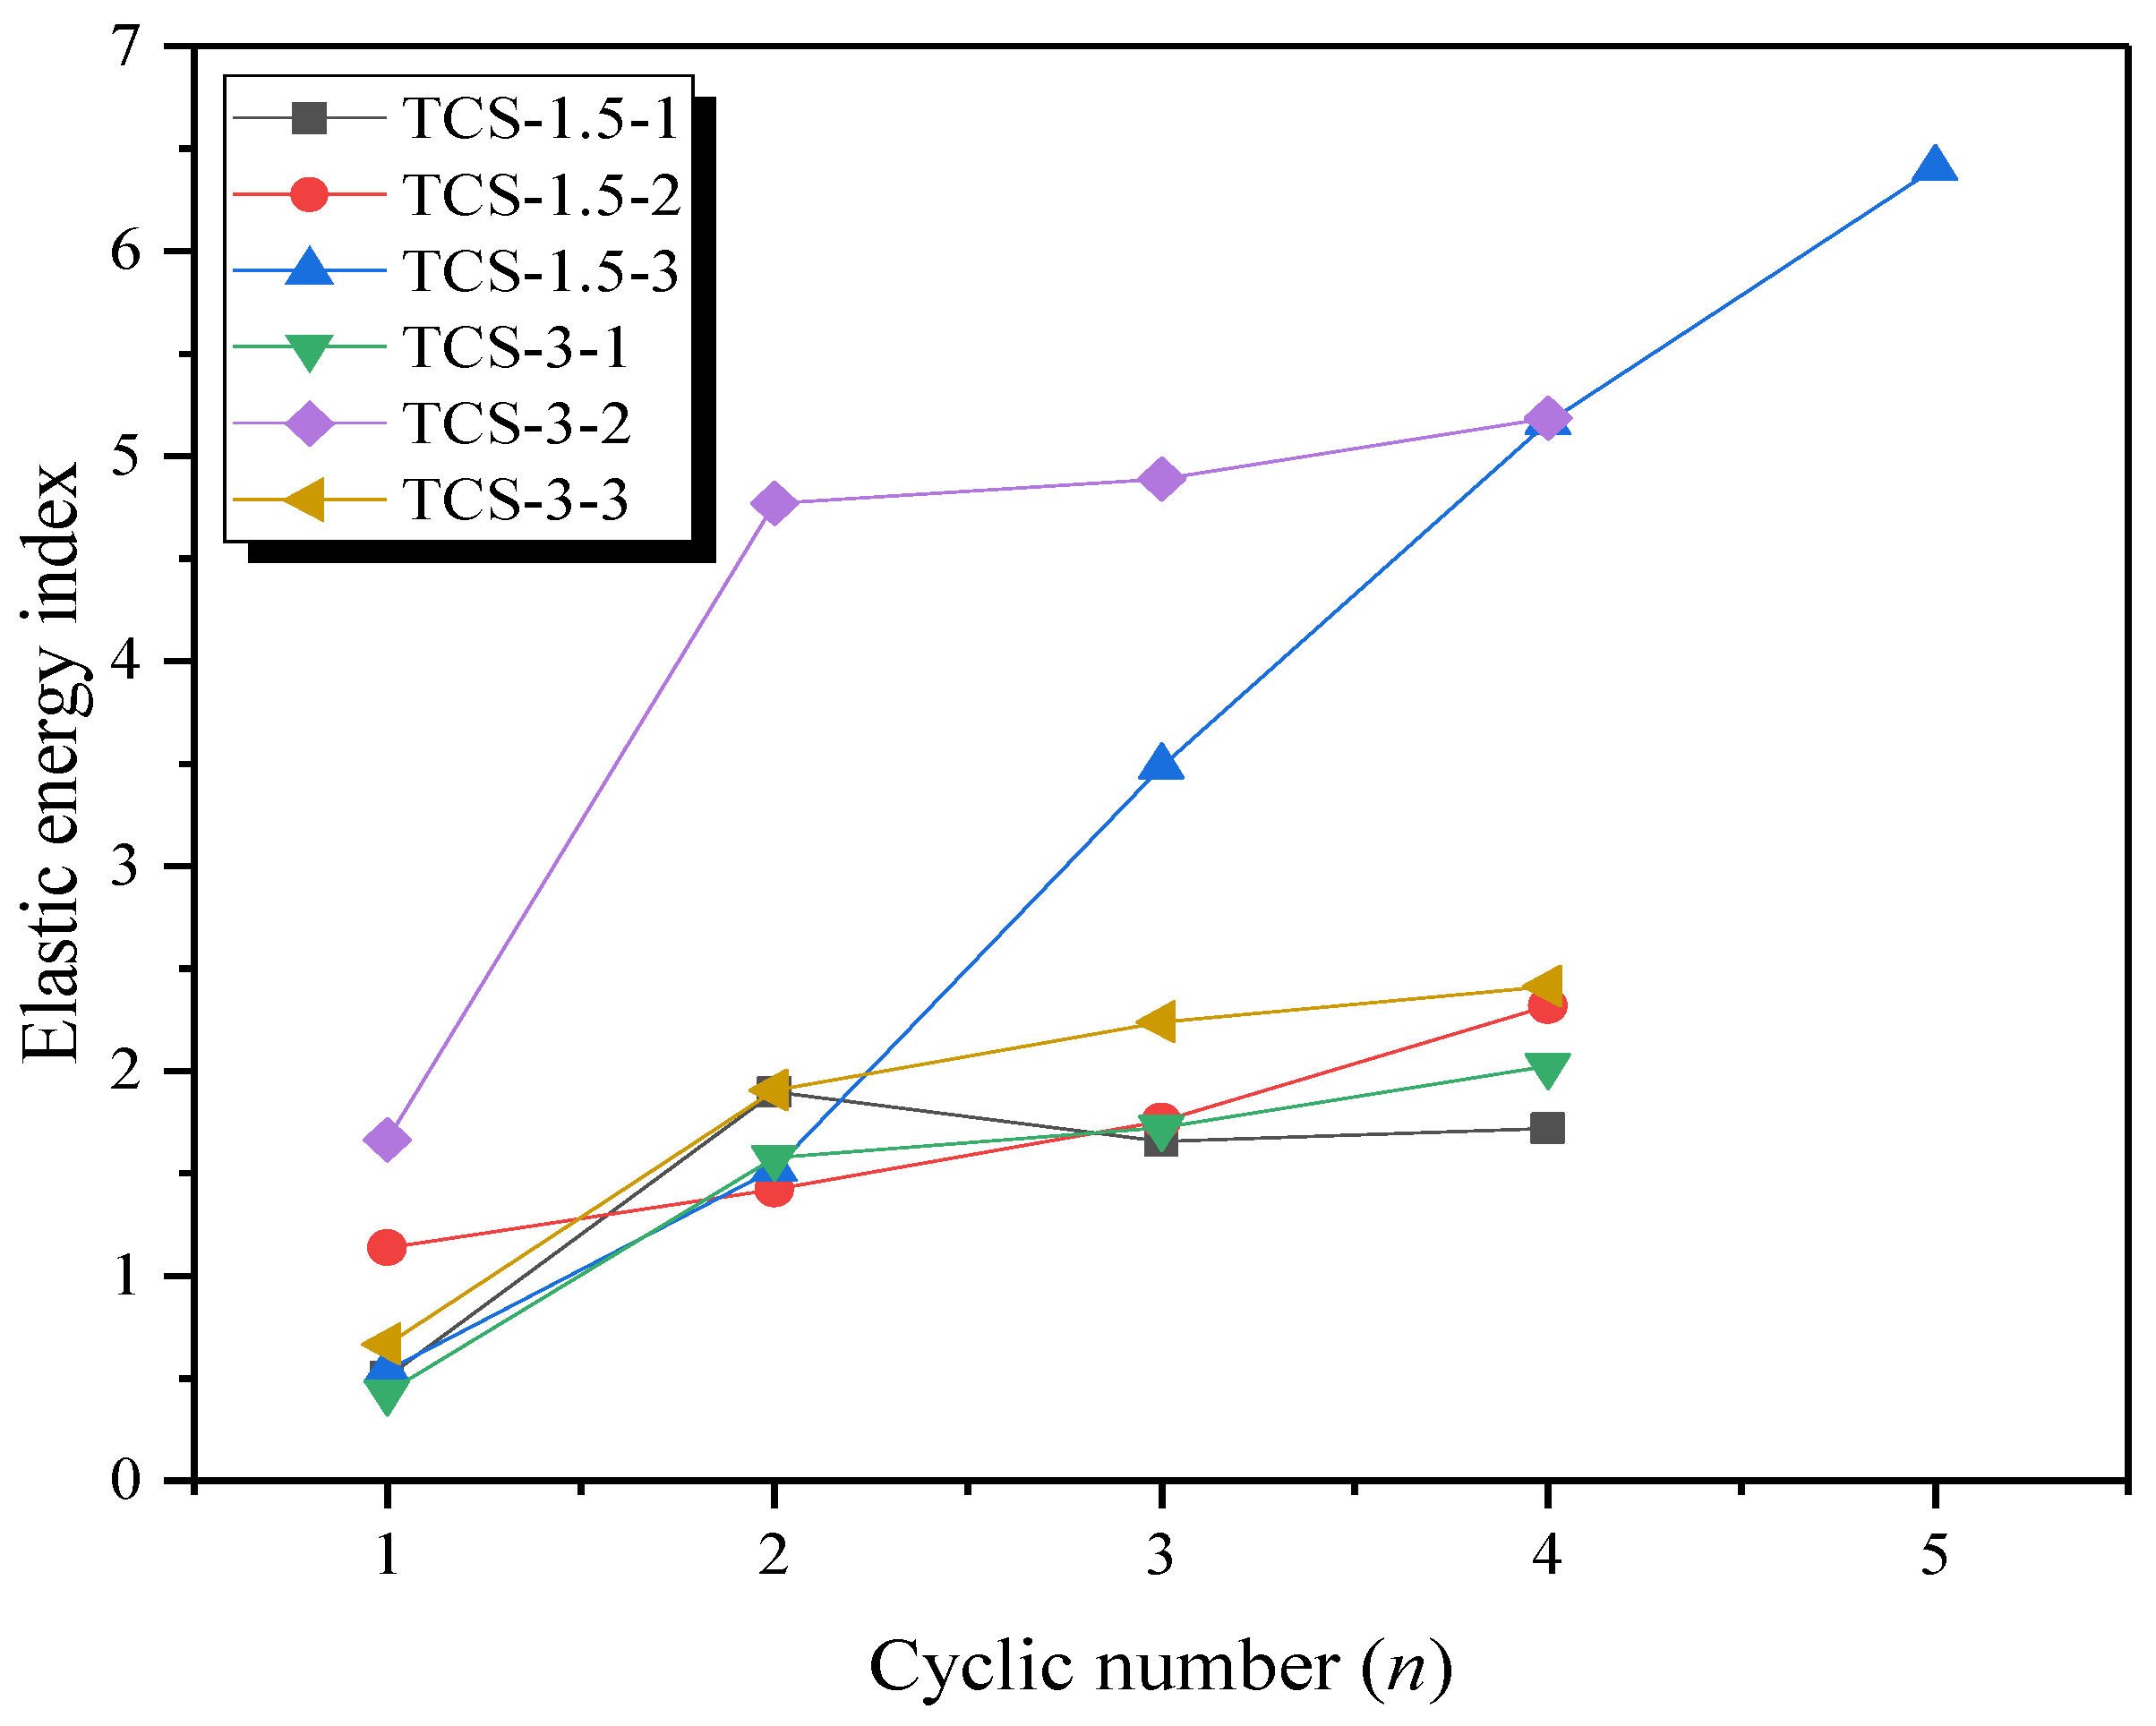
The elastic energy index is used as an important parameter in the classification and determination of the rock burst tendency [44]. In this study, under the tiered cyclic shear stress, the elastic energy of the rock fracture increases, and a portion of elastic energy is also dissipated in other forms. The dissipated energy cannot be released in the unloading process of the rock fracture. The elastic energy index is defined as the ratio between elastic energy Ue and dissipated energy Ud. The larger the elastic energy index, the better the coupling of rock fracture. It indicates that the accumulated energy required for fracture shear failure during loading is large, and the probability of impact during the failure is also increased.
The relationships between elastic energy index and cycle number are further studied, as shown in Figure 13. The results show that the elastic energy index of all samples increases with the increasing cycle number. The elastic energy index of the first stage is the smallest, which suggests that the probability of shear impact is the smallest in this stage due to the compaction of rock fractures at this stage. The elastic energy index of the specimen at the second stage is significantly increased compared with that at the first stage, indicating that the probability of shear impact increases at the second stage. With the increase in the cycle number, the elastic energy index of the specimen at the third and fourth stages increases gradually. It suggests that the probability of shear impact increases gradually with a slowly increasing rate. The main reason is that the shear displacement is based on elastic compaction, and the bulges of the fractures are not broken, so most of the total energy is stored in the form of elastic energy.

4. Discussion

In this study, rock specimens with artificial fractures were subjected to tiered cyclic shear tests. The observed frictional behavior and cutting-tooth behavior provide insight into the macroscopic shear behavior of the specimens. Unlike the direct shear stress used in previous tests, the tiered cyclic shear stress better simulates the stress waves generated during mining and transportation. This method more effectively mimics the stress perturbation effects that occur during open-pit slope mining. The results show that the tiered cyclic shear stress can lead to larger shear displacement in fractured rock specimens. This increased displacement can cause geological disasters, such as landslides and collapses, a finding that is consistent with previous research.
The analysis of energy conversion provides further insight into the evolution mechanism of shear failure in rock fractures. The total energy U is composed of elastic energy Ue and dissipated energy Ud. The dissipated energy Ud is mostly used for the compaction of rock fractures. The adjustment of the coupling state of the rock fractures consumes most of the energy in the first cycle. When the Rs of the fractures is 1.032 (Figure 12b,e), the proportion of dissipated energy is small. This suggests that the roughness coefficient has a notable influence on the energy evolution process, as both larger or smaller roughness coefficients can consume a significant amount of energy (Figure 12a,c,d,f). As the number of cycles increases, the effect of different roughness coefficients on energy distribution becomes less pronounced. In subsequent cycles, the rate of increase for elastic energy is faster than that for dissipated energy, which indicates a gradual increase in the rock’s capacity to store shear strength before failure.
In the last stage before the shear failure, the dissipated energy Ud increases at a slow rate. The evolution characteristics of the dissipated energy Ud may be helpful to understand the evolution mechanism of shear failure of rock fracture. The ultimate shear failure under tiered cyclic shear stress is triggered by the sudden release of elastic energy Ue stored within the fractures. This process is distinctly different from the shear failure that occurs during a direct shear test, which is typically caused by the failure of a major asperity with greater size and strength.
Meanwhile, numerical modeling provides a crucial theoretical complement for delving into the microscopic mechanisms behind phenomena such as displacement hysteresis, energy dissipation, and irregular shear patterns observed in the experiments. For example, the Discrete Element Method (DEM) can accurately simulate crack propagation and particle crushing in marble with pre-existing fractures [45]. This offers a framework for understanding how micro-damage on the shear plane affects overall mechanical performance. Furthermore, adaptive cohesive zone models can simulate irregular crack paths in heterogeneous materials [46], which aligns well with the non-uniform shear plane behavior observed in our experiments due to natural defects and variations in mineral composition. Therefore, future research could integrate the experimental data from this study with such numerical models to gain a more comprehensive understanding of the rock damage mechanisms under cyclic shear.

5. Conclusions

In this study, the pre-peak tiered cyclic shear test on rock samples with artificial fractures under the constant normal stress was conducted by the RDS-200 servo-controlled rock direct shear experimental apparatus. The effects of tiered cyclic shear stress on deformation characteristics, hysteretic curves, failure pattern, and energy evolution were revealed by macroscopic shear stress-shear displacement. The following conclusions can be drawn from this study:
First, all unrecoverable residual shear displacement (RSD) gradually increases linearly with the number of cycles in the TCS tests. The shear displacement of rock fractures has memory functions under pre-peak tiered cyclic shear loading. The loading and unloading curves at all levels have linear characteristics, and the linear characteristics are strengthened after cyclic loading and unloading progress. The shear displacement has a hysteresis effect and slightly increases or decreases with the change in shear stress. The energy calculation method considering the hysteresis effect of shear displacement behind shear stress is more accurate and closer to the real situation.
Second, the failure differences between rock fractures in DST and TCS primarily manifest in peak shear stress, failure pattern, and shear scratch. Peak shear stress weakening occurs in TCS, and the reduction degree of shear strength increases with the increase in normal stress, while this weakening does not occur in DST. The fracture surface morphology under DST is clearer than that in the TCS, and the TCS has a greater effect on the rock fractures. The decline rate of Rs is associated with the value of normal stress and the initial Rs. A higher normal stress and a larger initial Rs lead to a greater decrease in the Rs.
Third, the proportion of elastic energy (Ue) is relatively small in the first stage of TCS. With the increase in cyclic shear stress, the proportion of Ue to U increases gradually. The elastic energy Ue released by rock fractures increases faster than the dissipated energy Ud. The elastic energy index can be used to judge the rock burst tendency of rock specimens with fractures in the classification and determination. The elastic energy index and the probability of shear impact at the first stage are smaller. With the increase in the cyclic number, the elastic energy index increases and the probability of shear impact increases gradually with a small increasing rate.
This experimental design has certain limitations. Firstly, it does not account for the initial damage heterogeneity among the marble specimens. Furthermore, potential influencing factors such as mineral composition, grain size, and structural characteristics were not considered, although these variables may significantly impact the fracture mode of the samples. Future studies could incorporate microstructural analyses, such as SEM (scanning electron microscopy), before and after the shear experiments. This would provide a systematic understanding of the microstructural damage and evolutionary characteristics of the fracture surface.
The results of this study are important for slope stability assessments and geological hazard predictions. The study demonstrated that repeated loading significantly reduces the strength of discontinuities and causes residual displacement to accumulate. These findings are useful for evaluating the safety factor considering real-world external forces, such as seismic motion, blasting, and traffic vibrations. Additionally, energy progression analysis clarified energy accumulation and sudden release, offering insights into the suddenness of slope failures and the possibility of precursor detection. These results are considered to have direct practical applications for slope monitoring and revising design standards.

Author Contributions

Methodology, Y.L. and Z.X.; software, C.S.; validation, Q.X.; formal analysis, Y.L.; resources, Q.Y.; data curation, Z.X.; writing—original draft, Y.L.; writing—review and editing, H.L.; visualization, C.S.; supervision, Q.Y.; funding acquisition, Q.X. All authors have read and agreed to the published version of the manuscript.

Funding

This research was financially supported by the National Natural Science Foundation of China (No. 52404153) and the Natural Science Foundation of Jiangsu Province (No. BK20241649).

Institutional Review Board Statement

Not applicable.

Informed Consent Statement

Not applicable.

Data Availability Statement

The original contributions presented in this study are included in the article. Further inquiries can be directed to the corresponding author.

Conflicts of Interest

The authors declare no conflicts of interest.

Abbreviations

The following abbreviations are used in this manuscript:
ISRMInternational Society for Rock Mechanics
TCSTiered Cyclic Shear
DSTDirect Shear Test
RSDResidual Shear Displacement
σNormal Load
vlLoading Rate
vuUnloading Rate
RsContour Area Ratio
UTotal Energy
UeElastic Energy
UdDissipated Energy
SaThe Developed Area Of The Fracture Contour Surface
SThe Projected Area Of The Fracture Contour Surface
tfPeak Shear Strength

References

  1. Guo, N.; Li, C.; Liu, H.; Wang, Y. Dynamic Fracture and Energy Evolution Characterization of Naturally Fractured Granite Subjected to Multilevel Cyclic Loads. Geofluids 2021, 2021, 6685123. [Google Scholar] [CrossRef]
  2. Tang, Z.C.; Li, L.; Wang, X.C.; Zou, J.P. Influence of Cyclic Freezing-Thawing Treatment on Shear Behaviors of Granite Fracture under Dried and Saturated Conditions. Cold Reg. Sci. Technol. 2021, 181, 103192. [Google Scholar] [CrossRef]
  3. Tang, Z.C.; Zhang, Q.Z.; Peng, J.; Jiao, Y.Y. Experimental Study on the Water-Weakening Shear Behaviors of Sandstone Joints Collected from the Middle Region of Yunnan Province, P.R. China. Eng. Geol. 2019, 258, 105161. [Google Scholar] [CrossRef]
  4. Meng, F.; Wong, L.N.Y.; Zhou, H.; Wang, Z. Comparative Study on Dynamic Shear Behavior and Failure Mechanism of Two Types of Granite Joint. Eng. Geol. 2018, 245, 356–369. [Google Scholar] [CrossRef]
  5. Day, J.J.; Diederichs, M.S.; Hutchinson, D.J. New Direct Shear Testing Protocols and Analyses for Fractures and Healed Intrablock Rockmass Discontinuities. Eng. Geol. 2017, 229, 53–72. [Google Scholar] [CrossRef]
  6. Ge, Y.; Xie, Z.; Tang, H.; Chen, H.; Lin, Z.; Du, B. Determination of Shear Failure Regions of Rock Joints Based on Point Clouds and Image Segmentation. Eng. Geol. 2019, 260, 105250. [Google Scholar] [CrossRef]
  7. Fathi, A.; Moradian, Z.; Rivard, P.; Ballivy, G. Shear Mechanism of Rock Joints under Pre-Peak Cyclic Loading Condition. Int. J. Rock Mech. Min. Sci. 2016, 83, 197–210. [Google Scholar] [CrossRef]
  8. Kou, M.; Liu, X.; Tang, S.; Wang, Y. Experimental Study of the Prepeak Cyclic Shear Mechanical Behaviors of Artificial Rock Joints with Multiscale Asperities. Soil Dyn. Earthq. Eng. 2019, 120, 58–74. [Google Scholar] [CrossRef]
  9. Liu, X.; Kou, M.; Lu, Y.; Liu, Y. An Experimental Investigation on the Shear Mechanism of Fatigue Damage in Rock Joints under Pre-Peak Cyclic Loading Condition. Int. J. Fatigue 2018, 106, 175–184. [Google Scholar] [CrossRef]
  10. Liu, X.; Deng, Z.; Liu, Y.; Liu, S.; Lu, Y.; Han, Y. An experimental study on the cumulative damage and shear properties of rock joints under pre-peak cyclic shear loading. Chin. J. Rock Mech. Eng. 2018, 37, 2664–2675. [Google Scholar] [CrossRef]
  11. Yang, X.; Zhou, J.; Song, Y.; Han, X. Evolution characteristics of sliding displacement of rock interface under cyclic loading. J. China Coal Soc. 2019, 44, 3041–3048. [Google Scholar] [CrossRef]
  12. Ge, Y.; Tang, H.; Wang, L.; Xiong, C.; Zhang, S.; Wang, D. Strain energy evolution of penetrative rock joints under shear loading. Chin. J. Rock Mech. Eng. 2016, 35, 1111–1121. [Google Scholar] [CrossRef]
  13. Zhai, M.; Guo, B.; Li, B.; Jiao, F. Energy and deformation characteristics of rock joints under multi-stage shear loading-creep-unloading conditions. Rock Soil Mech. 2018, 39, 2865–2872, 2885. [Google Scholar] [CrossRef]
  14. Hashiguchi, K. Foundations of Elastoplasticity: Subloading Surface Model; Springer: Berlin/Heidelberg, Germany, 2017; ISBN 3-319-48821-X. [Google Scholar]
  15. Fathi, A.; Moradian, Z.; Rivard, P.; Ballivy, G.; Boyd, A.J. Geometric Effect of Asperities on Shear Mechanism of Rock Joints. Rock Mech. Rock Eng. 2016, 49, 801–820. [Google Scholar] [CrossRef]
  16. Guo, B.; Dong, H. Shear Failure Modes and AE Characteristics of Sandstone and Marble Fractures. Open Geosci. 2019, 11, 249–262. [Google Scholar] [CrossRef]
  17. Song, Y.; Deng, L.; Lyu, X.; Xu, H.; Zhao, Z. Study of acoustic emission characteristics and deformation evolution during rock frictional sliding. Rock Soil Mech. 2019, 40, 2899–2906, 2913. [Google Scholar] [CrossRef]
  18. Zhai, M.; Bai, H.; Wu, L. Shear Slip Instability Behavior of Rock Fractures under Prepeak Tiered Cyclic Shear Loading. Adv. Civ. Eng. 2020, 2020, 8851890. [Google Scholar] [CrossRef]
  19. Gao, Y.; Feng, X.-T. Study on Damage Evolution of Intact and Jointed Marble Subjected to Cyclic True Triaxial Loading. Eng. Fract. Mech. 2019, 215, 224–234. [Google Scholar] [CrossRef]
  20. Liu, X.S.; Ning, J.G.; Tan, Y.L.; Gu, Q.H. Damage Constitutive Model Based on Energy Dissipation for Intact Rock Subjected to Cyclic Loading. Int. J. Rock Mech. Min. Sci. 2016, 85, 27–32. [Google Scholar] [CrossRef]
  21. Peng, R.-D.; Ju, Y.; Gao, F.; Xie, H.-P.; Wang, P. Energy Analysis on Damage of Coal under Cyclical Triaxial Loading and Unloading Conditions. J. China Coal Soc. 2014, 39, 245–252. [Google Scholar]
  22. Song, D.; Wang, E.; Liu, J. Relationship between EMR and Dissipated Energy of Coal Rock Mass during Cyclic Loading Process. Saf. Sci. 2012, 50, 751–760. [Google Scholar] [CrossRef]
  23. Tang, L.; Zhao, Y.; Liao, J.; Liu, Q. Creep Experimental Study of Rocks Containing Weak Interlayer under Multilevel Loading and Unloading Cycles. Front. Earth Sci. 2020, 8, 519461. [Google Scholar] [CrossRef]
  24. Tang, Z.C.; Jiao, Y.Y.; Wong, L.N.Y.; Wang, X.C. Choosing Appropriate Parameters for Developing Empirical Shear Strength Criterion of Rock Joint: Review and New Insights. Rock Mech. Rock Eng. 2016, 49, 4479–4490. [Google Scholar] [CrossRef]
  25. Wang, X.; Lian, B.; Wang, J.; Feng, W.; Gu, T.-F. Creep Damage Properties of Sandstone under Dry-Wet Cycles. J. Mt. Sci. 2020, 17, 3112–3122. [Google Scholar] [CrossRef]
  26. Zuo, J.; Xie, H.; Meng, B.; Liu, J. Experimental Research on Loading-Unloading Behavior of Coal-Rock Combination Bodies at Different Stress Levels. Rock Soil Mech. 2011, 32, 1287–1296. [Google Scholar] [CrossRef]
  27. Li, Y.; Wu, W.; Tang, C.; Liu, B. Predicting the Shear Characteristics of Rock Joints with Asperity Degradation and Debris Backfilling under Cyclic Loading Conditions. Int. J. Rock Mech. Min. Sci. 2019, 120, 108–118. [Google Scholar] [CrossRef]
  28. Dong, H.; Guo, B.; Li, Y.; Si, K.; Wang, L. Empirical Formula of Shear Strength of Rock Fractures Based on 3D Morphology Parameters. Geotech. Geol. Eng. 2017, 35, 1169–1183. [Google Scholar] [CrossRef]
  29. Chen, Y.; Zuo, J.; Li, Z.; Dou, R. Experimental Investigation on the Crack Propagation Behaviors of Sandstone under Different Loading and Unloading Conditions. Int. J. Rock Mech. Min. Sci. 2020, 130, 104310. [Google Scholar] [CrossRef]
  30. Jiang, C.; Duan, M.; Yin, G.; Wang, J.; Lu, T.; Xu, J.; Zhang, D.; Huang, G. Experimental Study on Seepage Properties, AE Characteristics and Energy Dissipation of Coal under Tiered Cyclic Loading. Eng. Geol. 2017, 221, 114–123. [Google Scholar] [CrossRef]
  31. Peng, K.; Wang, Y.; Zou, Q.; Liu, Z.; Mou, J. Effect of Crack Angles on Energy Characteristics of Sandstones under a Complex Stress Path. Eng. Fract. Mech. 2019, 218, 106577. [Google Scholar] [CrossRef]
  32. Sheng, M.; Li, P.; Zhuang, X.; Wang, J. Influence of Cyclic Normal Stress on Shear Friction of EGS Granite Fractures. Eng. Fract. Mech. 2020, 238, 107268. [Google Scholar] [CrossRef]
  33. Song, Z.; Frühwirt, T.; Konietzky, H. Characteristics of Dissipated Energy of Concrete Subjected to Cyclic Loading. Constr. Build. Mater. 2018, 168, 47–60. [Google Scholar] [CrossRef]
  34. Song, Z.; Konietzky, H.; Frühwirt, T. Hysteresis Energy-Based Failure Indicators for Concrete and Brittle Rocks under the Condition of Fatigue Loading. Int. J. Fatigue 2018, 114, 298–310. [Google Scholar] [CrossRef]
  35. Wang, Y.; Li, C.; Liu, H.; Han, J. Fracture Failure Analysis of Freeze–Thawed Granite Containing Natural Fracture under Uniaxial Multi-Level Cyclic Loads. Theor. Appl. Fract. Mech. 2020, 110, 102782. [Google Scholar]
  36. Zhu, T.; Huang, D. Experimental Investigation of the Shear Mechanical Behavior of Sandstone under Unloading Normal Stress. Int. J. Rock Mech. Min. Sci. 2019, 114, 186–194. [Google Scholar]
  37. Li, D.; Sun, Z.; Xie, T.; Li, X.; Ranjith, P. Energy Evolution Characteristics of Hard Rock during Triaxial Failure with Different Loading and Unloading Paths. Eng. Geol. 2017, 228, 270–281. [Google Scholar] [CrossRef]
  38. Li, T.; Pei, X.; Wang, D.; Huang, R.; Tang, H. Nonlinear Behavior and Damage Model for Fractured Rock under Cyclic Loading Based on Energy Dissipation Principle. Eng. Fract. Mech. 2019, 206, 330–341. [Google Scholar] [CrossRef]
  39. Meng, Y.; Jing, H.; Yin, Q.; Gu, X. Investigation on mechanical and AE characteristics of yellow sandstone undergoing wetting-drying cycles. KSCE J. Civ. Eng. 2020, 24, 3267–3278. [Google Scholar] [CrossRef]
  40. Xie, H.; Li, L.; Peng, R.; Ju, Y. Energy Analysis and Criteria for Structural Failure of Rocks. J. Rock Mech. Geotech. Eng. 2009, 1, 11–20. [Google Scholar] [CrossRef]
  41. Zhu, X.-Y.; Chen, X.-D.; Dai, F. Mechanical Properties and Acoustic Emission Characteristics of the Bedrock of a Hydropower Station under Cyclic Triaxial Loading. Rock Mech. Rock Eng. 2020, 53, 5203–5221. [Google Scholar] [CrossRef]
  42. Xie, H.; Ju, Y.; Li, L. Criteria for strength and structural failure of rocks based on energy dissipation and energy release principles. Chin. J. Rock Mech. Eng. 2005, 24, 3003–3010. [Google Scholar]
  43. Jin, F.; Jiang, M.; Gao, X. Defining damage variable based on energy dissipation. Chin. J. Rock Mech. Eng. 2004, 23, 1976–1980. [Google Scholar]
  44. Gong, F.; Yan, J.; Li, X.; Luo, S. A Peak-Strength Strain Energy Storage Index for Rock Burst Proneness of Rock Materials. Int. J. Rock Mech. Min. Sci. 2019, 117, 76–89. [Google Scholar] [CrossRef]
  45. De Maio, U.; Gaetano, D.; Greco, F.; Lonetti, P.; Pranno, A. An Adaptive Cohesive Interface Model for Fracture Propagation Analysis in Heterogeneous Media. Eng. Fract. Mech. 2025, 325, 111330. [Google Scholar] [CrossRef]
  46. Tomporowski, D.; Nitka, M.; Tejchman, J. Application of the 3D DEM in the Modelling of Fractures in Pre-Flawed Marble Specimens during Uniaxial Compression. Eng. Fract. Mech. 2023, 277, 108978. [Google Scholar] [CrossRef]
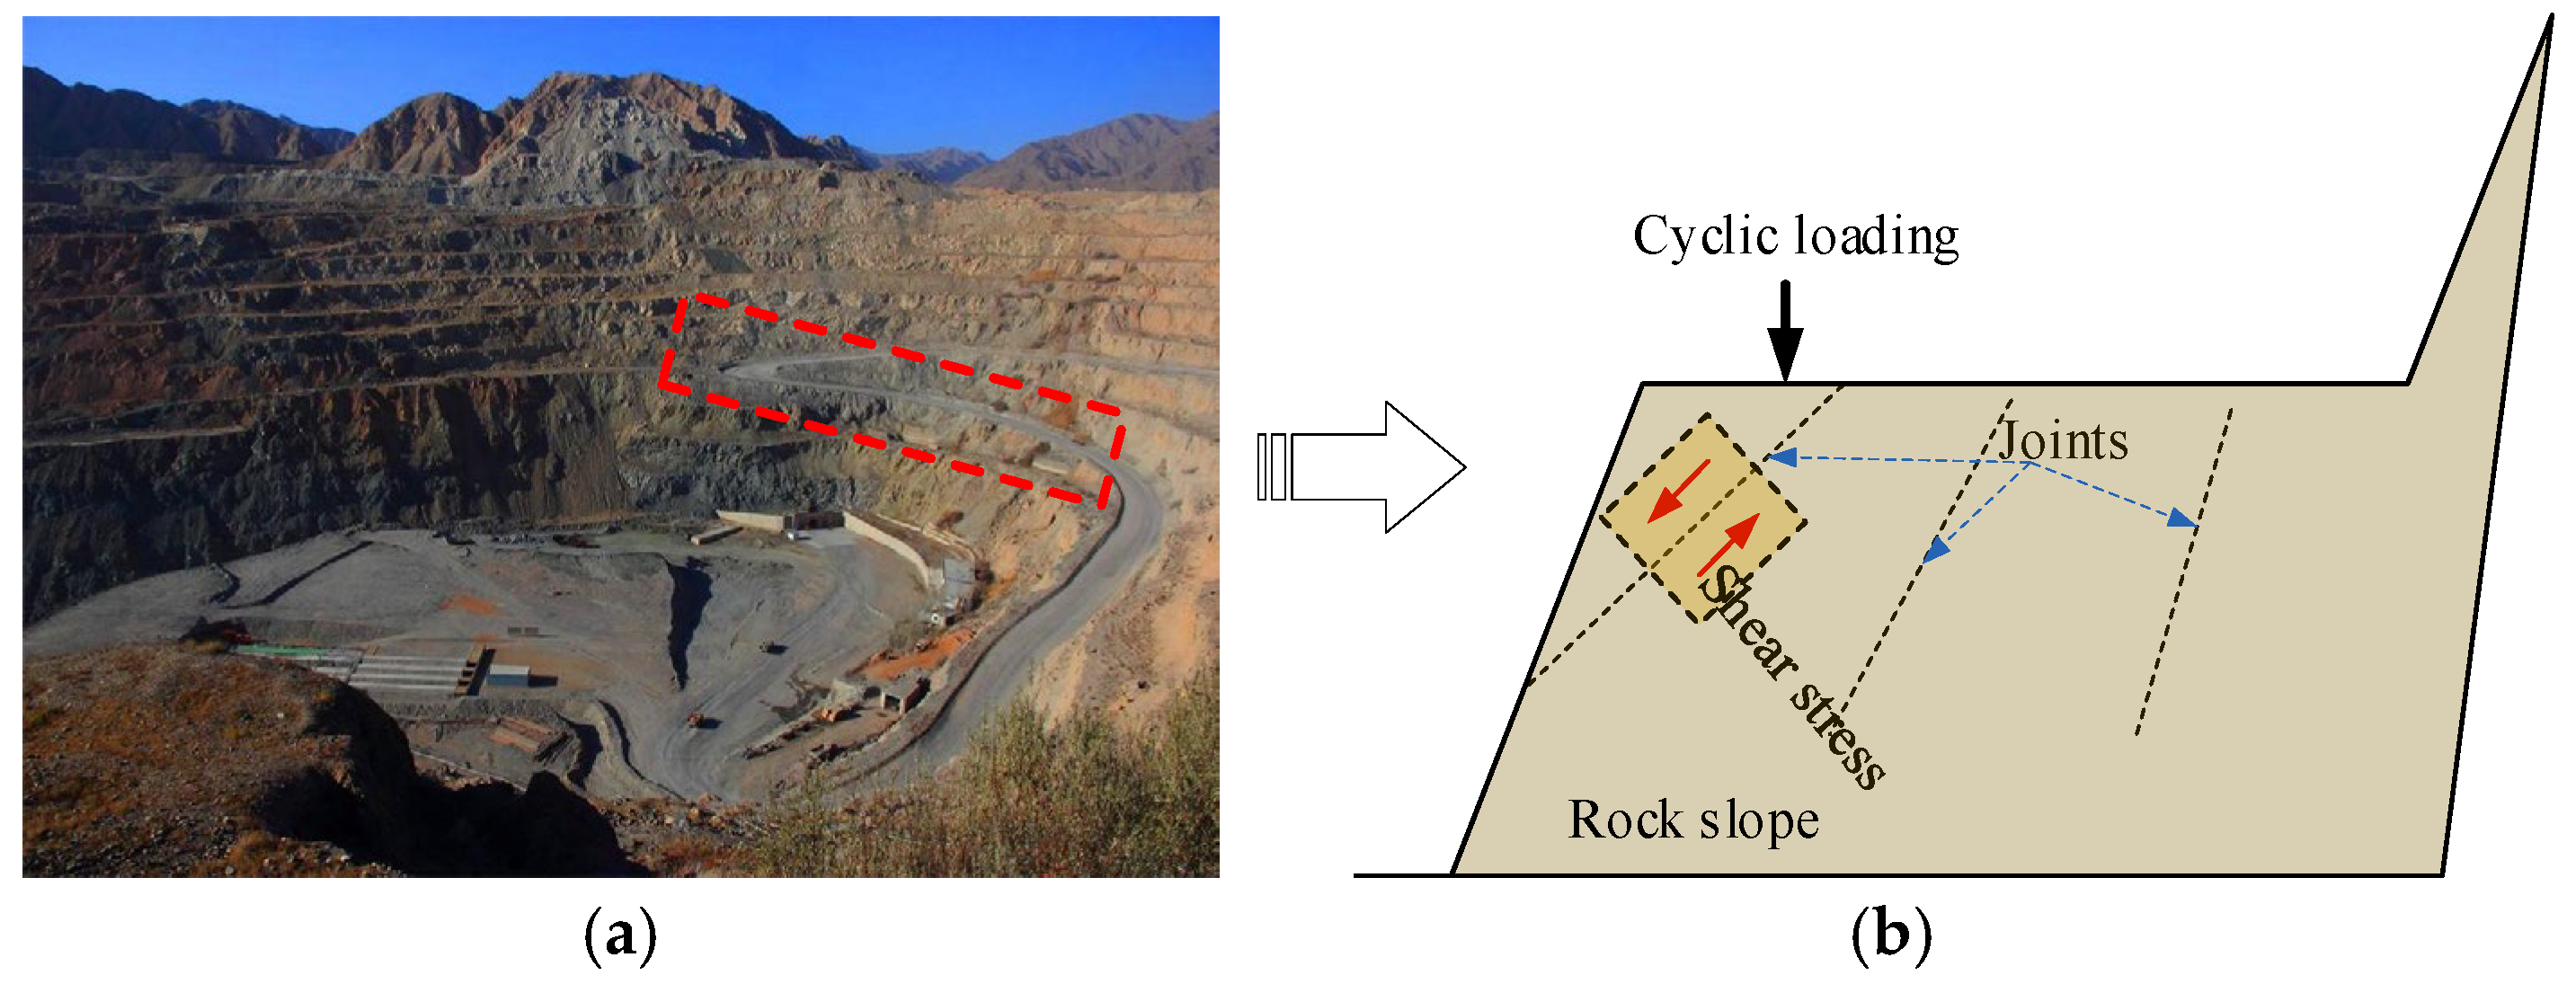
Figure 1. (a) Rock slope and (b) schematic diagram of cyclic loading failure of the rock slope with joints.
Applsci 15 10308 g001
Figure 2. Flowchart of shear experiment on marble specimens with fracture.
Applsci 15 10308 g002
Figure 3. Schematic diagram of experimental stress paths: (a) direct shear stress and (b) layered cyclic shear stress. Where, stage 1: normal stress loading, stage 2: shear stress loading, and stage 3: shear failure and slip.
Applsci 15 10308 g003
Figure 4. The relationship between shear/normal displacements and shear stress under different normal stress: (ac) TCS-1.5-1, TCS-1.5-2 and TCS-1.5-3; (df) TCS-3-1, TCS-3-2 and TCS-3-3.
Applsci 15 10308 g004aApplsci 15 10308 g004b
Figure 5. The variation characteristics of residual shear displacement with the number of cycles.
Applsci 15 10308 g005
Figure 6. Shear displacement-shear stress curves under cyclic loading and unloading for sample TCS-3-1: (a) Shear displacement-shear stress curves under cyclic loading; (b) Shear displacement-shear stress curves under cyclic unloading; (c) Enlarged curves of sliding position in (a); (d) Enlarged curves of sliding position in (b).
Applsci 15 10308 g006
Figure 7. T-δ curves. (a) Ideal. (b) Actual.
Applsci 15 10308 g007
Figure 8. Shear displacement-shear stress curves for sample TCS-1.5-1 at the second cycle: (a) Curve of the full loading-unloading process; (b) Enlarged curve around loading point, and (c) Enlarged curve around unloading point.
Applsci 15 10308 g008
Figure 9. Fitting failure envelopes in the DST and the TCS.
Applsci 15 10308 g009
Figure 10. Failure patterns of specimens under (a) DST and (b) TCS.
Applsci 15 10308 g010
Figure 11. Rs before and after test under (a) DST and (b) TCS.
Applsci 15 10308 g011
Figure 12. The relationship between U, Ue, Ud, and cycle number: (a) TCS-1.5-1, (b) TCS-1.5-2, (c) TCS-1.5-3, (d) TCS-3-1, (e) TCS-3-2 and (f) TCS-3-3.
Applsci 15 10308 g012
Figure 13. Plots of elastic energy index for the tested marble fracture samples with cycle number.
Applsci 15 10308 g013
Table 1. Sample parameters in direct shear test (DST) and tiered cyclic shear (TCS): contour area ratio Rs, normal load σ, loading rate vl, and unloading rate vu.
SpecimenRsσ (MPa)vl (KPa/s)vu (KPa/s)
DST-0.51.032180.5200
DST-11.032411200
DST-21.032322200
DST-31.032253200
DST-41.032294200
DST-51.032195200
TCS-1.5-11.011461.52010
TCS-1.5-21.032271.52010
TCS-1.5-31.054661.52010
TCS-3-11.0124832010
TCS-3-21.0321832010
TCS-3-31.0521232010
Disclaimer/Publisher’s Note: The statements, opinions and data contained in all publications are solely those of the individual author(s) and contributor(s) and not of MDPI and/or the editor(s). MDPI and/or the editor(s) disclaim responsibility for any injury to people or property resulting from any ideas, methods, instructions or products referred to in the content.