Article

Naked-Eye Detection of Water Contaminants Enabled by Engineered Plasmonic Resonance in Hybrid Detector Systems

1
Institute of Microelectronics and Optoelectronics, Warsaw University of Technology, Koszykowa 75, 00-665 Warsaw, Poland
2
National Institute of Telecommunications, 1 Szachowa Str., 04-894 Warsaw, Poland
3
Univ. Limoges, CNRS, IRCER, UMR 7315, F-87000 Limoges, France
4
Łukasiewicz Research Network—Institute of Microelectronics and Photonics, Al. Lotników 32/46, 02-668 Warsaw, Poland
5
Fraunhofer Institute for Ceramic Technologies and Systems (IKTS), Winterbergstr. 28, 01277 Dresden, Germany
*
Author to whom correspondence should be addressed.
Appl. Sci. 2025, 15(18), 9975; https://doi.org/10.3390/app15189975
Submission received: 22 August 2025 / Revised: 8 September 2025 / Accepted: 10 September 2025 / Published: 11 September 2025
(This article belongs to the Special Issue Applications of Thin Films and Their Physical Properties)

Abstract

Featured Application

We hereby present a concept of a sensor for detection of water contaminants with an integrated ceramic-based light emitter and a nanoparticle-based plasmonic sensing thin film. The presence of contaminants in the proposed device is indicated by the reversible change of color of emitted light, which may be observed directly, i.e., without any specialized equipment.

Abstract

The quality of water supply and its contamination remain global issues. In this work we aim to propose a concept of a novel integrated device for label-free and real-time monitoring of water contaminants that may be performed without specialized equipment. By employing an effective model for describing interactions of a plasmonic nanoparticle-based sensing reflector and using a transfer matrix approach to determine optical properties of the complete system, we demonstrate that our integrated sensing device is able to change the color of emitted light in response to the change of optical properties of the surrounding medium, which enables naked-eye detection of water contaminants. Additionally, by employing dual plasmon resonance arising from resonances of nanoparticles and metal substrate, as well as interactions between them, it is possible to engineer emission efficiency and colorimetric properties of the sensor. We believe that the proposed device, due to its compactness, integrated form, and naked-eye and real-time detection capabilities, will address the current challenges in water quality monitoring.

1. Introduction

The significance of water in human activity cannot be overstated—this chemical compound is essential to nearly every aspect of our daily lives, starting from sustaining natural life itself, through agriculture (or food production in general) [1], transportation, power generation [2], construction [3], and a vast number of other industrial applications [4], and ending with leisure activities.
A vast majority of those applications require access to or produce water (which, in the latter sense, is referred to as wastewater) of particular quality, taking into account its physical, chemical, and/or biological characteristics. With time, however, obtaining access to this indispensable resource becomes increasingly challenging. As readily usable water supply diminishes in time, which is due to several factors, including, among others, pollution (like oil spills, sewage disposal, etc.), industrial contamination (e.g., heavy metals, solvents [4], pharmaceutical pollution [5]), climate change [6], and diminishing supply of fresh water [7], the need to protect the remaining resources quickly grows in importance. Among undertaken activities, constant monitoring of water quality characteristics is of paramount importance, since it allows us to assess and act upon the associated risks in a proper and timely manner. In particular, a challenge is constituted by those risk factors that pose an immediate threat to the safety and health of humans (e.g., related to waterworks facilities, wastewater treatment plants, public swimming areas, and intentional contamination), and as such, need to be immediately detected and reported to the attention of appropriate authorities.
Conventionally, water quality assessment requires acquisition of a representative set of samples and subsequent analysis employing one of various broad-spectrum, well-established detection techniques, among which physical [8] (fluorescence spectroscopy, Raman spectroscopy), chemical (e.g., gas chromatography–mass spectrometry, ion chromatography [9], or high-performance liquid chromatography [10]), and biological (e.g., aptamer-based, using enzyme-linked immunoassays [11,12], or exploiting enzyme-catalyzed chemiluminescence [13]) techniques are distinguished. These are normally employed in specialized laboratory settings, under controlled environmental conditions, using bulky and expensive instrumentation, often with active participation or under the supervision of qualified lab technicians. Other techniques, like remote sensing through satellite or drone-based imaging, are rather dedicated to assessment of general physical properties of water [14] (e.g., turbidity/total suspended solids, temperature, presence of chlorophyll-a) and environmental studies [15] (like algae growth monitoring).
The difficulty and the associated cost posed by the ever-growing amount of water mass that needs to be monitored warrant research and development of novel means to monitor the quality of our water supply—means that are cheap and ubiquitous. The advent of sensors based on the surface plasmon resonance (SPR) phenomenon, i.e., such that probe refractive index changes at the interface of a metal–dielectric surface, has provided a valuable alternative to those conventional techniques, which, through their portability and compactness, foster in situ, e.g., IoT setups [16], or lab-on-a-chip (LoC) implementations [17]. In some realizations, those benefits are furthered by the property of a naked-eye detection, i.e., a visual readout of the result, using a predetermined colorimetric protocol, without the need for any additional equipment, making it especially suitable for deployment in harsh or otherwise unreliable (“off-grid”) locations and also point-of-care testing [18], where the monitored condition might pose an immediate threat to humans.
A considerable group of SPR-enabled solutions entails the use of metallic nanoparticles (NPs), which, directly introduced into the sample, form a heterogeneous colloidal mixture; it is then either alteration of the NP morphology (water sculpting or etching) [19,20] or, more commonly, binding of the analyte to the surface of the NP, through which the change in spectral location of its bulk or molecular SPR is invoked [21] and, thus, can be subsequently detected using well-established optical interrogation techniques. On the downside, this technique leads to the formation of a potentially toxic waste product [22]. An alternative technique employs thin film structures at nanoscale, which are formed primarily using the ALD technique at the facet of an optical fiber, in order to detect changes in the observed transmission or reflection properties while propagating through the fiber, whereby the sensor may be submerged in aqueous media [23,24,25]. Such an interrogation technique has also been successfully deployed with a planar curve–waveguide-based SPR sensor [26]. Another branch of studies is devoted to highly efficient metal–insulator–metal waveguiding SPR structures exploiting Fano resonance modes when coupled with elliptical ring resonators [27]. Another group of solutions is based on label-free SPR immunoassays, which were proven to detect a wide range of molecules without the need for prior labeling [28,29]. Interferometric (i.e., Mach–Zehnder integrated planar interferometers) and resonant structures (microcavities) utilizing evanescent field phenomenon have also been proposed as viable alternatives to SPR-enabled solutions [30,31]. A distinct group of methods, although employing well-established optical interrogation techniques, relies heavily on the advanced mathematical apparatus to enable indirect detection of the presence and concentration of molecules (e.g., the chaos-driven technique [32] or machine learning-based prediction of pollutant concentration from SERS spectra [33]).
Another notable approach for detecting water contaminants involves substrate-based colorimetric sensing. Recent examples include an integrated colorimetric sensor on a transparent substrate [34] and an actuator based on a graphene oxide substrate [35]. These and similar methods share a common principle: a specifically designed substrate is loaded with the water-based sample, where it undergoes a chemical reaction that produces a perceptible change in the substrate’s color. Despite a number of existing innovative solutions in the field, which significantly advance the field of water contamination sensing (in particular in terms of sensitivity, compactness, and accessibility), any individual device often reveals considerable drawbacks related to its final performance, such as the generation of potentially toxic byproducts during the process or often prohibitive requirements in terms of specialized measurement setups. Here, we aim to propose a solution that combines advantages of a perpetual in situ measurement in a noninvasive and thus reusable detection setup, which have not been simultaneously achieved with known solutions and which can thus help to overcome the previously identified limitations. In this work, we develop a concept of an integrated light-emitting optical system with a plasmonic sensing component working as a device for in situ naked-eye and non-invasive monitoring of contaminants in a water environment. Within the scope of our analysis, we demonstrate that by employing an appropriately designed NP-based plasmonic sensing layer, it is possible to achieve a change in colorimetric properties of emitted light, which is significant enough to be observed with an unaided human eye. Additionally, we show that the efficiency and colorimetric properties of the proposed sensing device can be further engineered by introducing a plasmonic reflecting substrate leading to a multiresonant effective response arising from the existence and intercoupling between resonances of the nanoparticles and the one of the substrates. In contrast to previous research, our analysis is rooted in the optical domain and presents an integrated chain for naked-eye detection, incorporating the analysis and mutual interdependencies of the properties of the source of excitation, the analyte, and the detector. In particular, we do not rely on the ambient source of irradiation, which cannot be objectively quantified and analyzed, but propose an integrated source of carefully engineered properties. As such, the proposed system composed reveals capability for naked-eye real-time monitoring of water contaminants with robustness against signal perturbation caused by environmental factors, such as changes in temperature and/or salinity or lighting conditions.
In the following section we describe the optical model used for the considered system, accounting for coupling between nanoparticles within the arrangement, as well as interactions with the substrate and surroundings. The second part outlines our approach to colorimetric analysis. The next section contains a detailed description of the proposed system and presents results on contaminant-induced changes in colorimetric response. Finally, we conclude by discussing the potential impact of our concept in the field of water monitoring and analysis.

2. Methods and Theory

Here, we will discuss methods and the theoretical framework for simulation of the considered device. The first section is dedicated to the description of the analytical model of reflection of the considered multilayer system based on transfer matrix formalism, as well as to the description of the effective permittivity model of metallic nanoparticles deposited on a substrate. The second section pertains to a comprehensive discussion of our approach for colorimetric properties of the considered sensing device.

2.1. Optical Model of the Considered System

Following the approach presented in [36], we consider our optical system as a four-interface optical planar system, depicted in Figure 1. Radiation from the input medium (in) impinges onto the effective layer, which consists of a 2D hexagonal arrangement of metallic nanoparticles (denoted as the 1st layer in Figure 1). The nanoparticle layer is deposited on a thin silica glass layer that separates nanoparticles from the substrate, which is treated as a semi-infinite (out) medium. Each layer/medium is described by a corresponding electric permittivity, i.e., ε i n , ε 1 ̿ , ε 2 , and ε o u t . It is worth underlining that ε 1 ̿ is a uniaxial permittivity tensor describing effective optical properties of the nanoparticle layer with specified geometrical parameters.
In such a system, the reflection coefficient for TE and TM polarizations of light can be analytically derived based on the transfer matrix method for a four-interface stack [36]:
r T E T M = r 01 T E / T M + r 12 T E / T M e 2 j k 1 / d + r 23 T E / T M e 2 j k 1 / d e 2 j k 2 h + r 01 T E / T M r 12 T E / T M r 23 T E / T M e 2 j k 2 h 1 + r 01 T E / T M r 12 T E / T M e 2 j k 1 / d + r 12 T E / T M r 23 T E / T M e 2 j k 2 h + r 01 T E / T M r 23 T E / T M e 2 j k 1 / d e 2 j k 2 h ,
where k 1 / denotes the parallel/perpendicular component of the wavevector inside the first layer; k 2 is the wavevector in the second layer; d is the assumed characteristic dimension of the effective nanoparticle/dipole layer; and r i j T E / T M is the reflection coefficient at the given i/j interface for the given TE/TM polarization, which can be expressed as follows:
r i j T E = ε i k j ε j k i ε i k j + ε j k i ,
r i j T M = k i k j k i + k j .
Wavevectors in isotropic media, in our case, input, 2nd layer, and output, can be defined as:
k i = 2 π λ ε i ε i n sin 2 θ ,
Parallel and perpendicular components of the wavevector in an anisotropic medium, i.e., the first layer of the considered system, can be calculated as follows:
k 1 = 2 π λ ε 1 ε i n sin 2 θ ,
k 1 = 2 π λ ε 1 / ε 1 1 / 2 ε 1 ε i n sin 2 θ ,
where λ denotes the free-space wavelength of the incident radiation; θ is the angle of incidence; and ε i n , ε 2 , and ε o u t correspond to the permittivity of the input medium, the 2nd layer, and the output medium, respectively. It is worth reminding that the first layer is a 2D arrangement of plasmonic nanoparticles, which, in line with the approach demonstrated by Kornyshev et al. [36], may be described with an effective uniaxial permittivity tensor ε ̿ 1 = [ ε 1 ,   ε 1 , ε 1 ] with components of the following form:
ε 1 = ε 2 + 4 π R 3 a 2 d β ,
ε 1 1 = ε 2 1 4 π R 3 a 2 d β ε 2 2 ,
where a is the separation distance between nanoparticles and R 3 β / is the effective parallel/perpendicular polarizability of the considered nanospheres interacting with each other in the assumed dipole approximation [1,2]. By further assuming that a h , the dimensionless polarizabilities can be defined as:
β = χ 1 χ ζ U A R 3 a 3 + 9 ξ U B R 3 h 2 a 5 ξ R 3 4 h 3 ,
β = χ 1 χ ζ U A R 3 a 3 18 ξ U B R 3 h 2 a 5 ξ R 3 4 h 3 ,
where, for assumed hexagonal arrangement of nanoparticles, U A = 11.0334 and U B = 6.7619 (for the origin of those figures, see [36,37]) and:
ζ = 1 ε 2 + ε 3 ,
ζ = 2 ε 3 ε 2 ε 2 + ε 3 ,
ξ = ε 3 ε 2 ε 3 + ε 2 ,
χ is the polarizability of a single nanoparticle in the dielectric ε 2 surrounding:
χ = ε 2 ε N P ε 2 ε N P + 2 ε 2 ,
where ε N P is the permittivity of the plasmonic material forming the considered nanoparticles (NPs).

2.2. Colorimetric Analysis

Here, we employ colorimetric analysis to assess the degree of color change perceived by a naked eye that may be obtained with the use of the proposed device setup with a sensing NP layer. For that purpose, the chromaticity coordinates were calculated, followed by their further conversion into color represented in the RGB system for more intuitive representation.
In the first step, the spectrum reaching the observer was calculated by multiplying the incident LED spectrum by the reflectance characteristics of the NP reflector. The calculated spectrum, being the primary indication of the proposed sensing method, was further subjected to colorimetric analysis. Then, the tristimulus values were calculated with use of predefined CIE color matching functions and calculated reflected spectra:
X = Δ λ λ = λ r e d λ v i o l e t x ¯ λ P ( λ ) ,
Y = Δ λ λ = λ r e d λ v i o l e t y ¯ λ P ( λ ) ,
Z = Δ λ λ = λ r e d λ v i o l e t z ¯ λ P ( λ ) ,
where x ¯ λ ,   y ¯ λ ,   a n d   z ¯ λ represent CIE color matching functions following the CIE recommendations on colorimetry [38]; P(λ) is the spectrum reflected from the NP-covered mirror; and X, Y, and Z are the resulting CIE tristimulus values. The violet and red limits, i.e., 380 nm and 780 nm, respectively, were imposed by CIE color matching functions. The chromaticity coordinates were then calculated using the following formulas [38]:
x = X X + Y + Z ,
y = Y X + Y + Z ,
z = Z X + Y + Z .
Further conversions to the CIE RGB system were conducted for x = 0.33 and y = 0.33, the white point coordinates (Illuminant E with equal spectral power distribution in the visible range) with gamma correction [39]. Illuminant E, while hard to reproduce in real-world conditions, is often used as a reference in colorimetry. Conducted colorimetric analysis focuses on calculation of chromaticity, as the parameters of the ultimate working environment of the considered sensor are not yet fully established. Introducing assumptions required for calculation of luminance would not necessarily lead to more accurate color representation. It is worth underlining that all acquired spectra were measured in relative values only, as available equipment was not calibrated for absolute measurements. For this reason, the following calculations using the measured data were normalized to unity. While this normalization introduces some inaccuracy in the representation of colors, primarily luminosity, it also provides comparability between the measured spectra, to which we attribute higher importance.

3. The Concept of the Sensing Device

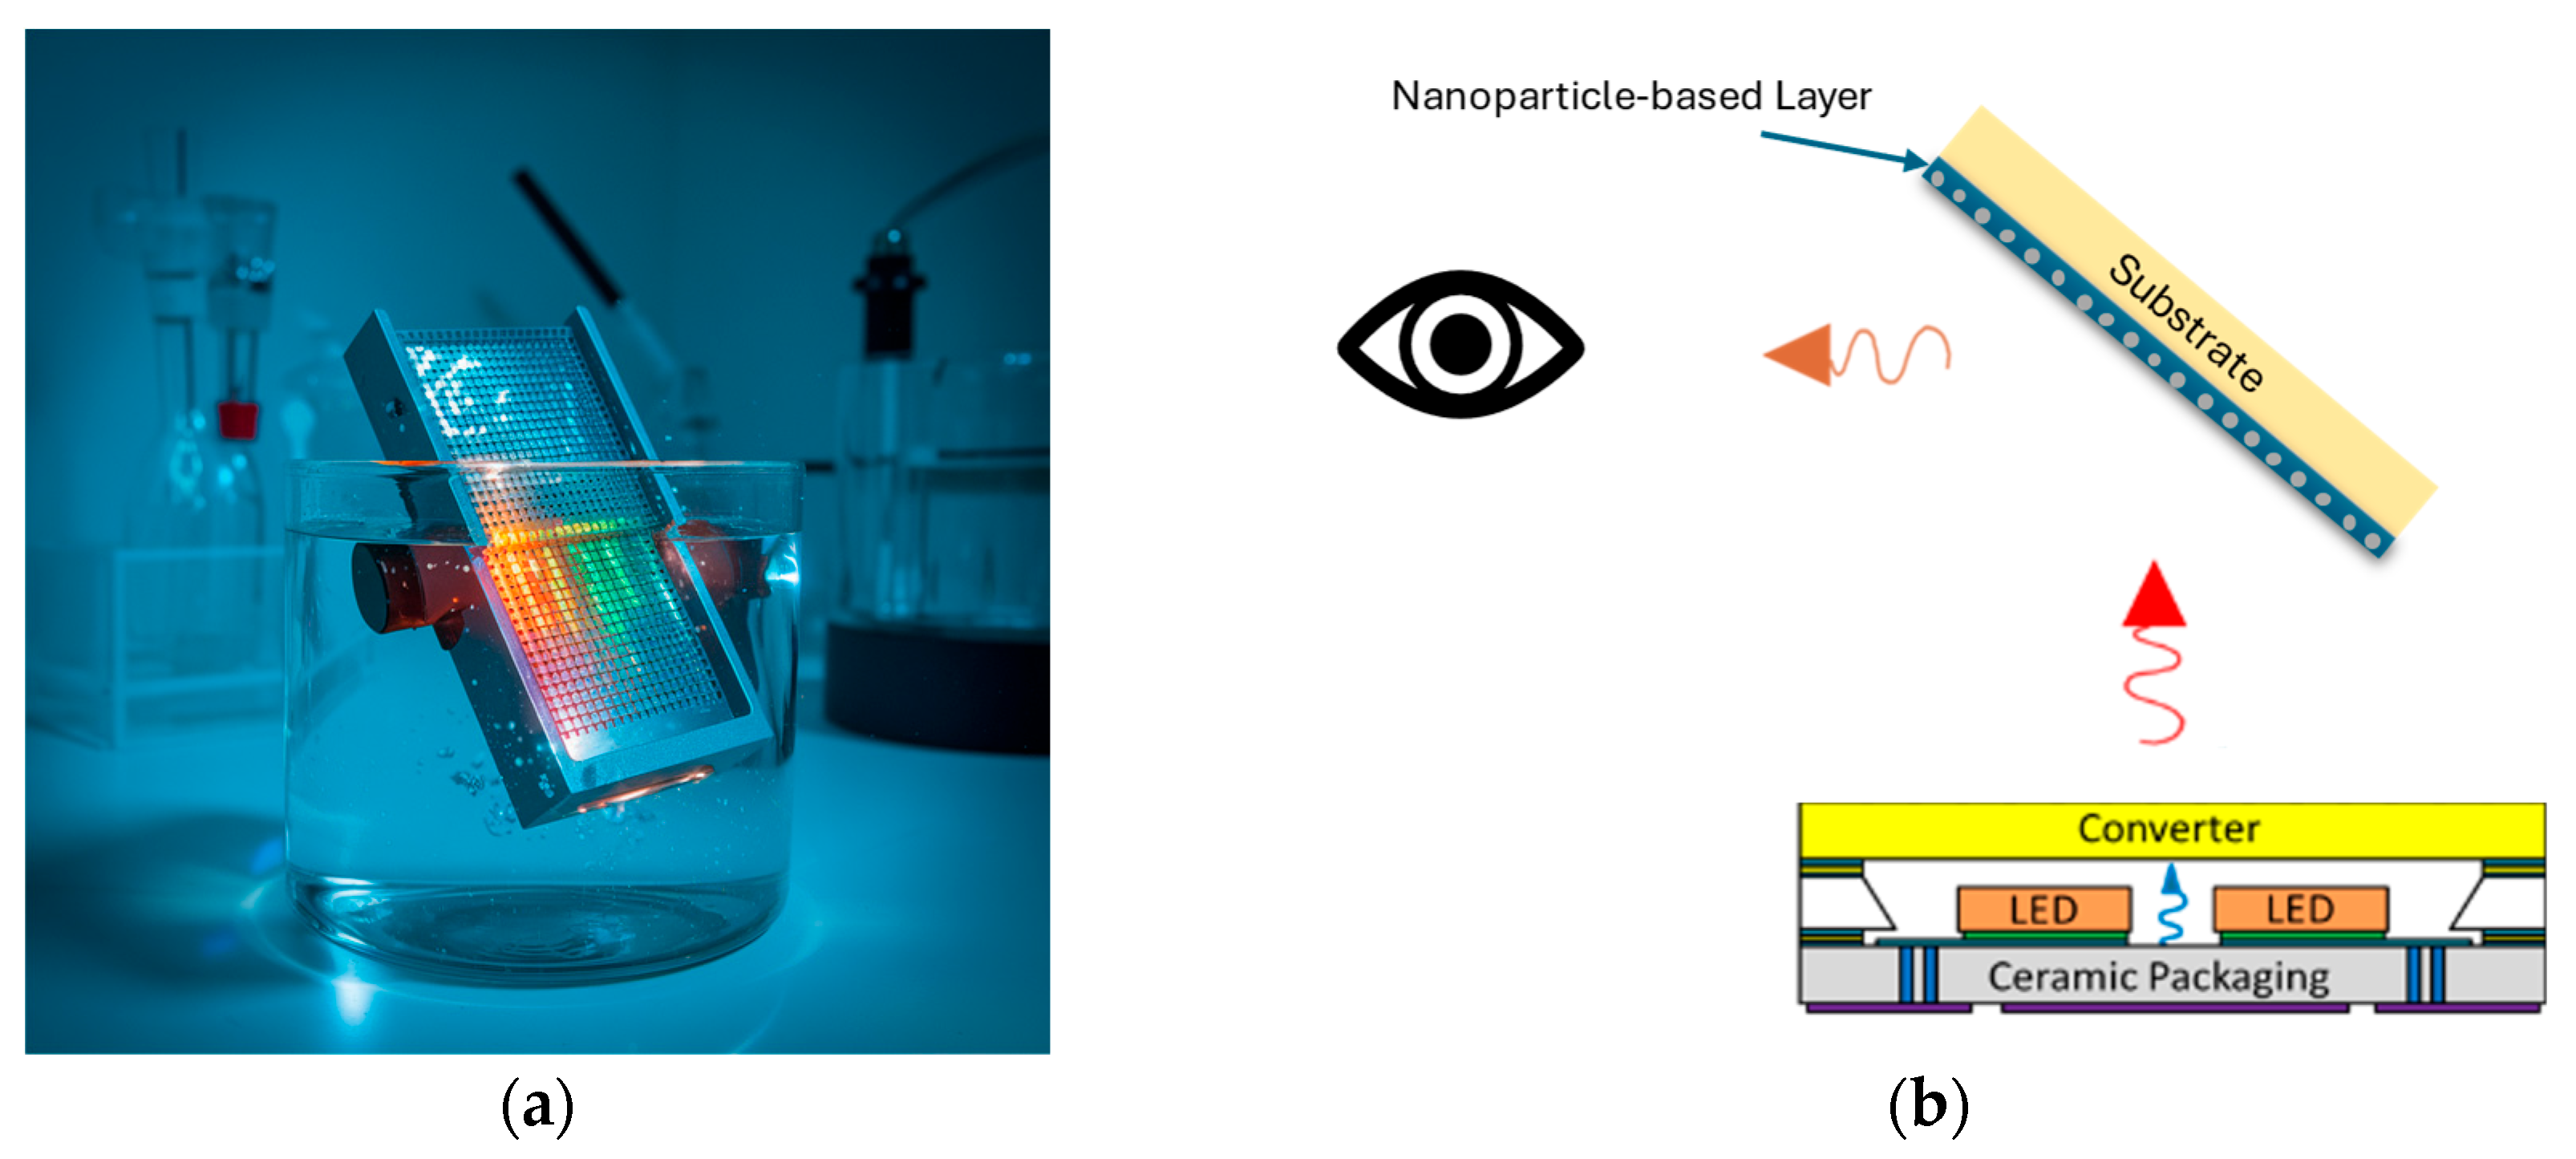
The concept of the proposed sensing device is illustrated in Figure 2a,b. The working principle of the optical system can be understood as an arrangement of subsequent light converters starting from the LED acting as a light source, via a ceramic-based luminophore converting spectrally narrow radiation of the LED to a broader visible spectral range (denoted as ‘converter’ in Figure 2), and, finally, a nanoparticle-based thin-layer sensor that modifies its spectral reflection characteristics in response to changes in its surroundings. The objective of this study is to develop an integrated system for the detection of water contaminants, based on the direct visual observation of contaminant-induced color variation of emitted light.
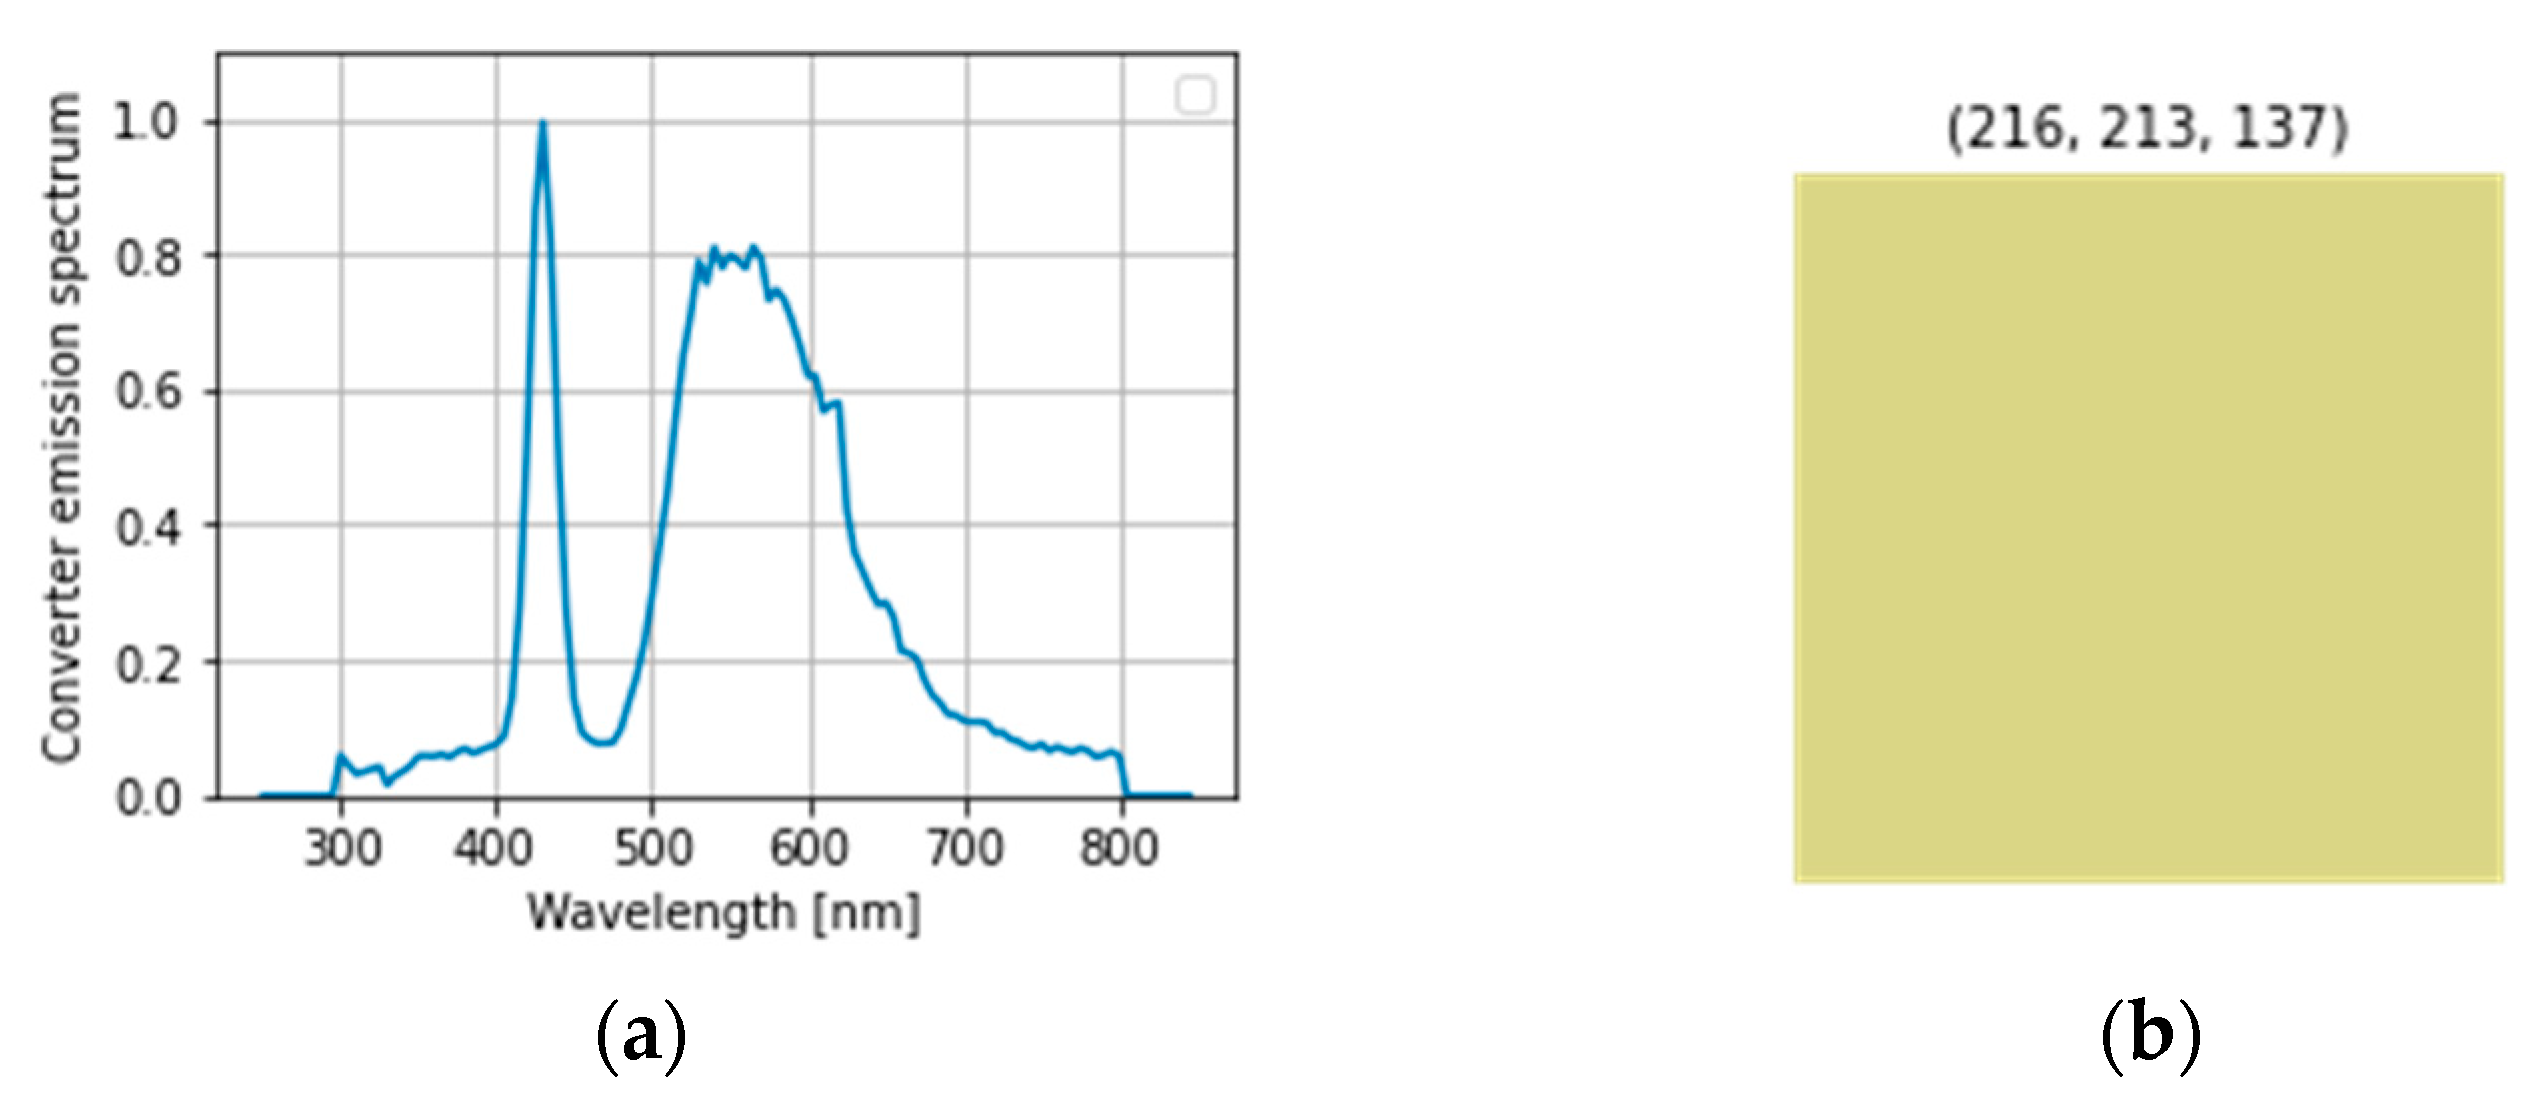
For that purpose, we propose a system with a luminophore based on yttrium aluminum garnet (YAG, Y3Al5O12) co-doped ceramic with 0.2% Ce3+ and 2% Sm3+ ions. The choice of the YAG system was made because of its good physicochemical properties, providing a relatively high probability of radiative transitions of dopants, which makes it a material readily used in photonics. The ceramic composition (active ions, concentrations, scattering phase, etc.) has been selected to obtain the broadband spectrum with the desired color rendering capability and high efficiency of conversion, which makes YAG/Ce3+ commonly used as a basis for white LED phosphors. The photoemission of the converter we used is achieved by excitation with an LED with an emission peak located at 429 nm. The measured emission spectrum of the converter and an LED has been illustrated in Figure 3. The measurements of the converter emission spectrum were conducted using the Newport OSM2-400UV-U optical spectrometer. The results were then interpolated to 1 nm intervals in order to provide computational compatibility with obtained CIE matching functions. The ceramic sample YAG: 0.2% Ce3+, 2% Sm3+ was elaborated using freeze granulation and solid-state reaction methods described in more detail in [40]. The complete LED-phosphor system was optimized and adapted to the reflection performance of the NP-based reflector. In particular, broadband Ce3+ visible light emission is located in the spectral range where the reflectance characteristics of the NP layer are particularly sensitive to changes in the refractive index of the surrounding medium caused by, e.g., water contamination, making it potentially observable with the naked eye. Moreover, Sm3+ ions were introduced to the matrix to improve emission properties within the spectral range corresponding to red color.
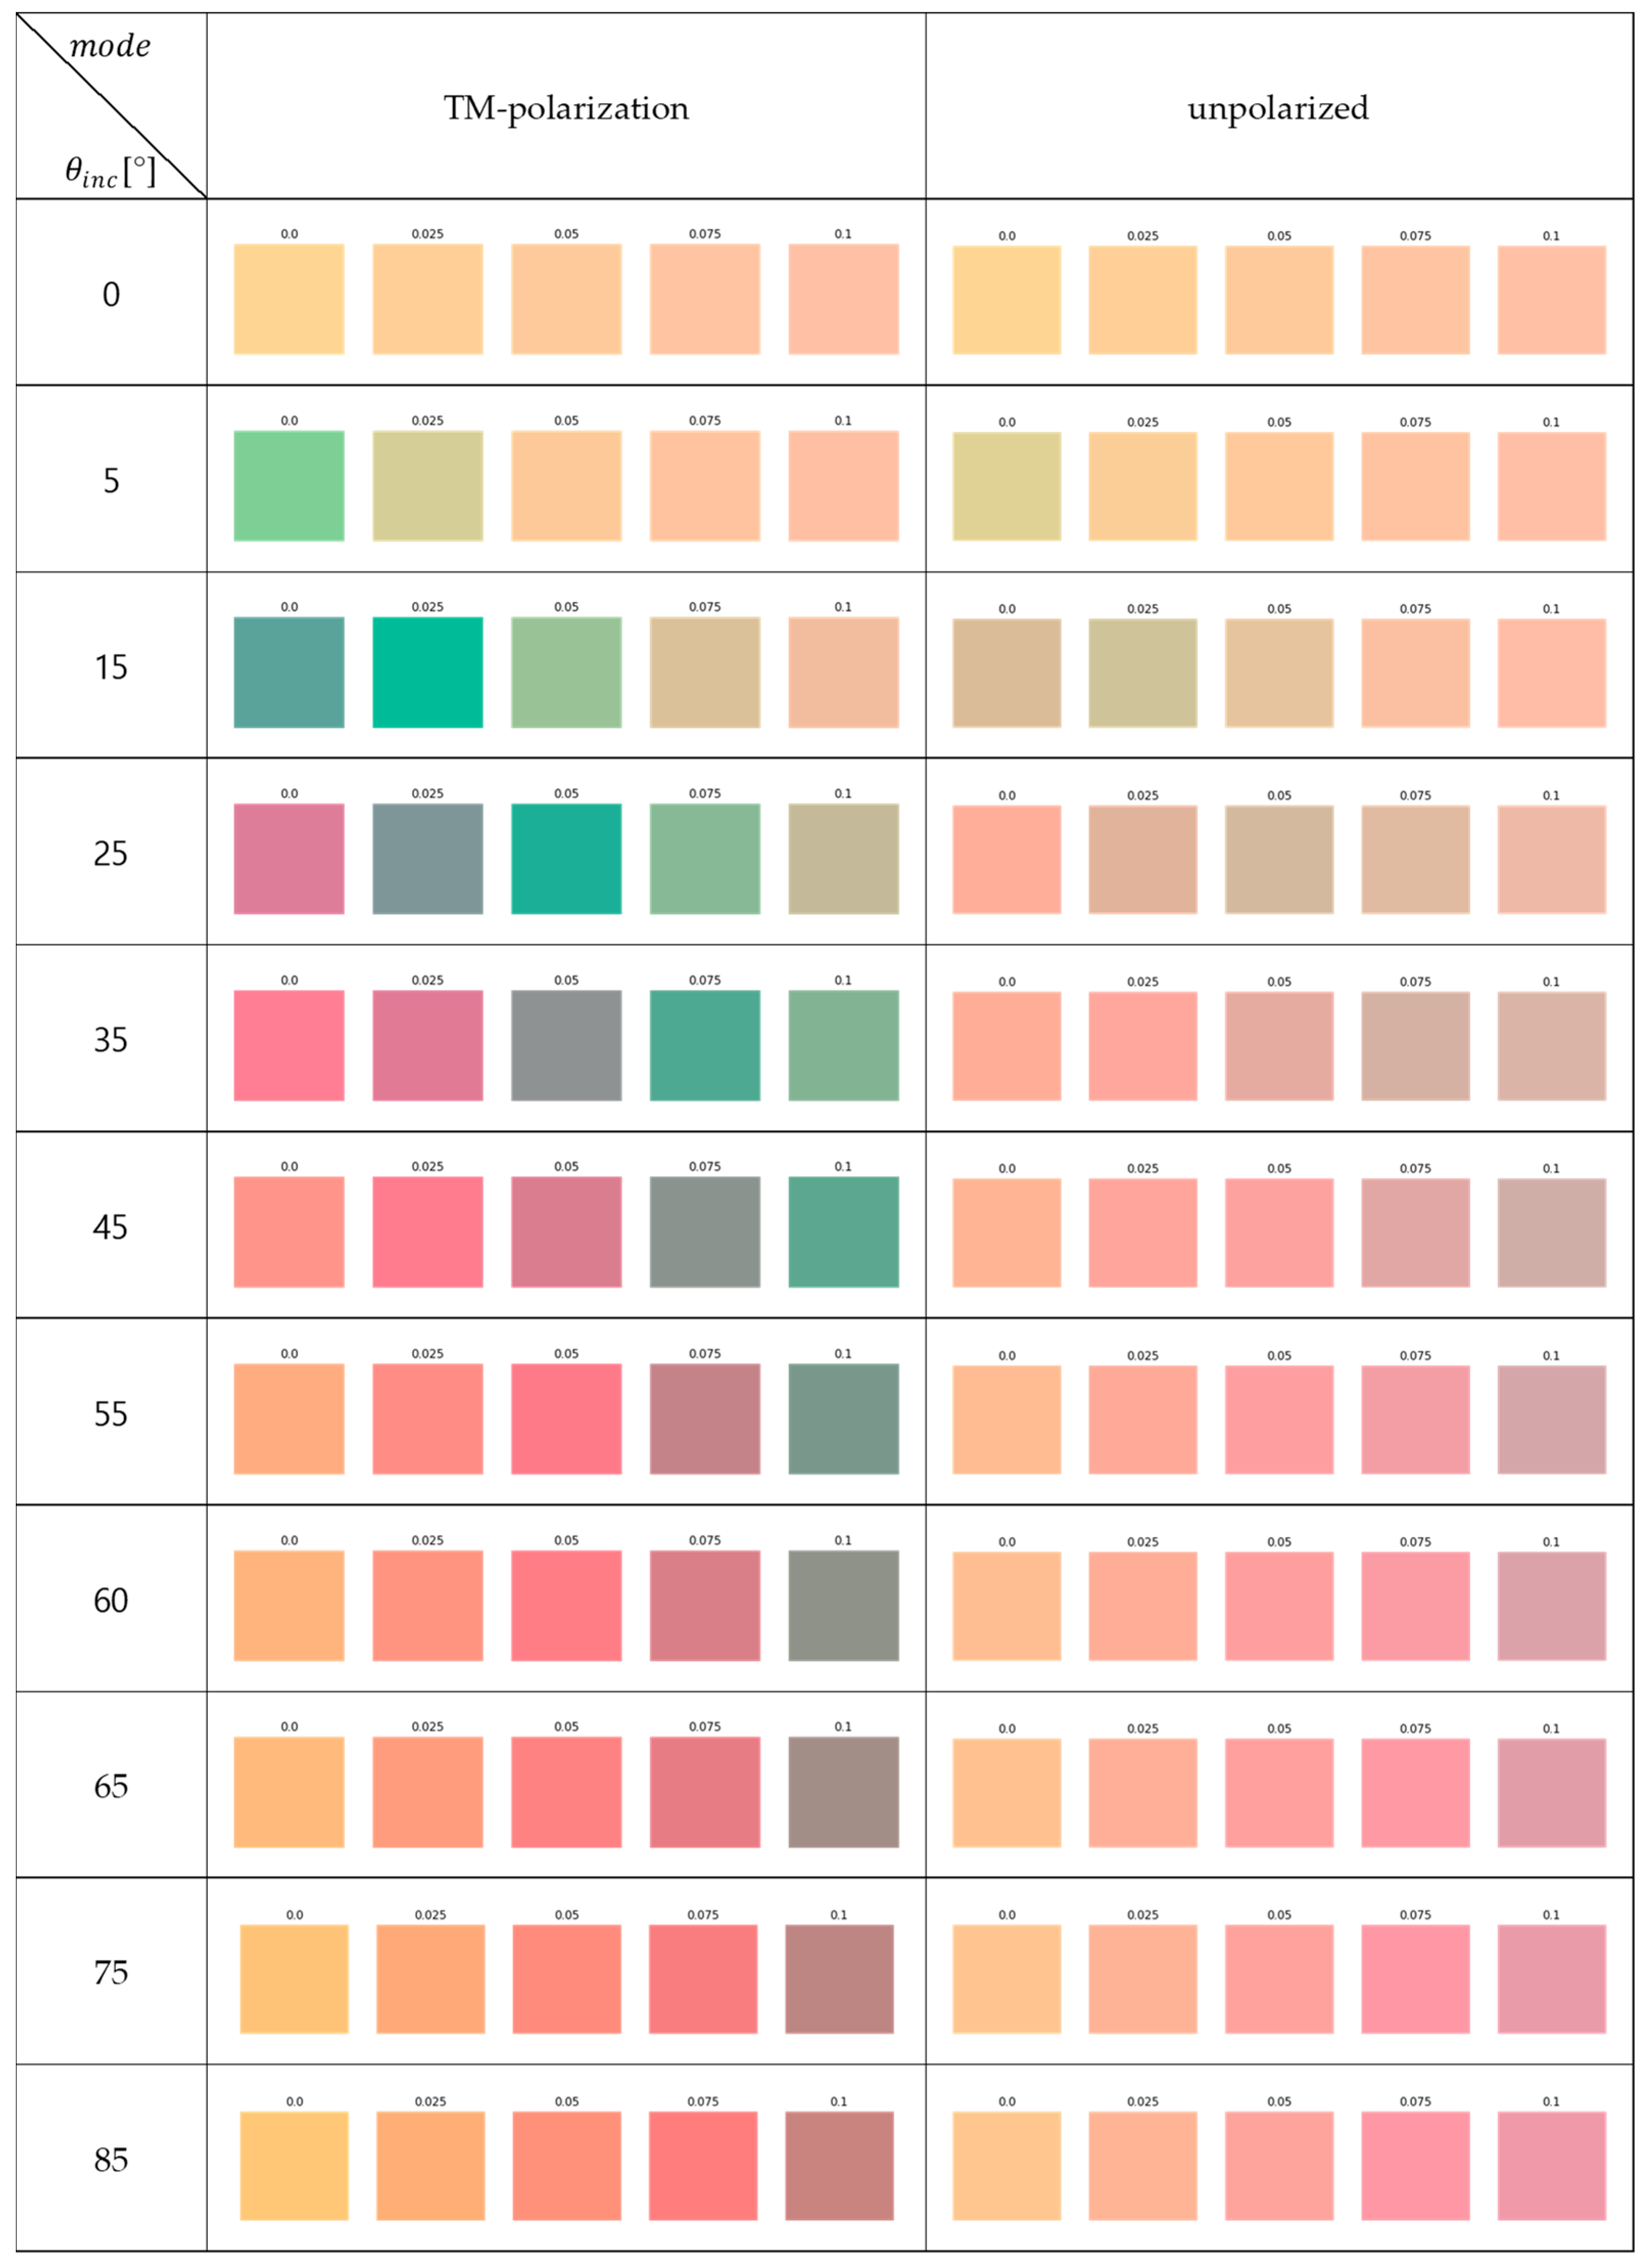
In our analysis, light of spectrum and color depicted in Figure 3 irradiates a 2D arrangement of nanoparticles deposited on a dielectric spacer (described with ε 2 = ε S i O 2 [41]) and truncated with a reflective substrate (output medium); see Figure 1. Since the objective of the proposed device is to operate underwater, the refractive index of the input medium is assumed as n i n = n w a t e r 1.33   ( ε w a t e r 1.76 ). Moreover, to achieve plasmonic excitation in the substrate, it is required to apply a non-normal angle of incidence, which, in our calculations, was set at 75°. It is worth underlying that choosing this particular angle not only improved sensitivity in comparison to normal incidence but also provided reliable operation, preventing false-positive color readouts (for details, see Appendix A.2) and maintaining stable colorimetric properties within a +/− 10° deviation of the incidence angle. The NP layer is a 2D hexagonal arrangement of silver nanoparticles of permittivity described with a modified Drude formula accounting for a surface damping effect and inter-band optical transitions [42,43]. This particular type of arrangement and material has been employed due to the fact that such a structure is known to deliver high-Q plasmonic resonance within the visible spectral range, which is essential for sensing applications [44]. Additionally, silver, among other noble metals, provides minimal optical dampening, which may even further enhance sensing performance in comparison to gold nanoparticles revealing inter-band absorption around 520 nm [42]. It is worth underlining that lower absorption also means that silver nanoparticles dissipate less energy as heat compared to gold or copper, which may stabilize measurement in underwater environments by preventing local heating of the medium. In line with our previous study [45], such nanoparticles may be synthesized based on the nucleation-growth method. Typically, to obtain a given pattern of nanoparticles on large areas, a number of different approaches can be applied involving non-template and template-assisted methods, such as dip-coating, block copolymer micelle nanolithography (BCML), capillary assembly, or confined electrochemical deposition (ECD) [46,47]. In particular, an NP layer with well-sustained inter-particle distances may be easier obtained using different variants of template-assisted methods, e.g., BCML combined with glancing angle deposition (GLAD), which have been experimentally demonstrated to successfully fabricate similar arrangements [48,49]. For the purpose of our calculations, the complete NP arrangement has been characterized with a uniaxial effective permittivity tensor as described in Section 2.1 of this manuscript. For the purpose of our analysis, the geometrical parameters of the layer have been chosen to achieve effective resonance within the emission spectrum of the considered luminophore, which can be achieved with R =   50 nm, h   =   30 nm, and a   =   80 nm. As such, the chosen set of geometrical parameters provides not only the location of the plasmonic resonance within the considered spectral range but also enhanced broadband surface damping, strengthening the entire response of the NP layer. It is worth underlining that the nanoparticle diameter ( R ), interparticle distance ( a ) , and distance to the substrate ( h ) are essential in engineering the plasmonic behavior of the system. The NP diameter dictates the spectral position of the localized plasmon resonance of individual particles, the interparticle distance governs the strength of coupling and possible resonance splitting or degeneration, and the distance to the substrate determines the interaction between NP modes and substrate-supported plasmonic modes. While each of these parameters can significantly influence the effective optical properties, the layer thickness and interparticle distance are relatively tolerant to fabrication-induced deviations. In contrast, the NP size is far more sensitive to such variations, making it the most critical parameter for ensuring reproducibility and precision in the plasmonic response. In order to account for nanoparticle size deviation, the calculated effective response was averaged over a representative set of nanoparticle diameters, i.e., ±2 nm, which are feasible within existing technological procedures [50]. The response of each nanoparticle size was computed individually, and the overall response was obtained as an average across the selected diameters, corresponding to the assumed size distribution of the ensemble. In this way, the resulting spectra represent the effective response of multilayers composed of nanoparticles with varying diameters, rather than the idealized case of a single-size system. This procedure provides a more realistic description of the experimentally expected performance, where unavoidable deviations in nanoparticle size contribute to the measured signal. Within the employed model, we simulate the presence of water contamination by modifying the refractive index of the medium surrounding the nanoparticles, i.e., n s u r r o u n d i n g =   n w a t e r + c , where c = { 0,0.025,0.05,0.075,0.1 } , influencing the final effective anisotropic permittivity of the NP layer; see Equations (7)–(14). It is worth underlining that such modification of refractive index can be achieved with an appropriate water–glycerol mixture [51].

4. Results and Discussion

In general, it is known that the introduction of a contaminant into an aqueous solution with a large amount of nanoparticles may induce a change in color of the reflected/transmitted light and thus allow naked-eye detection of contaminant presence [52]. However, such a strong response may be challenging to replicate with a single layer of NPs, which innately possess limited interaction volume and absorption cross section resulting from 2D geometry. Thus, to enhance the sensitivity of such a sensor, we employ not only localized plasmon resonance (LPR) of nanoparticles but also non-localized plasmon resonance (non-LPR) that may be encountered at the interface between dielectric and bulk optical metal. To demonstrate our idea, we investigate optical properties and responses of the considered devices with the NP sensing layer deposited on two different reflective substrates, i.e., for ε o u t = ε 3 = ε A u and ε o u t = ε A g [43]. Starting from the first case of gold substrate, consider reflection properties for TE- and TM-polarized as well as unpolarized light reflectance minimum around 610 nm; see the blue curve in Figure 4b,c corresponding to the absence of contaminants. This behavior is caused by an effective resonance arising from LPRs of nanoparticles composing the lattice as well as intercoupling between them. The additional minimum around 750 nm for TM-polarization corresponds to the resonance provided by plasmons excited in the gold substrate. It is worth noting that the change in the refractive index of the surroundings leads to substantial redshift of the minimum, which is caused by tuning effective plasmonic resonances of NPs. Due to the dominant influence of TM-polarization properties over response for unpolarized light, we limit the following colorimetric analysis to the case of TM-polarized and unpolarized radiation; see Figure 5 and Figure 6.
For each considered level of contamination c , we calculated the resulting spectrum, i.e., radiation of the converter and LED reflected by the NP-based sensing reflector, as perceived by the observer; see Figure 5a and Figure 6a. Then, in line with the methodology described in Section 2.2, the resulting spectra were translated to colors that may be perceived with a naked eye by a standardized CIE observer; see Figure 5b and Figure 6b.
It can be noticed that modification of the refractive index by 0.05, which may be caused by contamination with substances such as propanol (30% concentration in water solution corresponds to n c = 1.3750) or butanol (30% concentration in water solution corresponds to n c = 1.3968) [53], induces observable color change of light emitted by our device; see Figure 5b and Figure 6b. The effect of color change occurs for both TM-polarized and unpolarized light; however, higher contrast may be achieved by introducing a polarizer in the considered optical system (comparing Figure 5b and Figure 6b).
Similar analysis has been performed for an NP sensing layer deposited on a silver substrate; see Figure 7, Figure 8 and Figure 9. Due to coupling between NP and substrate modes, the resonances causing minima are blueshifted with respect to the case of gold substrate, which can be observed in related reflected spectra of TM-polarized light; compare Figure 4b and Figure 7b.
The colorimetric analysis has revealed that the overlap between plasmonic resonance and the emission peak of the considered luminophore causes significant modification of contaminant-induced color change of emitted light; see Figure 8 and Figure 9. In particular, the observable color change occurs already at a contamination level of 0.01, which significantly improves the sensitivity of the proposed device. Similar to the previous case, higher contrast color change occurs for TM-polarization. Thus, the application of a polarizer would be beneficial to facilitate signal recognition in cases of differentiated color perception in the target naked-eye detection application. For that purpose, deposition of the proposed NP layer onto two considered substrates, i.e., silver and gold, may also be applied to achieve higher color contrast change.
As such, the proposed device exhibits a plasmonic resonance that is well-aligned with the emission spectrum of the proposed converter, a characteristic that has been deliberately engineered to enhance its operational efficiency. While the assumed technological framework has been leveraged nearly to its full extent in terms of optimizing this resonance, further refinement could still yield measurable improvements in sensing performance.
As such, the proposed AgNP-based sensor provides several practical advantages for monitoring water quality. Its core mechanism relies on color changes of the emitted light that are perceptible to the naked eye, allowing for rapid, real-time, and on-site detection of contaminants without the need for complex instrumentation. The plasmonic properties of AgNPs ensure strong light–matter interactions, which facilitate reliable colorimetric responses in the target aquatic environment. Importantly, the sensor was designed to be well aligned with the emission spectrum of the LED/YAG ceramic converter, which may impose limitations on sensitivity.
At this stage of development, the main limitations relate to sensitivity and selectivity. While the sensor can reliably indicate the presence of contaminants, distinguishing between different types of analytes or detecting very low concentrations remains challenging. These limitations can be addressed in future work through optimization of nanoparticle size, shape, and surface functionalization, as well as fine-tuning of the optical setup and measurement protocols. Overall, the combination of naked-eye perceptibility, angle-optimized design, spectral alignment with the light source, and robust encapsulation highlights the practical promise of this approach for real-time, reliable water quality monitoring, while providing clear avenues for further enhancement of sensitivity and selectivity.

5. Conclusions

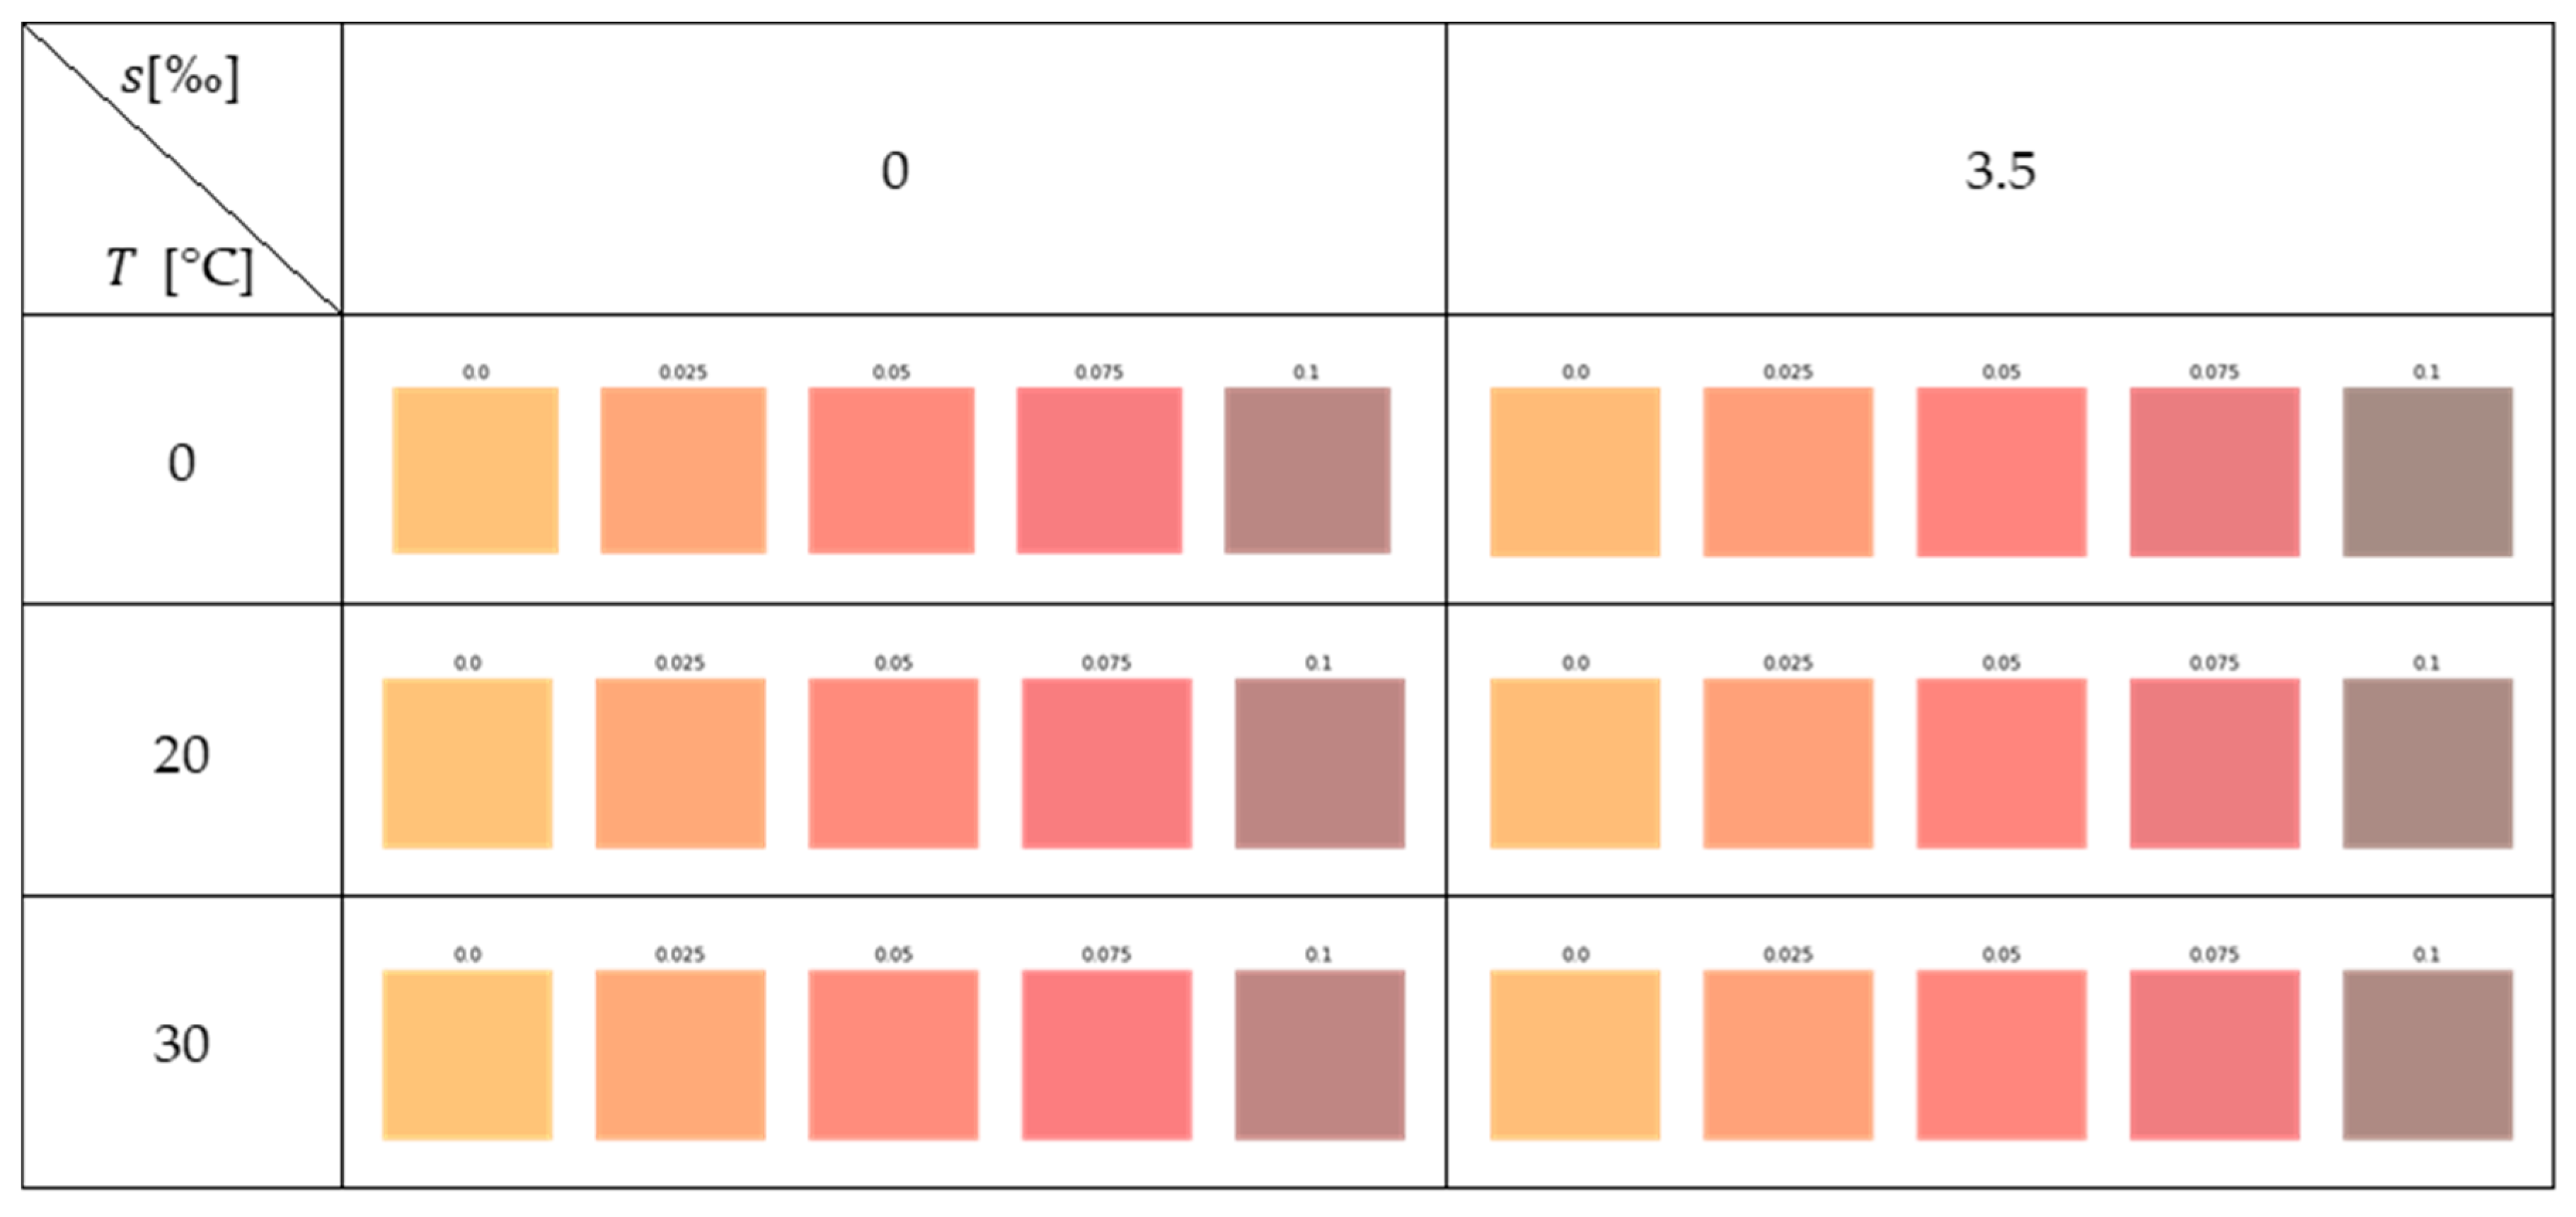
In this study, we have demonstrated the design and potential applications of an optical sensing and light-emitting device enabling naked-eye monitoring of water contaminants. By leveraging the sensitivity of Ag nanoparticles together with the efficient emission provided by a YAG luminophore, the proposed device may provide a rapid and cost-effective method for real-time water quality monitoring, regardless of external lighting conditions. The simplicity and self-sufficiency of the proposed device allow for immediate visual confirmation of contamination, eliminating the need for specialized instrumentation and/or an external light source. Additionally, the proposed sensor demonstrates robustness under typical aquatic conditions, as salinity induces only negligible spectral changes and temperature variations between 0 and 30 °C do not generate false-positive responses (for details, see Appendix A.1).
After demonstration of the concept, future work will be focused on improving the sensitivity and selectivity of the sensor for specific contaminants. The process of optimization is complex and requires not only a careful design of geometrical parameters of the NP layer to increase its sensitivity but also an appropriate choice of doping composition of the ceramic luminophore and its excitation source, functionalization of the sensing layer analyte-specific bioreceptors to improve selectivity of the device, as well as improving stability under assumed environmental conditions. In particular, the angle of incidence must be optimized to balance sensitivity and stability as well as related parameters, such as detection limit. Lower angles typically enhance sensitivity but are more vulnerable to environmental fluctuations, whereas higher angles improve robustness and color contrast at the cost of reduced sensitivity. Careful selection of this parameter is, therefore, essential for achieving reliable performance in practical sensing applications. Further development of the proposed sensor will also be focused on enhancing selectivity while maintaining robust naked-eye detection. This can be achieved by functionalizing the surface with analyte-specific recognition elements such as aptamers, DNAzymes, peptides, or small-molecule chelators [54]. These functional layers should be confined within the plasmonic near-field to maximize sensitivity, while different strategies, such as selective membranes, may help to minimize nonspecific signals from complex water matrices. Assay designs including sandwich or amplification schemes, molecularly imprinted polymers, and controlled aggregation can further improve specificity toward relevant targets, such as heavy-metal ions like Cu2+ [55,56]. As such, designing, optimizing, and demonstrating a sensing device for a given analyte is a separate, application-specific process often requiring development of dedicated theoretical models for simulation and technological processes for fabrication and integration.
Another key challenge in deploying AgNP-based colorimetric sensors in aqueous environments is the intrinsic susceptibility of silver to tarnishing, oxidation, and sulfidation, which can reduce long-term performance. Protective coatings can enhance sensor longevity; however, a trade-off exists between maintaining near-field plasmonic sensitivity and ensuring reliable measurements, which must be carefully balanced in the design process. Another critical consideration is the waterproof sealing of the electronics. This can be addressed by leveraging the inherently nonporous nature of YAG ceramic to encapsulate the LED and converter within a single, sealed device (schematic shown in Figure 2b), preventing water penetration while preserving stable operation.
We strongly believe that, by demonstrating the concept of device-enabling naked-eye monitoring of water contaminants, we paved guidelines for further successful development of this technology, which will improve accessibility and reliability of water quality monitoring solutions, ultimately promoting public health and environmental sustainability.

Author Contributions

Conceptualization, R.T., A.A., F.R., A.K., M.I., B.J., and S.Z.; methodology, B.J. and B.F.; software, B.J. and M.K. (Marcin Kieliszczyk); validation, A.K., O.B., F.R., and M.K. (Marcin Kaczkan); formal analysis, B.J. and B.F.; investigation, B.J.; resources, R.T.; data curation, R.T.; writing—original draft preparation, R.T. and B.J.; writing—review and editing, R.T. and M.K. (Marcin Kieliszczyk); visualization, B.J.; supervision, F.R. and M.K. (Marcin Kaczkan); project administration, A.K.; funding acquisition, A.K. All authors have read and agreed to the published version of the manuscript.

Funding

The work was carried out as a part of the M-Era.Net call 2019 grant entitled “New versatile platform for illumination and sensing”. The research conducted in Poland was financed by the National Center for Research and Development, contract number: M-ERA.NET2/2019/8/2021.

Institutional Review Board Statement

Not applicable.

Informed Consent Statement

Not applicable.

Data Availability Statement

The raw data supporting the conclusions of this article will be made available by the authors on request.

Conflicts of Interest

The authors declare no conflicts of interest.

Abbreviations

The following abbreviations are used in this manuscript:
NPNanoparticle
LEDLight-emitting diode
LPRLocalized plasmon resonance
ITOIndium tin oxide

Appendix A

Appendix A.1

Here, we perform a small sensitivity analysis showing the influence of common factors in the water environment, which may deteriorate sensing performance. In the scope of the analysis, we investigate the change in salinity and temperature and its influence over color readout. For that purpose, we have implemented a model of the refractive index of water and its dependence on salinity and temperature in line with the work of the Parrish Research Group of Oregon State University [57] and analyzed the influence of those parameters within the temperature range of 0–30 °C and salinity content from 0 to 3.5‰, which correspond to the cases of fresh and salt water, respectively. Please see Figure A1 and Figure A2 for sample results.
Figure A1. Cross-sensitivity analysis for the sensor based on the AgNP layer deposited on the Ag substrate and incident TM-polarized light.
Applsci 15 09975 g0a1
Figure A2. Cross-sensitivity analysis for the sensor based on the AgNP layer deposited on the Ag substrate and incident nonpolarized light.
Applsci 15 09975 g0a2
The obtained results demonstrated that salinity, which increases the refractive index of the surrounding medium, exerts only a slight and practically negligible effect on the colorimetric readout, even at a contamination level of 0.1. Furthermore, variations in water temperature within the range of 0 to 30 °C do not produce any observable changes in the response, thereby excluding the possibility of false-positive detections arising from thermal fluctuations. This confirms that the sensing mechanism remains robust against typical environmental variations, ensuring reliable performance under real aquatic conditions.

Appendix A.2

To provide insight into the spatial incidence-related properties, we investigate the influence of the angle of incidence over the output color readout for a representative case of an AgNP sensing layer deposited on an Ag substrate; see Figure A3.
Figure A3. Colorimetric readouts for various contamination levels and different angles of incidence (see rows for values) and different light polarizations (see description in columns) for the AgNP layer deposited on the Ag substrate.
Applsci 15 09975 g0a3
Numerical simulations presented above (see Figure A3) reveal that the colorimetric response of the sensor is strongly dependent on the angle of incidence, reflecting the plasmonic nature of the sensing layer. While an appropriate choice of incidence angle can significantly enhance sensitivity, larger angles provide lower color contrast and, at the same time, more stable performance against external disturbances such as temperature fluctuations. These findings indicate that optimizing the incidence angle offers a practical means to balance sensitivity with measurement stability. For these reasons, in the present work we selected an incidence angle of 75°, as it provides an optimal balance between sensitivity and robustness of the measurement.

References

  1. Velasco-Muñoz, J.; Aznar-Sánchez, J.; Belmonte-Ureña, L.; Román-Sánchez, I. Sustainable Water Use in Agriculture: A Review of Worldwide Research. Sustainability 2018, 10, 1084. [Google Scholar] [CrossRef]
  2. Berga, L. The Role of Hydropower in Climate Change Mitigation and Adaptation: A Review. Engineering 2016, 2, 313–318. [Google Scholar] [CrossRef]
  3. Ding, G.K.C. Life Cycle Assessment (LCA) of Sustainable Building Materials: An Overview. In Eco-Efficient Construction and Building Materials; Elsevier: Amsterdam, The Netherlands, 2014; pp. 38–62. ISBN 978-0-85709-767-5. [Google Scholar]
  4. Dutta, D.; Arya, S.; Kumar, S. Industrial Wastewater Treatment: Current Trends, Bottlenecks, and Best Practices. Chemosphere 2021, 285, 131245. [Google Scholar] [CrossRef]
  5. Wilkinson, J.L.; Boxall, A.B.A.; Kolpin, D.W.; Leung, K.M.Y.; Lai, R.W.S.; Galbán-Malagón, C.; Adell, A.D.; Mondon, J.; Metian, M.; Marchant, R.A.; et al. Pharmaceutical Pollution of the World’s Rivers. Proc. Natl. Acad. Sci. USA 2022, 119, e2113947119. [Google Scholar] [CrossRef] [PubMed]
  6. Rosińska, W.; Jurasz, J.; Przestrzelska, K.; Wartalska, K.; Kaźmierczak, B. Climate Change’s Ripple Effect on Water Supply Systems and the Water-Energy Nexus–A Review. Water Resour. Ind. 2024, 32, 100266. [Google Scholar] [CrossRef]
  7. Gleick, P.H.; Cooley, H. Freshwater Scarcity. Annu. Rev. Environ. Resour. 2021, 46, 319–348. [Google Scholar] [CrossRef]
  8. Guo, Y.; Liu, C.; Ye, R.; Duan, Q. Advances on Water Quality Detection by UV-Vis Spectroscopy. Appl. Sci. 2020, 10, 6874. [Google Scholar] [CrossRef]
  9. Kumari, V.B.C.; Patil, S.M.; Ramu, R.; Shirahatti, P.S.; Kumar, N.; Sowmya, B.P.; Egbuna, C.; Uche, C.Z.; Patrick-Iwuanyanwu, K.C. Chromatographic Techniques: Types, Principles, and Applications. In Analytical Techniques in Biosciences; Elsevier: Amsterdam, The Netherlands, 2022; pp. 73–101. ISBN 978-0-12-822654-4. [Google Scholar]
  10. Boukhobza, I.; Crans, D.C. Application of HPLC to Measure Vanadium in Environmental, Biological and Clinical Matrices. Arab. J. Chem. 2020, 13, 1198–1228. [Google Scholar] [CrossRef]
  11. Reinemann, C.; Freiin Von Fritsch, U.; Rudolph, S.; Strehlitz, B. Generation and Characterization of Quinolone-Specific DNA Aptamers Suitable for Water Monitoring. Biosens. Bioelectron. 2016, 77, 1039–1047. [Google Scholar] [CrossRef]
  12. Jaria, G.; Calisto, V.; Otero, M.; Esteves, V.I. Monitoring Pharmaceuticals in the Aquatic Environment Using Enzyme-Linked Immunosorbent Assay (ELISA)—A Practical Overview. Anal. Bioanal. Chem. 2020, 412, 3983–4008. [Google Scholar] [CrossRef]
  13. Kim, K.; Joung, H.-A.; Han, G.-R.; Kim, M.-G. An Immunochromatographic Biosensor Combined with a Water-Swellable Polymer for Automatic Signal Generation or Amplification. Biosens. Bioelectron. 2016, 85, 422–428. [Google Scholar] [CrossRef]
  14. Pillay, S.J.; Bangira, T.; Sibanda, M.; Kebede Gurmessa, S.; Clulow, A.; Mabhaudhi, T. Assessing Drone-Based Remote Sensing for Monitoring Water Temperature, Suspended Solids and CDOM in Inland Waters: A Global Systematic Review of Challenges and Opportunities. Drones 2024, 8, 733. [Google Scholar] [CrossRef]
  15. Alharbi, B. Remote Sensing Techniques for Monitoring Algal Blooms in the Area between Jeddah and Rabigh on the Red Sea Coast. Remote Sens. Appl. Soc. Environ. 2023, 30, 100935. [Google Scholar] [CrossRef]
  16. Ahmed, U.; Mumtaz, R.; Anwar, H.; Mumtaz, S.; Qamar, A.M. Water Quality Monitoring: From Conventional to Emerging Technologies. Water Supply 2020, 20, 28–45. [Google Scholar] [CrossRef]
  17. AlMashrea, B.A.; Almehdi, A.M.; Damiati, S. Simple Microfluidic Devices for in Situ Detection of Water Contamination: A State-of-Art Review. Front. Bioeng. Biotechnol. 2024, 12, 1355768. [Google Scholar] [CrossRef]
  18. Krishnan, S.; Syed, Z.U.Q. Colorimetric Visual Sensors for Point-of-Needs Testing. Sens. Actuators Rep. 2022, 4, 100078. [Google Scholar] [CrossRef]
  19. Yao, C.; Yu, S.; Li, X.; Wu, Z.; Liang, J.; Fu, Q.; Xiao, W.; Jiang, T.; Tang, Y. A Plasmonic ELISA for the Naked-Eye Detection of Chromium Ions in Water Samples. Anal. Bioanal. Chem. 2017, 409, 1093–1100. [Google Scholar] [CrossRef] [PubMed]
  20. Pang, H.; Hu, Y.; Yu, J.; Gallou, F.; Lipshutz, B.H. Water-Sculpting of a Heterogeneous Nanoparticle Precatalyst for Mizoroki–Heck Couplings under Aqueous Micellar Catalysis Conditions. J. Am. Chem. Soc. 2021, 143, 3373–3382. [Google Scholar] [CrossRef]
  21. Mayer, K.M.; Hafner, J.H. Localized Surface Plasmon Resonance Sensors. Chem. Rev. 2011, 111, 3828–3857. [Google Scholar] [CrossRef]
  22. Salah, N.H. Surface Plasmon Resonance Sensor of Toxic Nanoparticles in Aqueous Systems. Eurasian J. Sci. Eng. 2019, 4, 40–48. [Google Scholar] [CrossRef]
  23. Śmietana, M.; Burnat, D.; Curda, P.; Janaszek, B.; Kieliszczyk, M.; Sezemsky, P.; Koba, M.; Stranak, V.; Szczepański, P. Electro-Optically Modulated Lossy-Mode Resonance—A New Approach for Label-Free Sensing. ACS Photon. 2024, 11, 2061–2069. [Google Scholar] [CrossRef]
  24. Mahani, F.F.; Mokhtari, A.; Berini, P. Plasmonic Biosensor on the End-Facet of a Dual-Core Single-Mode Optical Fiber. Biosensors 2023, 13, 558. [Google Scholar] [CrossRef]
  25. Bekmurzayeva, A.; Ashikbayeva, Z.; Myrkhiyeva, Z.; Nugmanova, A.; Shaimerdenova, M.; Ayupova, T.; Tosi, D. Label-Free Fiber-Optic Spherical Tip Biosensor to Enable Picomolar-Level Detection of CD44 Protein. Sci. Rep. 2021, 11, 19583. [Google Scholar] [CrossRef]
  26. Cheng, Y.-C.; Chang, Y.-J.; Chuang, Y.-C.; Huang, B.-Z.; Chen, C.-C. A Plasmonic Refractive Index Sensor with an Ultrabroad Dynamic Sensing Range. Sci. Rep. 2019, 9, 5134. [Google Scholar] [CrossRef]
  27. Chau, Y.-F.C.; Chou Chao, C.-T.; Jumat, S.Z.B.H.; Kooh, M.R.R.; Thotagamuge, R.; Lim, C.M.; Chiang, H.-P. Improved Refractive Index-Sensing Performance of Multimode Fano-Resonance-Based Metal-Insulator-Metal Nanostructures. Nanomaterials 2021, 11, 2097. [Google Scholar] [CrossRef]
  28. Rich, R.L.; Myszka, D.G. Higher-Throughput, Label-Free, Real-Time Molecular Interaction Analysis. Anal. Biochem. 2007, 361, 1–6. [Google Scholar] [CrossRef] [PubMed]
  29. Mullett, W.M.; Lai, E.P.C.; Yeung, J.M. Surface Plasmon Resonance-Based Immunoassays. Methods 2000, 22, 77–91. [Google Scholar] [CrossRef]
  30. Wo, J.; Wang, G.; Cui, Y.; Sun, Q.; Liang, R.; Shum, P.P.; Liu, D. Refractive Index Sensor Using Microfiber-Based Mach–Zehnder Interferometer. Opt. Lett. 2012, 37, 67. [Google Scholar] [CrossRef]
  31. Fard, S.T.; Donzella, V.; Schmidt, S.A.; Flueckiger, J.; Grist, S.M.; Talebi Fard, P.; Wu, Y.; Bojko, R.J.; Kwok, E.; Jaeger, N.A.F.; et al. Performance of Ultra-Thin SOI-Based Resonators for Sensing Applications. Opt. Express 2014, 22, 14166. [Google Scholar] [CrossRef]
  32. Martínez-Ayala, L.; Bornacelli, J.; Ojeda-Misses, M.A.; Arano-Martinez, J.A.; Torres-Torres, C.; Martines-Arano, H. Chaos-Driven Detection of Methylene Blue in Wastewater Using Fractional Calculus and Laser Systems. Meas. Sci. Technol. 2025, 36, 15801. [Google Scholar] [CrossRef]
  33. Jayaprakash, V.; You, J.B.; Kanike, C.; Liu, J.; McCallum, C.; Zhang, X. Determination of Trace Organic Contaminant Concentration via Machine Classification of Surface-Enhanced Raman Spectra. Environ. Sci. Technol. 2024, 58, 15619–15628. [Google Scholar] [CrossRef]
  34. Lomae, A.; Chaiyo, S.; Chailapakul, O.; Siangproh, W.; Panchompoo, J. Fully Integrated Colorimetric Sensor Based on Transparency Substrate for Salbutamol Determination. MethodsX 2022, 9, 101913. [Google Scholar] [CrossRef]
  35. Xu, J.; Gui, M.; Li, Z.; Fang, Y.; Wang, S.; Li, H.; Yu, R. Enhanced Colorimetric Analysis Substrate Based on Graphene Oxide Open-Close Actuator. Sens. Actuators B Chem. 2025, 423, 136748. [Google Scholar] [CrossRef]
  36. Kornyshev, A.A.; Marinescu, M.; Paget, J.; Urbakh, M. Reflection of Light by Metal Nanoparticles at Electrodes. Phys. Chem. Chem. Phys. 2012, 14, 1850. [Google Scholar] [CrossRef]
  37. Bagchi, A.; Barrera, R.G.; Fuchs, R. Local-Field Effect in Optical Reflectance from Adsorbed Overlayers. Phys. Rev. B 1982, 25, 7086–7096. [Google Scholar] [CrossRef]
  38. CIE TC 1-85 International Commission on Illumination (CIE). CIE 015:2018 Colorimetry, 4th ed.; CIE TC 1-85 International Commission on Illumination: Vienna, Austria, 2018. [Google Scholar] [CrossRef]
  39. Fairman, H.S.; Brill, M.H.; Hemmendinger, H. How the CIE 1931 Color-Matching Functions Were Derived from Wright-Guild Data. Color Res. Appl. 1997, 22, 11–23. [Google Scholar] [CrossRef]
  40. Kozłowska, A.; Bogucki, O.; Szysiak, A.; Kaczkan, M.; Fetliński, B.; Janaszek, B.; Kieliszczyk, M.; Trihan, R.; Rossignol, F.; Aimable, A.; et al. Luminophore light sources for lighting and sensing applications. In Proceedings of the XIV Scientific Conference for Electron Technology ELTE 2023, Ryn, Poland, 18 April 2023. [Google Scholar]
  41. Arosa, Y.; De La Fuente, R. Refractive Index Spectroscopy and Material Dispersion in Fused Silica Glass. Opt. Lett. 2020, 45, 4268. [Google Scholar] [CrossRef]
  42. Blaber, M.G.; Arnold, M.D.; Ford, M.J. Search for the Ideal Plasmonic Nanoshell: The Effects of Surface Scattering and Alternatives to Gold and Silver. J. Phys. Chem. C 2009, 113, 3041–3045. [Google Scholar] [CrossRef]
  43. Barchiesi, D.; Grosges, T. Fitting the Optical Constants of Gold, Silver, Chromium, Titanium, and Aluminum in the Visible Bandwidth. J. Nanophoton 2014, 8, 083097. [Google Scholar] [CrossRef]
  44. Wang, B.; Yu, P.; Wang, W.; Zhang, X.; Kuo, H.; Xu, H.; Wang, Z.M. High-Q Plasmonic Resonances: Fundamentals and Applications. Adv. Opt. Mater. 2021, 9, 2001520. [Google Scholar] [CrossRef]
  45. Trihan, R.; Bogucki, O.; Kozlowska, A.; Ihle, M.; Ziesche, S.; Fetliński, B.; Janaszek, B.; Kieliszczyk, M.; Kaczkan, M.; Rossignol, F.; et al. Hybrid Gold-Silica Nanoparticles for Plasmonic Applications: A Comparison Study of Synthesis Methods for Increasing Gold Coverage. Heliyon 2023, 9, e15977. [Google Scholar] [CrossRef]
  46. Barad, H.-N.; Kwon, H.; Alarcón-Correa, M.; Fischer, P. Large Area Patterning of Nanoparticles and Nanostructures: Current Status and Future Prospects. ACS Nano 2021, 15, 5861–5875. [Google Scholar] [CrossRef]
  47. Kadem, L.F.; Lamprecht, C.; Purtov, J.; Selhuber-Unkel, C. Controlled Self-Assembly of Hexagonal Nanoparticle Patterns on Nanotopographies. Langmuir 2015, 31, 9261–9265. [Google Scholar] [CrossRef] [PubMed]
  48. Mark, A.G.; Gibbs, J.G.; Lee, T.-C.; Fischer, P. Hybrid Nanocolloids with Programmed Three-Dimensional Shape and Material Composition. Nat. Mater. 2013, 12, 802–807. [Google Scholar] [CrossRef] [PubMed]
  49. Mohammadi, R.; Ochs, M.; Andrieu-Brunsen, A.; Vogel, N. Effect of Asymmetry on Plasmon Hybridization and Sensing Capacities of Hole-Disk Arrays. J. Phys. Chem. C 2020, 124, 2609–2618. [Google Scholar] [CrossRef]
  50. Sati, A.; Ranade, T.N.; Mali, S.N.; Ahmad Yasin, H.K.; Pratap, A. Silver Nanoparticles (AgNPs): Comprehensive Insights into Bio/Synthesis, Key Influencing Factors, Multifaceted Applications, and Toxicity—A 2024 Update. ACS Omega 2025, 10, 7549–7582. [Google Scholar] [CrossRef]
  51. Gupta, V.; Aftenieva, O.; Probst, P.T.; Sarkar, S.; Steiner, A.M.; Vogel, N.; Fery, A.; König, T.A.F. Advanced Colloidal Sensors Enabled by an Out-of-Plane Lattice Resonance. Adv. Photon. Res. 2022, 3, 2200152. [Google Scholar] [CrossRef]
  52. Chhatre, A.; Solasa, P.; Sakle, S.; Thaokar, R.; Mehra, A. Color and Surface Plasmon Effects in Nanoparticle Systems: Case of Silver Nanoparticles Prepared by Microemulsion Route. Colloids Surf. A Physicochem. Eng. Asp. 2012, 404, 83–92. [Google Scholar] [CrossRef]
  53. Al-Dossari, M.; Awasthi, S.; Mohamed, A.; Abd El-Gawaad, N.; Sabra, W.; Aly, A. Bio-Alcohol Sensor Based on One-Dimensional Photonic Crystals for Detection of Organic Materials in Wastewater. Materials 2022, 15, 4012. [Google Scholar] [CrossRef]
  54. Prosposito, P.; Burratti, L.; Venditti, I. Silver Nanoparticles as Colorimetric Sensors for Water Pollutants. Chemosensors 2020, 8, 26. [Google Scholar] [CrossRef]
  55. Shellaiah, M.; Sun, K.-W. Review on Anti-Aggregation-Enabled Colorimetric Sensing Applications of Gold and Silver Nanoparticles. Chemosensors 2022, 10, 536. [Google Scholar] [CrossRef]
  56. Pilaquinga, F.; Morey, J.; Duel, P.; Yánez-Jácome, G.S.; Chuisaca-Londa, E.; Guzmán, K.; Caiza, J.; Tapia, M.; Debut, A.; Vizuete, K.; et al. Rapid, Low-Cost Determination of Hg2+, Cu2+, and Fe3+ Using a Cellulose Paper-Based Sensor and UV–Vis Method with Silver Nanoparticles Synthesized with S. mammosum. Sens. Bio-Sens. Res. 2024, 45, 100680. [Google Scholar] [CrossRef]
  57. Parrish, C. Index of Refraction of Seawater and Freshwater as a Function of Wavelength and Temperature. Parrish Research Group 2020. Available online: https://research.engr.oregonstate.edu/parrish/index-refraction-seawater-and-freshwater-function-wavelength-and-temperature (accessed on 4 September 2025).

Figure 1. Schematic illustration of the considered nanoparticle-based sensing reflector.
Applsci 15 09975 g001
Figure 2. Conceptual illustration of the proposed sensing device generated with the Ideogram online service (a) and schematic illustration of the considered optical system realizing the targeted function (b).
Applsci 15 09975 g002
Figure 3. Measured spectrum of light emitted by the ceramic doped with 0.2% Ce3+ and 2% Sm3+ ions and chosen LEDs (a). Calculated color of emitted light, including related RBG parameters, at the top (b).
Applsci 15 09975 g003
Figure 4. Calculated reflection spectra for TE- (a) and TM-polarized (b) as well as non-polarized light (c) for the considered NP layer deposited on the Au substrate.
Applsci 15 09975 g004
Figure 5. Calculated spectra observed by the receiver (a) and colorimetric analysis for TM-polarized light in the presence of different levels of contamination for the NP layer deposited on the Au substrate (b).
Applsci 15 09975 g005
Figure 6. Calculated spectra observed by the receiver (a) and colorimetric analysis for unpolarized light in the presence of different levels of contamination for the NP layer deposited on the Au substrate (b).
Applsci 15 09975 g006
Figure 7. Calculated reflection spectra for TE- (a) and TM-polarized (b) as well as non-polarized light (c) for the considered NP layer deposited on the Ag substrate.
Applsci 15 09975 g007
Figure 8. Calculated spectra observed by the receiver (a) and colorimetric analysis (b) for TM-polarized light propagating under different levels of contamination for the NP layer deposited on the Ag substrate.
Applsci 15 09975 g008
Figure 9. Calculated spectra observed by the receiver (a) and colorimetric analysis (b) for unpolarized light propagating under different levels of contamination for the NP layer deposited on the Ag substrate.
Applsci 15 09975 g009
Disclaimer/Publisher’s Note: The statements, opinions and data contained in all publications are solely those of the individual author(s) and contributor(s) and not of MDPI and/or the editor(s). MDPI and/or the editor(s) disclaim responsibility for any injury to people or property resulting from any ideas, methods, instructions or products referred to in the content.