Article

Changes in Frequency Domain Accelerations During Prolonged Running on Different Surfaces

by
Ignacio Catalá-Vilaplana
1,2,*,
Alberto Encarnación-Martínez
1 and
Pedro Pérez-Soriano
1
1
Research Group in Sports Biomechanics (GIBD), Department of Physical Education and Sports, University of Valencia, 46010 Valencia, Spain
2
Department of Physical Therapy, Faculty of Medicine, University of British Columbia, Vancouver, BC V6T 1Z3, Canada
*
Author to whom correspondence should be addressed.
Appl. Sci. 2025, 15(18), 9936; https://doi.org/10.3390/app15189936
Submission received: 16 July 2025 / Revised: 4 September 2025 / Accepted: 9 September 2025 / Published: 11 September 2025
(This article belongs to the Special Issue Human Performance and Health in Sport and Exercise—2nd Edition)

Abstract

Curved non-motorized treadmills (cNMTs) have been demonstrated to reduce impact accelerations in comparison with motorized treadmills (MTs). Most studies have analyzed impacts in the time domain, but analysis in the frequency domain can provide useful information associated with the increase in the running risk of injury. The purpose of this study was to analyze the frequency components (low- and high-frequency bands) of impact accelerations, countermovement jump (CMJ) height, and perceived comfort during a prolonged run on different surfaces: MT, cNMT, and overground (OVG). Twenty-one recreational runners completed three randomized prolonged running tests on cNMT, MT, and OVG for 30 min (80% of the individual maximal aerobic speed). Impact accelerations were registered at minutes 5 and 30 of the test, the countermovement jump test (CMJ) was performed before (PreTest) and after (PostTest) the test, and perceived comfort was determined at the end of each test. A two-way repeated-measures analysis of variance (significance at p < 0.05) showed a reduction on cNMT in both low- and high-frequency bands of impact accelerations, such as head power (p < 0.001, ESd = 3.0) on the cNMT vs. the MT and tibia peak power (p = 0.001, ESd = 2.2) on the cNMT vs. OVG. However, cNMT was perceived as the least comfortable surface by runners. The prolonged running effect decreased impact accelerations during the treadmill running test (MT and cNMT) in the low-frequency band, while CMJ height decreased (p = 0.024, ESd = 1.4) during the PostTest vs. PreTest with the cNMT. Using a cNMT could be an interesting strategy for load reduction in long-distance runners or in return-to-play rehabilitation protocols.

1. Introduction

Curved non-motorized treadmills (cNMTs) have been demonstrated to be a valid and reliable tool for rehabilitation, training, and research studies [1,2,3,4]. This type of treadmills, contrary to motorized treadmills (MTs), allow runners to self-select the speed by driving the belt with every step, resulting in a more natural gait pattern and permitting a better laboratory assessment of running performance under controlled conditions [5,6]. In this sense, using a cNMT, similarly to overground (OVG) running, requires muscular work to generate forward propulsion rather than keeping the pace with a motorized belt [7], leading to different muscle activity patterns with different neuromuscular control mechanisms and RPE [8,9]. Also, the pronounced forward lean of the concave belt observed in the cNMT could lead to kinematic changes, such as forefoot striking instead of heel/midfoot striking [2,4].
Treadmills, compared to asphalt, grass, or track, are easier to instrument, allow for better control of the environment, provide the possibility of maintaining a certain speed and slope, require less space, and allow high test replicability [10]. Previous studies have demonstrated that surface stiffness can influence impact accelerations during running [11], observing an impact reduction on an MT compared to OVG [2,12], on asphalt vs. grass [13], or on a road vs. asphalt and synthetic track [14].
Treadmills have become an important alternative since OVG running has been potentially related to overuse injuries [15,16]. The majority of injuries suffered by runners are due to overuse, since repeated and accumulated exposure to impact accelerations during prolonged running can overload and fatigue the musculoskeletal system, reducing its ability to absorb them and increasing the risk of injury [17,18]. Therefore, an important aspect for trainers and athletes is to decrease the incidence of overuse injuries, and as a result, the analysis of impact accelerations during running has become an important concern for the running research community [19]. Accelerometer-based analysis systems have commonly been used to assess acceleration peaks during activities such as running and walking, demonstrating excellent validity and reliability [20].
Most studies related to impact accelerations have carried out time domain analysis [2,10,12,21,22]. Some of these studies have shown a decrease in time domain impact accelerations while running on a cNMT vs. an MT and OVG [2,9,21]. However, few studies have focused on analysis in the frequency domain. The frequency domain can provide useful information regarding the increase in the running risk of injury since it allows for direct evaluation of the attenuation of impact accelerations [23,24]. Previous studies [25,26] have shown that frequency domain analysis is less sensitive to factors such as sensor placement variability and fatigue-related kinematic changes compared to the time domain approach. Moreover, Potthast et al. [27] demonstrated that knee angle and muscular preactivation alone explain a large proportion of the variance in impact forces, highlighting the complexity of interpreting raw acceleration peaks. The frequency content of the impact shock reflects distinct mechanical events: the low-frequency range (≈4–8 Hz) corresponds to voluntary lower limb motion and COM displacement during stance, whereas the high-frequency range (≈10–20 Hz) corresponds to the rapid deceleration of the foot and leg at ground contact, consistent with the active and passive peaks of the vertical GRF, respectively [25,26]. Time domain analysis does not allow this distinction. Accordingly, a lower peak power at lower frequencies indicates an impact profile with a reduced high-frequency (passive) component.
Fatigue can also affect other parameters related to performance, such as jump height and perceived comfort [28,29]. The countermovement jump test (CMJ) has been proposed as a good indicator of fatigue state due to its close relationship with other mechanical and metabolic variables related to effort [28,30]. Previous studies have reported a decrease in CMJ height and force production after a marathon [31,32,33,34].
Visual Analog Scales have traditionally been used to analyze perceived comfort on different types of footwear and insoles [35,36,37]. Although a previous systematic review and meta-analysis suggested that the degree of familiarization or comfort with MT running can also affect running biomechanics, the studies available in the literature analyze comfort on different surfaces (MT vs. OVG) in terms of familiarization time [38]. However, no previous studies have focused on the direct analysis of perceived comfort while running on different surfaces, which could be related to performance improvements and reduced risk of injury.
Therefore, the purpose of the present study was to compare impact accelerations in the frequency domain, CMJ height, and perceived comfort during a prolonged run on different surfaces (MT, cNMT, and OVG) under conditions of increasing fatigue. It was hypothesized that (a) running on a cNMT would decrease impact accelerations (in low- and high-frequency bands) compared to running on an MT and OVG, but lower comfort on a cNMT would be perceived (H1), and (b) an increase in impact accelerations and a decrease in CMJ height would be observed at the end of the test due to the effect of fatigue (H2).

2. Materials and Methods

2.1. Participants

Twenty-one recreational runners, including 17 males and 4 females (36 ± 9 years, height of 1.76 ± 0.08 m, weight of 69 ± 10 kg, body mass index of 22 ± 2, 4 ± 1 training sessions/week, and running training for 41 ± 15 km/week), participated in the study and gave written informed consent. All participants were required to run a minimum of twice a week in the past year [39] and to be free from lower limb injuries at the time of the investigation or within the 6 months prior to it [40]. Based on a general linear model (GLM) of two-way repeated-measures design, a total sample size of 18 recreational runners was required to detect significant differences associated with a minimum detectable effect size (large) with f = 0.50 (α = 0.05, β = 0.05, power = 0.9521). The study procedures complied with the Declaration of Helsinki and were approved by the Ethics Committee of the University of Valencia (registry number: 1568868).

2.2. Study Protocol

Each participant completed four evaluation sessions, separated by at least 48–72 h and completed at the same time of day (±1). On the first day, participants performed a submaximal running test on a 400 m track to estimate the maximal aerobic speed (MAS) [2,34,41].
During the second, third, and fourth days, participants carried out three running tests on different surfaces: MT (h/p/cosmos pulsar® 3p, h/p/cosmos sports and medical gmbh. Nußdorf, Germany; dimensions: 250 × 105 × 140 cm) with 1% incline to replicate the energy cost of outdoor running [42], cNMT (Bodytone ZRO-T, Bodytone International Sport S.L., Molina del Segura, Spain; dimensions: 175 × 82 × 156 cm), and overground (300 m asphalt circuit) (Figure 1). All sessions were performed as follows: (I) 8 min warm-up, which also served as the familiarization time [43], (II) CMJ height (PreTest), (III) 30 min running test at 80% of the individual MAS, (IV) CMJ height (PostTest), and (V) perceived comfort questionnaire. A completely randomized design protocol throughout R Studio (version 5211.4.1103) was used for surface order selection.
Speed was monitored differently on each surface: (a) speed was controlled on the MT using the treadmill LCD display; (b) a technician provided verbal feedback to the participant in order to maintain the target speed on the cNMT. During overground running, infrared timing gates (Chronojump and Boscosystem©, Barcelona, Spain) were placed 10 m apart to control running speed. A maximum deviation in all running conditions of ±5% from the pre-determined speed was allowed. Participants ran with their own shoes in all testing days to reduce biomechanics variability [21].

2.3. Data Collection

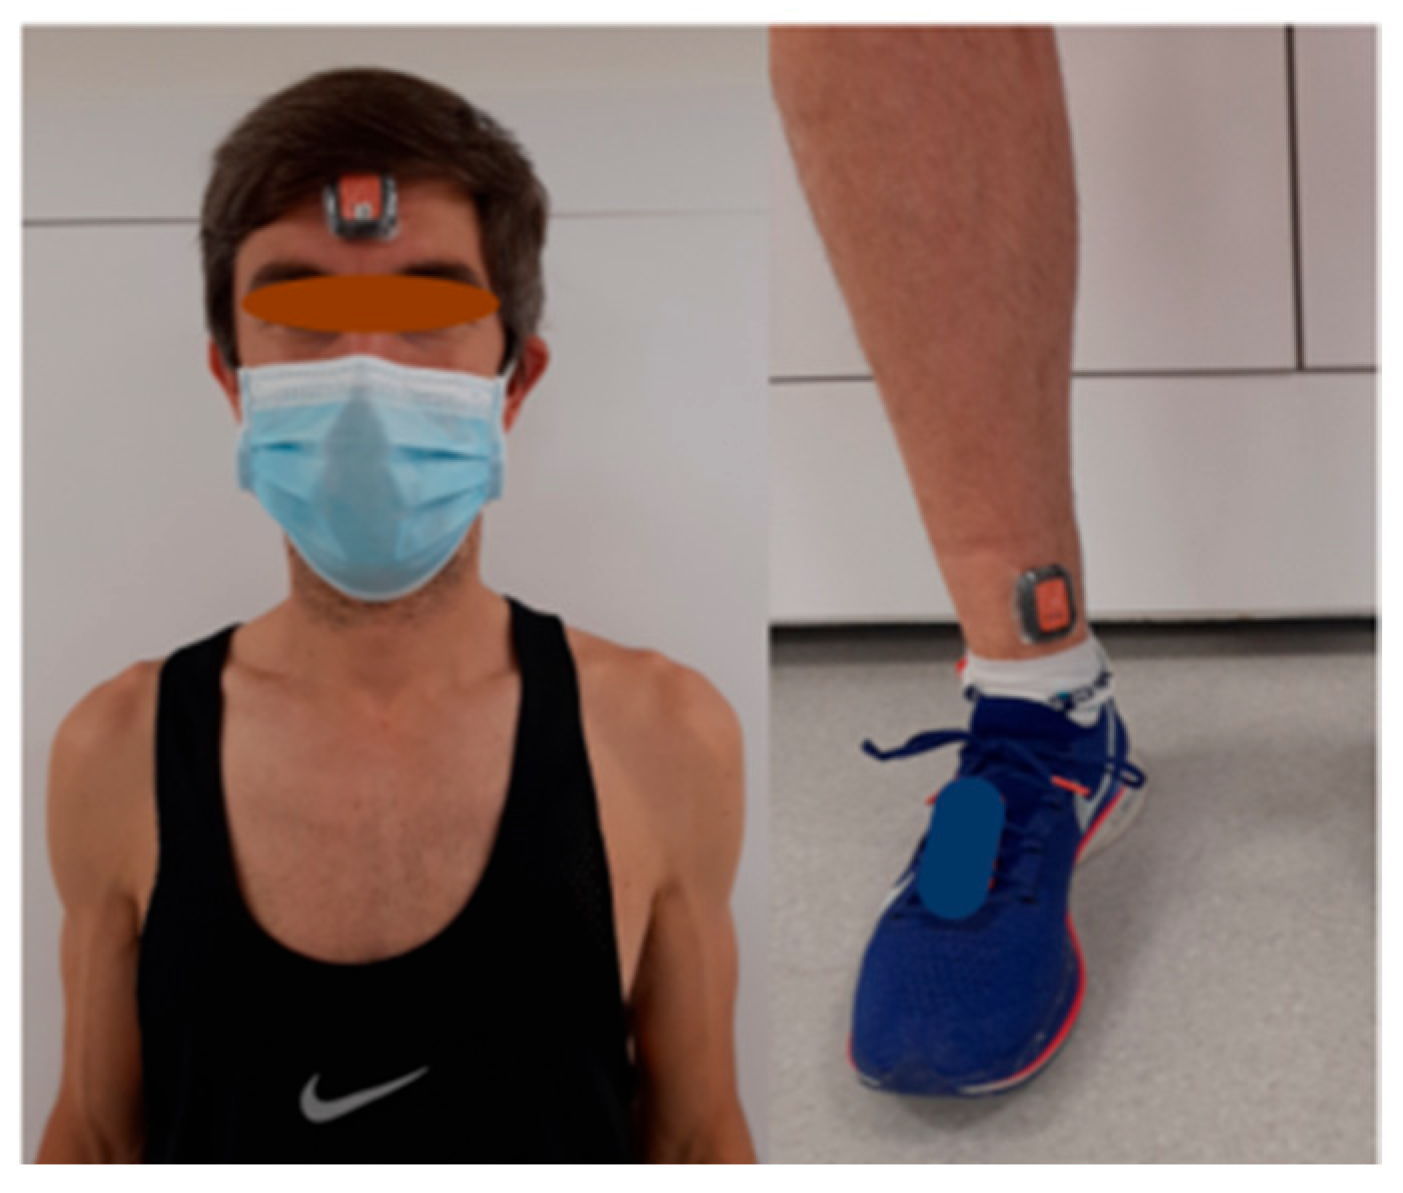
Two lightweight triaxial wireless accelerometers (XSENS DOT and XSENS, Enschede, Netherlands; total mass: 10.9 g; dimensions: 36 _ 30 _ 11 mm; range ± 16 g) were used to measure acceleration parameters [44]. Acceleration was recorded at 120 Hz, which explains the difference with the higher sampling rate reported by Gruber et al. [25]. The accelerometers were placed on the forehead and the anteromedial distal portion of the tibia in the dominant leg [26] (Figure 2). The sensors were firmly attached to the skin with double-sided adhesive tape and secured by elastic neoprene belts, adjusting the pressure to the participants’ comfort limit [45].
Impact accelerations in the frequency domain (low- and high-frequency bands) were recorded for 30 s at minutes 5 and 30 (hereafter referred to as PreTest and PostTest, respectively) of the 30 min run test at 80% of the MAS based on previous investigations that followed the same protocol used in the current study in order to analyze the effect of fatigue [46]. A total of 5880 strides on each surface were analyzed in the study.
Acceleration data was analyzed using Matlab (version R2022a, MathWorks, Natick, MA, USA). The raw signals were not filtered; instead, each stance phase (from ground contact to the instant before the following contact) was identified and extracted. For each stance phase, the mean and linear trends were removed, and the signals were zero-padded to 2048 points. Power spectra were then calculated for both the tibia and head accelerations [26].
As acceleration was collected from one tibia, only the corresponding first head impact was analyzed to avoid including two head impacts for each tibial contact. Analyses were performed separately for the low- (3–8.5 Hz) and high-frequency (8.5–20 Hz) ranges, in line with previous studies [25,26]. The signal power in the tibia (TPlow and TPhigh) and head (HPlow and HPhigh); the peak power in the tibia (TPPlow and TPPhigh) and head (HPPlow and HPPhigh); and the frequency at which peak power took place in the tibia [frequency of TPPlow (TPFlow) and TPPhigh (TPFhigh)] and head [frequency of HPPlow (HPFlow) and HPPhigh (HPFhigh)] during stance phase were determined [25,26]. To assess impact attenuation (ATTlow and ATThigh), a transfer function was calculated from the power spectra of the head and tibia [26]. For each condition (pre–post, 30 s, across the tested surfaces), variables were averaged across all stance phases. The positive values in shock attenuation indicate an increase in the signal power transmitted from the tibia to the head, while the negative values suggest an attenuation of the signal power.
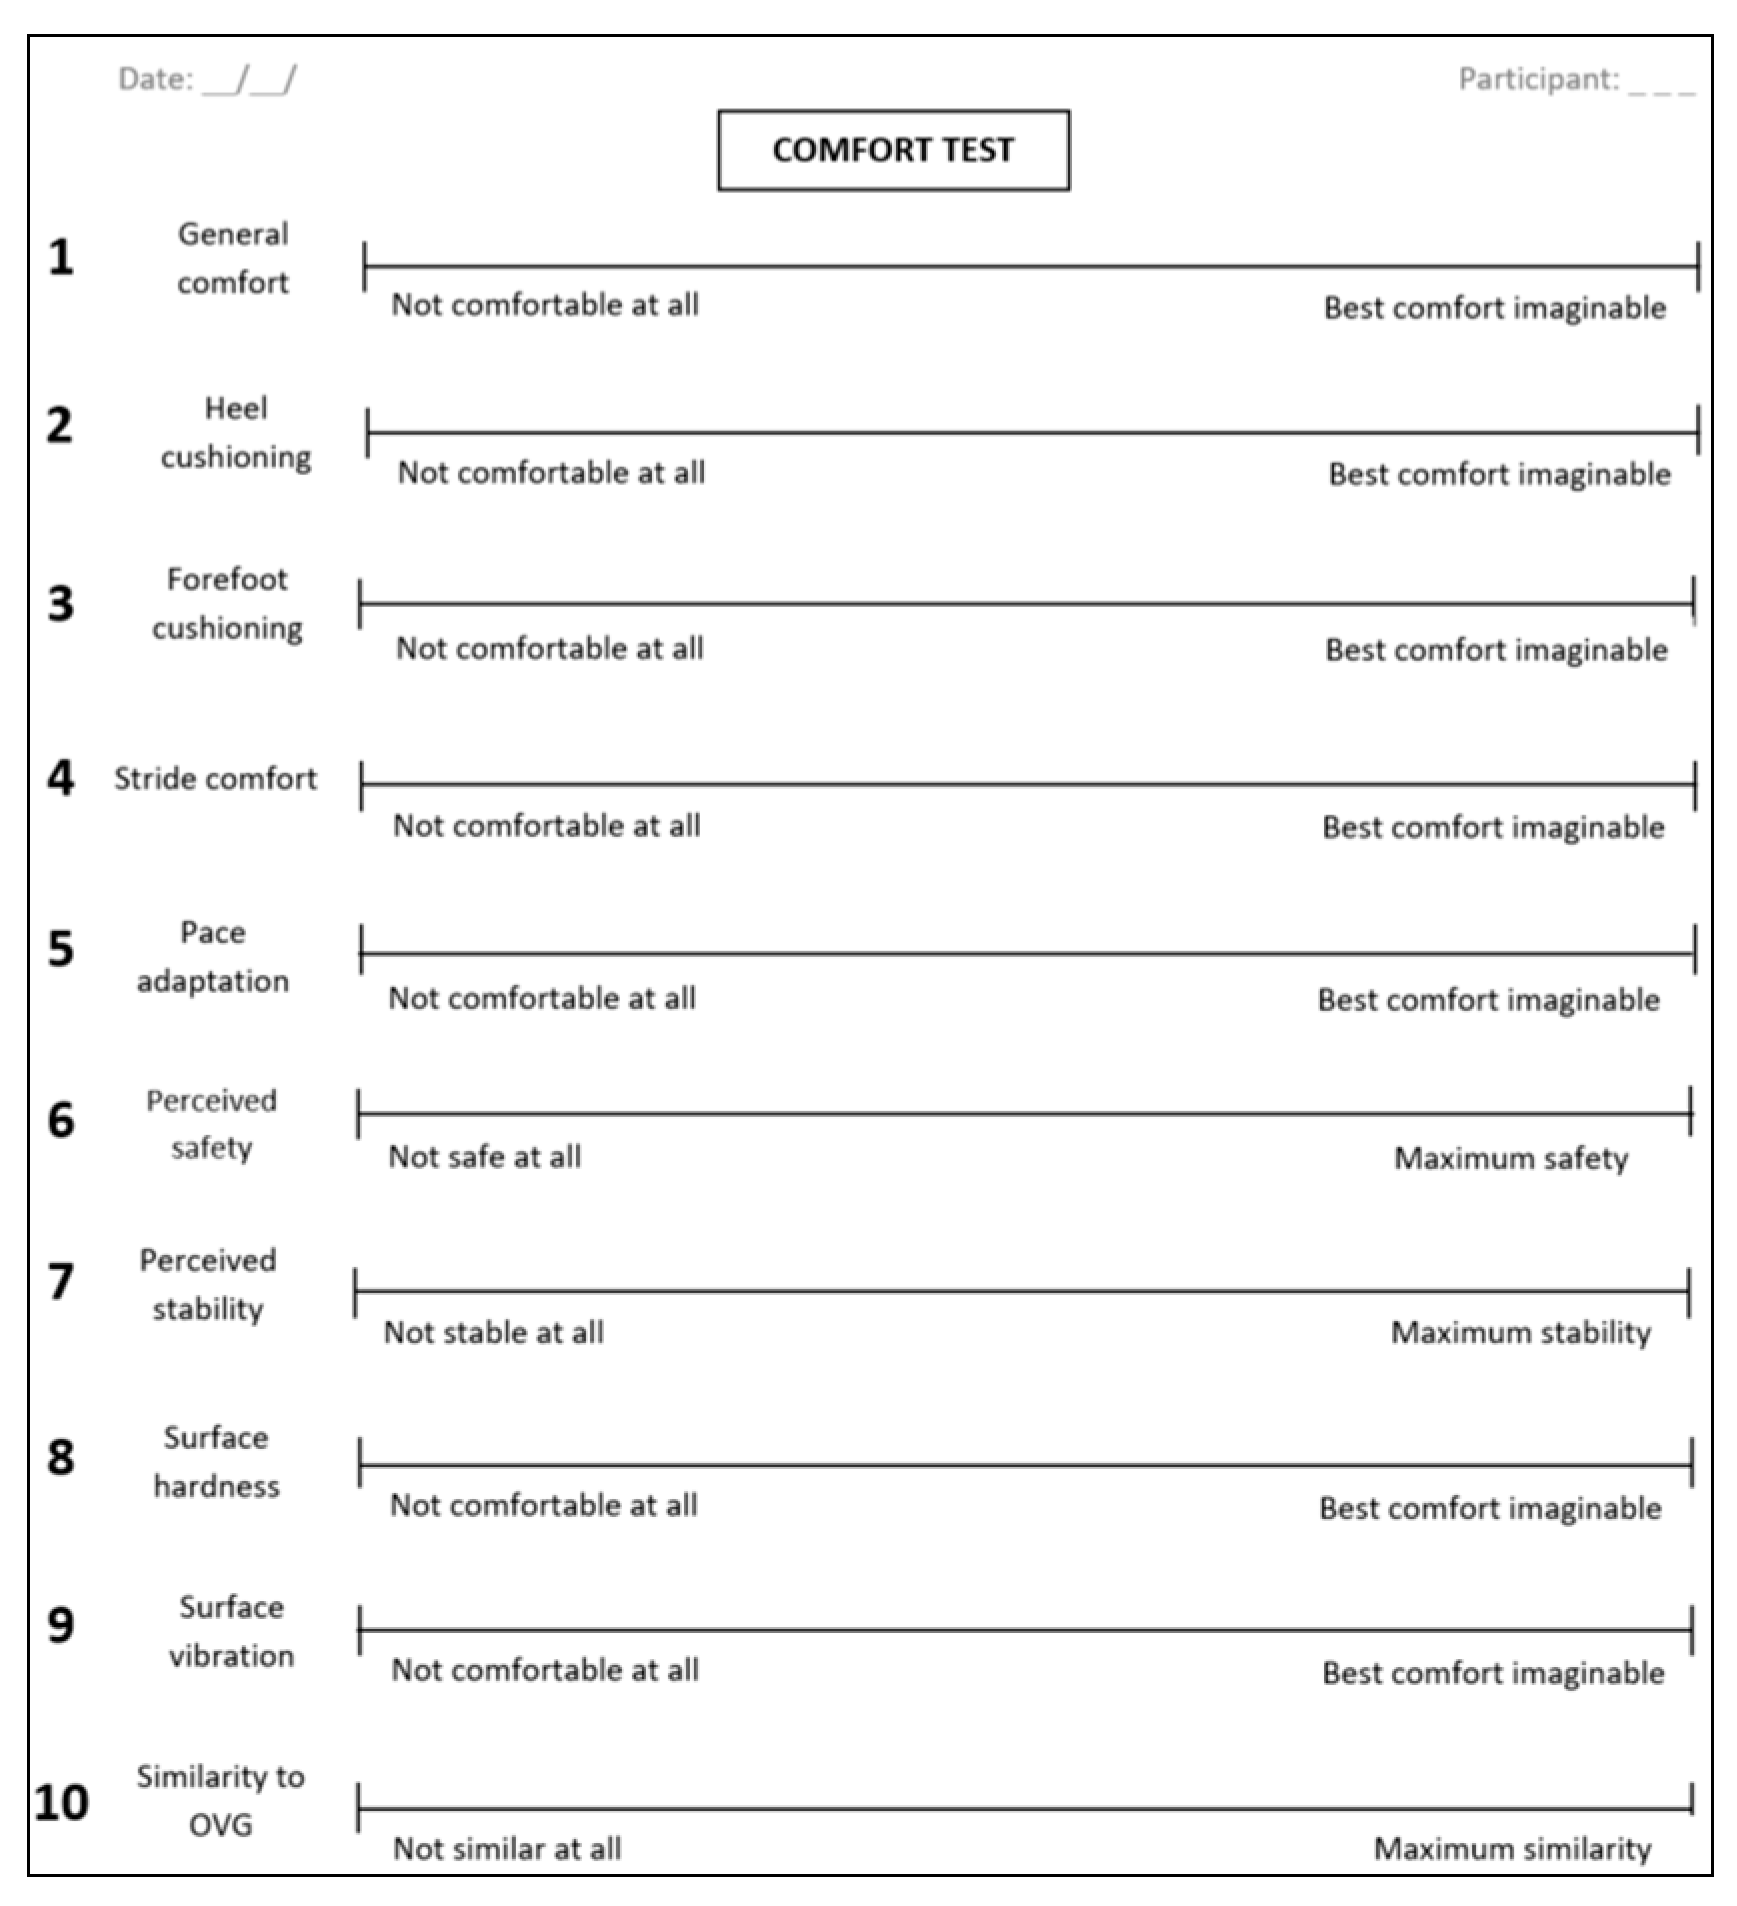
Finally, a contact platform (Chronojump-Boscosystem, Barcelona, Spain) and an adapted Visual Analog Scale [35] (Figure 3) with 11 comfort items (overall comfort, heel cushioning, forefoot cushioning, stride comfort, pace adaptation, perceived safety, perceived stability, surface hardness, surface vibration, and similarity to OVG) were used to register CMJ and comfort perception, respectively. Participants performed three CMJs for practice. Then two CMJ trials before (PreTest) and two CMJ trials after (PostTest) the 30 min run were performed. The average height from the two CMJ tests was registered for data analysis. Participants rested for one minute between jumps and two minutes between the practice and registered jumps in order to avoid the effect of fatigue.

2.4. Statistical Analysis

Statistical analysis was carried out using SPSS.26 statistics software package (SPSS Inc., Chicago, IL, USA). The normality and homoscedasticity of the data were verified using the Shapiro–Wilk test and Levene test, respectively. A general linear model of two-way repeated-measures design was performed for impact accelerations and CMJ. Running surface (MT, cNMT, and OVG) and prolonged running (PreTest vs. PostTest) were considered as within-subject factors. In terms of perceived comfort, a one-way ANOVA was performed, and running surface (MT, cNMT, and OVG) was considered as the only within-subject factor. Post hoc comparisons were performed using the Bonferroni test to identify the locations of specific differences. Statistical significance was set at p < 0.05. For significant pair differences, the effect size (ES) was assessed using Cohen’s d (0.2, small; 0.5, moderate; 0.8, large) [47].

3. Results

3.1. Running Surface Effect

Impact accelerations in the frequency domain (low- and high-frequency bands) were significantly lower (p < 0.001) when running on the cNMT compared to the MT and OVG, while the highest impacts were experienced during OVG running.
Specifically, in the low-frequency band, significantly lower impact accelerations were found on the cNMT vs. the MT in head and tibia power (p < 0.001, ESd = 3.0; p < 0.001, ESd = 4.8, respectively), head and tibia peak power (p < 0.001, ESd = 2.5; p < 0.001, ESd = 4.2, respectively), and head and tibia peak power frequency (p = 0.008, ESd = 1.7; p < 0.001, ESd = 1.9, respectively). Running on the cNMT also caused lower impacts compared to OVG running in head and tibia power (p < 0.001, ESd = 2.6; p < 0.001, ESd = 8.4, respectively), head and tibia peak power (p < 0.001, ESd = 2.2; p < 0.001, ESd = 8.0, respectively), and attenuation (p < 0.001, ESd = 3.4). On the other hand, lower impacts were observed in tibia power (p < 0.001, ESd = 3.2), tibia peak power (p = 0.002, ESd = 3.0), tibia peak power frequency (p = 0.031, ESd = 1.1), and attenuation (p < 0.001, ESd = 2.3) when running on the MT vs. OVG (Table 1). However, no differences (p > 0.05) were found between the MT and OVG in head power and head peak power.
Regarding the high-frequency band, running on the cNMT produced lower impacts compared to the MT in head and tibia power (p < 0.001, ESd = 4.9; p < 0.001, ESd = 7.01, respectively), head and tibia peak power (p < 0.001, ESd = 3.9; p < 0.001, ESd = 7.2, respectively), and attenuation (p < 0.001, ESd = 3.4). Similarly, lower impacts were observed on the cNMT vs. OVG in head and tibia power (p = 0.002, ESd = 4.3; p < 0.001, ESd = 8.1, respectively), head and tibia peak power (p = 0.005, ESd = 4.1; p < 0.001, ESd = 8.5, respectively), and attenuation (p < 0.001, ESd = 5.6). Impact accelerations were also lower during MT running in comparison with OVG in tibia power (p = 0.040, ESd = 2.0), tibia peak power (p = 0.004, ESd = 2.2), and attenuation (p = 0.016, ESd = 2.3) (Table 2). However, no differences (p > 0.05) were found in head and tibia peak power frequency between any of the running surfaces analyzed.
In terms of perceived comfort, significant differences were found between cNMT vs. OVG, with greater overall comfort (p = 0.006, ESd = 0.9), stride comfort (p = 0.002, ESd = 1.1), pace adaptation (p < 0.001, ESd = 2.1), perceived safety (p < 0.001, ESd = 1.2), and surface stability (p < 0.001, ESd = 1.9) observed during OVG running. In addition, higher values were also observed in stride comfort (p = 0.016, ESd = 0.9), pace adaptation (p < 0.001, ESd = 1.6), perceived safety (p < 0.001, ESd = 1.3), perceived stability (p < 0.001, ESd = 1.6), and surface hardness (p = 0.045, ESd = 0.9) while running on MT compared to cNMT (Table 3). However, no significant differences (p > 0.05) were observed in heel cushioning, forefoot cushioning, or surface vibration between the different running surfaces analyzed.

3.2. Prolonged Running Effect

In terms of the prolonged running effect, impacts were lower at the end of the test (PostTest) compared to the start (PreTest) in the low-frequency band. Specifically, differences in head power (p = 0.022, ESd = 1.02), head peak power (p = 0.003, ESd = 1.2), and tibia peak power frequency (p = 0.007, ESd = 0.8) in the low-frequency band between PreTest and PostTest were observed during treadmill running (MT and cNMT) (Table 1). However, no significant differences (p > 0.05) were found in impact acceleration variables in the high-frequency band between different moments of the test (Table 2).
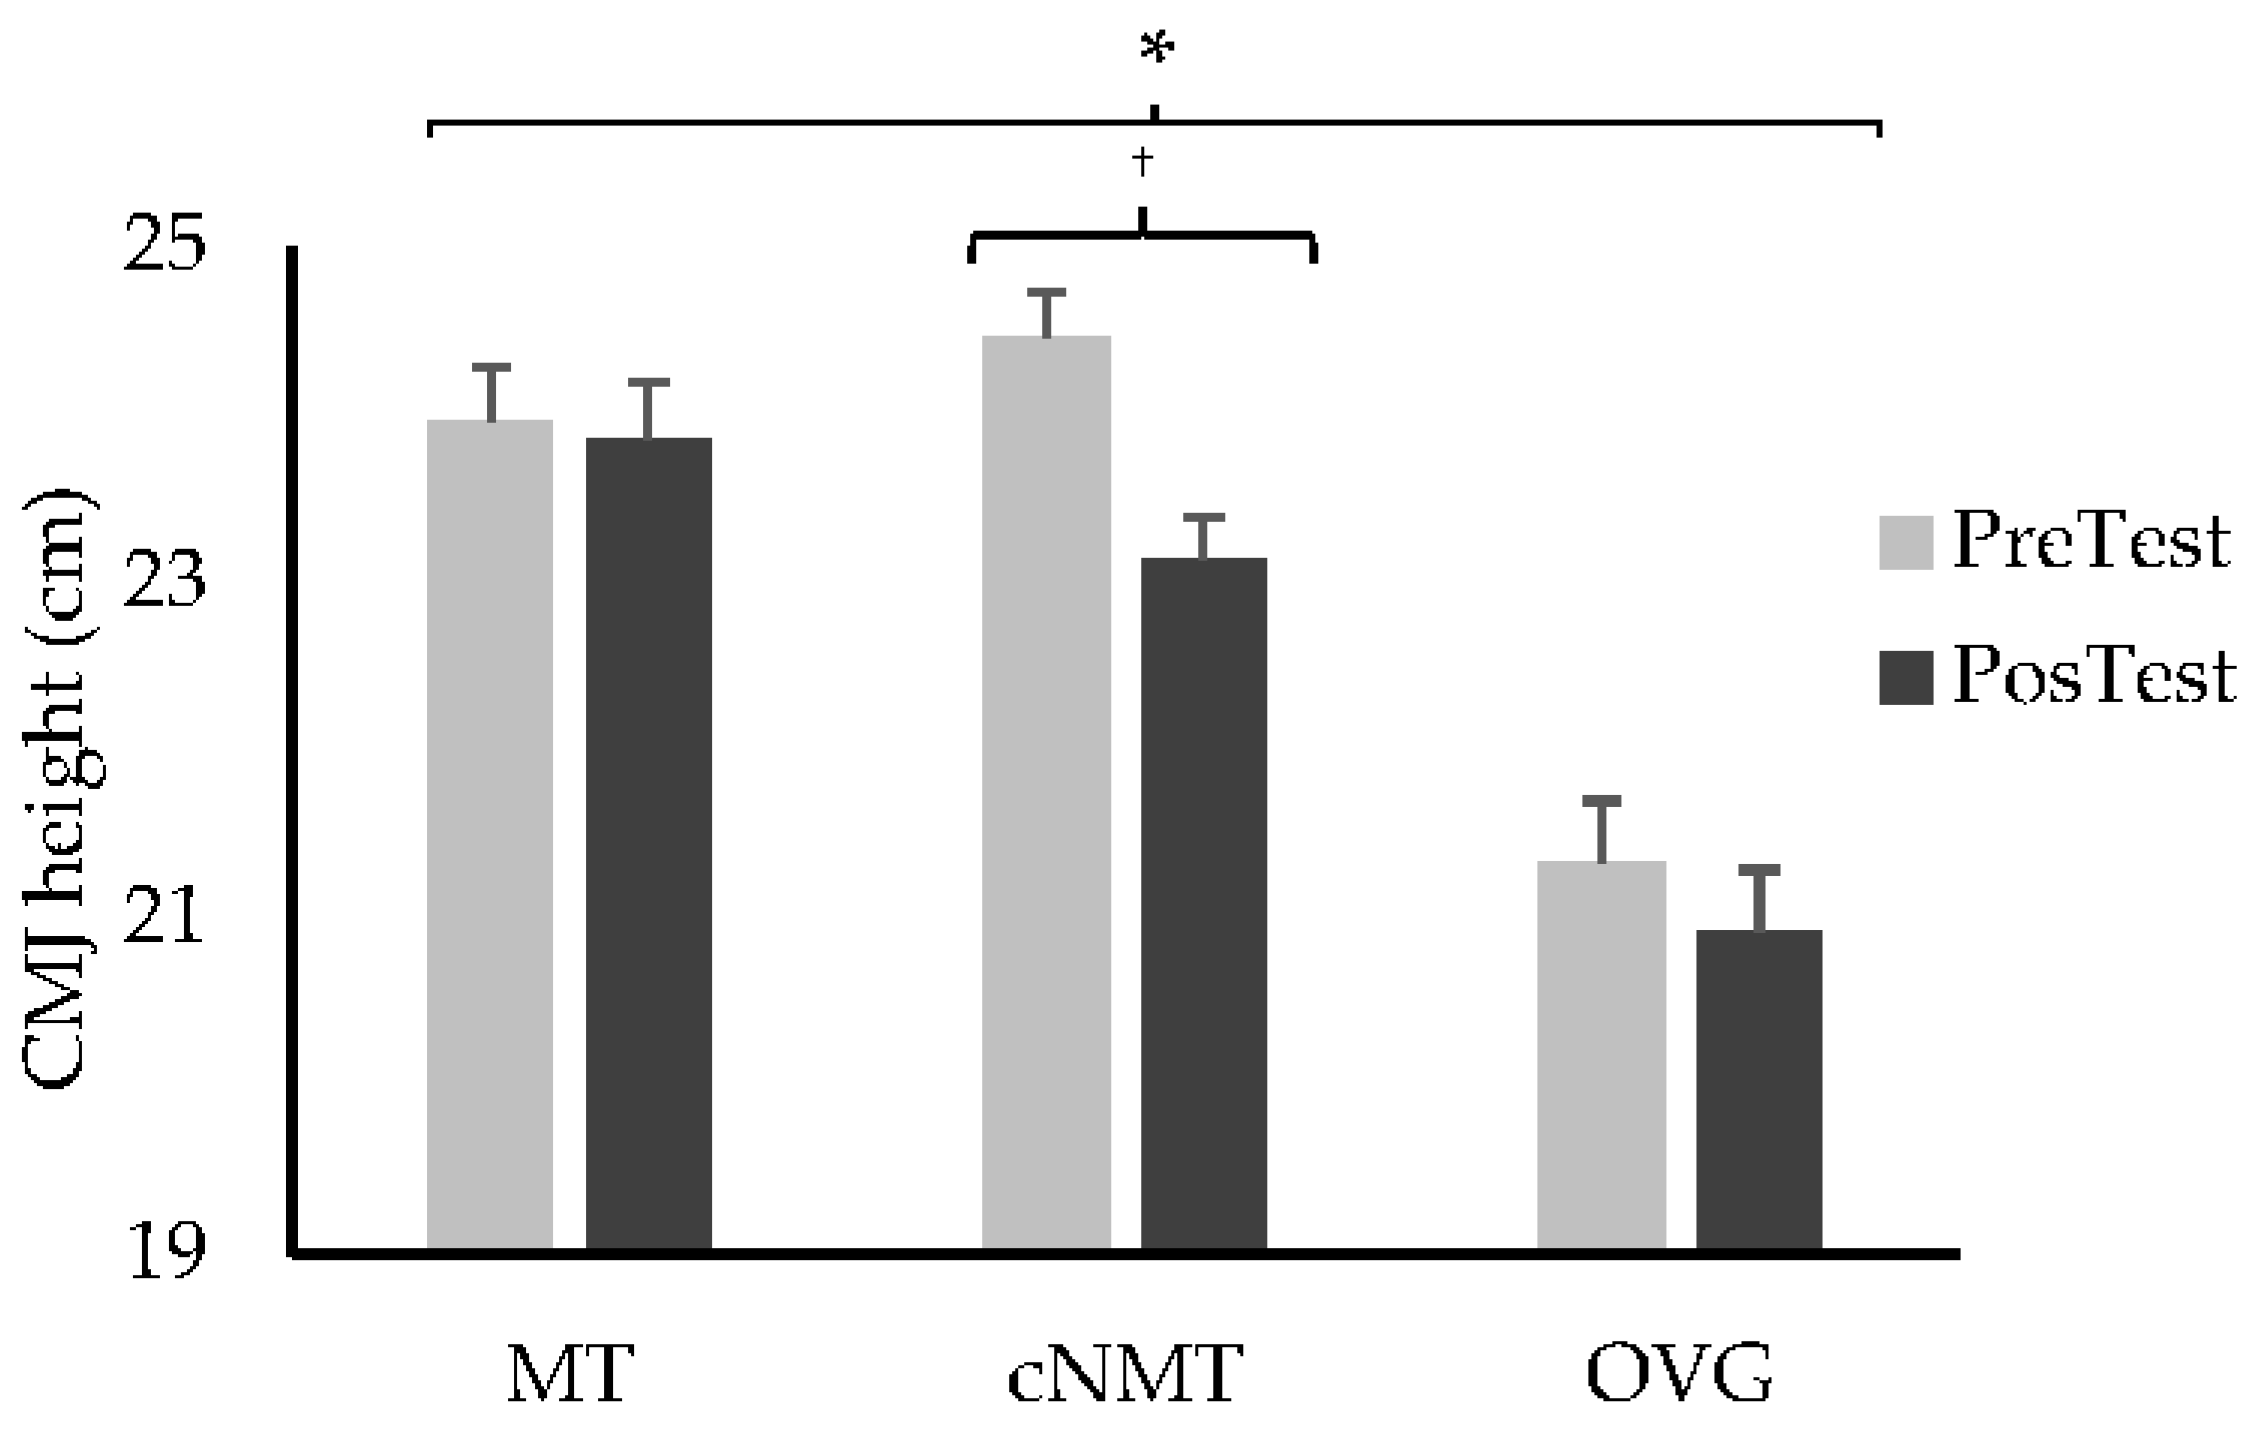
In relation to the CMJ test, the results showed a higher jump height for the MT compared to OVG during the PostTest (p = 0.025, ESd = 1.5), and the CMJ height for the cNMT significantly decreased during the PostTest compared to the PreTest (p = 0.024, ESd = 1.4) (Figure 4). However, no differences (p > 0.05) were found between PreTest and PostTest in the MT and OVG.

4. Discussion

The main objective of the present study was to analyze the influence of running surface on impact accelerations, CMJ height, and perceived comfort during a prolonged running period. To date, no studies have analyzed the frequency components of head and tibia accelerations during a prolonged running protocol on cNMT in comparison with MT and OVG. Based on the findings, we partially accept H1, since running on the cNMT reduced impact accelerations (in low- and high-frequency bands) compared to the MT and OVG. However, the cNMT was not considered the most comfortable surface by runners. H2 is partially rejected because a decrease in head power, head peak power, and tibia peak power frequency in the low-frequency band during the final (PostTest) vs. early stage (PreTest) was observed for treadmill running (MT and cNMT), while CMJ height just decreased with the cNMT during the PostTest vs. PreTest.
Impact accelerations in the low-frequency band (3–8 Hz) were significantly lower during cNMT running in head (vs. MT: 19.5%, vs. OVG: 19.5%) and tibia power (vs. MT: 37.4%, vs. 50.0%) and in head (vs. MT: 15.8%, vs. OVG: 15.8%) and tibia peak power (vs. MT: 40.0%, vs. OVG: 52.0%). A decrease in tibia power (20.1%), tibia peak power (20.0%), and attenuation (54.2%) was also observed for MT vs. OVG. Impacts in the high-frequency band (9–20 Hz) were also lower for the cNMT. Specifically, a decrease in head (30.8%, 33.4%) and tibia power (56.6%, 35.1%), tibia peak power (50.0%, 52.6%), and attenuation (23.4%, 32.1%) was found in comparison with the MT and OVG, respectively. Running on the MT also decreased tibia power (19.2%), tibia peak power (13.6%), and attenuation (11.4%) compared to OVG. Higher values at maximum signal during OVG running represent, in the low-frequency band, an increase in movement, whereas in the high-frequency band, they represent an increase in the severity of the impact [25].
Although the foot strike pattern was not controlled in this study, previous studies have associated the time domain impact acceleration reduction observed on the cNMT with the pronounced forward lean of the concave belt, which could favor forefoot striking instead of heel/midfoot striking [9]. In fact, a study by Stevens et al. [4] classified the same participants as “rear-foot strikers” (9/10) during overground running and as “mid-foot strikers” (8/10) while running on a curved non-motorized treadmill. This change came with variations in neuromuscular activity, finding a reduced activity in tibialis anterior, vastus lateralis, and rectus femoris and an increase in gluteus maximus and biceps femoris activation while running on a curved non-motorized treadmill [4].
The decrease in impact accelerations (low- and high-frequency bands) with MT running compared to OVG might be related to the decrease in stride length and increase in stride frequency observed on this surface [2,15,48,49,50]. This reduction could also be due to the leg stiffness adjustment, leading to different muscle activity patterns with different neuromuscular control mechanisms and RPE [8,9], or even due to the altered environment of treadmill running, which forces athletes to adjust locomotion in order to reduce the risk of injury or maintain performance [23].
Nevertheless, there is a lack of evidence regarding the effect of running surface on the frequency components of impact accelerations. In terms of running pattern, Gruber et al. [25] observed greater tibia peak power, both in low- and high-frequency ranges, when contact was made with the rearfoot. These authors also found significantly higher attenuation in rearfoot runners, which is in line with the greater attenuation observed in OVG running in this study (MT: 2.09 dB, cNMT: 0.34 dB, and OVG: 4.56 dB in low frequencies; MT: 18.45 dB, cNMT: 14.14 dB, and OVG: 20.83 dB in high frequencies). Similarly, no differences in head power, head peak power, or head peak power frequency between MT and OVG in the low- and high-frequency bands were found [25]. It is possible that the lack of differences in head accelerations is related to a protective mechanism in order to keep head vibrations and accelerations constant and thus avoid the disruption of the visual and vestibular systems [25,50].
According to previous studies, the ability of certain tissues to transmit and attenuate impact accelerations is determined by the frequency components of the impact [25,51]. In this sense, when the attenuation capacity is impaired due to prolonged running, these tissues become more vulnerable to excessive loading, which could result in overload of the tissue itself [52]. However, it is possible that the greater attenuation experienced in OVG and rearfoot runners is due to the greater tibia acceleration observed in these conditions [25], or it may even be related to an increase in knee flexion during heel strike, which generates greater displacement of the lower extremities [53].
In spite of being in the condition with higher impact accelerations, OVG was perceived as the most comfortable surface by runners. Specifically, significant differences in some important aspects, such as general comfort (16.2%), stride comfort (17.8%), pace adaptation (34.3%), perceived safety (24%), stability (27.5%), and hardness (10.7%) of the surface, were observed in comparison with the cNMT, which was considered the least comfortable surface. The MT was also more comfortable in terms of stride comfort (14.1%), pace adaptation (28%), perceived safety (21.3%), stability (22.6%), and hardness (14%) of the surface compared to the cNMT. However, no significant differences were observed between the three surfaces in cushioning (both at the heel and forefoot levels) or surface vibration. In line with these results, Taunton et al. [54] confirmed that the majority of runners preferred OVG running rather than MT running, and this could be related to the sensation of greater speed control and the ability to stop running, reducing the risk of falling [55]. This would explain the greater pace adaptation perceived by runners in this study during OVG running compared to MT and cNMT running. The lack of perceived safety and stability on an MT, and especially on a cNMT, could be due to an increase in the perceived effort and heart rate related to the risk of falling [56].
In terms of fatigue, Encarnación-Martínez et al. [34] analyzed the frequency components of impact accelerations during a fatiguing run, finding an increase in the maximum and total high-frequency power magnitude in the tibia acceleration signal after the fatiguing protocol on the treadmill. On the contrary, prolonged running in this study reduced tibia peak power frequency (3.4% and 3.2%), head power (7.5% and 6.3%), and head peak power (10.0% and 11.2%) in the low-frequency band during the PostTest vs. PreTest while running on the treadmills (MT and cNMT, respectively), and no significant changes (p > 0.05) were found in the high-frequency band between the PreTest and PostTest. Therefore, the running surface can affect runners differently and force them to adopt different strategies during a fatigue state [23]. Also, prolonged running can lead to changes in landing phase mechanics due to modifications in muscle pre-activation levels [57].
According to the literature, the ability to generate force during a CMJ is reduced by 16% after running a marathon [31]. This is associated with an increase in the myoglobin concentration in urine, suggesting that muscle fatigue after a marathon is related to muscle fiber damage [31]. Similarly, Petersen et al. [32] reported a 22% loss in maximum force production in knee extensors and a 13% height loss during a CMJ after the marathon. In the present study, the CMJ height was significantly lower (5.7%) during the PostTest vs. PreTest on the cNMT due to the effect of prolonged running. The decrease in CMJ height is also related to the rating of perceived effort, since those long- and middle-distance athletes who reported greater effort also experienced a greater reduction in CMJ height after the competition [33].
The results observed in the present study suggest that impact accelerations were influenced by running surface and fatigue. Even though a cNMT is not perceived as the most comfortable surface by runners, there was a significant reduction in impact accelerations compared to the MT and OVG. These findings allow for practical implications, showing that a cNMT should be considered by athletes and coaches while designing training sessions since it could be an interesting strategy for load reduction in long distance runners, in return-to-play rehabilitation protocols, or training environments where athletes would benefit from a reduction in impact accelerations.
The main limitation of the present investigation is related to the adaptation time on a cNMT, since participants had no previous running experience on this type of treadmill. Although this bias was minimized by using a protocol where runners had an 8 min warm-up for familiarization with this new condition, as recommended in previous studies [58], the adaptation period for the cNMT might not have been enough for some individuals. Also, no information related to the asymmetry between both legs during the running cycle was analyzed since impact accelerations were only recorded in the dominant leg. Future studies should consider foot strike pattern, running kinematic analysis and asymmetries between both legs in order to identify any locomotion alterations that may be present on this type of surface.

5. Conclusions

In conclusion, running on a cNMT reduced impact accelerations in the frequency domain (both in low- and high-frequency bands) in comparison with the MT and OVG, while the MT also produced a decrease on these parameters compared to OVG running. Moreover, the cNMT was perceived by runners as the least comfortable surface, while OVG running was the most comfortable surface. The prolonged running effect showed a decrease in head power, head peak power, and tibia peak power frequency in the low-frequency band with treadmill running (MT and cNMT) and a reduced CMJ height during the PostTest on the cNMT. These findings should be considered by coaches and athletes while planning training sessions with the aim of load reduction in long-distance runners or in return-to-play rehabilitation protocols.

Author Contributions

Conceptualization, I.C.-V., A.E.-M., and P.P.-S.; methodology, I.C.-V., A.E.-M., and P.P.-S.; software, I.C.-V. and A.E.-M.; formal analysis, I.C.-V. and P.P.-S.; investigation, I.C.-V., A.E.-M., and P.P.-S.; resources, A.E.-M. and P.P.-S.; data curation, I.C.-V., A.E.-M., and P.P.-S.; writing—original draft preparation, I.C.-V.; writing—review and editing, A.E.-M. and P.P.-S.; visualization, I.C.-V., A.E.-M., and P.P.-S.; supervision, A.E.-M.; project administration, A.E.-M. and P.P.-S.; funding acquisition, A.E.-M. All authors have read and agreed to the published version of the manuscript.

Funding

This work was supported by the “Ministerio de Universidades (Gobierno de España)”.

Institutional Review Board Statement

This study was conducted in accordance with the Declaration of Helsinki and approved by the Ethics Committee of the University of Valencia on 5 March 2021 (registry number: 1568868).

Informed Consent Statement

Informed consent was obtained from all subjects involved in the study.

Data Availability Statement

The raw data supporting the conclusions of this article will be made available by the authors on request.

Acknowledgments

The contribution of I.C.-V. was funded with a doctoral fellowship by “Ministerio de Ciencia, Innovación y Universidades de España” (FPU19/04462).

Conflicts of Interest

The authors declare no conflicts of interest.

References

  1. Bruseghini, P.; Tam, E.; Monte, A.; Capelli, C.; Zamparo, P. Metabolic and kinematic responses while walking and running on a motorised and a curved non-motorised treadmill. J. Sports Sci. 2019, 37, 396–403. [Google Scholar] [CrossRef] [PubMed]
  2. Catalá-Vilaplana, I.; Encarnación-Martínez, A.; Camacho-García, A.; Sanchis-Sanchis, R.; Pérez-Soriano, P. Influence of surface condition and prolonged running on impact accelerations. Sports Biomech. 2023, 24, 1064–1078. [Google Scholar] [CrossRef]
  3. Edwards, R.B.; Tofari, P.J.; Cormack, S.J.; Whyte, D.G. Non-motorized Treadmill Running Is Associated with Higher Cardiometabolic Demands Compared with Overground and Motorized Treadmill Running. Front. Physiol. 2017, 8, 914. [Google Scholar] [CrossRef]
  4. Stevens, C.J.; Hacene, J.; Wellham, B.; Sculley, D.V.; Callister, R.; Taylor, L.; Dascombe, B.J. The validity of endurance running performance on the Curve 3(TM) non-motorised treadmill. J. Sports Sci. 2015, 33, 1141–1148. [Google Scholar] [CrossRef]
  5. Schoenmakers, P.P.; Crisell, J.J.; Reed, K.E. Physiological and Perceptual Demands of Running on a Curved Nonmotorized Treadmill Compared with Running on a Motorized Treadmill Set at Different Grades. J. Strength Cond. Res. 2020, 34, 1197–1200. [Google Scholar] [CrossRef]
  6. Stevens, C.J.; Hacene, J.; Sculley, D.V.; Taylor, L.; Callister, R.; Dascombe, B. The reliability of running performance in a 5 km time trial on a non-motorized treadmill. Int. J. Sports Med. 2015, 36, 705–709. [Google Scholar] [CrossRef] [PubMed]
  7. Frishberg, B.A. An analysis of overground and treadmill sprinting. Med. Sci. Sports Exerc. 1983, 15, 478–485. [Google Scholar] [CrossRef] [PubMed]
  8. Baur, H.; Hirschmüller, A.; Mueller, S.; Gollhofer, A.; Mayer, F. Muscular activity in treadmill and overground running. Isokinet. Exerc. Sci. 2007, 15, 165–171. [Google Scholar] [CrossRef]
  9. Montgomery, G.; Abt, G.; Dobson, C.; Smith, T.; Ditroilo, M. Tibial impacts and muscle activation during walking, jogging and running when performed overground, and on motorised and non-motorised treadmills. Gait Posture 2016, 49, 120–126. [Google Scholar] [CrossRef]
  10. García-Pérez, J.A.; Pérez-Soriano, P.; Llana Belloch, S.; Lucas-Cuevas, A.G.; Sánchez-Zuriaga, D. Effects of treadmill running and fatigue on impact acceleration in distance running. Sports Biomech. 2014, 13, 259–266. [Google Scholar] [CrossRef]
  11. Dixon, S.J.; Collop, A.C.; Batt, M.E. Surface effects on ground reaction forces and lower extremity kinematics in running. Med. Sci. Sports Exerc. 2000, 32, 1919–1926. [Google Scholar] [CrossRef]
  12. Aubol, K.G.; Hawkins, J.L.; Milner, C.E. Tibial Acceleration Reliability and Minimal Detectable Difference During Overground and Treadmill Running. J. Appl. Biomech. 2020, 36, 457–459. [Google Scholar] [CrossRef] [PubMed]
  13. Waite, N.; Goetschius, J.; Lauver, J.D. Effect of Grade and Surface Type on Peak Tibial Acceleration in Trained Distance Runners. J. Appl. Biomech. 2020, 37, 2–5. [Google Scholar] [CrossRef]
  14. Boey, H.; Aeles, J.; Schütte, K.; Vanwanseele, B. The effect of three surface conditions, speed and running experience on vertical acceleration of the tibia during running. Sports Biomech. 2017, 16, 166–176. [Google Scholar] [CrossRef]
  15. Hamill, J.; Derrick, T.R.; Holt, K.G. Shock attenuation and stride frequency during running. Hum. Mov. Sci. 1995, 14, 45–60. [Google Scholar] [CrossRef]
  16. van der Worp, M.P.; ten Haaf, D.S.M.; van Cingel, R.; de Wijer, A.; Nijhuis-van der Sanden, M.W.G.; Staal, J.B. Injuries in runners; a systematic review on risk factors and sex differences. PLoS ONE 2015, 10, e0114937. [Google Scholar] [CrossRef] [PubMed]
  17. Abt, J.P.; Sell, T.C.; Chu, Y.; Lovalekar, M.; Burdett, R.G.; Lephart, S.M. Running Kinematics and Shock Absorption Do Not Change After Brief Exhaustive Running. J. Strength Cond. Res. 2011, 25, 1479. [Google Scholar] [CrossRef] [PubMed]
  18. Clansey, A.C.; Hanlon, M.; Wallace, E.S.; Nevill, A.; Lake, M.J. Influence of tibial shock feedback training on impact loading and running economy. Med. Sci. Sports Exerc. 2014, 46, 973–981. [Google Scholar] [CrossRef]
  19. Darch, L.; Chalmers, S.; Wiltshire, J.; Causby, R.; Arnold, J. Running-induced fatigue and impact loading in runners: A systematic review and meta-analysis. J. Sports Sci. 2022, 40, 1512–1531. [Google Scholar] [CrossRef]
  20. Van den Berghe, P.; Six, J.; Gerlo, J.; Leman, M.; De Clercq, D. Validity and reliability of peak tibial accelerations as real-time measure of impact loading during over-ground rearfoot running at different speeds. J. Biomech. 2019, 86, 238–242. [Google Scholar] [CrossRef]
  21. Encarnación-Martínez, A.; Catalá-Vilaplana, I.; Berenguer-Vidal, R.; Sanchis-Sanchis, R.; Ochoa-Puig, B.; Pérez-Soriano, P. Treadmill and Running Speed Effects on Acceleration Impacts: Curved Non-Motorized Treadmill vs. Conventional Motorized Treadmill. Int. J. Environ. Res. Public Health 2021, 18, 5475. [Google Scholar] [CrossRef] [PubMed]
  22. Sheerin, K.R.; Besier, T.F.; Reid, D. The influence of running velocity on resultant tibial acceleration in runners. Sports Biomech. 2020, 19, 750–760. [Google Scholar] [CrossRef]
  23. Derrick, T.; Dereu, D.; Mclean, S. Impacts and kinematic adjustments during an exhaustive run. Med. Sci. Sports Exerc. 2002, 34, 998–1002. [Google Scholar] [CrossRef] [PubMed]
  24. Encarnación-Martínez, A.; Sanchis-Sanchis, R.; Pérez-Soriano, P.; García-Gallart, A. Relationship between muscular extensibility, strength and stability and the transmission of impacts during fatigued running. Sports Biomech. 2020, 22, 1364–1380. [Google Scholar] [CrossRef]
  25. Gruber, A.H.; Boyer, K.A.; Derrick, T.R.; Hamill, J. Impact shock frequency components and attenuation in rearfoot and forefoot running. J. Sport Health Sci. 2014, 3, 113–121. [Google Scholar] [CrossRef]
  26. Shorten, M.R.; Winslow, D.S. Spectral Analysis of Impact Shock during Running. J. Appl. Biomech. 1992, 8, 288–304. [Google Scholar] [CrossRef]
  27. Potthast, W.; Brüggemann, G.-P.; Lundberg, A.; Arndt, A. The influences of impact interface, muscle activity, and knee angle on impact forces and tibial and femoral accelerations occurring after external impacts. J. Appl. Biomech. 2010, 26, 1–9. [Google Scholar] [CrossRef]
  28. Claudino, J.G.; Cronin, J.; Mezêncio, B.; McMaster, D.T.; McGuigan, M.; Tricoli, V.; Amadio, A.C.; Serrão, J.C. The countermovement jump to monitor neuromuscular status: A meta-analysis. J. Sci. Med. Sport 2017, 20, 397–402. [Google Scholar] [CrossRef]
  29. Hoerzer, S.; Trudeau, M.B.; Edwards, W.B.; Nigg, B.M. Intra-rater reliability of footwear-related comfort assessments. Footwear Sci. 2016, 8, 155–163. [Google Scholar] [CrossRef]
  30. Jiménez-Reyes, P.; Cuadrado-Peñafiel, V.; González-Badillo, J.J. Aplicación del CMJ para el control del entrenamiento en las sesiones de velocidad. (Application of the Counter Movement Jump Test to Monitor Training Load in Sprint Sessions). Cult. Cienc. Deporte 2011, 6, 105–112. [Google Scholar] [CrossRef]
  31. Del Coso, J.; Areces, F.; Salinero, J.J.; González-Millán, C.; Abián-Vicén, J.; Soriano, L.; Ruiz, D.; Gallo, C.; Lara, B.; Calleja-Gonzalez, J. Compression stockings do not improve muscular performance during a half-ironman triathlon race. Eur. J. Appl. Physiol. 2014, 114, 587–595. [Google Scholar] [CrossRef]
  32. Petersen, K.; Hansen, C.B.; Aagaard, P.; Madsen, K. Muscle mechanical characteristics in fatigue and recovery from a marathon race in highly trained runners. Eur. J. Appl. Physiol. 2007, 101, 385–396. [Google Scholar] [CrossRef] [PubMed]
  33. Balsalobre-Fernández, C.; Tejero-González, C.M.; del Campo-Vecino, J. Relationships between training load, salivary cortisol responses and performance during season training in middle and long distance runners. PLoS ONE 2014, 9, e106066. [Google Scholar] [CrossRef]
  34. Encarnación-Martínez, A.; García-Gallart, A.; Sanchis-Sanchis, R.; Pérez-Soriano, P. Effects of Central and Peripheral Fatigue on Impact Characteristics during Running. Sensors 2022, 22, 3786. [Google Scholar] [CrossRef]
  35. Mündermann, A.; Nigg, B.M.; Stefanyshyn, D.J.; Humble, R.N. Development of a reliable method to assess footwear comfort during running. Gait Posture 2002, 16, 38–45. [Google Scholar] [CrossRef]
  36. Nigg, B.M. Biomechanics of Sport Shoes; University of Calgary: Calgary, AB, Canada, 2010; ISBN 978-0-9867421-0-1. [Google Scholar]
  37. Lucas-Cuevas, A.G.; Pérez-Soriano, P.; Priego-Quesada, J.I.; Llana-Belloch, S. Influence of foot orthosis customisation on perceived comfort during running. Ergonomics 2014, 57, 1590–1596. [Google Scholar] [CrossRef]
  38. Van Hooren, B.; Fuller, J.T.; Buckley, J.D.; Miller, J.R.; Sewell, K.; Rao, G.; Barton, C.; Bishop, C.; Willy, R.W. Is Motorized Treadmill Running Biomechanically Comparable to Overground Running? A Systematic Review and Meta-Analysis of Cross-Over Studies. Sports Med. 2019, 50, 785–813. [Google Scholar] [CrossRef]
  39. Willwacher, S.; Regniet, L.; Mira Fischer, K.; Oberländer, K.D.; Brüggemanna, G.-P. The effect of shoes, surface conditions and sex on leg geometry at touchdown in habitually shod runners. Footwear Sci. 2014, 6, 129–138. [Google Scholar] [CrossRef]
  40. Sobhani, S.; Dekker, R.; Postema, K.; Dijkstra, P.U. Epidemiology of ankle and foot overuse injuries in sports: A systematic review. Scand. J. Med. Sci. Sports 2013, 23, 669–686. [Google Scholar] [CrossRef] [PubMed]
  41. Berthon, P.; Fellmann, N.; Bedu, M.; Beaune, B.; Dabonneville, M.; Coudert, J.; Chamoux, A. A 5-min running field test as a measurement of maximal aerobic velocity. Eur. J. Appl. Physiol. 1997, 75, 233–238. [Google Scholar] [CrossRef] [PubMed]
  42. Jones, A.M.; Doust, J.H. A 1% treadmill grade most accurately reflects the energetic cost of outdoor running. J. Sports Sci. 1996, 14, 321–327. [Google Scholar] [CrossRef] [PubMed]
  43. Arnold, B.J.W.; Weeks, B.K.; Horan, S.A. An examination of treadmill running familiarisation in barefoot and shod conditions in healthy men. J. Sports Sci. 2019, 37, 5–12. [Google Scholar] [CrossRef]
  44. Cudejko, T.; Button, K.; Al-Amri, M. Validity and reliability of accelerations and orientations measured using wearable sensors during functional activities. Sci. Rep. 2022, 12, 14619. [Google Scholar] [CrossRef] [PubMed]
  45. Lucas-Cuevas, A.G.; Encarnación-Martínez, A.; Camacho-García, A.; Llana-Belloch, S.; Pérez-Soriano, P. The location of the tibial accelerometer does influence impact acceleration parameters during running. J. Sports Sci. 2017, 35, 1734–1738. [Google Scholar] [CrossRef]
  46. Izquierdo-Renau, M.; Queralt, A.; Encarnación-Martínez, A.; Perez-Soriano, P. Impact Acceleration During Prolonged Running While Wearing Conventional Versus Minimalist Shoes. Res. Q. Exerc. Sport 2020, 92, 182–188. [Google Scholar] [CrossRef]
  47. Cohen, J. Quantitative methods in psychology: A power primer. Psychol. Bull. 1992, 112, 1155–1159. [Google Scholar] [CrossRef] [PubMed]
  48. Clarke, T.E.; Cooper, L.B.; Hamill, C.L.; Clark, D.E. The effect of varied stride rate upon shank deceleration in running. J. Sports Sci. 1985, 3, 41–49. [Google Scholar] [CrossRef]
  49. Derrick, T.R.; Hamill, J.; Caldwell, G.E. Energy absorption of impacts during running at various stride lengths. Med. Sci. Sports Exerc. 1998, 30, 128–135. [Google Scholar] [CrossRef]
  50. Mercer, J.A.; Bates, B.T.; Dufek, J.S.; Hreljac, A. Characteristics of shock attenuation during fatigued running. J. Sports Sci. 2003, 21, 911–919. [Google Scholar] [CrossRef]
  51. Smeathers, J.E. Transient vibrations caused by heel strike. Proc. Inst. Mech. Eng. 1989, 203, 181–186. [Google Scholar] [CrossRef]
  52. Voloshin, A.; Wosk, J.; Brull, M. Force wave transmission through the human locomotor system. J. Biomech. Eng. 1981, 103, 48–50. [Google Scholar] [CrossRef]
  53. Mizrahi, J.; Verbitsky, O.; Isakov, E. Fatigue-related loading imbalance on the shank in running: A possible factor in stress fractures. Ann. Biomed. Eng. 2000, 28, 463–469. [Google Scholar] [CrossRef]
  54. Taunton, J.E.; Ryan, M.B.; Clement, D.B.; McKenzie, D.C.; Lloyd-Smith, D.R.; Zumbo, B.D. A prospective study of running injuries: The Vancouver Sun Run “In Training” clinics. Br. J. Sports Med. 2003, 37, 239–244. [Google Scholar] [CrossRef]
  55. Miller, J.R.; Van Hooren, B.; Bishop, C.; Buckley, J.D.; Willy, R.W.; Fuller, J.T. A Systematic Review and Meta-Analysis of Crossover Studies Comparing Physiological, Perceptual and Performance Measures Between Treadmill and Overground Running. Sports Med. 2019, 49, 763–782. [Google Scholar] [CrossRef] [PubMed]
  56. Milner, C.E.; Hawkins, J.L.; Aubol, K.G. Tibial Acceleration during Running Is Higher in Field Testing Than Indoor Testing. Med. Sci. Sports Exerc. 2020, 52, 1361–1366. [Google Scholar] [CrossRef] [PubMed]
  57. Bobbert, M.F.; Yeadon, M.R.; Nigg, B.M. Mechanical analysis of the landing phase in heel-toe running. J. Biomech. 1992, 25, 223–234. [Google Scholar] [CrossRef] [PubMed]
  58. Schieb, D.A. Kinematic Accommodation of Novice Treadmill Runners. Res. Q. Exerc. Sport 1986, 57, 1–7. [Google Scholar] [CrossRef]
Figure 1. Study conditions: (A) motorized treadmill; (B) curved non-motorized treadmill; (C): overground running.
Applsci 15 09936 g001
Figure 2. Accelerometers placed on the forehead and the anteromedial distal portion of the tibia in the dominant leg.
Applsci 15 09936 g002
Figure 3. Visual Analog Scale with 11 comfort items.
Applsci 15 09936 g003
Figure 4. CMJ height (mean and standard deviation) based on surface and moment of the test (PreTest/PostTest). CMJ: countermovement jump; MT: motorized treadmill; cNMT: curved non-motorized treadmill; OVG: overground. * Differences between MT and OVG during PostTest (p < 0.05); differences between PreTest and PostTest (p < 0.05).
Applsci 15 09936 g004
Table 1. Impact accelerations in low-frequency band (mean and standard deviation (S.D.)) based on surface (MT, cNMT, and OVG) and moment of the test (PreTest/PostTest).
ParameterMomentMTcNMTOVG
Mean (S.D.)Mean (S.D.)Mean (S.D.)
HPLow (g2)PreTest0.40 (0.15) a,†0.32 (0.13) 0.41 (0.18) a
PostTest0.37 (0.13) a0.30 (0.11)0.36 (0.16) a
TPLow (g2)PreTest0.50 (0.19) a,b0.33 (0.13)0.60 (0.20) a
PostTest0.49 (0.18) a,b0.32 (0.13)0.64 (0.19) a
HPPLow (g2/Hz)PreTest0.10 (0.04) a,†0.09 (0.03) 0.10 (0.04) a
PostTest0.09 (0.03) a0.08 (0.03)0.09 (0.04) a
TPPLow (g2/Hz)PreTest0.10 (0.04) a,b0.06 (0.03)0.12 (0.04) a
PostTest0.10 (0.04) a,b0.06 (0.02)0.13 (0.04) a
HPFLow (Hz)PreTest3.53 (0.28) a3.49 (0.24)3.47 (0.25)
PostTest3.50 (0.25) a3.45 (0.24)3.53 (0.25)
TPFLow (Hz)PreTest6.83 (0.81) a,b,†6.51 (0.82) 6.48 (0.76)
PostTest6.60 (0.77) a,b6.30 (0.83)6.54 (0.82)
ATTlow (dB)PreTest0.91 (2.79) b0.09 (2.71)1.80 (2.61) a
PostTest1.18 (2.28) b0.25 (2.78)2.76 (2.46) a
HPlow (low-frequency head power); TPlow (low-frequency tibia power); HPPlow (low-frequency head peak power); TPPlow (low-frequency tibia peak power); HPFlow (low-frequency head peak power frequency); TPFlow (low-frequency tibia peak power frequency); ATTlow (low-frequency attenuation); MT (motorized treadmill); cNMT (curved non-motorized treadmill); OVG (overground). a Differences with cNMT (p < 0.05); b differences with OVG (p < 0.05); differences with PostTest (p < 0.05).
Table 2. Impact accelerations in high-frequency band (mean and standard deviation (S.D.)) based on surface (MT, cNMT, and OVG) and moment of the test (PreTest/PostTest).
ParameterMomentMTcNMTOVG
Mean (S.D.)Mean (S.D.)Mean (S.D.)
HPHigh (g2)PreTest0.14 (0.05) a0.09 (0.03)0.13 (0.05) a
PostTest0.13 (0.04) a0.09 (0.03)0.13 (0.06) a
TPHigh (g2)PreTest1.15 (0.46) a,b0.48 (0.27)1.37 (0.56) a
PostTest1.20 (0.55) a,b0.54 (0.31)1.54 (0.77) a
HPPHigh (g2/Hz)PreTest0.02 (0.01) a0.01 (0.01)0.01 (0.01) a
PostTest0.01 (0.01) a0.01 (0.01)0.01 (0.01) a
TPPHigh (g2/Hz)PreTest0.09 (0.03) a0.04 (0.02)0.10 (0.04) a
PostTest0.10 (0.04) a0.05 (0.02)0.12 (0.05) a
HPFHigh (Hz)PreTest11.07 (1.97)10.89 (1.95)10.70 (2.11)
PostTest11.59 (2.37)11.33 (2.46)11.21 (2.48)
TPFHigh (Hz)PreTest12.88 (2.40) b12.40 (2.60)13.00 (2.58)
PostTest13.40 (2.28) b12.62 (2.22)12.57 (1.99)
ATThigh (dB)PreTest9.05 (1.96) a,b6.73 (3.01)10.00 (1.98) a
PostTest9.40 (2.14) a,b7.41 (3.25)10.83 (2.6) a
HPhigh (high-frequency head power); TPhigh (high-frequency tibial power); HPPhigh (high-frequency head peak power); TPPhigh (high-frequency tibial peak power); HPFhigh (high-frequency head peak power frequency); TPFhigh (high-frequency tibial peak power frequency); ATThigh (high-frequency attenuation); MT (motorized treadmill); cNMT (curved non-motorized treadmill); OVG (overground); a differences with cNMT (p < 0.05); b differences with OVG (p < 0.05).
Table 3. Perceived comfort (mean and standard deviation (S.D.)) based on surface.
ParameterMTcNMTOVG
Mean (S.D.)Mean (S.D.)Mean (S.D.)
Overall comfort70.5 (15.0)59.0 (17.3) b75.2 (16.6)
Heel cushioning71.5 (14.9)64.8 (18.3)74.6 (13.8)
Forefoot cushioning71.2 (15.2)65.6 (16.0)74.8 (12.9)
Stride comfort75.6 (12.5) a61.5 (20.2) b79.2 (13.7)
Pace adaptation80.2 (13.1) a52.2 (21.5) b86.5 (11.3)
Perceived safety80.3 (14.2) a59.0 (19.1) b83.0 (16.3)
Perceived stability80.1 (12.6) a57.5 (16.9) b85.0 (12.1)
Surface hardness74.6 (14.3) a60.6 (18.8)71.3 (20.5)
Surface vibration76.4 (17.5)69.7 (17.8)81.9 (16.9)
Similarity to OVG60.9 (22.8) b50.4 (18.4) b86.0 (13.4)
MT (motorized treadmill); cNMT (curved non-motorized treadmill); OVG (overground). a Differences with cNMT (p < 0.05); b differences with OVG (p < 0.05).
Disclaimer/Publisher’s Note: The statements, opinions and data contained in all publications are solely those of the individual author(s) and contributor(s) and not of MDPI and/or the editor(s). MDPI and/or the editor(s) disclaim responsibility for any injury to people or property resulting from any ideas, methods, instructions or products referred to in the content.