Abstract
Superselective intra-arterial chemotherapy (SSIAC) presents a promising approach for treating oral cancer by delivering high concentrations of anticancer agents directly to the tumor-feeding arteries. However, drug distribution can be unpredictable, particularly in patients with vascular variations, such as the linguofacial trunk. In this study, we conducted a patient-specific computational fluid dynamics (CFD) analysis using contrast-enhanced computed tomography data obtained from two patients with oral cancer. We created 40 catheter placement models to simulate both the conventional and SSIAC techniques. We analyzed the blood and agent flows using a zero-dimensional resistance boundary model validated in a previous study. The agent distribution ratios to the lingual artery and facial artery varied significantly, whereas the blood flow distribution remained consistent across all the models. High anticancer agent concentration gradients were observed within 2 mm of the catheter tip, indicating that local flow dynamics governed the drug delivery process. No significant correlation was observed between the bifurcation flow angles and agent distribution. This study demonstrates that agent delivery in SSIAC is highly sensitive to the catheter tip location and local blood flow, independent of the blood flow bifurcation angles. Patient-specific CFD may assist clinicians in preoperatively determining the optimal catheter positioning to improve the treatment efficacy.
1. Introduction
Surgery, typically combined with chemotherapy and/or radiotherapy, is used as a standard treatment for oral cancer. Although it can effectively eradicate primary tumors, particularly early-stage cancers [1,2,3], surgery presents substantial challenges in advanced oral cancer. Extensive surgical resection can cause severe dysfunction of the oral cavity and the associated structures owing to the proximity of the tumor to essential structures involved in speech, mastication, and deglutition [4,5]. The resulting deficits may considerably impair the patient’s quality of life, presenting difficulties in eating and speaking, along with aesthetic concerns owing to facial disfigurement. Therefore, less invasive and function-sparing alternatives to surgery are required for treating oral cancer. Chemoradiotherapy has been a non-surgical alternative in selected cases. However, systemic chemotherapy alone is typically reserved for palliative management or for cases where surgery and/or radiation are not feasible. The survival data indicate that chemotherapy used as the sole primary modality has lower survival outcomes when compared with surgical treatment [6,7], particularly for operable tumors.
A therapeutic strategy that provides high curative potential while preserving organ function is essential to maintain the patients’ quality of life. Superselective intra-arterial chemotherapy (SSIAC) is a promising alternative, as it enables the targeted delivery of chemotherapeutic agents [8,9,10,11,12,13]. In addition, SSIAC ensures higher concentrations of agents at the tumor site while minimizing systemic side effects, thereby addressing the limitations of conventional treatment approaches. This technique has gained considerable attention as a targeted therapy that minimizes damage to the surrounding healthy tissues. In SSIAC, a hook-shaped catheter is introduced through the superficial temporal artery (STA), a branch of the external carotid artery (ECA) (see Figure 1a). The catheter is navigated into the tumor-feeding arteries, such as the maxillary artery (MA), facial artery (FA), and lingual artery (LA), which supply blood to the oral cancer. By targeting these specific arteries, SSIAC maximizes the concentration of chemotherapeutic agents at the tumor site, thereby improving the treatment efficacy. SSIAC has presented promising results in several clinical trials and has been increasingly recognized as an effective alternative for patients with advanced oral cancer, particularly for candidates not suitable for surgery owing to the risks of postsurgical dysfunction [14,15].
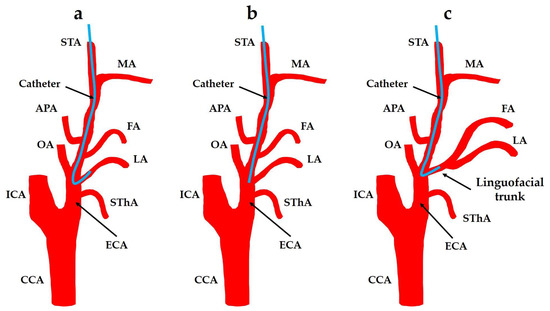
Figure 1.
Retrograde intra-arterial chemotherapy for oral cancer. (a) Superselective intra-arterial chemotherapy; (b) conventional intra-arterial chemotherapy; and (c) the FA and LA bifurcate from the linguofacial trunk. CCA: common carotid artery; ECA: external carotid artery; FA: facial artery; ICA: internal carotid artery; APA: ascending pharyngeal artery; LA: lingual artery; MA: maxillary artery; OA: occipital artery; STA: superficial temporal artery; SThA: superior thyroid artery.
Despite its advantages, SSIAC faces various limitations. The catheter placement is technically demanding, as insertion into the narrow, tortuous tumor-feeding arteries requires high surgical precision. Although the positional accuracy required for catheterization in the ECA and its branches has not been evaluated in previous studies, evidence from the internal carotid artery (ICA) procedures highlights the requirement for sub-millimeter to low-millimeter accuracy (±1–2 mm) to ensure precise deployment and minimize complications [16]. Misplacement can compromise drug delivery and reduce the treatment efficacy. When the catheterization of tumor-feeding arteries is infeasible, conventional intra-arterial chemotherapy (CIAC; Figure 1b) is used. In CIAC, a straight catheter is placed near the arterial bifurcation, allowing for drug infusion but with lower targeting accuracy. This increases the risk of affecting non-tumor tissues and thereby reduces the treatment efficacy and increases the side effects [11].
A linguofacial trunk (LFT) is a branch of the ECA that induces both LA and FA. The distribution of chemotherapeutic agents in patients with abnormalities in ECA branching patterns is a major concern. For example, the incidence rate of LFT is approximately in the range of 2.7% to 31.0% [17,18,19,20,21,22]. When a catheter is inserted into the LFT, predicting the amount of chemotherapeutic agent delivered to each artery is challenging (see Figure 1c). The distribution of anticancer agents between the LA and FA can significantly impact the treatment outcome, as both arteries may supply different parts of the tumor. SSIAC via LFT can cause residual oral cancer, which was observed in a recent case. Therefore, understanding and predicting the flow of chemotherapeutic agents in these anatomically complex regions is crucial for optimizing the treatment efficacy and effectiveness. We employed computational fluid dynamics (CFD) to simulate and analyze the flow of anticancer agents through the patients’ arteries to address these challenges [23,24]. CFD is a powerful tool that enables researchers to model the flow of fluids, such as blood, using complex systems, making it well-suited for analyzing the dynamics of chemotherapy agent delivery in patients. CFD can simulate the flow of blood and anticancer agents through arteries using patient-specific models, thereby providing insights into the distribution of agents in tumor-feeding arteries. Setting the appropriate boundary conditions to accurately replicate blood flow within the human body is a crucial aspect of CFD analysis. Boundary conditions can be used to define the mechanism of blood flow into and out of simulated arteries and are essential for achieving reliable and clinically relevant results.
Based on recent advancements in CFD, they have been applied targeted intra-arterial drug delivery. Sarker et al. [25] performed a CFD-based optimization of an atraumatic catheter for coronary plaque drug delivery, demonstrating the crucial effect of catheter tip design and infusion parameters on the drug distribution in arterial models. Taebi et al. [26] demonstrated that the boundary condition selection also significantly influences the microsphere distribution in liver arterial CFD models, highlighting the requirement for patient-specific modeling. In another domain, Cooney et al. [27] employed CFD to reveal spatial heterogeneity in the intraperitoneal drug and heat dispersion during hyperthermic intraperitoneal chemotherapy, demonstrating the importance of catheter placement and flow direction on therapeutic outcomes.
Based on these insights, this study is the first to simulate patient-specific SSIAC via the LFT, systematically analyzing the influence of catheter tip position and blood flow direction on the distribution of anticancer agents to the lingual and facial arteries. This approach presents clinically relevant guidelines for optimizing the catheter placement in anatomically complex vascular networks.
In our previous work, we developed a new outlet boundary condition, referred to as the zero-dimensional (0D) model, which is detailed in [28]. The 0D model enabled us to replicate patient-specific blood flow patterns in our computational analyses [23,24]. This model was validated in our previous studies and could accurately reproduce the blood flow dynamics of individual patients, thereby presenting a solid foundation for further analysis into the distribution of chemotherapy agents.
Based on this, we conducted fluid dynamics simulations to analyze the flow of anticancer agents when injected using modeled catheters [23,24]. Our findings indicated that the distribution of anticancer agents within the arteries was primarily determined by the direction of blood flow toward the artery at the location of the catheter tip. In particular, in the LFT, our analysis demonstrated that blood flow within a radius of 2.0 mm from the catheter tip contributes significantly to transporting most chemotherapy agents through the arterial system. This small blood flow zone near the catheter tip was identified as a key factor influencing the overall distribution of anticancer agents, highlighting the importance of precise catheter placement.
However, despite these advances, several challenges remain to be addressed. Although we identified the critical zone of blood flow around the catheter tip, the influence of blood flow in this zone on the distribution of anticancer agents within the LFT remains unclear. Additionally, our previous studies did not identify a definitive parameter that could reliably predict the distribution of chemotherapeutic agents between the LA and FA when a catheter was placed in the LFT.
In this study, we hypothesized that blood flow within the LFT can be quantitatively evaluated using new parameters, termed as θLA and θFA. This hypothesis aims to address the clinical challenge of predicting the distribution of anticancer agents in anatomically complex regions, thereby enhancing the precision and efficacy of intra-arterial chemotherapy for patients with oral cancer. Furthermore, the hypothesis is based on the premise that the evaluated parameters can predict the distribution of anticancer agents between the LA and FA by analyzing the blood flow dynamics within the LFT. Therefore, this study aims to test this hypothesis by analyzing these new parameters and evaluating their potential to predict the flow of anticancer agents in the LFT, ultimately improving the precision and effectiveness of intra-arterial chemotherapy for oral cancer patients.
2. Materials and Methods
The methodology described in this section is based on our previous works [23,24].
2.1. Geometrical Model and Mesh Generation
Digital imaging and communications in medicine (DICOM) data from contrast-enhanced computed tomography (CT) angiography of two patients with tongue cancer (Patients A and B) were imported into 3D Slicer (version 4.11) [29] to extract the target analysis region (see Figure 2 and Figure 3). The analysis region included the common carotid artery (CCA), ICA, ECA, and their branches.
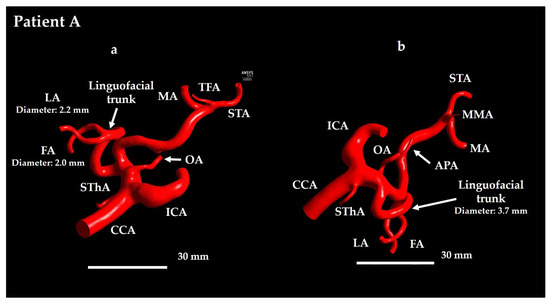
Figure 2.
Geometrical model for Patient A. (a) Anterior view and (b) lateral view. In Patient A, the TFA and MMA branch from the ECA in opposite directions. TFA is visible in panel (a) and MMA is visible in panel (b). CCA: common carotid artery; FA: facial artery; ICA: internal carotid artery; APA: ascending pharyngeal artery; LA: lingual artery; MA: maxillary artery; OA: occipital artery; STA: superficial temporal artery; SThA: superior thyroid artery; TFA: transverse facial artery; MMA: middle meningeal artery.
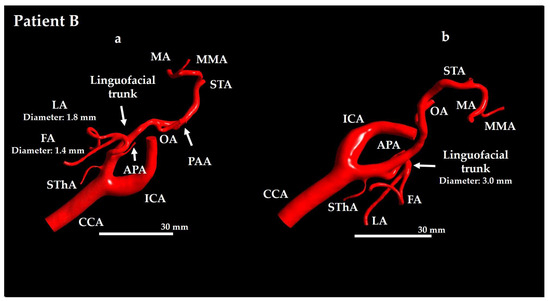
Figure 3.
Geometrical model for Patient B. (a) Anterior view and (b) lateral view. CCA: common carotid artery; FA: facial artery; ICA: internal carotid artery; APA: ascending pharyngeal artery; LA: lingual artery; MA: maxillary artery; PAA: posterior auricular artery; MMA: middle meningeal artery; OA: occipital artery; STA: superficial temporal artery; SThA: superior thyroid artery.
For Patient A, the ECA branches included the superior thyroid artery (SThA), LFT, ascending pharyngeal artery (APA), occipital artery (OA), middle meningeal artery (MMA), MA, STA, and transverse FA (TFA) (see Figure 2). For Patient B, the branches included the SThA, LFT, APA, LA, FA, OA, posterior auricular artery (PAA), MMA, MA, and STA (see Figure 3).
The vasculature of Patient A typically exhibited a more tortuous course (see Figure 2), whereas that of Patient B exhibited relatively straight branches (see Figure 3). This difference was particularly evident when comparing the ICA and ECA between the two patients. Patient A had a relatively long LFT, with a distance of 325.1 mm from the ECA–LFT junction to the LA–FA junction, whereas in Patient B this distance was 22.0 mm. Furthermore, the LA and FA were twisted in Patient A, whereas in Patient B, they were not.
The TFA supplies the parotid gland, masseter muscle, and facial skin, whereas the PAA primarily supplies the auricle and the scalp posterior to the ear. As these arteries do not supply the oral cancer region, anticancer agent distribution to them would reduce therapeutic efficacy; therefore, they were included in the analysis region.
Using the vascular modeling toolkit (VMTK) module in 3D Slicer, the vessel centerlines were traced to obtain the coordinates for catheter placement. A cylindrical catheter with a diameter of 1.3 mm was modeled along these centerlines in the Standard Triangulated Language (STL) format. The catheter and vessel geometries were imported into 3-Matic (version 10.0, Materialise, Leuven, Belgium), where Boolean operations were performed to place the catheter inside the vessel, establishing the analysis model. The catheter was modeled as a hollow tube. By varying the catheter positions within the vessel, we created five models simulating CIAC and 15 models simulating SSIAC for each patient, presenting a total of 40 analysis models.
2.1.1. Conventional Intra-Arterial Chemotherapy Models
For each patient, a base model was created with the catheter tip positioned at the bifurcation of the LFT (Models A-C Center and B-C Center; Figure 4 and Figure 5, left side). In addition to these base models, four sub-models were generated by tilting the catheter tip 0.5 mm forward, backward, leftward, or rightward to simulate slight positional deviations. In all the base models, the catheter tip center point was rotated about a point located 3 mm proximally along the catheter centerline from the catheter tip center point, corresponding to a tilt angle of 9.5°. In CIAC models, forward refers to the direction of LFT branching, whereas backward refers to the opposite direction.
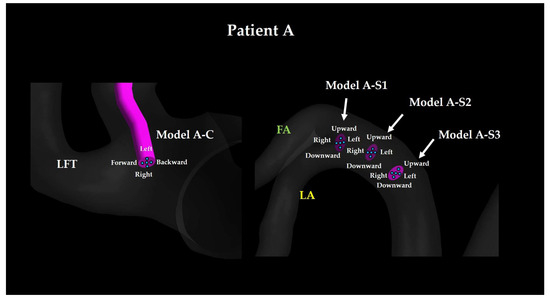
Figure 4.
Catheter tip location for Patient A. The walls of CCA and ICA are hidden. LFT: linguofacial trunk; FA: facial artery; LA: lingual artery.
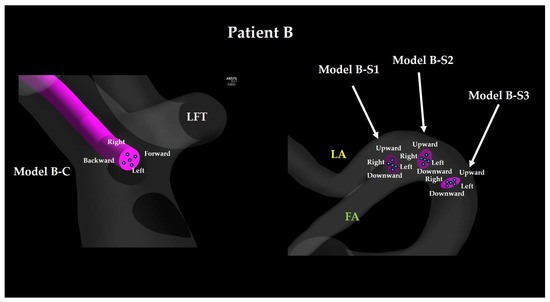
Figure 5.
Catheter tip location for Patient B. The walls of SThA and ICA are hidden. LFT: linguofacial trunk; FA: facial artery; LA: lingual artery.
2.1.2. Superselective Intra-Arterial Chemotherapy Models
For each patient, SSIAC models were constructed with the catheter tip placed at the bifurcation of the LA and FA within the LFT (Models A-S1 and B-S1; Figure 4 and Figure 5, right). To evaluate the effect of proximal positioning, the catheter tip was retracted 3 mm proximally (Models A-S2 and B-S2) and then by an additional 3 mm (Models A-S3 and B-S3). For each base position (S1, S2, and S3), additional sub-models were created by tilting the catheter tip 0.5 mm upward, downward, leftward, or rightward to account for angular variations. Similar to the CIAC models, this rotation corresponded to a tilt angle of 9.5°. In SSIAC models, upward refers to the cranial direction of the patient, whereas downward refers to the caudal direction.
The naming convention of each model is as follows: the first letter (A or B) indicates the patient, whereas the second letter (C, S1, S2, or S3) indicates the proximal–distal position of the catheter tip, and the final descriptor (center, forward, backward, upward, downward, left, or right) specifies the tilt direction of the catheter tip.
The 40 STL files were segmented using 3-Matic and imported into ICEM CFD (version 2019 R1, ANSYS Inc., Canonsburg, PA, USA) for meshing. Based on the findings of previous studies [23,24], tetrahedral meshes were applied to the core region, and prism layers (seven layers) were applied to the vessel and catheter walls, thereby ensuring that the first grid point was a y-plus value below 1 (Figure 6). Here, y-plus represents a dimensionless wall distance, and placing the first grid point of the prism layer to achieve y-plus < 1 enables accurate resolution of the near-wall flow phenomena. The average mesh counts for Patients A and B were 2,706,638 (±280,591.7 standard deviation) and 3,556,703 (±142,377.5 standard deviation), respectively.
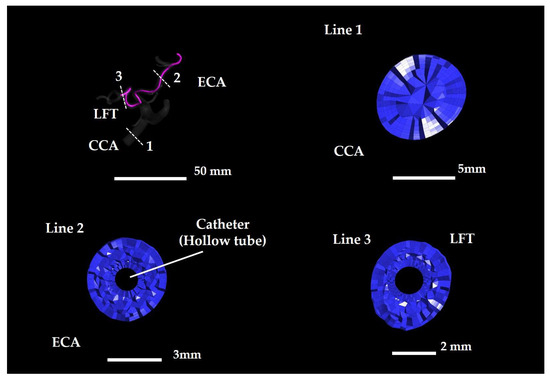
Figure 6.
Tetrahedral and prismatic meshes in Model A–S1 Center. Lines 1–3 indicate cross-section locations. CCA: common carotid artery; ECA: external carotid artery.
2.2. Numerical Method
In this study, intra-arterial drug delivery is represented as a two-species mixing problem involving anticancer agents and blood in the arterial network. The concentration fields for both the species were computed using the species transport module of FLUENT (version 2019 R1, ANSYS Inc., Canonsburg, PA, USA), where the local mass fraction of each species was governed by the following advection–diffusion equation:
where Yi denotes the mass fraction of species (with = 0 for anticancer drugs and = 1 for blood). Equation (1) was solved for Y0, which was the drug fraction. As the species fractions satisfy everywhere, the blood fraction follows as .
The diffusive flux, , of each species, driven by local concentration gradients, was evaluated in FLUENT using Fick’s law as follows:
where denotes the binary diffusion coefficient of species in the mixture and denotes the local mixture density. As direct measurements for either drug-in-blood or water-in-blood diffusion are unavailable, we consulted the published liquid–liquid data, which span 0.25 × 10⁻⁹–4.56 × 10⁻⁹ m2/s [30]. For the present simulations, we adopted the self-diffusion coefficient of water at 25 °C (2.299 × 10⁻⁹ m2/s [31]). The local mixture density, , and dynamic viscosity, , were updated from the species mass fractions as follows:
The species properties were prescribed as follows: blood was modeled as an incompressible Newtonian fluid with = 1050 kg/m3 [32] and μ = 4.6 × 10⁻³ Pa·s [33], whereas the anticancer drug was approximated as pure water ( = 998 kg/m3, μ = 1.0 × 10⁻³ Pa·s).
2.3. Boundary Conditions
For Patients A and B, the analysis model had two inlets: the CCA inlet and the catheter tip. At the CCA inlet, blood flow velocity waveforms were obtained from Doppler ultrasound measurements using a general ultrasound diagnostic device (HDI 5000; ATL-Philips Medical Systems, Bothell, WA, USA). The average velocity waveform was calculated based on four consecutive cardiac cycles near the center of the artery. Poiseuille flow profiles with peak velocities of 0.35 m/s and 0.37 m/s were applied at the CCA inlet for Patients A and B, respectively.
At the catheter tip, a mass flow rate of 1.35 × 10⁻⁵ kg/s was applied, based on a syringe pump injection rate of 50 mL/h and catheter diameter of 1.3 mm. The mass fraction of the anticancer agent (Y0) was set to 0 at the CCA inlet and 1 at the catheter tip. The injection direction at the catheter tip was defined as normal to the boundary.
The outlet configuration included nine outlets for each patient. For Patient A, the outlets were the ICA, SThA, LA, FA, OA, APA, MMA, MA, and TFA. For Patient B, the outlets were the ICA, SThA, LA, FA, OA, APA, PAA, MA, and MMA. A 0D resistance model was applied to all the outlets, except for the STA outlet, which was modeled as a wall owing to surgical ligation to prevent the flow of blood and anticancer agents. The vessel and catheter walls were modeled as rigid under no-slip conditions.
The key difference between Models A-C and B-C (representing CIAC) and Models A-S1, A-S2, A-S3, B-S1, B-S2, and B-S3 (representing SSIAC) lies in the relative orientation of the catheter tip to the incoming ECA blood flow. In the CIAC models, the anticancer agent is injected opposite to the direction of blood flow from the ECA. Conversely, the injection direction is aligned with the LFT blood flow in the SSIAC models.
2.4. 0D Resistance Model
The 0D resistance model used in this study was derived from a previous study conducted on the carotid artery blood flow. The details are available in [28]. This model is based on the anatomical observation that peripheral vascular networks exhibit fractal-like branching and optimized principles that minimize energy loss owing to blood viscosity. The arteries branch progressively into smaller vessels (large arteries, main arteries, terminal arteries, arterioles, and capillaries) until they transition to the venous system. A 0D model was constructed by determining branch generation up to the terminal capillaries below a threshold diameter (Figure 7). The outlet pressure boundary conditions of the 3D model were determined based on this peripheral network structure, which was capable of replicating the patient-specific carotid artery flow patterns reported in previous studies [23,28].
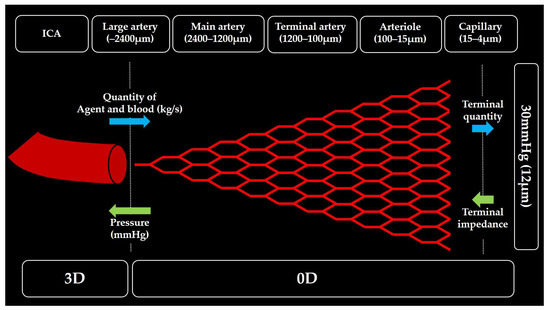
Figure 7.
Conceptual diagram of zero-dimensional resistance model.
2.5. Numerical Condition
The Reynolds numbers at the CCA inlet were 584 for Patient A and 637 for Patient B. At the catheter tip, the Reynolds number was 13, indicating laminar flow. Velocity–pressure coupling was achieved using the semi-implicit method for pressure linked equations (SIMPLE) scheme [34].
Convergence was achieved when the amplitude of the anticancer agent distribution ratio at all the outlets decreased below 0.1%. The distribution ratios were calculated as the ratio of the mass of the anticancer agent injected at the catheter tip to that measured at each outlet.
2.6. Evaluation Metrics
Four zones were defined within the analysis domain (see Figure 8) as follows:
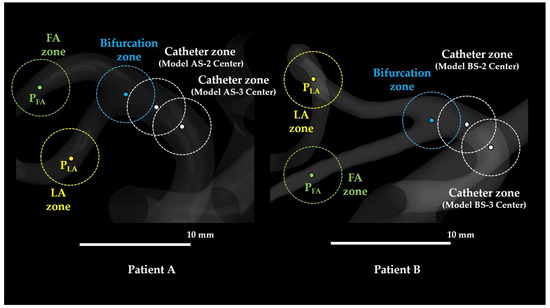
Figure 8.
Various zones defined in the study. FA: facial artery; LA: lingual artery. In Models AS-1 and BS-1, the bifurcation zone and catheter zone were identical.
- Catheter zone: A spherical region with a 2 mm radius centered at the catheter tip.
- Bifurcation zone: A spherical region with a 2 mm radius centered at the bifurcation of the LFT into the LA and FA.
- LA zone: A spherical region with a 2 mm radius centered at a distal point in the LA (LA point; PLA), located 17.0 mm downstream from the LFT bifurcation along the LA centerline in Patient A and 12.0 mm downstream in Patient B.
- FA zone: A spherical region with a 2 mm radius centered at a distal point in the FA (FA point; PFA), located 14.0 mm downstream from the LFT bifurcation along the FA centerline in Patient A and 11.0 mm downstream in Patient B.
PLA and PFA were placed more than six times the vessel diameter away from the LFT bifurcation, thereby avoiding regions of strong curvature, to ensure fully developed flow fields. The equivalent circular diameter of the LFT at the LA–FA bifurcation was 3.7 mm in Patient A and 3.0 mm in Patient B (see Figure 2 and Figure 3). A radius of 2 mm (diameter: 4 mm) was selected for evaluating the flow field in each zone, as well as for evaluating the flow both distal and proximal to the catheter tip (diameter: 1.3 mm).
To evaluate the blood flow within the LFT, two parameters (θLA and θFA) were defined (see Figure 9):
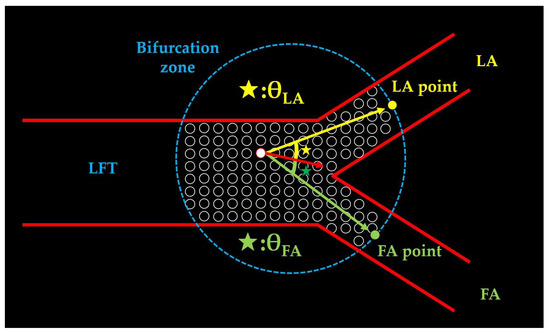
Figure 9.
The definition of θ-values. The red arrow represents the blood flow vector at an arbitrary mesh centroid within the bifurcation zone. The yellow arrow connects the mesh centroid to the LA point, and the green arrow connects the mesh centroid to the FA point. θLA (yellow star) is defined as the angle between the red and yellow arrows, whereas θFA (green star) denotes the angle between the red and green arrows. LFT: linguofacial trunk; LA: lingual artery; FA: facial artery.
- θLA: The angle between the velocity vector at each mesh center in the bifurcation zone and a line connecting the bifurcation point to a distal point 2 mm along the LA centerline. Smaller values indicate the flow directed toward the LA.
- θFA: The angle between the velocity vector at each mesh center in the bifurcation zone and a line connecting the bifurcation point to a distal point 2 mm along the FA centerline. Smaller values indicate the flow directed toward the FA.
θLA and θFA were calculated for all the meshes within the bifurcation zone, and their mean values were obtained.
The evaluation metrics included distribution ratios of anticancer agents and blood, mean Y0 concentration gradients in the LA, FA, and catheter zones, and mean values of θLA and θFA. The distribution of Y0 and flow field characteristics was qualitatively evaluated using volume rendering, streamline, and vector visualization in CFD-POST (version 2019 R1, ANSYS Inc., Canonsburg, PA, USA).
3. Results
This section presents the main results obtained in this study. The average analysis time was 149.6 ± 26.04 min for Patient A and 246.9 ± 56.45 min for Patient B.
3.1. Distribution Ratios of Blood and Anticancer Agents with Flow Visualization
Table A1, Table A2, Table A3 and Table A4 summarize the distribution ratios of blood and anticancer agents for each outlet in patients A and B. Figure 10 and Figure 11 present the bar graphs of the mean distribution ratios of anticancer agents and blood for the LA and FA in both patients across different models. These mean values are calculated as averages over the five sub-model points. The blood ratios were measured from the CCA, whereas the drug ratios were measured from the catheter tip. Therefore, for models S1, S2, and S3, the LA and FA drug ratios sum to 1. In all the models, the distribution ratios of anticancer agents did not match those of blood in either the LA or FA, indicating that drug delivery patterns vary substantially from the blood flow patterns.
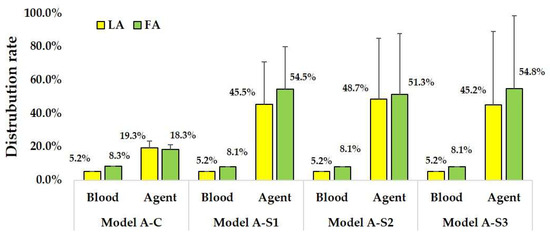
Figure 10.
Distribution rates of anticancer agent and blood in Patient A models. Error bars indicate variability across sub-models with catheter tip displacements of ±0.5 mm.
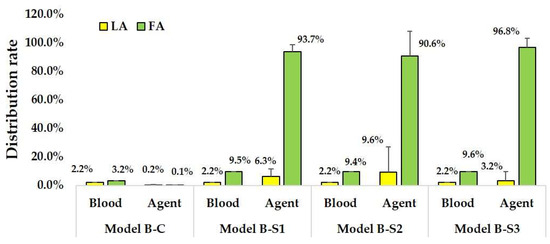
Figure 11.
Distribution rates of anticancer agent and blood in Patient B models. Error bars indicate variability across sub-models with catheter tip displacements of ±0.5 mm.
For the CIAC models (Models A-C, five models) used on Patient A, the blood distribution ratios were consistent for LA (5.2–5.3%) and FA (8.3%). Conversely, the anticancer agent distribution ratios varied significantly based on the catheter positioning, ranging from 15.2 to 26.1% for LA and 14.5 to 21.7% for FA. Additionally, 51.4–68.8% of the anticancer agents flowed into the ICA instead of the ECA branches.
For SSIAC models (Models A-S1, S2, and S3, 15 models), blood distribution ratios were similarly consistent for LA (5.1–5.3%) and FA (8.0–8.3%). However, the anticancer agent distribution ratios exhibited significant variations for LA (0–98.6%) and FA (1.4–100.0%). ICA received 56.9–57.1% of the anticancer agents.
Figure 12a depicts the distribution of the mass fraction of the anticancer agent (Y0) in Model A-C Center. Figure 12b,c depict the streamlines directed toward the ICA and LFT, respectively, in the same model. Figure 12d depicts the Y0 distribution in Model A-S1 Center, whereas Figure 12e,f depict the streamlines directed toward the FA and LA, respectively. In Model A-C Center, the anticancer agent introduced from the catheter tip was distributed toward both the LFT and ICA, with the corresponding streamlines passing near the catheter tip. Conversely, the streamlines directed toward both the LA and FA in Model A-S1 Center also passed near the catheter tip, as the catheter was located within the LFT. These findings indicate that streamlines flowing near the catheter tip are critical for effective transport of anticancer agents.
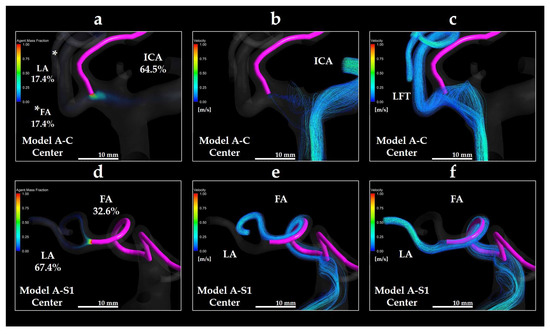
Figure 12.
Volume rendering images of Y0 and streamlines in Models A-C Center and A-S1 Center. (a) Y0 volume rendering in Model A-C Center; (b) streamline directed toward the ICA in Model A-C Center; (c) streamline directed toward the LFT in Model A-C Center; (d) Y0 volume rendering in Model A-S1 Center; (e) streamline directed toward the FA in Model A-S1 Center; (f) streamline directed toward the LA in Model A-S1 Center. * in panel (a) indicates the LA. The percentages shown indicate the distribution ratio of the anticancer agent. ICA: internal carotid artery; LFT: linguofacial trunk; FA: facial artery; LA: lingual artery.
For the conventional methods (Models B-C, five models) used on Patient B, the blood distribution ratios were consistent for LA (2.2%) and FA (3.2%). However, anticancer agents exhibited negligible distribution in LA (0–1.0%) and FA (0–0.4%), with almost no flow into the LFT.
For the superselective methods (Models B-S1, S2, and S3, 15 models), the blood distribution ratios remained stable for LA (2.2%) and FA (9.5–9.6%). Anticancer agent ratios varied significantly based on the catheter position, ranging from 0% to 44.2% for LA and 55.8% to 100.0% for FA, with the majority flowing into FA.
Figure 13a depicts the distribution of the anticancer agent mass fraction (Y0) in Model B-C Forward. Figure 13b depicts the streamline directed toward the LFT in the same model. Figure 13c depicts the Y0 distribution in Model B-S1 Center, whereas Figure 13d,e depicts the streamlines toward the LA and FA, respectively. In Model B-C Forward, only a small amount of the agent introduced from the catheter tip was distributed distally to the LFT, 1.0% toward the LA, and 0.4% toward the FA. Although the streamlines passed near the catheter tip, the streamline toward the LFT in Patient B was located farther from the catheter than that in Patient A. Therefore, the amount of agent delivered to the LFT was minimal.
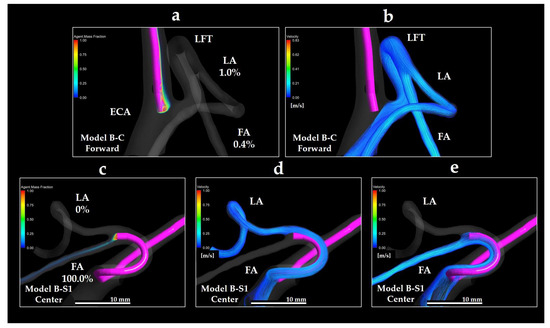
Figure 13.
Volume rendering images of Y0 and streamlines in Models B-C Forward and B-S1 Center. (a) Y0 volume rendering in Model B-C Forward; (b) streamline directed toward the LFT in Model B-C Forward; (c) Y0 volume rendering in Model B-S1 Center; (d) streamline directed toward the LA in Model B-S1 Center; (e) streamline directed toward the FA in Model B-S1 Center. The percentages shown indicate the distribution ratio of the anticancer agent. FA: facial artery; LA: lingual artery; ECA: external carotid artery; LFT: linguofacial trunk.
Notably, in the Model B-S1 Center, despite the catheter being placed within the LFT, the distribution ratio of the anticancer agent to the LA was 0%, with the entire amount delivered exclusively to the FA. This was because the streamline toward the FA covered the catheter tip, whereas the streamline toward the LA did not. These findings indicate that even if the catheter is placed in the LFT, the agent may not be evenly distributed to both distal branches. Instead, the distribution was strongly dependent on the local flow field surrounding the catheter tip.
3.2. Concentration Gradients of Anticancer Agents
Table 1 and Table 2 present the mean concentration gradients (m−1) in the catheter, LA, and FA zones for each model in Patients A and B. In all the models, whether representing the conventional method or SSIAC, the Y0 gradient was consistently the highest in the catheter zone, indicating that this region primarily governs the anticancer agent transport. Differences between the LA and FA zones were patient-specific: in Patient A, the FA gradients were at least five times greater than those in the LA, whereas in Patient B, the two zones exhibited comparable gradients. These findings highlight patient-dependent variability in spatial drug distribution.

Table 1.
Gradient of mass fraction of the anticancer agent (m−1) in the catheter, LA, and FA zones in models.

Table 2.
Gradient of mass fraction of the anticancer agent (m−1) in the catheter, LA, and FA zones in models B-C, B-S1, B-S2, and B-S3.
3.3. Analysis of θLA and θFA
As described in Section 2.6, θLA and θFA represent the intensity of blood flow directed toward LA or FA within a diameter zone of 2 mm at the bifurcation points.
For conventional methods (Model A-C) used on Patient A, θLA and θFA averaged 49.84 ± 0.40° and 75.80 ± 0.41°, respectively. The superselective models exhibit the following variations:
Model A-S1: θLA = 51.80 ± 1.02°, θFA = 73.80 ± 0.92°
Model A-S2: θLA = 53.00 ± 0.80°, θFA = 69.40 ± 1.58°
Model A-S3: θLA = 48.22 ± 3.50°, θFA = 38.74 ± 4.20°
Models A-C, S1, and S2 exhibited flow predominance toward the LA, whereas Model A-S3 exhibited flow predominance toward the FA. The inclination of the catheter did not alter the dominance of LA or FA blood flow.
For conventional methods (Model B-C) used on Patient B, θLA and θFA averaged 68.49 ± 0.27° and 75.02 ± 0.05°, respectively. The superselective models presented the following results.
Model B-S1: θLA = 68.83 ± 0.69°, θFA = 35.15 ± 0.61°
Model B-S2: θLA = 68.76 ± 4.06°, θFA = 35.94 ± 1.48°
Model B-S3: θLA = 53.93 ± 2.43°, θFA = 33.62 ± 1.32°
The conventional models exhibited flow predominance toward the LA, whereas the superselective models indicated FA dominance. Moreover, the catheter inclination did not affect flow dominance.
3.4. Scatter Plot of θLA, θFA, and Distribution Rate of Anticancer Agent
Figure 14 and Figure 15 depict the scatter plots of θLA and θFA against the distribution ratios of anticancer agents to LA and FA, respectively, in Models A-S1, A-S2, A-S3, B-S1, B-S2, and B-S3. For Patient A, the correlation coefficients between θLA and the LA distribution ratio and between θFA and the FA distribution ratio were 0.1363 and 0.0384, respectively. For Patient B, the corresponding correlation coefficients were 0.0852 and 0.0094, respectively. These low correlation values indicate that no significant relationship was observed between the directionality of the bifurcation flow (θ values) and the distribution patterns of the anticancer agents.
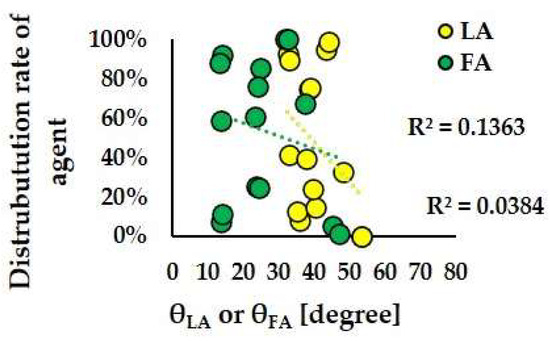
Figure 14.
Scatter plots of the agent distribution rate and θLA and θFA in Models A-S1, A-S2, and A-S3.
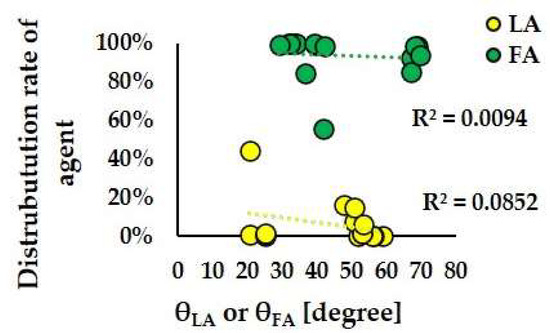
Figure 15.
Scatter plots of the distribution rate of agent and θLA and θFA in Models B-S1, B-S2, and B-S3.
3.5. Flow Field Vectors near the Catheter Tip
Figure 16 depicts the distribution of flow field vectors and the volume rendering of Y0 around the catheter tip in Model A-S1 Center. The local flow vectors near the catheter tip were directed linearly toward the vessel wall at the LA–FA bifurcation (arrow heads), whereas additional vectors originating away from the catheter tip were observed entering the branches, selectively directed into the LA (yellow stars) and FA (green stars).
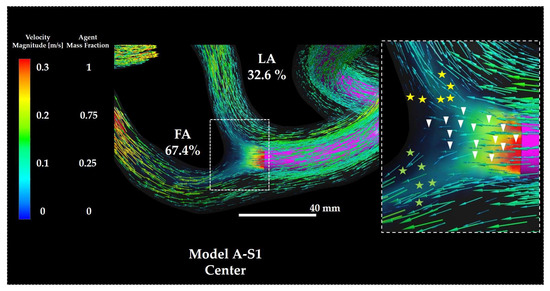
Figure 16.
Flow vectors and volume rendering of Y0 in Model A-S1. The percentages indicate the distribution ratio of the anticancer agent. The right panel depicts a magnified view of the catheter tip region. Symbols are defined in the main text. FA: facial artery; LA: lingual artery.
Figure 17 depicts the distribution of the flow field vectors and the volume rendering of Y0 around the catheter tip in Model B-S1 Center. Unlike in Model A-S1, the vectors directed towards the vessel wall at the LA–FA bifurcation were scarcely observed (arrow heads). Instead, most vectors in the vicinity of the catheter tip were directed into the FA branch (green stars), indicating preferential flow toward the FA. Conversely, the vectors directed towards the LA (yellow stars) followed along the catheter wall and passed above the catheter tip before entering the LA branch.
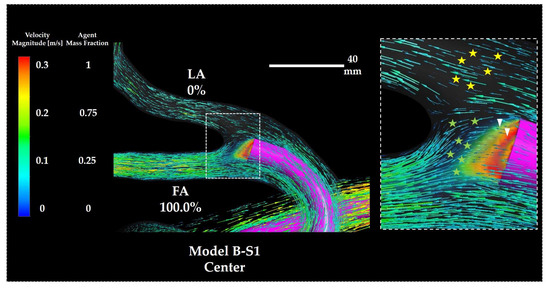
Figure 17.
Flow vectors and volume rendering of Y0 in Model B-S1. The percentages indicate the distribution ratio of the anticancer agent. The right panel depicts a magnified view of the catheter tip region. Symbols are defined in the main text. FA: facial artery; LA: lingual artery.
4. Discussion
SSIAC for oral cancer enables the delivery of anticancer agents with higher concentrations to the tumor tissue than CIAC. Tohnai et al. [11] compared patients with tongue cancer treated using these two approaches—catheter placement in the main trunk of the ECA for CIAC versus catheter placement in the LA for SSIAC—and demonstrated that SSIAC achieved significantly higher intratumoral concentrations of platinum-based agents.
However, the drug delivery pathway cannot be directly visualized during intra-arterial chemotherapy in patients with LFT. Clinically, drug distribution is typically evaluated using indigo carmine staining or contrast-enhanced CT angiography. Indigo carmine staining involves catheter placement in the ECA or its branches, followed by visual inspection of stained oral regions after dye injection. Contrast-enhanced CT angiography identifies high-absorption regions after contrast infusion. Both the methods depend on manual injection with finger pressure, producing infusion pressures higher than syringe pump delivery and potentially misrepresenting the true perfusion range of the anticancer agent.
CFD provides an alternative by enabling a detailed analysis of drug distribution under physiological flow conditions that are difficult to replicate experimentally. Apart from our study, only one CFD analysis of intra-arterial chemotherapy for oral cancer has been reported, by Rhode et al. [35]. However, their study analyzed a single case; excluded major ECA branches such as the OA, MA, and STA; placed the catheter unrealistically in the CCA; used literature-derived rather than patient-specific boundary conditions; and required four days to complete the computation.
Conversely, our CFD models included all the ECA branches, placed the catheter at clinically relevant sites (ECA or its branches), and applied a validated peripheral vascular model capable of reproducing patient-specific carotid flow patterns [28]. The computation times were also significantly shorter, approximately 150 min for Patient A and 250 min for Patient B, supporting the feasibility of clinical application.
In the CIAC model for Patient A (Model A-C), 51.4–68.8% of the anticancer agent entered the ICA, likely owing to the proximity of the common trunk and ECA–ICA bifurcations. This finding highlights the risk of drug delivery to brain tissue and serious adverse events such as cerebral infarction, making CIAC unsuitable. In Patient B (Model B–C), most drug influx occurred in the APA (45.9–60.7%) and MA (31.3–43.0%), with minimal flow into the LFT. FA delivery (0.4%) occurred only when the catheter tip was oriented toward the FA, indicating poor overall efficacy.
In the SSIAC models, Patient A achieved drug delivery to both the LA and FA when the catheter was placed in the common trunk, whereas Patient B achieved delivery only to the FA. For Patient B, LA delivery required direct catheter placement in the LA. These interpatient differences highlight the requirement for the preoperative prediction of optimal catheter positioning to improve the treatment outcomes and demonstrate the potential of CFD for treatment planning.
Across all the models, the anticancer agent distribution ratios to the LA and FA did not correspond to the blood distribution ratios. As the blood flow velocity (1.0 × 10⁻¹ m/s) significantly exceeds the diffusion coefficient (1.0 × 10⁻⁹ m2/s), advection dominates drug transport. In both the CIAC and SSIAC models, streamlines towards the drug-inflow outlets passed near the catheter tip (see Figure 12c,e,f and Figure 13e). While minimal variation was observed for the blood distribution ratios, the anticancer agent distribution ratios varied substantially, indicating that drug delivery is governed primarily by the local blood flow component around the catheter tip. In addition, Y0 gradients were highest within a 2 mm radius of the catheter tip, demonstrating the crucial role of the immediate pericatheter flow field in drug transport. The θ-values, introduced to evaluate the blood flow directionality, were not reliable predictors of LA versus FA drug distribution. In Patient A, vectors near the catheter tip were directed toward the LFT wall and subsequently divided into the LA and FA, distributing the drug to both arteries (see Figure 16). In Patient B, most vectors near the tip were directed toward the FA (see Figure 17), presenting nearly exclusive FA delivery. Because θ-values reflect averaged flow within the LFT, they could not capture such localized flow features. Moreover, tortuous vessel geometries cannot be represented by a single angular parameter, explaining the lack of significant correlation between θ-values and drug distribution ratios. These findings indicate that analysis of sub-millimeter ultra-local hemodynamics around the catheter tip is necessary to predict drug delivery more accurately. Our findings suggest that, for clinical application, the catheter tip should be advanced into the specific tumor-feeding artery (LA or FA) whenever feasible. When direct placement was technically challenging, the coil embolization of non-tumor-feeding arteries was reported [36] to redirect the blood flow towards the target artery, and our results support the potential utility of such flow-modifying strategies.
This study faces several limitations. The error bars for the anticancer agent distribution ratio represent variability across sub-models generated by ±0.5 mm displacements of the catheter tip. In principle, extrapolation based on these perturbations could further reduce uncertainty. However, because the flow field near the LA–FA bifurcation changes nonlinearly corresponding to the catheter position, simple linear extrapolation may introduce bias. Therefore, we reported the observed variability without extrapolation. Future works incorporating multidirectional and wider perturbations could enable response surface modeling for more precise uncertainty quantification. The 0D peripheral vascular model assumes a normal branching pattern, whereas tumor vessels undergo angiogenesis and exhibit abnormal morphology [37,38]. These vessels are irregular, lack clear arteriolar–capillary–venular boundaries, vary in diameter, and show disorganized branching, all of which can cause heterogeneous flow and permeability [39]. Consequently, the model may not fully capture tumor-specific vascular resistance. Incorporating angiogenesis-informed boundary conditions could improve accuracy. Additionally, vessel walls were modeled as rigid, whereas in reality they are elastic and subject to pulsatile flow. The fluid–structure interaction (FSI) between blood flow and vessel wall motion can alter local hemodynamics, particularly near the catheter tip. Although the FSI might modify the flow patterns, the velocity–diffusion coefficient scales indicate that advection is the dominant transport mechanism.
Author Contributions
Conceptualization, Y.O. and H.K.; methodology, Y.O.; software, Y.O.; validation, Y.O., H.K. and T.I.; writing—original draft preparation: Y.O. and Y.Y.; writing—review and editing: T.I. and K.M.; visualization: Y.O.; supervision: K.M.; project administration: Y.O.; funding acquisition: H.K. All authors have read and agreed to the published version of the manuscript.
Funding
This research was supported in part by Grants-in-Aid for Scientific Research (JSPS KAKENHI, Grant Number 19K19240) from the Japan Society for the Promotion of Science.
Institutional Review Board Statement
This study was conducted in accordance with the Declaration of Helsinki and approved by the Ethics Committee of Yokohama City University (Protocol Code F220800061, 30 August 2022).
Informed Consent Statement
Not applicable.
Data Availability Statement
The data that support the findings of this study are available from the corresponding author upon reasonable request.
Acknowledgments
The authors want to thank all the members who provided us with significant help and cooperation.
Conflicts of Interest
The authors declare no conflicts of interest.
Abbreviations
The following abbreviations are used in this manuscript:
| APA | ascending pharyngeal artery |
| CIAC | conventional intra-arterial chemotherapy |
| DICOM | digital imaging and communications in medicine |
| ECA | external carotid artery |
| FA | facial artery |
| ICA | internal carotid artery |
| LA | lingual artery |
| LFT | linguofacial trunk |
| MA | maxillary artery |
| MMA | middle meningeal artery |
| PAA | posterior auricular artery |
| SSIAC | superselective intra-arterial chemotherapy |
Appendix A

Table A1.
Distribution rate of blood in models A-C, A-S1, A-S2, and A-S3.
Table A1.
Distribution rate of blood in models A-C, A-S1, A-S2, and A-S3.
| Type of IAC | CIAC | SSIAC | ||||||||||||||||||
|---|---|---|---|---|---|---|---|---|---|---|---|---|---|---|---|---|---|---|---|---|
| Model | Model A-C | Model A-S1 | Model A-S2 | Model A-S3 | ||||||||||||||||
| Catheter | Center | Forward | Backward | Left | Right | Center | Upward | Downward | Left | Right | Center | Upward | Downward | Left | Right | Center | Upward | Downward | Left | Right |
| ICA | 56.9% | 57.1% | 57.1% | 57.0% | 57.1% | 57.3% | 57.2% | 57.2% | 57.2% | 57.1% | 57.1% | 57.3% | 57.3% | 57.2% | 57.3% | 57.2% | 57.2% | 57.2% | 57.2% | 57.1% |
| SThA | 1.7% | 1.7% | 1.7% | 1.7% | 1.7% | 1.7% | 1.7% | 1.7% | 1.7% | 1.7% | 1.7% | 1.7% | 1.7% | 1.7% | 1.7% | 1.7% | 1.7% | 1.7% | 1.7% | 1.7% |
| APA | 3.0% | 3.0% | 3.0% | 3.0% | 3.0% | 3.0% | 3.0% | 3.0% | 3.0% | 3.0% | 3.0% | 3.0% | 3.0% | 3.0% | 3.0% | 3.0% | 3.0% | 3.0% | 3.0% | 3.0% |
| LA | 5.3% | 5.2% | 5.3% | 5.2% | 5.2% | 5.2% | 5.2% | 5.1% | 5.2% | 5.1% | 5.2% | 5.2% | 5.1% | 5.2% | 5.1% | 5.2% | 5.2% | 5.1% | 5.2% | 5.2% |
| FA | 8.3% | 8.3% | 8.3% | 8.3% | 8.3% | 8.1% | 8.0% | 8.1% | 8.0% | 8.2% | 8.1% | 8.1% | 8.2% | 8.1% | 8.2% | 8.1% | 8.1% | 8.1% | 8.1% | 8.1% |
| OA | 5.4% | 5.4% | 5.4% | 5.4% | 5.4% | 5.4% | 5.4% | 5.4% | 5.4% | 5.4% | 5.5% | 5.4% | 5.4% | 5.4% | 5.4% | 5.4% | 5.4% | 5.4% | 5.4% | 5.5% |
| MA | 18.5% | 18.4% | 18.4% | 18.4% | 18.4% | 18.4% | 18.5% | 18.5% | 18.5% | 18.4% | 18.5% | 18.4% | 18.4% | 18.4% | 18.4% | 18.4% | 18.4% | 18.4% | 18.4% | 18.5% |
| MMA | 0.1% | 0.1% | 0.1% | 0.1% | 0.1% | 0.1% | 0.1% | 0.1% | 0.1% | 0.1% | 0.1% | 0.1% | 0.1% | 0.1% | 0.1% | 0.1% | 0.1% | 0.1% | 0.1% | 0.1% |
| TFA | 0.9% | 0.9% | 0.9% | 0.9% | 0.9% | 0.9% | 0.9% | 0.9% | 0.9% | 0.9% | 0.9% | 0.9% | 0.9% | 0.9% | 0.9% | 0.9% | 0.9% | 0.9% | 0.9% | 0.9% |

Table A2.
Distribution rate of agent in models A-C, A-S1, A-S2, and A-S3.
Table A2.
Distribution rate of agent in models A-C, A-S1, A-S2, and A-S3.
| Type of IAC | CIAC | SSIAC | ||||||||||||||||||
|---|---|---|---|---|---|---|---|---|---|---|---|---|---|---|---|---|---|---|---|---|
| Model | Model A-C | Model A-S1 | Model A-S2 | Model A-S3 | ||||||||||||||||
| Catheter | Center | Forward | Backward | Left | Right | Center | Upward | Downward | Left | Right | Center | Upward | Downward | Left | Right | Center | Upward | Downward | Left | Right |
| ICA | 64.5% | 51.4% | 68.1% | 68.8% | 55.8% | 0% | 0% | 0% | 0% | 0% | 0% | 0% | 0% | 0% | 0% | 0% | 0% | 0% | 0% | 0% |
| SThA | 0% | 0% | 0% | 0% | 0% | 0% | 0% | 0% | 0% | 0% | 0% | 0% | 0% | 0% | 0% | 0% | 0% | 0% | 0% | 0% |
| APA | 0% | 0% | 0% | 0% | 0% | 0% | 0% | 0% | 0% | 0% | 0% | 0% | 0% | 0% | 0% | 0% | 0% | 0% | 0% | 0% |
| LA | 17.4% | 26.1% | 15.2% | 15.9% | 21.7% | 32.6% | 0% | 94.9% | 0% | 98.6% | 41.3% | 8.0% | 92.8% | 12.3% | 89.1% | 39.1% | 14.5% | 74.6% | 23.9% | 75.4% |
| FA | 17.4% | 21.7% | 15.9% | 14.5% | 21.7% | 67.4% | 100.0% | 5.1% | 100.0% | 1.4% | 58.7% | 92.0% | 7.2% | 87.7% | 10.9% | 60.9% | 85.5% | 25.4% | 76.1% | 24.6% |
| OA | 0% | 0% | 0% | 0% | 0% | 0% | 0% | 0% | 0% | 0% | 0% | 0% | 0% | 0% | 0% | 0% | 0% | 0% | 0% | 0% |
| MA | 0.7% | 0.7% | 0.7% | 0.7% | 0.7% | 0% | 0% | 0% | 0% | 0% | 0% | 0% | 0% | 0% | 0% | 0% | 0% | 0% | 0% | 0% |
| MMA | 0% | 0% | 0% | 0% | 0% | 0% | 0% | 0% | 0% | 0% | 0% | 0% | 0% | 0% | 0% | 0% | 0% | 0% | 0% | 0% |
| TFA | 0% | 0% | 0% | 0% | 0% | 0% | 0% | 0% | 0% | 0% | 0% | 0% | 0% | 0% | 0% | 0% | 0% | 0% | 0% | 0% |

Table A3.
Distribution rate of blood in models B-C, B-S1, B-S2, and B-S3.
Table A3.
Distribution rate of blood in models B-C, B-S1, B-S2, and B-S3.
| Type of IAC | CIAC | SSIAC | ||||||||||||||||||
|---|---|---|---|---|---|---|---|---|---|---|---|---|---|---|---|---|---|---|---|---|
| Model | Model B-C | Model B-S1 | Model B-S2 | Model B-S3 | ||||||||||||||||
| Catheter | Center | Forward | Backward | Left | Right | Center | Upward | Downward | Left | Right | Center | Upward | Downward | Left | Right | Center | Upward | Downward | Left | Right |
| ICA | 74.0% | 74.0% | 74.0% | 74.0% | 74.0% | 7.1% | 7.1% | 7.1% | 7.1% | 7.1% | 7.1% | 7.1% | 7.1% | 7.1% | 7.1% | 7.1% | 7.1% | 7.1% | 7.1% | 7.1% |
| SThA | 0.6% | 0.6% | 0.6% | 0.6% | 0.6% | 3.0% | 3.1% | 3.1% | 3.1% | 3.1% | 3.1% | 3.1% | 3.1% | 3.1% | 3.1% | 3.1% | 3.1% | 3.1% | 3.1% | 3.1% |
| LA | 2.2% | 2.2% | 2.2% | 2.2% | 2.2% | 2.2% | 2.2% | 2.2% | 2.2% | 2.2% | 2.2% | 2.1% | 2.2% | 2.2% | 2.2% | 2.2% | 2.2% | 2.2% | 2.2% | 2.2% |
| FA | 3.2% | 3.2% | 3.2% | 3.2% | 3.2% | 9.6% | 9.6% | 9.6% | 9.6% | 9.6% | 9.6% | 9.5% | 9.6% | 9.6% | 9.6% | 9.5% | 9.5% | 9.5% | 9.5% | 9.5% |
| OA | 0.9% | 0.9% | 0.9% | 0.9% | 0.9% | 1.8% | 1.8% | 1.8% | 1.8% | 1.8% | 1.8% | 1.8% | 1.8% | 1.8% | 1.8% | 1.8% | 1.8% | 1.8% | 1.8% | 1.8% |
| APA | 7.1% | 7.1% | 7.1% | 7.1% | 7.1% | 74.2% | 74.1% | 74.1% | 74.1% | 74.1% | 74.1% | 74.1% | 74.1% | 74.1% | 74.1% | 74.1% | 74.1% | 74.1% | 74.1% | 74.1% |
| PAA | 0.6% | 0.6% | 0.6% | 0.6% | 0.6% | 0.6% | 0.6% | 0.6% | 0.6% | 0.6% | 0.6% | 0.6% | 0.6% | 0.6% | 0.6% | 0.6% | 0.6% | 0.6% | 0.6% | 0.6% |
| MA | 9.5% | 9.5% | 9.6% | 9.5% | 9.5% | 0.9% | 0.9% | 0.9% | 0.9% | 0.9% | 0.9% | 0.9% | 0.9% | 0.9% | 0.9% | 0.9% | 0.9% | 0.9% | 0.9% | 0.9% |
| MMA | 1.8% | 1.8% | 1.8% | 1.8% | 1.8% | 0.6% | 0.6% | 0.6% | 0.6% | 0.6% | 0.6% | 0.6% | 0.6% | 0.6% | 0.6% | 0.6% | 0.6% | 0.6% | 0.6% | 0.6% |

Table A4.
Distribution rate of agent in models B-C, B-S1, B-S2, and B-S3.
Table A4.
Distribution rate of agent in models B-C, B-S1, B-S2, and B-S3.
| Type of IAC | CIAC | SSIAC | ||||||||||||||||||
|---|---|---|---|---|---|---|---|---|---|---|---|---|---|---|---|---|---|---|---|---|
| Model | Model B-C | Model B-S1 | Model B-S2 | Model B-S3 | ||||||||||||||||
| Catheter | Center | Forward | Backward | Left | Right | Center | Upward | Downward | Left | Right | Center | Upward | Downward | Left | Right | Center | Upward | Downward | Left | Right |
| ICA | 0% | 0% | 0% | 0% | 0% | 0% | 0% | 0% | 0% | 0% | 0% | 0% | 0% | 0% | 0% | 0% | 0% | 0% | 0% | 0% |
| SThA | 0% | 0% | 0% | 0% | 0% | 0% | 0% | 0% | 0% | 0% | 0% | 0% | 0% | 0% | 0% | 0% | 0% | 0% | 0% | 0% |
| LA | 0% | 1.0% | 0% | 0% | 0% | 0% | 15.9% | 0% | 0% | 0% | 0.7% | 44.2% | 0% | 0.7% | 1.4% | 7.2% | 15.2% | 1.4% | 1.4% | 6.2% |
| FA | 0% | 0.4% | 0% | 0% | 0% | 100.0% | 84.1% | 100.0% | 100.0% | 100.0% | 99.3% | 55.8% | 100.0% | 99.3% | 98.6% | 92.8% | 84.8% | 98.6% | 98.6% | 93.8% |
| OA | 0% | 0% | 0% | 0% | 0% | 0% | 0% | 0% | 0% | 0% | 0% | 0% | 0% | 0% | 0% | 0% | 0% | 0% | 0% | 0% |
| APA | 53.0% | 45.9% | 60.7% | 45.7% | 55.2% | 0% | 0% | 0% | 0% | 0% | 0% | 0% | 0% | 0% | 0% | 0% | 0% | 0% | 0% | 0% |
| PAA | 3.6% | 3.3% | 3.3% | 4.1% | 3.0% | 0% | 0% | 0% | 0% | 0% | 0% | 0% | 0% | 0% | 0% | 0% | 0% | 0% | 0% | 0% |
| MA | 37.0% | 41.0% | 31.3% | 43.0% | 36.4% | 0% | 0% | 0% | 0% | 0% | 0% | 0% | 0% | 0% | 0% | 0% | 0% | 0% | 0% | 0% |
| MMA | 6.4% | 8.3% | 4.6% | 7.2% | 5.3% | 0% | 0% | 0% | 0% | 0% | 0% | 0% | 0% | 0% | 0% | 0% | 0% | 0% | 0% | 0% |
References
- Bellini, E.; Pace, G.M.; Marchi, F.; Paderno, A.; Zimello, C.; Pennacchi, A.; Mercante, G.; Peretti, G.; Spriano, G.; Iandelli, A. Impact of surgical margins status on survival outcomes in oral cavity squamous cell carcinoma: A systematic review and meta-analysis. Acta Otorhinolaryngol. Ital. 2025, 45 (Suppl. 1), S2. [Google Scholar] [CrossRef] [PubMed]
- Kwak, J.H.; Ji, Y.B.; Song, C.M.; Lee, Y.J.; Park, H.J.; Tae, K. Long-term oncologic outcomes and prognostic factors related to recurrences in pathologic Stage I/II early oral tongue cancer. Front. Surg. 2025, 12, 1534274. [Google Scholar] [CrossRef]
- Stawarz, K.; Bieńkowska-Pluta, K.; Galazka, A.; Gorzelnik, A.; Durzynska, M.; Misiak-Galazka, M.; Stawarz, G.; Zwolinski, J. Clinicopathologic predictors of survival following oral cancer surgery: A retrospective cohort study. Cancers 2025, 17, 2454. [Google Scholar] [CrossRef]
- Kodama, N.; Kumai, Y.; Miyamoto, T.; Matsubara, K.; Samejima, Y.; Orita, Y. Factors affecting the swallowing dysfunction following oral cancer surgery. Ann. Rehabil. Med. 2021, 45, 368–378. [Google Scholar] [CrossRef] [PubMed]
- Morioka, R.; Matsuda, Y.; Kato, A.; Okui, T.; Okuma, S.; Tatsumi, H.; Kanno, T. Oral functional impairment may cause malnutrition following oral cancer treatment in a single-center cross-sectional study. Sci. Rep. 2022, 12, 14787. [Google Scholar] [CrossRef]
- Ogawa, T.; Matsuura, K.; Shiga, K.; Tateda, M.; Katagiri, K.; Kato, K.; Saijo, S.; Kobayashi, T. Surgical treatment is recommended for advanced oral squamous cell carcinoma. Tohoku J. Exp. Med. 2011, 223, 17–25. [Google Scholar] [CrossRef][Green Version]
- Spiotto, M.T.; Jefferson, G.; Wenig, B.; Markiewicz, M.; Weichselbaum, R.R.; Koshy, M. Differences in survival with surgery and postoperative radiotherapy compared with definitive chemoradiotherapy for oral cavity cancer: A national cancer database analysis. JAMA Otolaryngol. Head Neck Surg. 2017, 143, 691–699. [Google Scholar] [CrossRef]
- Fuwa, N.; Kodaira, T.; Furutani, K.; Tachibana, H.; Nakamura, T.; Nakahara, R.; Tomoda, T.; Inokuchi, H.; Daimon, T. Intra-arterial chemoradiotherapy for locally advanced oral cavity cancer: Analysis of therapeutic results in 134 cases. Br. J. Cancer 2008, 98, 1039–1045. [Google Scholar] [CrossRef]
- Nozato, T.; Koizumi, T.; Hayashi, Y.; Iida, M.; Iwai, T.; Oguri, S.; Hirota, M.; Kioi, M.; Koike, I.; Hata, M.; et al. Thermochemoradiotherapy using superselective intra-arterial infusion for patients with oral cancer with cervical lymph node metastases. Anticancer Res. 2019, 39, 1365–1373. [Google Scholar] [CrossRef] [PubMed]
- Fuwa, N.; Kodaira, T.; Furutani, K.; Tachibana, H.; Nakamura, T. A new method of selective intra-arterial infusion therapy via the superficial temporal artery for head and neck cancer. Oral Surg. Oral Med. Oral Pathol. Oral Radiol. Endod. 2008, 105, 783–789. [Google Scholar] [CrossRef]
- Tohnai, I. Chemotherapy using intra-arterial infusion for oral cancer. Nagoya J. Med. Sci. 2006, 68, 101–108. [Google Scholar]
- Koizumi, J.T.; Minamiyama, S.; Hayashi, Y.; Osawa, K.; Ohashi, N.; Ohya, T.; Iida, M.; Iwai, T.; Oguri, S.; Hirota, M.; et al. Retrograde superselective intra-arterial chemoradiotherapy for squamous cell carcinoma of the buccal mucosa. Int. J. Radiat. Res. 2019, 17, 283–291. [Google Scholar]
- Nakasato, T.; Katoh, K.; Sone, M.; Ehara, S.; Tamakawa, Y.; Hoshi, H.; Sekiyama, S. Superselective continuous arterial infusion chemotherapy through the superficial temporal artery for oral cavity tumors. AJNR Am. J. Neuroradiol. 2000, 21, 1917–1922. [Google Scholar]
- Mitsudo, K.; Koizumi, T.; Iida, M.; Iwai, T.; Nakashima, H.; Oguri, S.; Kioi, M.; Hirota, M.; Koike, I.; Hata, M.; et al. Retrograde superselective intra-arterial chemotherapy and daily concurrent radiotherapy for stage III and IV oral cancer: Analysis of therapeutic results in 112 cases. Radiother. Oncol. 2014, 111, 306–310. [Google Scholar] [CrossRef]
- Minamiyama, S.; Mitsudo, K.; Hayashi, Y.; Iida, M.; Iwai, T.; Nakashima, H.; Oguri, S.; Ozawa, T.; Koizumi, T.; Hirota, M.; et al. Retrograde superselective intra-arterial chemotherapy and daily concurrent radiotherapy for T2–4N0 tongue cancer: Control of occult neck metastasis. Oral Surg. Oral Med. Oral Pathol. Oral Radiol. 2017, 124, 16–23. [Google Scholar] [CrossRef]
- Nishimura, K.; Otani, K.; Mohamed, A.; Dahmani, C.; Ishibashi, T.; Yuki, I.; Kaku, S.; Takao, H.; Murayama, Y. Accuracy of length of virtual stents in treatment of intracranial wide-necked aneurysms. Cardiovasc. Interv. Radiol. 2019, 42, 1168–1174. [Google Scholar] [CrossRef]
- Lucev, N.; Bobinac, D.; Maric, I.; Drescik, I. Variations of the great arteries in the carotid triangle. Otolaryngol. Head Neck Surg. 2000, 122, 590–591. [Google Scholar] [CrossRef] [PubMed]
- Ozgur, Z.; Govsa, F.; Ozgur, T. Assessment of origin characteristics of the front branches of the external carotid artery. J. Craniofac. Surg. 2008, 19, 1159–1166. [Google Scholar] [CrossRef] [PubMed]
- Shintani, S.; Terakado, N.; Alcalde, R.E.; Tomizawa, K.; Nakayama, S.; Ueyama, Y.; Ichikawa, H.; Sugimoto, T.; Matsumura, T. An anatomical study of the arteries for intraarterial chemotherapy of head and neck cancer. Int. J. Clin. Oncol. 1999, 4, 327–330. [Google Scholar] [CrossRef]
- Sanjeev, I.K.; Anita, H.; Ashwini, M.; Mahesh, U.; Rairam, G.B. Branching pattern of external carotid artery in human cadavers. J. Clin. Diagn. Res. 2010, 4, 3128–3133. [Google Scholar]
- Zümre, O.; Salbacak, A.; Ciçekcibaşi, A.E.; Tuncer, I.; Seker, M. Investigation of the bifurcation level of the common carotid artery and variations of the branches of the external carotid artery in human fetuses. Ann. Anat. 2005, 187, 361–369. [Google Scholar] [CrossRef]
- Mata, J.R.; Mata, F.R.; Souza, M.C.R.; Nishijo, H.; Ferreira, T.A.A. Arrangement and prevalence of branches in the external carotid artery in humans. Ital. J. Anat. Embryol. 2012, 117, 65–74. [Google Scholar]
- Kitajima, H.; Oshima, M.; Iwai, T.; Ohhara, Y.; Yajima, Y.; Mitsudo, K.; Tohnai, I. Computational fluid dynamics study of intra-arterial chemotherapy for oral cancer. Biomed. Eng. Online 2017, 16, 57. [Google Scholar] [CrossRef]
- Kitajima, H.; Iwai, T.; Yajima, Y.; Mitsudo, K. Computational fluid dynamics study of superselective intra-arterial chemotherapy for oral cancer: Flow simulation of anticancer agent in the linguofacial trunk. Appl. Sci. 2020, 10, 7496. [Google Scholar] [CrossRef]
- Sarker, S.; Chatzizisis, Y.S.; Terry, B.S. Computational optimization of a novel atraumatic catheter for local drug delivery in coronary atherosclerotic plaques. Med. Eng. Phys. 2020, 79, 26–32. [Google Scholar] [CrossRef]
- Taebi, A.; Pillai, R.M.; Roudsari, B.S.; Vu, C.T.; Roncali, E. Computational modeling of the liver arterial blood flow for microsphere therapy: Effect of boundary conditions. Bioengineering 2020, 7, 64. [Google Scholar] [CrossRef] [PubMed]
- Cooney, O.S.; Goodin, D.A.; Mouw, T.J.; Martin, R.C.G.; Frieboes, H.B. Intra-abdominal temperature variation during hyperthermic intraperitoneal chemotherapy evaluated via computational fluid dynamics modeling. J. Gastrointest. Oncol. 2024, 15, 1847. [Google Scholar] [CrossRef]
- Ohhara, Y.; Oshima, M.; Iwai, T.; Kitajima, H.; Yajima, Y.; Mitsudo, K.; Krdy, A.; Tohnai, I. Investigation of blood flow in the external carotid artery and its branches with a new 0D peripheral model. Biomed. Eng. Online 2016, 15, 16. [Google Scholar] [CrossRef]
- Fedorov, A.; Beichel, R.; Kalpathy-Cramer, J.; Finet, J.; Fillion-Robin, J.C.; Pujol, S.; Bauer, C.; Jennings, D.; Fennessy, F.; Sonka, M.; et al. 3D Slicer as an image computing platform for the quantitative imaging network. Magn. Reson. Imaging 2012, 30, 1323–1341. [Google Scholar] [CrossRef] [PubMed]
- Haynes, W.M. CRC Handbook of Chemistry and Physics, 93rd ed.; CRC Press: Boca Raton, FL, USA, 2012; pp. 6–250. [Google Scholar]
- Holz, M.; Heil, S.R.; Sacco, A. Temperature-dependent self-diffusion coefficients of water and six selected molecular liquids for calibration in accurate 1H NMR PFG measurements. Phys. Chem. Chem. Phys. 2000, 20, 4740–4742. [Google Scholar] [CrossRef]
- Thomas, B.; Sumam, K.S. Blood flow in human arterial system—A review. Procedia Technol. 2016, 24, 339–346. [Google Scholar] [CrossRef]
- Bartosik, A. Simulations of frictional losses in a turbulent blood flow using three rheological models. WSEAS Trans. Fluid Mech. 2020, 15, 131–139. [Google Scholar] [CrossRef]
- Ansys Fluent Theory Guide; Ansys, Inc.: Canonsburg, PA, USA, 2021; p. 916.
- Rhode, S.; Paul, M.C.; Martens, E.; Campbell, D.F. Simulation of haemodynamic flow in head and neck cancer chemotherapy. Biomed. Eng. Online 2011, 10, 104. [Google Scholar] [CrossRef] [PubMed]
- Masuda, K.; Yamazoe, S.; Baba, A.; Mogami, T.; Ogane, S.; Nomura, T.; Ojiri, H. Superselective intra-arterial chemoradiotherapy using altered blood flow compared to conventional systemic chemoradiotherapy for locally advanced oral squamous cell carcinoma: A single-center retrospective study. Oral Radiol. 2021, 37, 700–706. [Google Scholar] [CrossRef]
- Hashizume, H.; Baluk, P.; Morikawa, S.; McLean, J.W.; Thurston, G.; Roberge, S.; Jain, R.K.; McDonald, D.M. Openings between defective endothelial cells explain tumor vessel leakiness. Am. J. Pathol. 2000, 156, 1363–1380. [Google Scholar] [CrossRef]
- Hormuth, D.A., II; Phillips, C.M.; Wu, C.; Lima, E.A.B.F.; Lorenzo, G.; Jha, P.K.; Jarrett, A.M.; Oden, J.T.; Yankeelov, T.E. Biologically-based mathematical modeling of tumor vasculature and angiogenesis via time-resolved imaging data. Cancers 2021, 13, 3008. [Google Scholar] [CrossRef]
- Gamde, M.S.; Ogenyi, O.D. Angiogenesis in breast cancer: A review. Asian Pac. J. Cancer Biol. 2024, 9, 97–103. [Google Scholar] [CrossRef]
Disclaimer/Publisher’s Note: The statements, opinions and data contained in all publications are solely those of the individual author(s) and contributor(s) and not of MDPI and/or the editor(s). MDPI and/or the editor(s) disclaim responsibility for any injury to people or property resulting from any ideas, methods, instructions or products referred to in the content. |
© 2025 by the authors. Licensee MDPI, Basel, Switzerland. This article is an open access article distributed under the terms and conditions of the Creative Commons Attribution (CC BY) license (https://creativecommons.org/licenses/by/4.0/).