Article

Solvent-Driven Extraction of Bioactive Compounds from Propolis for Application in Food Industry Matrices

by
Sara Peixoto
1,2,
Amanda Priscila Silva Nascimento
3,
Cristina Vicente
1,2 and
Ana Novo Barros
4,*
1
CEB—Centre of Biological Engineering, University of Minho, 4710-057 Braga, Portugal
2
LABBELS—Associate Laboratory, 4710-057 Guimarães, Portugal
3
Academic Unit of Food Engineering, Federal University of Campina Grande, Av. Aprígio Veloso, 882, Campina Grande 58429-900, Brazil
4
Centre for the Research and Technology of Agro-Environmental and Biological Sciences (CITAB), University of Trás-os-Montes e Alto Douro (UTAD), 5000-801 Vila Real, Portugal
*
Author to whom correspondence should be addressed.
Appl. Sci. 2025, 15(18), 9928; https://doi.org/10.3390/app15189928
Submission received: 14 August 2025 / Revised: 1 September 2025 / Accepted: 9 September 2025 / Published: 10 September 2025
(This article belongs to the Special Issue New Advances in Antioxidant Properties of Bee Products)

Abstract

Propolis is a resinous substance collected by honeybees from plant exudates and enriched with beeswax, pollen, and enzymes. Known for its antioxidant, antimicrobial, and anti-aging properties, it has attracted interest for applications in food, nutraceutical, and cosmetic industries. In this work, Portuguese propolis from the Guarda region was characterized to evaluate how different solvents influence extraction efficiency and bioactive potential. Samples were extracted by cold maceration using 96% ethanol, 70% ethanol, and ultrapure water, and their physicochemical profile was determined. Total phenolic content (TPC) and total flavonoid content (TFC) were measured by the Folin–Ciocalteu and aluminum chloride methods, while antioxidant activity was assessed through DPPH, ABTS, and FRAP assays. Tyrosinase and elastase inhibition tests were performed to assess anti-aging potential. Ethanolic extracts contained markedly higher phenolic and flavonoid levels than aqueous extracts, with 70% ethanol showing a slight advantage for flavonoid recovery. Both TPC and TFC correlated strongly with antioxidant activity (R2 > 0.95), highlighting phenolics, particularly flavonoids, as the main contributors to bioactivity. The 96% ethanol extract showed the highest tyrosinase inhibition (46.9 ± 0.9%), while elastase inhibition remained consistently high for ethanolic extracts. Overall, these findings indicate that Portuguese propolis is a rich source of bioactive compounds and emphasize the importance of solvent selection to optimize its functional properties.

1. Introduction

Propolis is a resinous material collected by honeybees from plant exudates and enriched with beeswax, essential oils, pollen and salivary enzymes. Traditionally, its bioactive compounds have been extracted with ethanol, water, or hydroalcoholic mixtures, solvents that are widely employed in the food, cosmetic and pharmaceutical industries due to their efficiency and regulatory acceptance. Within the hive, it functions as a protective barrier, sealing gaps and safeguarding the colony against microbial threats and environmental stressors. Beyond its role in hive defense, propolis has long been valued for its biological activities, and over the past few decades it has emerged as a focus of growing scientific interest [1,2]. Its chemical profile is dominated by flavonoids such as pinocembrin, quercetin, galangin, apigenin and chrysin, together with phenolic acids including ferulic and caffeic acids and their derivatives. These compounds are strongly associated with antioxidant, antimicrobial, anti-inflammatory and anticancer properties [3,4,5].
The composition of propolis is highly variable and reflects the diversity of plant sources available to bees. Botanical and geographical origin, bee species and the season of collection all shape its phytochemical profile, influencing key quality markers such as total phenolic content (TPC), total flavonoid content (TFC) and chromatographic signatures [4,6]. Studies on Bornes and Fundão propolis from Portugal have reported particularly high TPC values, reaching up to 329 mg GAE/g, together with strong antioxidant activity in DPPH and reducing-power assays [7]. Portuguese propolis from the Algarve and Guarda regions has also been shown to be rich in phenolic compounds and to exhibit marked antioxidant capacity, with TPC values often above 200 mg GAE/g and antioxidant activities exceeding 85% in DPPH, ABTS and FRAP assays [8,9,10].
Such characteristics have attracted attention for potential applications in the food and nutraceutical sectors. Propolis extracts have been explored as natural preservatives, functional food ingredients and active packaging components, demonstrating the ability to inhibit lipid oxidation and suppress microbial growth in a range of food systems [3,11,12,13]. However, their direct use can be hindered by limited water solubility, thermal sensitivity and a distinctive bitter flavour. These challenges underline the importance of optimising extraction processes and carefully selecting solvents—most commonly ethanol, hydroethanolic solutions, or water—to improve the recovery of bioactive compounds while preserving their integrity [14].
While novel extraction techniques such as ultrasound-assisted extraction and subcritical water extraction have gained recognition, conventional maceration using ethanol, water, or hydroalcoholic solvents remains the most widely applied approach, particularly in pharmaceutical, cosmetic and food industries [15,16,17,18]. Yet, comprehensive evaluations of how different solvent systems influence extraction yield, chemical composition and resulting bioactivity in Portuguese propolis remain limited. Moreover, few studies have examined their potential in antioxidant and anti-ageing contexts.
In this study, we examined inland Portuguese propolis from the Guarda region, comparing the effects of three solvent systems—96% ethanol, 70% ethanol and ultrapure water—on extraction efficiency, phenolic and flavonoid content, antioxidant capacity and anti-ageing activity. By linking chemical composition to functional performance, our work provides new insights into the bioactive potential of Portuguese propolis and its prospective applications in food, nutraceutical and cosmetic formulations.

2. Materials and Methods

2.1. Sample Conditions

The propolis analyzed in this work (Sample 1) originated from a certified beekeeper located in the inland region of Portugal (Guarda district). It was harvested in late April 2023, approximately one month after production, and transported to the laboratory in an insulated container under cool conditions (exact temperature not recorded). As typically observed in raw hive material, the sample still contained minor impurities such as fragments of bee parts.
Upon arrival, it was stored at 4 °C in the dark, with silica gel placed inside the container to control humidity and preserve its chemical integrity until further analysis.

2.2. Sample Preparation

To minimize variability associated with particle size, the raw propolis was first homogenized by grinding. About 50 g of material were processed in an electric grinder (1500 W Philips Walita, São Paulo, Brazil) in two 20 s cycles. The powdered propolis obtained was transferred to amber glass containers and kept under refrigerated, dry, and light-protected conditions until use in the extraction step.

2.3. Extraction of Bioactive Compounds

Three solvents with different polarities were used to extract phenolic and flavonoid compounds from Sample 1:
  • 96% ethanol (absolute ethanol, EtOH 96%);
  • 70% ethanol (hydroethanol, EtOH 70%);
  • Ultrapure water (Milli-Q grade).
For each extraction, a 1:20 (w/v) ratio was used (0.5 g of propolis in 10 mL of solvent). The mixtures were subjected to cold solid–liquid maceration for 24 h at room temperature (20 °C) under constant magnetic stirring (150 rpm). These extraction conditions (1:20 w:v ratio; 24 h maceration under agitation at room temperature) were selected based on previous studies on propolis and other natural matrices, as they allow effective recovery of phenolic compounds while minimizing the risk of thermal degradation of antioxidants. After maceration, samples were centrifuged at 10,000× g for 10 min (Thermo Scientific™ Heraeus™ Multifuge™ X3/X3F; Thermo Fisher Scientific, Waltham, MA, USA), and the supernatants were collected in 10 mL volumetric flasks for subsequent analyses.
This extraction protocol was chosen to maximize phenolic recovery while avoiding thermal degradation of antioxidant compounds. A schematic representation of the extraction process is shown in Figure 1.

2.4. Physicochemical Characterization

The moisture content was determined by oven drying at 105 °C until constant weight, according to AOAC method 925.10. Ash content was measured by incineration in a muffle furnace at 550 °C for 6 h, following AOAC method 923.03. All measurements were performed in triplicate and results expressed as percentage on a dry weight basis (g/100 g DW).

2.5. Extraction Yield

The extraction yield (%) was calculated gravimetrically by evaporating a known volume of each extract to dryness in pre-weighed vials at 40 °C in a ventilated oven until constant weight. Samples were cooled in a desiccator between drying cycles, and constant weight was defined as a difference of <0.2 mg between successive measurements. Solvent blanks were processed identically, and their residual mass was subtracted. This moderate drying condition (40 °C) was selected as a widely used and reproducible procedure in propolis studies, ensuring solvent removal for gravimetric yield determination without significant compromise of phenolic compounds. The yield was expressed as:
Yield   ( % ) = m a s s   o f   d r i e d   e x t r a c t i n i t i a l   m a s s   o f   p r o p o l i s × 100
Triplicate extractions were performed for each solvent.

2.6. Determination of Total Phenolic Content (TPC)

We quantified total phenolic content (TPC) following the Folin–Ciocalteu assay described by Prgomet et al. [19], with minor adjustments. In practice, 100 μL of extract were combined with 500 μL of diluted Folin–Ciocalteu reagent (1:10) and 400 μL of sodium carbonate (7.5%, w/v). The mixture was kept for 30 min at room temperature in the dark before recording absorbance at 765 nm. Calibration was performed with gallic acid, and the data were reported as mg gallic acid equivalents (GAE) per gram of propolis and per gram of extract.

2.7. Determination of Total Flavonoid Content (TFC)

Total flavonoid content (TFC) was determined using the aluminum chloride colorimetric method, as described by Zhishen et al. [20]. Briefly, 500 μL of extract was mixed with 500 μL of 2% (w/v) AlCl3 solution. After 30 min of incubation at room temperature, the absorbance was measured at 415 nm. Catechin was used as standard, and results were expressed as mg of catechin equivalents (CTE) per gram of propolis and per gram of extract.

2.8. Antioxidant Activity Assays

To assess antioxidant potential, three complementary in vitro methods were employed: DPPH radical scavenging, ABTS radical cation decolorization, and ferric reducing antioxidant power (FRAP). All determinations were carried out in triplicate, and the results expressed as Trolox equivalents per gram of sample (µmol TE/g).
DPPH assay: Free radical scavenging activity was evaluated using the procedure of Brand-Williams et al. [21], with adjustments for sample volume. In brief, 100 μL of extract were mixed with 3.9 mL of 0.06 mM DPPH solution prepared in methanol. The reaction was kept in the dark at room temperature for 30 min, after which absorbance was read at 517 nm.
ABTS assay: The ABTS radical cation was generated as described by Re et al. [22] by combining 7 mM ABTS with 2.45 mM potassium persulfate and allowing the solution to stand in the dark for 12–16 h. Prior to use, the stock was diluted to reach an absorbance of 0.70 ± 0.02 at 734 nm. For analysis, 30 μL of extract were added to 3 mL of the working solution, and absorbance was recorded after 6 min.
FRAP assay: Reducing power was determined following Benzie and Strain [23]. The FRAP reagent consisted of acetate buffer (300 mM, pH 3.6), TPTZ solution (10 mM in 40 mM HCl), and 20 mM FeCl3·6H2O, mixed in a 10:1:1 ratio (v/v/v). A 100 μL aliquot of extract was combined with 3 mL of this reagent and incubated at 37 °C for 30 min. The absorbance of the reaction mixture was then measured at 593 nm.

2.9. Tyrosinase Inhibition Assay

Tyrosinase inhibition was assessed following the method of Prgomet et al. [19], with slight modifications. The reaction mixture contained 40 μL phosphate buffer (0.1 M, pH 6.8), 80 μL L-DOPA (2.5 mM), 40 μL of extract, and 40 μL mushroom tyrosinase (100 U/mL). After incubation at 37 °C for 10 min, the absorbance was measured at 475 nm. Inhibition percentage was calculated using:
Inhibition (%) = (A0 − As)/A0 × 100
is the sample absorbance.

2.10. Elastase Inhibition Assay

Elastase inhibitory activity was evaluated as described by Prgomet et al. [19]. The assay mixture consisted of 25 μL Tris-HCl buffer (0.2 M, pH 8.0), 25 μL of extract, 25 μL of porcine pancreatic elastase (1 U/mL), and 25 μL of N-Succinyl-Ala-Ala-Ala-p-nitroanilide (1 mM). After 30 min at 25 °C, the absorbance was measured at 410 nm. Inhibition percentage was calculated relative to the control.
In this study, the assay was performed at a single concentration of each extract without serial dilutions, as a preliminary screening approach. Under these conditions, the strong pigmentation of propolis and the high inhibitory effect of ethanolic extracts led to absorbance values exceeding the optimal dynamic range of the method, preventing precise quantification. Positive and negative reference inhibitors were not included at this stage but will be incorporated in future studies to enable benchmarking.

2.11. Background Absorbance Correctio N

In both enzyme inhibition assays, background absorbance caused by the natural pigmentation of propolis extracts was corrected by including extract blanks (extract + buffer + enzyme without substrate). The absorbance values of these blanks were subtracted from those of the complete reaction mixtures, ensuring that the reported values reflected only enzymatic activity.

2.12. Statistical Analysis

All experiments were conducted in triplicate. Results are expressed as mean ± standard deviation (SD). Differences among extraction solvents were assessed by one-way analysis of variance (ANOVA), followed by Tukey’s post hoc test, with significance defined at p < 0.05.

3. Results

To investigate the bioactive potential of Portuguese propolis from the Guarda region, we first conducted a preliminary physicochemical characterization. Extracts were then prepared using three solvents with different polarities (ultrapure water, 70% ethanol, and 96% ethanol) to compare their efficiency in recovering phenolic and flavonoid compounds. These extracts were subsequently evaluated for antioxidant activity (DPPH, ABTS, FRAP) and anti-ageing potential through tyrosinase and elastase inhibition assays. In addition, an extract obtained with sunflower oil was prepared to explore its possible application in lipophilic food systems. The following sections present a comparative analysis of the extraction strategies and discuss their functional and technological implications.

3.1. Proximate Composition Analysis

Ash and moisture contents of Sample 1 (Portuguese propolis, Guarda) were determined as part of the initial characterization [24]. Ash content represents the inorganic fraction and is linked to mineral composition, while moisture reflects the water content, which directly influences storage stability and microbial safety [1,2].
As shown in Table 1, Sample 1 exhibited a low ash content (0.64 ± 0.01%), which is below values previously reported for other Portuguese propolis (Sample 2: 1.90 ± 0.02%) and for propolis from central inland Portugal (1.3–4.2%) [4,8,25]. These results are closer to those observed for Galician propolis (0.31–0.81%) [4]. Low ash values have been associated with higher resin purity [2,6], a feature that is often correlated with greater phenolic content and enhanced biological activity [4,5,26].
Moisture content in Sample 1 (5.90 ± 0.17%) was slightly higher than previous reports for the region (3.6–4.5%) [4,8]. According to Bankova et al. [2] and Martinello & Mutinelli [1], moisture levels above ~8% can accelerate microbial growth and enzymatic degradation of bioactives. Values below this threshold, such as those observed here, are generally acceptable for long-term storage without significant spoilage risk.
From a technological perspective, both parameters are valuable quality indicators. A high resin-to-ash ratio is desirable for food and pharmaceutical applications [3,12], while controlled moisture levels help preserve phenolic and flavonoid integrity during storage [26,27]. This favorable physicochemical profile may partly explain the high phenolic and flavonoid levels observed in subsequent analyses.

3.2. Efficiency of Extraction

The efficiency of solvent extraction is a critical determinant of bioactive recovery from propolis, as it influences both chemical composition and subsequent biological activity [2,14,28,29]. In this study, Sample 1 was subjected to cold solid–liquid maceration (24 h, constant agitation) under identical conditions, varying only the solvent: ultrapure water, 70% ethanol, and 96% ethanol.
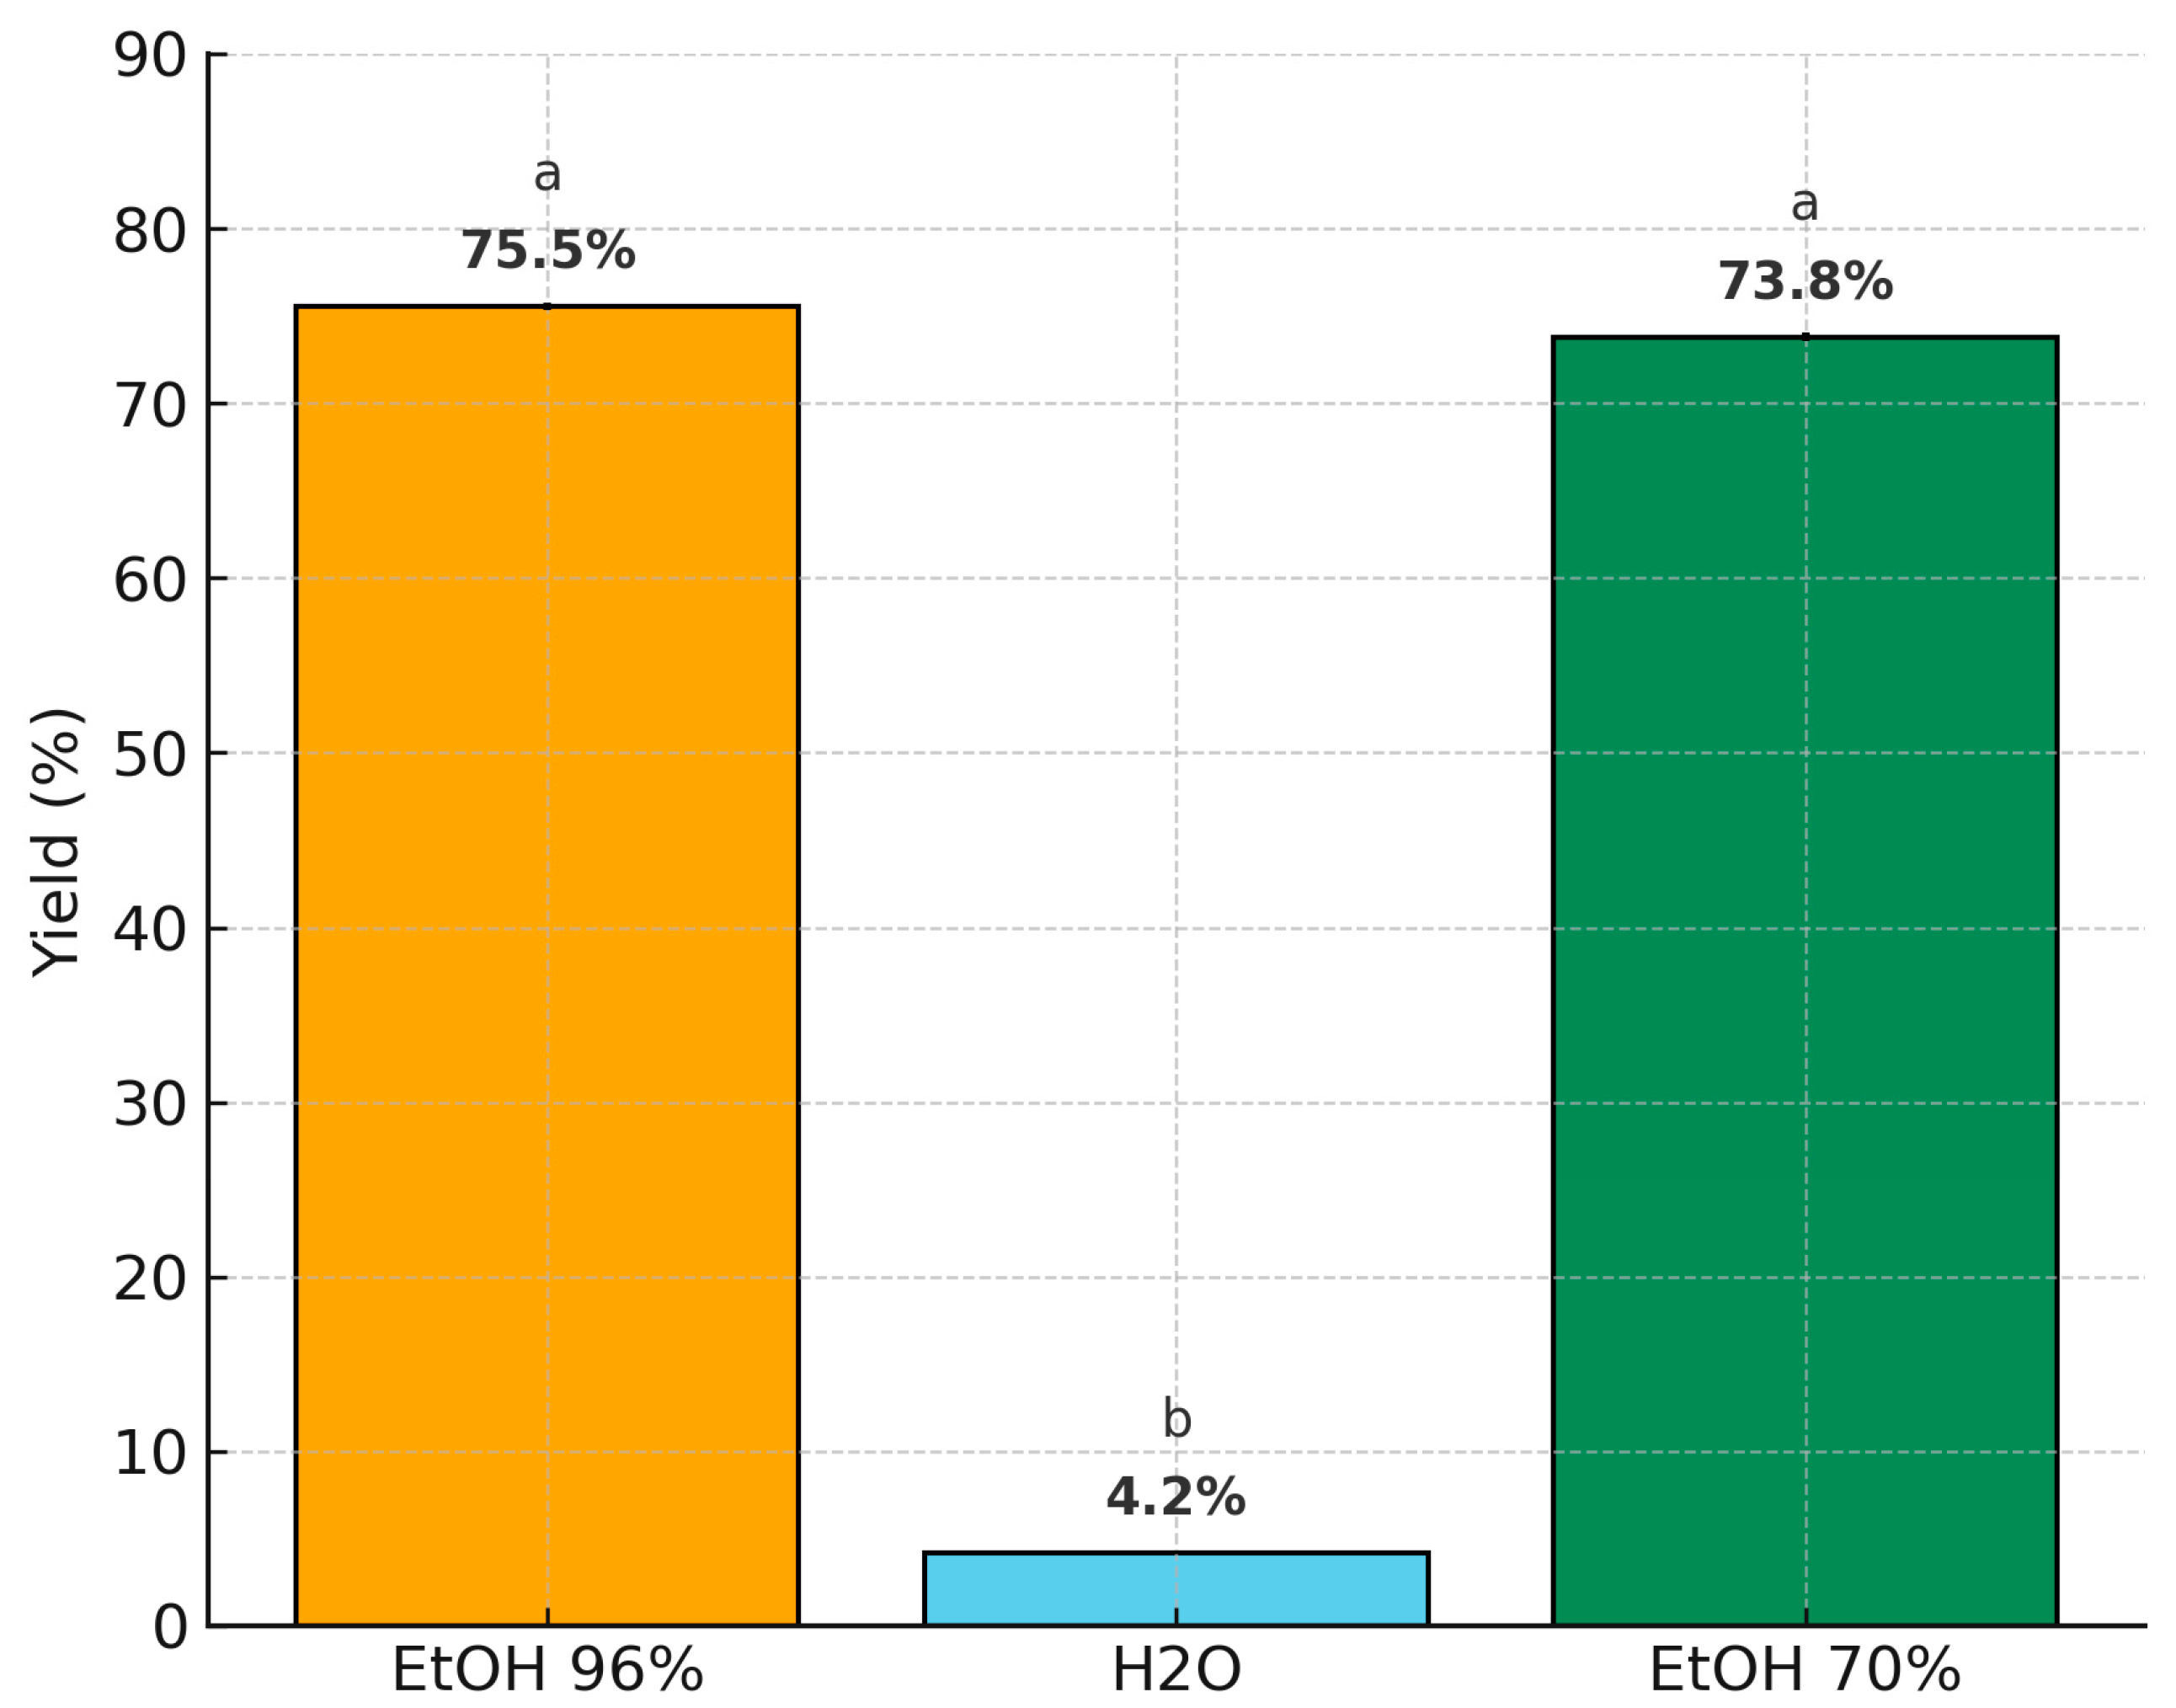
As shown in Figure 2, aqueous extraction yielded only 4.2%, reflecting water’s limited capacity to solubilize the hydrophobic phenolic and flavonoid compounds abundant in propolis [30,31]. In contrast, ethanol-based solvents achieved yields more than 17 times higher: 75.5% for 96% ethanol and 73.8% for 70% ethanol, with no statistically significant difference between them (p > 0.05). These results are consistent with previous studies on European and tropical propolis, confirming ethanol as a superior extraction medium [4,14,26].
The slightly higher yield with 96% ethanol may be linked to enhanced recovery of lipophilic constituents such as flavonoid aglycones and terpenoids [6,29]. By contrast, the intermediate polarity of 70% ethanol favours a broader spectrum of bioactives, including moderately polar phenolics [14,30], which may be advantageous for multifunctional applications in food and pharmaceutical formulations.
Although aqueous extraction can recover highly polar compounds such as sugars and proteins—potentially contributing to niche bioactivities—these extracts generally display lower antioxidant capacity [31]. This difference in chemical profile will be further reflected in the TPC, TFC, and antioxidant activity results presented in subsequent sections.
The chemical profile of propolis is shaped by multiple factors, including botanical origin, geographic location, and harvest season [2,4,29]. Solvent polarity plays a decisive role not only in extraction yield but also in the range of phytochemicals recovered. Consistent with prior reports, both hydroethanolic and absolute ethanolic extractions in this study exceeded 70% yield, while aqueous extraction reached only 4.2% [14,29,30].
Water remains a biocompatible and low-cost option for certain applications, but its ability to extract phenolic-rich fractions from propolis is limited [29,32], largely because many active constituents are poorly soluble in water [2,14].
Extraction temperature is another influential parameter. Elevated temperatures can improve mass transfer and shorten extraction time, but may also degrade thermosensitive phenolics [33,34,35,36,37,38]. Studies using subcritical water extraction have demonstrated that this technique can enhance phenolic recovery but also alter antioxidant profiles due to thermal degradation [39]. Furthermore, high extraction temperatures are commonly associated with thermal degradation of phenolics, compromising yield and bioactivity [40]. In this study, extractions were conducted at ambient temperature to preserve antioxidant integrity, supporting their potential use in food systems.The relatively high yields obtained with ethanol-based solvents (>70%) can also be explained by co-extraction of waxes and resinous fractions, as no dewaxing or winterization step was performed prior to gravimetric determination. Therefore, the yields reported here represent the total ethanol-soluble fraction of propolis. Methodological differences across studies, especially regarding wax removal, may account for the lower values often reported in the literature. Future studies should incorporate a dewaxing step to distinguish resin-rich from total yields, thus improving comparability. It should also be emphasized that extraction yield is strongly influenced by the botanical and geographic origin of propolis, as well as by the presence of variable amounts of wax and resins. Therefore, differences across studies are expected, and the present results should be interpreted as comparative indicators of solvent efficiency rather than absolute values of phenolic recovery.
Beyond this, the present study did not aim to optimize extraction parameters such as solvent ratio or maceration time. Instead, standardized conditions were applied to ensure comparability between solvents. Future studies employing experimental design approaches (e.g., response surface methodology) could further refine these parameters to maximize recovery and improve process scalability.
Finally, oven drying at 40 °C was applied solely for gravimetric determination of extraction yield. This procedure is generally considered adequate for this purpose; however, freeze-drying could represent a valuable alternative to further preserve thermosensitive compounds. Future studies should explore this approach when extracts are intended for subsequent chemical or bioactivity analyses.

3.3. Phenolic Composition of Propolis

Phenolic compounds such as flavonoids are widely recognized as the principal bioactive constituents of propolis, underpinning much of its antioxidant, antimicrobial, and anti-inflammatory potential [41,42,43]. Their abundance is shaped by a complex interplay between botanical origin, geographical location, seasonal factors, and, critically, the polarity of the extraction solvent [44,45]. In this study, the total phenolic content (TPC) and total flavonoid content (TFC) of Portuguese propolis (Sample 1) were quantified after extraction with solvents of markedly different polarity—ultrapure water, 70% ethanol, and 96% ethanol—allowing direct comparison of their compositional efficiency.
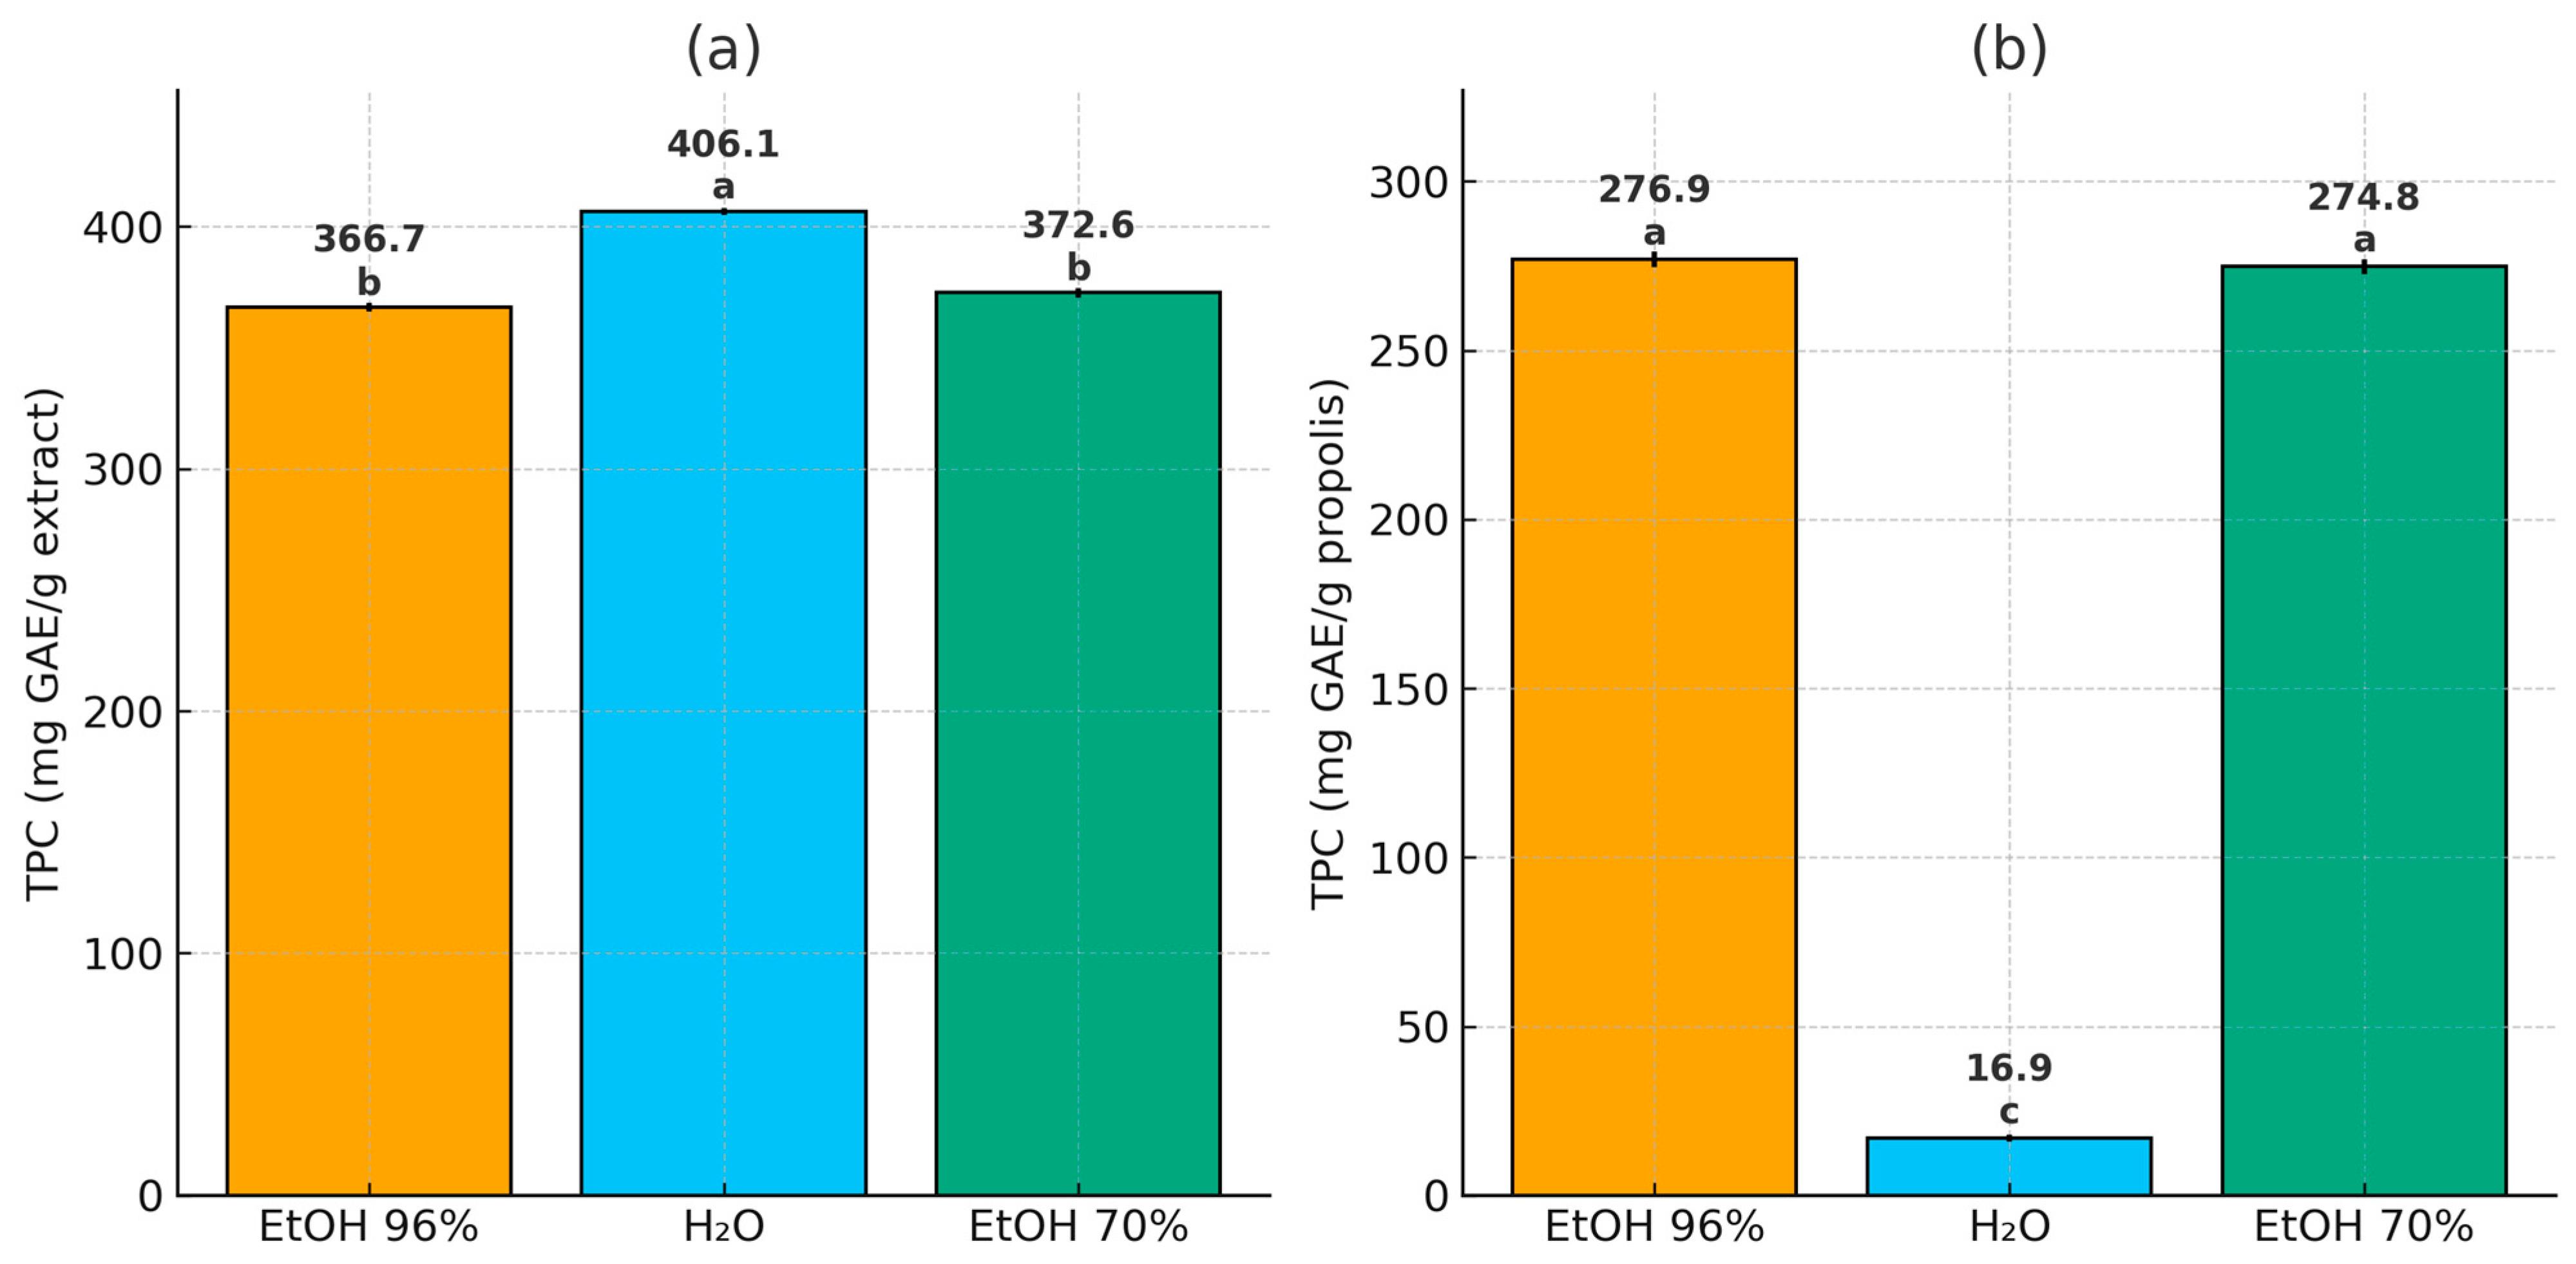
The results revealed a clear advantage for ethanol-based extractions (Figure 3). When expressed per gram of propolis, TPC reached 276.9 ± 0.99 mg GAE/g for 96% ethanol and 274.8 ± 2.41 mg GAE/g for 70% ethanol, while the aqueous extract contained only 16.9 ± 0.10 mg GAE/g. When normalized to extract mass, values remained high for ethanol (366.7 ± 1.14 mg GAE/g for 96% and 372.6 ± 2.81 mg GAE/g for 70%), whereas the water extract appeared artificially enriched (406.1 ± 0.49 mg GAE/g extract) due to the concentration effect of its intrinsically low extraction yield.
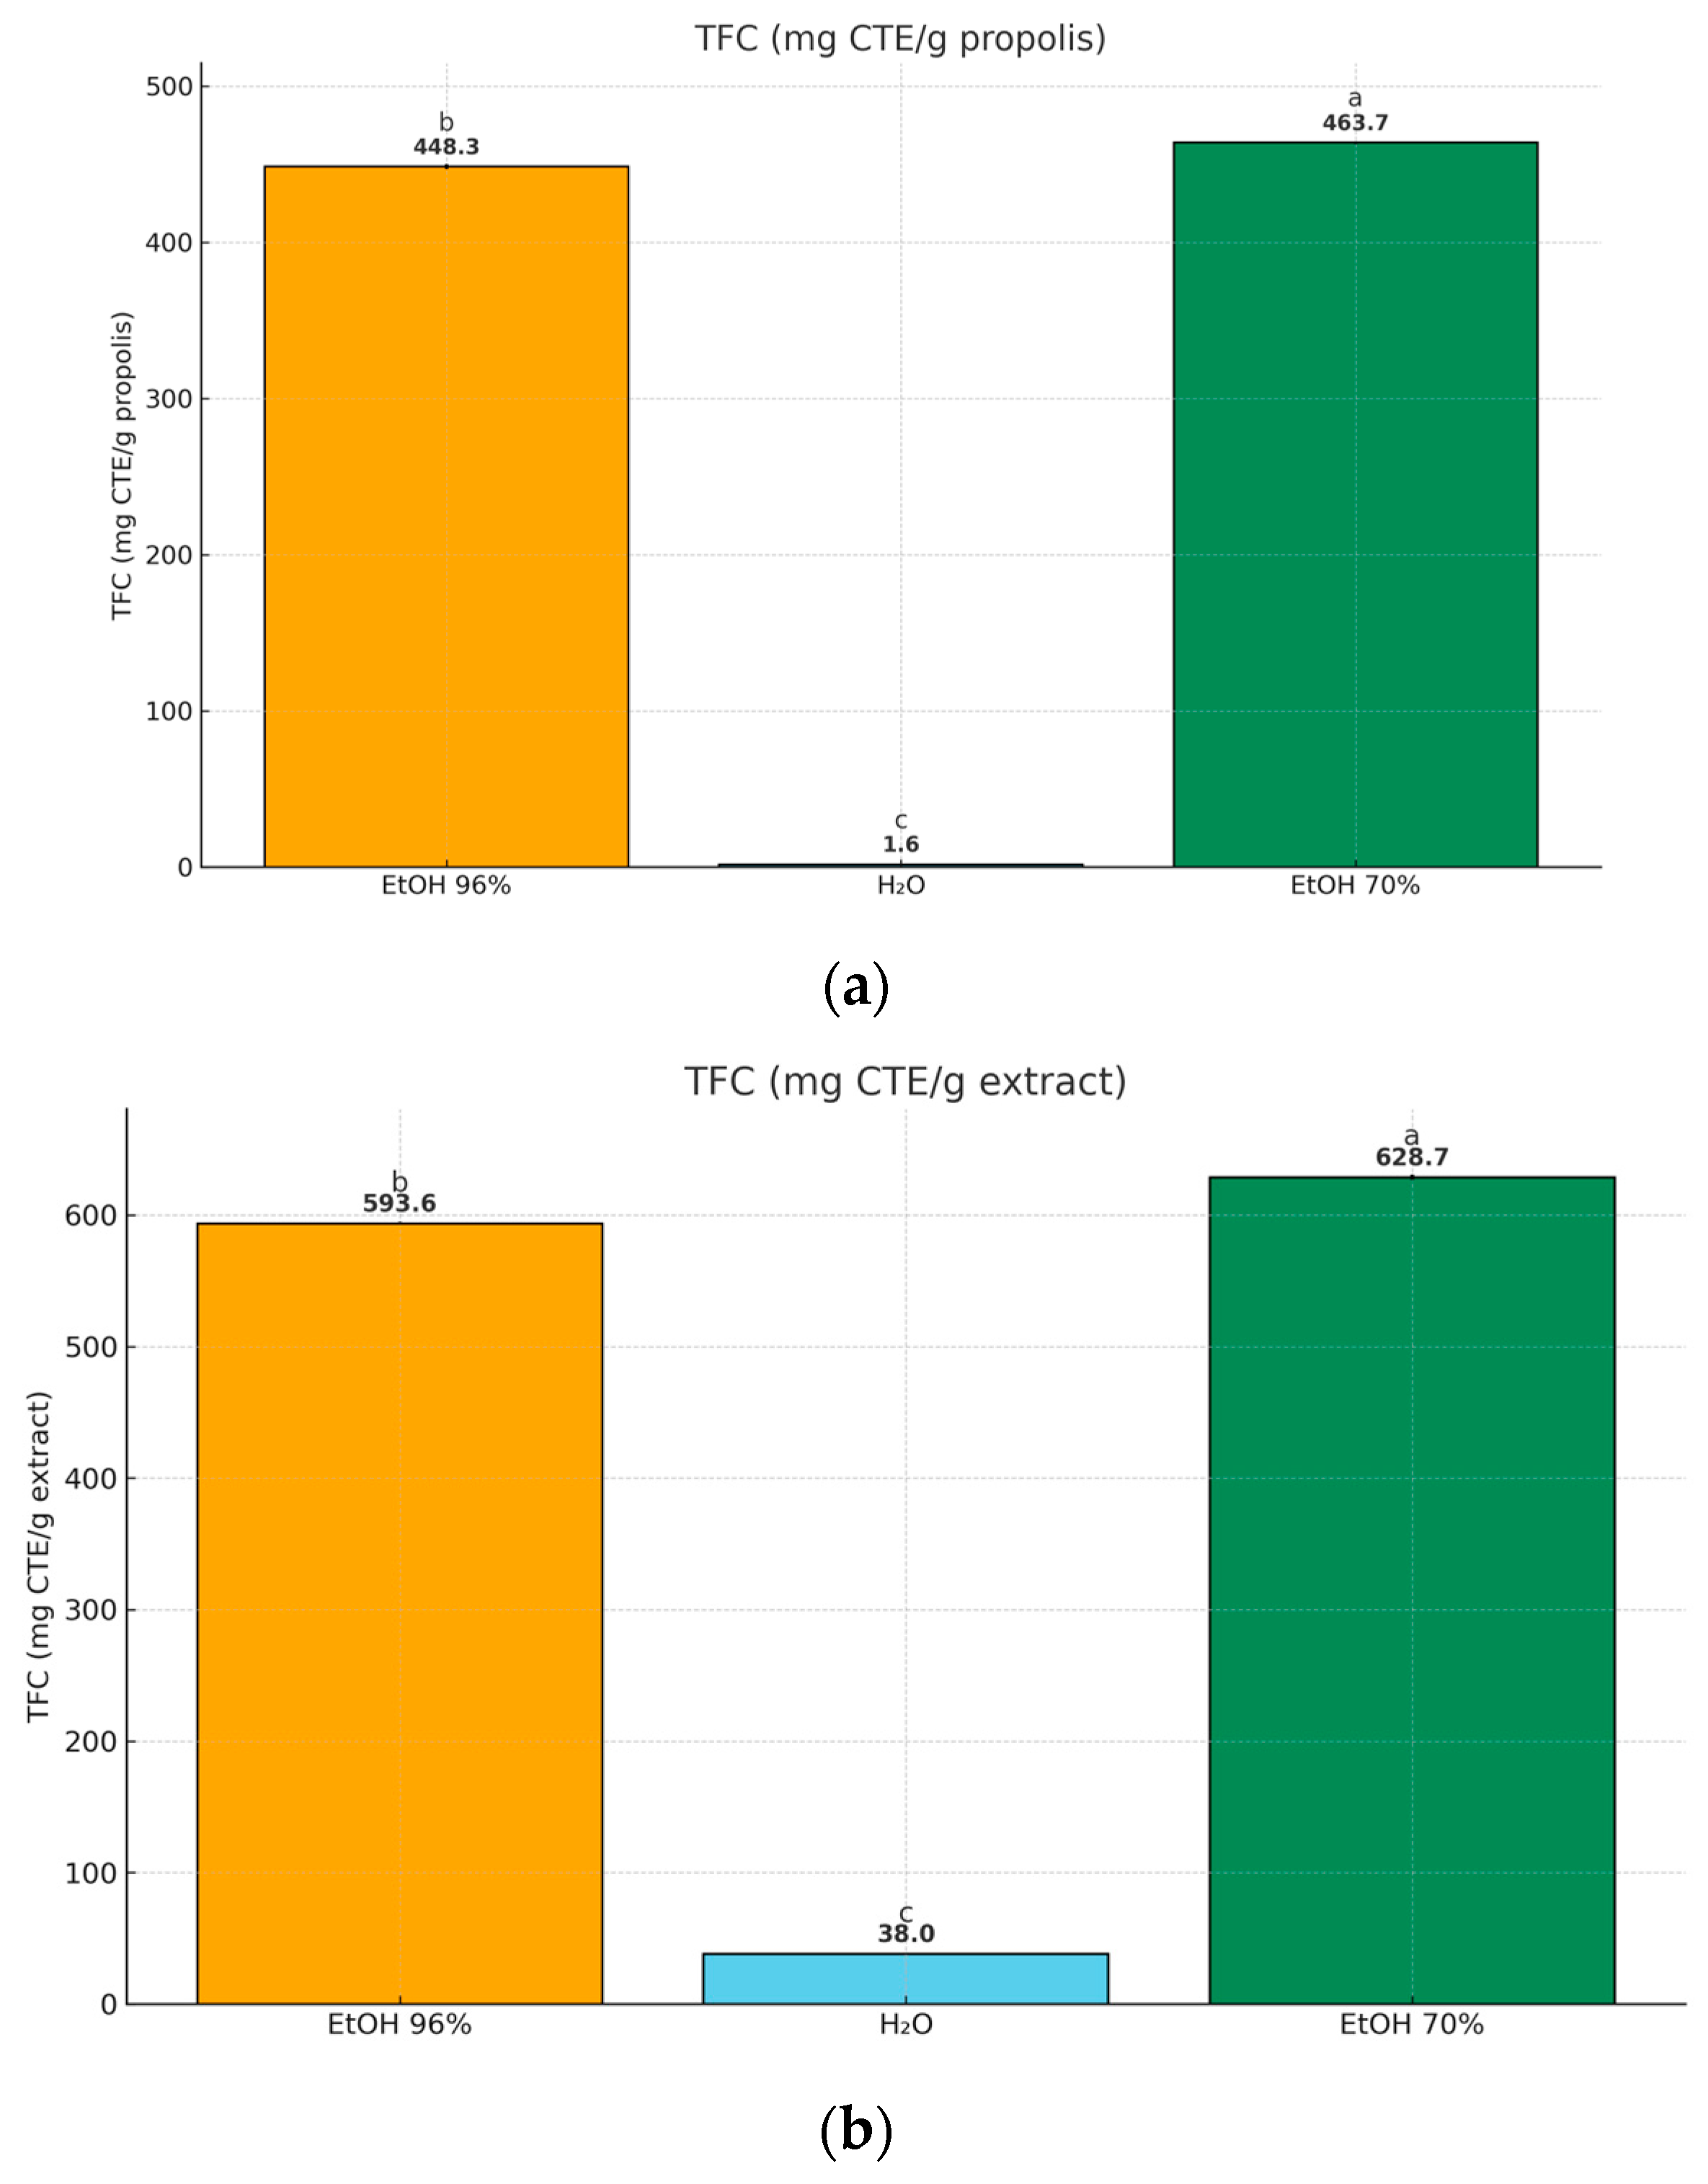
A parallel trend was observed for TFC (Figure 4). Per gram of propolis, the 70% ethanol extract yielded the highest flavonoid content (463.7 ± 0.93 mg CTE/g), slightly exceeding 96% ethanol (448.3 ± 1.61 mg CTE/g), whereas water recovered only 1.6 ± 0.07 mg CTE/g. On a per-extract basis, 70% ethanol again led (628.7 ± 1.87 mg CTE/g extract), followed by 96% ethanol (593.6 ± 1.07 mg CTE/g extract) and water (38.0 ± 0.33 mg CTE/g extract). These patterns confirm that ethanol—particularly at 70% concentration—optimizes recovery of a broader spectrum of flavonoids, including glycosylated derivatives and moderately polar compounds, while 96% ethanol is more selective for lipophilic aglycones [14,30].
A strong linear correlation was observed between TPC and TFC (R2 = 0.9951), suggesting that flavonoids represent a substantial proportion of the total phenolic pool in these extracts. Similar relationships have been reported for Iranian, Anatolian, and Bulgarian propolis [46,47,48,49,50]. However, since the present analysis was based on only three solvent conditions, these results should be regarded as exploratory rather than definitive. For the Portuguese propolis evaluated here, this trend indicates that its antioxidant potential is likely flavonoid-driven and highlights hydroethanolic extraction as an efficient strategy for recovering these compounds.
When placed in a broader comparative framework, the phenolic and flavonoid levels of this Portuguese sample position it among the richest propolis extracts of European origin reported to date. For example, Falcão et al. [26] reported a TPC of 291 ± 0.1 mg GAE/g for propolis from Portugal extracted with 80% ethanol, in close agreement with our findings. Comparable high values have also been documented for propolis from northwestern Spain [51,52], Brazil [30], Malaysia [30], and Australian stingless bee propolis [53], all consistently demonstrating the superior efficiency of ethanol over water in recovering these bioactive fractions.
Collectively, these results highlight that hydroethanolic extraction, particularly at 70% ethanol, offers the optimal balance of polarity to maximize phenolic and flavonoid recovery. This compositional richness underpins the strong antioxidant profile of Portuguese propolis and supports its potential application in functional foods, nutraceuticals, and cosmetic formulations.
Beyond the strong TPC–TFC association, the exploratory correlation analysis (Figure 5) also reveals that both parameters are highly correlated with antioxidant capacity as measured by DPPH, ABTS, and FRAP assays. This convergence across independent analytical methods strengthens the evidence that phenolics—particularly flavonoids—are the main contributors to the antioxidant profile of Portuguese propolis. Although the small number of extracts evaluated limits the statistical conclusiveness, the consistency of these relationships across all assays supports the interpretation that hydroethanolic extraction maximizes the recovery of bioactive compounds responsible for antioxidant performance. These findings are in full agreement with previous observations for Portuguese and other European propolis [26,30,53], reinforcing their functional relevance for potential food, nutraceutical, and cosmetic applications.

3.4. Anti-Aging Activity of Propolis

Natural bioactive compounds with anti-aging potential have attracted growing interest for cosmetic, dermatological, and nutraceutical applications. In particular, propolis polyphenols have been associated with the inhibition of skin-aging enzymes such as tyrosinase and elastase, thereby modulating pigmentation and preserving skin structural integrity. The following assays were performed to assess the inhibitory effects of Sample 1 extracts against these enzymes.

3.4.1. Tyrosinase Inhibition Assay

Tyrosinase is a copper-containing enzyme responsible for catalyzing the first two steps of melanin biosynthesis and plays a central role in skin pigmentation. Beyond its physiological role in protecting against ultraviolet radiation, excessive tyrosinase activity is associated with hyperpigmentation disorders such as melasma, lentigines, and post-inflammatory pigmentation [54,55]. Several studies have also highlighted the importance of natural tyrosinase inhibitors from propolis and other natural matrices, which support its relevance in biomedical and industrial research [56,57,58,59].In the food industry, tyrosinase is also implicated in enzymatic browning, which negatively affects the sensory and nutritional quality of plant-derived products [60,61]. Consequently, tyrosinase inhibitors have relevance in both cosmetic and food preservation applications.
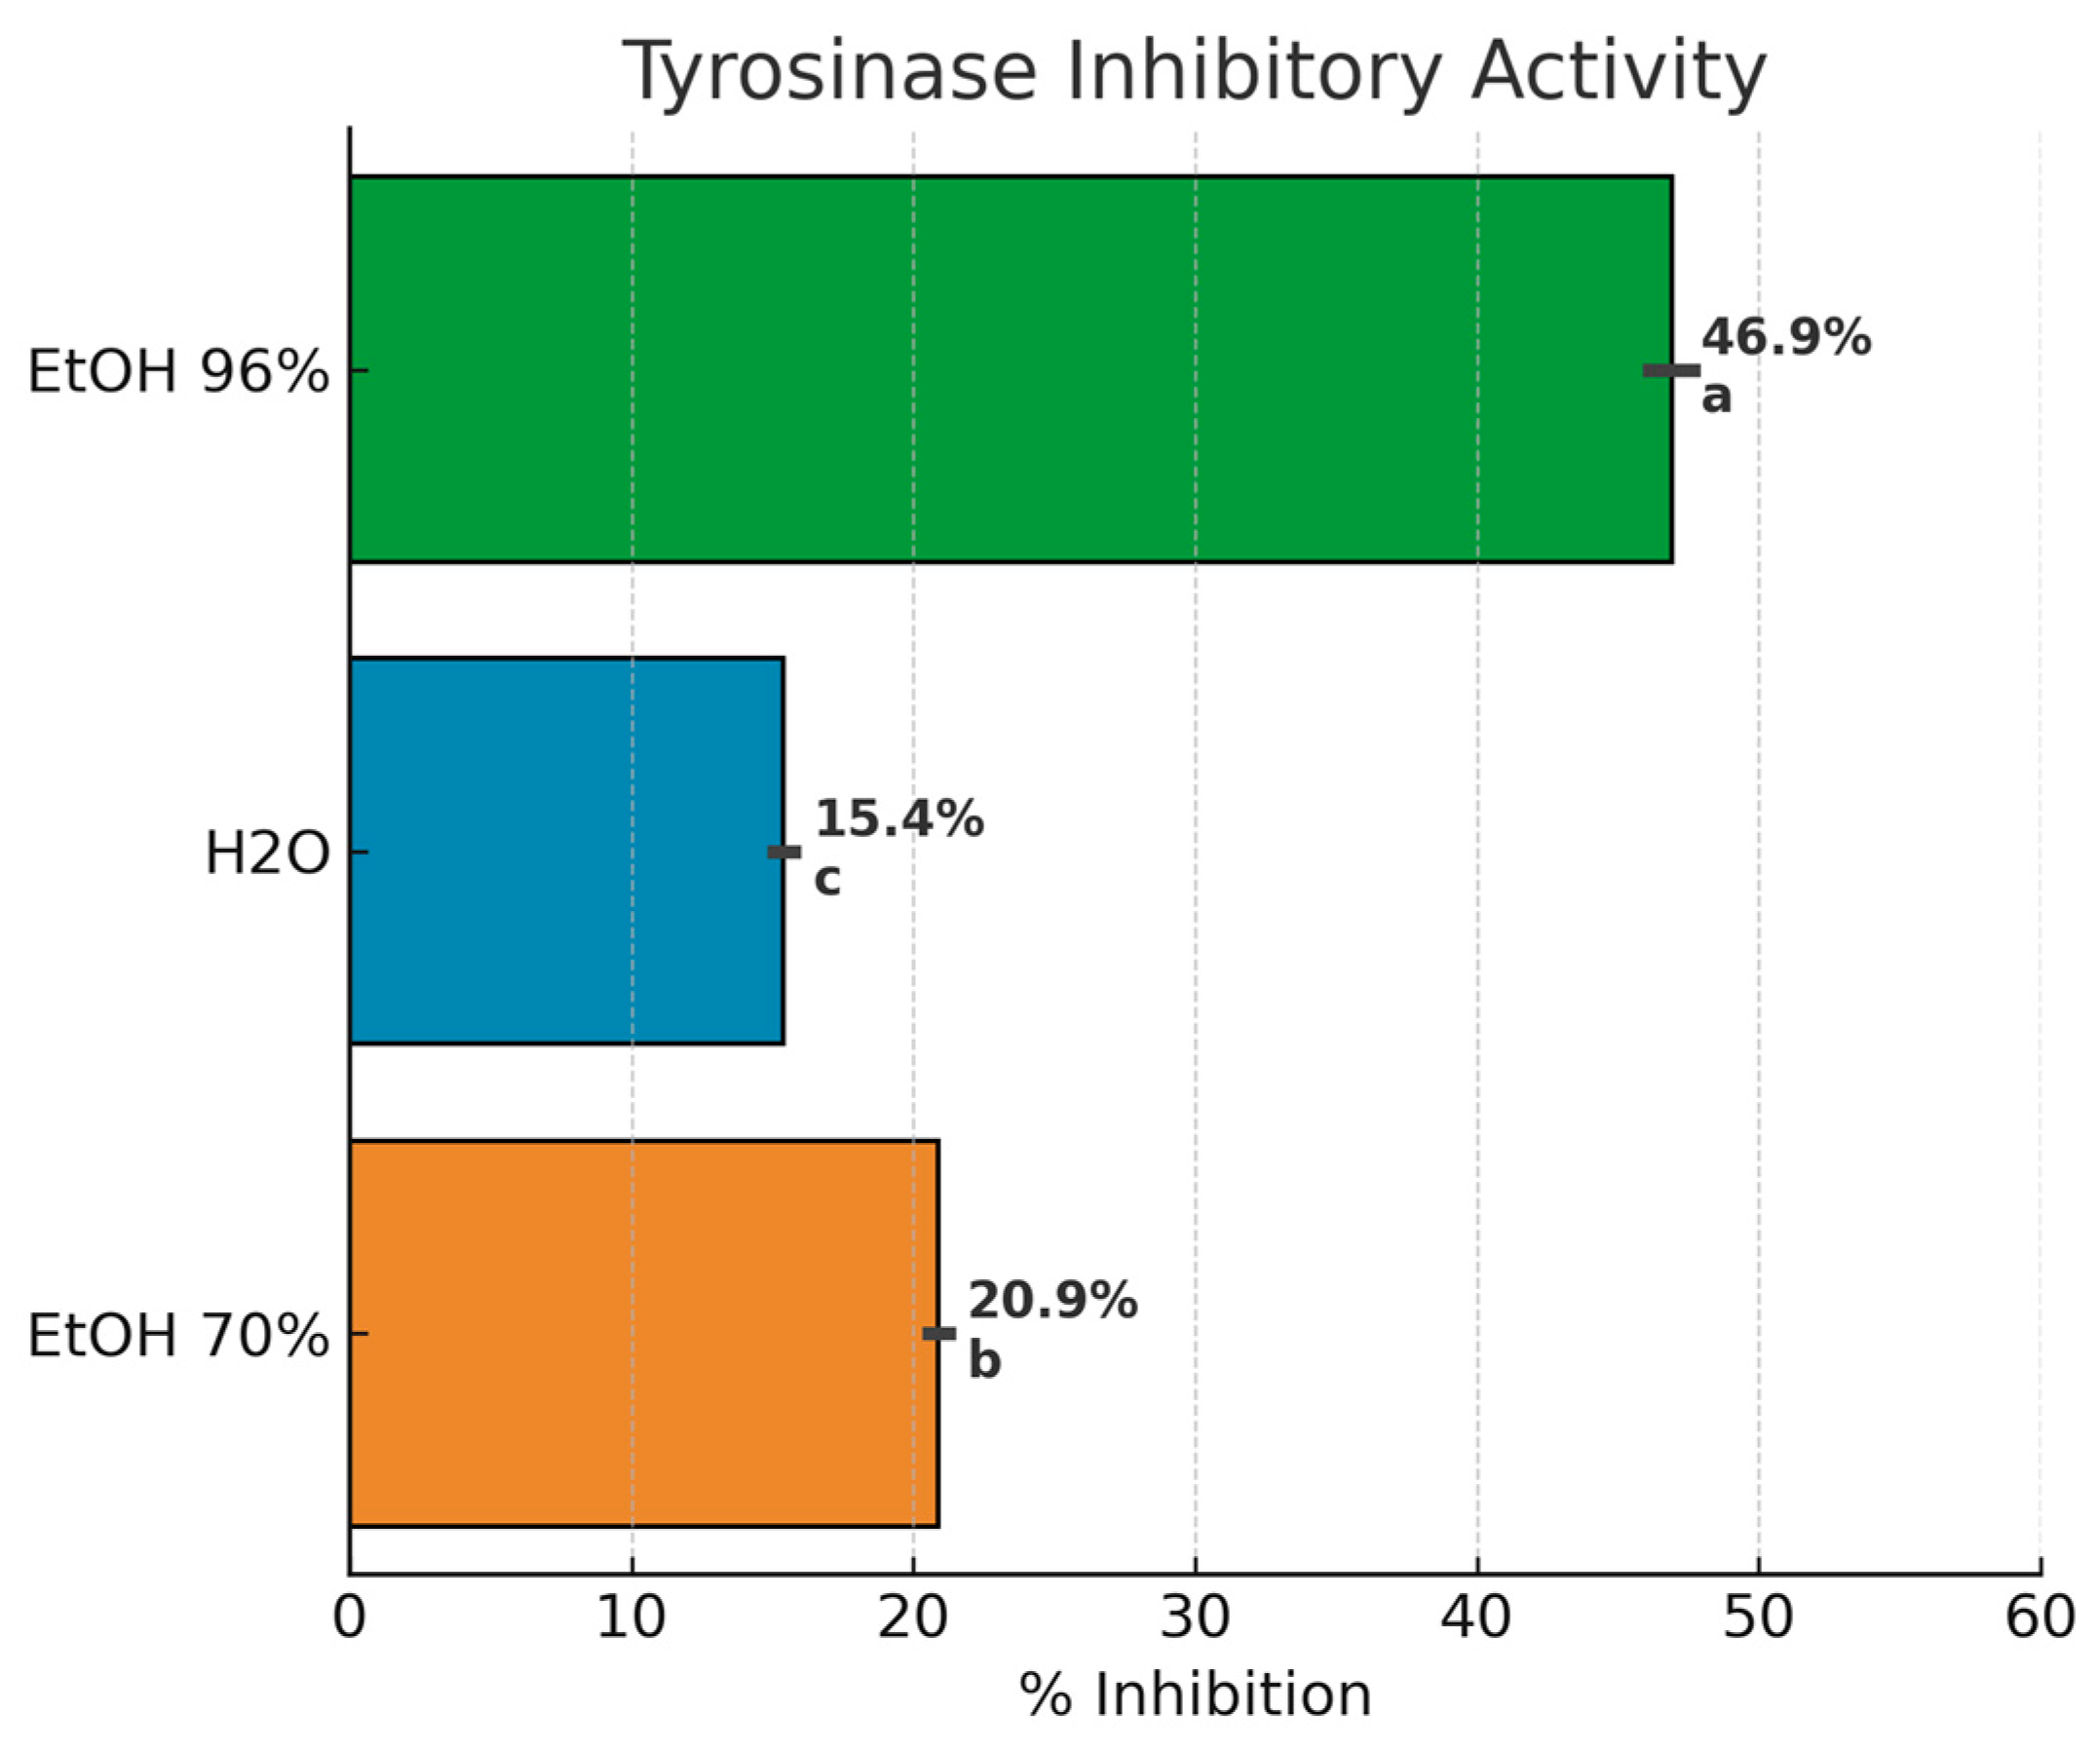
The inhibitory capacity of Sample 1 extracts was assessed, and results are presented in Figure 5. The 96% ethanol extract exhibited the highest inhibition (46.9 ± 0.9%), markedly higher than the 70% ethanol (20.9 ± 1.6%) and aqueous extracts (15.4 ± 1.19%). These results suggest that more lipophilic compounds—likely enriched in the 96% ethanol extract—contribute substantially to tyrosinase inhibition.
Although limited, existing literature supports the involvement of flavonoids and other phenolics as key tyrosinase inhibitors. Greek propolis samples rich in flavonoids exhibited inhibition values between 40.14% and 56.66%, while terpenoid-rich samples reached 68.46–85.69% [62]. Moroccan propolis showed high inhibitory potential, with IC50 values as low as 0.037 mg/mL, attributed to copper chelation by ortho-dihydroxylated flavonoids [63]. Deniz et al. (2021) also reported >50% inhibition for ethanolic propolis extracts, with IC50 values near 170 µg/mL [64].
Given the high flavonoid content of Sample 1, the observed tyrosinase inhibition is consistent with its phenolic profile. However, as the present assay was conducted at a single extract concentration, further work with standardized concentrations is required to enable direct comparison with literature IC50 values and to confirm the dose–response relationship.
These findings are summarized in Figure 6, which clearly illustrates the superior tyrosinase inhibitory activity of the 96% ethanol extract compared to the 70% ethanol and aqueous extracts. This visual representation reinforces the conclusion that the lipophilic phenolic fraction, particularly flavonoids, plays a dominant role in the tyrosinase inhibition capacity of Portuguese propolis.
To date, relatively few studies have specifically examined the tyrosinase inhibitory activity of propolis extracts. In one study, 20 Greek propolis samples were evaluated, and the highest inhibition levels were reported in terpenoid-rich extracts (68.46–85.69% at 200 µg/mL), while flavonoid-rich samples displayed intermediate inhibition (40.14–56.66%) [62]. Similarly, a study on 21 Moroccan propolis samples identified two extracts with remarkably high tyrosinase inhibition, showing IC50 values of 0.050 mg/mL and 0.037 mg/mL. Interestingly, a negative correlation was observed between IC50 and total polyphenol content, suggesting a copper-chelation mechanism involving the ortho-dihydroxyl groups of catechol-type flavonoids at the enzyme’s active site [63].
Deniz et al. (2021) further reported that ethanolic propolis extracts exhibited IC50 values around 169.70 ± 2.96 µg/mL, corresponding to inhibition above 50% (64.38 ± 2.89%) [64]. These findings support the role of flavonoids as potent tyrosinase inhibitors, as their hydroxyl groups in the A and B rings facilitate Cu2+ chelation, thereby blocking enzymatic activity [65].
In the present study, the tyrosinase inhibition values for Sample 1—particularly in ethanolic extracts—are consistent with the range reported for flavonoid-rich propolis. However, because our measurements were obtained from single extract concentrations, direct IC50 comparisons with literature data are not possible. Further assays using standardized concentrations are required to confirm potency and elucidate structure–activity relationships.

3.4.2. Elastase Inhibition Assay

Elastase is a serine protease responsible for degrading key extracellular matrix proteins such as elastin, collagen, and fibronectin, which are critical for maintaining skin elasticity and structural integrity. Excessive elastase activity is associated with dermal aging, wrinkle formation, and loss of skin firmness. Additionally, dysregulation of elastase has been linked to pigmentary disorders, including urticaria pigmentosa and age-related hyperpigmentation [63,66]. Additional studies have also emphasized the role of elastase inhibition in preventing skin aging and hyperpigmentation, reinforcing its importance as a therapeutic and cosmetic target [67].
The study of elastase inhibition by propolis extracts is relatively recent, and literature reports remain scarce. Deniz et al. (2021) evaluated ethanolic propolis extracts and reported an elastase inhibition of 45.43 ± 5.22%, highlighting their potential anti-aging relevance [64].
In the present work, elastase inhibition by Sample 1 extracts was evaluated following the same methodological principles applied in the tyrosinase assay. However, repeated assays revealed that all tested concentrations—particularly ethanolic extracts—consistently produced inhibition levels above the assay control (Tris-HCl buffer). Serial dilutions of the extracts were performed to adjust activity within the assay’s dynamic range, yet the inhibition remained above control levels in all replicates. Although this prevented the precise quantification of inhibition, the results indicate substantial elastase inhibitory potential, particularly for the 96% ethanol extract.
From an application perspective, the anti-aging activity of the Sample 1 propolis extracts—demonstrated by both tyrosinase and elastase inhibition—suggests potential for use as a natural ingredient in cosmetic formulations aimed at pigmentation control and maintenance of skin elasticity. In the food industry, similar bioactivity could be explored for biopreservation purposes, contributing to the extension of product shelf life [54,55,60].
It is important to note that the bioactivity of propolis is influenced by factors such as geographical origin, botanical source, climate conditions, and harvest time. In this study, the Sample 1 propolis was collected one month after production and stored under refrigeration, which may have contributed to the favorable anti-aging activity observed.
These results are illustrated in Figure 7, which highlights the markedly higher elastase inhibition observed for the 96% ethanol extract compared with the 70% ethanol and aqueous extracts. This visual evidence further supports the potential of hydroethanolic extractions, particularly at higher ethanol concentrations, to maximize the anti-aging activity of Portuguese propolis.

3.5. Overall Interpretation of Bioactivity

The evaluation of Sample 1 propolis extracts demonstrated a consistent relationship between chemical composition and biological activity. Hydroethanolic solvents, particularly 70% and 96% ethanol, maximized extraction efficiency, yielding extracts rich in phenolic compounds and flavonoids. These compositional characteristics were directly reflected in the strong antioxidant capacity observed across all three assays (DPPH, ABTS, FRAP), with correlation coefficients (R2) above 0.95 linking both total phenolic content (TPC) and total flavonoid content (TFC) to antioxidant performance.
In addition to antioxidant activity, the anti-aging potential of the extracts was confirmed by significant inhibition of tyrosinase and elastase, enzymes implicated in skin pigmentation and extracellular matrix degradation, respectively. The 96% ethanol extract exhibited the highest inhibition for both enzymes, while 70% ethanol extracts also demonstrated notable activity. This pattern reinforces the contribution of flavonoid-rich phenolic profiles to the bioactivity of propolis.
Taken together, these results highlight Sample 1 as a potent natural source of multifunctional bioactive compounds with potential applications in cosmetic formulations targeting hyperpigmentation and skin aging, as well as in the development of natural antioxidants for food preservation. While compositional variability due to geographic and seasonal factors is well-documented in propolis, the present findings underscore the capacity of inland Portuguese propolis to deliver high-value bioactivities when extracted under optimized solvent conditions.
Despite these promising results, some methodological limitations should be acknowledged. The tyrosinase inhibition assay was performed at a single concentration and without positive controls, and the elastase assay was also conducted at a single concentration without dilution series or reference inhibitors. In both cases, the results should therefore be regarded as exploratory, aimed primarily at comparing solvent-dependent trends. In the elastase assay, the strong pigmentation of propolis extracts and the high inhibitory effect of ethanolic solvents led to absorbance values exceeding the assay’s linear dynamic range, preventing precise quantification. Future studies should include reference inhibitors (e.g., kojic acid, azelaic acid for tyrosinase; oleanolic acid, ursolic acid for elastase), as well as dilution strategies and dose–response curves with IC50 values, to ensure accurate quantification and enable robust comparison with the literature.

4. Conclusions

This study demonstrated that Portuguese propolis from the Guarda region is a rich source of bioactive phenolic and flavonoid compounds, with particularly high antioxidant and anti-aging potential. Extraction efficiency and bioactivity were strongly influenced by solvent polarity, with hydroethanolic solutions—especially 70% ethanol—providing the highest recovery of phenolics and flavonoids, as well as superior antioxidant performance in DPPH, ABTS, and FRAP assays. A strong positive correlation was found between phenolic content, flavonoid content, and antioxidant capacity, indicating that the antioxidant potential of this propolis is largely flavonoid-driven.
Notably, the ethanolic extracts exhibited significant tyrosinase and elastase inhibitory activities, underscoring their potential for cosmetic applications, particularly in skin-whitening and anti-aging formulations. Their combined antioxidant and antimicrobial properties also suggest promising uses in the food industry, for example in natural preservation strategies to extend shelf life, and in the pharmaceutical sector, where propolis-based formulations could serve as adjuncts in oxidative stress-related conditions. Nonetheless, incorporation into final products generally requires further processing steps, such as lyophilization, encapsulation, or formulation adjustments, as widely reported in the literature.
Overall, the results highlight the technological relevance of Portuguese propolis, particularly ethanolic extracts, as multifunctional natural ingredients. Future research should focus on scaling up extraction processes, exploring green extraction technologies, and validating these functional properties in real food, cosmetic, and pharmaceutical matrices to expand their commercial and industrial applicability.

Author Contributions

Methodology, S.P.; Formal analysis, A.P.S.N.; Investigation, S.P.; Resources, A.N.B.; Data curation, S.P.; Writing—original draft, A.P.S.N. and A.N.B.; Writing—review & editing, A.P.S.N., C.V. and A.N.B.; Visualization, C.V.; Supervision, C.V. and A.N.B.; Project administration, A.N.B.; Funding acquisition, A.N.B. All authors have read and agreed to the published version of the manuscript.

Funding

This work is supported by National Funds by FCT –Portuguese Foundation for Science and Technology, under the projects UID/04033/2023: Centre for the Research and Technology of Agro-Environmental and Biological Sciences and LA/P/0126/2020 (https://doi.org/10.54499/LA/P/0126/2020).

Institutional Review Board Statement

Not applicable.

Informed Consent Statement

Not applicable.

Data Availability Statement

The data presented in this study are available from the corresponding author upon reasonable request.

Conflicts of Interest

The authors declare no conflicts of interest.

References

  1. Martinello, M.; Mutinelli, F. Antioxidant activity in bee products: A review. Antioxidants 2021, 10, 71. [Google Scholar] [CrossRef]
  2. Bankova, V.S.; Popova, M.; Trusheva, B. Propolis: Recent advances in chemistry and plant origin. Apidologie 2020, 52, 68–82. [Google Scholar] [CrossRef]
  3. El-Sakhawy, M.; Salama, A.; Mohamed, S.A.A. Applications of propolis in food industries and packaging. Biomass Conv. Bioref. 2024, 14, 13731–13746. [Google Scholar] [CrossRef]
  4. Miguel, M.G.; Nunes, S.; Dandlen, S.A.; Cavaco, A.M.; Antunes, M.D. Phenols and antioxidant activity of hydro-alcoholic extracts of propolis from Algarve, South of Portugal. Food Chem. Toxicol. 2010, 48, 3418–3423. [Google Scholar] [CrossRef]
  5. Tumbarski, Y.; Ivanov, I.; Todorova, M.; Apostolova, S.; Tzoneva, R.; Nikolova, K. Phenolic content, antioxidant activity and in vitro anti-inflammatory and antitumor potential of selected Bulgarian propolis samples. Biomedicines 2025, 13, 334. [Google Scholar] [CrossRef] [PubMed]
  6. Bankova, V.; Popova, M.; Trusheva, B. Propolis volatile compounds: Chemical diversity and biological activity: A review. Chem. Cent. J. 2014, 8, 28. [Google Scholar] [CrossRef] [PubMed]
  7. Moreira, L.; Dias, L.G.; Pereira, J.A.; Estevinho, L. Antioxidant properties, total phenols and pollen analysis of propolis samples from Portugal. Food Chem. Toxicol. 2008, 46, 3482–3485. [Google Scholar] [CrossRef]
  8. Oliveira, R.D.; Celeiro, S.P.; Barbosa-Matos, C.; Freitas, A.S.; Cardoso, S.M.; Viana-Pereira, M.; Almeida-Aguiar, C.; Baltazar, F. Portuguese propolis antitumoral activity in melanoma involves ROS production and induction of apoptosis. Molecules 2022, 27, 3533. [Google Scholar] [CrossRef]
  9. Justino, I.A.; Furlan, J.P.R.; Ferreira, I.R.S.; Marincek, A.; Aldana-Mejía, J.A.; Tucci, L.F.F.; Bastos, J.K.; Stehling, E.G.; Marzocchi-Machado, C.M.; Marcato, P.D. Antimicrobial, antioxidant, and anticancer effects of nanoencapsulated Brazilian red propolis extract: Applications in cancer therapy. Processes 2024, 12, 2856. [Google Scholar] [CrossRef]
  10. Shin, S.-B.; Lee, J.-K.; Ko, M.-J. Enhanced extraction of bioactive compounds from propolis (Apis mellifera L.) using subcritical water. Sci. Rep. 2023, 13, 15038. [Google Scholar] [CrossRef]
  11. Segueni, N.; Boutaghane, N.; Asma, S.T.; Tas, N.; Acaroz, U.; Arslan-Acaroz, D.; Shah, S.R.A.; Abdellatieff, H.A.; Akkal, S.; Peñalver, R.; et al. Review on Propolis Applications in Food Preservation and Active Packaging. Plants 2023, 12, 1654. [Google Scholar] [CrossRef]
  12. Maicelo Quintana, J.L.; Reyna Gonzales, K.; Balcázar Zumaeta, C.R.; Auquinivin Silva, E.A.; Castro Alayo, E.M.; Medina Mendoza, M. Potential application of bee products in the food industry. Heliyon 2024, 10, e24056. [Google Scholar] [CrossRef]
  13. Santiago, K.B.; Rodrigues, J.C.Z.; Conte, F.L.; Tasca, K.I.; Romagnoli, G.G.; Aldana Mejía, J.A.; Bastos, J.K.; Sforcin, J.M. Brazilian red propolis exerts selective cytotoxic activity against prostate cancer cells and modulates human monocyte functions. Phytother. Res. 2022, 36, 399–409. [Google Scholar] [CrossRef]
  14. Aboulghazi, A.; Bakour, M.; Fadil, M.; Lyoussi, B. Simultaneous optimization of extraction yield, phenolic compounds and antioxidant activity of Moroccan propolis extracts: Improvement of ultrasound-assisted technique using response surface methodology. Processes 2022, 10, 297. [Google Scholar] [CrossRef]
  15. Bhadange, Y.A.; Carpenter, J.; Saharan, V.K. A comprehensive review on advanced extraction techniques for natural products. ACS Omega 2024, 9, 7150–7165. [Google Scholar] [CrossRef]
  16. Barreto, G.A.; Viana, L.C.; Costa, R.V.; Rocha, J.C.; Justino, I.A. Evaluation of Brazilian red propolis extracts by supercritical CO2 extraction. Appl. Sci. 2022, 12, 11741. [Google Scholar] [CrossRef]
  17. Bouarab Chibane, L.; Degraeve, P.; Ferhout, H.; Bouajila, J.; Oulahal, N. Plant antimicrobial polyphenols as potential natural food preservatives. J. Sci. Food Agric. 2019, 99, 1457–1474. [Google Scholar] [CrossRef] [PubMed]
  18. Monroy, Y.M.; Salazar, G.; Ramírez, J.; Quintero, L.; Díaz, F.; Marín, M.L. Supercritical fluid extraction of red propolis: Optimization and antioxidant potential. Molecules 2024, 29, 284. [Google Scholar] [CrossRef]
  19. Prgomet, I.; Gonçalves, B.; Domínguez-Perles, R.; Santos, R.; Saavedra, M.J.; Aires, A.; Pascual-Seva, N.; Barros, A. Irrigation deficit turns almond by-products into a valuable source of antimicrobial (poly) phenols. Ind. Crops Prod. 2019, 132, 186–196. [Google Scholar] [CrossRef]
  20. Zhishen, J.; Mengcheng, T.; Jianming, W. The determination of flavonoid contents in mulberry and their scavenging effects on superoxide radicals. Food Chem. 1999, 64, 555–559. [Google Scholar] [CrossRef]
  21. Brand-Williams, W.; Cuvelier, M.E.; Berset, C. Use of a free radical method to evaluate antioxidant activity. LWT—Food Sci. Technol. 1995, 28, 25–30. [Google Scholar] [CrossRef]
  22. Re, R.; Pellegrini, N.; Proteggente, A.; Pannala, A.; Yang, M.; Rice-Evans, C. Antioxidant activity applying an improved ABTS radical cation decolorization assay. Free Radic. Biol. Med. 1999, 26, 1231–1237. [Google Scholar] [CrossRef]
  23. Benzie, I.F.F.; Strain, J.J. The ferric reducing ability of plasma (FRAP) as a measure of “antioxidant power”: The FRAP assay. Anal. Biochem. 1996, 239, 70–76. [Google Scholar] [CrossRef]
  24. AOAC. Official Methods of Analysis of AOAC International, 21st ed.; AOAC International: Gaithersburg, MD, USA, 2019. [Google Scholar]
  25. Nascimento, A.P.S.; Carvalho, A.J.D.B.A.; Lima, M.D.S.; Barros, S.L.; Ribeiro, S.; Pasqualli, M.; Lisboa, H.M.; Barros, A.N. Enhancing antioxidant retention through varied wall material combinations in grape spray drying and storage. Antioxidants 2023, 12, 1745. [Google Scholar] [CrossRef] [PubMed]
  26. Falcão, S.I.; Vale, N.; Gomes, P.; Freire, C.; Fernandes, E.; Cunha, A.; Almeida-Aguiar, C. Phenolic Profiling of Portuguese Propolis by LC-MS Spectrometry: Uncommon Propolis Rich in Flavonoid Glycosides. Phytochem. Anal. 2013, 24, 309–318. [Google Scholar] [CrossRef]
  27. Breda, C.; Catarino, M.D.; Ferreira, R.B.; Silva, A.M. Phenolic composition and antioxidant activity of edible flowers: Insights from synergistic effects and multivariate analysis. Antioxidants 2025, 14, 282. [Google Scholar] [CrossRef]
  28. Buitrago, D.M.; Perdomo, S.J.; Silva, F.A.; Cely-Veloza, W.; Lafaurie, G.I. Physicochemical characterization, antioxidant, and proliferative activity of Colombian propolis extracts: A comparative study. Molecules 2024, 29, 1643. [Google Scholar] [CrossRef] [PubMed]
  29. Wang, G.; Zhang, Y.; Qiao, J.; El-Seedi, H.R.; Kong, L.; Zhang, H. Inhibitory effects of aqueous ethanol extracts of poplar-type propolis on advanced glycation end products and protein oxidation. Foods 2024, 13, 3022. [Google Scholar] [CrossRef] [PubMed]
  30. Yusof, N.; Abdul Munaim, M.S.; Veloo Kutty, R. Effects of Different Ethanol Concentrations on Total Phenolic and Flavonoid Contents in Malaysian Propolis. IOP Conf. Ser. Mater. Sci. Eng. 2020, 991, 012033. [Google Scholar] [CrossRef]
  31. Park, Y.K.; Ikegaki, M. Preparation of Water and Ethanolic Extracts of Propolis and Evaluation of Their Antioxidant Activities. Biosci. Biotechnol. Biochem. 1998, 62, 2230–2232. [Google Scholar] [CrossRef]
  32. Miłek, M.; Bonikowski, R.; Dżugan, M. Effect of extraction conditions on the chemical profile of raw poplar-type propolis extract. Chem. Pap. 2024, 78, 6709–6720. [Google Scholar] [CrossRef]
  33. Balasubramaniam, A.K.; Elangovan, A.; Abdul Rahman, M.; Nayak, S.; Swain, D.; Parasur Babu, H.; Narasimhan, A.; Monga, V. Propolis: A comprehensive review on nature’s polyphenolic wonder. Fitoterapia 2025, 183, 106526. [Google Scholar] [CrossRef]
  34. Pereira, L.; Cunha, A.; Almeida-Aguiar, C. Portuguese propolis from Caramulo as a biocontrol agent of apple blue mold. Food Control. 2022, 139, 109071. [Google Scholar] [CrossRef]
  35. Kubiliene, L.; Laugaliene, V.; Pavilonis, A.; Maruska, A.; Majiene, D.; Barcauskaite, K.; Kubilius, R.; Kasparaviciene, G.; Savickas, A. Alternative preparation of propolis extracts: Comparison of their composition and biological activities. BMC Complement. Altern. Med. 2015, 15, 156. [Google Scholar] [CrossRef]
  36. Ma, S.; Ma, H.; Pan, Z.; Luo, L.; Weng, L. Antioxidant activities of propolis extracts by different solvents in vitro. Zhongguo Shipin Xuebao 2016, 16, 53–58. [Google Scholar]
  37. Daud, N.M.; Putra, N.R.; Jamaludin, R.; Norodin, N.S.M.; Sarkawi, N.S.; Hamzah, M.H.S.; Nasir, H.M.; Abang Zaidel, D.N.; Che Yunus, M.A.; Md Salleh, L. Valorisation of plant seeds as natural bioactive compounds by various extraction methods: A review. Trends Food Sci. Technol. 2022, 119, 201–214. [Google Scholar] [CrossRef]
  38. Sarkar, A.; Ghosh, U. Classical single factor optimisation of parameters for phenolic antioxidant extraction from tamarind seed (Tamarindus indica). Plant Sci. Today 2016, 3, 258–266. Available online: https://horizonepublishing.com/journals/index.php/PST/article/view/242 (accessed on 7 June 2025). [CrossRef]
  39. Niazmand, R.; Shahidi Noghabi, M.; Niazmand, A. Optimization of subcritical water extraction of phenolic compounds from Ziziphus jujuba using response surface methodology: Evaluation of thermal stability and antioxidant activity. Chem. Biol. Technol. Agric. 2021, 8, 6. [Google Scholar] [CrossRef]
  40. Antony, A.; Farid, M. Effect of Temperatures on Polyphenols during Extraction. Appl. Sci. 2022, 12, 2107. [Google Scholar] [CrossRef]
  41. De Aguiar, S.C.; Cottica, S.M.; dos Santos, S.T.; da Fonseca, J.M.; da Silva Leite, L.; da Silva, M.L. Antioxidant activity, phenolic acid, and flavonoid composition of an antiseptic ointment based on aloe and green propolis and its potential for preventing mastitis in dairy cows. Vet. Sci. 2025, 12, 248. [Google Scholar] [CrossRef]
  42. Pobiega, K.; Kot, A.M.; Przybył, J.L.; Synowiec, A.; Gniewosz, M. Comparison of the chemical composition and antioxidant properties of propolis from urban apiaries. Molecules 2023, 28, 6744. [Google Scholar] [CrossRef]
  43. Silva, A.M.; Rocha, B.; Moreira, M.M.; Delerue-Matos, C.; das Neves, J.; Rodrigues, F. Biological Activity and Chemical Composition of Propolis Extracts with Potential Use in Vulvovaginal Candidiasis Management. Int. J. Mol. Sci. 2024, 25, 2478. [Google Scholar] [CrossRef]
  44. Ruiz Ruiz, J.C.; Pacheco López, N.A.; Rejón Méndez, E.G.; Samos López, F.A.; Medina Medina, L.; Quezada-Euán, J.J.G. Phenolic Content and Bioactivity as Geographical Classifiers of Propolis from Stingless Bees in Southeastern Mexico. Foods 2023, 12, 1434. [Google Scholar] [CrossRef] [PubMed]
  45. Kurek-Górecka, A.; Rzepecka-Stojko, A.; Górecki, M.; Stojko, J.; Sosada, M.; Świerczek-Zięba, G. Structure and Antioxidant Activity of Polyphenols Derived from Propolis. Molecules 2014, 19, 78–101. [Google Scholar] [CrossRef] [PubMed]
  46. Karagecili, H.; Yılmaz, M.A.; Ertürk, A.; Kiziltas, H.; Güven, L.; Alwasel, S.H.; Gulcin, İ. Comprehensive Metabolite Profiling of Berdav Propolis Using LC-MS/MS: Determination of Antioxidant, Anticholinergic, Antiglaucoma, and Antidiabetic Effects. Molecules 2023, 28, 1739. [Google Scholar] [CrossRef]
  47. Kurek-Górecka, A.; Kara, Y.; Pokajewicz, K.; Ben Hammouda, I.; Wieczorek, P.P.; Marciniak, D.; Balwierz, R.; Kłósek, M.; Czuba, Z.P.; Kolaylı, S. Phenolic Content, Volatile Compounds and Antioxidant Activity in Propolis Samples Collected from Turkey and Poland. Eur. Food Res. Technol. 2025, 251, 2199–2210. [Google Scholar] [CrossRef]
  48. Izol, E.; Turhan, M. Detailed Phytochemical Profile by LC-MS/MS, Mineral Content by ICP-MS, and In Vitro Antioxidant, Antidiabetic, Antiepileptic, Anticholinergic and Antiglaucoma Properties of Bitlis Propolis. Life 2024, 14, 1389. [Google Scholar] [CrossRef]
  49. Fathi Hafshejani, S.; Lotfi, S.; Rezvannejad, E.; Mortazavi, M.; Riahi-Madvar, A. Correlation between Total Phenolic and Flavonoid Contents and Biological Activities of 12 Ethanolic Extracts of Iranian Propolis. Food Sci. Nutr. 2023, 11, 4308–4325. [Google Scholar] [CrossRef]
  50. Altuntaş, Ü.; Güzel, İ.; Özçelik, B. Phenolic Constituents, Antioxidant and Antimicrobial Activity and Clustering Analysis of Propolis Samples Based on PCA from Different Regions of Anatolia. Molecules 2023, 28, 1121. [Google Scholar] [CrossRef]
  51. Hossain, R.; Quispe, C.; Khan, R.A.; Saikat, A.S.M.; Ray, P.; Ongalbek, D.; Yeskaliyeva, B.; Jain, D.; Smeriglio, A.; Trombetta, D.; et al. Propolis: An Update on Its Chemistry and Pharmacological Applications. Chin. Med. 2022, 17, 100. [Google Scholar] [CrossRef]
  52. Rendueles, E.; Mauriz, E.; Sanz-Gómez, J.; González Paramás, A.M.; Vallejo Pascual, M.-E.; Adanero Jorge, F.; García Fernández, C. Biochemical Profile and Antioxidant Properties of Propolis from Northern Spain. Foods 2023, 12, 4337. [Google Scholar] [CrossRef]
  53. Woods, D.C.; Olsson, M.A.; Heard, T.A.; Wallace, H.M.; Tran, T.D. Quality Assessment and Chemical Diversity of Australian Propolis from Tetragonula carbonaria and Tetragonula hockingsi Stingless Bees. Sci. Rep. 2025, 15, 17928. [Google Scholar] [CrossRef]
  54. Kim, Y.-J.; Uyama, H. Tyrosinase Inhibitors from Natural and Synthetic Sources: Structure, Inhibition Mechanism and Perspective for the Future. Cell. Mol. Life Sci. 2005, 62, 1707–1723. [Google Scholar] [CrossRef]
  55. Lee, J.-Y.; Choi, H.-J.; Chung, T.-W.; Kim, C.-H.; Jeong, H.-S.; Ha, K.-T. Caffeic Acid Phenethyl Ester Inhibits Alpha-Melanocyte Stimulating Hormone-Induced Melanin Synthesis through Suppressing Transactivation Activity of Microphthalmia-Associated Transcription Factor. J. Nat. Prod. 2013, 76, 1399–1405. [Google Scholar] [CrossRef]
  56. Ferreira, I.C.; Baptista, P.; Vilas-Boas, M.; Barros, L. Free-Radical Scavenging Capacity and Reducing Power of Wild Edible Mushrooms from Northeast Portugal: Individual Cap and Stipe Activity. Food Chem. 2007, 100, 1511–1516. [Google Scholar] [CrossRef]
  57. Acito, M.; Varfaj, I.; Brighenti, V.; Cengiz, E.C.; Rondini, T.; Fatigoni, C.; Russo, C.; Pietrella, D.; Pellati, F.; Bartolini, D.; et al. A Novel Black Poplar Propolis Extract with Promising Health Promoting Properties: Focus on Its Chemical Composition, Antioxidant, Anti-Inflammatory, and Antigenotoxic Activities. Food Funct. 2024, 15, 4983–4999. [Google Scholar] [CrossRef]
  58. Mohtar, L.G.; Messina, G.A.; Bertolino, F.A.; Pereira, S.V.; Raba, J.; Nazareno, M.A. Comparative Study of Different Methodologies for the Determination of the Antioxidant Activity of Venezuelan Propolis. Microchem. J. 2020, 158, 105244. [Google Scholar] [CrossRef]
  59. Can, Z.; Kara, Y.; Kolayli, S.; Çakmak, I. Antioxidant Activity and Phenolic Composition of Propolis from Marmara Region, Turkey. J. Apic. Res. 2022, 61, 542–548. [Google Scholar] [CrossRef]
  60. Xie, L.-P.; Chen, Q.-X.; Huang, H.; Wang, H.-Z.; Zhang, R.-Q. Inhibitory Effects of Some Flavonoids on the Activity of Mushroom Tyrosinase. Biochemistry 2003, 68, 487–491. [Google Scholar] [CrossRef] [PubMed]
  61. Fan, M.; Ding, H.; Zhang, G.; Hu, X.; Gong, D. Relationships of Dietary Flavonoid Structure with Its Tyrosinase Inhibitory Activity and Affinity. LWT 2019, 107, 25–34. [Google Scholar] [CrossRef]
  62. Stavropoulou, M.-I.; Stathopoulou, K.; Cheilari, A.; Benaki, D.; Gardikis, K.; Chinou, I.; Aligiannis, N. NMR Metabolic Profiling of Greek Propolis Samples: Comparative Evaluation of Their Phytochemical Compositions and Investigation of Their Anti-Ageing and Antioxidant Properties. J. Pharm. Biomed. Anal. 2021, 194, 113814. [Google Scholar] [CrossRef] [PubMed]
  63. El-Guendouz, S.; Aazza, S.; Lyoussi, B.; Antunes, M.D.; Faleiro, M.L.; Miguel, M.G. Anti-Acetylcholinesterase, Antidiabetic, Anti-Inflammatory, Antityrosinase and Antixanthine Oxidase Activities of Moroccan Propolis. Int. J. Food Sci. Technol. 2016, 51, 1762–1773. [Google Scholar] [CrossRef]
  64. Deniz, F.S.S.; Orhan, I.E.; Duman, H. Profiling Cosmeceutical Effects of Various Herbal Extracts through Elastase, Collagenase, Tyrosinase Inhibitory and Antioxidant Assays. Phytochem. Lett. 2021, 45, 171–183. [Google Scholar] [CrossRef]
  65. Kim, D.; Park, J.; Kim, J.; Han, C.; Yoon, J.; Kim, N.; Seo, J.; Lee, C. Flavonoids as Mushroom Tyrosinase Inhibitors: A Fluorescence Quenching Study. J. Agric. Food Chem. 2006, 54, 935–941. [Google Scholar] [CrossRef]
  66. Majdi, F.; Alizadeh Behbahani, B.; Barzegar, H.; Mehrnia, M.A. Active packaging coating based on Lepidium sativum seed mucilage and propolis extract: Preparation, characterization, and application for buffalo meat preservation. PLoS ONE 2024, 19, e0311802. [Google Scholar] [CrossRef]
  67. Yong, H.; Liu, J. Active packaging films and edible coatings based on polyphenol-rich propolis extract: A review. Compr. Rev. Food Sci. Food Saf. 2021, 20, 2106–2145. [Google Scholar] [CrossRef] [PubMed]
Figure 1. Schematic overview of the extraction procedure for obtaining the bioactive compounds contained in first propolis sample in three different solvents (EtOH 96%, H2O and EtOH 70%) at room temperature.
Applsci 15 09928 g001
Figure 2. Extraction yield (%) of Portuguese propolis (Sample 1) obtained with 96% ethanol, 70% ethanol, and water. Values are expressed as mean ± SD (n = 3). Different letters above the bars indicate significant differences among solvents (one-way ANOVA followed by Tukey’s test, p < 0.05).
Applsci 15 09928 g002
Figure 3. Total phenolic content (TPC) of Portuguese propolis (Sample 1) extracted with different solvents: (a) TPC expressed as mg gallic acid equivalents (GAE) per gram of extract; (b) TPC expressed as mg GAE per gram of raw propolis. Bars represent mean ± standard deviation (n = 3). Different letters indicate statistically significant differences among groups (p < 0.05), based on one-way ANOVA followed by Tukey’s post hoc test.
Applsci 15 09928 g003
Figure 4. Total flavonoid content (TFC) of Sample 1 (Portuguese propolis, Guarda), determined by the aluminum chloride (AlCl3) method, expressed as: (a) mg catechin equivalents (CTE) per gram of extract; (b) mg CTE per gram of propolis. Values are expressed as mean ± standard deviation (n = 3). Different lowercase letters above the bars indicate statistically significant differences among extraction solvents (one-way ANOVA followed by Tukey’s post hoc test, p < 0.05).
Applsci 15 09928 g004
Figure 5. Pearson correlation matrix between total phenolic content (TPC), total flavonoid content (TFC), and antioxidant activities (DPPH, ABTS, and FRAP assays) of Portuguese propolis (Sample 1). TPC and TFC values are expressed as mg gallic acid equivalents (GAE)/g and mg catechin equivalents (CTE)/g of propolis, respectively; antioxidant activities are expressed as mmol or μmol TEAC/g. Color scale indicates the strength of the correlation.
Applsci 15 09928 g005
Figure 6. Tyrosinase inhibitory activity of Portuguese propolis (Sample 1, Guarda) extracted with 96% ethanol, water, and 70% ethanol, at concentrations of 135.4, 5.0, and 134.1 mg/mL, respectively. Values are expressed as mean ± SD (n = 3). Results correspond to a single tested concentration and should be considered exploratory. Different letters indicate significant differences among solvents (one-way ANOVA followed by Tukey’s test, p < 0.05).
Applsci 15 09928 g006
Figure 7. Elastase inhibitory activity of Portuguese propolis (Sample 1, Guarda) extracted with 96% ethanol, water, and 70% ethanol. Values represent the percentage of inhibition observed at each concentration (mean ± SD, n = 3). Results correspond to a single tested concentration and should be considered exploratory. Different letters indicate significant differences among solvents (one-way ANOVA followed by Tukey’s test, p < 0.05).
Applsci 15 09928 g007
Table 1. Ash and moisture contents (%/g DW) of Portuguese propolis (Sample 1, this study) compared with values reported in the literature (Sample 2).
SampleAsh (%)Moisture (%)
Sample 1 (this study)0.64 ± 0.015.90 ± 0.17
Sample 2 (literature)1.90 ± 0.023.60 ± 0.30
Values for Sample 1 are expressed as mean ± standard deviation (n = 3). Literature data are reported as published by the respective authors.
Disclaimer/Publisher’s Note: The statements, opinions and data contained in all publications are solely those of the individual author(s) and contributor(s) and not of MDPI and/or the editor(s). MDPI and/or the editor(s) disclaim responsibility for any injury to people or property resulting from any ideas, methods, instructions or products referred to in the content.