Article

Tissue Characterization by Ultrasound: Linking Envelope Statistics with Spectral Analysis for Simultaneous Attenuation Coefficient and Scatterer Clustering Quantification

Instituto de Tecnologías Físicas y de la Información, Serrano 144, 28006 Madrid, Spain
*
Author to whom correspondence should be addressed.
Appl. Sci. 2025, 15(18), 9924; https://doi.org/10.3390/app15189924
Submission received: 28 July 2025 / Revised: 4 September 2025 / Accepted: 8 September 2025 / Published: 10 September 2025
(This article belongs to the Special Issue Applications of Ultrasonic Technology in Biomedical Sciences)

Abstract

Featured Application

Multimodal ultrasound imaging using quantitative ultrasound algorithms.

Abstract

This paper proposes the use of quantitative methods for the characterization of tissues by linking, into a single approach, ideas coming from the spectral analysis methods commonly used to determine the attenuation coefficient with the envelope statistics formulation. Initially, the Homodyned K-distribution model used to fit data obtained from ultrasound signal envelopes was reviewed, and the necessary equations to further derive the attenuation coefficient from this model were developed. To test and discuss the performance of these methods, experimental work was conducted in phantoms. To this end, a series of tissue-mimicking materials composed of poly-vinyl alcohol (PVA) loaded with different particles (aluminium, alumina, cellulose) at varying concentrations were manufactured. A single-channel scanning system was employed to analyse these samples. It was verified that quantitative images obtained from the attenuation coefficient and from the scatterer clustering μ parameter (associated with scatterer concentration) effectively discriminate materials exhibiting similar echo envelope patterns, enhancing the information obtained in comparison with the conventional analysis based on B-scans. Additionally, the implementation of quantitative bi-parametric imaging mappings based on both the μ parameter and the attenuation coefficient, as a means to rapidly visualize results and identify areas characterized by specific acoustic features, was also proposed.

1. Introduction

Changes in the acoustic scattering properties of tissues has been correlated with the modification of the physical properties of tissues by disease, as demonstrated in [1] for liver and ocular tissues. Such modifications offer a valuable opportunity to enhance the diagnostic capabilities of ultrasound techniques. In general, these properties exhibit frequency dependence, and their spectral features can provide quantitative information for tissue characterization [2]. However, conventional echo envelope algorithms employed for obtaining B-scan images overlook spectral variations. Consequently, a significant portion of frequency-related information is lost.
To avoid this, substantial efforts have been made to develop methods capable of extracting quantitative information from ultrasound data. These advancements aim to improve conventional B-scan images with additional layers of information concerning the scanned tissues. Several algorithms have attempted to characterize tissue sound attenuation by analysing the spectral content of the waves reflected from different depths [3,4,5]. Moreover, even from commonly used signal envelopes, a deeper statistical analysis of amplitude distribution can provide quantitative information related to tissue state [6]. This statistical analysis relies on the use of various distribution functions such as Rice, Nakagami, or the Homodyned K-distribution, among others [7]. These functions can be fitted to the amplitude distribution of the echoes scattered from tissues. All these approaches provide quantitative information about tissues, which, when combined with the typical B-scan image, can be correlated with their healthy state.
With advancements in hardware processing power, some of these quantitative techniques have been successfully applied under experimental conditions (in vitro and ex vivo). In a dermatological context, these methods have been employed to measure the acoustic properties of human skin [8] and characterize bacterial infections in skin ulcers [9]. The liver has also been a focus of several studies, such as those on fibrosis [10] and fat content [2]. Furthermore, these quantitative methods have been utilized to characterize tumours in rats, both ex vivo and in vivo [11], as well as in cancerous human lymph nodes ex vivo [12], to evaluate the response of breast cancer to chemotherapy [13], and to study prostate cancer [14]. These techniques have more recently been employed in brain tissues, including the induction of brain apoptosis in the developing mammalian brain [15]. Consequently, major ultrasound imaging manufacturers have started incorporating quantitative tissue characterization packages into their devices [16].
The advent of artificial intelligence methods in ultrasound image analysis [17,18,19] can also benefit from quantitative ultrasound techniques. Deep learning-based solutions for tissue characterization have already demonstrated their potential in identifying different tissue structures [17,20,21]. Obtaining prior quantitative information from ultrasound data can enhance the utilization of machine learning and deep learning strategies by enriching the numerical information provided to artificial intelligence algorithms. This pre-processing step is expected to facilitate the automatic detection of pathological tissue features, as AI algorithms could be trained with more information. Consequently, new generations of ultrasound imaging systems are anticipated to provide more than just B-scan images of scanned tissues and Doppler analysis of blood flow.
This paper proposes further advancements in quantitative approaches by merging spectral analysis techniques used for obtaining tissue attenuation characteristics with methodological procedures based on envelope statistics. First, a wideband radio frequency (RF) signal scattered by tissues is split into different frequency components using bandpass filtering. A similar strategy has previously been employed by Bigellow [4] for calculating tissue attenuation based on the spectral content of these components. In our study, we employed this signal split into frequency components to conduct statistical analyses at various frequencies after obtaining the signal envelope. It has been shown that one of the parameters obtained by fitting the envelope of scattering signals to the Homodyned K-distribution (commonly referred to as the μ parameter) provides information about scatterer clustering [22,23]. This clustering can be related to scatterer concentration, although the relation is indirect since the μ parameter depends on acquisition system settings, total attenuation, and the density and spatial organization of scatterers [24]. Additionally, it was demonstrated in this paper that the spatial derivative of another parameter from the same distribution (commonly referred to as the σ parameter) can be correlated with the attenuation coefficient. Consequently, all this information can be visualized as new images superimposed onto ultrasound B-scan images, thereby enriching the understanding of tissue characteristics.
The obtained attenuation coefficient can be complemented with information regarding scatterer clustering using the proposed method. The outcome is a 3-mode image comprising the echo envelope, attenuation, and scatterer clustering. Within this work, the algorithm was applied to ultrasound signals from tissue-mimicking phantoms to evaluate the performance of the method.
This new approach may significantly impact clinical settings where the characterization of backscattering spectral changes [11,12,13,14,15] or the Homodyned K-distribution parameters [9,10] has already proven clinically relevant. These include, among others, dermatological, oncological, and hepatic diseases, in which measuring an additional parameter could further enhance the technique’s sensitivity. Furthermore, the proposed analysis holds potential for application to other pathologies that would benefit from more precise tissue characterization.
The structure of this paper is as follows: first, the mathematical approach utilizing the Homodyned K-distribution used to analyse ultrasound signals backscattered by tissues was presented in Section 2.1. Next, in Section 2.2, it was shown how the attenuation coefficient can be obtained from the derivative of one of the coefficients provided by this distribution. In the following Section 2.3, the experimental procedure employed to obtain the ultrasound dataset was explained; this section includes the description of the tissue-mimicking samples, the ultrasound hardware used (based on a scanning single-channel transducer arrangement), and the signal treatment methodology. The subsequent Section 3 shows the results obtained and discusses the performance of the presented algorithm in comparison with conventional B-scan images.

2. Materials and Methods

2.1. Envelope Statistics Using the Homodyned K-Distribution

From the point of view of ultrasound wave propagation, biological tissues can be modelled as substrates with randomly or non-randomly distributed sound scatterers. The echo signals produced by this type of media are the superposition of the reflections that take place in each of the scatterers. It has been established that the statistical distribution of the amplitudes of the echo signal envelope carries crucial information about the material responsible for such backscattering [25]. Consequently, this statistical analysis offers a means to characterize tissues and has the potential to provide insights into their health state.
To achieve this characterization, this paper employs the Homodyned K-distribution to fit the amplitude distribution of the echoes backscattered from the tissues. The Homodyned K-distribution is considered one of the most comprehensive scattering models, as it can account for the effect of tissues in scenarios with a limited number of scatterers and can also accommodate periodic amplitude changes within the analysed media [26]. The distribution is expressed by the following integral:
p A A = A u = 0 u J 0 u s J 0 u A 1 + u 2 σ 2 2 μ μ   d u
where pA(A) is the probability density function associated with a particular amplitude A on the signal envelope and J 0 x is the Bessel function of order 0. This Homodyned K-distribution is described by a set of three parameters: σ, μ, and s. These parameters are associated with the diffuse energy, scatterer clustering, and coherent energy, respectively. It is proposed in this study that variations in the parameter σ, denoted as Δσ, can be linked to changes in the scattered energy ΔE as the ultrasound wave penetrates through the tissues. From this ΔE, information about the attenuation coefficient of the tissues can be obtained, as elaborated below.
Jakeman [27] and Dutt [28] already demonstrated that the Homodyned K-distribution can be expressed as a discrete sum:
E [ A 2 r ] =   2 σ 2 μ r r ! Γ ( r + 1 ) Γ ( μ ) p = 0 r Γ ( μ + r p ) Γ p + 1 p ! r p ! s 2 μ 2 σ 2 p
where
E A 2 r = A 2 r ¯
Here, Γ is the Gamma function, and E[A2r] represents the averages along the time of the even powers of the amplitude and is commonly referred to as the amplitude of even moments (r being a natural number).
To elaborate further, the three first even moments lead to a set of three equations:
E A 2 = s 2 + 2 σ 2 E A 4 = 8 1 + 1 μ σ 4 + 8 σ 2 s 2 + s 4 E A 6 = 48 1 + 3 μ + 2 μ 2   σ 6 + 72 1 + 1 μ σ 4 s 2 + 18 σ 2 s 4 + s 6
If this nonlinear system of equations can be solved, an estimation of the three parameters that define the Homodyned K-distribution is obtained. These parameters characterize the scattering properties of a given tissue.
The envelope of a signal along time A(t) can be obtained from the original signal by the addition of the in-phase (xp) and quadrature (xq) signals:
A t = x p t + x q t = x p t + j x p t
The average along time (¯) of the first even moment of the envelope could be obtained from the in-phase signal as:
E A 2 = x p t 2 1 + j 2 ¯ = 2 x p t 2 ¯

2.2. Attenuation Coefficient

In this work, we propose a method to obtain the attenuation coefficient (α) of a given material using the Homodyned K-distribution parameters s and σ. From the first equation of system (4), these parameters are directly related to the averaged intensity of the echo envelope (A2), which is proportional, in turns, to the intensity of the incident wave. The acoustic attenuation causes the wave intensity to decrease exponentially as the wave penetrates the material.
Following the mathematical formulation proposed in [29], the discrete Fourier transform (Xi(f)) of the wave (xi(t)), backscattered by a given tissue with the transducer at position i, may be expressed as:
X i f f 2 H f 2 V i n c ( f ) e 2 α t o t z i F i ( f ) D i ( f , α l o c )
where f is frequency; H(f) is the dimensionless filtering characteristics of the ultrasound source; |Vinc(f)| is the amplitude spectrum of the voltage pulse applied to the ultrasound source; zi is the distance from the ultrasound source to the beginning of the region of interest in the tissue when the transducer is at discrete position i; α t o t and α l o c i are the attenuation coefficients of the tissue until reaching the region of interest and within this region of interest, respectively; Fi(f) accounts for the frequency dependent tissue reflectivity; and D i ( f , α l o c i ) takes into account the diffraction pattern within this region.
If the transducer approaches the tissue a distance ∆z, the relation of the spectrum in the new position i + 1 and the previous position would be:
X i + 1 f X i f = e 2 α t o t z i e 4 α l o c i z F i + 1 ( f ) D i + 1 ( f , α l o c i ) e 2 α t o t z i F i ( f ) D i ( f , α l o c i ) = e 2 α l o c i z
where it was assumed that the transducer displacement is small and, consequently, no significant changes in the reflectivity or local attenuation of the tissue are produced, and then F i + 1 f = F i f and D i + 1 ( f , α l o c i ) = D i ( f , α l o c i ) .
Parceval’s theorem relates the time average of a signal squared with the frequency average 〈 〉 of its discrete Fourier transform as:
x p t 2 ¯ = N X f 2
where N is the number of samples of the signal in the frequency domain. From (6), (8), and (9), the relationship between the envelope energy at consecutive depths would be:
E i + 1 A 2 E i A 2 = 2 N X i + i f 2 2 N X i f 2 = X i f 2 e 4 α l o c i z X i f 2
To solve these frequency averages, some knowledge about the attenuation coefficient is needed. For a narrow bandwidth, the frequency dependence of the local attenuation coefficient in tissues may be approximated by a linear function [4]:
α l o c i = α 0 i f + c i
where α 0 i and c i are the slope and y-intercept, respectively. In addition, approximating the spectrum of the ultrasound beam X i f by a Gaussian function of central frequency f c i and standard deviation di, the frequency average can be integrated.
E i + 1 A 2 E i A 2 = A i 2 e 2 f f c i d i 2 e 4 α l o c i z d f A i 2 e 2 f f c i d i 2 d f = A i 2 d i π 2 e 4 z α 0 i f c i + c i e 2 z α 0 i d i 2 A i 2 d i π 2
Using a first order approach for moderate attenuation, the last exponential in the numerator, depending on the square of the attenuation, could be approximated to 1, which makes:
E i + 1 A 2 E i A 2 = e 4 z α 0 i f c i + c i
Combining this equation with the first system of Equation (4), corresponds to the Homodyned K-distribution model:
s i + 1 2 + 2 σ i + 1 2 s i 2 + 2 σ i 2 = e 4 z α 0 i f c i + c i = e 4 z α l o c i ( f c i )
And, finally, the local attenuation coefficient at depth i can be extracted from (13) as:
α l o c i ( f c i ) = 1 4 z ln s i + 1 2 + 2 σ i + 1 2 s i 2 + 2 σ i 2
This result shows the way to relate the attenuation coefficient to the parameters defining the Homodyned K-distribution scattering model. Therefore, by analysing the changes in the Homodyned K-distribution parameters (s and σ) along the ultrasound signal’s propagation path, the attenuation coefficient as a function of z for a given material can be derived.
In the present paper, ultrasound images used for material characterization were obtained by successive linear scans at different depths performed with a single-channel focused transducer. To obtain the attenuation coefficient in this case, a small correction should be introduced as two different regions (water coupling layer and tissue-mimicking material) are traversed by the ultrasound beam (Figure 1). If the speeds of sound in the coupling medium and in the analysed tissue are similar, wave refraction can be neglected. As a result, when the transducer approaches the tissue, the decrease in the distance travelled by the wave in the coupling material can be assumed to be equal to the increase in the distance travelled through the tissue. This approximation is generally acceptable when using water or coupling gels as coupling media for biological tissues. In that case, when the transducer performs two consecutive linear B-scans (i and i + 1) with ∆z being the variation in distance to the tissue between them, Equation (8) becomes:
X i + 1 f X i f = e 2 α l o c i z e 2 α l o c i α c o u p l i n g z
where α c o u p l i n g is the attenuation coefficient in the coupling material. Following a similar strategy as before, the envelopes of these signals are obtained, and replacing their mean square values with the Homodyned K-distribution parameters becomes:
α l o c i ( f c i ) = α c o u p l i n g ( f c i ) 1 4 z ln s i + 1 2 + 2 σ i + 1 2 s i 2 + 2 σ i 2
As noted, this solution was obtained when narrow pulses around a central frequency f c i are used; therefore, the attenuation frequency dependence can be considered linear. Alternatively, when using wideband pulses and the attenuation frequency dependence becomes nonlinear, a parallel formulation could be followed using the signals resulting from a narrow bandpass filtering of the scattering signals centred at successive frequencies fj instead of the original signals. A similar strategy was previously proposed by Bigelow [4], where multiple Gaussian filters were applied to the backscattered echoes to obtain frequency shifts from which the attenuation coefficient was calculated using Fourier Transform analysis. Now, different the Homodyned K-distribution parameters si and σi can be obtained from the envelopes of the signal i filtered at different central frequencies fj becoming s i , f j and σ i , f j , respectively. Therefore, the attenuation coefficient (17) would be different for each frequency band and can be expressed as:
α l o c i ( f j ) = α c o u p l i n g ( f j ) 1 4 z ln s i + 1 , f j 2 + 2 σ i + 1 , f j 2 s i , f j 2 + 2 σ i , f j 2
To provide a more general characterization of tissue attenuation as a function of frequency in the case of wideband pulses, the frequency dependence of the attenuation coefficients obtained at the different central frequencies fj can be fitted to a power form:
α l o c i f = α 0 i f n + c i
This is a generalization of the common linear formula previously used in Equation (11) for a narrow bandwidth, where n was equal to 1. Fitting this power form to the attenuation coefficient values obtained experimentally at different frequencies improves the reliability and regularizes the results, especially when working with data acquired from ultrasound devices covering a broad frequency spectrum [30].
As a result, the proposed methodology allows us to infer information about the attenuation coefficient of tissues based on variations in the parameters σ and s, which are directly related to changes in scattered intensity.
The subsequent sections of this paper will delve into the experimental methodology and experimental results in order to discuss the performance of the mathematical approach presented.

2.3. Experimental Methodology

Tissue-mimicking phantoms with diverse characteristics were prepared using poly-vinyl alcohol (PVA) as described in [31]. That study highlighted the suitability of this gel for phantom fabrication due to its similarity in density and sound speed to biological soft tissues, the robustness of the resulting gels, and the possibility of tailoring their properties through the addition of specific additives to mimic different tissues. The PVA used in this study was 130,000, 99+% hydrolysed (Sigma Aldrich, St. Louis, MI, USA) with a 10% mass concentration in water. Following the aforementioned reference, this mixture resulted in samples with a density of 1040 kg/m3 and a sound speed of 1541 m/s at ambient temperature (~25 °C). To introduce acoustic scatterers into the material and alter its attenuation coefficient, three types of particles, namely aluminium, alumina (Al2O3), and cellulose, were used at different concentrations up to 8% weight per weight (w/w). The particle sizes mainly ranged from 1 to 5 µm for aluminium and alumina, and above 50 µm for cellulose (with the latter exhibiting a pronounced tendency to flocculate). Additionally, a preservative agent, chlorhexidine at 0.05% w/w, was added to improve the durability and stability of the samples.
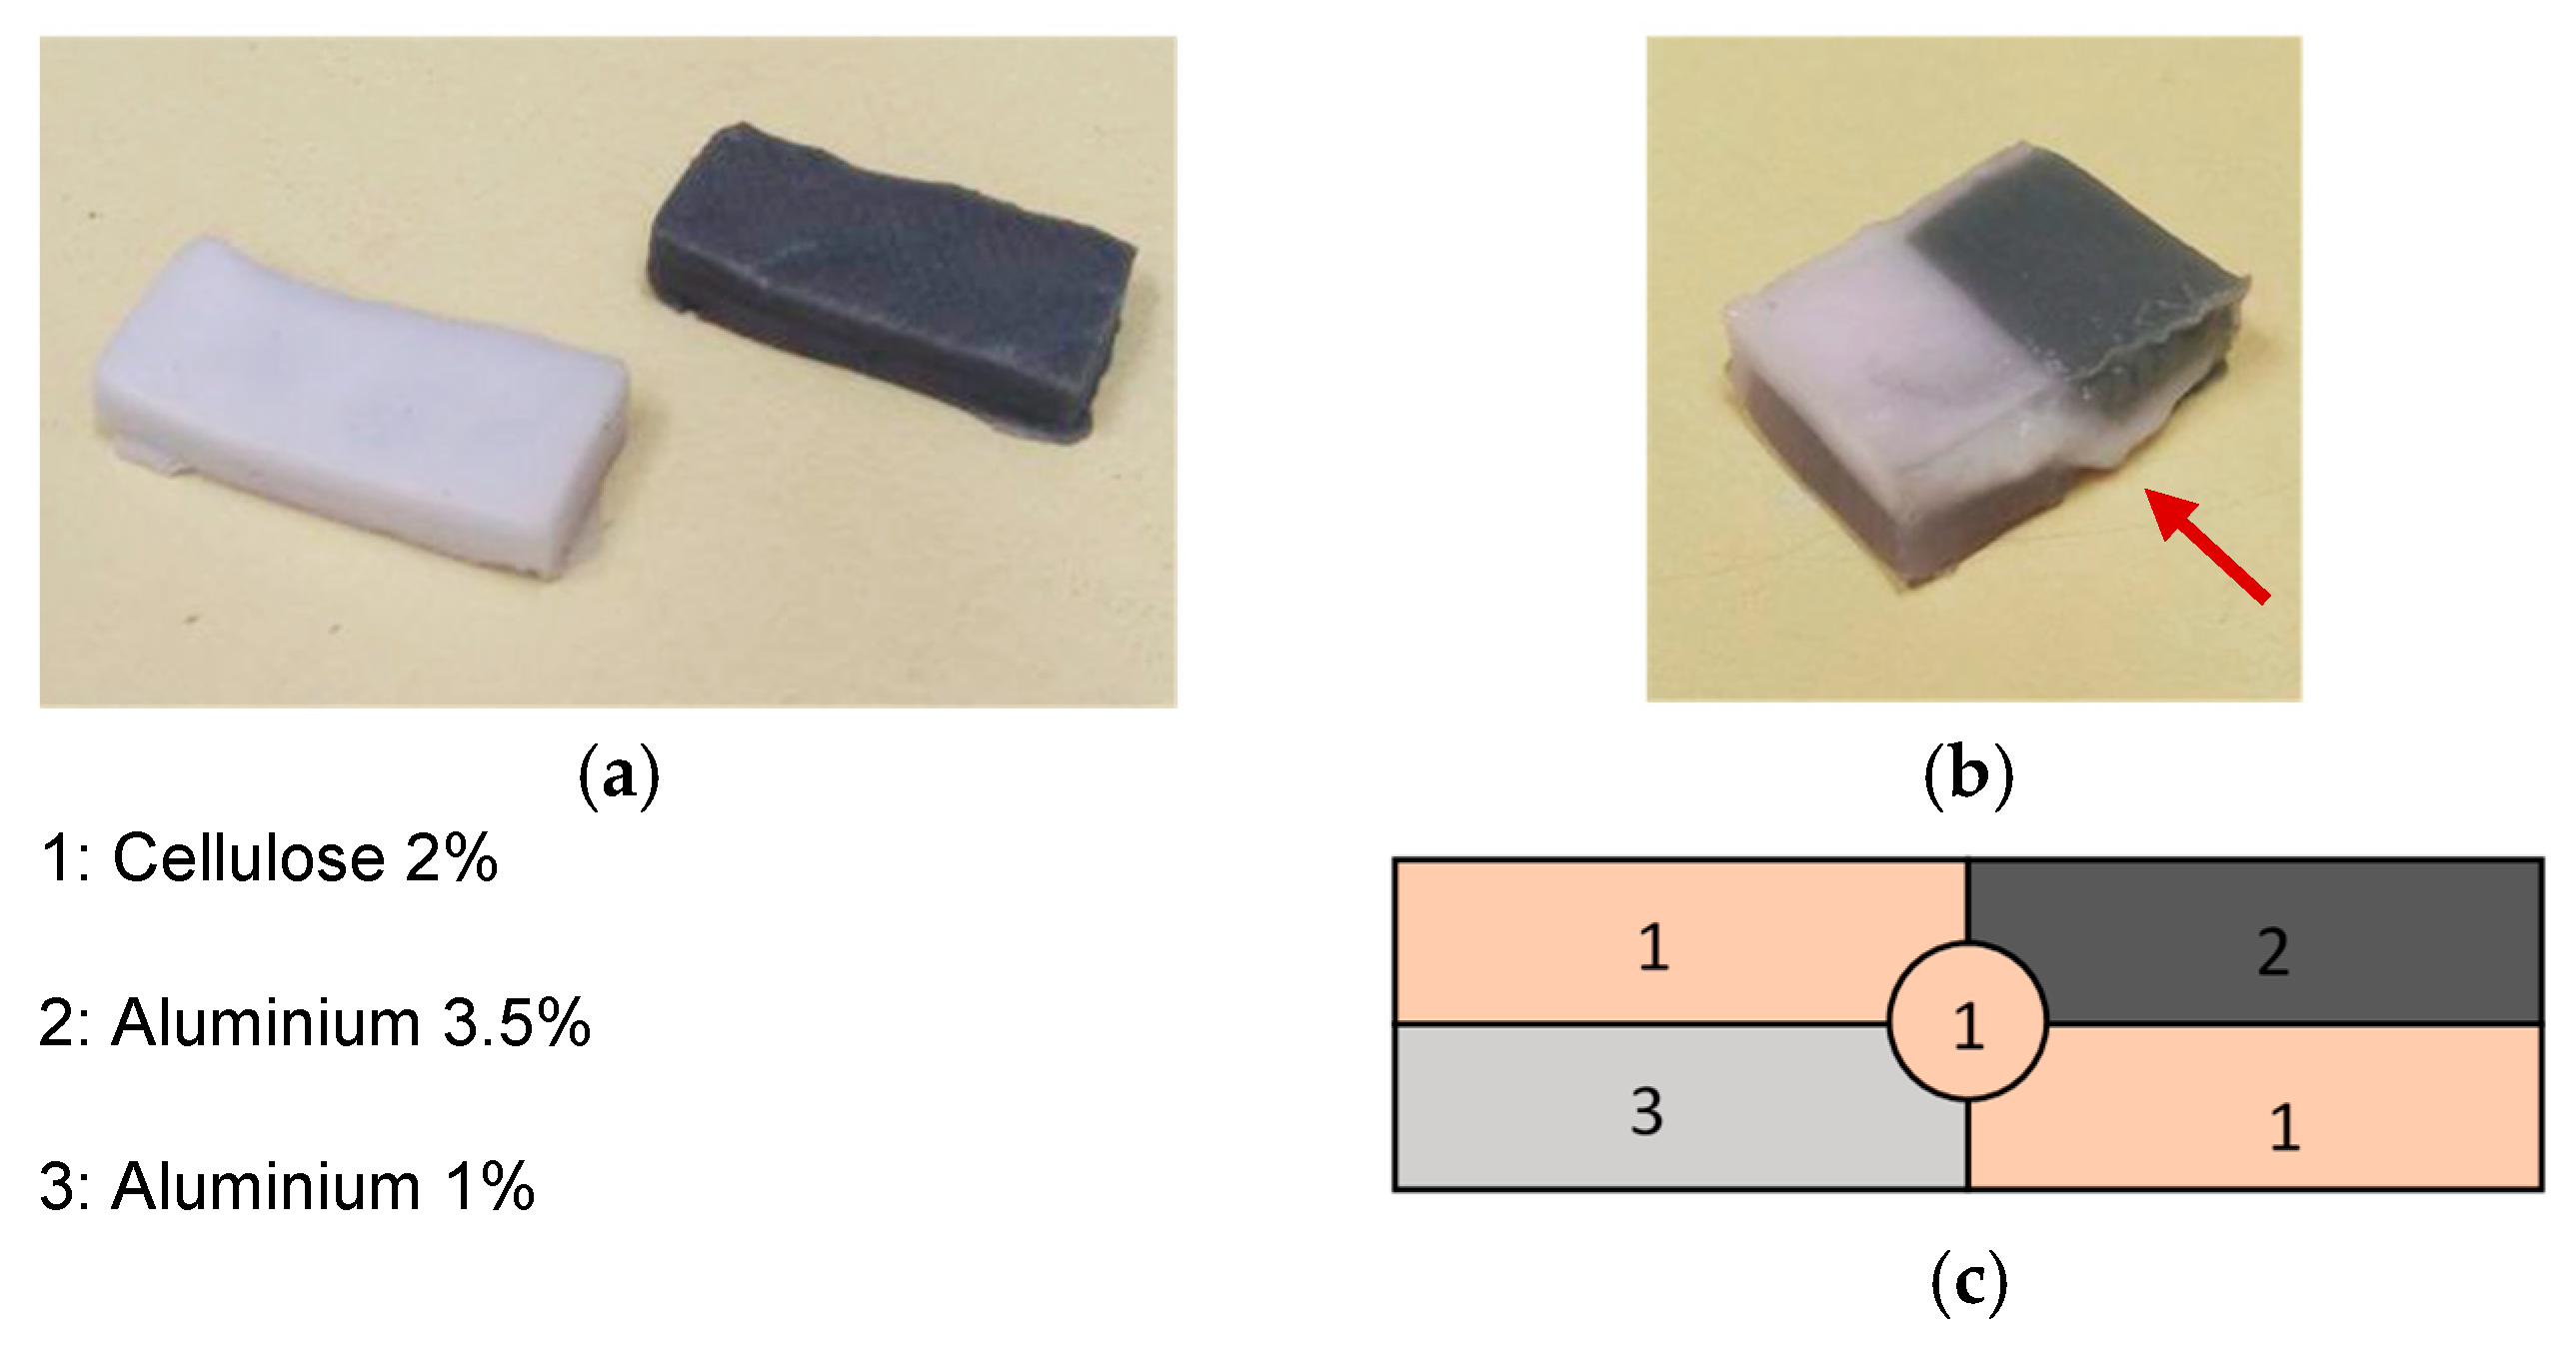
For this study, parallelepipedal PVA-based samples loaded with particles were produced. Batches of four samples each were made for five different particle concentrations (1%, 2%, 4%, 6%, and 8% w/w) using aluminium and alumina particles. This customization yields isotropic gels with varying scatterer concentrations and attenuation properties. Although biological tissues often exhibit anisotropic behaviour and boundary irregularities, experiments conducted with these phantoms may provide a preliminary assessment of the algorithm’s performance prior to further measurements with real tissues. Each specimen’s dimensions were set to 22 mm in length, 10 mm in width, and 5 mm in thickness. Figure 2a depicts two of these PVA samples charged with 4% particle concentrations of aluminium (dark grey) and alumina (light grey). The manufacturing of these elements was made following a moulding procedure, with the moulds being made of poly-lactic acid (PLA) using 3D printing. It should be noted that although these samples are inhomogeneous due to their composition of PVA, water, and particles, they will be referred to as single-material samples throughout this work. This is because, at a macroscopic scale, the properties detected by the ultrasound device are not expected to change significantly within each sample.
Additionally, a composite phantom made from a mixture of three different PVA-based materials was manufactured and will be referred to as the composite phantom (Figure 2b). All these materials shared the same PVA 10% base but had varying concentrations of different particles (2% cellulose, 1% aluminium, and 3.5% aluminium), as shown in Figure 2c. The dimensions of the composite phantom were 20 mm × 10 mm × 6 mm.
The ultrasound system used to obtain images of the developed materials is based on a single-channel transducer configuration performing linear scans. The transducer used in the system was manufactured by S-Sharp, and it has a wideband radio frequency ranging from 20 MHz up to 70 MHz. This spherically focalized transducer features a 10 mm curvature radius and a 6 mm diameter active element.
To ensure accurate positioning of the ultrasound beam focus at the target depth and enable linear scans for image acquisition, the transducer was supported by a motion system consisting of three stages (PI, model Q-521.330) arranged in an XYZ configuration. Each stage is controlled by an independent electronic driver that allows motion in incremental displacements of 0.05 μm along its respective axis. In the present study, a scanning speed of 5 mm/s was used. The ultrasound pulse–echo acquisition system (pulser and digitizer) was synchronized with the horizontal movement to precisely relate signal captures with known transducer positions.
The tissue-mimicking samples were immersed in a water-filled box that acted as the coupling material between the transducer and the samples. The transducer was excited by broadband electric negative pulses emitted by a DPR-500 (JSR Ultrasonics, Pittsford, NY, USA). The echo signals were amplified in the pulser–receiver up to 50 dB and then sent to a Picoscope 6400D digitizer (Pico Technology, Cambridgeshire, UK). A sampling frequency of 313 MHz was used for all acquisitions in this study. Custom software developed in MATLAB 2010b was used to configure all devices, control the movement stages, set signal emission and reception parameters, store the signals acquired by the digitizer, and oversee the entire measurement process.
Given the significant curvature radius of the transducer used, 2D raster scans were performed to change the beam focus position within the samples. After each 10 mm linear scan, the depth was increased in steps of 0.1 mm. A lateral increment of 5 µm between consecutive A-scans allowed for beam superposition to provide image continuity. The acquisition gain was increased as the focus went deeper into the samples to improve the signal-to-noise ratio. Depending on the sample, between 35 and 42 linear scans were required for analysis.
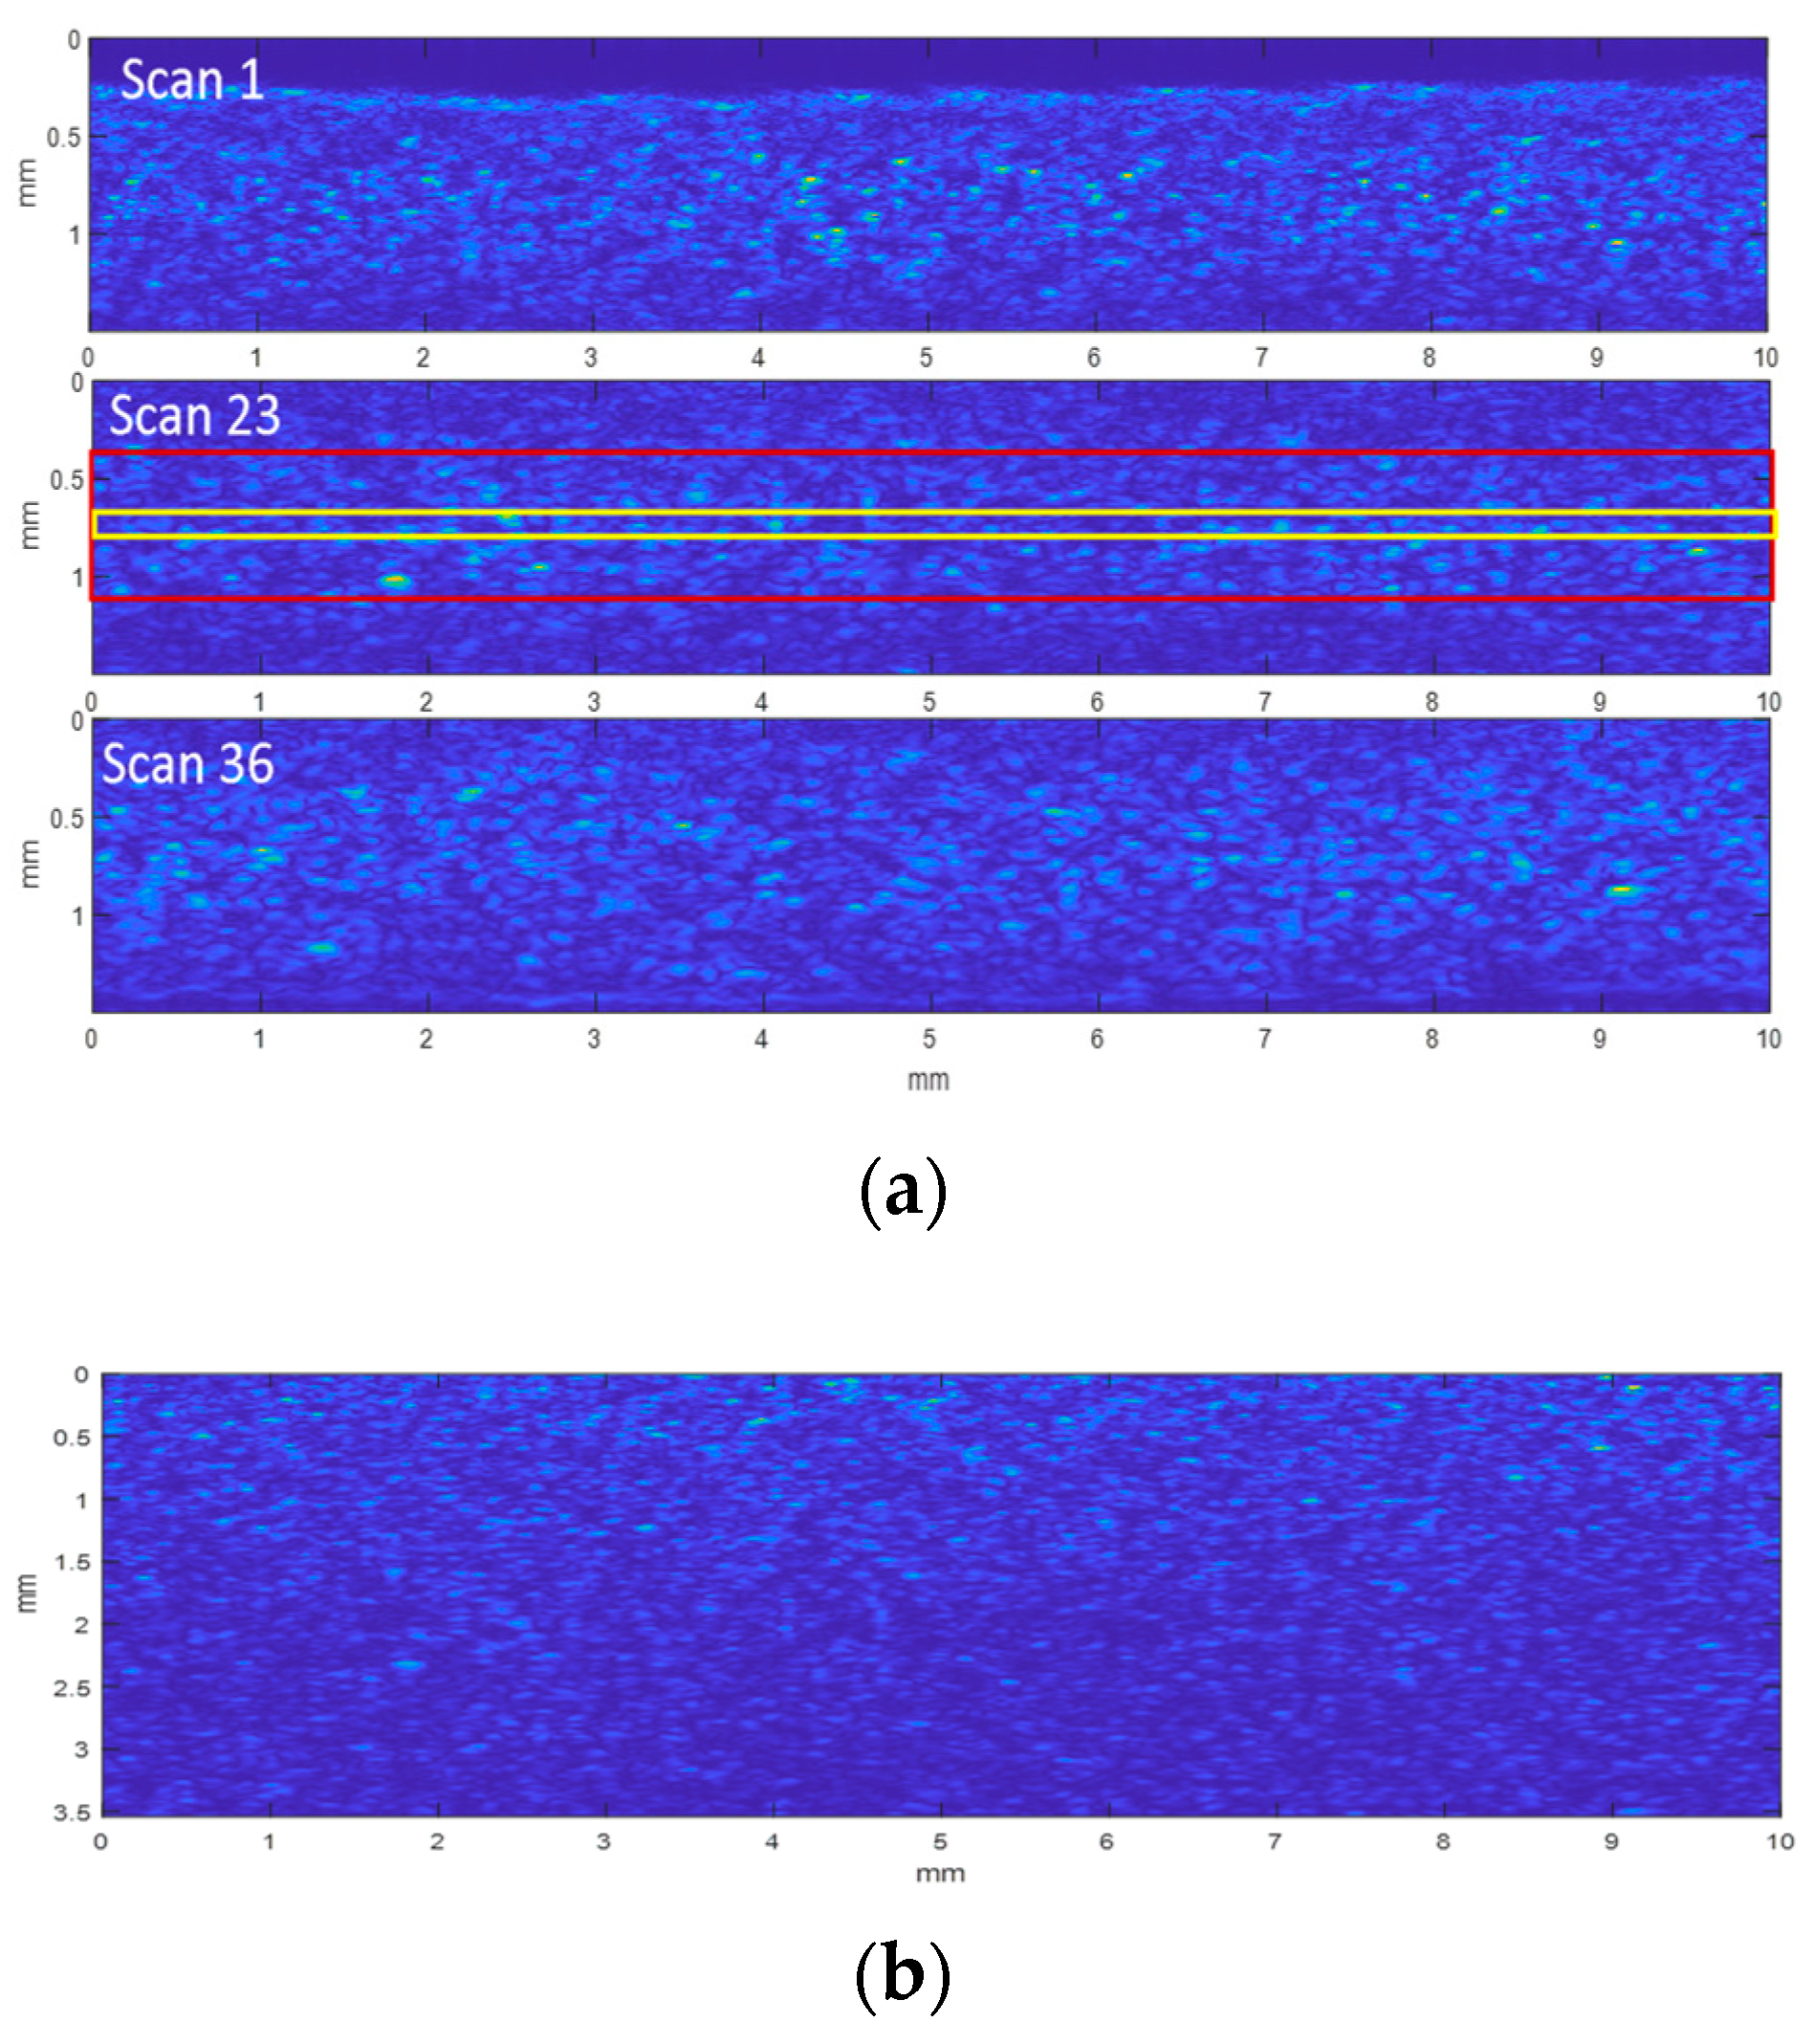
As an example, Figure 3a displays three linear scan images obtained when the focus was placed near the surface, middle, and bottom of the sample, respectively. The upper part of each figure corresponds to the sampled region closest to the transducer. In the first of them, the interface between the water (dark due to the absence of scatterers) and the phantom can be observed. Focussing effects can be seen in all three figures, with the scatterers showing higher amplitude in the middle of the images than above and below the focal plane. The red rectangle in the central image (Scan 23) indicates the area selected to extract the Homodyned K-distribution parameters. Its thickness is 0.75 mm, and it is located near the focal plane. The yellow rectangle shows a 0.1 mm cut, which corresponds to the increases in depth between two successive scans and is used to compose the global B-scan image of the sample (Figure 3b).
The upper and lower interfaces of the samples were discarded from the image to compound the B-scan of the sample, for further comparison with the images obtained using the Homodyned K-distribution parameters. In this compounded image (Figure 3b), the focussing effect observed in the previous images (Figure 3a) has disappeared. However, the attenuation effect of the wave as it travels through the samples can be appreciated, with the intensity of the scatterers inside the sample decreasing from top to bottom.
To obtain 2D images from the Homodyned K-distribution parameters, the following processing steps were carried out:
(a)
Narrow bandpass filtering: Acquisitions were subjected to a battery of 10 MHz bandwidth bandpass filters centred at 20 MHz, 25 MHz, 30 MHz, 35 MHz, and 40 MHz, resulting in five sets of signals representative of these frequency bands.
(b)
Calculation of the Homodyned K-distribution parameters for each band: For each frequency band, windows with lateral and axial dimensions of 1 mm and 0.75 mm, respectively, were used to extract the envelopes of the signals along the material. The Homodyned K-distribution parameters were then calculated through a two-step process: Initially, a numerical estimation of the Homodyned K-distribution parameters was obtained by solving the system of Equation (4) using the nonlinear equation solver lsqnonlin (MATLAB). This estimation served as the initial value for refining the parameter values on a following step. For this, the same nonlinear equation solver was used, but now envelope data were fitted directly to the probability density function of Equation (1). This two-step process was repeated for all frequencies. Then, a new window was selected with a 0.5 mm lateral displacement for calculating a new set of the Homodyned K-distribution parameters. After completing one row, the procedure continued with the following linear scan until the estimation of the parameters was made for the whole image.
(c)
Smoothing of the Homodyned K-distribution parameters: To obtain the attenuation coefficient of the sample, which is based on derivatives with respect to the propagation beam direction, the Homodyned K-distribution parameters were smoothed along the axial direction using splines.
(d)
Calculation of the attenuation coefficient for each frequency band: Based on Equation (18), the attenuation coefficient values along the tissue were calculated for each frequency band.
(e)
Calculation of the general attenuation coefficient as a function of frequency: Equation (19) was employed to derive the expression of the attenuation coefficient as a function of frequency, utilizing the attenuation coefficients obtained at different frequencies.
The focus of the tissue characterization discussion was put on the analysis of both the attenuation coefficient (emerging from step (e)) and the scatterer clustering parameter (directly related to the μ value which is obtained in step (c)).

3. Results and Discussion

3.1. Analysis of Single-Material Samples

3.1.1. Echo Envelope Images

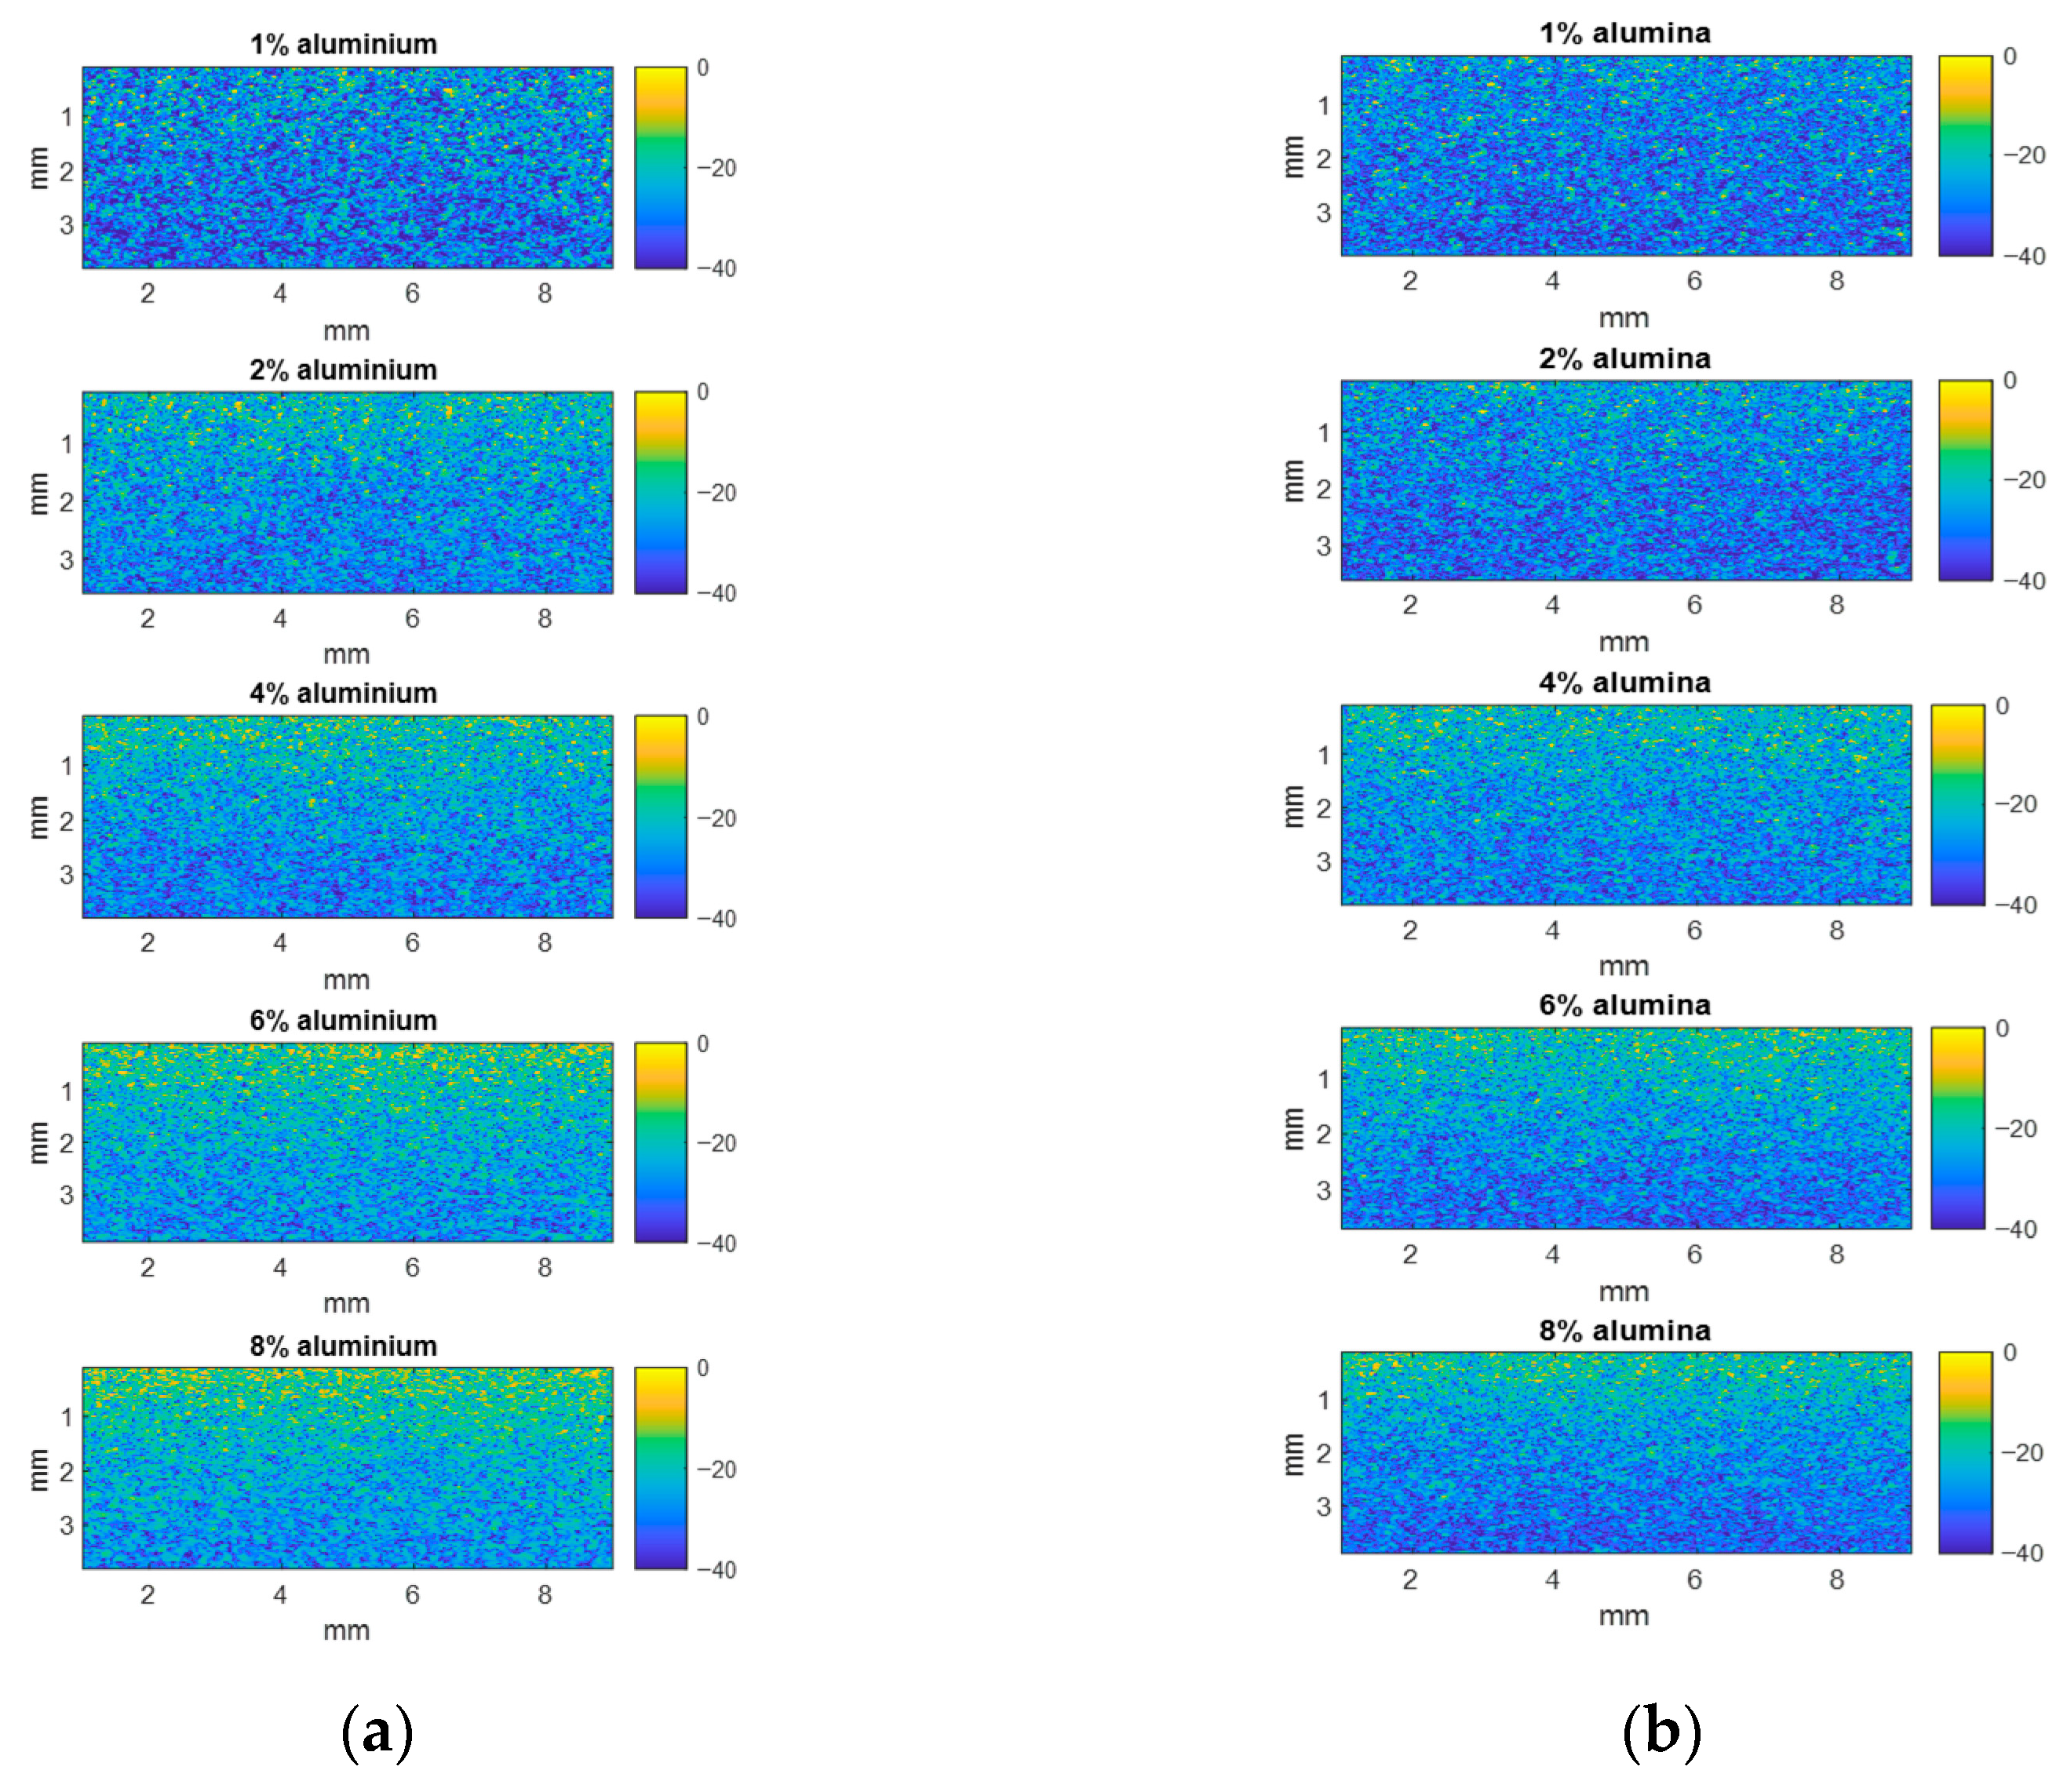
The analysis of the images obtained from the scanning of the single-material samples was initially performed using the conventional ultrasound imaging method based on the echo envelope. Figure 4 displays sections of 10 different samples of PVA loaded with alumina and aluminium particles, each with varying mass concentrations ranging from 1% to 8%.
Upon examination of these B-scan images, no apparent inhomogeneities in particle distribution could be seen along each sample, indicating a relatively uniform distribution of the particles within the PVA matrix. Also, a gradual increase in the echo density—which leads to echo merging and an increase in echo intensity—was observed, as the particle concentration increased for both types of particles. This increase was particularly significant at lower concentrations; however, as the concentration reached higher values, the effect became less evident.
It is important to consider the differences between the materials based on the nature of the particles. Although the sizes of both kinds of particles were similar, the density of aluminium (2700 kg/m3) is lower than that of alumina (3950 kg/m3). Consequently, for a given mass concentration, the number of alumina particles will be smaller than the number of aluminium particles. This difference in the number of particles is noticeable in the images of the right column (alumina), where a smaller number of scatterers is observed, especially at higher concentrations. The reflection coefficient of PVA gel–aluminium and PVA gel–alumina particles are 0.83 and 0.93, respectively; therefore, a significant impact was not expected by these differences of impedance mismatch in the B-scans.
Another important detail observed in these images was the loss of scatter reflections as the ultrasound wave penetrated deeper into the samples, moving from the upper to the lower region. Additionally, the effect became more evident as the particle concentration increased, suggesting a correlation between the concentration of scatterers and the attenuation properties of the materials.
In summary, the echo envelope analysis provided valuable insights into the scattering characteristics of the single-material samples. The images allowed the visualization of particle concentration variations, with higher concentrations leading to more pronounced echo density. Additionally, the observation of the loss of scatter reflections provided information on the attenuation properties of the materials, with aluminium particles showing a more significant effect compared with alumina particles. These results laid the foundation for further quantitative tissue characterization using the Homodyned K-distribution technique.

3.1.2. Attenuation Coefficient Images

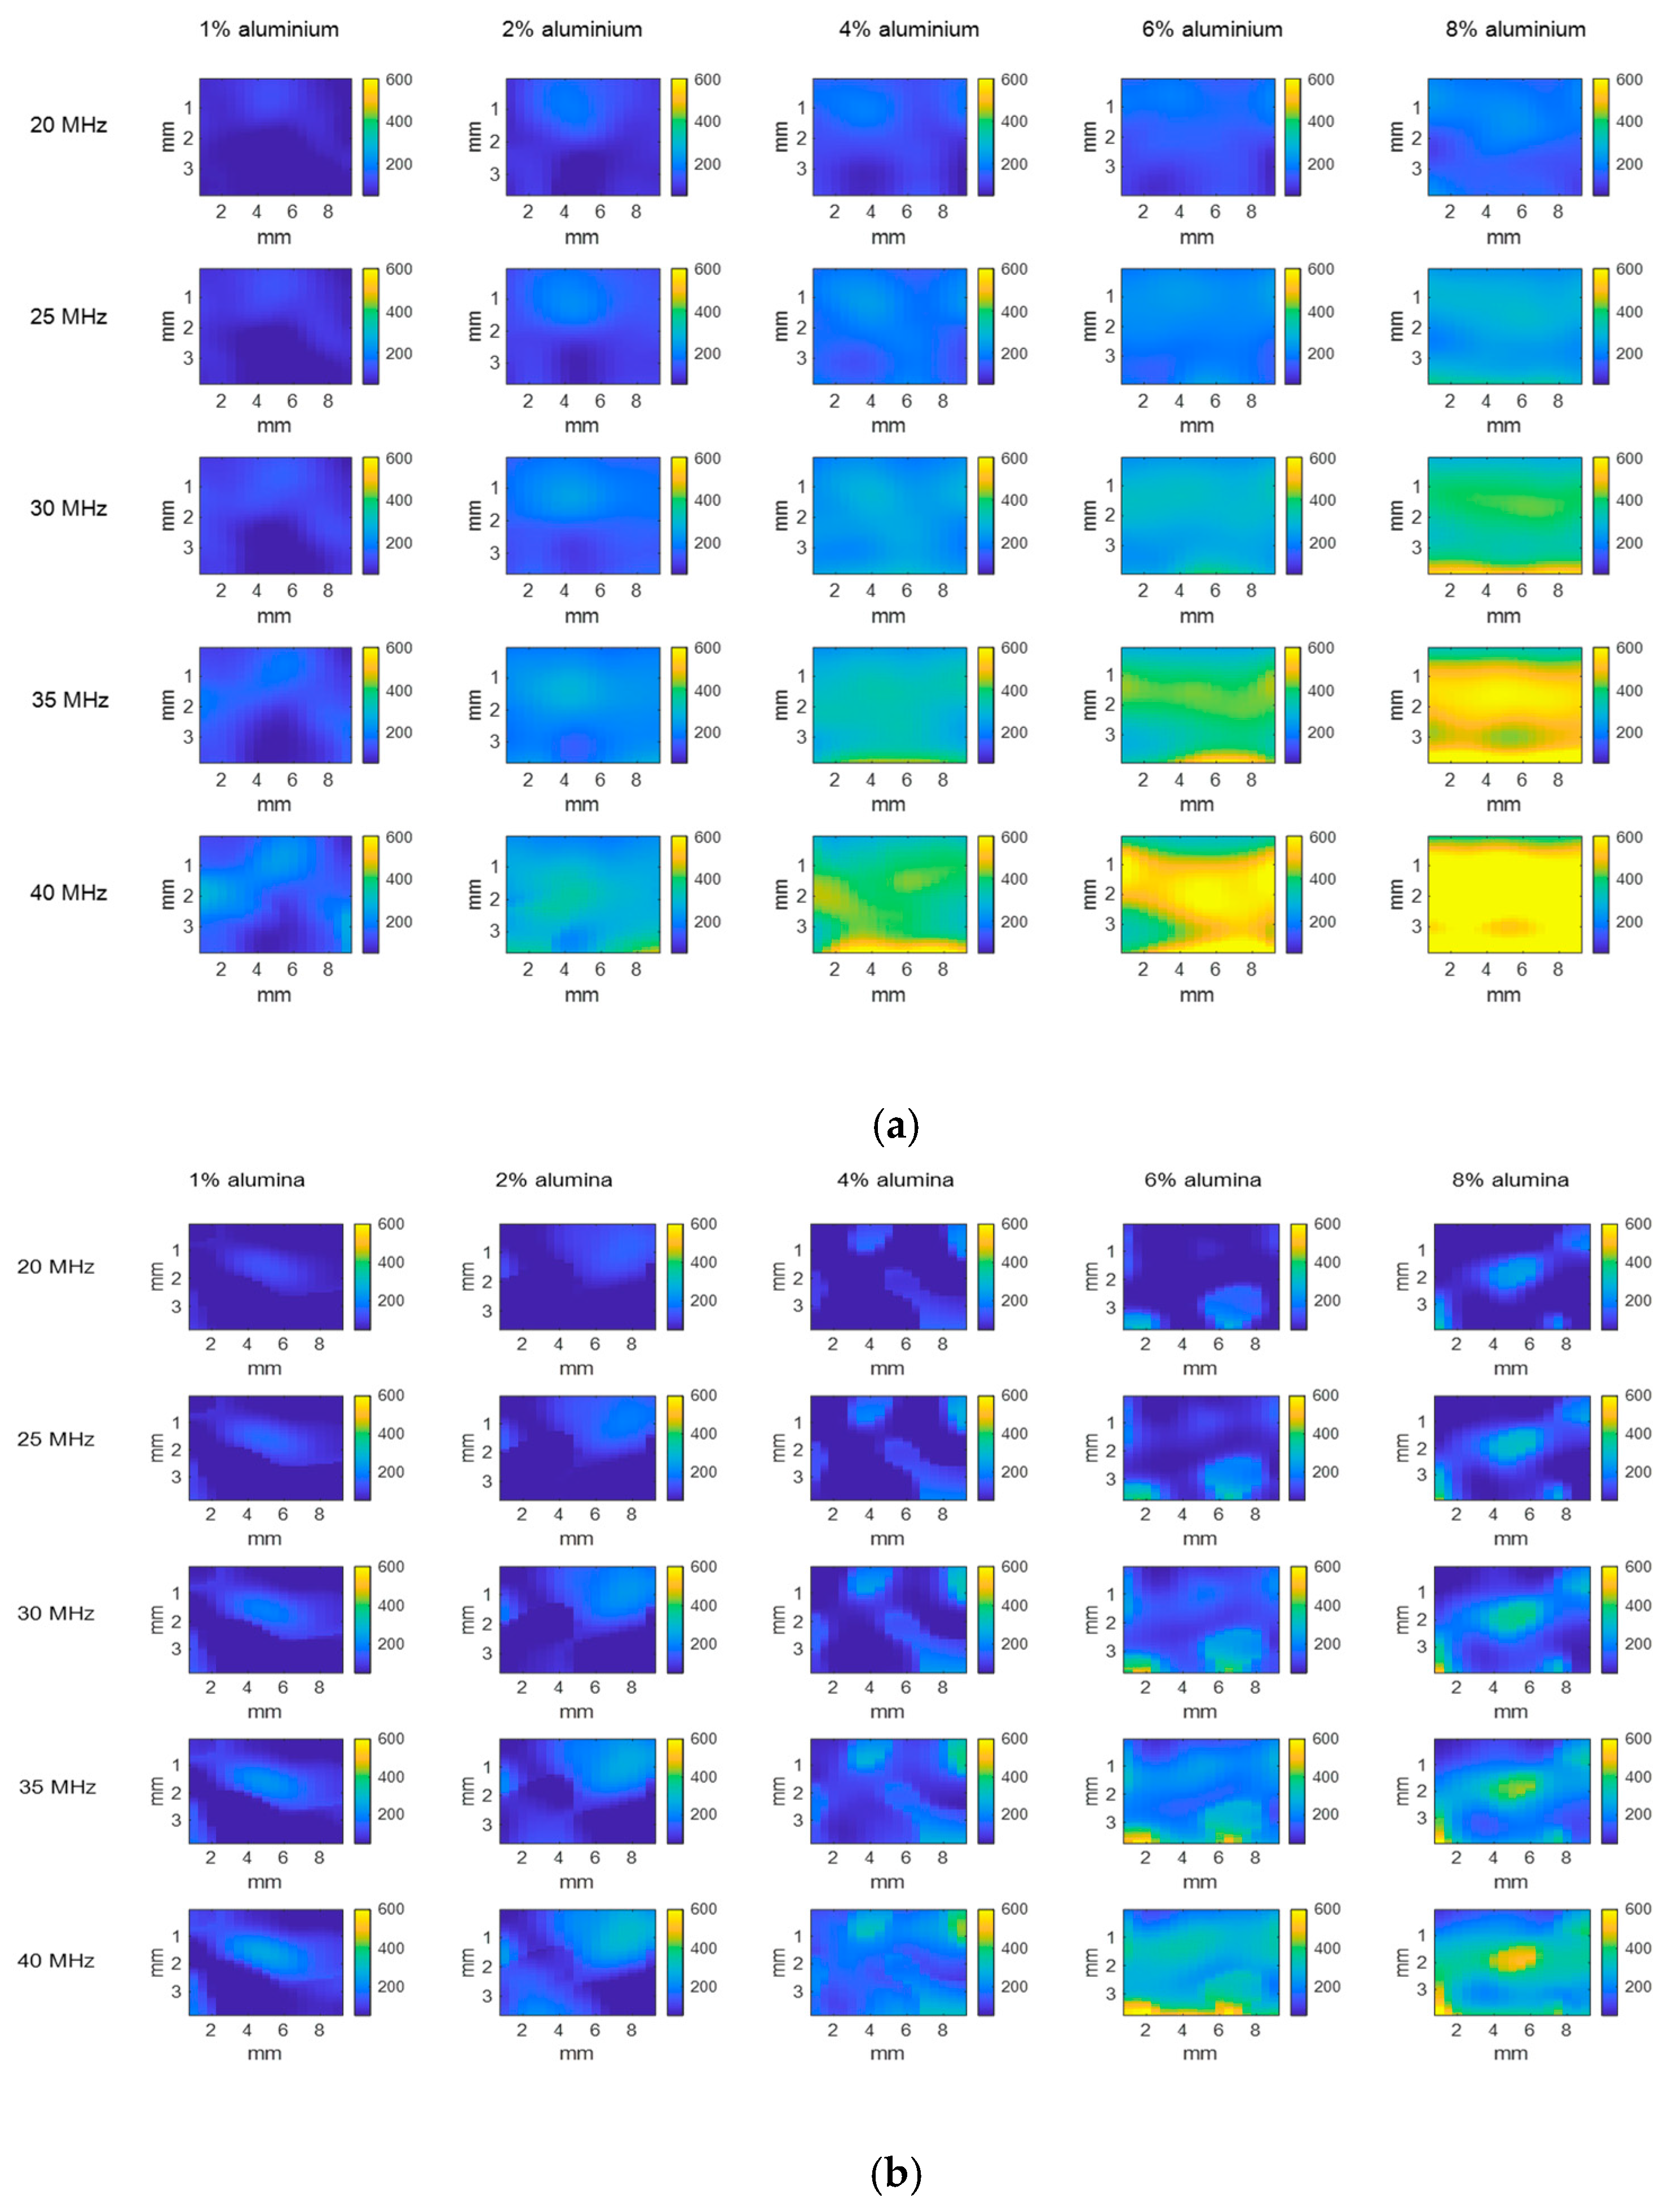
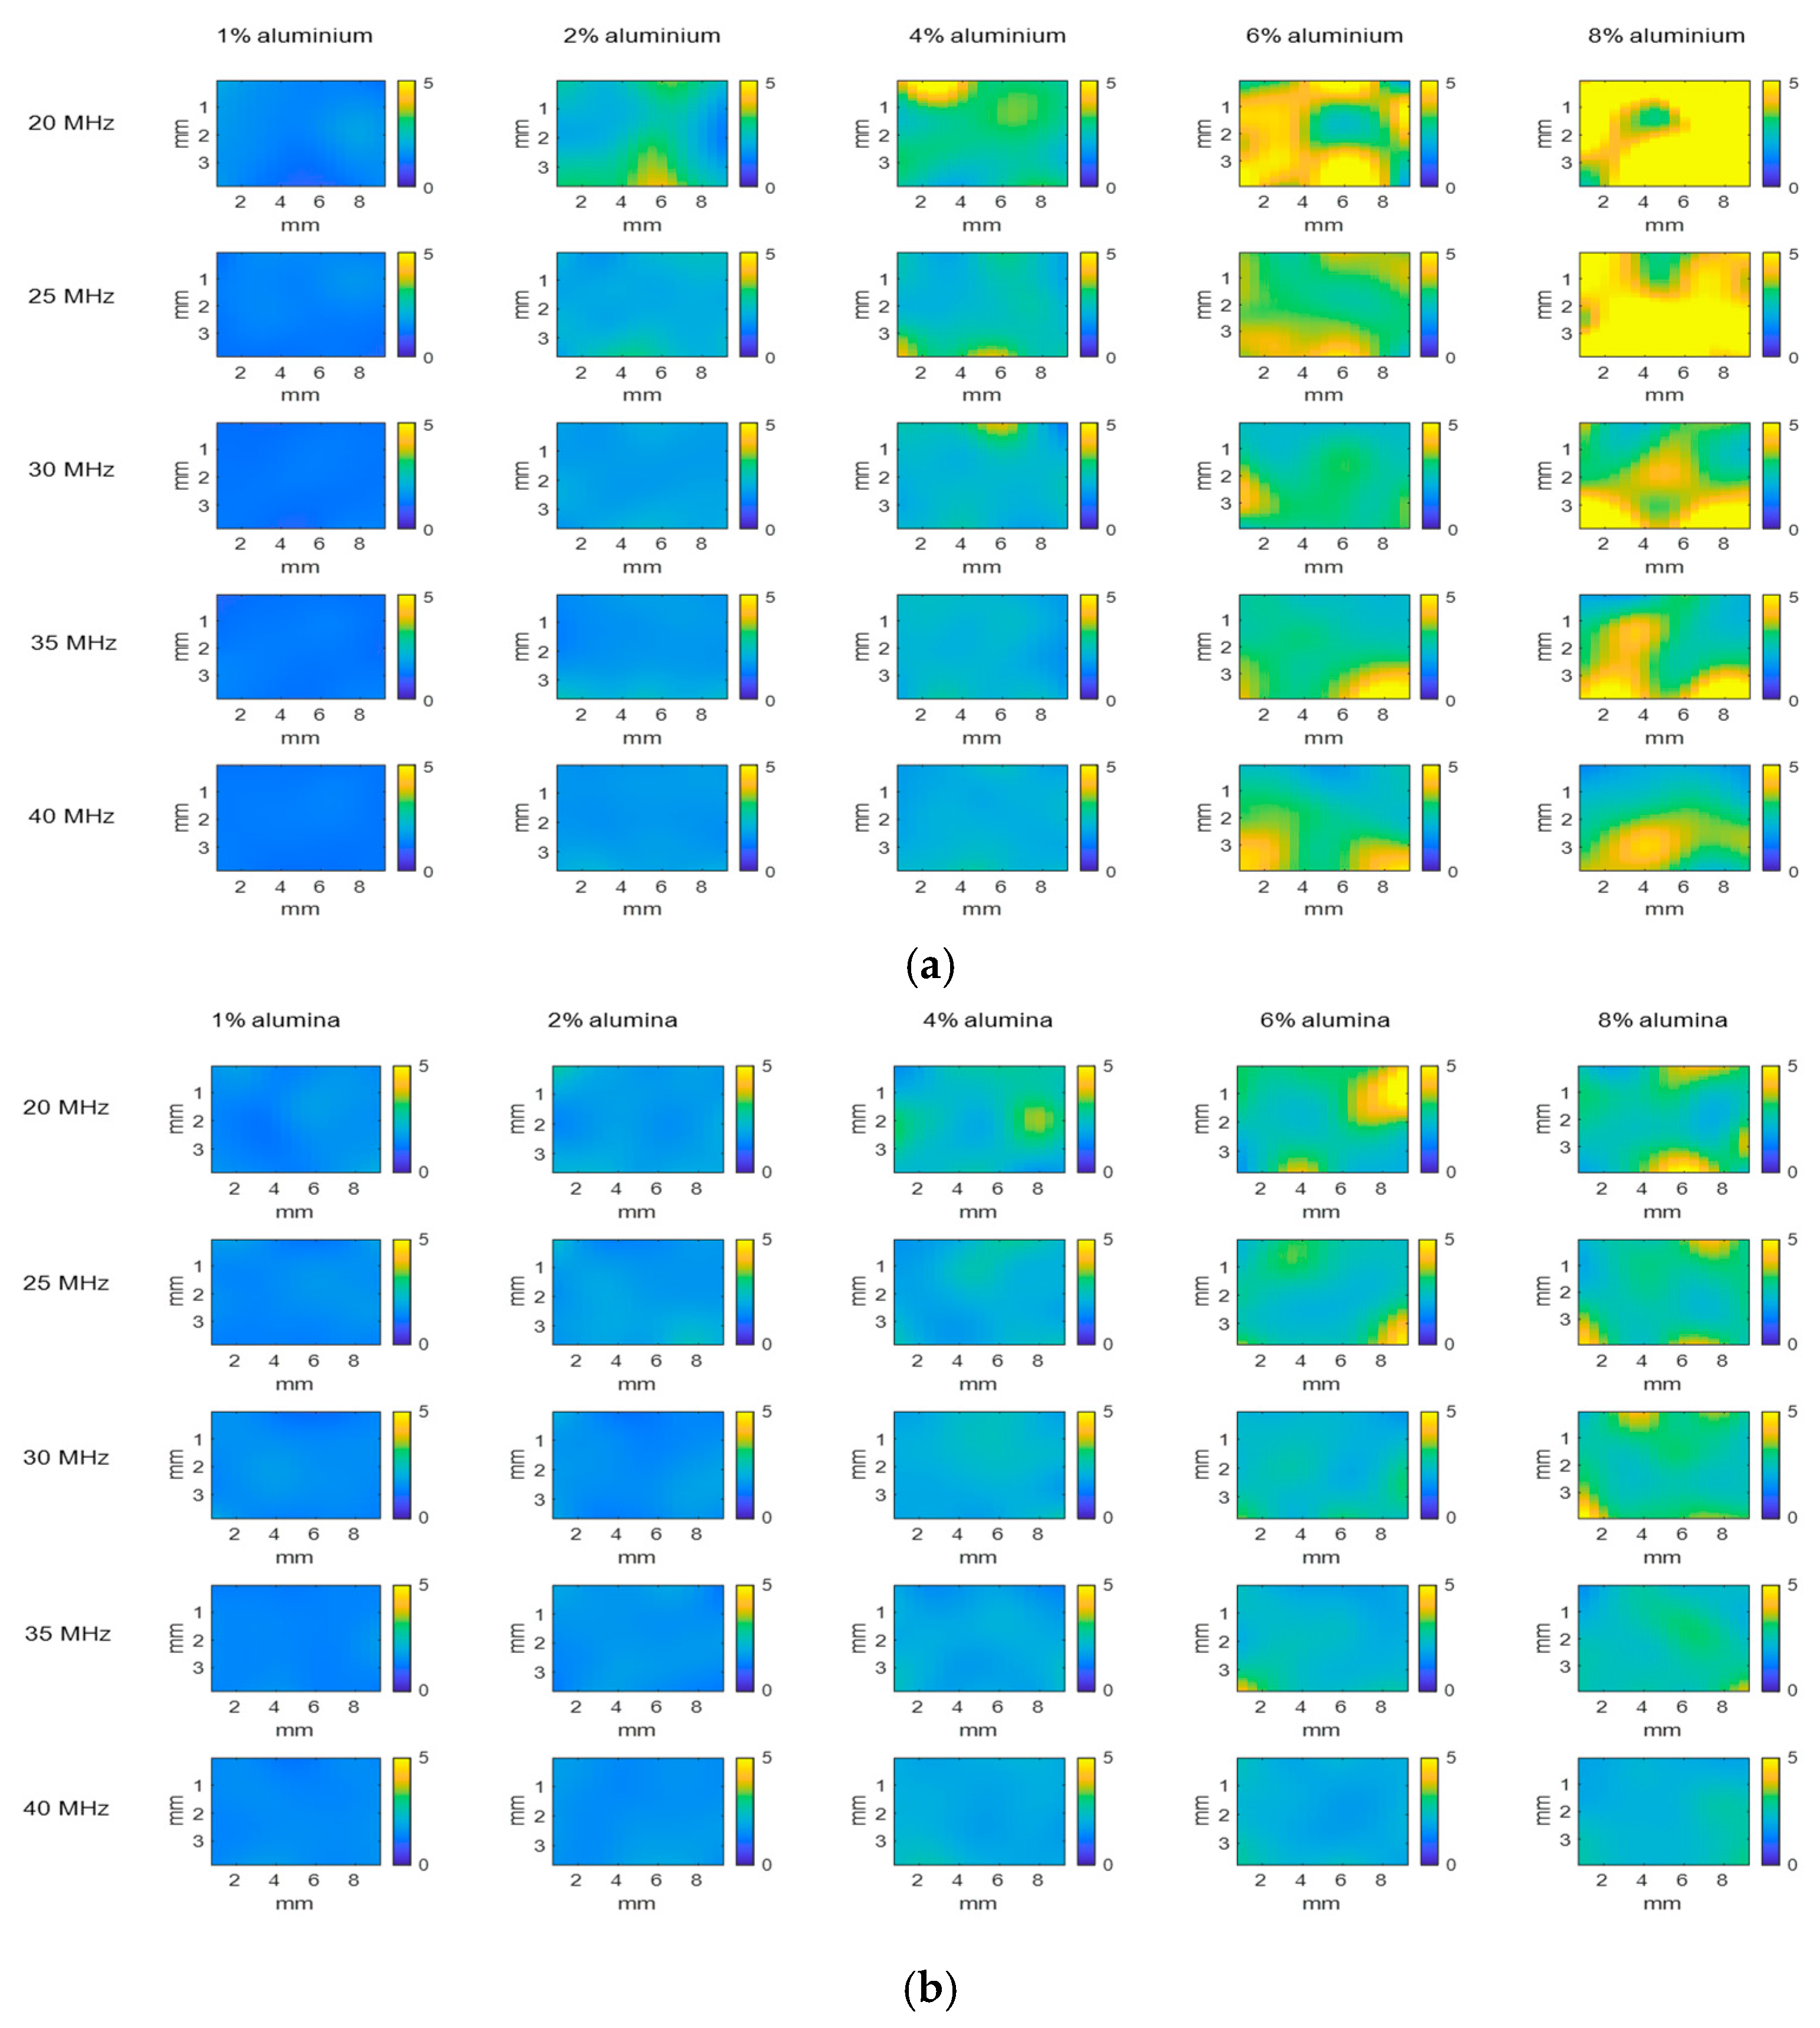
Figure 5 presents the attenuation coefficient images obtained from the same 10 samples analysed in the previous section but now utilizing the method proposed in this paper. The images are organized based on frequency (rows), particle concentration (columns), and the nature of the particles used to load the PVA samples: aluminium for Figure 5a and alumina for Figure 5b. The colour mappings reveal a clear increase in the attenuation coefficient with both frequency and particle concentration. The attenuation increment with concentration becomes more evident at the highest frequencies. Notably, the images corresponding to samples loaded with aluminium particles display a higher attenuation coefficient, as evidenced by the faster transition to green and yellow colours (400–600 Np/m).
The echo envelope gradients observed in Figure 4, which were challenging to assess quantitatively in that figure, were transformed into quantitative values of the attenuation coefficient in Figure 5. This transformation allowed for the discrimination between different concentrations, especially in the case of samples loaded with aluminium particles.
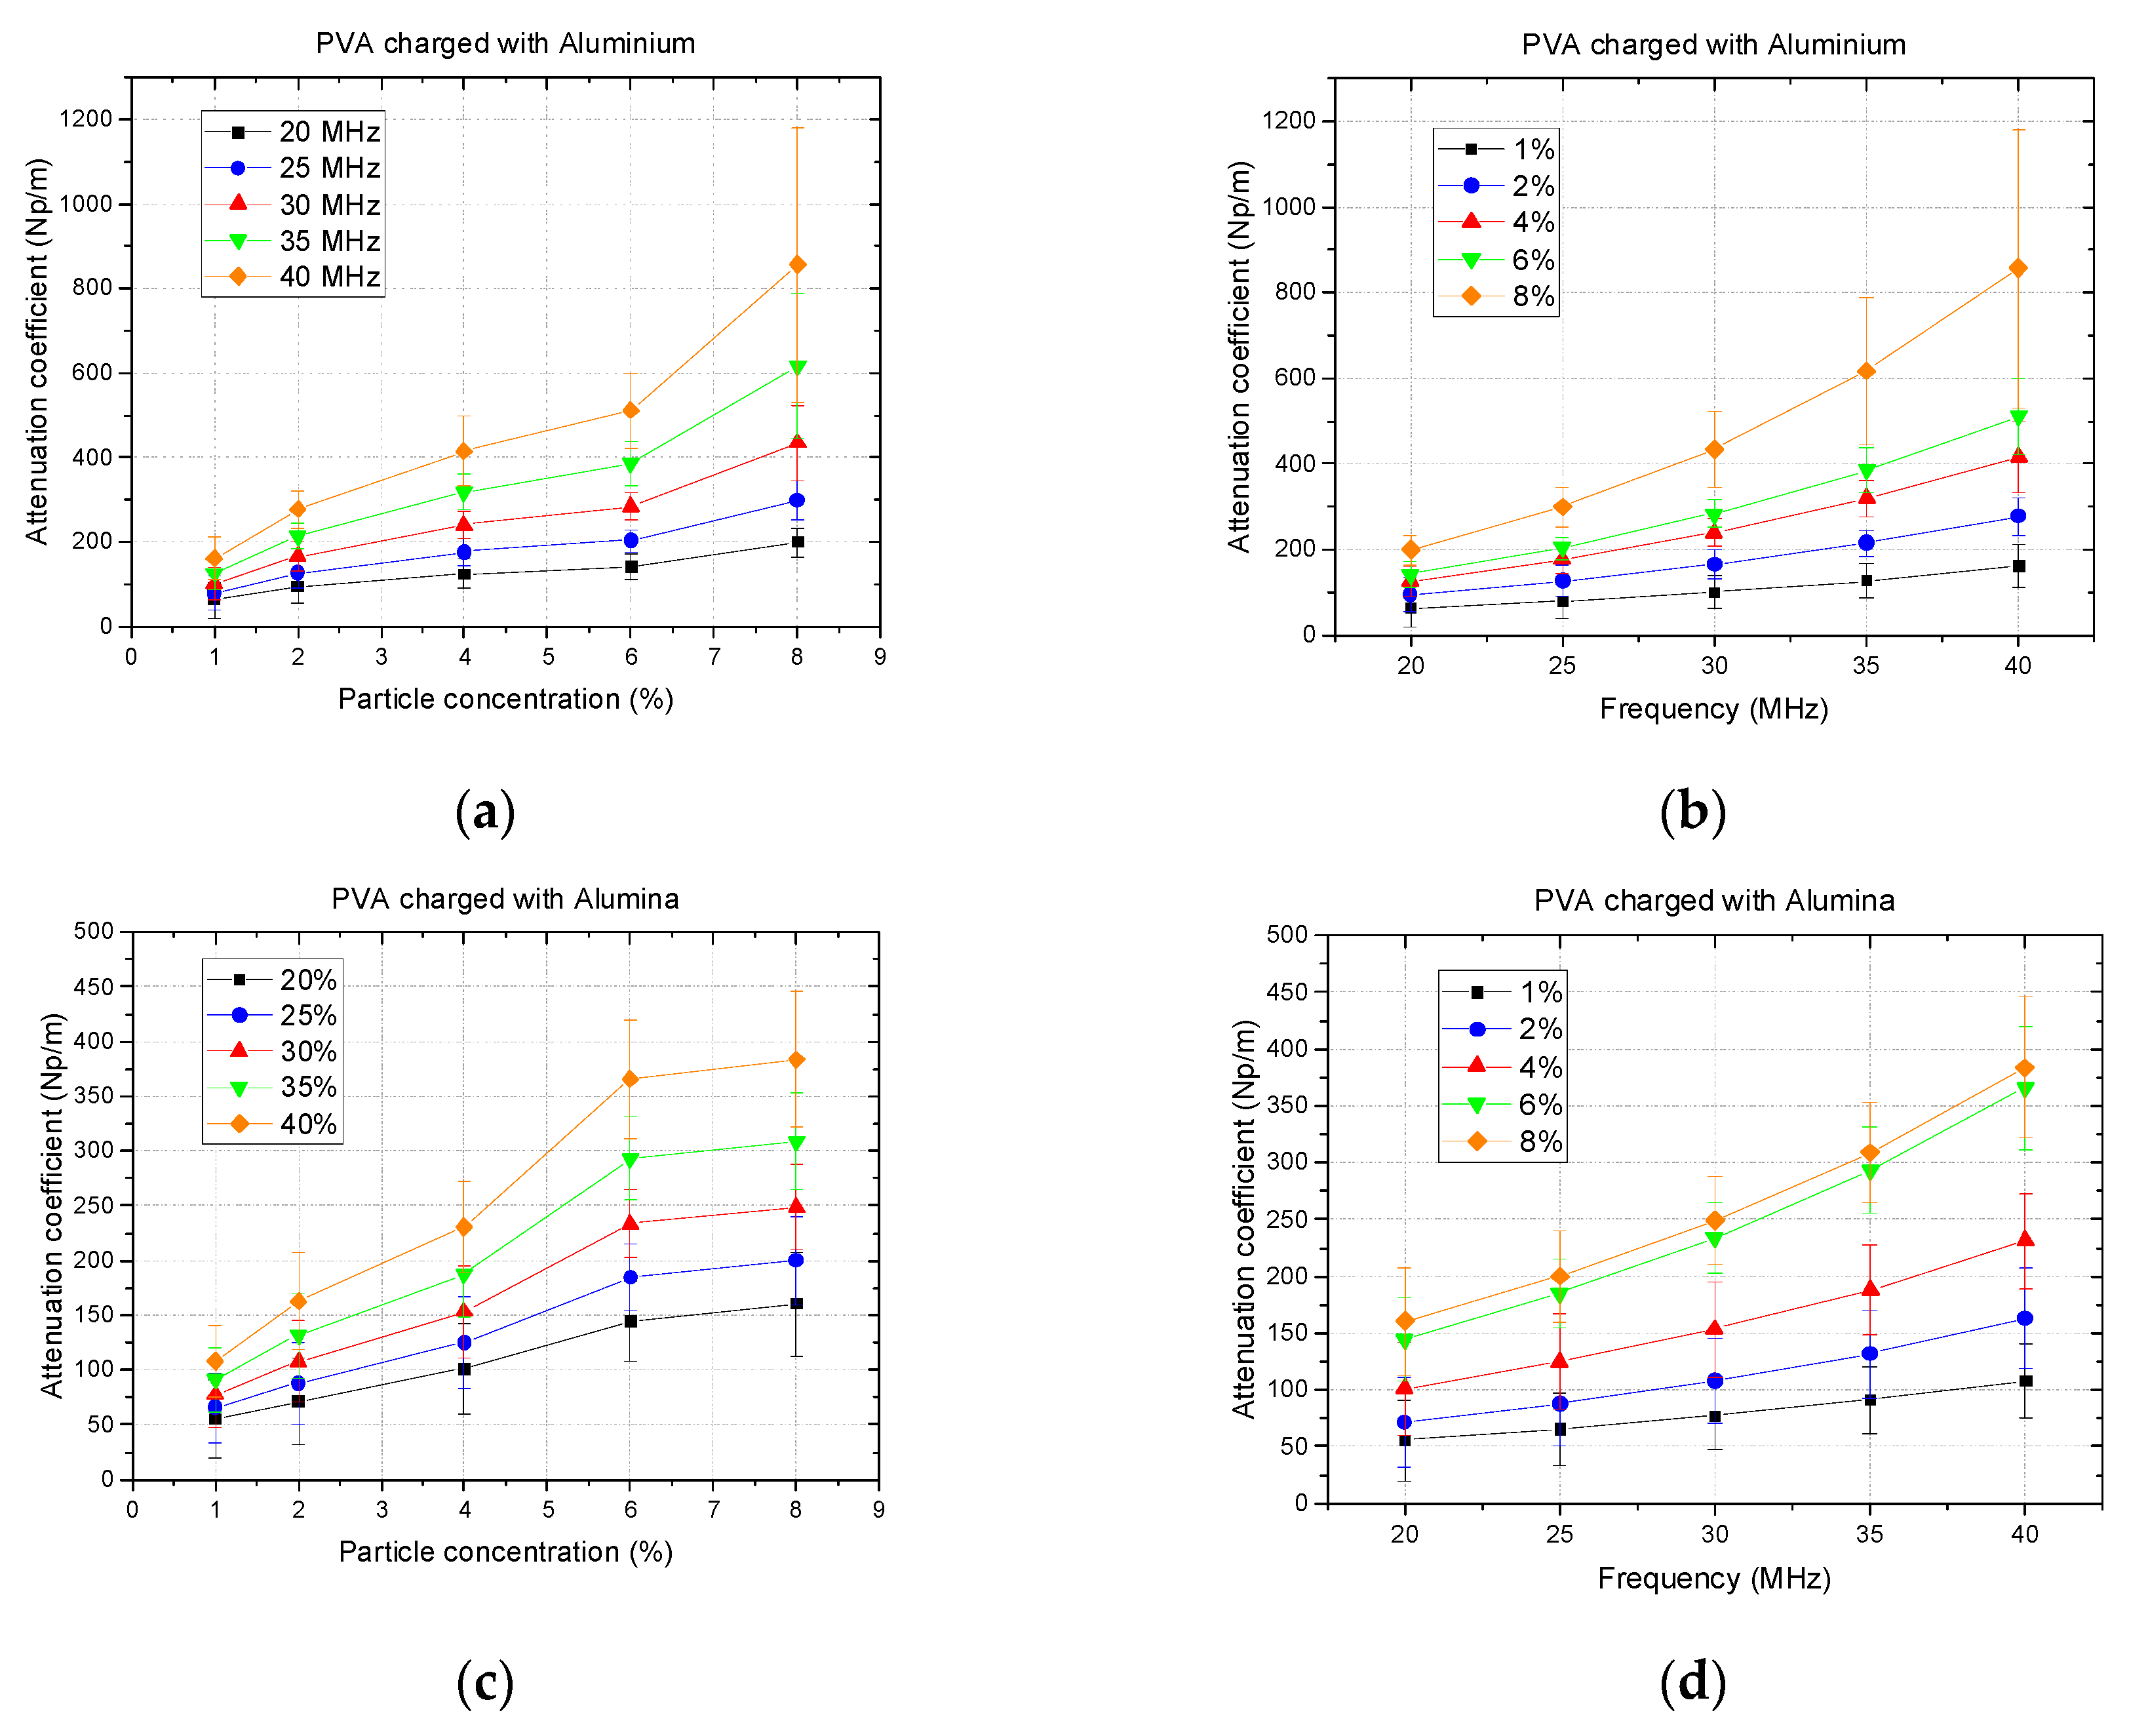
Furthermore, a more detailed quantitative analysis of the attenuation coefficient was conducted with data averaged across each image and also averaged for all samples made for each material type (Figure 6). Error bars were plotted to account for the standard deviations of the attenuation coefficient measurements along each sample. Observations made earlier about the increasing attenuation coefficient with increasing frequency and particle concentration are more easily quantified in these plots. Data dispersion is linked to the absolute values of the attenuation coefficient, where similar attenuation coefficients with different particles, frequencies, or concentrations exhibit error bars of the same order. A noteworthy finding is that the attenuation coefficient is better suited for discriminating different materials (particle concentrations) when using higher frequencies, as the overlapping of error bars decreases with an increase in the frequency. This advantage is balanced by the limitation that higher frequencies have lower penetration into tissues. However, for the materials and thicknesses analysed in this work, this effect did not significantly impact the reliability of the obtained attenuation coefficients.

3.1.3. Scatterer Clustering Parameter Images

The scatterer clustering in the samples was evaluated through the μ parameter obtained from fitting the Homodyned K-distribution to the ultrasound data acquired in each region. Figure 7 displays the images obtained from this parameter for the same 10 samples as before. The trend of the μ parameter to increase with particle concentration is evident for both types of particles. Additionally, materials loaded with alumina particles exhibited lower μ values than those with the same concentrations of aluminium particles, which aligns with the echo envelope results presented earlier and is attributed to the lower density and, consequently, the larger number of aluminium particles.
Frequency also had an impact on the μ parameter, with a moderate decrease observed as the frequency increased. This dependence is related to the different field of view of a wideband transducer as a function of frequency. Considering the resolution cell volume as the volume of the medium where the amplitude of the scattering decreases 3 dB from its maximum, for a 10 mm scan, this volume goes from 0.20 μL at 20 MHz to 0.11 μL at 40 MHz for the transducer used in this work. Then, the resolution cell volume decreased with higher frequency, resulting in fewer echoes detected in the image. However, this effect could not be compensated easily because the μ parameter was also affected by noise, especially at low scatterer concentrations, leading to a “saturation” for the smallest values of μ. This effect was already shown by Fernandez et al. [22], and it is frequency dependent in a complex way.
Figure 8 demonstrates that the lowest values of μ were obtained for the lowest concentrations and the highest frequencies. Consequently, while the clustering μ parameter is related to scatterer concentration, establishing a simple proportionality between this parameter and the concentration is not straightforward for most cases. Images in Figure 7 also reveal variability in the μ parameter within the samples, similar to what was observed for the attenuation coefficient.
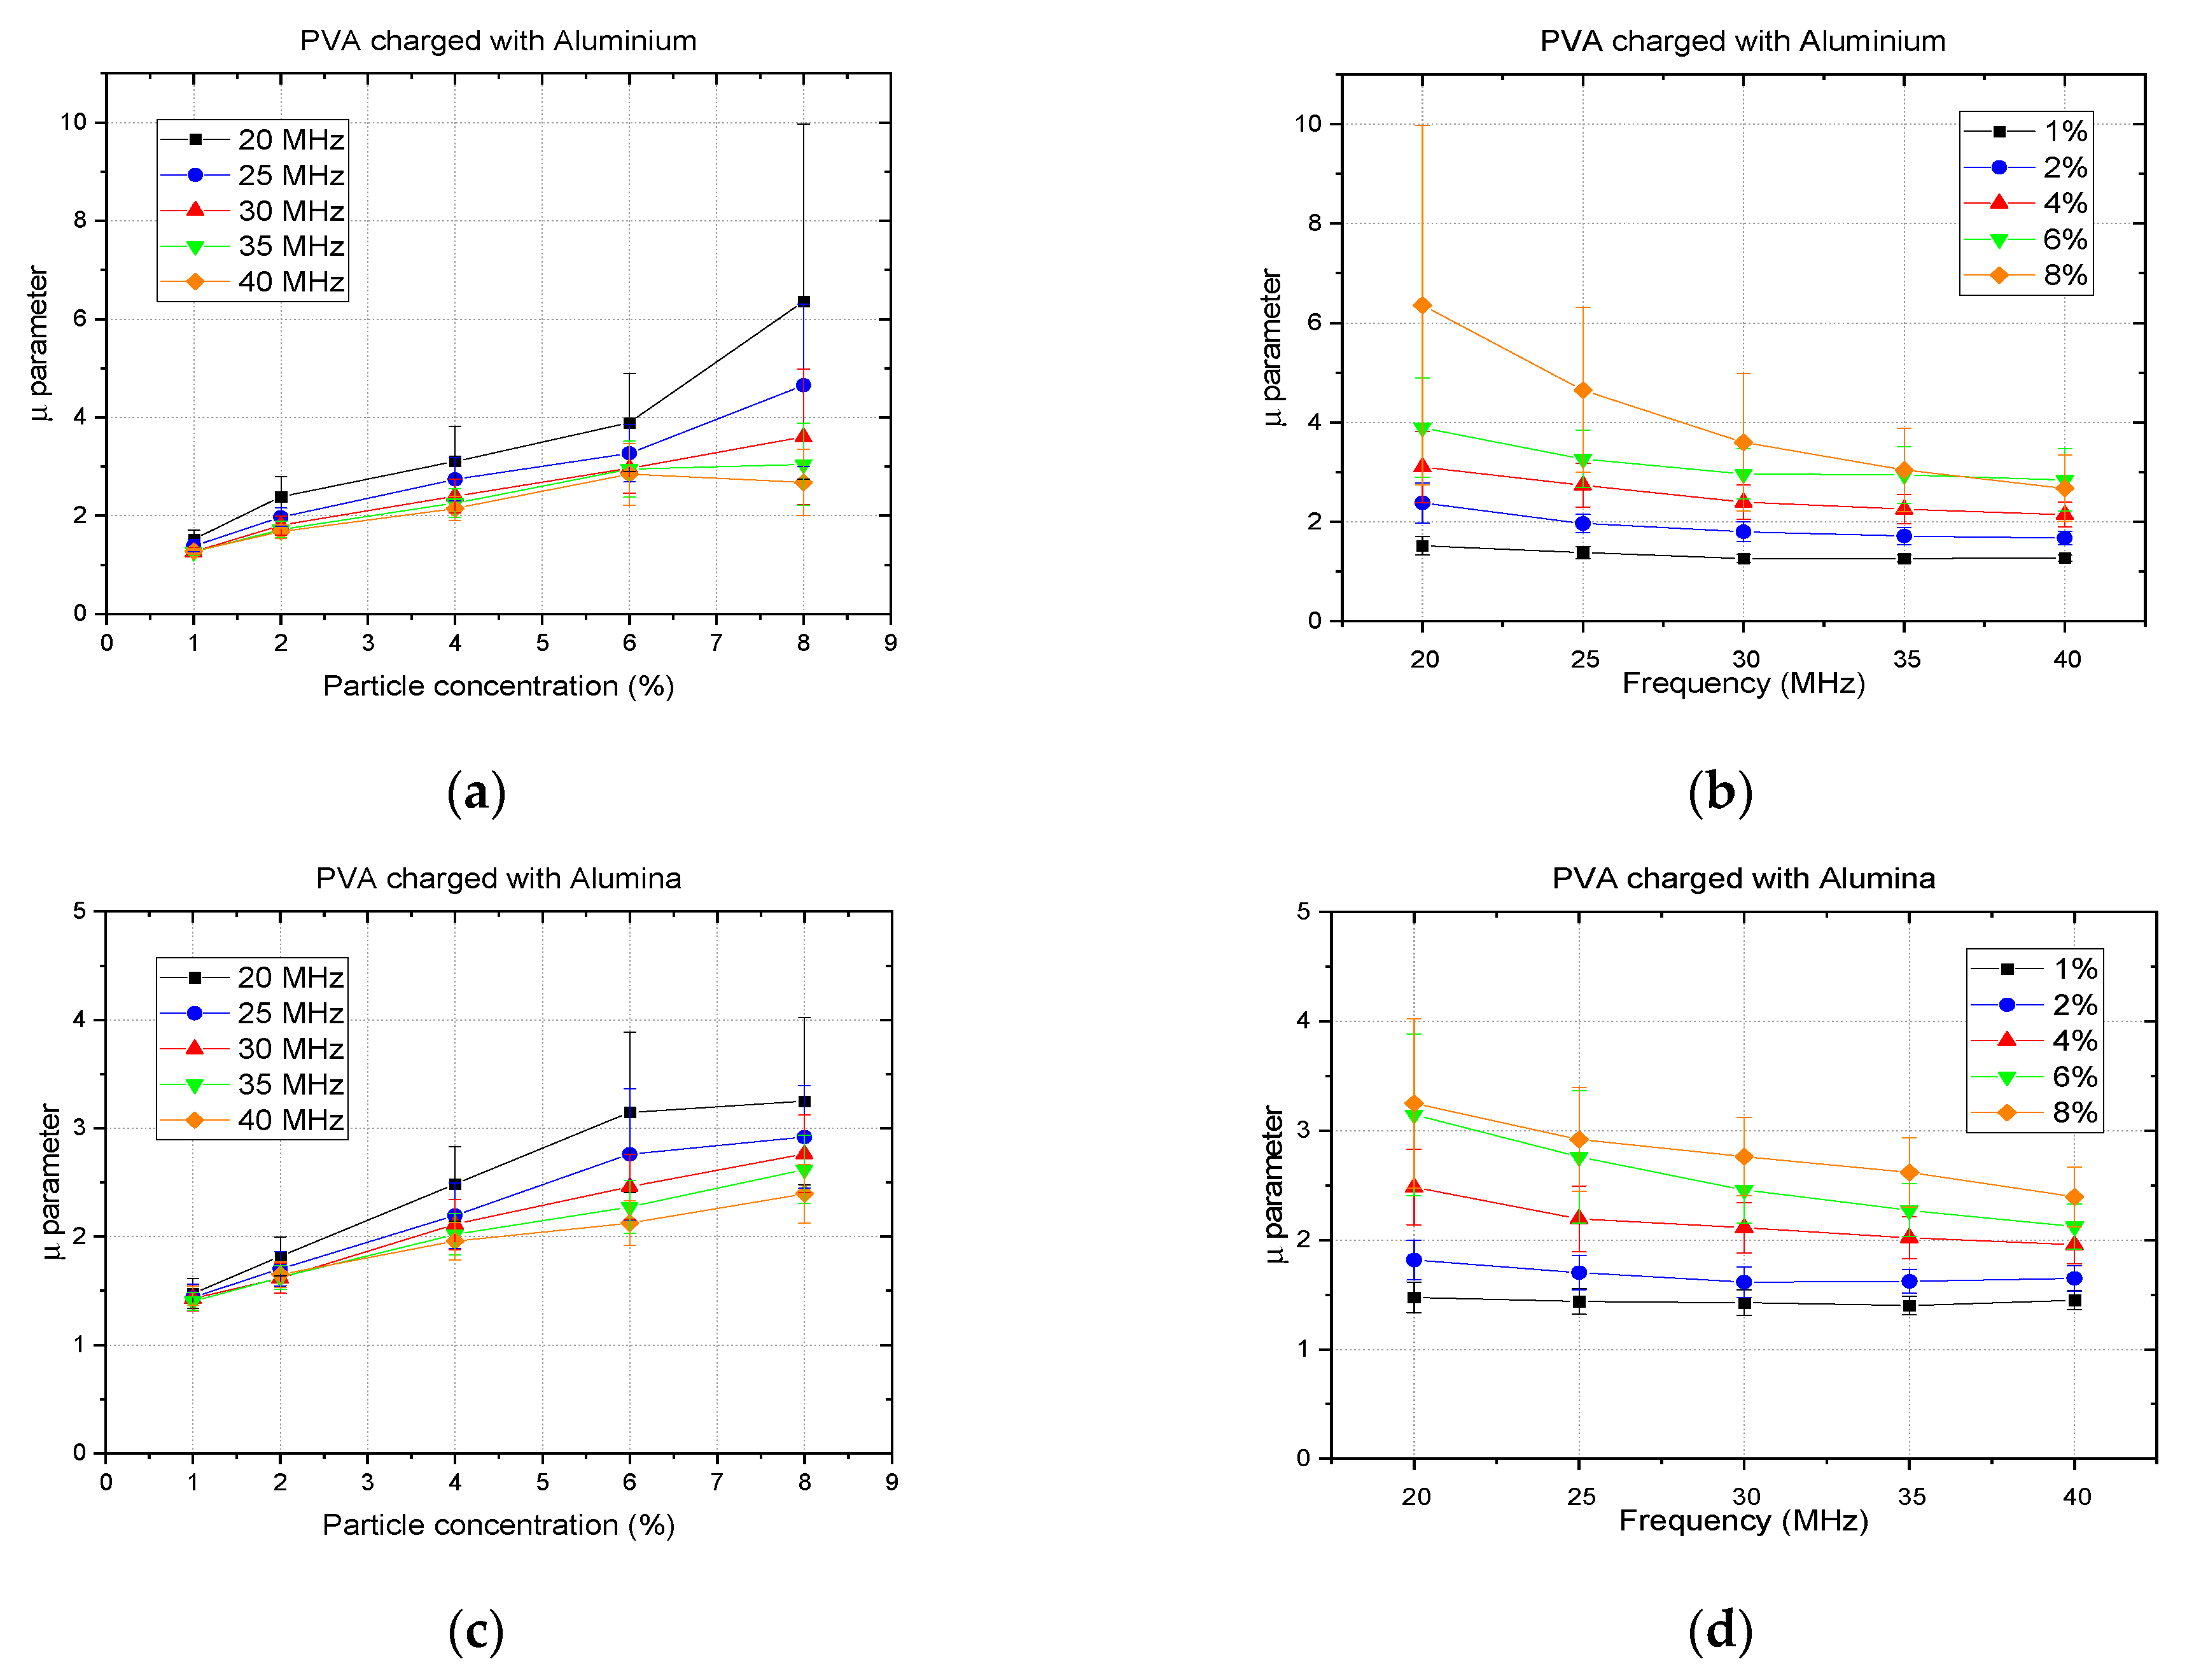
Averaged μ parameter results for all samples with corresponding error bars are shown in Figure 8. The overlapping of error bars was more pronounced for the highest particle concentrations and frequencies. Therefore, contrary to the behaviour of the attenuation coefficient as a descriptor, the μ parameter appears better suited for discriminating materials at low scatterer concentrations and for using the lowest frequencies.
Comparing the behaviour of both the attenuation coefficient and the μ parameter as a function of particle concentration (Figure 6a,c and Figure 8a,c), it can be observed that changes in the slope of the parameters with changes in concentration were consistent for both of them. For example, a change from 6% to 8% concentration in the case of the aluminium-charged samples caused a steep increase in the slope compared with the overall stable trend at lower concentrations, as can be seen in Figure 6a and Figure 8a. This steeper slope appears for both the attenuation coefficient and the μ parameter. The same coherence among these parameters occurs, but with a decrease in the steepness of the slope when there is a change from 6% to 8% concentration in the case of the alumina-charged materials (Figure 6c and Figure 8c); both attenuation coefficients register the same behaviour. This coherence suggests that variations in the expected slope might be the result of local changes in the concentration of particles in the material during the curing process.

3.2. Multimodal Image of the Composite Phantom

Unlike the single-material samples, the composite phantom was intentionally designed to include variations in acoustic characteristics, simulating the presence of interfaces between different tissues. This more realistic setup allowed for the study of the performance of the proposed algorithms in scenarios where tissue boundaries were present.
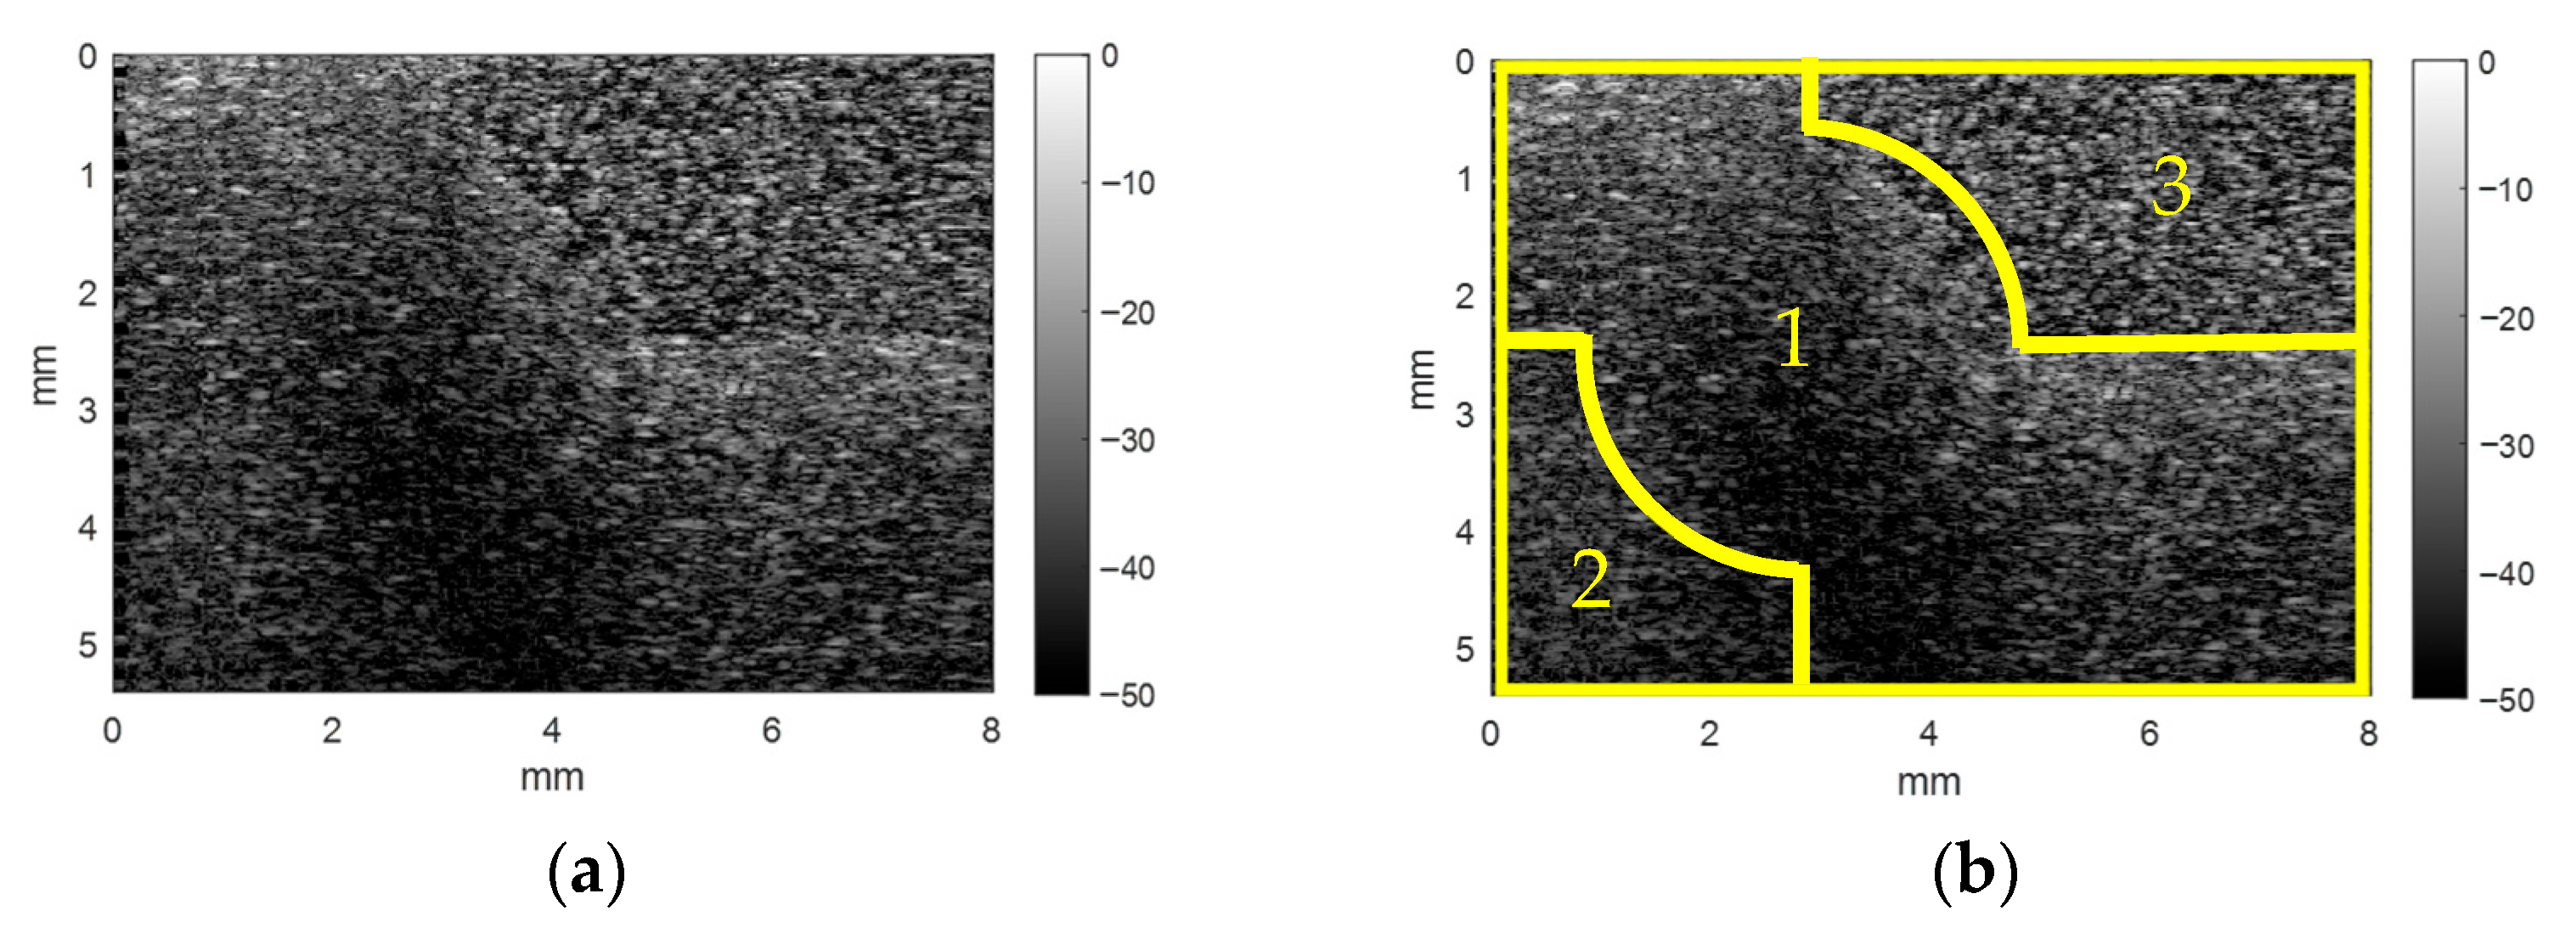
The echo envelope analysis of the composite phantom (Figure 9) was performed using a conventional black and white palette similar to medical B-scans. The boundaries between materials 1 and 3 were barely visible in the centre of the right side of Figure 9a as a horizontal interface, while no noticeable limit was observed between materials 1 and 2. The B-scan image of material 1 displayed a shadow at the bottom central part, which might be misinterpreted as another material. However, this shadow was likely the result of the high attenuation of material 1. To adjust the relative position between acquired data and the material boundaries shown in Figure 9b, the interface between materials 1 and 3 was used as a reference. Overall, the B-scan images of all the PVA-based materials forming the phantom appeared quite similar, making discrimination among them a challenging task based solely on this representation.
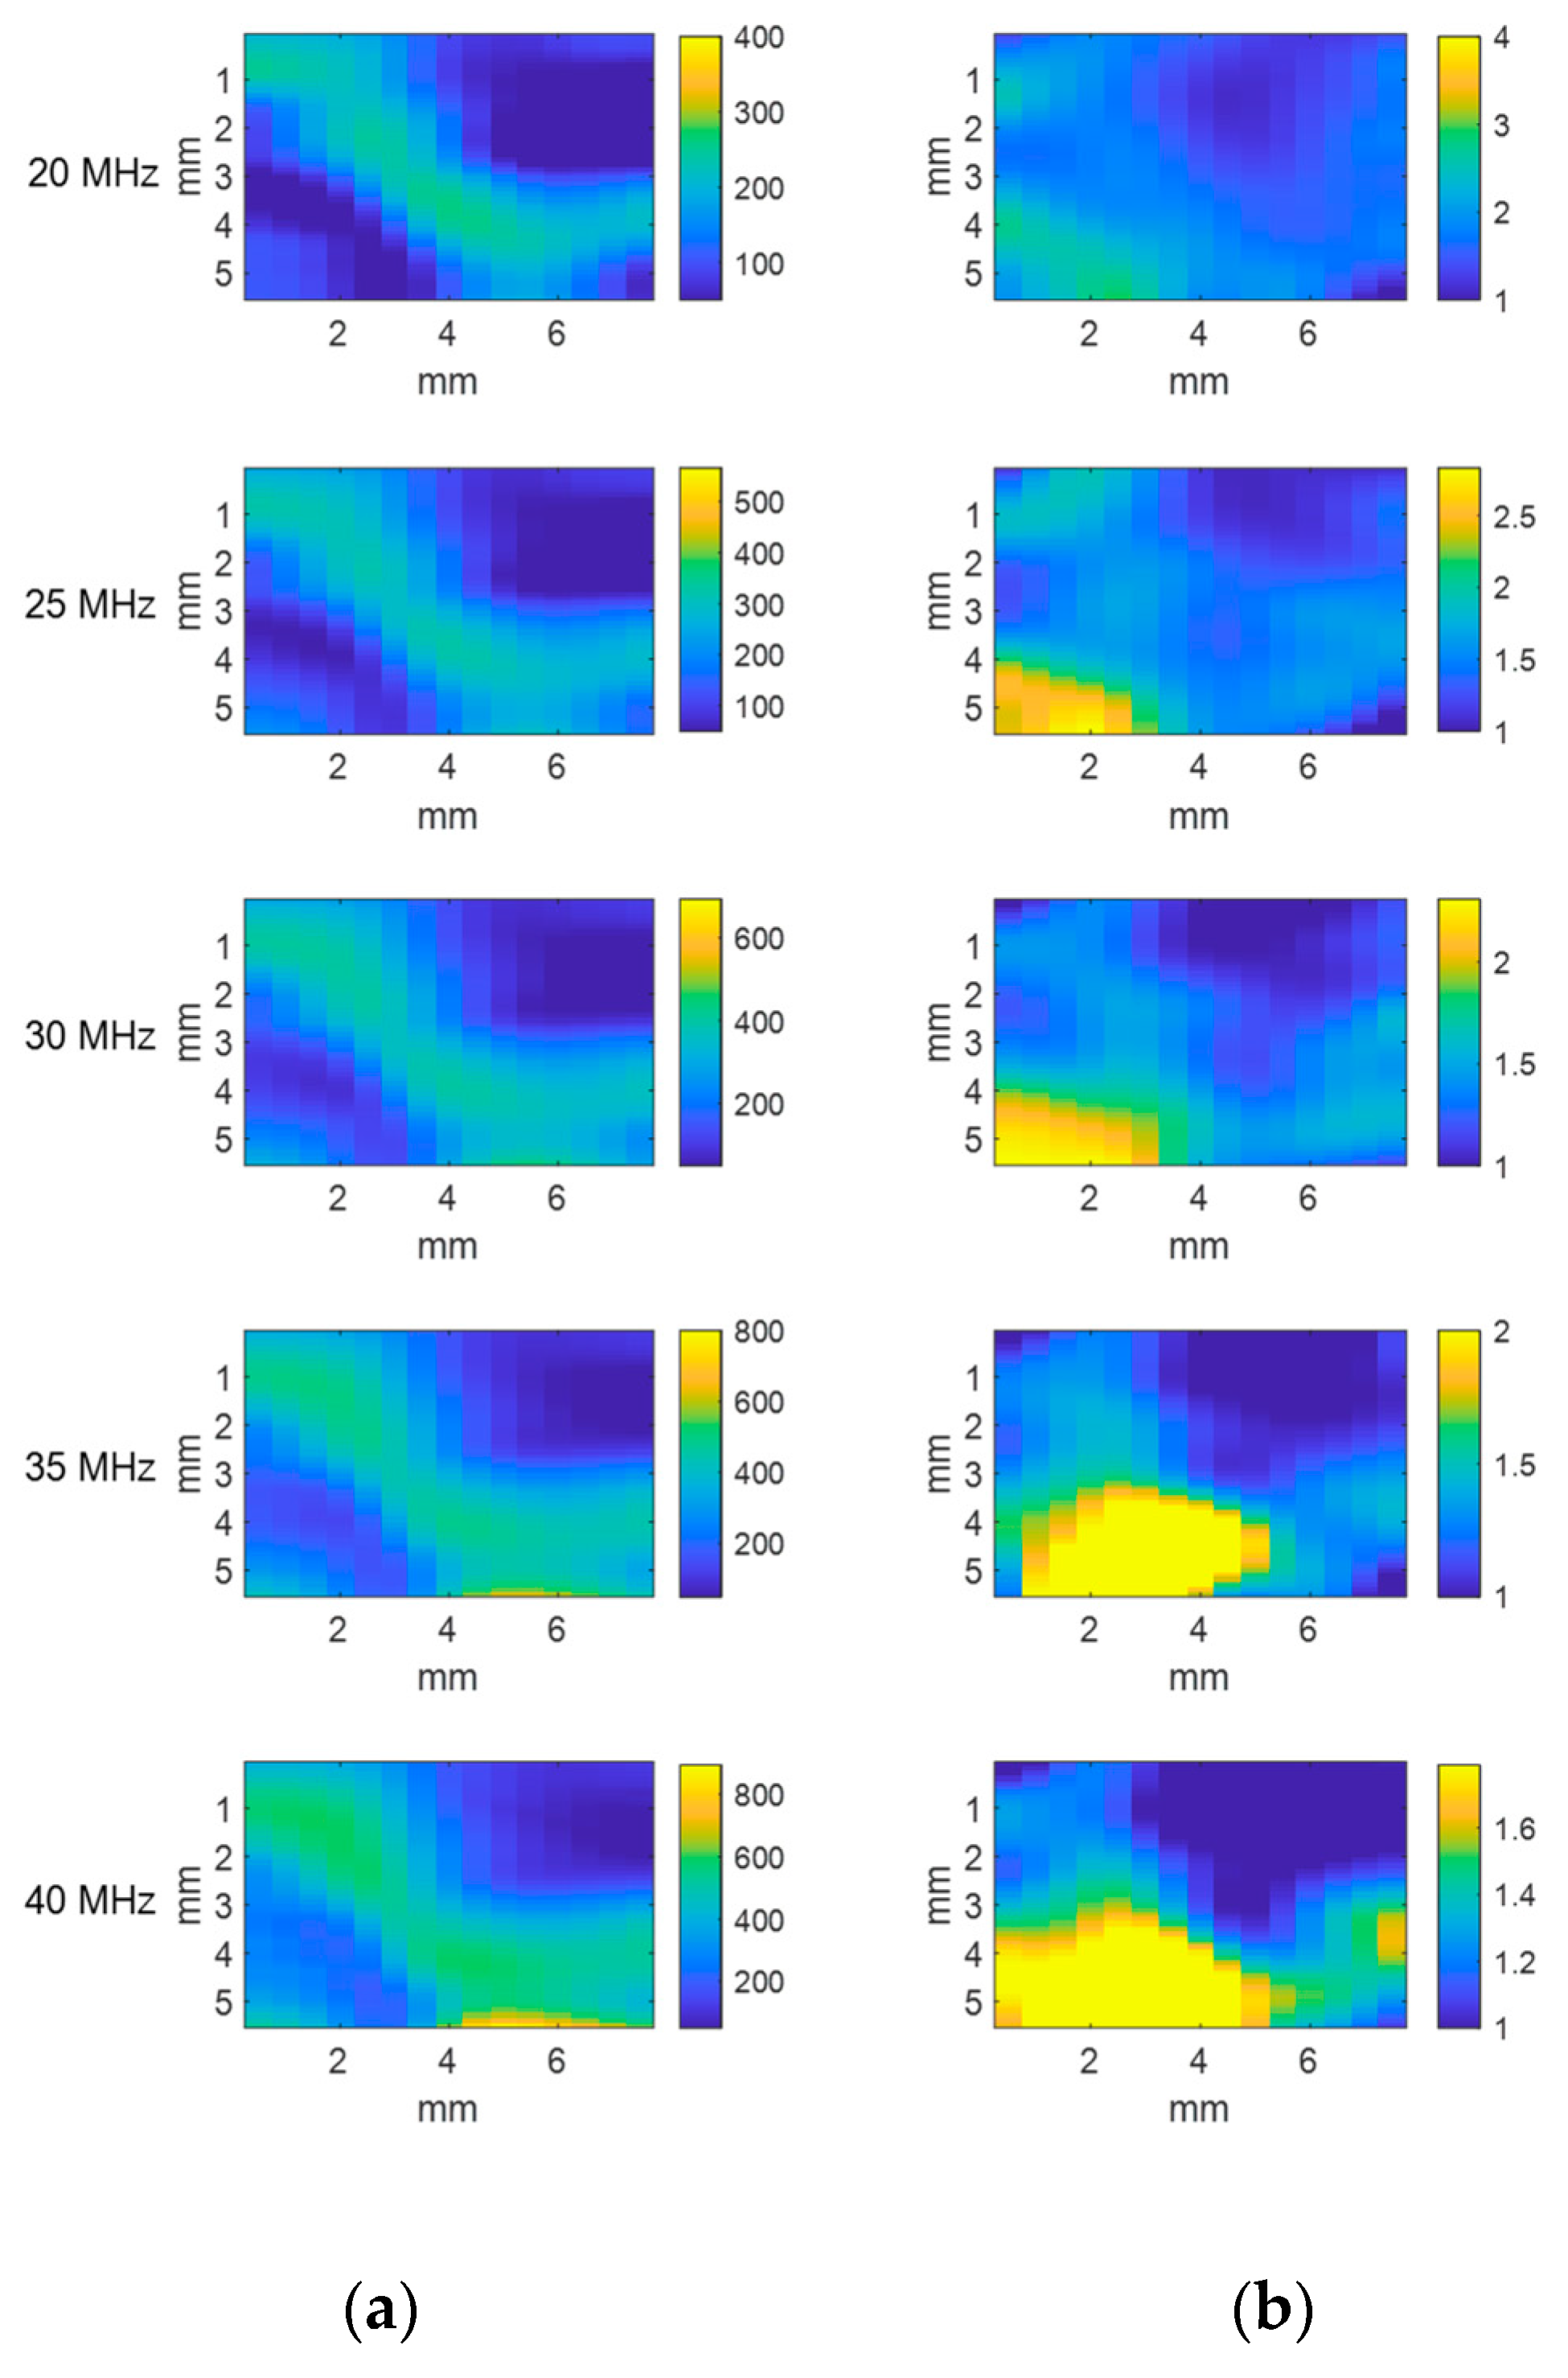
The same dataset was then processed using the algorithm to calculate both the attenuation coefficient and the μ parameter (Figure 10). The attenuation coefficient showed a high amplitude region distributed along the diagonal from the top-left to the bottom-right corner, which corresponds to the region occupied by material 1. It also shows a clear low attenuation region at the upper right corner corresponding to material 3. On the other side, the lower left corner (material 2) has a different behaviour as a function of frequency, being closer to the upper right corner at low frequencies and closer to the diagonal region at high frequencies. Based only on attenuation images, it is hard to distinguish materials 2 and 3. The same happens with materials 1 and 3 if only the μ parameter was analysed. This points out the higher efficiency of multiparametric quantitative analysis related to simple models based only on the attenuation coefficient or the μ parameter.
The μ parameter showed a dominant high value in the lower left corner, corresponding to material 2, with a trend of decreasing values towards the upper right corner (material 3), especially at higher frequencies.
The results indicated that the attenuation coefficient was able to clearly distinguish material 1 from materials 2 and 3, while the μ parameter detected a region with a high density of scatterers, corresponding to material 2. Finally, material 3 is clearly different from material 2 in terms of the μ parameter and from material 1 in terms of attenuation. This experiment showcased the capacity of the quantitative algorithm to discriminate among materials. Furthermore, combining both the attenuation coefficient and the μ parameter improved this algorithm’s performance, making it more effective in discriminating materials. In contrast, B-scan images are more difficult to interpret and, consequently, more dependent on the observer.
To address the need for an effective representation of both parameters in a single image, a bi-parametric representation was proposed (Figure 11) for the central frequency of 30 MHz. A colour representation is commonly used for other multimodal ultrasound data representation such as Doppler, elastography, etc., which are commonly superimposed to a grey-scaled B-scan image. More recently, when more than two parameters needed to be represented, more complex representations were proposed such as the RGB-based palettes used to represent scattering and reflection characteristics [32,33]. In this work, we chose a palette that could be correlated with the quantitative values of the attenuation coefficient and the μ parameter through a bi-dimensional colour scaling (Figure 11b), which was then plotted with the corresponding tissue images (Figure 11a,c). In this representation, each coloured pixel represented the combination of both parameters, with colours increasing their red content with an increasing attenuation coefficient and their green content with an increasing μ parameter. Colours moving towards black or yellow indicated low or high values of both variables, respectively.
The images resulting from this representation were more complex to analyse quantitatively compared with single-parameter representations. However, they could be used for a quick identification of materials. The dominance of orange in the image corresponded to a μ parameter close to 1.2 and attenuations close to 300 Np/m and clearly identified material 1. On the other side, the yellow region, with a μ parameter above 1.6, and the dark region, with attenuations under 200 Np/m, indicated the locations of the other two materials, 2 and 3, respectively. The bi-parametric representation was found to fit well with the geometrical distribution of the materials, with their boundaries delimited by the yellow-line mask (Figure 11c) being proposed for the first time to represent the μ parameter and the attenuation coefficient together.
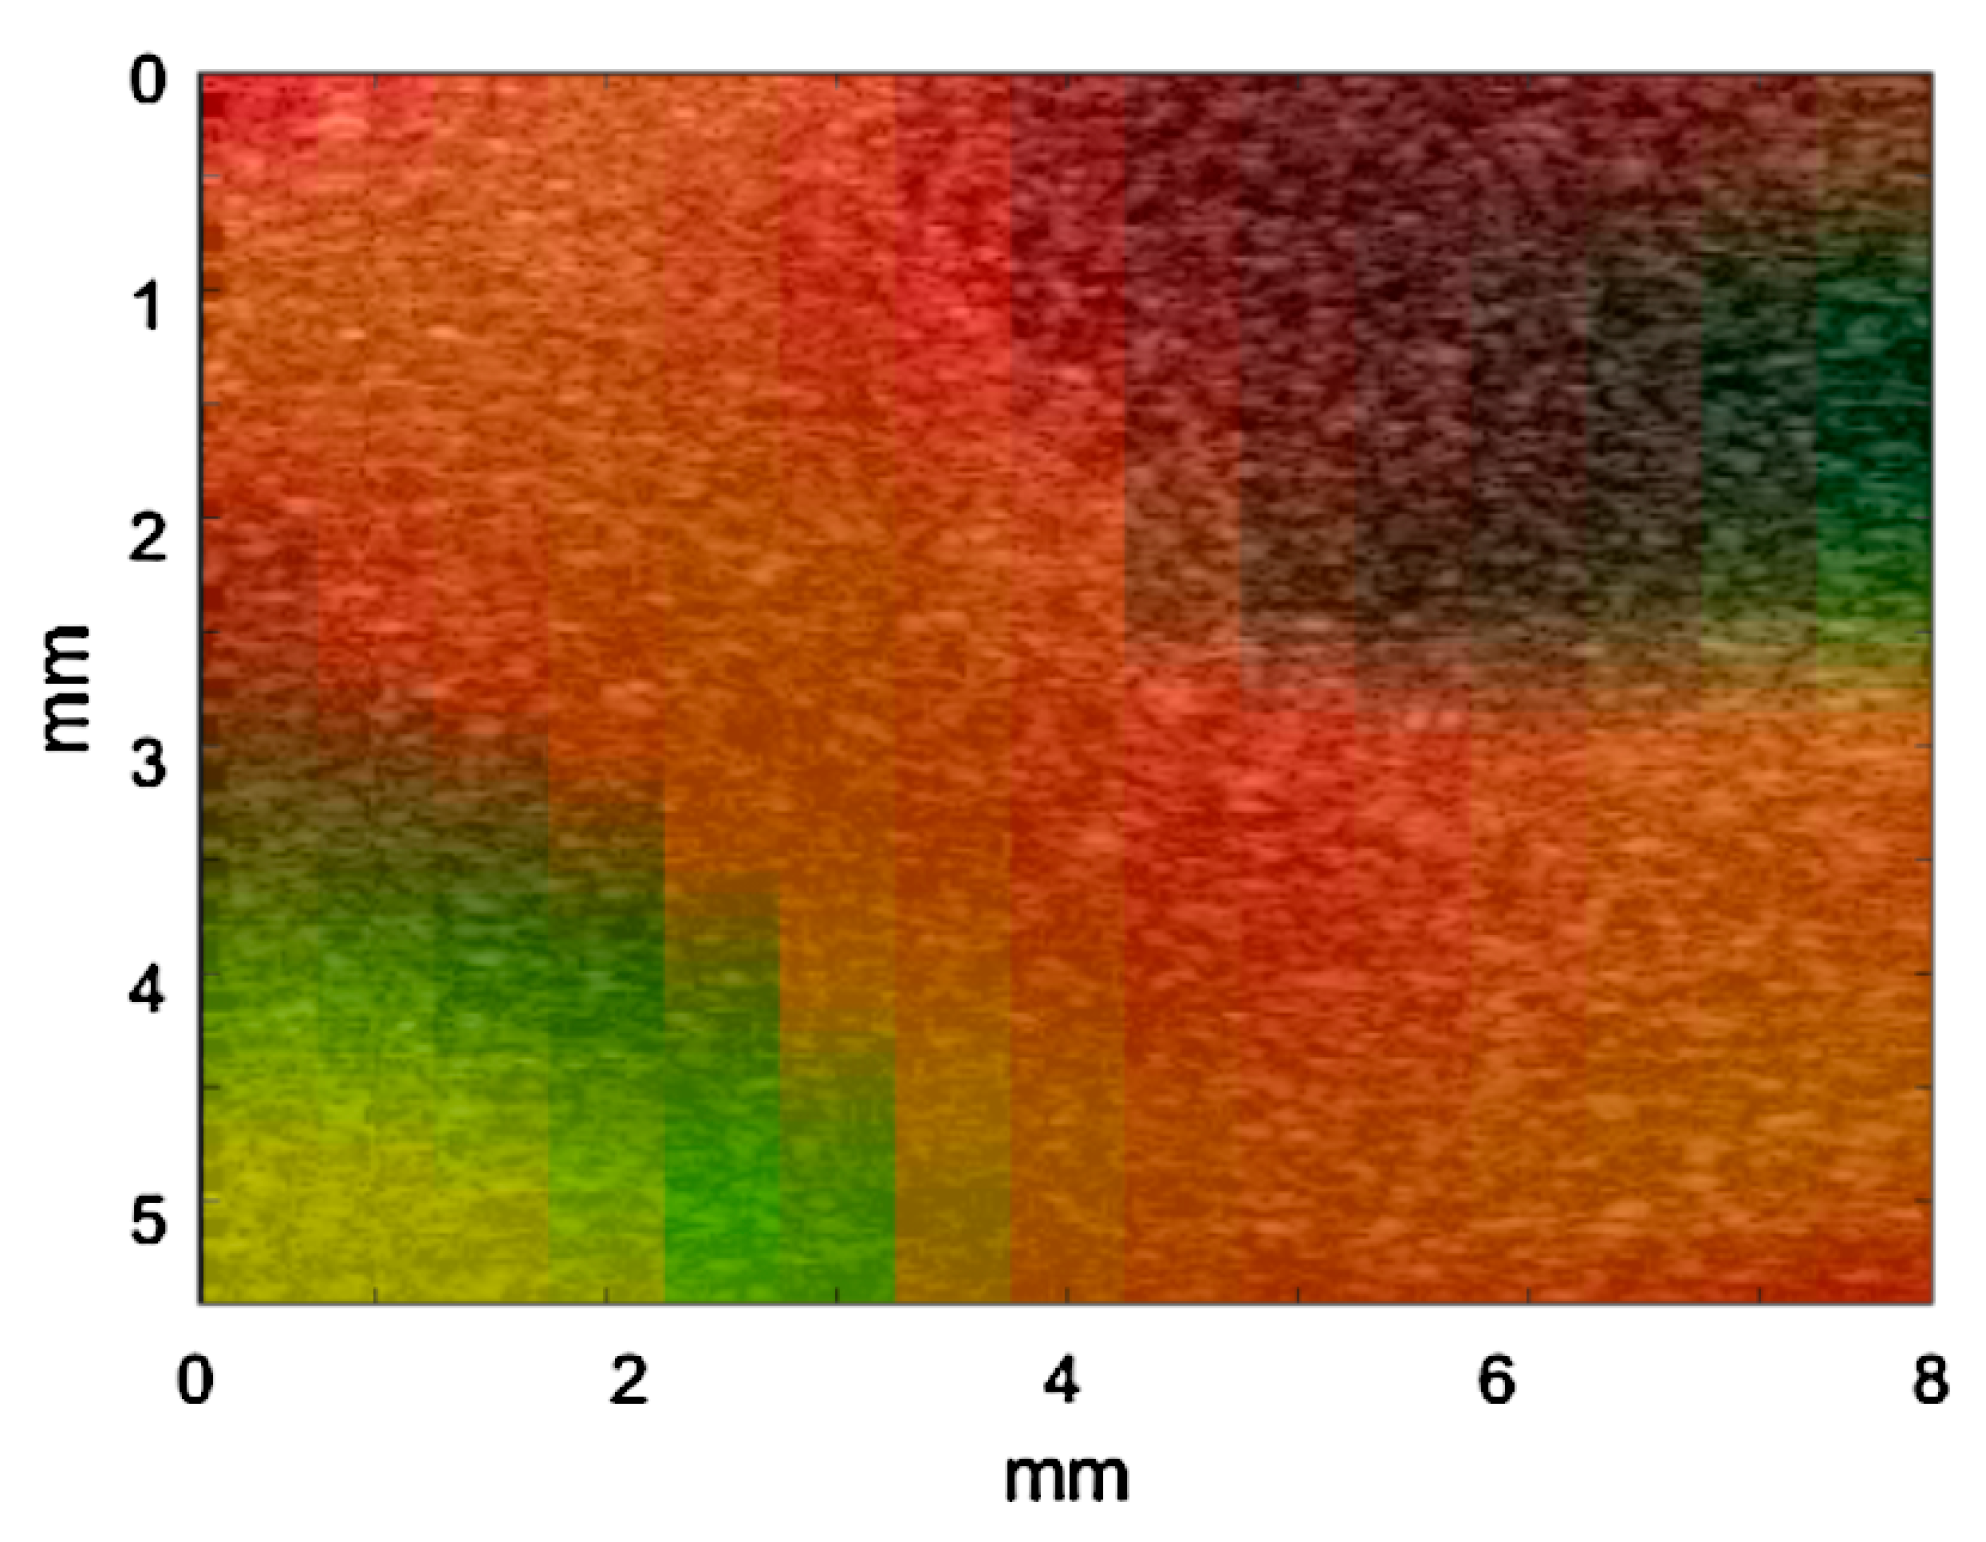
Finally, Figure 12 combines this bi-parametric representation with conventional black and white B-scan images, providing transparency to the colour palette belonging to the bi-parametric representation. Although the quantification provided by the colour scaling of Figure 11b was lost, this representation allowed for the application of different information layers that could be shown or hidden by the user within a given tissue image, offering valuable insights into the tissue’s characteristics and structure.

4. Conclusions

This paper introduced and demonstrated the use of quantitative methods based on envelope statistics to characterize the acoustic attenuation coefficient and scatterer clustering of tissues together, enhancing the information provided by conventional ultrasound B-scans.
It was shown how envelope statistics based on data fitting to the Homodyned K-distribution can be used to obtain information about the attenuation coefficient. A previous splitting of the wideband radio frequency signal by band filtering at selected frequencies was proposed in order to proceed with further data processing using envelope statistics algorithms.
To assess the performance of the method for the analysis of experimental ultrasound images, an arrangement based on a single-transducer scanning system was used to characterize a set of tissue-mimicking samples manufactured for this study. The transducer incorporated into the system had a 6 mm diameter active element, a spherical focalization with a 10 mm curvature radius, and a wideband radio frequency going from 20 MHz up to 70 MHz. It was excited with a wideband pulser using a pulse–echo working configuration. The transducer was mounted on a precision motion system to perform 2D scans. The samples analysed were made from a PVA–water solution (10% w/w) gels. To make materials with different characteristics, mass concentrations from 1% to 8% of different particles (aluminium, alumina and cellulose) were added to the samples.
B-scan, attenuation coefficient, and μ parameter images were obtained for all the scanned samples. These quantitative parameters were analysed as a function of particle concentration and frequency for the single-material samples, and the standard deviation of the data was also assessed. Results showed that these quantitative parameters could effectively distinguish samples with different particle concentrations, even when subtle variations in echo envelope patterns were present. The attenuation coefficient showed better performance at higher frequencies, while the μ parameter performed better at lower frequencies and concentrations. The study on the composite phantom demonstrated the ability of the proposed methodology to characterize materials with varying characteristics and interfaces. Images of the attenuation coefficient and the μ parameter provided quantitative information about the different materials in the composite phantom. Additionally, a bi-parametric mapping of these magnitudes was proposed, offering a fast identification of the geometrical distributions of different materials in the sample. This representation could be combined with B-scan images to provide tri-modal information about a given tissue.
In conclusion, it was shown that the attenuation coefficient of a scattering material can be obtained from the statistical analysis of envelopes with the help of the Homodyned K-distribution. This approach was used to enhance the information yielded by ultrasound scanning through the generation of multimodal images based on the attenuation coefficient and the clustering of scatterers (by using the single model presented in this work), as well as the conventional tissue echo envelope. The implementation of such quantitative analyses proved successful for the ultrasound characterization of the phantoms developed in this work. However, as noted previously, the inherent anisotropy and boundary irregularities of biological tissues may affect the ability of the algorithms to accurately characterize them. Consequently, further studies on real biological tissues are required to fully assess the potential of the proposed methodology.

Author Contributions

Conceptualization and methodology, L.E.; formal analysis, L.E. and A.I.; investigation, L.E., C.d.L. and C.D.; writing—original draft preparation, L.E.; writing—review and editing, A.I., M.P. and Ó.M.-G. All authors have read and agreed to the published version of the manuscript.

Funding

This work was supported by the projects PID2019-111392RB-I00 and PID2022-138013OB-I00 from the Spanish Ministry of Science and Innovation. This work has been funded with EUR 1.026 million by the Comunidad de Madrid through the LUNABRAIN-CM R&D activities program (TEC-2024/TEC-43), granted by Order 5696/2024.

Data Availability Statement

The original data obtained experimentally and analysed as described in the present study are openly available in the DIGITAL.CSIC repository at http://hdl.handle.net/10261/394298 (accessed on 9 September 2025).

Conflicts of Interest

The authors declare no conflicts of interest.

Abbreviations

The following abbreviations are used in this manuscript:
PVApoly-vinyl alcohol

References

  1. Lizzi, F.; Ostromogilsky, M.; Feleppa, E.; Rorke, M.; Yaremko, M. Relationship of ultrasonic spectral parameters to features of tissue microstructure. IEEE Trans. Ultrason. Ferroelectr. Freq. Control. 1987, 34, 319–329. [Google Scholar] [CrossRef]
  2. Muleki-Seya, P.; Han, A.; Andre, M.P.; Erdman, J.W., Jr.; O’bRien, W.D., Jr. Analysis of two quantitative ultrasound approaches. Ultrason. Imaging 2018, 40, 84–96. [Google Scholar] [CrossRef]
  3. Labyed, Y.; Bigelow, T.A. Estimating the total ultrasound attenuation along the propagation path by using a reference phantom. J. Acoust. Soc. Am. 2010, 128, 3232–3238. [Google Scholar] [CrossRef] [PubMed]
  4. Bigelow, T.A. Estimating the total ultrasound attenuation along the propagation path by applying multiple filters to backscattered echoes from a single spherically focused source. IEEE Trans. Ultrason. Ferroelectr. Freq. Control. 2010, 57, 900–907. [Google Scholar] [CrossRef]
  5. Kim, H.; Varghese, T. Hybrid spectral domain method for attenuation slope estimation. Ultrasound Med. Biol. 2008, 34, 1808–1819. [Google Scholar] [CrossRef] [PubMed]
  6. Zhou, Z.; Zhang, Q.; Wu, W.; Wu, S.; Tsui, P.-H. Hepatic steatosis assessment using quantitative ultrasound parametric imaging based on backscatter envelope statistics. Appl. Sci. 2019, 9, 661. [Google Scholar] [CrossRef]
  7. Destrempes, F.; Cloutier, G. A Critical Review and Uniformized Representation of Statistical Distributions Modeling the Ultrasound Echo Envelope. Ultrasound Med. Biol. 2010, 36, 1037–1051. [Google Scholar] [CrossRef]
  8. Piotrzkowska, H.; Litniewski, J.; Lewandowski, M.; Szymanska, E.; Nowicki, A. Use of quantitative ultrasound to measure acoustic properties of human skin. Arch. Acoust. 2009, 34, 471–480. [Google Scholar]
  9. Omura, M.; Coron, A.; Bridal, S.L.; Yoshida, K.; Yamaguchi, T. Quantitative ultrasound imaging of bacterial infection on skin ulcers by envelope statistics analysis. In Proceedings of the 2016 IEEE International Ultrasonics Symposium (IUS), Tours, France, 18–21 September 2016; pp. 1–4. [Google Scholar] [CrossRef]
  10. Yamaguchi, T.; Hachiya, H. Proposal of a parametric imaging method for quantitative diagnosis of liver fibrosis. J. Med. Ultrason. 2010, 37, 155–166. [Google Scholar] [CrossRef]
  11. Bigelow, T.A.; McFarlin, B.L.; O’bRien, W.D.; Oelze, M.L. In vivo ultrasonic attenuation slope estimates for detecting cervical ripening in rats: Preliminary results. J. Acoust. Soc. Am. 2008, 123, 1794–1800. [Google Scholar] [CrossRef]
  12. Mamou, J.; Coron, A.; Oelze, M.L.; Saegusa-Beecroft, E.; Hata, M.; Lee, P.; Machi, J.; Yanagihara, E.; Laugier, P.; Feleppa, E.J. Three-Dimensional High-Frequency Backscatter and Envelope Quantification of Cancerous Human Lymph Nodes. Ultrasound Med. Biol. 2011, 37, 345–357. [Google Scholar] [CrossRef]
  13. Sadeghi-Naini, A.; Papanicolau, N.; Falou, O.; Zubovits, J.; Dent, R.; Verma, S.; Trudeau, M.; Boileau, J.F.; Spayne, J.; Iradji, S.; et al. Quantitative ultrasound evaluation of tumor cell death response in locally advanced breast cancer patients receiving chemotherapy. Clin. Cancer Res. 2013, 19, 2163–2174. [Google Scholar] [CrossRef]
  14. Rohrbach, D.; Wodlinger, B.; Wen, J.; Mamou, J.; Feleppa, E.J. High-Frequency quantitative ultrasound for imaging prostate cancer using a novel micro-ultrasound scanner. Ultrasound Med. Biol. 2018, 44, 1341–1354. [Google Scholar] [CrossRef]
  15. Rosado-Mendez, I.M.; Noguchi, K.K.; Castañeda-Martinez, L.; Kirvassilis, G.; Wang, S.H.; Manzella, F.; Swiney, B.S.; Masuoka, K.; Capuano, S.; Brunner, K.G.; et al. Quantitative ultrasound and apoptotic death in the neonatal primate brain. Neurobiol. Dis. 2019, 127, 554–562. [Google Scholar] [CrossRef] [PubMed]
  16. Cloutier, G.; Destrempes, F.; Yu, F.; Tang, A. Quantitative ultrasound imaging of soft biological tissues: A primer for radiologists and medical physicists. Insights Imaging 2021, 12, 127. [Google Scholar] [CrossRef]
  17. Becker, A.S.; Mueller, M.; Stoffel, E.; Marcon, M.; Ghafoor, S.; Boss, A. Classification of breast cancer in ultrasound imaging using a generic deep learning analysis software: A pilot study. Br. J. Radiol. 2018, 91, 20170576. [Google Scholar] [CrossRef]
  18. Brattain, L.J.; Telfer, B.A.; Dhyani, M.; Grajo, J.R.; Samir, A.E. Machine learning for medical ultrasound: Status, methods, and future opportunities. Abdom. Radiol. 2018, 43, 786–799. [Google Scholar] [CrossRef]
  19. Liu, S.; Wang, Y.; Yang, X.; Lei, B.; Liu, L.; Li, S.X.; Ni, D.; Wang, T. Deep Learning in Medical Ultrasound Analysis: A Review. Engineering 2019, 5, 261–275. [Google Scholar] [CrossRef]
  20. Skandha, S.S.; Nicolaides, A.; Gupta, S.K.; Koppula, V.K.; Saba, L.; Johri, A.M.; Kalra, M.S.; Suri, J.S. A hybrid deep learning paradigm for carotid plaque tissue characterization and its validation in multicenter cohorts using a supercomputer framework. Comput. Biol. Med. 2022, 141, 105131. [Google Scholar] [CrossRef] [PubMed]
  21. Sahashi, Y.; Kawasaki, M.; Okubo, M.; Kawamura, I.; Kawase, Y.; Yoshida, A.; Tanaka, T.; Hattori, A.; Matsuo, H.; Ozaki, Y. Development of 60 MHz integrated backscatter intravascular ultrasound and tissue characterization of attenuated signal coronary plaques that cause myocardial injury after percutaneous coronary intervention. Heart Vessel. 2022, 37, 1689–1700. [Google Scholar] [CrossRef]
  22. Fernández, A.; Ibáñez, A.; Parrilla, M.; Elvira, L.; Bassat, Q.; Jiménez, J. Estimation of the concentration of particles in suspension based on envelope statistics of ultrasound backscattering. Ultrasonics 2021, 116, 106501. [Google Scholar] [CrossRef]
  23. Elvira, L.; Fernández, A.; León, L.; Ibáñez, A.; Parrilla, M.; Martínez, Ó.; Jiménez, J. Evaluation of the Cell Concentration in Suspensions of Human Leukocytes by Ultrasound Imaging: The Influence of Size Dispersion and Cell Type. Sensors 2023, 23, 977. [Google Scholar] [CrossRef] [PubMed]
  24. Destrempes, F.; Cloutier, G. Statistical modeling of ultrasound signals related to the packing factor of wave scattering phenomena for structural characterization. J. Acoust. Soc. Am. 2021, 150, 3544–3556. [Google Scholar] [CrossRef]
  25. Oelze, M.L.; Mamou, J. Review of Quantitative Ultrasound: Envelope Statistics and Backscatter Coefficient Imaging and Contributions to Diagnostic Ultrasound. IEEE Trans. Ultrason. Ferroelectr. Freq. Control. 2016, 63, 336–351. [Google Scholar] [CrossRef]
  26. Destrempes, F.; Cloutier, G. Review of envelope statistics models for quantitative ultrasound imaging and tissue characterization. In Quantitative Ultrasound in Soft Tissues; Mamou, J., Oelze, M., Eds.; Springer: Dordrecht, The Netherlands, 2013; pp. 219–274. [Google Scholar] [CrossRef]
  27. Jakeman, E. On the statistics of K-distributed noise. J. Phys. A Math. Gen. 1980, 13, 31–48. [Google Scholar] [CrossRef]
  28. Dutt, V.; Greenleaf, J.F. Ultrasound echo envelope analysis using a homodyned K distribution signal model. Ultrason. Imaging 1994, 16, 265–287. [Google Scholar] [CrossRef]
  29. Bigelow, T.A.; Labyed, Y. Attenuation Compensation and Estimation. In Quantitative Ultrasound in Soft Tissues; Mamou, J., Oelze, M., Eds.; Springer: Dordrecht, The Netherlands, 2013; pp. 71–93. [Google Scholar] [CrossRef]
  30. Szabo, T.L. Causal theories and data for acoustic attenuation obeying a frequency power law. J. Acoust. Soc. Am. 1995, 97, 14–24. [Google Scholar] [CrossRef]
  31. Elvira, L.; Durán, C.; Higuti, R.T.; Tiago, M.M.; Ibáñez, A.; Parrilla, M.; Valverde, E.; Jiménez, J.; Bassat, Q. Development and Characterization of Medical Phantoms for Ultrasound Imaging Based on Customizable and Mouldable Polyvinyl Alcohol Cryogel–Based Materials and 3-D Printing: Application to High-Frequency Cranial Ultrasonography in Infants. Ultrasound Med. Biol. 2019, 45, 2226–2241. [Google Scholar] [CrossRef]
  32. Parker, K.J. Scattering and reflection identification in H-scan images. Phys. Med. Biol. 2016, 61, L20–L28. [Google Scholar] [CrossRef] [PubMed]
  33. Khairalseed, M.; Brown, K.; Parker, K.J.; Hoyt, K. Real-time H-scan ultrasound imaging using a Verasonics research scanner. Ultrasonics 2019, 94, 28–36. [Google Scholar] [CrossRef] [PubMed]
Figure 1. As the distance between the transducer and the material decreases, ∆z represents the change in the space crossed by the beam in different materials (coupling material and tissue) between the i and i + 1 B-scans.
Applsci 15 09924 g001
Figure 2. Tissue phantoms based on poly-vinyl alcohol (PVA) made for the experiments. Photograph (a) shows parallelepipedic PVA layers loaded with aluminium 4% (dark grey) and alumina 4% (light grey) particles. At the right, in photograph (b), the composite phantom made of PVA loaded with aluminium and cellulose particles at different concentrations is shown, and the section view marked by the red arrow is detailed in diagram (c).
Applsci 15 09924 g002
Figure 3. Three different linear B-scans are shown in (a) at the upper, middle, and lower parts of the phantom. The red and yellow squares correspond to the signal windows used to calculate the Homodyned K-distribution parameters and the reflectivity global image, respectively. This last reflectivity image is shown in (b).
Applsci 15 09924 g003
Figure 4. Images of ultrasound reflectivity in decibels corresponding to 10 different samples made with PVA loaded with aluminium (a) and alumina (b) particles with different concentrations (1%, 2%, 4%, 6%, and 8%) ordered in rows. The decibel scale was referenced to the absolute maximum of the whole set of measurements.
Applsci 15 09924 g004
Figure 5. Images of the attenuation coefficient corresponding to 10 different samples made with PVA loaded with aluminium (a) and alumina (b) particles with different concentrations (1%, 2%, 4%, 6%, and 8%) ordered in columns. The rows show data obtained for different frequencies (20 MHz to 40 MHz in steps of 5 MHz).
Applsci 15 09924 g005
Figure 6. Plots of the attenuation coefficient as a function of particle concentration and frequency averaged along the whole sample. Upper (a,b) and lower (c,d) plots correspond to the PVA charged with aluminium and alumina, respectively. At the left (a,c), the attenuation was obtained as a function of the concentration and, at the right (b,d), as a function of the frequency.
Applsci 15 09924 g006
Figure 7. Images of the μ parameter corresponding to 10 different samples made with PVA loaded with aluminium (a) and alumina (b) particles with different concentrations (1%, 2%, 4%, 6%, and 8%) ordered in columns. The rows show data obtained for different frequencies (20 MHz to 40 MHz in steps of 5 MHz).
Applsci 15 09924 g007
Figure 8. Plots of the μ parameter as a function of particle concentration and frequency averaged along the whole sample. Upper (a,b) and lower (c,d) plots correspond to the PVA charged with aluminium and alumina, respectively. At the left (a,c), the attenuation was obtained as a function of the concentration and, at the right (b,d), as a function of the frequency.
Applsci 15 09924 g008
Figure 9. Reflectivity image in decibels without (a) and with (b) the superimposed diagram of boundaries between the different materials forming the composite phantom, where number 1 corresponds to PVA charged with 2% cellulose particles, number 2 corresponds to PVA charged with 3.5% aluminium particles, and number 3 corresponds to PVA charged with 1% aluminium particles.
Applsci 15 09924 g009
Figure 10. Images representing the attenuation coefficient in Np/m (a) and the μ parameter (b) of the composite phantom. Different rows correspond to the frequencies analysed (20–40 MHz in steps of 5 MHz).
Applsci 15 09924 g010
Figure 11. Bi-parametric representation of the attenuation coefficient and the μ parameter of the composite sample for results obtained at 30 MHz (a). The corresponding scale, which allows for quantitatively interpreting colours, is shown in (b). The same bi-parametric image of (a) with the material boundaries superimposed in yellow is presented in (c), where number 1 corresponds to PVA charged with 2% cellulose particles, number 2 corresponds to PVA charged with 3.5% aluminium particles, and number 3 corresponds to PVA charged with 1% aluminium particles.
Applsci 15 09924 g011
Figure 12. Combined image of the conventional B-scan (in gray scale) with the bi-parametric representation of the attenuation coefficient and the μ parameter obtained from the composite sample for the 30 MHz results. Quantitative parameters are added with transparency to allow the visibility of the B-scan.
Applsci 15 09924 g012
Disclaimer/Publisher’s Note: The statements, opinions and data contained in all publications are solely those of the individual author(s) and contributor(s) and not of MDPI and/or the editor(s). MDPI and/or the editor(s) disclaim responsibility for any injury to people or property resulting from any ideas, methods, instructions or products referred to in the content.