Article

Radiological Implications of Industrial Activities on Soil and Water: An Environmental Analytical Chemistry Perspective in Artisanal Gold-Mining Regions of Atiwa West

1
Department of Radiochemistry and Radioecology, University of Pannonia, 8200 Veszprem, Hungary
2
Radiation Protection Institute, Ghana Atomic Energy Commission, Accra P.O. Box LG 80, Ghana
3
GIS Department, Wallulel Ghana Ltd., Accra P.O. Box AN 1133, Ghana
*
Author to whom correspondence should be addressed.
Appl. Sci. 2025, 15(18), 9857; https://doi.org/10.3390/app15189857
Submission received: 6 June 2025 / Revised: 29 August 2025 / Accepted: 4 September 2025 / Published: 9 September 2025
(This article belongs to the Section Chemical and Molecular Sciences)

Abstract

Artisanal gold mining can enhance natural radioactivity in nearby environmental media. This study assessed health risks and environmental impacts associated with the release of natural radionuclides in Atiwa West, Ghana. Activities of naturally occurring radionuclides were measured in soil samples (Ra-226, Th-232, K-40) and water samples (Ra-226, Ra-228, K-40) by HPGe γ-spectrometry; Ra-226 in vegetation was estimated from soil activities using a transfer factor. The mean activity concentrations in soils were 22.1 ± 2.1 Bq/kg (Ra-226), 27.5 ± 2.3 Bq/kg (Th-232) and 198 ± 22 Bq/kg (K-40). At several water locations, Ra-226 and Ra-228 exceeded the WHO screening levels for drinking water of 1.0 Bq/L and 0.1 Bq/L, respectively. Radiological hazard indices attributable to inhalation and ingestion were evaluated. Overall, soil radiological risks were low; however, approximately 22% of sites recorded values above the global average annual gonadal dose equivalent (AGDE). In some locations, the committed effective dose from drinking water surpassed the WHO screening threshold of 0.1 mSv/y, with the associated excess lifetime cancer risk (ELCR) exceeding 2.9 × 10⁻⁴. Overall, the mining-affected waters presented a greater potential radiological impact than the soils, underscoring the need for water quality management and periodic monitoring in artisanal mining areas.

1. Introduction

Natural radioactivity has been widespread in the Earth’s environment since its beginning, occurring in soil, water, air and vegetation. The concentration of radioactivity and the resulting external gamma radiation are largely determined by the geological and geographical characteristics of a given area [1,2,3,4,5,6,7,8,9,10]. Consequently, natural radiation represents the predominant source of external dose to the global population [2,4,11,12]. In the terrestrial environment, the natural radionuclides of concern are predominantly Ra-226, Th-232, K-40 and radioactive Rn-222 gas [3,7]. Soil and water contamination by radionuclides is one of the most serious environmental issues in terrestrial ecosystems because it serves as a pathway for inhalation and ingestion for radiation exposure in persons. As a result, their investigation is crucial in determining the level of contamination and continuous monitoring in the terrestrial environment [1,12,13,14,15].
Radionuclides can be transferred through the environment by several paths such as through water resources, soil sub-compartments and the atmosphere, contributing to public exposure [16,17]. Consequently, the public is exposed to natural radioactivity through secondary transmission modes, including ingestion of contaminated water resources; consumption of food grown on contaminated lands, as illustrated in Figure 1 (via irrigation or deposition); and consumption of contaminated animals [18,19]. The transfer of radionuclides from soil to water or plants (known as the transfer or concentration factor) is a significant factor in estimating the internal radiation dose due to water or plant ingestion since it is known that there is a linear correlation between these environmental media [16].
Human activities such as mining can redistribute and enhance the concentrations of radionuclides, leading to their accumulation in the environment, thereby altering natural concentrations [14,20,21]. In undisturbed natural settings, radionuclides within a decay series are typically in radiological equilibrium; however, disequilibrium occurs in the event of activities such as mining and mineral processing [21]. For this reason, radioactivity in mining zones is generally higher than in surrounding areas, thus increasing the background gamma radiation levels [22].
Gold mining has been recognized as a potential source of radiation exposure, primarily because naturally occurring radionuclides are released into the surrounding environment. This concern has led to increasing global interest in evaluating levels of radioactivity in both soils and water within mining zones and their neighboring areas [23,24,25]. In such settings, radiation exposure can affect not only miners but also nearby communities. The main pathways include direct exposure to external gamma rays emitted by mineral ores, inhalation and ingestion of dust particles or water containing uranium- and thorium-derived radionuclides, and inhalation of short-lived radon progeny. These risks emerge throughout different stages of mining operations, such as drilling, ore extraction and processing (e.g., leaching), storage and transportation of raw materials, seepage of radionuclides through tailings, and even the handling of contaminated tools or waste materials when adequate protective measures are absent [7,8,10,23,26,27]. Residents living near mining areas can also be exposed through drinking water, the food chain or the reuse of mine waste as construction materials [28,29,30]. The continual release of mine waste and tailings into the environment may cause an accumulation of radionuclides in soil, air and water, and subsequently an increase in radiation exposure in humans [31]. According to the literature, tailings from gold mines have significantly higher concentrations of Ra-226, Th-232 and K-40 than normal soil. This means that if mining activities are not appropriately monitored, they could lead to considerable exposure to natural radioactivity to the people within the surrounding area and workers at the mining sites [8,21,25,32,33,34].
Small-scale and artisanal mining cause more environmental harm than good, especially in developing countries, although they are great sources of income and wealth creation. The location of mines, lack of enforcement of mining rules and the unaccountable extraction procedures make mining an environmental tragedy [24]. Hence, it is critical to investigate and make available comprehensive scientific evidence for assessing the levels of exposure to humans within mining locations. From the literature, there has been quite a few investigations on radioactivity levels in mining areas in Ghana [35,36,37,38,39,40,41]. However, mining activities in the country have not yet been subjected to radiological regulatory control, and due to this, there is often little or no information and awareness of the radiological dangers associated with natural radioactivity concentration exposure in mining locations, especially in small-scale and artisanal mining areas.
In recent times, the Atiwa West District has seen several on-going small-scale and artisanal gold-mining activities, which are not regulated. The area is close to the Atiwa Forest Reserve, which has been identified as a prospective bauxite mining area [42,43]. Despite the on-going mining activities, the area has not been investigated for radioactivity levels and radiological hazards due to mining. It is crucial to conduct a pre-operational study to generate a baseline database of the levels of natural radioactivity and radiation risks in the mining communities and the proposed bauxite mining zone, as this information will be used to evaluate the radiological effects of long-term mining activities in the environment. In this study, the activity concentrations of Ra-226, Ra-228, Th-232 and K-40, as well as the associated radiological hazards, are reported. Therefore, the objectives of the study were to determine the activity concentrations of Ra-226, Ra-228, Th-232 and K-40 in soils, sediment, plants and water within mining areas and communities; to estimate Kd, which in this paper refers to the sediment-to-water ratio (Section 2.6), and the soil-to-plant transfer coefficient (A) for plants (Section 2.7); and to assess the radiological risks associated with the exposure of the public and miners to the radionuclides.

2. Materials and Methods

2.1. Study Area

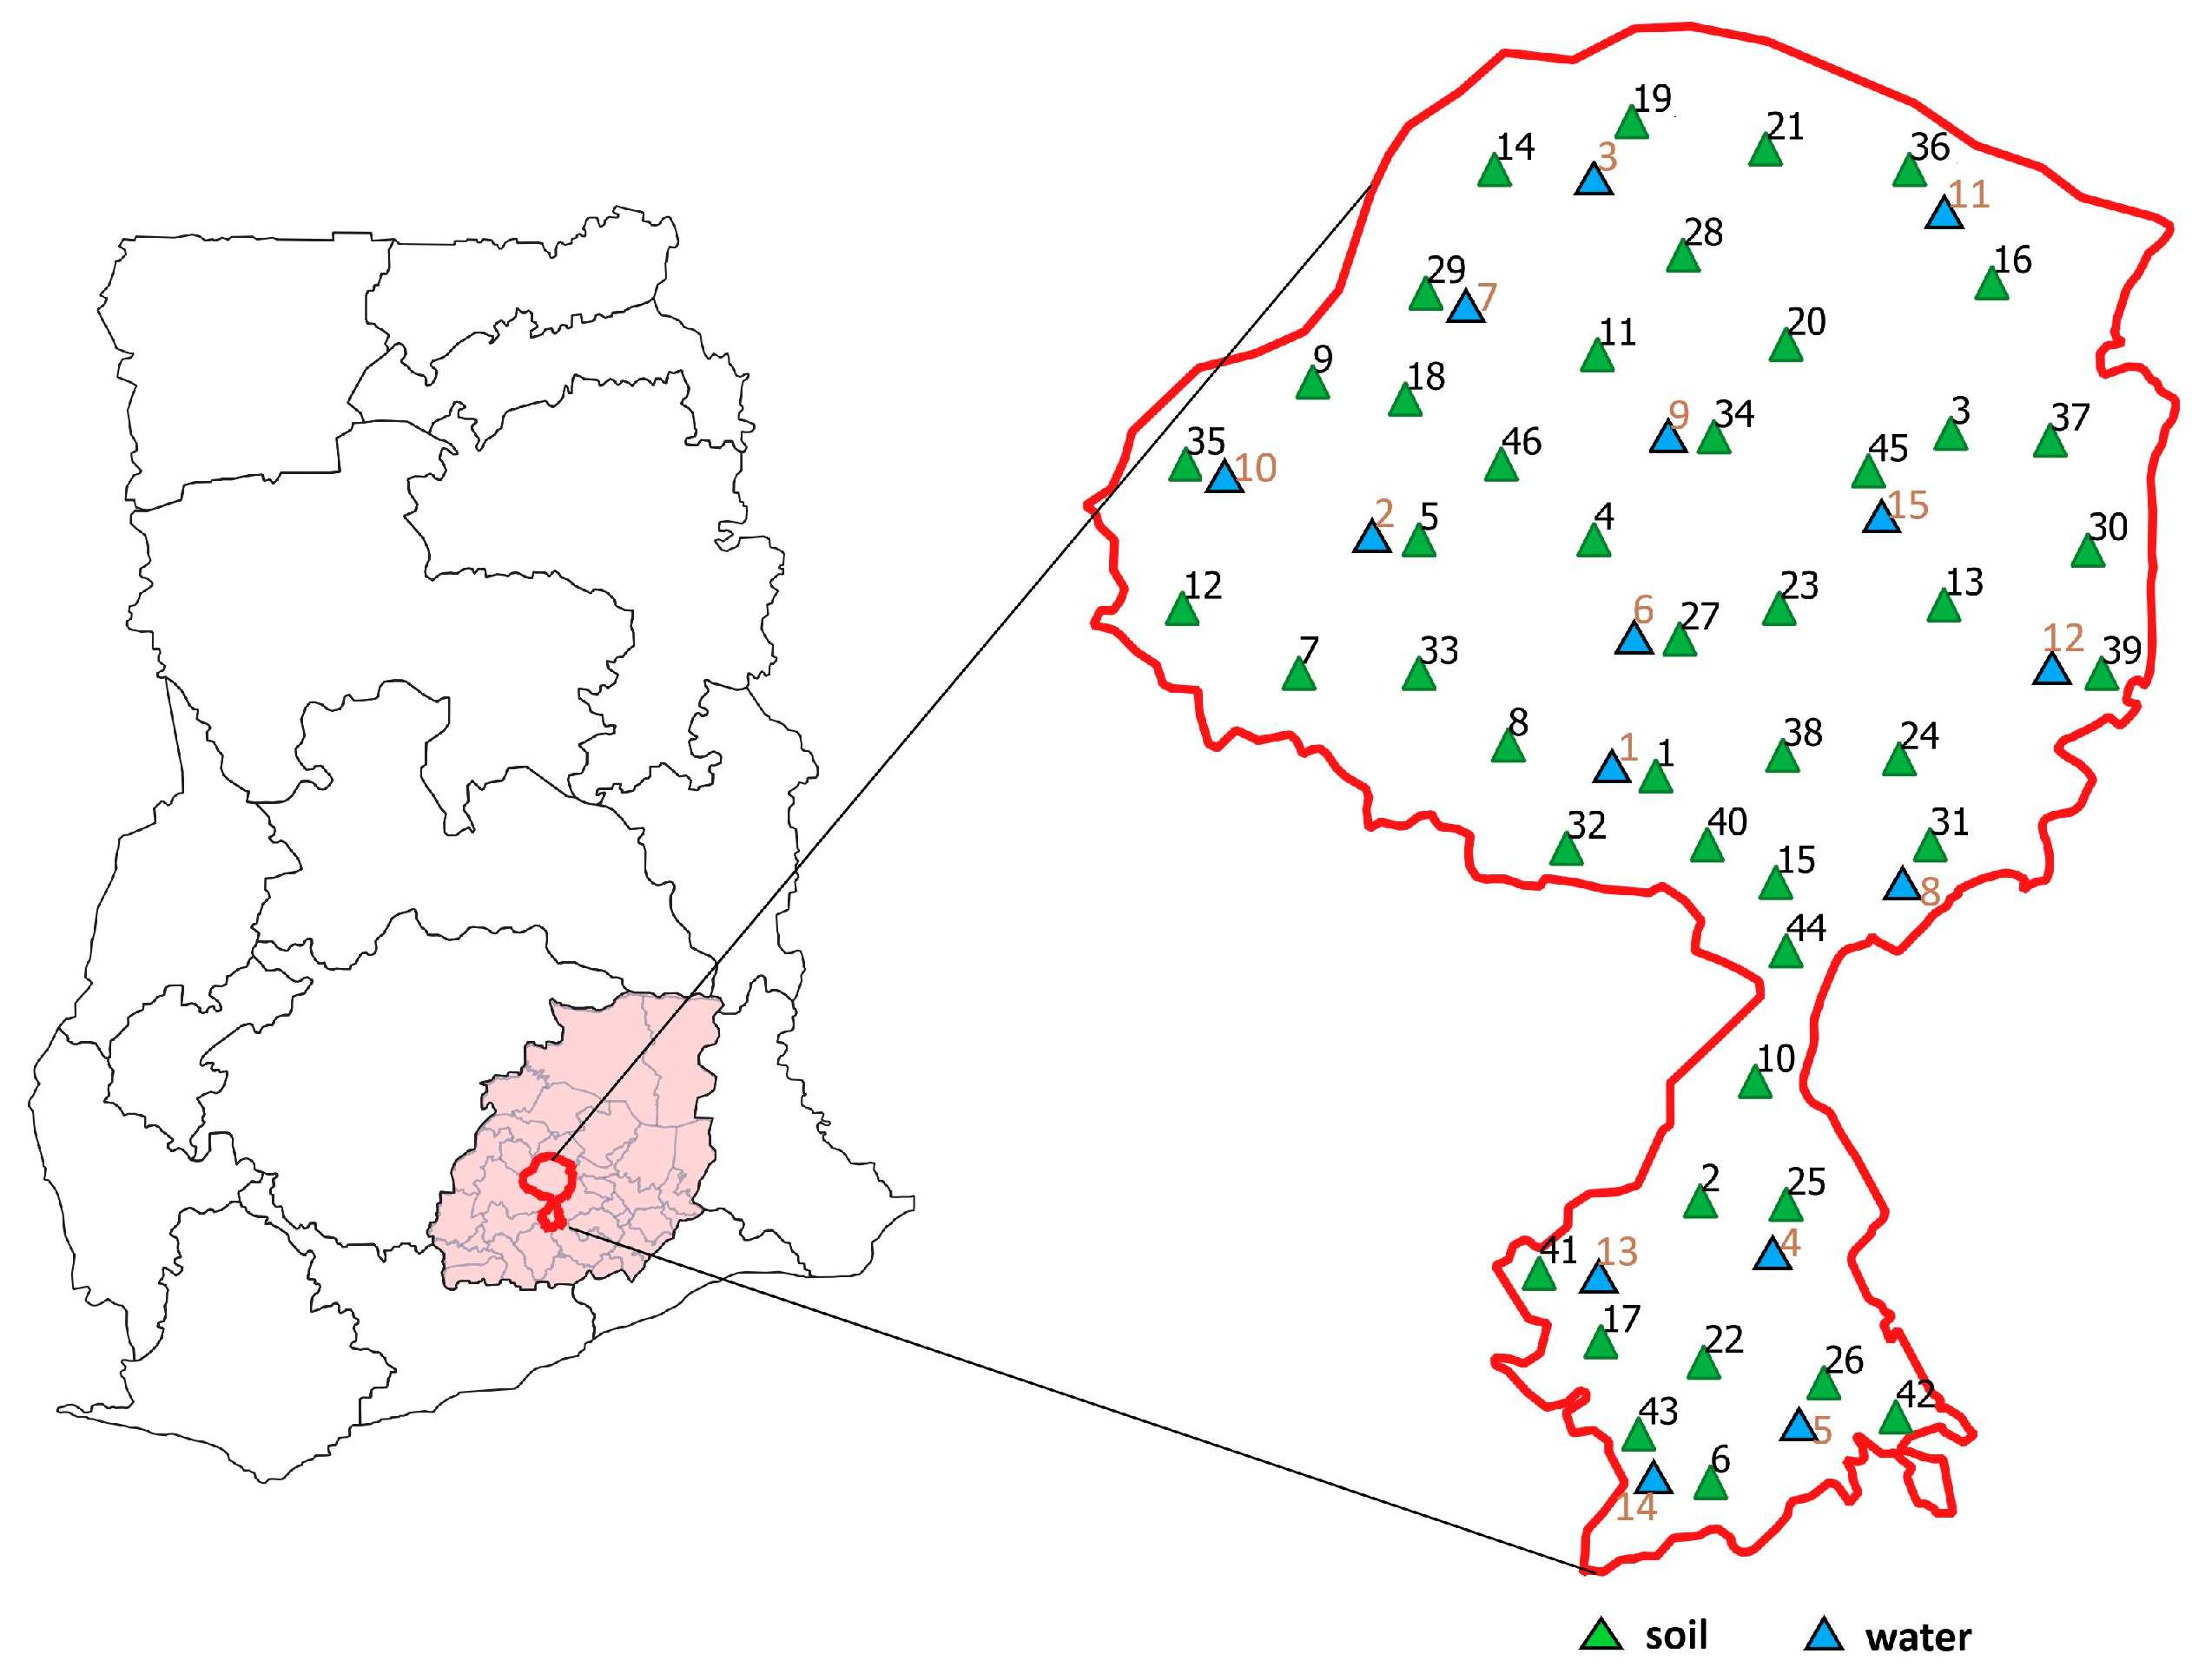
The study area is in the Atiwa West district of the Eastern Region of Ghana (Figure 2) and lies between latitude 6°18′50.4″ N and longitude 0°35′34″ W. The area is within a semi-deciduous forest region, having a rainfall level between 1250 mm and 1750 mm, with a mean of 1500 mm each year. Temperatures range between 24 °C and 29 °C, with relative humidities of 65–75% and 75–80% during the dry and wet seasons, respectively. The soils are predominantly reddish-brown, with the highlands characterized by well-drained, deep gravel-free silty loams and silty clay loams, while the lowlands are characterized by poorly drained alluvia silty clays [44,45]. The area is known for artisanal-scale mining activities that are on-going in many of the towns and communities, with some mining activities happening very close to residential areas and farms. The study area is close to the largest national forest reserve in the country, the Atiwa Forest. There are about forty communities around the Atiwa Forest whose livelihoods depend on the forest [43]. In this survey, the study area was selected based on its proximity to communities and the forest.

2.2. Sampling

Soil samples were collected from different locations, with each sampling location covering a surface area of 2 m × 2 m. At each sampling location, 4 points were marked and sampled. The soil samples were collected from a depth of 10–30 cm from the surface. At each sampling location the collected samples were homogenously mixed and transferred into Ziploc bags. They were then correctly labeled and transported to the laboratory for analysis [1,5,46]. A total of 46 locations were sampled for soil and sediment from the study area (Figure 2) Soil samples were collected from mining sites, farms and undisturbed lands around the mining sites. Soil samples were taken from 17 mining sites; 10 farming areas; and 12 undisturbed areas, including residential areas and areas with no mining activities taking place, as well as sediments from 7 rivers and streams. Each sampling site belonged to a single land-use category; not all land uses were present at every site. Water samples were collected from 15 different locations of surface water sources, i.e., rivers and streams, and mine waste waters identified in the mining zones and within the communities. Three water samples were collected at each location by adding samples into acid-washed polyethylene containers (2 L). Each bottle was rinsed several times with the sample water before the final collection. Immediately after sampling, the samples were acidified to pH < 2 upon collection using concentrated hydrochloric acid in order to prevent adsorption of radionuclides onto container walls and inhibit biological activity [47,48,49]. Samples were labeled, transported to the laboratory, and stored at 4 °C until analysis. The water samples were not filtered prior to the analysis; thus, both the dissolved and suspended radionuclides were measured. Therefore, colloidal or settled particulates may have influenced the activity measurements, and this is a limitation of the present study. Field physicochemical parameters for water (pH, temperature, electrical conductivity) and for soils/sediments (pH, grain-size distribution, organic matter) were not measured during this campaign owing to logistical constraints; this limits interpretation of the radionuclide speciation, sorption (Kd) comparability, and soil-property-based comparisons. These measurements are planned for a short follow-up survey.

2.3. Sample Preparation

In the laboratory, the soil samples were oven-dried at 60 °C for 24 h in accordance with ISO 18589-2:2015 guidelines [50]. For samples collected from the banks of surface water bodies, air-drying was carried out for at least one week prior to oven drying to minimize the moisture content. The dried samples were then gently disaggregated, homogenized and passed through a 2 mm mesh sieve, as recommended by the IAEA (TRS No. 295). A total of 500 g of each prepared sample was transferred into Marinelli beakers and stored for a minimum 27 days to allow secular equilibrium between uranium/radium and their progeny [49,50]. Regarding the water samples, for each sampling location, a 1 L aliquot of well-homogenized unfiltered water was transferred directly into a Marinelli beaker without any pre-concentration or treatment. The samples were sealed immediately to minimize radon loss and stored for at least 30 days to allow a secular equilibrium between radium and its short-lived progeny.

2.4. Instrumental Analysis

A high-purity germanium (HPGe) detector was used to measure the concentration of each specific radionuclide in the samples. The absolute (specific) peak efficiency method was used to determine the quantity of each radionuclide. The gamma spectrometry was calibrated for energy and efficiency using a certified multi-gamma mixture of standard sources (solid and liquid) containing gamma-emitting radionuclides covering the energy range of interest, in accordance with IAEA TRS No. 295 [49]. To ensure the validity of the absolute efficiency calibration, all samples were counted in the same Marinelli geometry as the calibration standard (with matched fill height and container positioning and deviations in geometry or density); however, as the water samples were unfiltered and could contain suspended sediment, the densities may have been higher than that of the calibration standard (1.00 g cm−3), leading to a small bias in the measured activities due to potential self-attenuation and geometry effects on low-energy photons (<300 keV). Therefore, the reported water activities may have an additional uncertainty component from a geometry mismatch, and this is considered as a limitation and considered in the interpretation.
All gamma spectrometry measurements were conducted under a standardized QA/QC protocol. Background spectra were acquired regularly and subtracted from the sample spectra. Procedural blanks and duplicate samples (10% of total) were analyzed to monitor contamination and reproducibility. Certified reference materials (IAEA-375 soil, IAEA-443 water) were measured periodically to verify the accuracy, with the results agreeing within ±5% of certified values. The ORTEC GMX40-76 High Purity Germanium (HPGe) detector (AMETEK Advanced Measurement Technology, Oak Ridge, TN, USA) was used for determining the concentration of radionuclides in the samples. Characteristic gamma peaks were employed to determine the activity concentrations of the respective radionuclides: Ra-226 using Pb-214 the energy peak of 351.9 keV and emission probability (Pγ) of 35.3%, and Bi-214 using the energy peak of 609.3 keV and Pγ of 45.2%. Th-232 and Ra-228 were obtained from the maximum energies of the equilibrium decay products (Ac-228 and Tl-208), i.e., Ac-228 with an energy peak of 911.2 keV and Pγ of 26%, and Tl-208 with energy peaks of 583.2 and 2614.5 keV and Pγs of 30.5% and 35.8%, respectively. For K-40, the peak of 1460.8 keV (Pγ: 10.6%) was used to measure its quantity. To obtain better statistics of the gamma spectra and to achieve minimal counting errors, each measurement was performed with a counting time of 80,000 s [51].

2.5. Activity Concentration Measurement

Equation (1) was used to calculate the specific concentrations of radionuclides present in the soil and water samples (since no filtration was applied, the reported activities represent the total (dissolved + particulate) radionuclide concentration in the water):
A = N/(ε × P × m × t)
where N represents the net counts under the corresponding energy peaks, ε presents the efficiency for the specific energy peak, P denotes the gamma emission probability of the radionuclide, m stands for sample mass (in grams) or volume (in litres), and t stands for the counting time in seconds. The activity concentrations (A) of Ra-226, Ra-228, Th-232, and K-40 are expressed in Bq/kg for soil samples and Bq/L for water samples.

2.6. Sediment–Water Distribution Coefficient

The partitioning of radionuclides between the sediment and water was expressed using the distribution coefficient, Kd, defined as Equation (2):
Kd (L/kg) = Asediment (Bq/kg)/Awater (Bq/L)
Higher Kd values indicate stronger sorption of the radionuclide to sediments, whereas lower values suggest greater mobility in the aqueous phase. A finite Kd indicates exchange and partitioning between the two phases; the magnitude reflects the relative strength of sorption but does not by itself establish the direction of contamination.
As water samples were analyzed in the original condition at the sampling time, without treatment and filtering, the reported water activities include particulate-bound radionuclides; therefore, the calculated distribution coefficients represent the apparent Kd and may underestimate the true sorption. We also computed Kd specifically for Ra-228 (Ac-228 proxy) in both phases to ensure isotope consistency.

2.7. Assessment of Radiological Risk Parameters

Below are the radiological risk indices calculated to evaluate the radiation hazard for the population of the study area due to exposure to terrestrial radionuclides found in the soil and water.

2.7.1. Radium Equivalent Activity Index (Raeq)

The distributions of radionuclides measured in the environment are not uniform. To evaluate the specific activity of materials containing varying concentrations of Ra-226, Th-232 and K-40, the radiation exposure was expressed in terms of the radium equivalent activity (Raeq), as presented in Equation (3). The formulation of this index relies on the premise that specific activity levels of certain radionuclides contribute equally to the external gamma radiation exposure. In particular, it assumes that a concentration of 370 Bq/kg of radium-226, 259 Bq/kg of thorium-232 and 4810 Bq/kg of potassium-40 each result in comparable gamma dose rates [51,52].
Raeq = ARa + (1.43 × ATh) + (0.077 × AK)
where ARa, ATh and AK stand for concentrations of the respective radionuclides in Bq/kg.

2.7.2. Internal and External Hazard Indices

For radiation hazards to remain within safe limits, both the internal hazard index (Hin) and external hazard index (Hex) must be less than unity. Natural radionuclides in soil contribute to external gamma radiation, thereby exposing the population. An Hex value of 1 corresponds to the maximum permissible radium-equivalent activity of 370 Bq/kg, which is equivalent to the ICRP-recommended annual effective dose of 1 mSv/y. Hin, on the other hand, accounts for the radiological risk posed to the respiratory system through radon and its progeny [51,52,53]. The two indices are calculated using the following equations:
Hin = (ARa/185) + (ATh/259) + (AK/4810)
Hex = (ARa/370) + (ATh/259) + (AK/4810)
where A stands for concentrations of the corresponding radionuclides in Bq/kg.

2.7.3. Absorbed Gamma Dose Rate (D)

The absorbed gamma dose rate (presented as Equation (6)) serves as an indicator of external radiation exposure to the human body, with its biological and clinical impacts directly linked to natural radioactivity levels. At a height of 1 m above ground, the dose rate can be estimated from the specific activities of radionuclides, assuming a uniform distribution within the soil [54,55].
D (nGy/h) = 0.462ARa + 0.604ATh + 0.0417AK
where A stands for concentration of the corresponding radionuclide in Bq/kg. The world mean absorbed gamma dose rate level is 60.0 nGy/h [10].

2.7.4. Annual Effective Dose (AED)

Expressed as the effect of gamma radiation released by radionuclides on the different organs of the human body as presented in Equation (7) for determining outdoor external annual effective dose from terrestrial gamma radiation based on the calculated D [51,55]:
AED (mSv/y) = D (nGy/h) × T × DC × O × 10−6
where D is the absorbed dose rate, T is the annual exposure time (8760 h), DC stands for the dose-conversion coefficient from air kerma to effective dose (0.7 Sv/Gy), O is the outdoor occupancy factor (0.2) and 10−6 converts nGy to mGy (so the result is in mSv/y). The global average outdoor external effective dose from terrestrial gamma radiation is about 0.07 mSv/y (UNSCEAR, 2008 [56]). Note that this is an observed global average, not a regulatory dose limit; the commonly cited public dose limit for artificial sources is 1 mSv/y.
The radiological risk related to the ingestion of water in the study area was evaluated. The committed effective dose due to the ingestion of Ra-226, Ra-228 and K-40 in the water samples was calculated using the following equation:
Eing(w) = Iw(j=1)3DCFing × (Ra-226, Ra-228, K-40) × Asp(w)
where Eing(w) represents the annual effective dose, expressed in millisieverts per year (mSv/y), that results from the ingestion of drinking water; Asp(w) denotes the activity concentration of the radionuclide in the water, measured in becquerels per liter (Bq/L); Iw corresponds to the assumed yearly water consumption, commonly estimated at 730 L per year (equivalent to 2 L per day), which is a standard value applied in international drinking water safety assessments; and DCFing is 2.8 × 10⁻⁴ mSv/Bq for Ra-226, 6.9 × 10⁻⁴ mSv/Bq for Ra-228 and 6.2 × 10⁻⁶ mSv/Bq for K-40 [10,57].

2.7.5. Annual Gonadal Dose Equivalent (AGDE)

Expressed as the effect of radiation to cells, particularly on active bone marrow and bone surface cells [10]. It has been known that a high AGDE can result in fatal leukemia cases [52]. The AGDE was determined with the following equation:
AGDE (µSv/y) = 3.09ARa + 4.18ATh + 0.314AK
where A stands for concentration of the corresponding radionuclide in Bq/kg. The world mean AGDE value is 300 µSv/y [10].

2.7.6. Excess Lifetime Cancer Risk (ELCR)

The potential for cancer development resulting from exposure to gamma radiation—whether through ingestion, inhalation or direct external contact with radioactive materials—is typically assessed by estimating the probability of cancer occurrence over the course of an individual’s lifetime [54,55]. The calculation of ELCR determines this probability on a human population. It is calculated by the following expression:
ELCR = AED × DL × RF
where AED is the annual effective dose in Sv/y, DL is the mean duration of life of 70 years and RF is the risk factor (i.e., fatal cancer risk) in per Sv. The ICRP 60 recommends an RF value of 0.05 for members of the public when dealing with stochastic impacts. The screening level for ELCR is 0.00029 [10,58].

2.7.7. Estimation of Radium Uptake by Vegetables

The estimation of the uptake of radium from the soil by plants (vegetables) cultivated within the study area was derived using a fixed soil-to-plant transfer coefficient of 0.04, not direct measurements, using the following expression:
Ra-226veg = A × ARa
where Ra-226veg is the activity concentration of Ra-226 in vegetables in Bq/kg, A is the transfer coefficient of Ra-226 from soil to vegetables given as 0.04 and ARa is the activity concentration of Ra-226 in the soil samples in Bq/kg [28,59,60,61,62]. The soil-to-plant transfer coefficient value of 0.04 used in this study is a generic screening value recommended in IAEA Technical Reports Series No. 472 and supported by UNSCEAR 2000 Annex B data for Ra-226 uptake into terrestrial plants. The real transfer coefficients can be affected by factors such as crop species; soil pH; and the presence of competing alkaline earth elements, such as calcium and magnesium. Reported values in regional studies typically range from about 0.01 to 0.1 for Ra-226. Due to lacking soil chemo-properties and crop-specific data at the time of the laboratory analysis, this generic coefficient was used, which represents a limitation of the study and future work should include direct gamma spectrometry of vegetable samples and determination of site-specific transfer coefficients.

2.7.8. Annual Effective Dose Due to Vegetable Consumption

The annual effective dose due to the consumption of radium in vegetables was evaluated using the equation given by the IAEA [61]:
E = Cp × Ip × DCF
where E is the effective dose rate as a result of the consumption of vegetables in Sv/y, Cp is the concentration of Ra-226 activity concentration in vegetables in Bq/kg, Ip is the amount of vegetables consumed per year at 90 kg and DCF is the dose conversion factor of Ra-226 (2.8 × 10⁻⁷ Sv/Bq) [59,61,62].

2.8. Data Analysis

Statistical analyses of data were performed using SPSS 26 software. The statistical distribution of the obtained data was evaluated using both Kolmogorov–Smirnov (K–S) and Shapiro–Wilk (S–W) tests to assess normality. This step was necessary to determine the appropriateness of using Pearson’s correlation coefficient, which assumes normally distributed variables. In cases where the K–S and S–W results differed (as occurred for K-40), the S–W test results were given greater weight because it is generally more reliable for small-to-moderate sample sizes (n < 50). Pearson correlation coefficient analysis was then applied to normally distributed datasets to quantify the strength of relationships between measured radionuclide concentrations and other parameters in order to assess patterns of co-occurrence in the environment [63].

3. Results and Discussion

3.1. Activity Concentrations of Radionuclides in Soil and Sediment

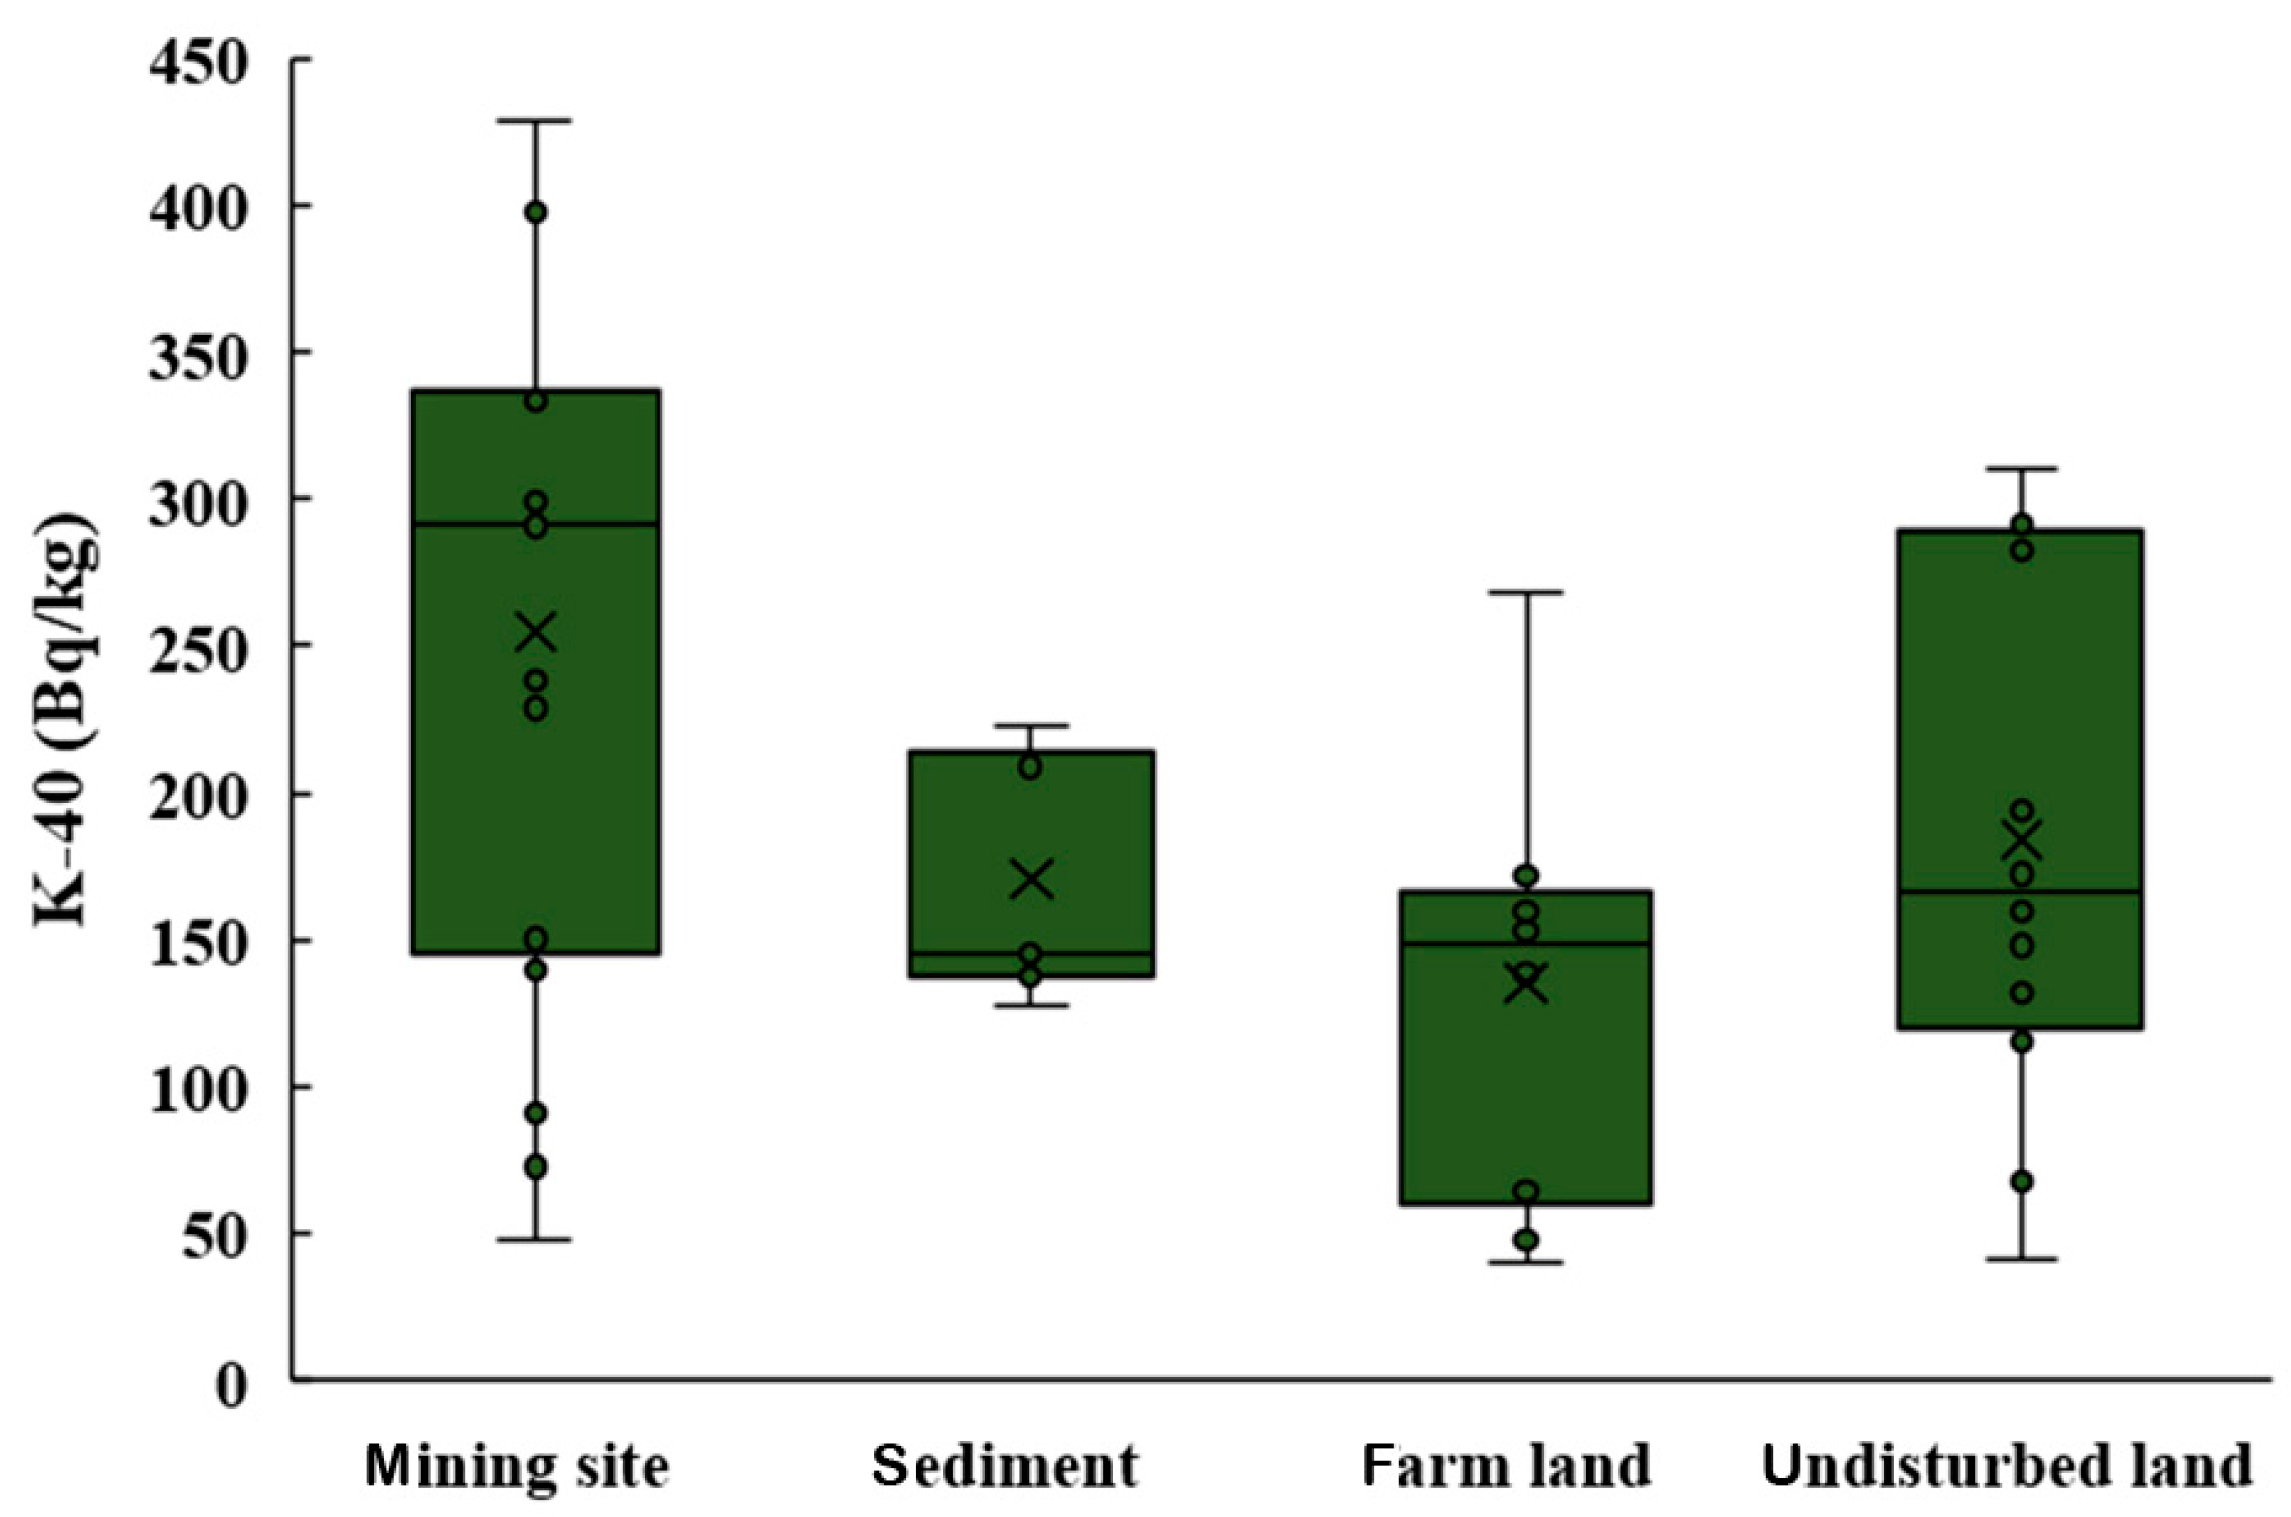
The activity concentration of Ra-226, Th-232 and K-40 were determined by gamma ray spectrometry for the different soil, sediment and water samples collected from Atiwa West mining areas. The mean activity values and other statistical data of the measured radionuclides in the soil and sediment samples are presented in Table 1 and Figure 3, Figure 4 and Figure 5 to show their distributions.
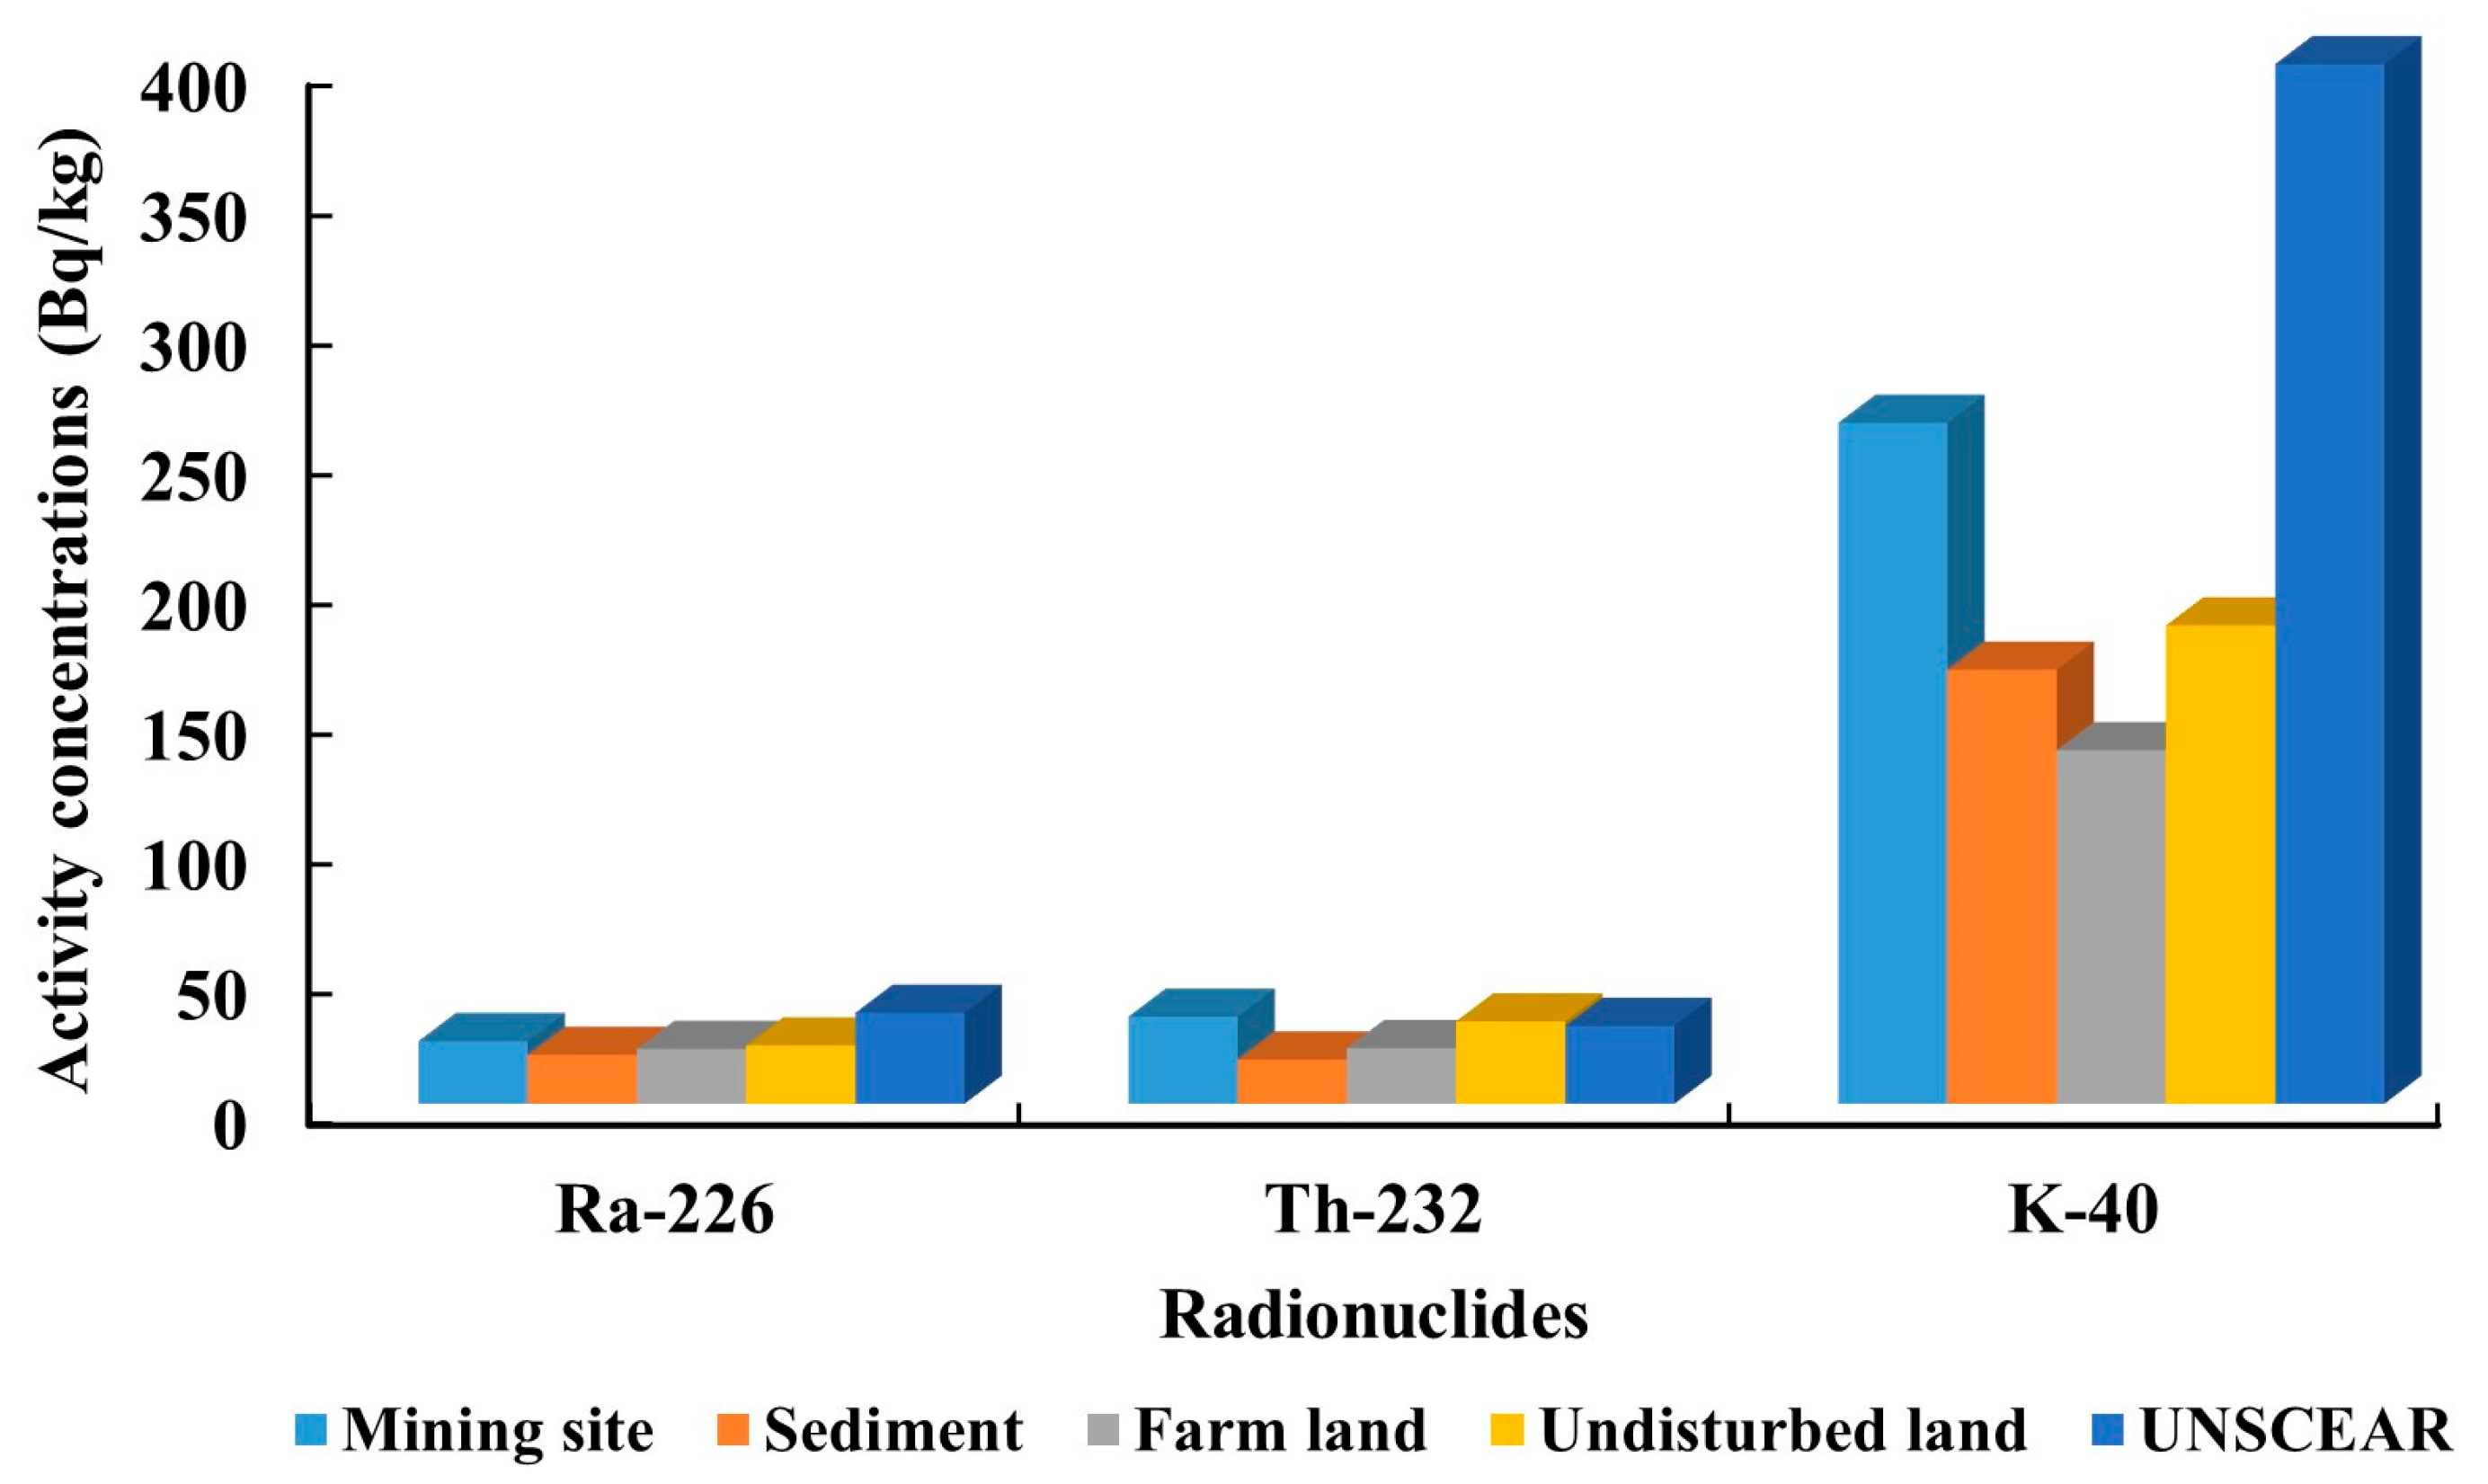
From Table 1, the activity concentrations of Ra-226 ranged from 12.9 ± 1.4 to 29.1 ± 1.8 Bq/kg, with an average of 24.1 ± 2.3 Bq/kg, in the soils from mining sites; 15.8 ± 1.7 to 22.4 ± 2.3 Bq/kg, with an average of 18.8 ± 2.0 Bq/kg, in the sediments; 17.3 ± 1.7 to 28.8 ± 3.0 Bq/kg, with an average of 21.1 ± 2.1 Bq/kg, in the soils from farm lands; and 16.2 ± 1.6 to 26.8 ± 1.7 Bq/kg, with an average of 22.4 ± 2.1 Bq/kg, in the soils from undisturbed lands. For Th-232, the mean activity concentrations were 33.5 ± 2.5 Bq/kg for mining sites, 17.0 ± 1.7 Bq/kg for sediments, 21.4 ± 2.2 Bq/kg for farmlands and 31.7 ± 2.7 Bq/kg for undisturbed lands. The mean activity concentrations of K-40 were 262 ± 25 Bq/kg, 167 ± 20 Bq/kg, 136 ± 18 Bq/kg and 184 ± 21 Bq/kg for the mining sites, sediments, farmlands and undisturbed lands, respectively. The overall mean values for Ra-226, Th-232 and K-40 in the measured soil and sediment samples were 22.1 ± 2.1 Bq/kg, 27.5 ± 2.3 Bq/kg and 198 ± 22 Bq/kg, respectively.

Normality of Data

The normal distributions of radionuclides in soil and sediment were determined using Kolmogorov–Smirnov and Shapiro–Wilk normality tests. The results show Ra-226 has a normal distribution with p-values ˃ 0.05 for both tests (0.20 and 0.69, respectively). Similarly, the Th-232 activities were found to be normally distributed, with p-values of 0.20 and 0.15. The Kolmogorov–Smirnov test for K-40 had a p-value ˂ 0.05, while the Shapiro–Wilk test showed a normal distribution (0.07).
Figure 3, Figure 4 and Figure 5 show the frequency distributions of the measured radionuclides in the soil and sediment samples.
The analysis revealed that the mean activity concentrations of the radionuclides followed a decreasing trend in the sequence K-40 > Th-232 > Ra-226. When compared with international reference levels, the average concentrations were generally below the worldwide recommended values of 35 Bq/kg for Ra-226, 30 Bq/kg for Th-232 and 400 Bq/kg for K-40 [10]. This suggests that on a broad scale, the radiological risk from natural radionuclides in the study area may be considered relatively low.
However, it is important to note that several sampling points exhibited concentrations that surpassed these global averages. Such localized exceedances indicate the possibility of environmental hotspots where elevated radiation levels could contribute to higher external gamma dose rates and, consequently, an increased risk of long-term exposure for individuals residing or working nearby. These findings highlight the need for site-specific monitoring and regulatory oversight since areas exceeding recommended thresholds may require remedial actions, land-use restrictions or public health interventions.
The comparison of the measured activity concentrations with international averages is illustrated in Figure 6, providing a visual representation of both compliance with and deviations from the established global benchmarks.
The maximum activity concentrations of Th-232 were mainly found in soils from mining sites and undisturbed lands. The activity concentrations of most soils from undisturbed lands and farms were found to have decreasing Ra-226 and Th-232 levels with increasing distance from the mining zones. A similar scenario was reported by Perevoshchikov et al. in soils of the northern part of Verkhneksamskoe, Russia [64]. High K-40 activity levels were also found in mining areas, undisturbed lands and sediments, whereas some farmlands recorded low K-40 levels. High K-40 can be attributed to high silica that generally occurs in soils and the use of fertilizers that contain potassium [60,65,66]. The Ra-226 and Th-232 concentrations were lower in the sediment samples than in the soil samples. In comparison with Ra-226, the mean activity concentrations were within the reference level for all the sampled locations. The alterations in the activity concentrations of these natural radionuclides depend on the geological conditions, e.g., rock formations and the transport processes of the area under study [23]. Also, the geographical variances, geological mineralization and meteorological conditions of the area influence the distribution of radionuclides in an area [60].
Ra-226 and Th-232 are known to be incorporated in heavy minerals in their crystal structures, whereas K-40 are incorporated in light minerals [63]. Thus, sampling locations with high Th-232 concentrations are likely to have heavy minerals present in the soil compositions, whereas sampling locations with light mineral compositions have high K-40 concentrations in their soils. The inconsistent activity concentrations in the study area can be attributed to the alterations in the mineralogical and chemical compositions of the rock formations in the area [63]. In the present work, the high Th-232 raises radiological safety concern because the increase in Th-232 activity concentrations enhances the background radiation levels and this may render soils from the area unfit for use as building material and for other purposes [52,67]. Mining can negatively impact the environment in the long term. Anthropogenic activities, such as artisanal mining, have an accumulative long-term effect on the environment. The increase in soil salt content and microelements, as well as the alteration of the physical and chemical properties of soil, are examples of such impacts. Soil acts as a buffer in the natural environment and, therefore, radiation characteristics of soil in an area will involve a soil analysis of the upper soil layer, which receives about 95% of the anthropogenic impact [64].
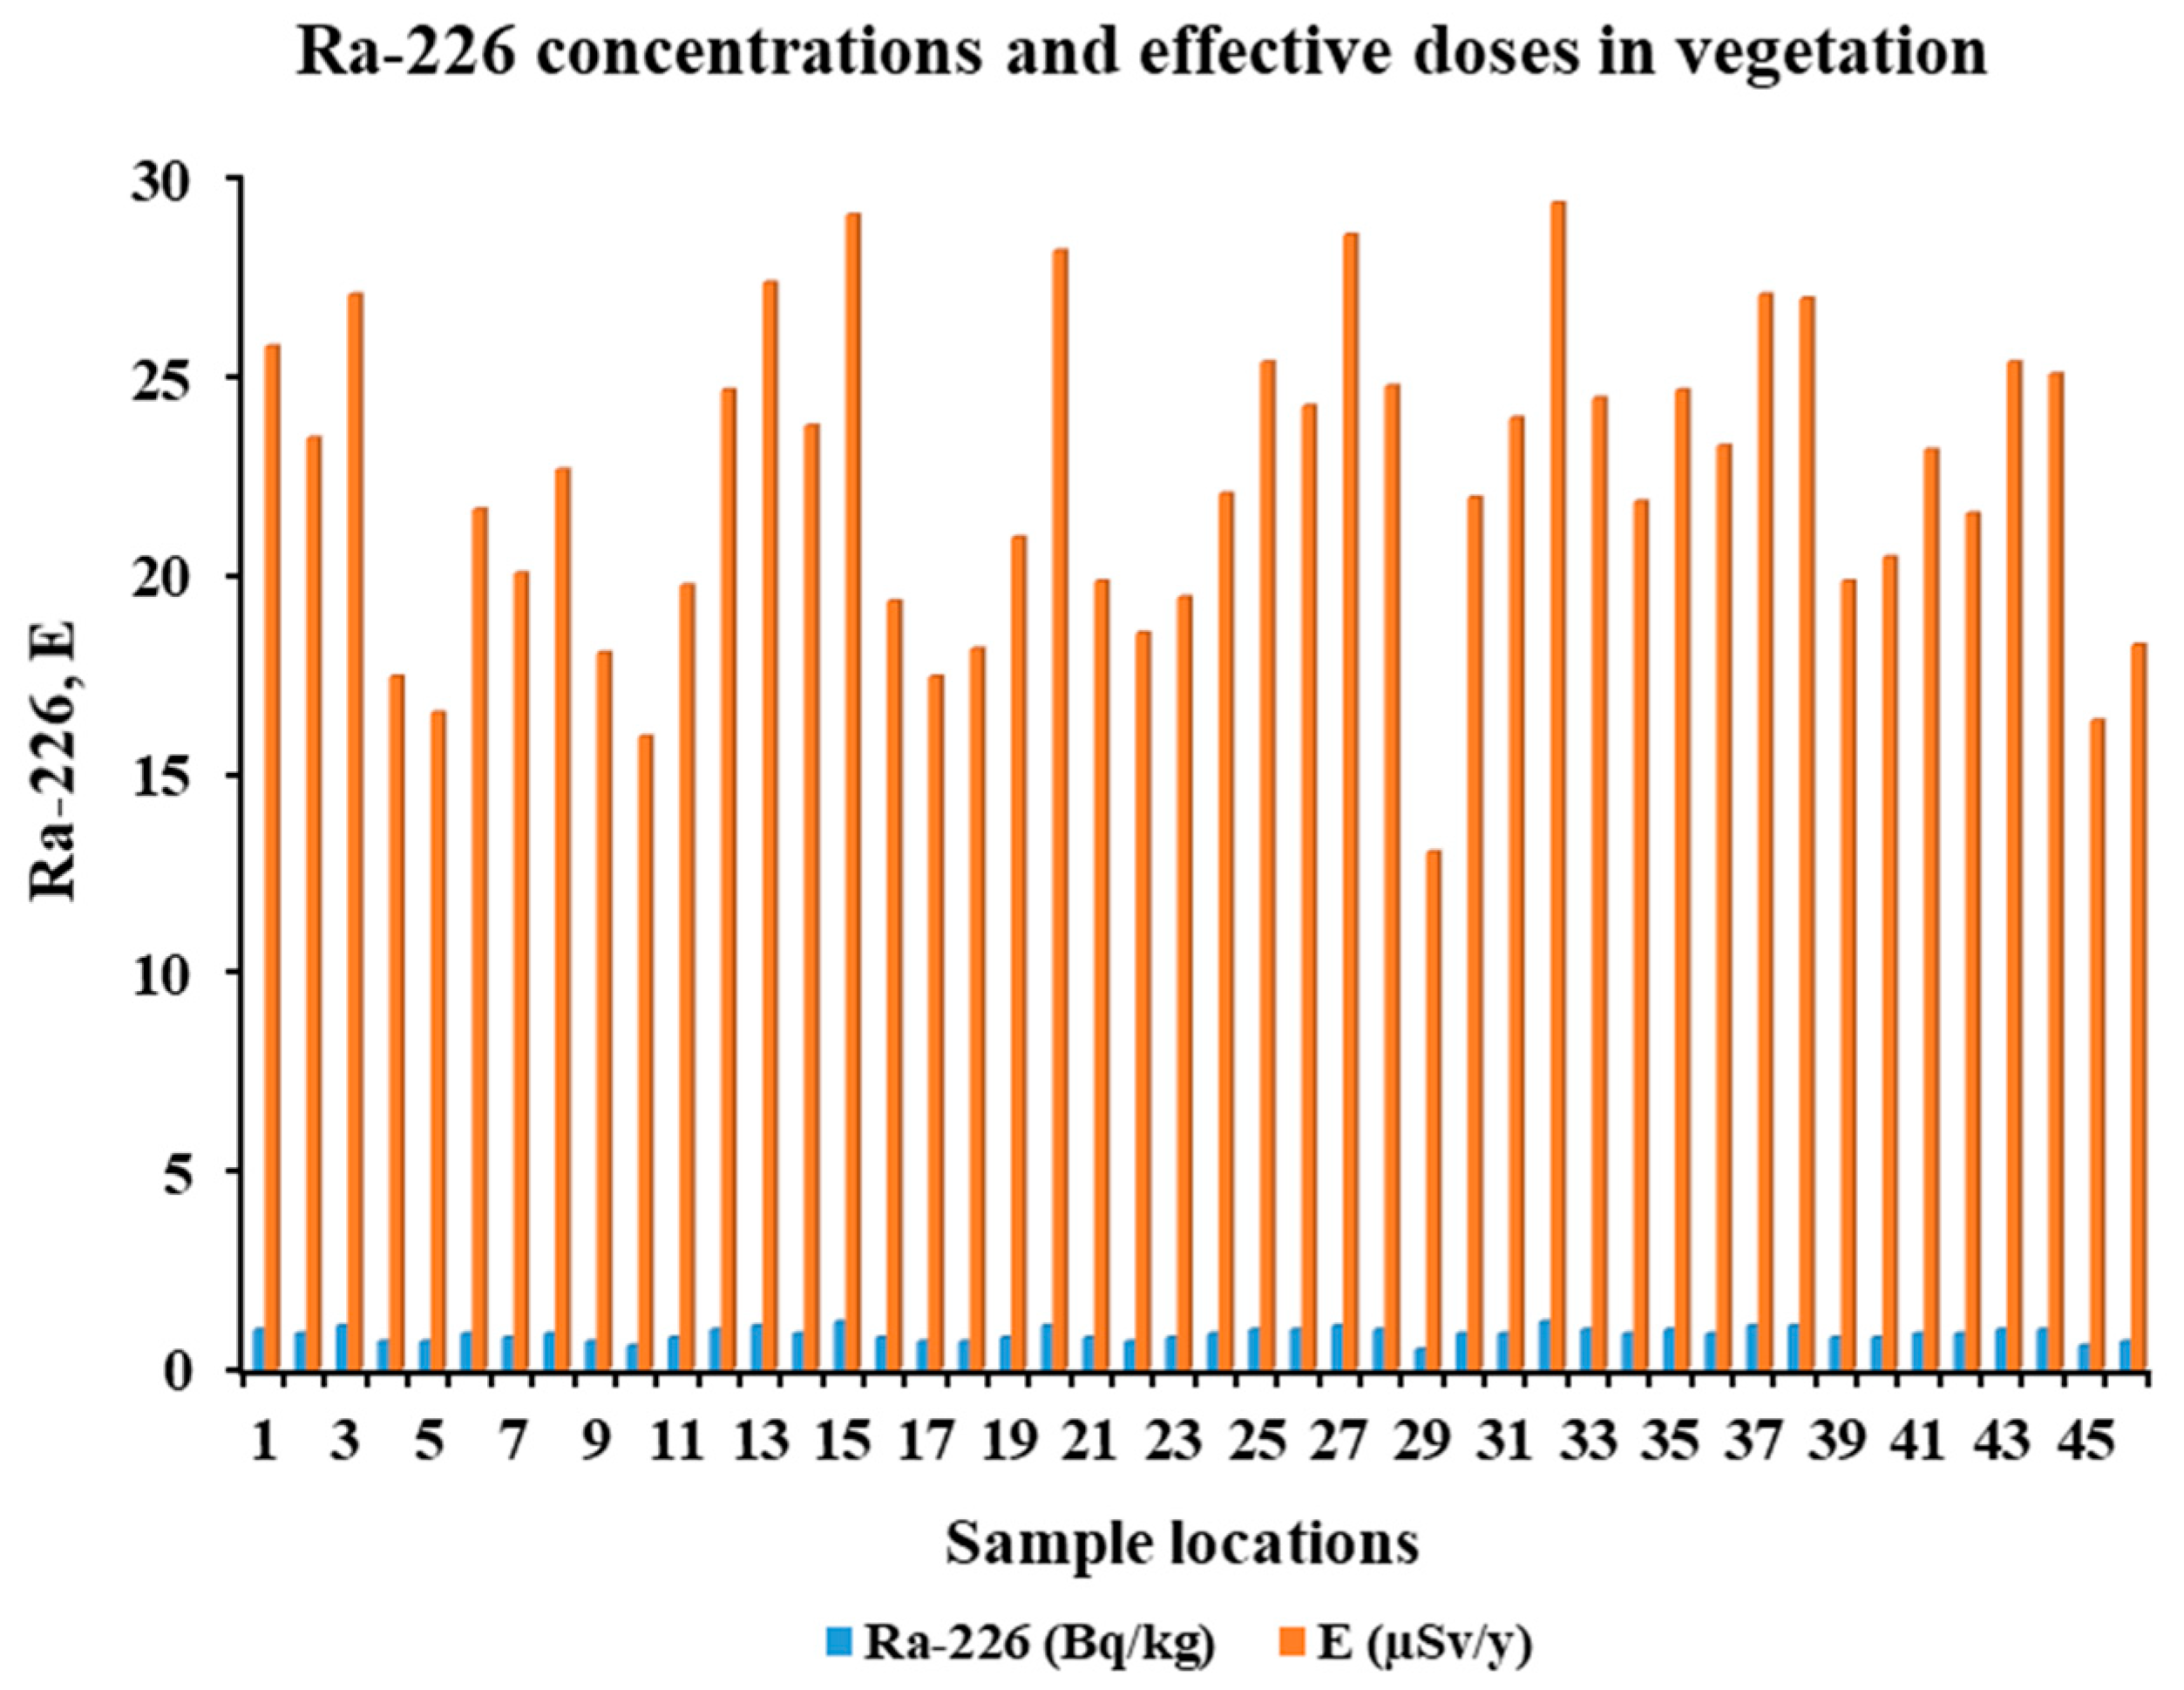
The radium content in vegetables due to the uptake of radium by plants and vegetables from the soil was estimated in the study and are presented in Figure 7. The assessment of radium content in vegetables is significant for the protection of human health [68,69]. The estimated activity concentration of Ra-226 in vegetables, which was calculated from the measured soil Ra-226 values using a soil-to-plant transfer coefficient of 0.04, ranged from 0.5 Bq/kg to 1.2 Bq/kg, with an average of 0.9 Bq/kg. These values are within the typical background range for foodstuffs reported by the UNSCEAR (generally <1–2 Bq/kg wet weight for Ra-226) and are far below any radiological protection intervention levels [68,70,71]. This outcome lessens the concern regarding the radioactivity contamination of crops cultivated in the study area, particularly in farming areas, as there was large amount of crop cultivation of cocoa, cassava, okra, pepper, plantain, etc., on the farmlands sampled for the present study.

3.2. Activity Concentrations of Radionuclides in Water Samples

The statistics of the Ra-226, Ra-228 and K-40 activity concentrations measured in the water samples are detailed in Table 2.
The results of the concentrations of the determined naturally occurring radionuclides in all water samples are shown in Figure 8. The mean activity concentrations of Ra-226, Ra-228 and K-40 in water samples collected from the studied area were 1.02 ± 0.2 Bq/L, 4.53 ± 0.9 Bq/L and 13.97 ± 3.2 Bq/L, respectively. The main contributor of the overall activity concentration in the water samples was K-40, with a relatively high concentration of 16.50 ± 3.2 Bq/L; because the waters were unfiltered, the measured K-40 likely includes a substantial particulate fraction, and thus, comparisons with dissolved-phase values should be made with caution. The activity concentrations of Ra-226 were relatively lower than Ra-228 in all water samples measured. This is consistent with the Th-232 concentrations being higher than Ra-226 concentrations in the soil and sediment samples, thus confirming that the investigated area is more abundant in thorium in its soils and bedrocks than radium. The estimated mean concentrations were above the WHO drinking water screening levels of 1.0 Bq L−1 for Ra-226 and 0.1 Bq L−1 for Ra-228 [57,69,72]. Because K-40 contributes only a small fraction of the calculated dose in our dataset, and was excluded from some indicative-dose frameworks, our conclusion that the drinking water CED exceeds the 0.1 mSv y−1 screening level is robust, even if K-40 is omitted.
The Ra-226 and Ra-228 concentrations varied in narrow ranges indicating similarity in their origin and a potential contamination from exploitation of the radium and thorium bearing rocks during mining [73]. The highest Ra-226 (1.31 ± 0.2 Bq/L) activity was determined in a water sample collected from a water source in a mining zone and the highest Ra-228 was determined in a water sample from a gold ore washing area whose outlet led into a river. Water samples from rivers and streams recorded high Ra-226 and Ra-228 concentrations, while the lowest Ra-226 concentrations were recorded in tailings from a mining site. Generally, the highest contaminations were observed in water samples from mining areas and rivers and streams with proximity to such areas.
The high activity concentrations of the radionuclides in water samples collected from the study area can be attributed to the on-going mining activities in the area. Mining activities, such as washing the gold minerals in water bodies, as well as leaching and washing down of radionuclides from mine wastes into water bodies, have contributed to the high activity levels recorded from the water measurements [26,28,31,72]. A physical observation of water bodies is symptomatic of the excessive contamination of the water bodies (rivers and streams) due to the mining activities with the water bodies having a brownish color instead of being colorless. In most mining areas, it was also observed that rocks containing gold ores from different locations within a mining site were washed in a particular stream or river. This could be the reason for the elevated levels of radionuclides in water resources in the study area. The high radionuclide activities can also be attributed to the geological formation of the area [72]. Without source apportionment, both natural lithology and mining practices may contribute radiation; future work will map the concentrations vs. the distance/flow direction.

3.3. Relationships Between Measured Radionuclides

The relationships existing between Ra-226, Th-232 and K-40 concentrations in the soils and water were studied using regression analysis, Pearson correlations and transfer factors.

3.3.1. Activity Correlation and Ratios in Soil and Sediment

The measured activity concentrations of Ra-226, Th-232 and K-40 for all sampled locations were correlated, as shown in Figure 9 as (a), (b) and (c), respectively. In the regression analysis, it was realized that there was a good correlation with positive correlation coefficients between Ra-226 and Th-232 (R2 = 0.43), Ra-226 and K-40 (R2 = 0.26), and Th-232 and K-40 (R2 = 0.46). This may demonstrate a common response to soil chemical behavior and other environmental processes during the distribution of radionuclides in the environment [74]. Activity ratios of Ra-226/Th-232, Ra-226/K-40 and Th-232/K-40 for all sampling locations were evaluated. Ra-226/Th-232 had activity ratios ranging from 0.528–1.242, with about 72% less than the world average of 1.17. Ra-226/K-40 and Th-232/K-40 had activity ratios greater than the world average of 0.075–0.088, except for three locations, which had activity ratios of 0.066, 0.060 and 0.057 for Ra-226/K-40. The low potassium contents of the rocks in the study area could be the reason for the activity ratios of Ra-226/K-40 and Th-232/K-40 being greater than the world average [6].

3.3.2. Pearson Correlation

The Pearson correlation analysis results are shown in Table 3. The three primordial radionuclides in the soils are positively intercorrelated (Pearson r = 0.50–0.70, all p < 0.01), indicating shared lithologic controls and partial co-occurrence in the mineral matrix [51,75].

3.3.3. Sediment–Water Distribution Coefficients (Kd)

The activity concentrations for Ra-226, Th-232, Ra-228 and K-40 in the sediments and waters are presented in Figure 3, Figure 4, Figure 5 and Figure 8 above. Figure 10 shows the radionuclide concentrations in the soil/sediment relative to those in water at locations where both sediment and water samples were collected at the same point. The concentrations of the radionuclides in the sediment were higher than those in the water for all the locations. The sediment–water distribution coefficients (Kd) for Ra-226, Ra-228 and K-40 ranged from 12.5 to 50.0 L/kg, 3.2 to 10.0 L/kg and 9.1 to 33.3 L/kg, respectively. The corresponding mean Kd values were 20.0 L/kg for Ra-226, 5.3 L/kg for Ra-228 and 14.3 L/kg for K-40. These finite Kd values indicate active exchange and partitioning of radionuclides between sediments and water within the mining areas, with higher Kd values reflecting stronger sorption to sediments. The elevated values observed in certain rivers and streams suggest that sediments act as a significant sink for these radionuclides, although the Kd alone does not determine the direction or source of contamination.

3.4. Radiological Risk Assessment

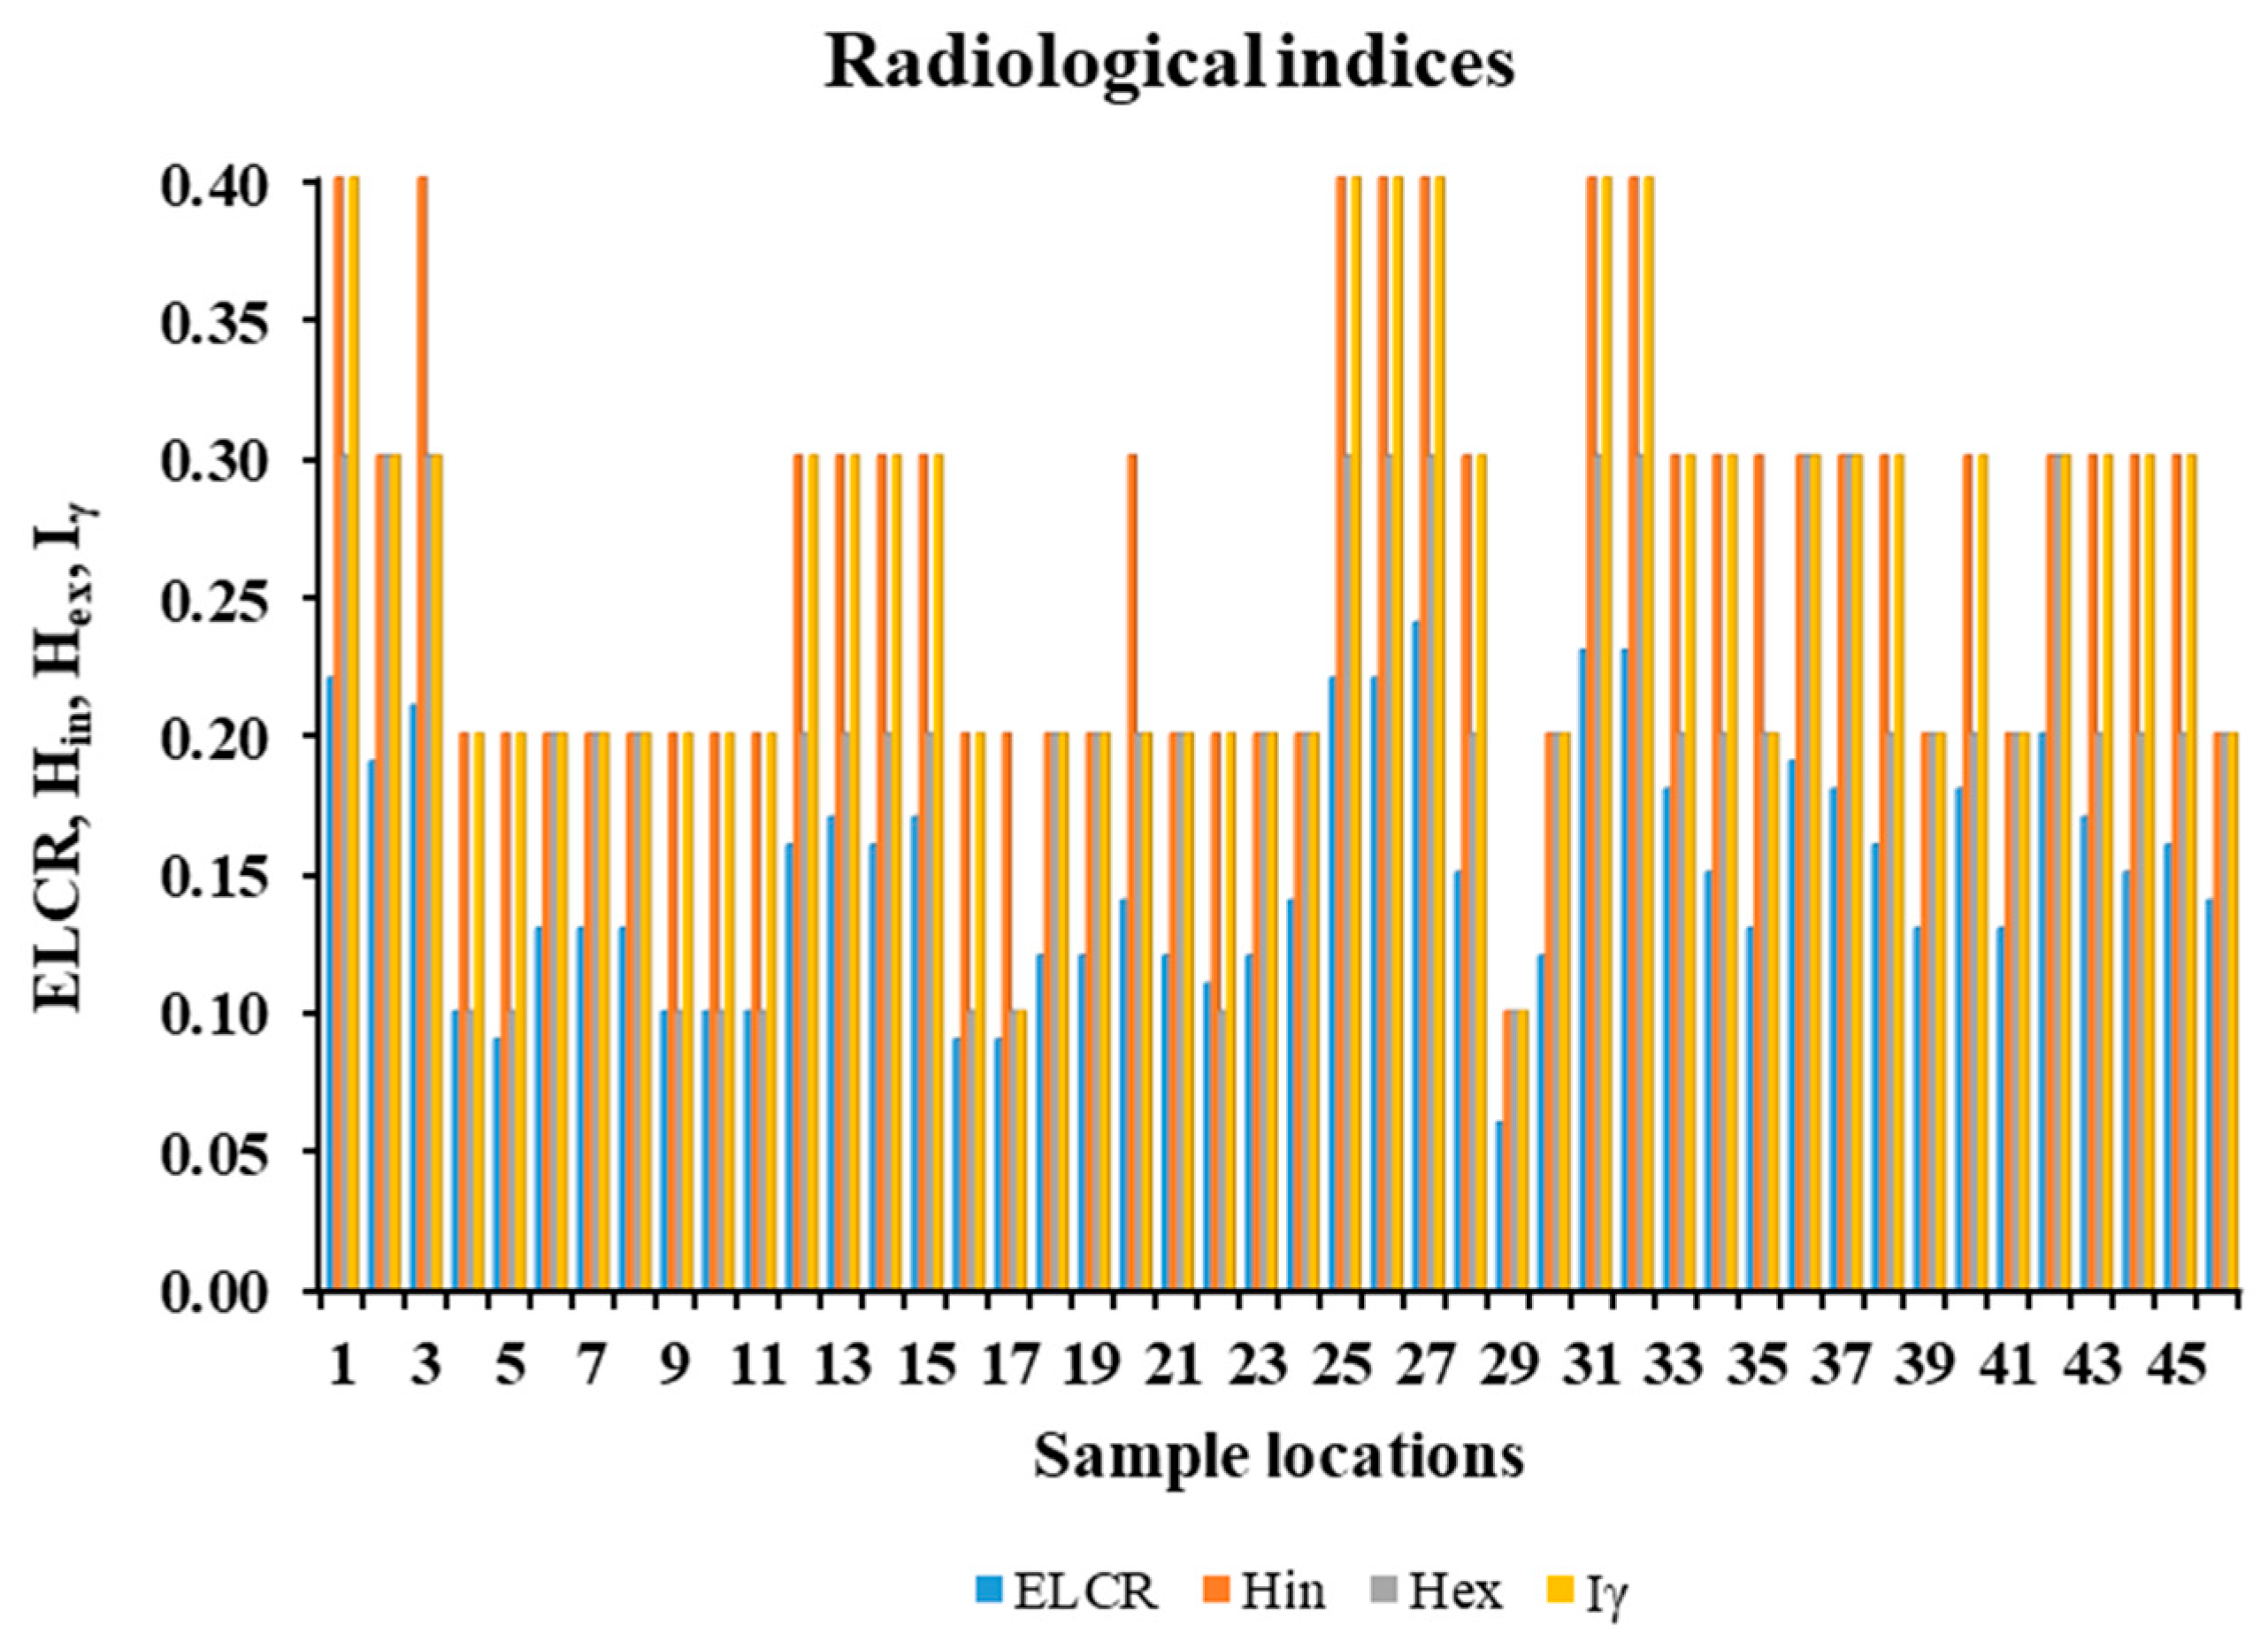
To estimate the risk due to radiation exposure from radionuclides in the soil, sediment and water, a radiological risk assessment was performed for the various sample locations. Figure 11 and Figure 12 show the radiological risks and health effect indices evaluated for soil and sediment in all the sampling locations.
From Figure 11, the radium equivalent activity (Raeq) values varied from 32.0 Bq/kg to 120.9 Bq/kg, with a mean of 76.7 Bq/kg. Both the lowest and highest values were recorded in mining locations. All Raeq values were below the UNSCEAR reference level of 370 Bq/kg [10,56]. Raeq is related to the external and internal gamma dose due to Rn-222 and its progenies, and thus, soil used by inhabitants as building material must not exceed 370 Bq/kg [76]. The estimated absorbed gamma dose rate (D) 1 m above the ground due to the occurrence of natural radionuclides in soil were observed to vary between 14.5 nGy/h and 56.1 nGy/h, with an average of 35.1 nGy/h, which is lower than the world mean of 60.0 nGy/h [56]. The estimated annual effective dose (AED) varied from 17.8 µSv/y to 68.8 µSv/y, with an average value of 43.0 µSv/y. The estimate AED was below the permissible level of 70.0 µSv/y for public exposure [10]. The computed AED for all the sampled locations were also below the suggested level of 20 mSv/y by the ICRP for occupational exposure [29,58]. The annual gonadal dose equivalent (AGDE) ranged from 100.1 µSv/y to 396.3 µSv/y, with an average of 245.3 µSv/y. The average AGDE value is less than the world average of 300.0 µSv/y [10]. Nonetheless, some locations (22%) recorded values above 300.0 µSv/y. These locations are mining areas and some undisturbed lands that are close to the mining areas.
According to the ICRP and UNSCEAR [10,51], the internal and external exposures to natural radiation must be minimal to limit the radiation dose 1 mSv/y. Thus, both Hin and Hex must be less than or equal to 1. In this study, the calculated values were found to have averages less than 1, with 0.3 and 0.2 for Hin and Hex, respectively (as shown in Figure 12). The gamma index (Iɣ), which considers the collective effect of natural radionuclides in an environment, were found to range between 0.1 and 0.4, with a mean value of 0.3, which is less than the world average of 1.0 [77]. The present study also estimated the rate of cancer rise in the study area by calculating the excess lifetime cancer risk (ELCR). The ELCR was found to range between 0.06 × 10⁻³ and 0.24 × 10⁻³. The computed mean of 0.15 × 10⁻³ is below the reference level of 0.29 × 10⁻³ (UNSCEAR, 2000 [10]). From Figure 7, the annual effective dose as a result of vegetable consumption was from 13.0 µSv/y to 29.3 µSv/y, with a mean value of 22.3 µSv/y. The mean value was below the permissible dose level of 1.0 mSv/y set by the UNSCEAR, IAEA and FAO [10,29,60,61,78].
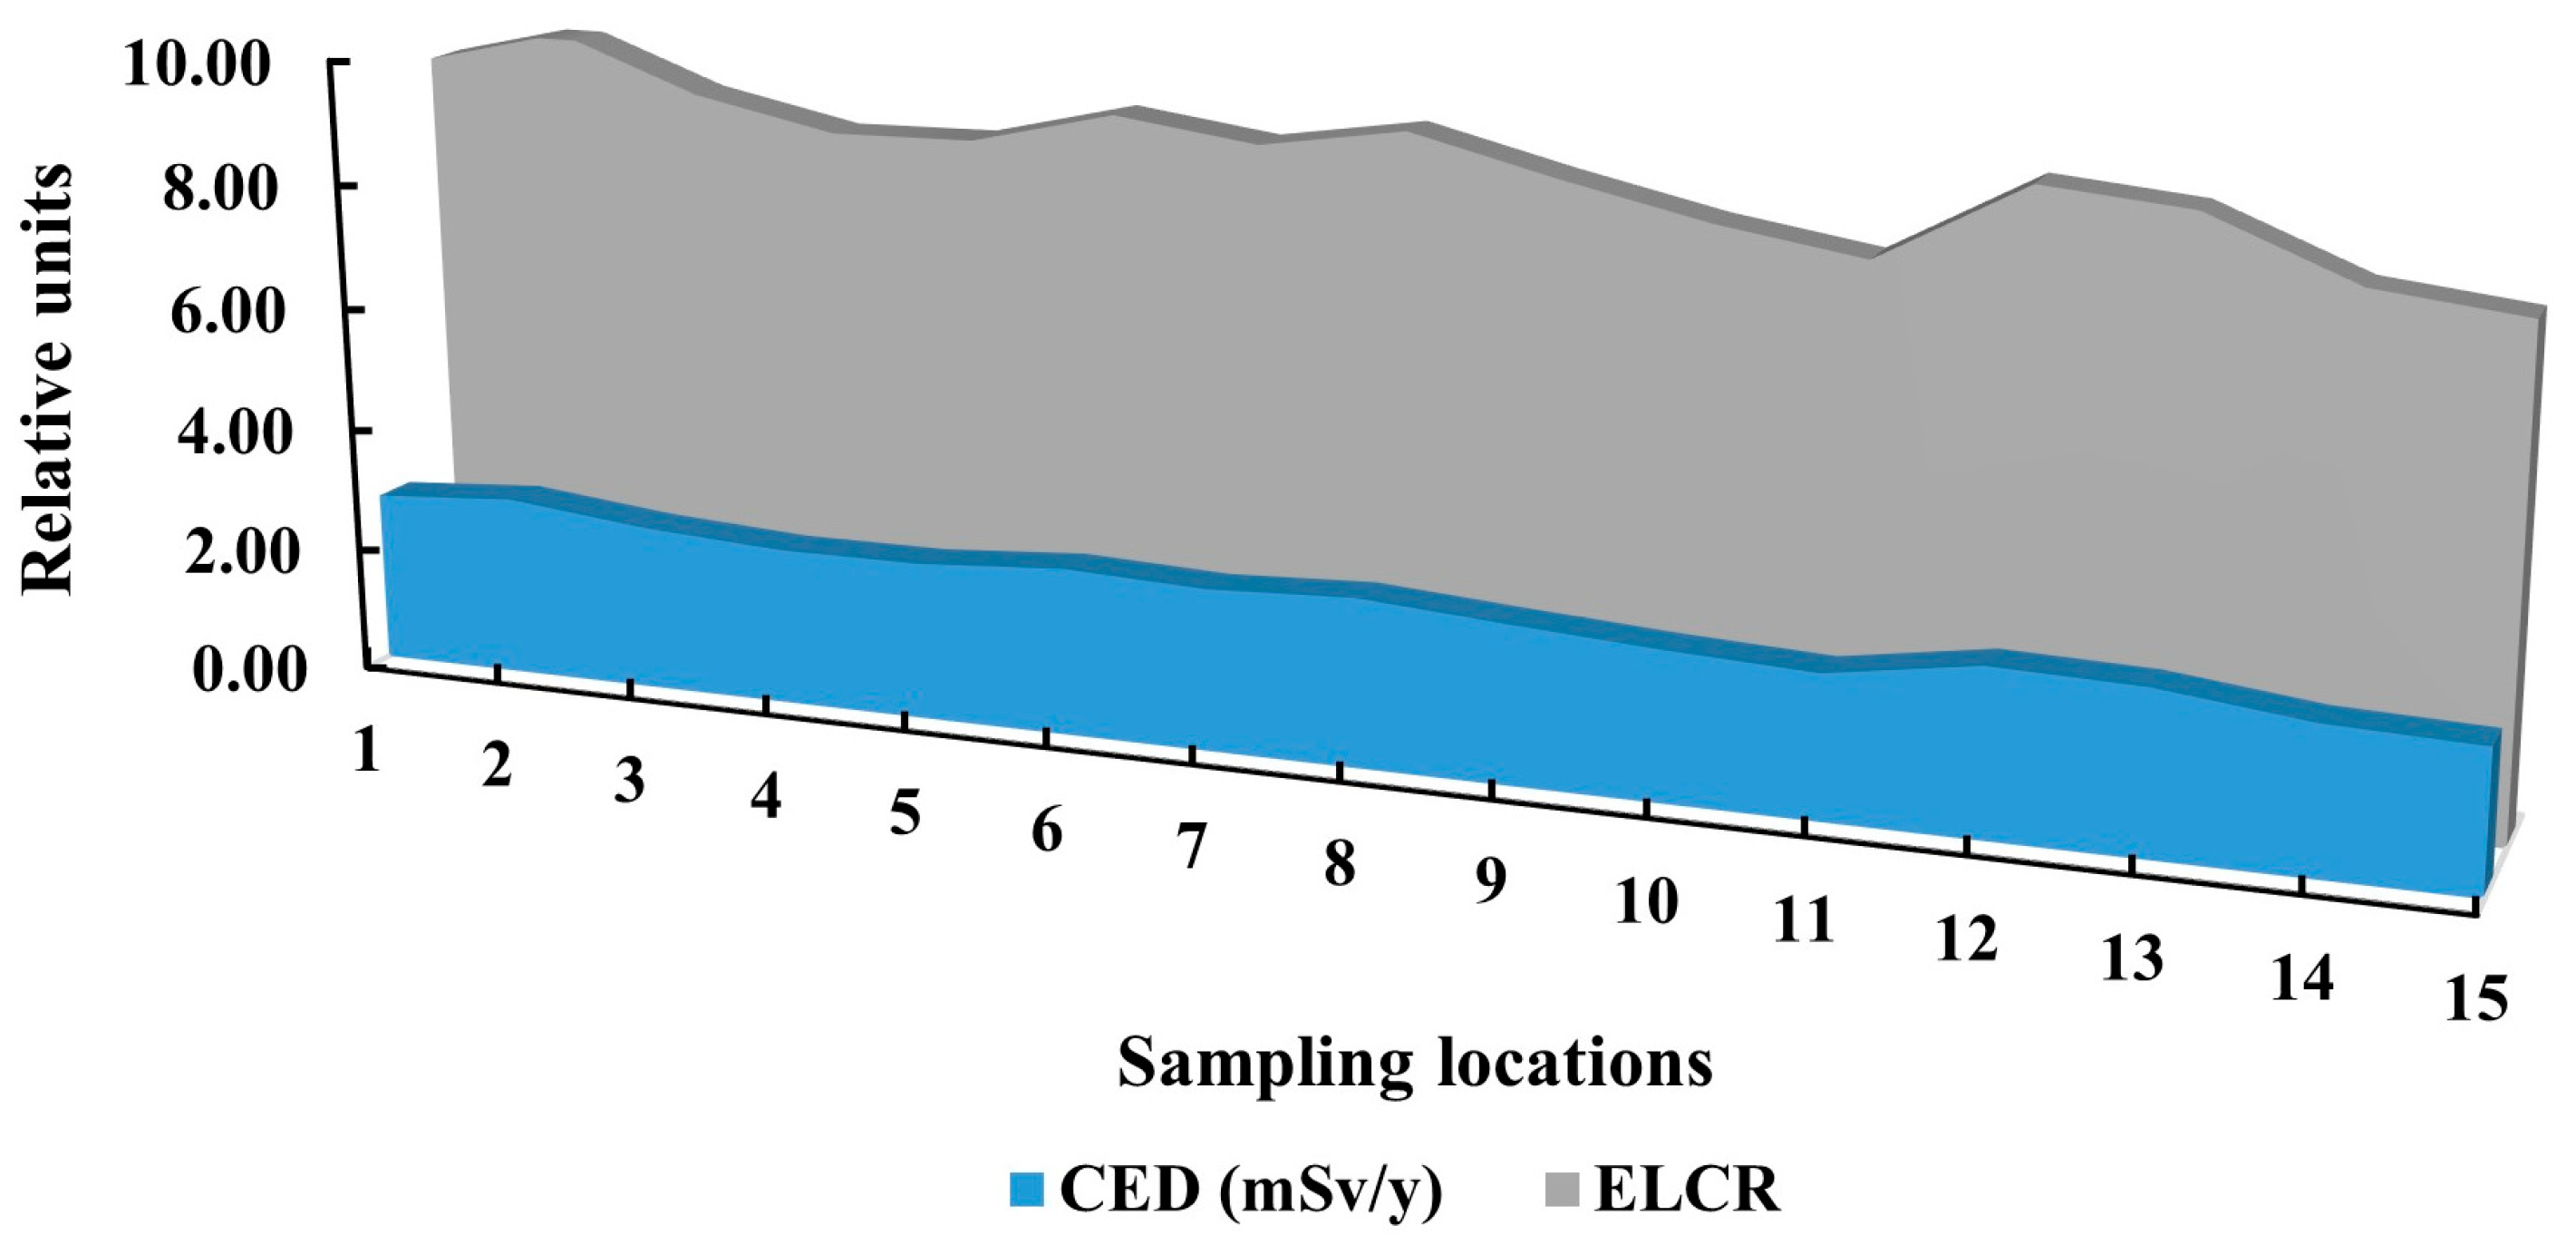
The radiological risk for ingestion of radionuclides in water from the sampling locations were also assessed, as presented in Figure 13. Radionuclides can be transferred from the respiratory tract to the gastrointestinal tract by ingestion. They can also be absorbed into the body fluid from the small intestines [72], and hence, there is a need to determine the dose due to ingestion of radionuclides. The committed annual effective dose (CED) due to ingestion of the determined radionuclides in water samples varied from 2.25 mSv/y to 2.88 mSv/y, with a mean dose of 2.55 mSv/y. The evaluated annual effective doses were well above the world average of 0.1 mSv/y set by the WHO and ICRP and 0.3 mSv/y suggested by the UNSCEAR [10,69,79]. The ELCR arising from ingestion of radionuclides in water ranged between 7.88 × 10⁻³ and 10.09 × 10⁻³, with an average of 8.94 × 10⁻³, which is higher than the reference level of 0.29 × 10⁻³ [10]. The highest CEDs (2.88 mSv/y and 2.73 mSv/y) and ELCRs (10.09 × 10⁻³ and 9.55 × 10⁻³) were recorded for water samples from mining sites with a direct connection to a river, hence the likelihood of polluting the river with radioactive substances. During the sampling activities of this study, it was observed that the miners washed the extracted gold ores or rocks containing gold ores directly in the rivers and streams or, in some cases, in ponds, with the wastes channeled into rivers and streams. This action by the miners can be the reason for the high CEDs and ELCRs computed for water samples from the study area. It was also observed that farmers with farms around mining sites use wastewater and the contaminated streams and rivers as sources of water to irrigate their farms and as drinking water for farm animals and herds. Thus, water sources identified in the study area are used for irrigation, domestic purposes and drinking water in certain areas. From Figure 13, it can be concluded that the ELCR due to water samples indicates that the probability of the public developing a type of cancer as a result of long-term exposure to radiation is certainly high.
The general outcome of the evaluation of the radiological parameters estimated in soil and sediment is that the miners and public living in the study area are likely to receive a minimal radiation dose, except in cases of using soil for building purposes, like filling and local brickmaking from locations that recorded high AGDE values, and thus, their use can pose a significant health risk to humans [29,51,59,70]. In the case of the water samples, the estimated doses and cancer risk were higher than the reference levels and their use will be detrimental to the health of the public. The exposure of the human population to natural radionuclides in the study area by inhalation and ingestion can result in internal exposure, and through gamma ray irradiation, result in external exposure [21]. These exposures in the long-term will give rise to serious health consequences, such as chronic hemorrhage, premature aging, lung cancer, gastrointestinal cancer, kidney diseases, anemia, necrosis of the mouth, cardiovascular complications and acute leucopoenia. Exposure to specific radionuclides, like radium, can cause cataract, teeth fracture and several types of cancers, and thorium exposure may result in lung, hepatic, pancreas, kidney and bone cancers, as well as leukemia [6,32,80,81].

4. Conclusions

Radioactivity concentrations of terrestrial radionuclides Ra-226, Ra-228, Th-232 and K-40 were determined using an HPGe gamma ray detector in soil, sediment and water samples collected from mining areas in Eastern Region, Ghana. The average activity concentrations of Ra-226, Th-232 and K-40 studied in soil and sediment samples were below the world average values. However, in the water samples, Ra-226 and Ra-228 recorded mean values above the screening levels of 1.0 Bq/L and 0.1 Bq/L, respectively. The radium contents in vegetables were also computed. Their concentrations were observed within typical background activity ranges reported by the UNSCEAR and imply low dose contribution at the assumed transfer coefficient. The radiological safety parameters were evaluated in the study. All the evaluated radiological hazard parameters for the soil and sediment were below reference levels. However, it was noted that some sample locations had values higher than recommended, especially for the AGDE. The committed effective dose from water ingestion exceeded the WHO reference dose level of 0.1 mSv y−1 at many locations, indicating that the studied waters are not suitable for drinking without treatment and warrant confirmatory monitoring. These suggest that the residents of the area are exposed to natural radioactivity due to miners washing gold ores, either directly in water resources or by directing the liquid wastes into the water resources of the study area. Hence, considering the impact of the artisanal mining activities within the study area, the water resources are not suitable for drinking without treatment. Potential implications for domestic use and irrigation warrant targeted assessment (including filtered/unfiltered splits and crop uptake measurements); therefore, interim restrictions and confirmatory monitoring (including filtered/unfiltered split and radiochemical confirmation for Ra) plus mitigation (alternative water sources/treatment) is highly recommended. Further studies, including those using Liquid Scintillation Techniques and covering more areas, would enable the appropriate regulatory agencies to put measures in place to ensure residents are not exposed to radiation doses from radionuclides. The outcome of this investigation can be applicable for creating a natural radioactivity map and a source of reference for future environmental radioactivity assessment for the region.

Author Contributions

Conceptualization, E.O.A.-k., F.O., A.S. and T.K.; Data curation, E.O.A.-k. and A.S.; Formal analysis, E.O.A.-k., E.T.G., E.A., L.T.-L., A.C., A.S. and T.K.; Investigation, E.O.A.-k., E.T.G., E.A., L.T.-L. and A.C.; Methodology, E.O.A.-k., F.O., E.A., T.G., A.C., A.S. and T.K.; Resources, T.K.; Software, E.O.A.-k.; Validation, E.T.G., A.S. and T.K.; Visualization, E.O.A.-k. and A.S.; Writing—original draft, E.O.A.-k., F.O., E.A., L.T.-L., A.C., A.S. and T.K.; Writing—review and editing, E.O.A.-k., A.S. and T.K. All authors have read and agreed to the published version of the manuscript.

Funding

This research received no external funding.

Data Availability Statement

The original contributions presented in this study are included in the article. Further inquiries can be directed to the corresponding author.

Conflicts of Interest

Author Eunice Amponsem was employed by the company Wallulel Ghana Ltd. The remaining authors declare that the research was conducted in the absence of any commercial or financial relationships that could be construed as a potential conflicts of interest.

References

  1. Öge, T.O.; Özdemir, F.B.; Öge, M. Assessment of environmental radioactivity in soil samples from Bartın Province, Turkey. J. Radioanal. Nucl. Chem. 2021, 328, 149–162. [Google Scholar] [CrossRef]
  2. Abdulkarim, M.S.; Umar, S.; Mohammed, A.; Modelu, D. Determination of radionuclides in soil samples taken from Gura Topp (Jos) using sodium iodide thallium detector NaI(Ti). Niger. J. Basic Appl. Sci. 2018, 26, 30–34. [Google Scholar] [CrossRef]
  3. Sayeb, I.S.; Mustafa, M.B. Detection of natural radioactive materials in the soil of bauxite mining areas of Kuantan, Pahang, Malaysia. Int. J. Math. Phys. Sci. Res. 2016, 4, 74–76. [Google Scholar]
  4. Najam, L.A.; Younis, S.A. Assessment of natural radioactivity level in soil samples for selected regions in Nineveh Province (IRAQ). Int. J. Nov. Res. Phys. Chem. Math. 2015, 2, 1–9. [Google Scholar]
  5. Sivakumar, S.; Chandrasekaran, A.; Ravisankar, R.; Ravikumar, S.M.; Prince, J.; Jebakumar, P.; Vijayagopal, P.; Vijayalakshmi, I.; Jose, M.T. Measurement of natural radioactivity and evaluation of radiation hazards in coastal sediments of east coast of Tamilnadu using statistical approach. J. Taibah Univ. Sci. 2014, 8, 375–384. [Google Scholar] [CrossRef]
  6. Qureshi, A.A.; Tariq, S.; Din, K.U.; Manzoor, S.; Calligaris, C.; Waheed, A. Evaluation of excessive lifetime cancer risk due to natural radioactivity in the rivers sediments of Northern Pakistan. J. Radiat. Res. Appl. Sci. 2014, 7, 438–447. [Google Scholar] [CrossRef]
  7. Ademola, A.K.; Bello, A.K.; Adejumobi, A.C. Determination of natural radioactivity and hazard in soil samples in and around gold mining area in Itagunmodi, south-western, Nigeria. J. Radiat. Res. Appl. Sci. 2014, 7, 249–255. [Google Scholar] [CrossRef]
  8. Innocent, A.J.; Onimisi, M.Y.; Jonah, S.A. Evaluation of naturally occurring radionuclide materials in soil samples collected from some mining sites in Zamfara State, Nigeria. Br. J. Appl. Sci. Technol. 2013, 3, 684–692. [Google Scholar] [CrossRef]
  9. Hamzah, Z.; Rahman, S.A.A.; Saat, A. Measurement of 226Ra, 228Ra and 40K in soil in district of Kuala Krai using gamma spectrometry. Malays. J. Anal. Sci. 2011, 15, 159–166. [Google Scholar]
  10. United Nations Scientific Committee on the Effects of Atomic Radiation (UNSCEAR). Sources, Effects, and Risks of Ionization Radiation; Report to the General Assembly 2000, with Annexes; UNSCEAR: New York, NY, USA, 2000. [Google Scholar]
  11. Shayeb, M.A.; Baloch, M.A. Distribution of natural radioactivity in soil and date palm-pits using high purity germanium radiation detectors and LB-alpha/beta gas flow counter in Saudi Arabia. Nucl. Eng. Technol. 2020, 52, 1282–1288. [Google Scholar] [CrossRef]
  12. Chandrasekaran, A.; Rajalakshmi, A.; Ravisankar, R.; Vijayagopal, P.; Venkatraman, B. Measurements of natural gamma radiations and effects of physico-chemical properties in soils of Yelagiri hills, Tamilnadu India with statistical approach. Procedia Earth Planet. Sci. 2015, 11, 531–538. [Google Scholar] [CrossRef]
  13. Taqi, A.H.; Shaker, A.M.; Battawy, A.A. Natural radioactivity assessment in soil samples from Kirkuk city of Iraq using HPGe detector. Int. J. Radiat. Res. 2018, 16, 455–463. Available online: http://ijrr.com/article-1-2398-en.html (accessed on 3 September 2025).
  14. Yordanova, I.I.; Banov, M.D.; Misheva, L.G.; Staneva, D.N.; Bineva, T.K. Natural radioactivity in virgin soils and soils from some areas with closed uranium mining facilities in Bulgaria. Open Chem. 2015, 13, 600–605. [Google Scholar] [CrossRef]
  15. Akpanowo, M.A.; Umaru, I.; Iyakwari, S. Assessment of radiological risk from the soils of artisanal mining areas of Anka, North West Nigeria. Afr. J. Environ. Sci. Technol. 2019, 13, 303–309. [Google Scholar] [CrossRef]
  16. Asaduzzaman, K.; Khandaker, M.U.; Amin, Y.M.; Bradley, D.A.; Mahat, R.H.; Nor, R.M. Soil-to-root vegetable transfer factors for 226Ra, 232Th, 40K, and 88Y in Malaysia. J. Environ. Radioact. 2014, 135, 120–127. [Google Scholar] [CrossRef]
  17. Liu, Y.; Zhou, W.; Gao, B.; Zheng, Z.; Chen, G.; Wei, Q.; He, Y. Determination of radionuclide concentration and radiological hazard in soil and water near the uranium tailings reservoir in China. Environ. Pollut. Bioavailab. 2021, 33, 174–183. [Google Scholar] [CrossRef]
  18. Mathuthu, M.; Uushona, V.; Indongo, V. Radiological safety of groundwater around a uranium mine in Namibia. Phys. Chem. Earth Parts A/B/C 2021, 122, 102915. [Google Scholar] [CrossRef]
  19. The Joint Research Centre: EU Science Hub. Simplified Pathways of Natural Radionuclides. 2025. Available online: https://joint-research-centre.ec.europa.eu/sites/default/files/styles/oe_theme_medium_no_crop/public/2024-09/Simplified%20pathways%20of%20natural%20radionuclides.jpg?itok=Z0OhKE3a (accessed on 28 June 2025).
  20. Ramadhany, M.F.; Wijaya, G.S.; Muharini, A. Assessment of natural radioactivity concentration and radiological risk in Tanjung Enim’s coal mine, South Sumatra Indonesia. Res. Sq. 2022. [Google Scholar] [CrossRef]
  21. Ladan, S.C.; Mustapha, I.M.; Hassan, A.; Aliyu, M.S.; Tukur, S.R. Assessment of radioactivity concentration level in soil samples of some gold mining areas of Shiroro, Niger State, Nigeria. J. Radiat. Nucl. Appl. 2022, 7, 1–6. [Google Scholar] [CrossRef]
  22. Leuangtakoun, S.; Hong, B.T.; Loat, B.V.; Cuong, P.V. Determination of natural radioactivity in soil samples around gold mining area in Khamkeut district, Bolikhamxay Province, Laos using gammarRay spectrometer with NaI (Tl) detector. VNU J. Sci. Math.-Phys. 2018, 34, 12–21. [Google Scholar] [CrossRef]
  23. Yachiso, G.; Chaubey, A.K.; Turi, B. Measurements of natural radioactivity levels in soil samples and hazards in Lega Dembi gold mining, East Guji, Oromia, Ethiopia. Res. Sq. 2022. [Google Scholar] [CrossRef]
  24. Souffit, D.G.; Saïdou; Modibo, B.O.; Lepoire, D.; Tokonami, S. Risk assessment of exposure to natural radiation in soil using RESRAD-ONSITE and RESRAD-BIOTA in the cobalt-nickel bearing areas of Lomié in Eastern Cameroon. Radiation 2022, 2, 177–192. [Google Scholar] [CrossRef]
  25. Joel, E.S.; Maxwell, O.; Adewoyin, O.O.; Olawole, O.C.; Arijaje, T.E.; Embong, Z.; Saeed, M.A. Investigation of natural environmental radioactivity concentration in soil of coastaline area of Ado-Odo/Ota Nigeria and its radiological implications. Sci. Rep. 2019, 9, 4219. [Google Scholar] [CrossRef]
  26. Bansah, K.J.; Dumakor-Dupey, N.K.; Kansake, B.A.; Assan, E.; Bekui, P. Socioeconomic and environmental assessment of informal artisanal and small-scale mining in Ghana. J. Clean. Prod. 2018, 202, 465–475. [Google Scholar] [CrossRef]
  27. Galhardi, J.A.; García-Tenorio, R.; Bonotto, D.M.; Frances, I.D.; Motta, J.G. Natural radionuclides in plants, soils and sediments affected by U-rich coal mining activities in Brazil. J. Environ. Radioact. 2017, 177, 37–47. [Google Scholar] [CrossRef]
  28. Bello, S.; Nasiru, R.; Garba, N.N.; Adeyemo, D.J. Annual effective dose associated with radon, gross alpha and gross beta radioactivity in drinking water from gold mining areas of Shanono and Bagwai, Kano state, Nigeria. Microchem. J. 2020, 154, 104551. [Google Scholar] [CrossRef]
  29. Idriss, H.; Salih, I.; Alaamer, A.S.; Saleh, A.; Abdelgali, M.Y. Environmental-impact assessment of natural radioactivity around a traditional mining area in Al-Ibedia, Sudan. Arch. Environ. Contam. Toxicol. 2016, 70, 783–792. [Google Scholar] [CrossRef]
  30. Odumo, O.B.; Mustapha, A.O.; Patel, J.P.; Angeyo, H.K. Radiological survey and assessment of associated activity concentration of the naturally occurring radioactive materials (NORM) in the Migori artisanal gold mining belt of southern Nyanza, Kenya. Appl. Radiat. Isot. 2011, 69, 912–916. [Google Scholar] [CrossRef]
  31. Aliyu, A.S.; Ibrahim, U.; Akpa, C.T.; Garba, N.N.; Ramli, A.T. Health and ecological hazards due to natural radioactivity in soil from mining areas of Nasarawa State, Nigeria. Isot. Environ. Health Stud. 2015, 51, 448–468. [Google Scholar] [CrossRef]
  32. Focus, E.; Rwiza, M.J.; Mohammed, N.K.; Banzi, F.P. The influence of gold mining on radioactivity of mining sites soil in Tanzania. EQA-Int. J. Environ. Qual. 2021, 46, 46–59. [Google Scholar] [CrossRef]
  33. Barba-Lobo, A.; Gázquez, M.J.; Bolívar, J.P. A practical procedure to determine natural radionuclides in solid materials from mining. Minerals 2022, 12, 611. [Google Scholar] [CrossRef]
  34. Nguelem, E.J.M.; Ndontchueng, M.M.; Motapon, O. Determination of 226Ra, 232Th, 40K, 235U and 238U activity concentration and public dose assessment in soil samples from bauxite core deposits in Western Cameroon. SpringerPlus 2016, 5, 1253. [Google Scholar] [CrossRef]
  35. Adukpo, O.K.; Faanu, A.; Lawluvi, H.; Tettey-Larbi, L.; Emi-Reynolds, G.; Darko, E.O.; Kansaana, C.; Kpeglo, D.O.; Awudu, A.R.; Glover, E.T.; et al. Distribution and assessment of radionuclides in sediments, soil and water from the lower basin of river Pra in the Central and Western Regions of Ghana. J. Radioanal. Nucl. Chem. 2015, 303, 1679–1685. [Google Scholar] [CrossRef]
  36. Anyimah Ackah, E.; Ofosu, I.W.; Lutterodt, H.E.; Darko, G.; Kpeglo, D.O. Excess lifetime cancer risk and committed effective dose associated with dietary exposure to radioactivity of natural origin from mining areas. J. Consum. Prot. Food Saf. 2021, 16, 219–225. [Google Scholar] [CrossRef]
  37. Doyi, I.; Oppon, O.C.; Glover, E.T.; Gbeddy, G.; Kokroko, W. Assessment of occupational radiation exposure in underground artisanal gold mines in Tongo, Upper East Region of Ghana. J. Environ. Radioact. 2013, 126, 77–82. [Google Scholar] [CrossRef]
  38. Faanu, A.; Darko, E.O.; Ephraim, J.H. Determination of natural radioactivity and hazard in soil and rock samples in a mining area in Ghana. West Afr. J. Appl. Ecol. 2011, 19, 79–92. [Google Scholar]
  39. Faanu, A.; Kpeglo, D.O.; Sackey, M.; Darko, E.O.; Emi-Reynolds, G.; Lawluvi, H.; Awudu, R.; Adukpo, O.K.; Kansaana, C.; Ali, I.D.; et al. Natural and artificial radioactivity distribution in soil, rock and water of the Central Ashanti Gold Mine, Ghana. Environ. Earth Sci. 2013, 70, 1593–1604. [Google Scholar] [CrossRef]
  40. Faanu, A.; Lawluvi, H.; Kpeglo, D.O.; Darko, E.O.; Emi-Reynolds, G.; Awudu, A.R.; Adukpo, O.K.; Kansaana, C.; Ali, I.D.; Agyeman, B.; et al. Assessment of natural and anthropogenic radioactivity levels in soils, rocks and water in the vicinity of Chirano Gold Mine in Ghana. Radiat. Prot. Dosim. 2014, 158, 87–99. [Google Scholar] [CrossRef]
  41. Faanu, A.; Adukpo, O.K.; Tettey-Larbi, L.; Lawluvi, H.; Kpeglo, D.O.; Darko, E.O.; Emi-Reynolds, G.; Awudu, R.A.; Kansaana, C.P.; Amoah, A.; et al. Natural radioactivity levels in soils, rocks, and water at a mining concession of Perseus gold mine and surrounding towns in Central Region of Ghana. SpringerPlus 2016, 5, 98. [Google Scholar] [CrossRef]
  42. Purwins, S. Bauxite mining at Atiwa Forest Reserve, Ghana: A political ecology of a conservation-exploitation conflict. GeoJournal 2020, 87, 1085–1097. [Google Scholar] [CrossRef]
  43. International Union for Conservation of Nature (IUCN). Atiwa Fate Back in the Public Domain. Flowing Water or Bauxite Breakdown? IUCN: Gland, Switzerland, 2020; pp. 1–12. [Google Scholar]
  44. Ministry of Finance and Economic Planning (Ghana) (MOFEP). Programme-Based Budget Estimates for 2019, Atiwa West District Assembly. Ministry of Finance, Composite Budget for 2019–2022. 2019. Available online: https://mofep.gov.gh/sites/default/files/composite-budget/2019/ER/Atiwa-West.pdf (accessed on 23 July 2022).
  45. Amponsah, A.; Nasare, L.I.; Tom-Dery, D.; Baatuuwie, B.N. Land cover changes of Atiwa Range Forest Reserve, a biodiversity hotspot in Ghana. Trees For. People 2022, 9, 100301. [Google Scholar] [CrossRef]
  46. International Atomic Energy Agency (IAEA). Soil Sampling for Environmental Contaminants; IAEA-TECDOC-1415; IAEA: Vienna, Austria, 2004; pp. 1–81. ISBN 92-0-111504-0. Available online: https://www.iaea.org/publications/7113/soil-sampling-for-environmental-contaminants (accessed on 3 September 2025).
  47. ISO 5667-3:2018; Water Quality—Sampling—Part 3: Preservation and Handling of Water Samples. ISO: Geneva, Switzerland, 2018.
  48. U.S. Environmental Protection Agency (EPA). Method 903.1: Radium-226 in drinking water, radon emanation technique. In Methods for Chemical Analysis of Water and Wastes; EPA-600/4-79-020; U.S. EPA: Cincinnati, OH, USA, 1980. [Google Scholar]
  49. International Atomic Energy Agency (IAEA). Measurement of Radionuclides in Food and the Environment; Technical Reports Series No. 295; IAEA: Vienna, Austria, 1989. [Google Scholar]
  50. ISO 18589-2:2015; Measurement of radioactivity in the environment—Soil—Part 2: Preparation of samples. ISO: Geneva, Switzerland, 2015.
  51. Akuo-ko, E.O.; Adelikhah, M.; Amponsem, E.; Csordas, A.; Kovacs, T. Radiological assessment in beach sediment of coastline, Ghana. Heliyon 2023, 9, e16690. [Google Scholar] [CrossRef]
  52. Orosun, M.M.; Usikalu, M.R.; Oyewumi, K.J.; Adagunodo, T.A. Natural radionuclides and radiological risk assessment of granite mining field in Asa, North-central Nigeria. MethodsX 2019, 6, 2504–2514. [Google Scholar] [CrossRef]
  53. International Commission on Radiological Protection (ICRP). Recommendations of the International Commission on Radiological Protection. ICRP Publication 60. 1990. Available online: https://www.icrp.org/publication.asp?id=ICRPPublication60 (accessed on 3 September 2025).
  54. Beogo, C.E.; Cisse, O.I.; Zougmore, F. Assessment of radiological hazards from soil samples in the Northeastern area of Burkina Faso. SN Appl. Sci. 2022, 4, 73. [Google Scholar] [CrossRef]
  55. Atibu, E.K.; Arpagaus, P.; Mulaji, C.K.; Mpiana, P.T.; Poté, J.; Loizeau, J.-L.; Carvalho, F.P. High environmental radioactivity in artisanal and small-scale gold mining in Eastern Democratic Republic of the Congo. Minerals 2022, 12, 1278. [Google Scholar] [CrossRef]
  56. United Nations Scientific Committee on the Effects of Atomic Radiation (UNSCEAR). Sources of Ionizing Radiation; UNSCEAR: Vienna, Austria, 2008; Volume 1. [Google Scholar]
  57. World Health Organization (WHO). Guidelines for Drinking Water Quality, 4th ed.; WHO: Geneva, Switzerland, 2011; pp. 1–541.
  58. International Commission on Radiological Protection (ICRP). Recommendation of the International Commission on Radiological Protection (ICRP); Oxford Publication 60, Annals of the ICRP 210-3; Pergamon Press: New York, NY, USA, 1991. [Google Scholar]
  59. United Nations Scientific Committee on the Effects of Atomic Radiation (UNSCEAR). Sources and Effects of Ionizing Radiation; UNSCEAR: Vienna, Austria, 1988. [Google Scholar]
  60. Idriss, H.; Salih, I.; Alaamer, A.S.; AL-Rajhi, M.A.; Osman, A.; Adreani, T.A.; Abdelgalil, M.Y.; Ali, N.Y. Health risk profile for terrestrial radionuclides in soil around artisanal gold mining area at Alsopag, Sudan. Acta Geophys. 2018, 66, 673–681. [Google Scholar] [CrossRef]
  61. International Atomic Energy Agency (IAEA). International Basic Safety for Protection Against Ionizing Radiation and for the Safety of Radiation Sources; Safety Series No. 115; IAEA: Vienna, Austria, 1996. [Google Scholar]
  62. International Atomic Energy Agency (IAEA). The Environmental Behavior of Radium; Technical Report Series I 310; IAEA: Vienna, Austria, 1990. [Google Scholar]
  63. Dina, N.T.; Das, S.C.; Kabir, M.Z.; Rasul, M.G.; Deeba, F.; Rajib, M.; Islam, M.S.; Hayder, A.; Ali, M.I. Natural radioactivity and its radiological implications from soils and rocks in Jaintiapur area, North-east Bangladesh. J. Radioanal. Nucl. Chem. 2022, 331, 4457–4468. [Google Scholar] [CrossRef]
  64. Perevoshchikov, R.; Perminova, A.; Menshikova, E. Natural radionuclides in soils of natural-technogenic landscapes in the impact zone of potassium salt mining. Minerals 2022, 12, 1352. [Google Scholar] [CrossRef]
  65. Navarrete, M.; Zúñiga, M.A.; Espinosa, G.; Golzarri, J.I. Radioactive contamination factor (RCF) obtained by comparing contaminant radioactivity (137Cs) with natural radioactivity (40K) in marine sediments taken up from Mexican sea waters. World J. Nucl. Sci. Technol. 2014, 4, 158–162. [Google Scholar] [CrossRef]
  66. Huang, Y.; Lu, X.; Ding, X.; Feng, T. Natural radioactivity level in beach sand along the coast of Xiamen Island, China. Mar. Pollut. Bull. 2015, 91, 357–361. [Google Scholar] [CrossRef]
  67. Akuo-ko, E.O.; Adelikhah, M.; Amponsem, E.; Csordas, A.; Kovacs, T. Investigations of indoor radon levels and its mapping in the Greater Accra region, Ghana. J. Radioanal. Nucl. Chem. 2023, 333, 2975–2986. [Google Scholar] [CrossRef]
  68. Hashim, A.J.; Najam, L.A. Radium and uranium concentrations measurements in vegetable samples of Iraq. Detection 2015, 3, 21–28. [Google Scholar] [CrossRef]
  69. World Health Organization (WHO). Guidelines for Drinking—Water Quality, 3rd ed.; WHO: Geneva, Switzerland, 2008.
  70. Amin, S.A.; Ayoub, A.A.; Jassim, A.A. Radioactivity levels in some vegetables and herbs. Eng. Technol. J. 2018, 36, 174–178. [Google Scholar]
  71. United Nations Scientific Committee on the Effects of Atomic Radiation (UNSCEAR). Sources and Effects of Ionizing Radiation; UNSCEAR: Vienna, Austria, 1993. [Google Scholar]
  72. Avwiri, G.O.; Osimobi, J.C.; Agbalagba, E.O. Evaluation of natural occurring radionuclide variation with lithology depth profile of Udi and Ezeagu local government areas of Enugu State, Nigeria. Int. J. Eng. Appl. Sci. 2013, 4, 1–10. [Google Scholar]
  73. Alvarado, J.A.C.; Balsiger, B.; Rollin, S.; Jakob, A.; Burger, M. Radioactive and chemical contamination of the water resources in the former uranium mining and milling sites of Mailuu Suu (Kyrgyzstan). J. Environ. Radioact. 2014, 138, 1–10. [Google Scholar] [CrossRef]
  74. Alazemi, N.; Bajoga, A.D.; Bradley, D.A.; Regan, P.H.; Shams, H. Soil radioactivity levels, radiological maps, and risk assessment for the state of Kuwait. Chemosphere 2016, 154, 55–62. [Google Scholar] [CrossRef]
  75. Sureshgandhi, M.; Ravisankar, R.; Rajalakshmi, A.; Sivakumar, S.; Chandrasekaran, A.; Anand, D.P. Measurements of natural gamma radiation in beach sediments of north-east coast of Tamilnadu, India by gamma ray spectrometry with multivariate statistical approach. J. Radiat. Res. Appl. Sci. 2014, 7, 7–17. [Google Scholar] [CrossRef]
  76. Otoo, F.; Darko, E.O.; Garavaglia, M.; Giovani, C.; Pividore, S.; Andam, A.B.; Amoako, J.K.; Adukpo, O.K.; Tandoh, J.B.; Inkoom, S. Public exposure to natural radioactivity and radon exhalation rate in construction materials used within Greater Accra Region of Ghana. Sci. Afr. 2018, 1, e00009. [Google Scholar] [CrossRef]
  77. Botwe, B.O.; Schirone, A.; Delbono, I.; Barsanti, M.; Delfanti, R.; Kelderman, P.; Nyarko, E.; Lens, P.N.L. Radioactivity concentrations and their radiological significance in sediments of the Tema Harbour, Greater Accra, Ghana. J. Radiat. Res. Appl. Sci. 2017, 10, 63–71. [Google Scholar] [CrossRef]
  78. Food and Agriculture Organization of the United Nations (FAO). Review of Food Consumption Surveys, Recommendations; Africa, 102; FAO: Rome, Italy, 1977. [Google Scholar]
  79. International Commission on Radiological Protection (ICRP). Protection from Potential Exposures—Application to Selected Radiation Sources; ICRP Publication 76, Ann ICRP 27 (2); ICRP: Ottawa, ON, Canada, 1997. [Google Scholar]
  80. Zubair, M.; Shafiqullah. Measurement of natural radioactivity in several sandy-loamy soil samples from Sijua, Dhanbad, India. Heliyon 2020, 6, e03430. [Google Scholar] [CrossRef] [PubMed]
  81. Kaur, M.; Tripathi, P.; Choudary, I.; Mehra, R.; Kumar, A. Assessment of annual effective dose due to inhalation and ingestion of radon in water samples from some regions of Punjab, India. Int. J. Pure Appl. Phys. 2017, 13, 193–200. [Google Scholar]
Figure 1. Pathways of human exposure to natural radionuclides [19].
Applsci 15 09857 g001
Figure 2. Map of study area.
Applsci 15 09857 g002
Figure 3. Distribution of Ra-226 activity concentrations in the various sampling locations.
Applsci 15 09857 g003
Figure 4. Distribution of Th-232 activity concentrations in the various sampling locations.
Applsci 15 09857 g004
Figure 5. Distribution of K-40 activity concentrations in the various sampling locations.
Applsci 15 09857 g005
Figure 6. Comparing mean activity levels with the world averages.
Applsci 15 09857 g006
Figure 7. Estimated activity concentrations of Ra-226 (Bq/kg) in the vegetables and the effective doses.
Applsci 15 09857 g007
Figure 8. Activity concentrations of Ra-226, Ra-228 and K-40 measured in the water samples.
Applsci 15 09857 g008
Figure 9. Activity correlations between (a) Ra-226 and Th-232, (b) Ra-226 and K-40, and (c) Th-232 and K-40.
Applsci 15 09857 g009
Figure 10. Sediment–water Kd values for Ra-226, Ra-228 and K-40.
Applsci 15 09857 g010
Figure 11. Radiological hazards due to radionuclides’ activity levels in soil and sediment.
Applsci 15 09857 g011
Figure 12. Radiological indices due to radionuclides’ activity levels in soil and sediment.
Applsci 15 09857 g012
Figure 13. Annual effective dose and ELCR determined for water samples.
Applsci 15 09857 g013
Table 1. Statistical data of the measured radionuclides in the soils and sediments.
Ra-226 (Bq/kg)Th-232 (Bq/kg)K-40 (Bq/kg)
Mining sitesMean24.1 ± 2.333.5 ± 2.5262 ± 25
Range12.9–29.110.8–44.048–429
Standard deviation3.58.8115.1
Geometric mean23.831.9225
SedimentMean18.817.0167
Range15.8–22.414.3–20.2128–223
Standard deviation2.22.037.9
Geometric mean18.716.9163
FarmsMean21.121.4136
Range17.3–28.815.8–26.840–269
Standard deviation3.83.765.3
Geometric mean20.821.1117
Undisturbed landsMean22.431.7184
Range16.2–26.825.9–38.841–310
Standard deviation3.23.987.8
Geometric mean22.231.4159
Table 2. Statistics for radionuclides in water samples.
Ra-226 (Bq/L)Ra-228 (Bq/L)K-40 (Bq/L)
Mean1.02 ± 0.24.53 ± 0.913.97 ± 3.2
Minimum0.52 ± 0.23.92 ± 1.010.90 ± 3.1
Maximum1.31 ± 0.25.12 ± 0.916.50 ± 3.2
Median1.144.5613.98
Standard deviation0.270.311.73
Geometric mean0.974.5213.86
Table 3. Correlation analysis between radionuclides and radiological parameters.
Ra-226Th-232K-40Ra-226vegEveg
Ra-2261.0
Th-2320.71.0
K-400.50.71.0
Ra-226veg1.00.70.51.0
Eveg1.00.70.51.01.0
Disclaimer/Publisher’s Note: The statements, opinions and data contained in all publications are solely those of the individual author(s) and contributor(s) and not of MDPI and/or the editor(s). MDPI and/or the editor(s) disclaim responsibility for any injury to people or property resulting from any ideas, methods, instructions or products referred to in the content.