Article

Automated Testing System for Environmentally Assisted Fatigue Crack Propagation with Compliance-Based Crack Monitoring

1
Department of Mechanical Engineering, Louisiana Tech University, Ruston, LA 71272, USA
2
Department of Civil Engineering and Construction Engineering Technology, Louisiana Tech University, Ruston, LA 71272, USA
*
Author to whom correspondence should be addressed.
Appl. Sci. 2025, 15(18), 10252; https://doi.org/10.3390/app151810252
Submission received: 2 September 2025 / Revised: 14 September 2025 / Accepted: 18 September 2025 / Published: 20 September 2025

Abstract

Featured Application

This work outlines a cost-effective automated testing system for conducting environmentally assisted cracking experiments using tensile specimens.

Abstract

Environmentally assisted cracking (EAC) can be an aggressive degradation mechanism for materials in safety-critical applications across a variety of industries, particularly when combined with cyclic mechanical loading. Corrosion fatigue, a prominent form of EAC, often affects tubular components such as piping, heat exchangers, and boiler tubes in chemical, refining, and power generation industries. This study presents the design and validation of a low-cost, automated test system for evaluating EAC under controlled laboratory conditions. The system integrates electromechanical loading, force measurement, and closed-loop control of temperature and pH. Crack growth is monitored using a compliance-based method calibrated using finite element analysis. Environmental control loops were validated for stability and responsiveness. Performance was demonstrated through tests on carbon steel specimens in acidic chloride solution and polymethylmethacrylate (PMMA) specimens in xylene solvents. The system demonstrated accurate load control, environmental stability, and sensitivity to crack extension. The test system also enabled detection of crack closure behavior in carbon steel specimens resulting from corrosion product buildup during immersion in acidic chloride solution. Additionally, the system effectively distinguished varying impacts of environmental severity in PMMA testing (100% xylene vs. 50% xylene–50% ethanol), confirming its suitability for comparative studies. This test platform enables efficient, repeatable evaluation of EAC fatigue performance across a range of materials and environments.

1. Introduction

Environmentally assisted cracking (EAC) is a widespread and significant degradation mechanism that accelerates material failure when mechanical stress and an aggressive environment act simultaneously [1]. This phenomenon manifests in various forms and has been observed in a wide range of safety-critical applications [2]. One specific subset of EAC for metals is corrosion fatigue, which results from the combined action of repeated mechanical loading and exposure to a corrosive environment [3]. The synergistic nature of fatigue and corrosion results in accelerated initiation and propagation of fatigue cracks. This complex mechanism is a significant contributor to materials degradation in many components subjected to fluctuating stress and aggressive environments, including those found in power boilers, chemical processing facilities, nuclear power plants, as well as offshore and subsea oil and gas systems [4,5,6,7]. Tubular product forms, such as pipes, heat exchangers, and boiler tubes, are particularly susceptible due to their exposure to a wide range of process fluids in combination with internal pressure, thermal gradients, and vibrational loading.
Recent advances in structural health monitoring (SHM) have enabled in situ detection and assessment of cracks in critical infrastructure using smart sensors and machine learning techniques. Deng et al. [8] provided a comprehensive review of modern SHM technologies for bridges, highlighting the integration of sensing and data analytics for damage detection. Other recent studies have demonstrated innovations such as electromechanical impedance-based bolt loosening detection using attention-enhanced parallel convolutional neural networks [9], damage localization in composite-overwrapped pressure vessels using signal-similarity and ultrasonic guided waves [10], and the increasing role of smart sensors in asset management strategies [11]. While these SHM technologies enable continuous condition monitoring and rapid fault detection, controlled laboratory testing remains essential for isolating environmental and mechanical contributions to crack initiation and propagation. Such controlled testing allows mechanistic insight into materials degradation and enables the development and validation of predictive models under aggressive, service-like conditions.
Accurate laboratory assessment of EAC behavior, including corrosion fatigue, requires test systems that can replicate the mechanical and environmental conditions of service while enabling reliable monitoring of crack growth. Traditional fracture mechanics specimens, such as compact tension (CT) or arc-shaped tension (AT) geometries, may not represent the surface condition or form factor of as-manufactured pipe and tube. In contrast, C-ring specimens, as defined in ASTM G38 [12], offer an attractive alternative for testing tubular products. Originally developed for stress corrosion cracking evaluations, C-ring specimens allow for tensile or compressive loading, preserve the as-fabricated surface, and are compatible with compliance-based techniques for estimating crack length.
Recent work by Wheeler et al. [13] demonstrated the development of C-ring geometries for characterizing fatigue crack extension in high-pressure vessels, reinforcing the versatility of this specimen type for structural integrity studies. A key consideration in fatigue crack growth is the phenomenon of crack closure, in which plastic deformation in the wake of a propagating crack causes the crack faces to contact during part of the load cycle. First observed by Elber in 1970, crack closure effectively reduces the portion of the cycle during which the crack is actively propagating by lowering the effective stress intensity factor range [14]. Various mechanisms, such as oxide formation [15], surface roughness [16], phase transformations [17], and the insertion of filler materials like epoxy [18] and metallic deposits [19,20,21], have been studied for their ability to promote crack closure and impede fatigue crack growth. As such, the ability to capture and study crack closure effects is an important feature of any experimental setup aimed at evaluating fatigue behavior under service-like conditions.
While numerous studies have contributed to the understanding of EAC and corrosion fatigue in structural materials, there remains a notable lack of accessible and adaptable experimental systems for studying these phenomena. Existing test setups are often expensive, difficult to replicate, and limited in their ability to integrate multiple environmental controls such as temperature, solvent exposure, or corrosive media. This study addresses this limitation by introducing a cost-effective and fully automated testing system capable of simulating EAC behavior under service-like conditions, including the application of static and/or cyclic mechanical loads during environmental exposure. The primary objective is to validate the system’s ability to detect and quantify fatigue crack propagation in both metallic and polymeric materials exposed to aggressive environments. The unique contribution of this work lies in its cost-effective, modular design; compliance-based crack monitoring; and programmable environmental control, offering a practical and versatile platform for mechanistic investigation and material performance assessment.
The system includes integrated data acquisition and environmental control functions, enabling long-duration testing under user-defined temperature and pH conditions. For metallic materials, dissolved oxygen (DO) content also strongly affects corrosion behavior, influencing both passive film formation and corrosion rate [22]. While plastics are not generally subject to electrochemical corrosion, DO can still contribute to oxidative degradation or accelerate environmentally induced cracking under certain conditions [23]. In this study, air was continuously bubbled into the solution prior to and during testing to maintain a saturated DO level, ensuring consistency across samples. Future enhancements of the testing system will include precision control of DO content to enable systematic investigation of its influence. A strain gage load cell and standard bridge circuit were used for load signal measurement, while closed-loop control algorithms maintain consistent thermal and chemical exposure throughout testing.
To monitor crack propagation, a compliance-based method was developed that correlates load drop to crack length. This approach was calibrated using finite element analysis (FEA) and validated experimentally. System validation was conducted using polymethylmethacrylate (PMMA) in a xylene (dimethylbenzene) environment and SA-210-A1 carbon steel immersed in a mildly acidic chloride solution (0.1 M HCl + 0.5 M NaCl). These environments were selected to induce accelerated crack growth representative of environmental degradation mechanisms relevant to polymer and metallic tubing, respectively. Test samples were subjected to sinusoidal cyclic loading, with frequency controlled by a pulse-width modulation (PWM) motor speed controller. The testing system demonstrated sufficient sensitivity, repeatability, and control stability to support environmentally assisted fatigue evaluations across a range of materials and service conditions. The test system was effective in monitoring crack arrest as observed in the steel samples, which was attributed to the formation of corrosion products during the pre-soaking period. Furthermore, the test system enabled the observation that the duration of pre-soaking appeared to influence the load drop response during cycling. In addition, the system successfully distinguished environmental severity in PMMA testing between 100% xylene and a 50% xylene-50% ethanol mixture, and in humid laboratory air, confirming its suitability for comparative studies involving varied environmental exposures.

2. Materials and Methods

2.1. Sample Preparation

Two materials with substantially different properties were selected for study in the EAC fatigue test system. The first was ASME SA210-A1 carbon steel boiler tube, which has exhibited a long-standing corrosion fatigue problem in power boiler applications [24]. The second material was cast polymethylmethacrylate (PMMA) tube (McMaster-Carr, 8486K555, Elmhurst, IL, USA) per ASTM D5436 [25], a very commonly used transparent polymer in aerospace, automobile, and transplant applications [26]. The chemical composition of SA-210-A1 carbon steel is provided in Table 1. The mechanical properties of PMMA and SA-210-A1 carbon steel are provided in Table 2.
The C-ring geometry used for all test samples is provided in Figure 1. The outside diameter (D) was 76.2 mm, inside diameter (d) was 63.5 mm, the hole diameter (C) was 9.53 mm, and the width (B) was 19.1 mm. A starter notch with a depth of 1.53 mm was machined into the SA-210-A1 carbon steel specimens to promote controlled crack initiation. The presence of the notch induced a localized stress concentration, thereby increasing the effective stress during cyclic loading. The starter notch was produced in accordance with the requirements of ASTM E399 [27]. PMMA specimens did not require a starter notch, as crack initiation readily occurred in the presence of xylene solvent. Six samples of each material were prepared according to ASTM Standard G38 [12].

2.2. Test Environments and Exposure

Test environments were selected to promote accelerated environmental degradation under cyclic loading conditions. Carbon steel specimens (SA-210-A1) were immersed in a dilute acidic chloride solution consisting of 0.1 M hydrochloric acid (HCl, ACS reagent grade, Honeywell FlukaTM, Steinheim, Germany) and 0.5 M sodium chloride (NaCl, ACS reagent grade, Fisher BioReagentsTM, Thermo Fisher Scientific, Waltham, MA, USA). Prior to initiating cyclic loading, all five carbon steel specimens were pre-exposed to the test solution for a minimum of 10 h. This pre-soaking step facilitated surface etching at the crack tip region, aiding in the post-test identification of the initial (pre-crack) crack length through fractographic analysis.
PMMA specimens were exposed to xylene (Kean Strip Xylol Xylene, W.M. Barr Company, Memphis, TN, USA) to induce rapid environmental degradation during cyclic fatigue testing. Unlike the carbon steel specimens, PMMA samples were not pre-soaked. Environmental exposure and cyclic loading were initiated simultaneously.

2.3. Test System and Instrumentation

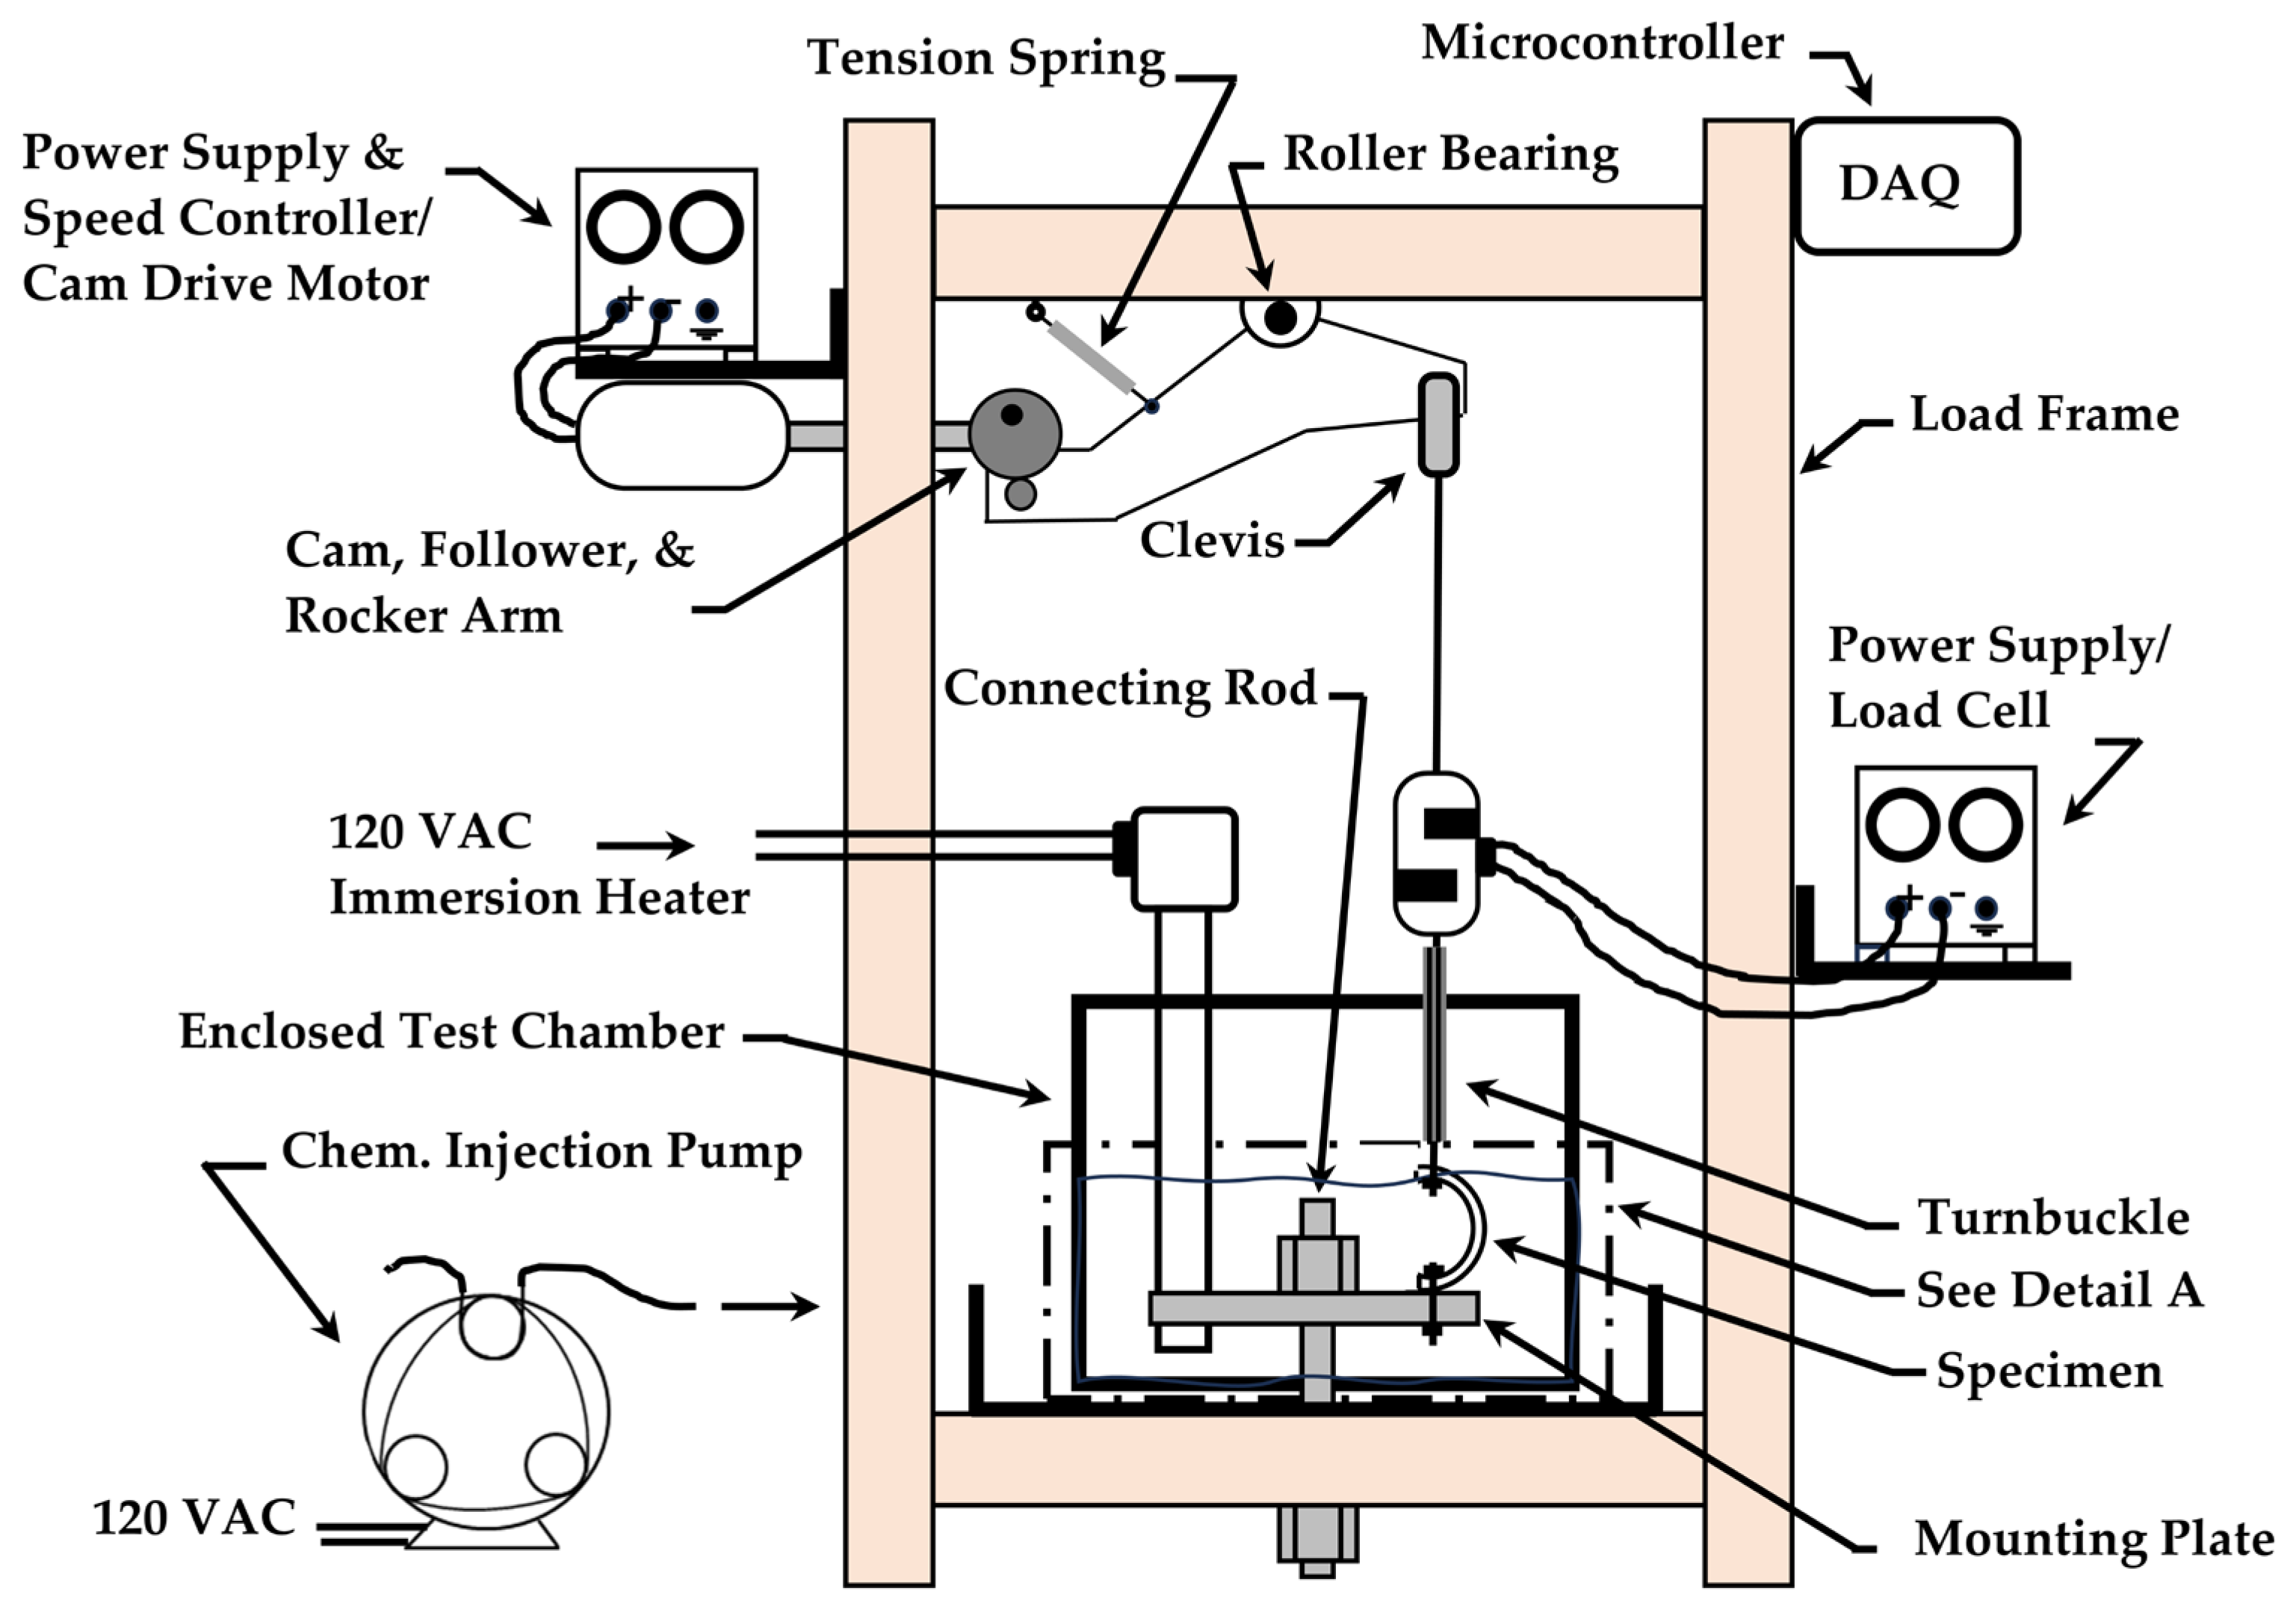
A custom designed EAC testing system was developed to enable controlled evaluation of specimens under cyclic loading and manipulated environmental conditions. A simplified schematic of the testing system is shown in Figure 2 with additional detail of the test chamber interior provided in Figure 3. The system integrates mechanical loading, environmental exposure, and real-time data acquisition in a compact and adaptable platform. C-ring specimens are mounted in an environmental chamber containing a fixture that applies cyclic displacement using a motor-driven actuator through a cam and rocker arm assembly. A turnbuckle was adjusted to set the initial load value prior to engaging the cyclic load drive motor. The applied load was measured using a strain-gauge-based load cell with signal amplification and logging performed via a high-resolution data acquisition unit (U6, LabJack Corporation, Lakewood, CO, USA).
Environmental conditions are regulated using feedback control loops for temperature and pH, which are maintained at user-defined setpoints via a graphical user interface. Load cycling may be engaged or disengaged by the user to vary the balance between mechanical and environmental influences. A motor speed controller enabled high-resolution control of cyclic loading frequency, while an independent digital counter (Digiten, Shenzhen Huimai Technology, Co., Shenzhen, China) with LCD display tracked cycle count using a proximity switch. This test setup allows continuous monitoring of load drop over time at a constant displacement, which is used in combination with a compliance calibration to estimate crack length during testing.
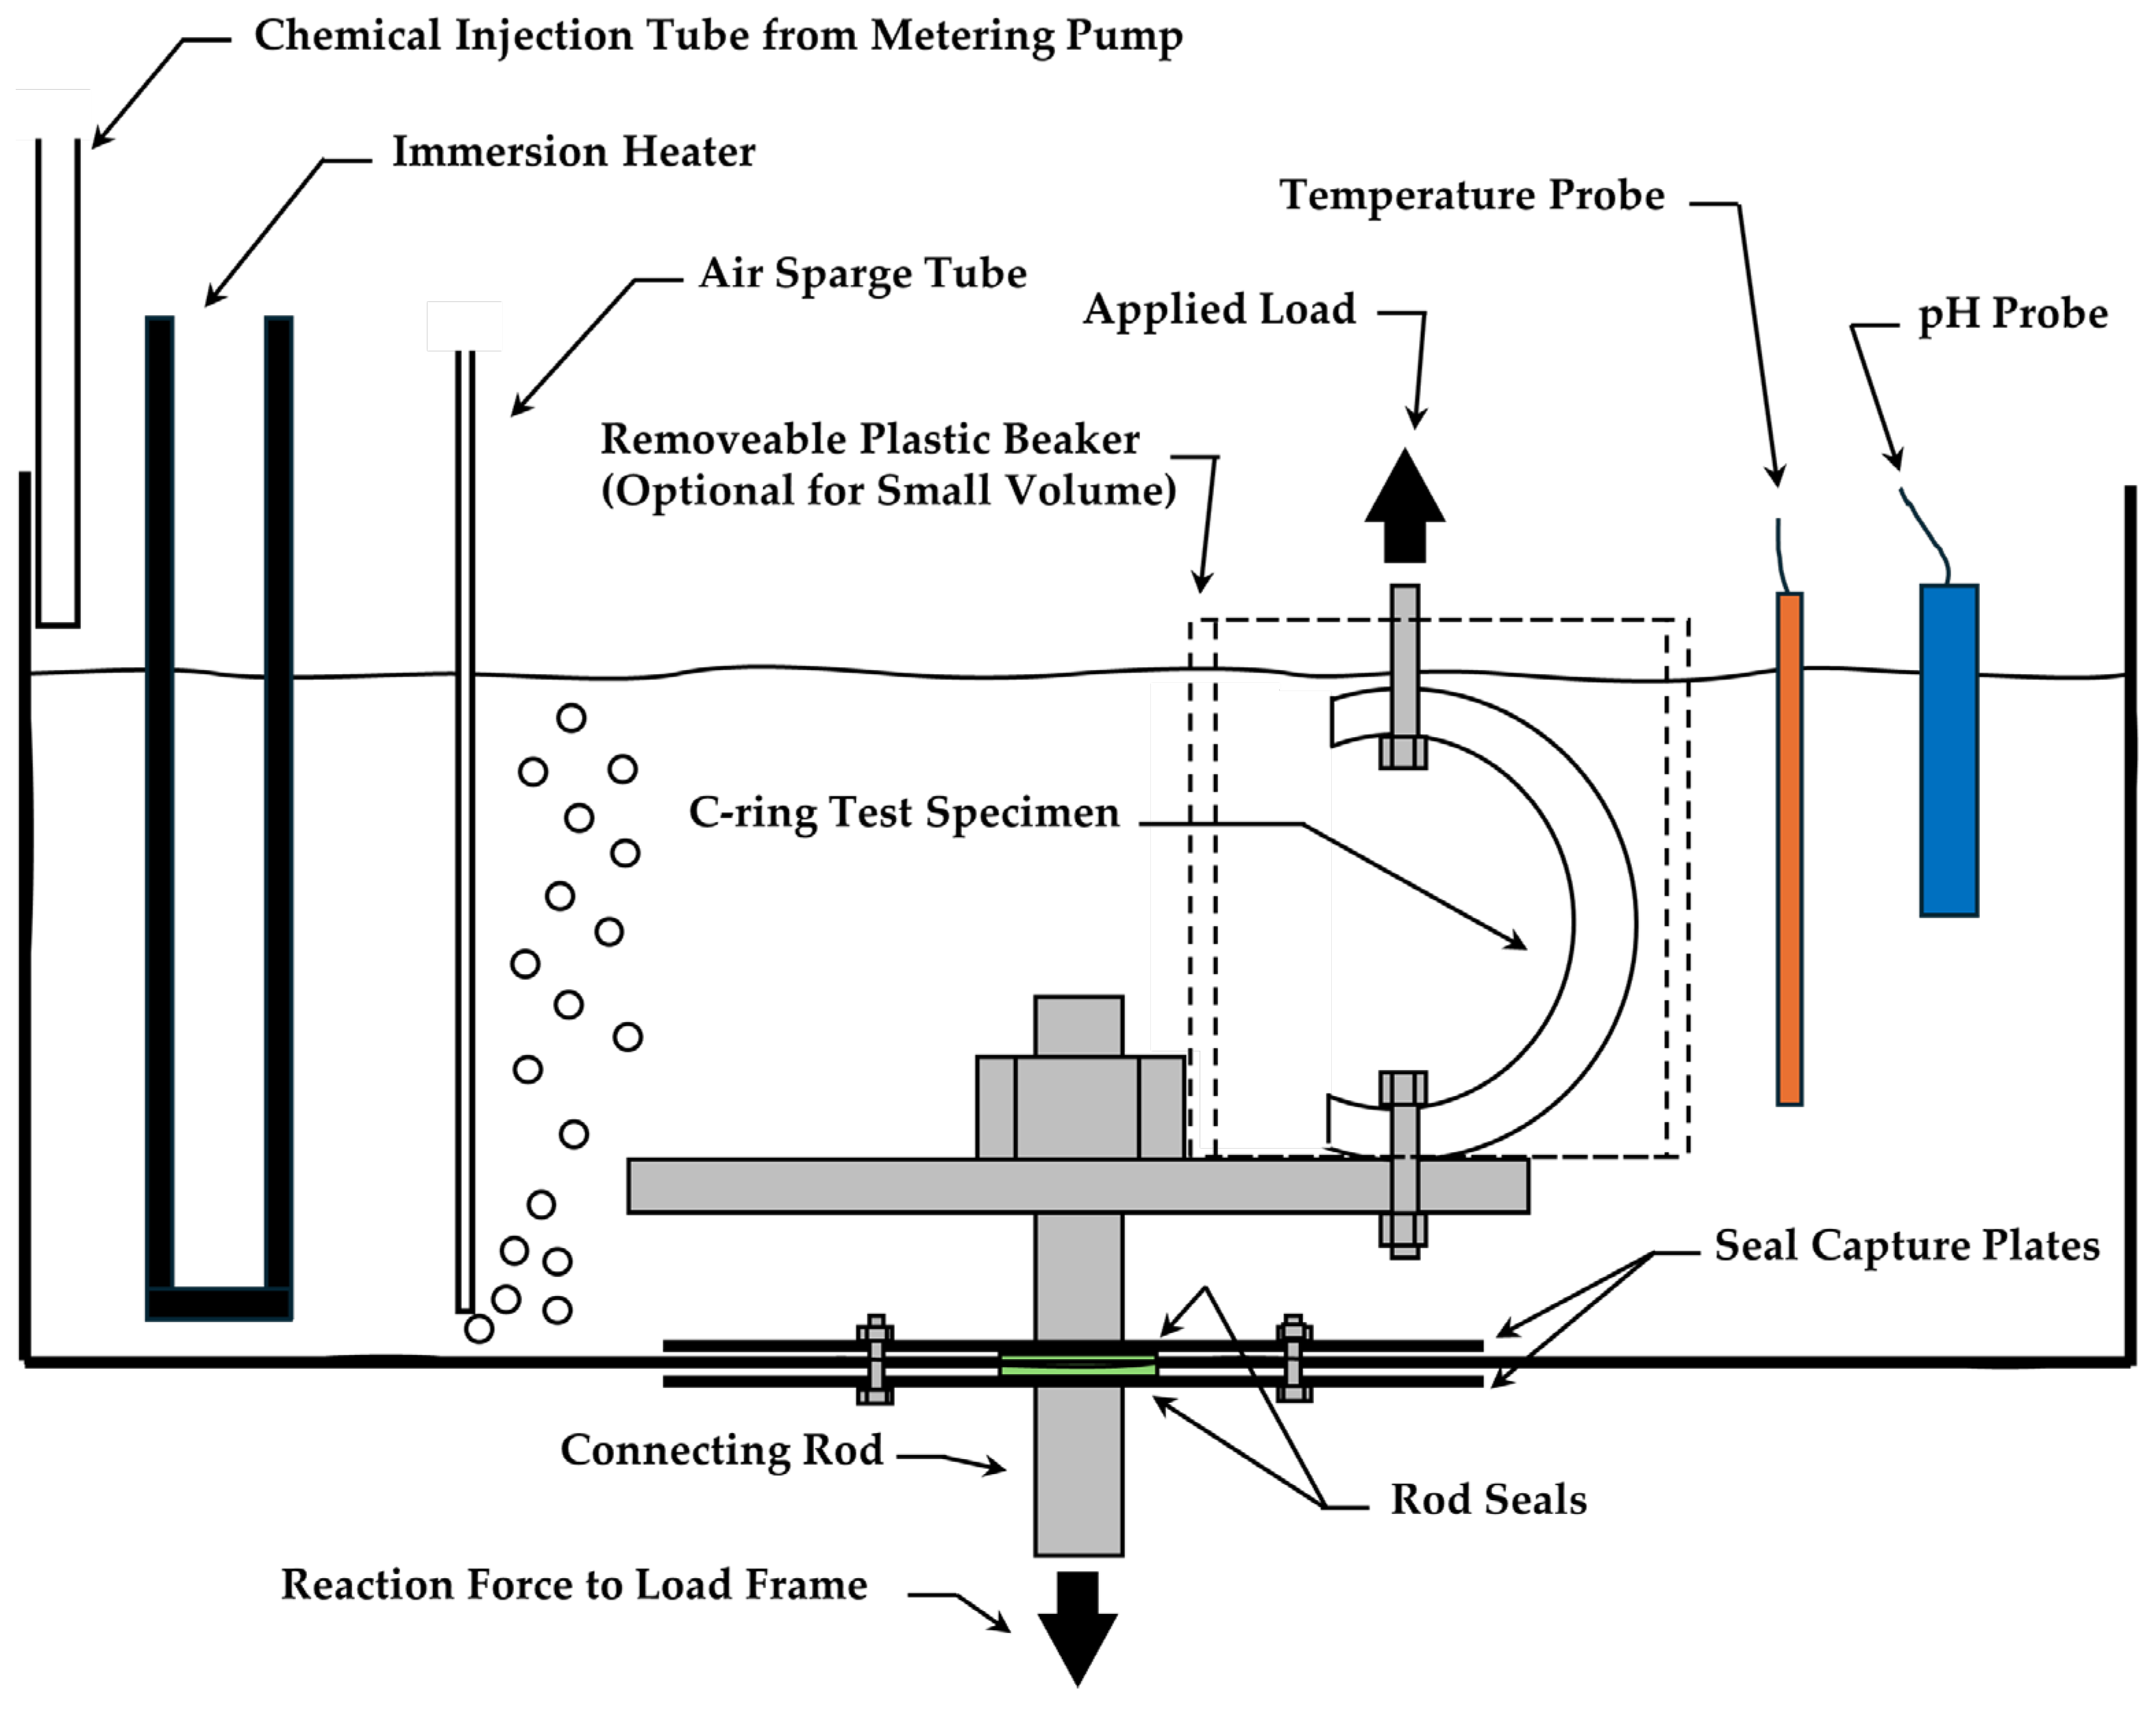
The overall height and width of the load frame was 1015 mm and 660 mm, respectively. The enclosed environmental test chamber was constructed of PMMA sheet. The dimensions of the environmental chamber were 30.5 cm × 30.5 cm × 30.5 cm. A 38.1 mm steel connecting rod was used to anchor the test chamber to the load frame. Polyurethane rod seals were used to prevent fluid leakage around the steel connecting rod used to anchor the chamber to the load frame (Figure 2 and Figure 3). Rod seals were fixed in place between mechanically fastened PMMA rod seal capture plates (See Figure 3). Four 0.25–20 UNC bolts, nuts, and washers were used to fix the capture plates and rod seals as shown in Figure 3. A 152.4 mm × 101.6 mm × 9.5 mm thick carbon steel plate, retained to the connecting rod via hex nut, was used for mounting C-ring specimens with up to 9.5 mm diameter bolting. The mounting plate contained a slotted sample mounting hole of 38 mm length for alignment of the sample. A removable 400 mL polytetrafluoroethylene (PTFE) beaker was provided for conducting EAC fatigue crack growth testing using reduced solution volumes (Figure 3).
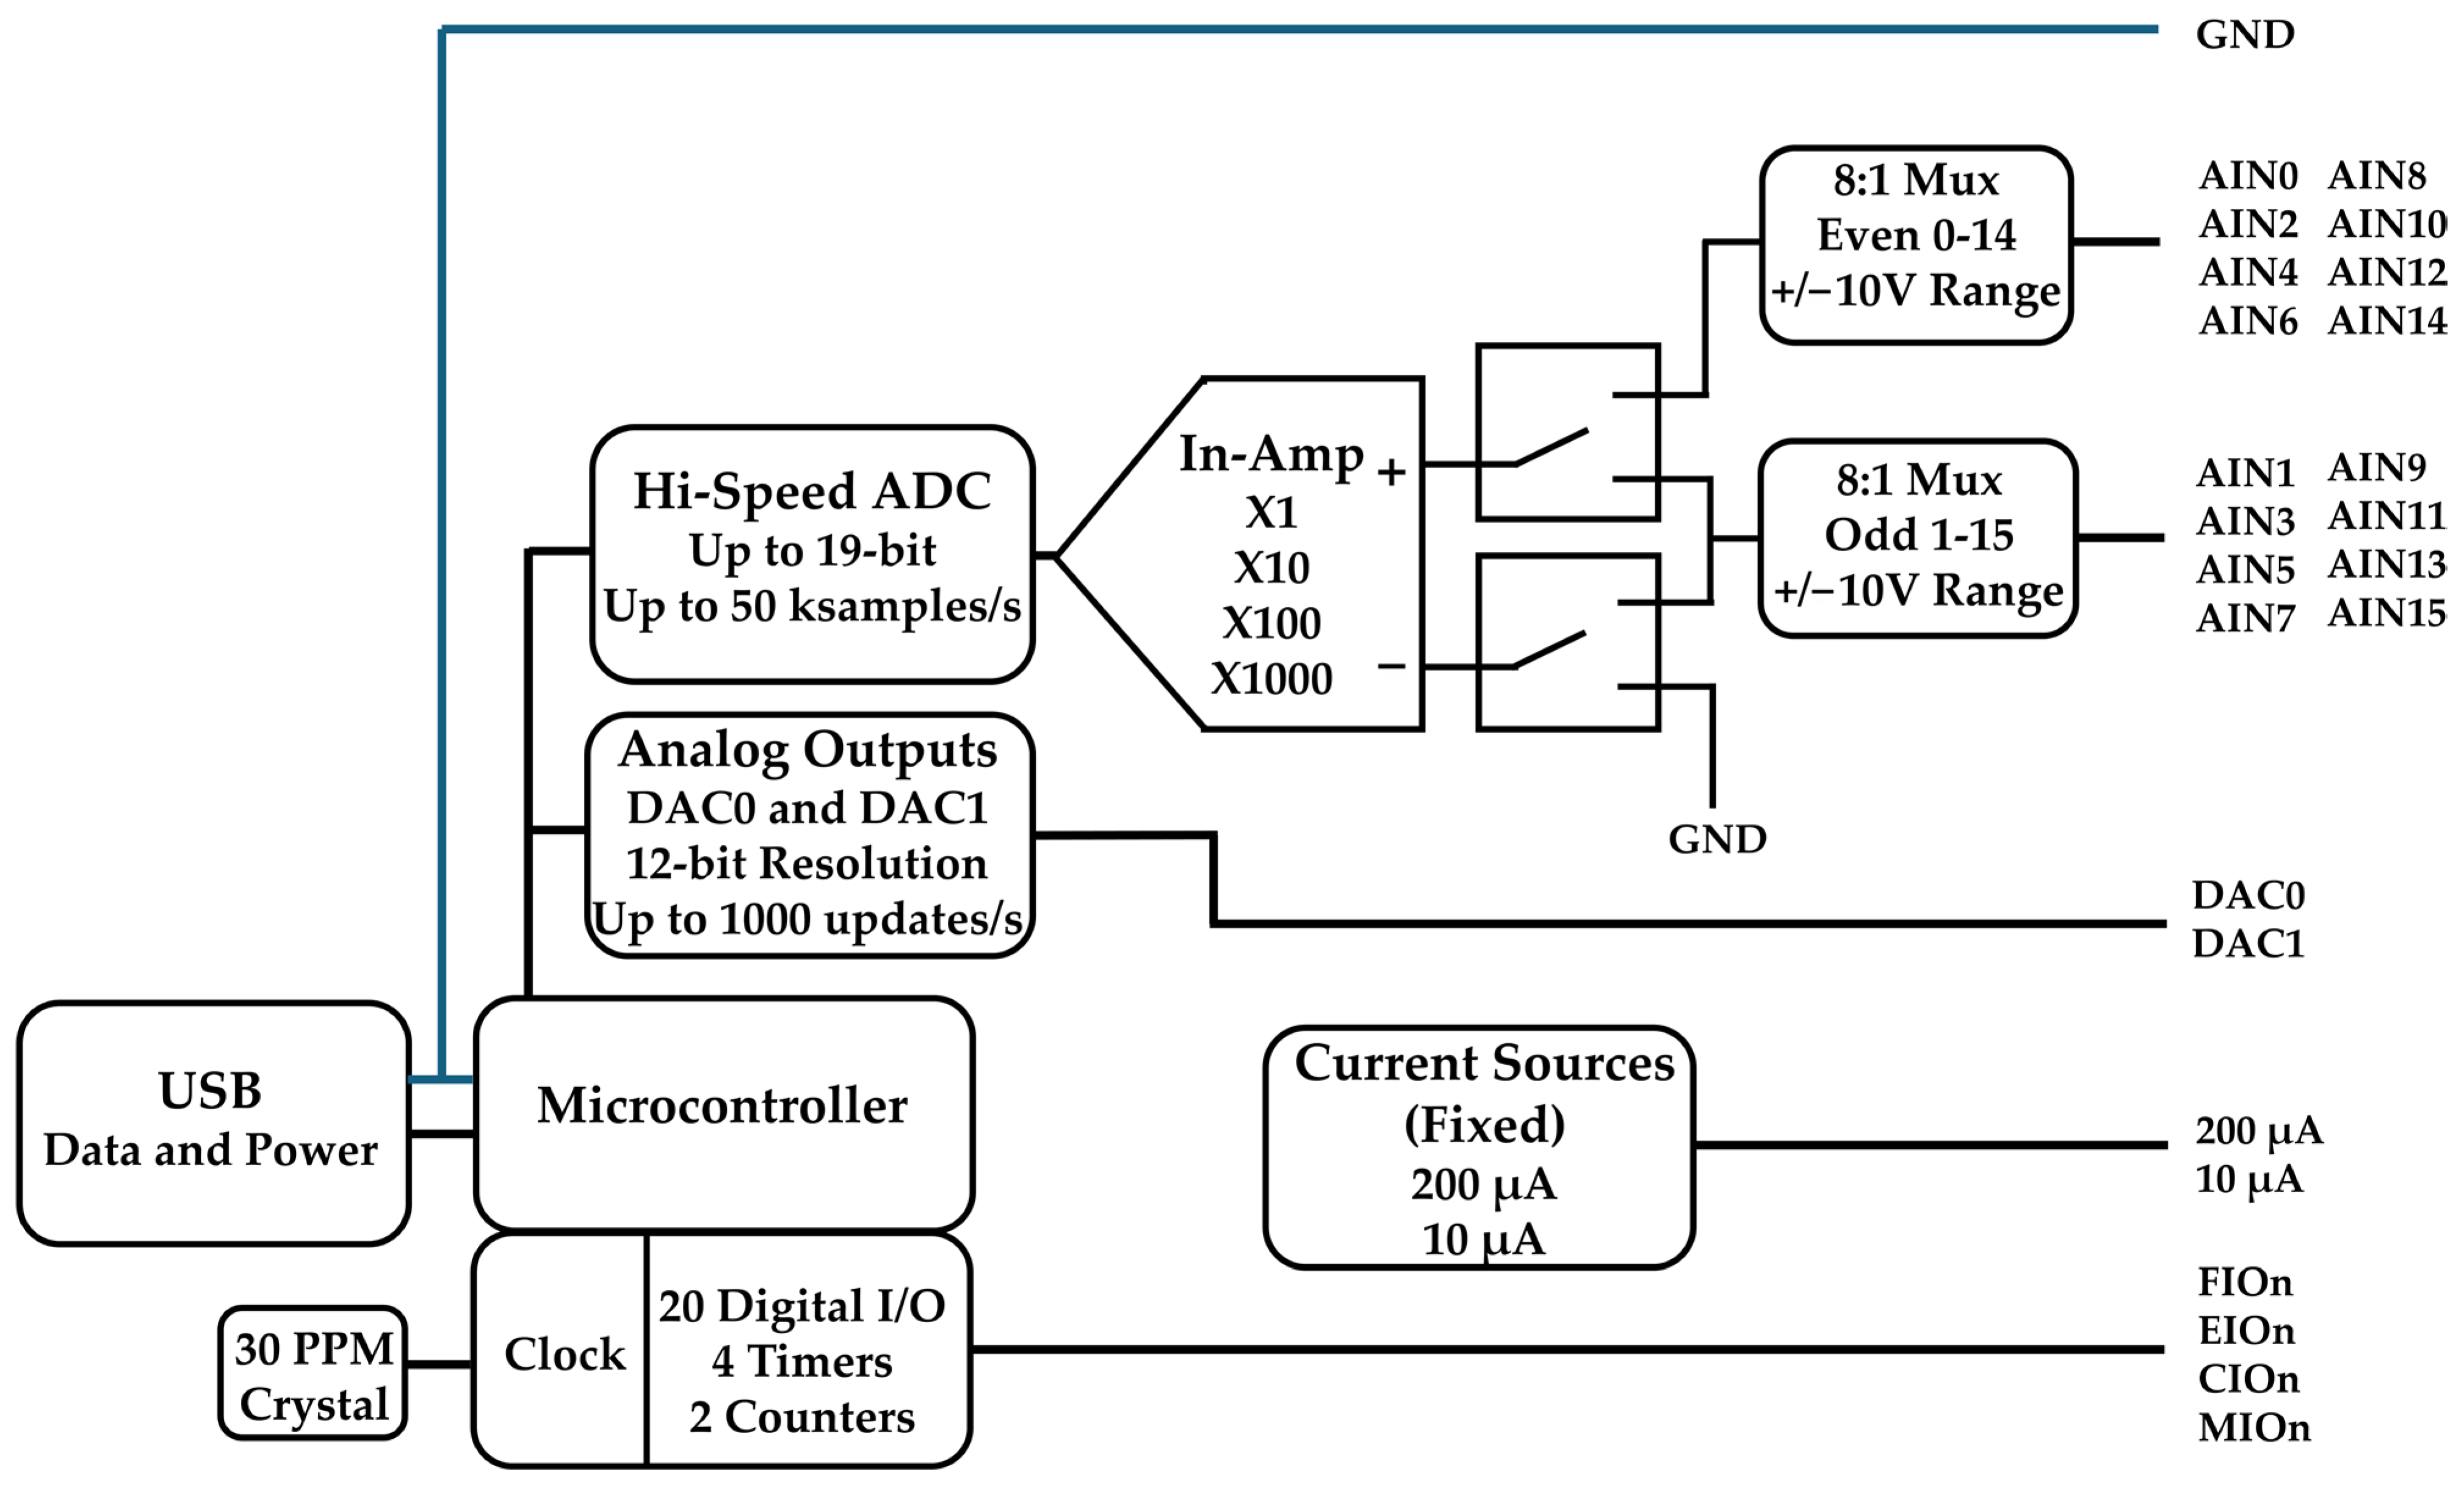
A commercially available LabJack U6 precision data acquisition (DAQ) unit (LabJack Corporation, Lakewood, CO, USA) was used for measurement and control of system variables including the applied load, temperature, and pH. A block diagram of the LabJack U6 DAQ is shown in Figure 4. Communication between the DAQ and a Windows laptop computer was established using a full-speed USB 2.0 connection, which provided both data communications and power to the unit. A CB37 terminal board (LabJack Corporation, Lakewood, CO, USA) was used to give full access to the 14 (16-bit) analog inputs (AIN), 2 analog outputs identified on the terminals as digital-to-analog converters (DAC), and 8 of the 20 digital I/O channels available from the U6 model. An LJTick-DigitalOut5V conditioning module (LabJack Corporation, Lakewood, CO, USA) was used to convert the DAQ’s standard 3.3V digital output to 5V for reliable control signaling of solid-state relays (SSRs, are detailed down below). The digital signal converter (DSC) was used to convert two digital outputs for on/off switching of the immersion heater and the load cycle drive motor. Table 3 shows the full pinout from the DAQ with the CB37 terminal board. An input/output (I/O) list for the EAC fatigue testing system is provided in Table 4.
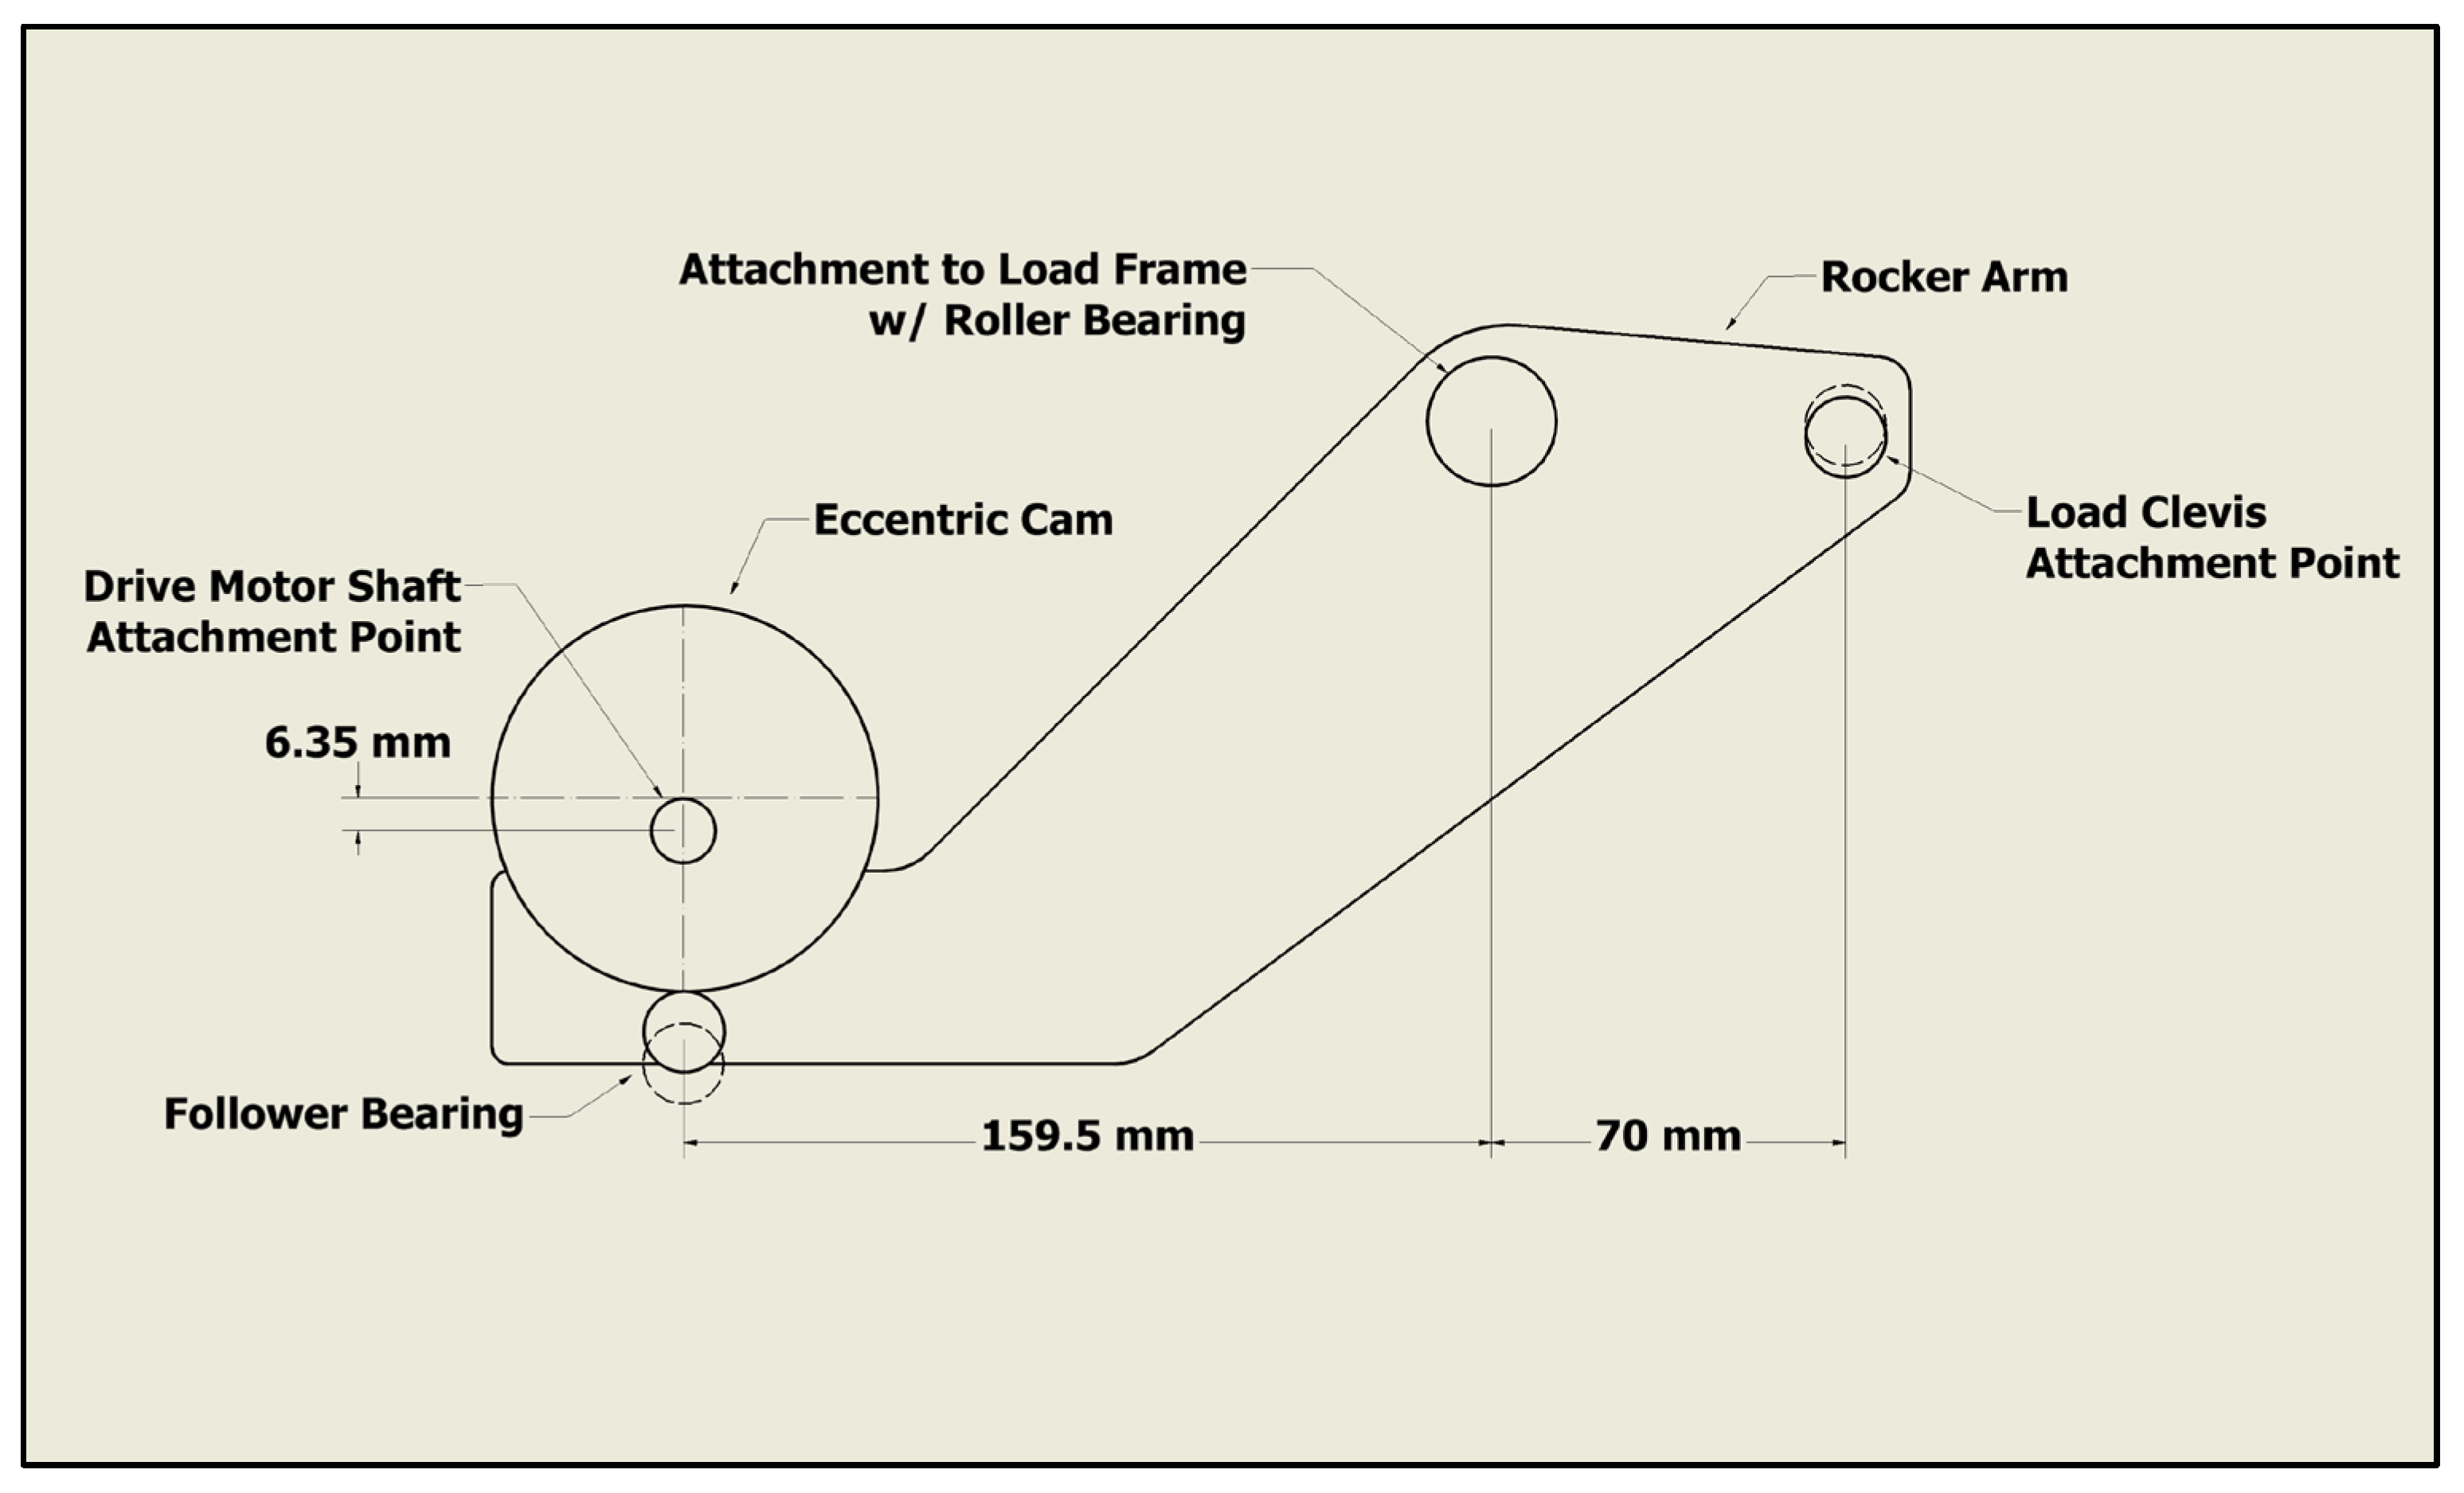
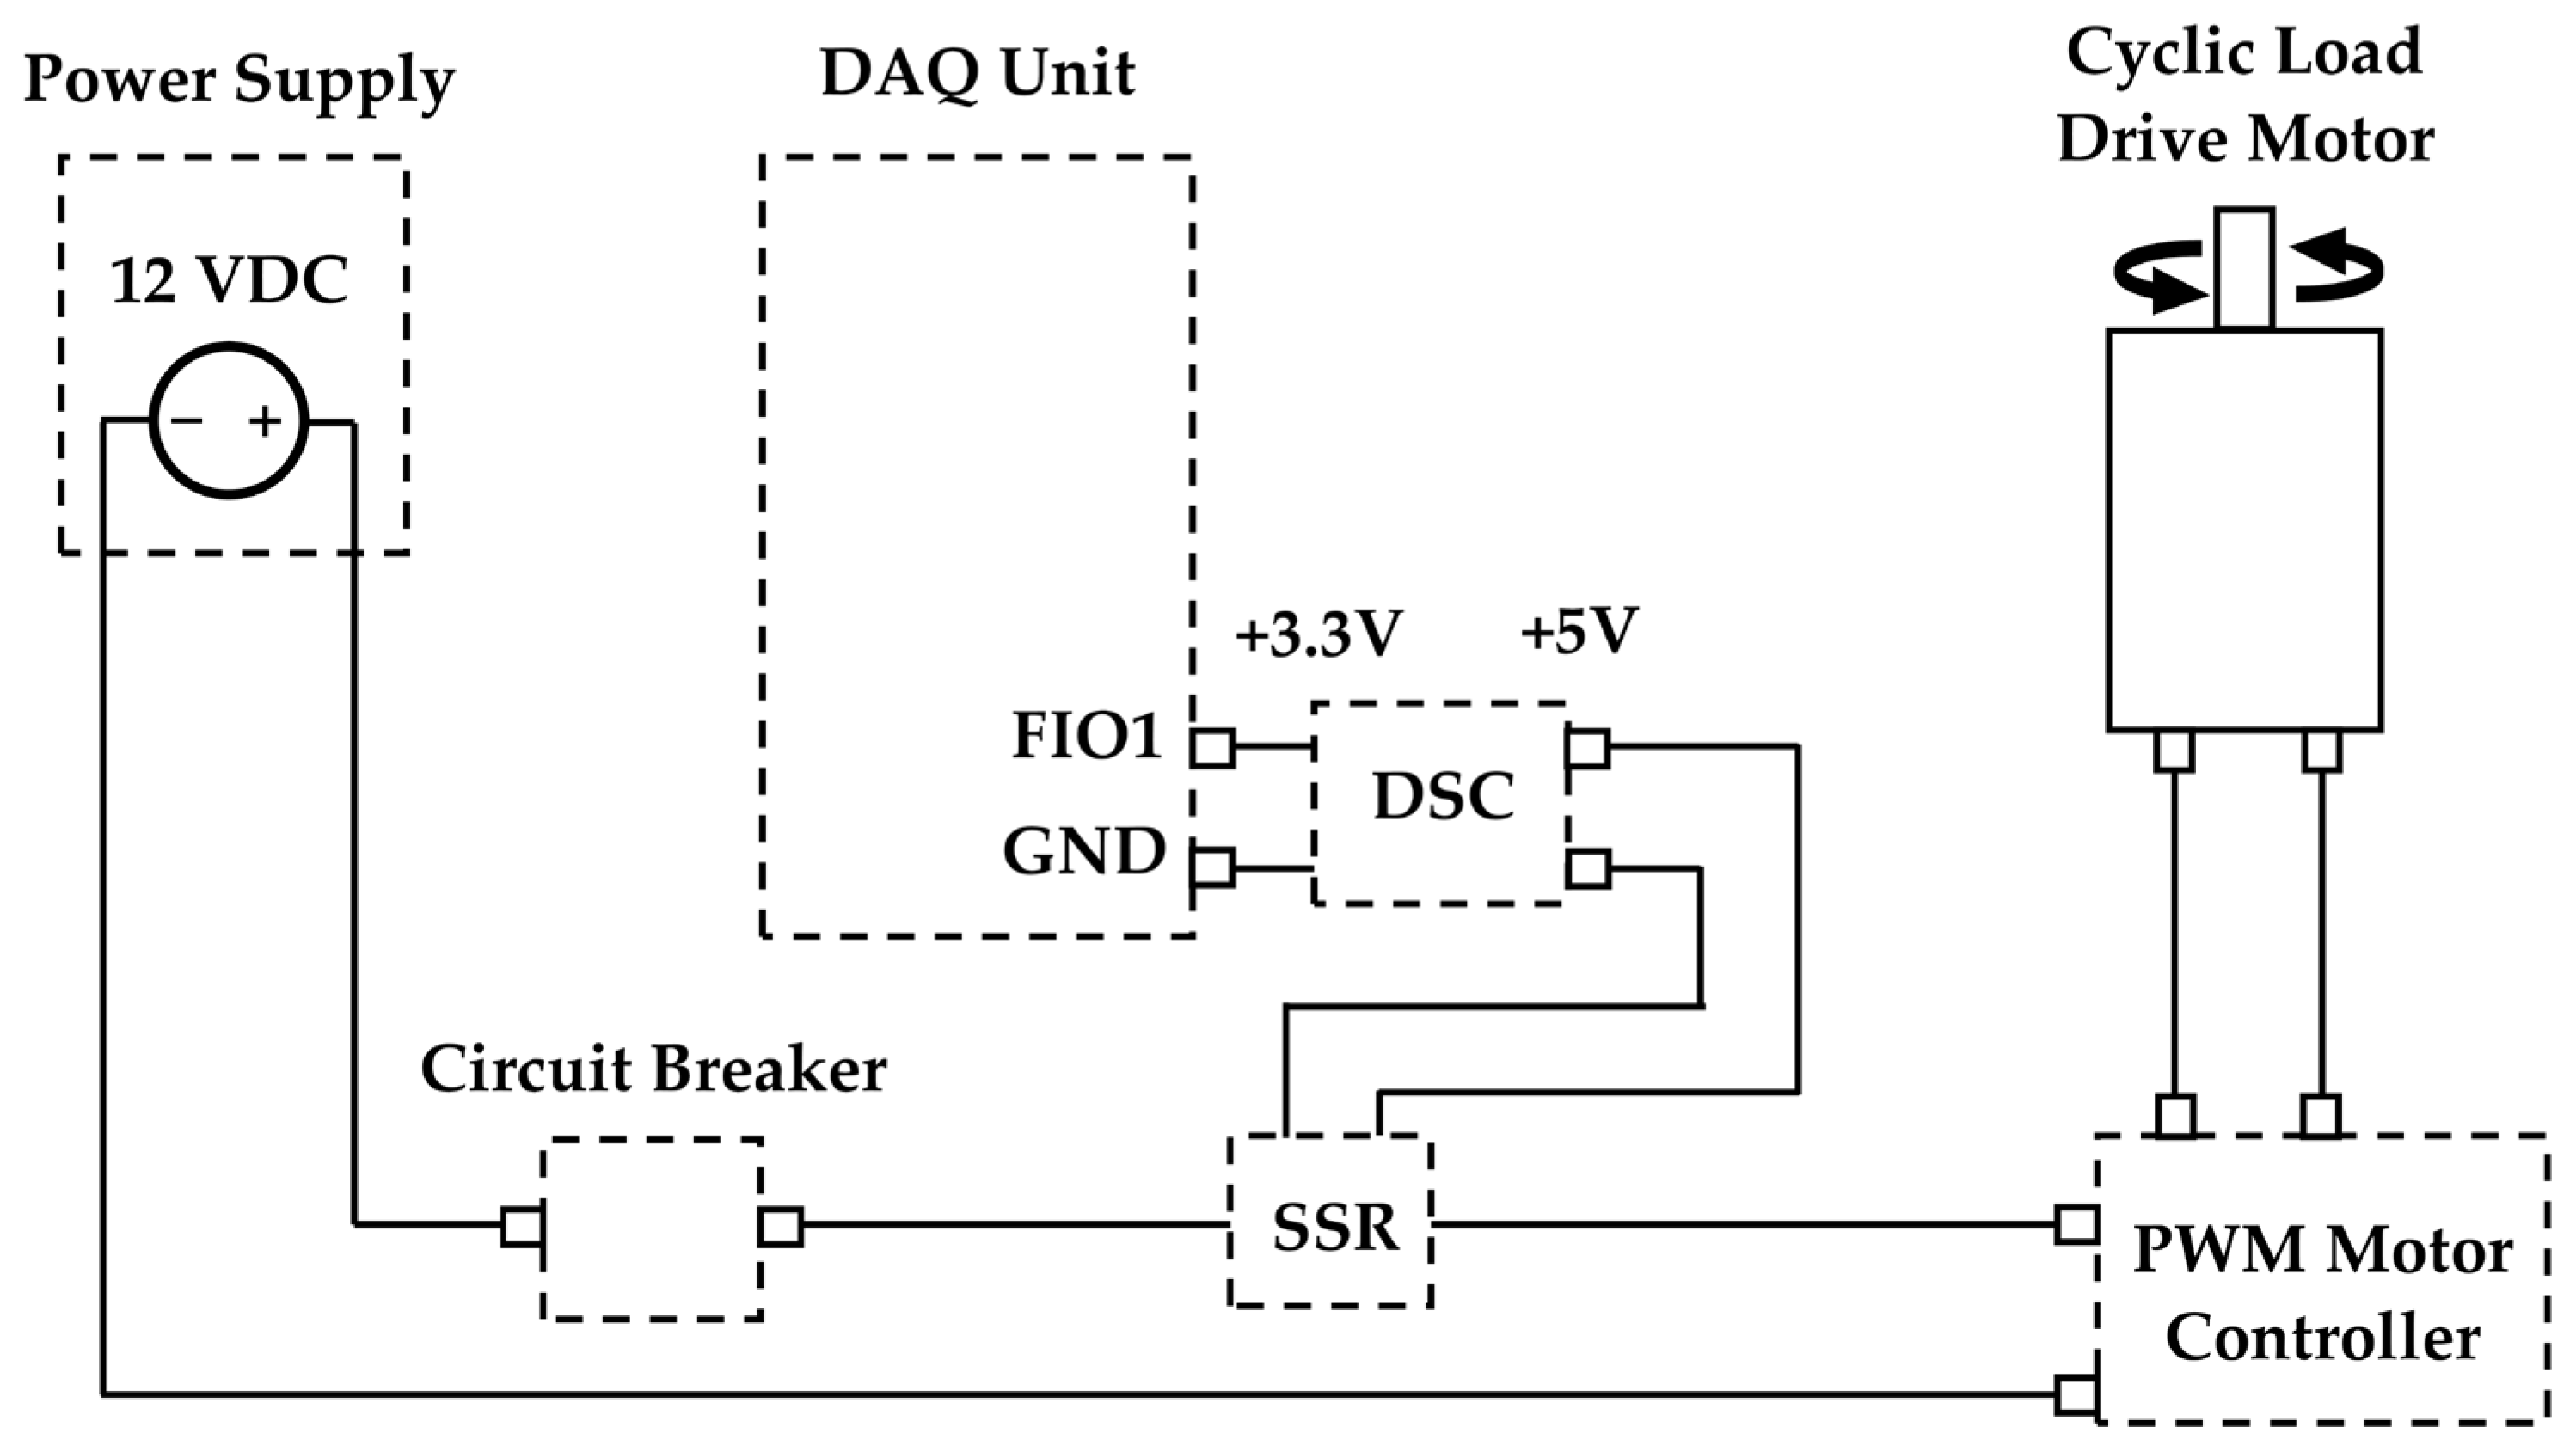
A 0.25–20 UNC turnbuckle was used for manual adjustment of the load to the C-ring specimen. At 20 threads per inch, the linear travel of one full rotation of a single side of the turnbuckle produced 12.7 mm displacement of the C-ring. The turnbuckle was adjusted by hand until the desired initial load was obtained. An E30-150-12-G4 Ampflow gearmotor with 4:1 reduction (Powerhouse Engineering, Inc., Belmont, CA, USA) was used to cycle application of the load through an eccentric cam, cam follower roller bearing (CF6/KR16, UXCell, Hong Kong, China), and rocker arm assembly as can be seen in Figure 5. The eccentric cam and rocker arm were manufactured from 6.35 mm thick carbon steel plate using a water jet cutter. The roller bearing follower was a Uxcell CF6 needle roller bearing with a 16 mm roller diameter, 11 mm roller width, and an M6 standard stud. Steel pillow block mounted roller bearings (UCP205-16, Sackorange, purchased from Amazon, USA) with 25.4 mm bore were used to minimize frictional resistance of the rocker arm assembly during load cycling. The electric motor was powered by a 12 VDC, 50 A power supply with 110/220 VAC input switching capability (Dongguan Sifulai Trading Co., Guangdong, China). Motor speed, and thus load cycle frequency, was controlled using a 40 A pulse-width modulation (PWM) motor controller equipped with a rocker switch for direction control (LiebeWH, Shenzhen, China). Circuit overload protection was provided by a 50 A, 12–48 VDC circuit breaker with a manual reset button (EPLZON, China, purchased from Amazon, USA). A GTX-1 DD220D40 solid-state relay (GTHRUCS, China, purchased from Amazon, USA) was used to enable software-based on/off control of the cyclic load drive motor via digital output channel FIO1 from the DAQ (See Table 4). A simplified diagram of the motor control circuit is provided in Figure 6. The cyclic load drive motor shaft was also supported by a steel pillow block mounted roller bearing (UCP201-8, Sackorange, China), featuring a 12.7 mm bore and mounted on a 6.35 mm thick steel mounting plate (See Figure 2). Initial preload on the specimen was established by manually adjusting the turnbuckle while the cam was positioned at the maximum displacement point (high side) of the load cycle. As shown in Figure 5, the rocker arm provided mechanical advantage by amplifying the load transmitted to the specimen while proportionally reducing the applied displacement. This mechanism enabled a displacement-controlled sinusoidal cyclic fatigue load to be applied to the test specimen. Alternatively, other cyclic loading profiles can be achieved by using interchangeable cam profiles to modify the load ramp characteristics.
Measurement of the applied load was accomplished using an S-type beam load cell with a 100 kg load rating and a 2.0 mV/V sensitivity (PSD-S1, Walfront, Wuhan City, China). Excitation voltage to the bridge circuit was provided by an adjustable 0–30 VDC, 0–3 amp benchtop power supply (BK Precision, Yorba Linda, CA, USA). Feedback of the excitation voltage to the AIN1 channel on the DAQ recorded actual values in real time for use in the following signal-to-load scaling calculation:
P = E o E e x c × S × L C R ,
where P is the applied load in kg, Eo is the output voltage signal from the bridge in mV, Eexc is the excitation voltage across the bridge, S is the load cell sensitivity in mV/V, and LCR is the load cell rating in kg. The selected U6 model DAQ provided built-in amplification for the measurement of small differential bridge signals. Bridge circuit differential channel AIN2-AIN3 was used to obtain the voltage signal (Eo) from the load cell. A single 4-wire shielded load cell cable including +/− excitation and +/− signal conductors was used. A simplified wiring diagram of the load cell measurement is provided in Figure 7.
An EI1034 temperature probe (LabJack Corporation, Lakewood, CO, USA) was used to sense solution temperature inside of the test chamber. The probe consisted of a silicon type integrated-circuit sensor model LM34CAZ (Texas Instruments, Dallas, TX, USA) mounted inside of a 316 stainless steel tube. The solution temperature was measured using the AIN0 channel of the DAQ (See Table 4). Wiring of the temperature control loop is shown in Figure 8.
The test chamber fluid was heated to the desired temperature using a 1300 W, 120 VAC immersion heater with integral float switch for automatic low-level shutoff (KD Heater Company, Ltd., Yangsju-si, Republic of Korea). Simple two-position (on/off) control of the heater was accomplished using a Kyotto KD20C40AX solid-state relay (SSR) (Kytech Electronics, Ltd., Pingzhen City, Taiwan) with the control signal provided by a digital output (FIO0) from the DAQ. The temperature of the test chamber solution (AIN0) was used to set the state of the digital output to the heater (FIO0). The heater was energized if the solution temperature dropped below the user-defined set point. Likewise, the heater was deenergized when the solution temperature was equal to or exceeded the set point.
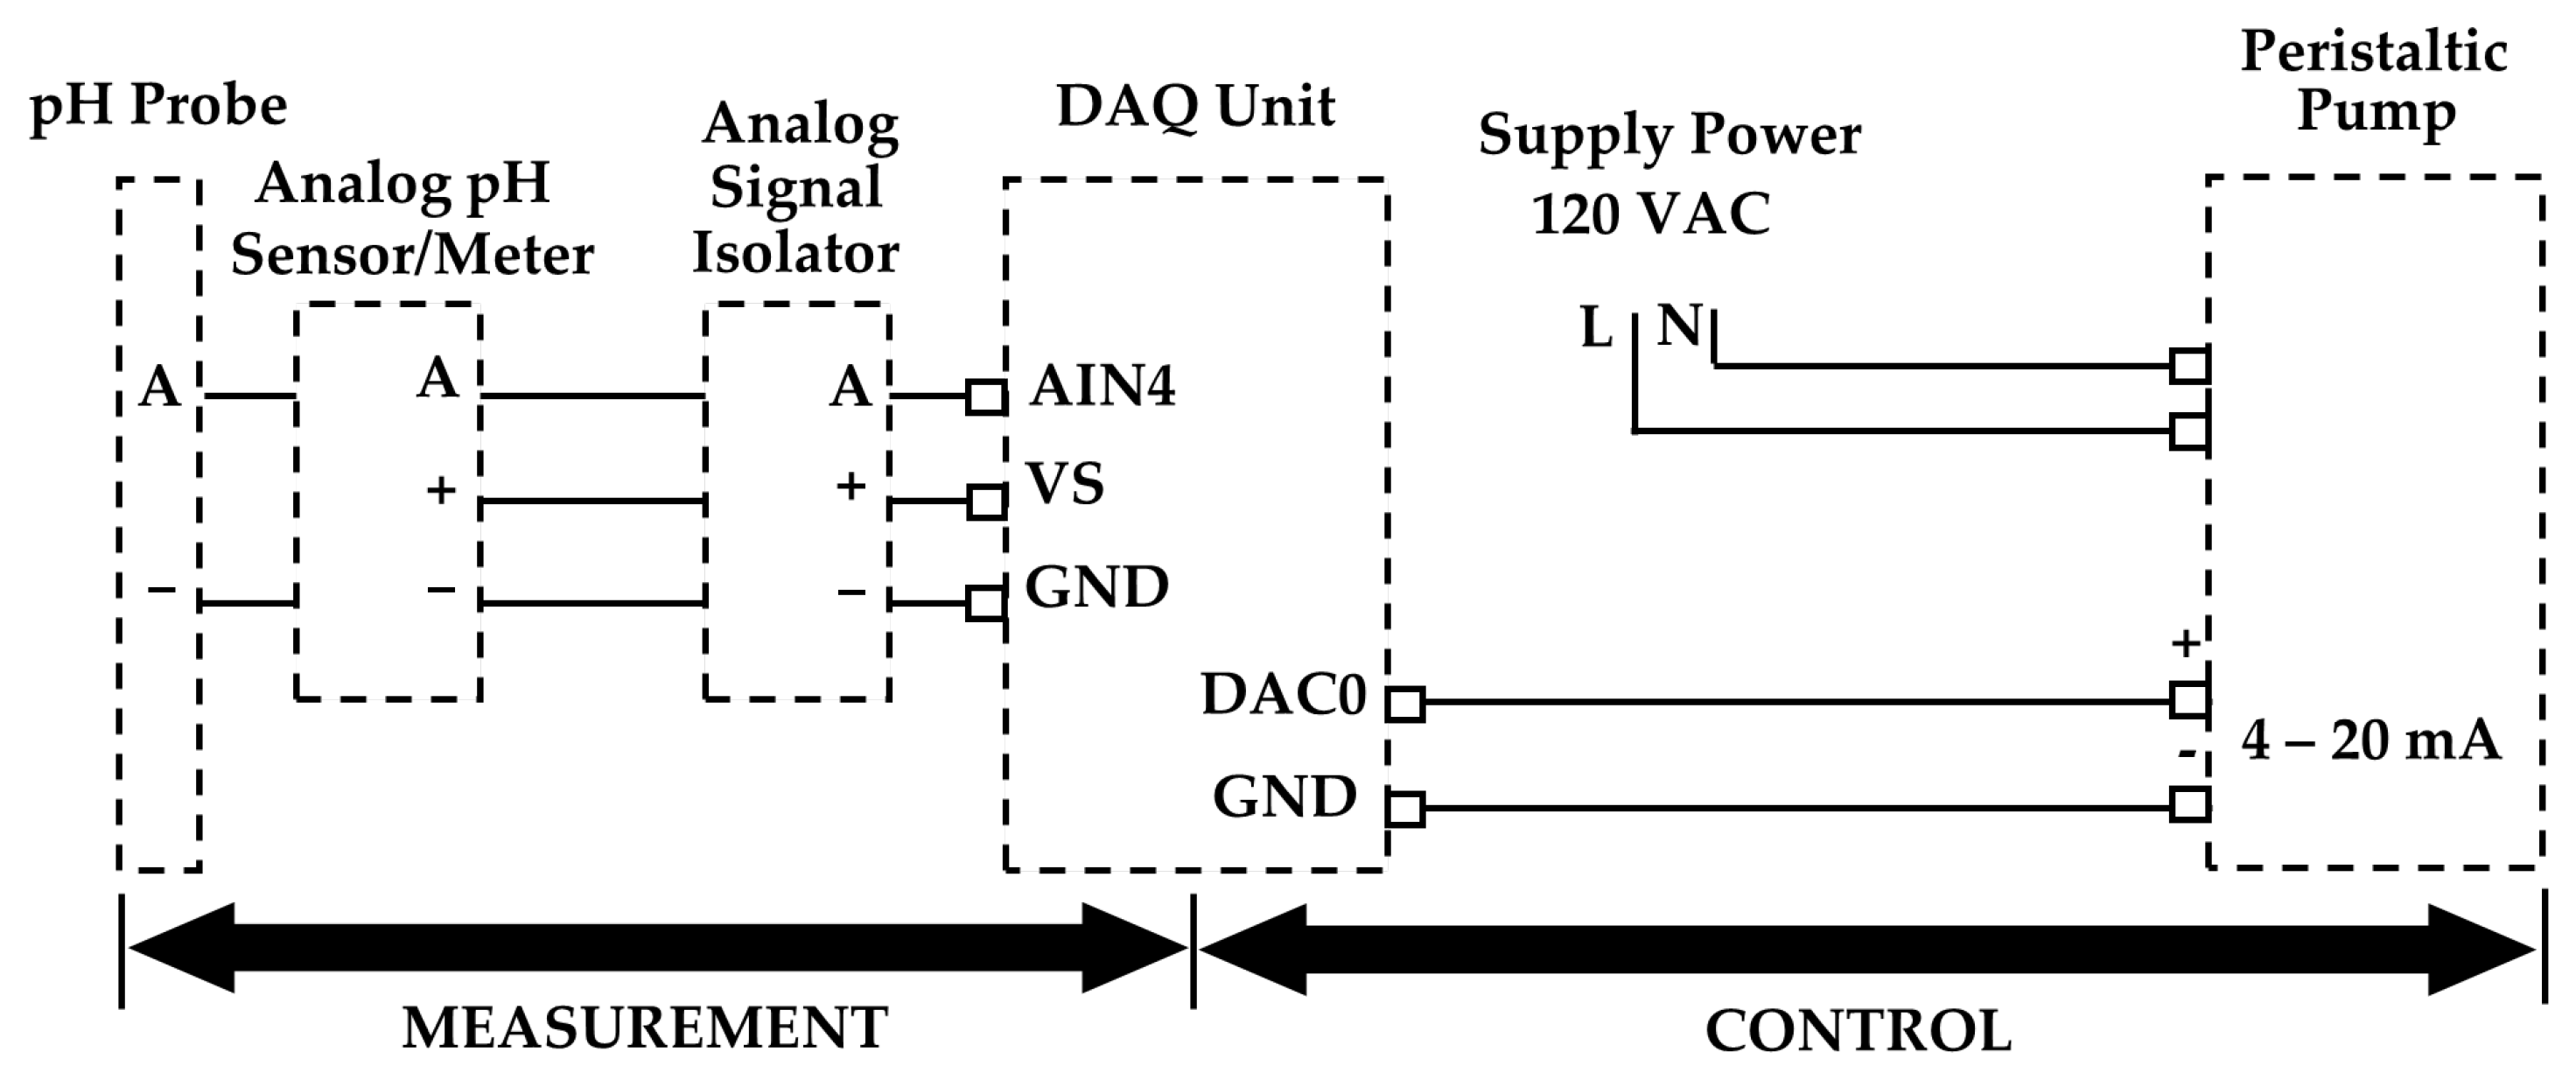
Solution pH was measured using a single junction Ag/AgCl pH probe containing KCl reference solution and a GravityTM analog pH sensor. A GravityTM analog isolator circuit (Atlas Scientific, Long Island City, NY, USA) was used to eliminate electrical interference from other devices. The GravityTM analog pH sensor and isolator circuitry were provided on independent printed circuit boards (PCB) that were interconnected through three male/female pin headers. The pH probe was connected to the analog pH sensor/meter PCB via Subminiature Version A (SMA) connector. A simplified wiring diagram of the pH control loop is provided in Figure 9.
A hybrid digital/analog control loop with on/off control logic was used for control of solution pH to a user specified setpoint. The analog output value can be set between 4 mA and 20 mA by the user to control the volume of reagent dispensed by the metering pump when an injection command is given. This feature allows the pH control loop to be tuned to conveniently accommodate varying solution volumes in the test chamber.
The presence of dissolved oxygen in aqueous environments is known to have a significant effect on the corrosion behavior of materials [1,29,30]. As such, air was continually sparged prior to and during testing to provide a consistently saturated dissolved oxygen (DO) content for evaluation of the test system. Future expansion of the test system will incorporate a solenoid valve operated N2 sparge system and ppb (parts-per-billion) range DO sensor for accurate control of the DO content during testing. An analog measurement of DO can be used to set a digital output from the DAQ that will open/close the N2 sparge solenoid valve through a solid-state relay (SSR). The presence of N2 will reduce DO from the enclosed test chamber environment based on the DO content set point provided to the control logic. This future planned control loop will allow the test media to be maintained at specific DO levels for enhanced replication of the environment of interest.
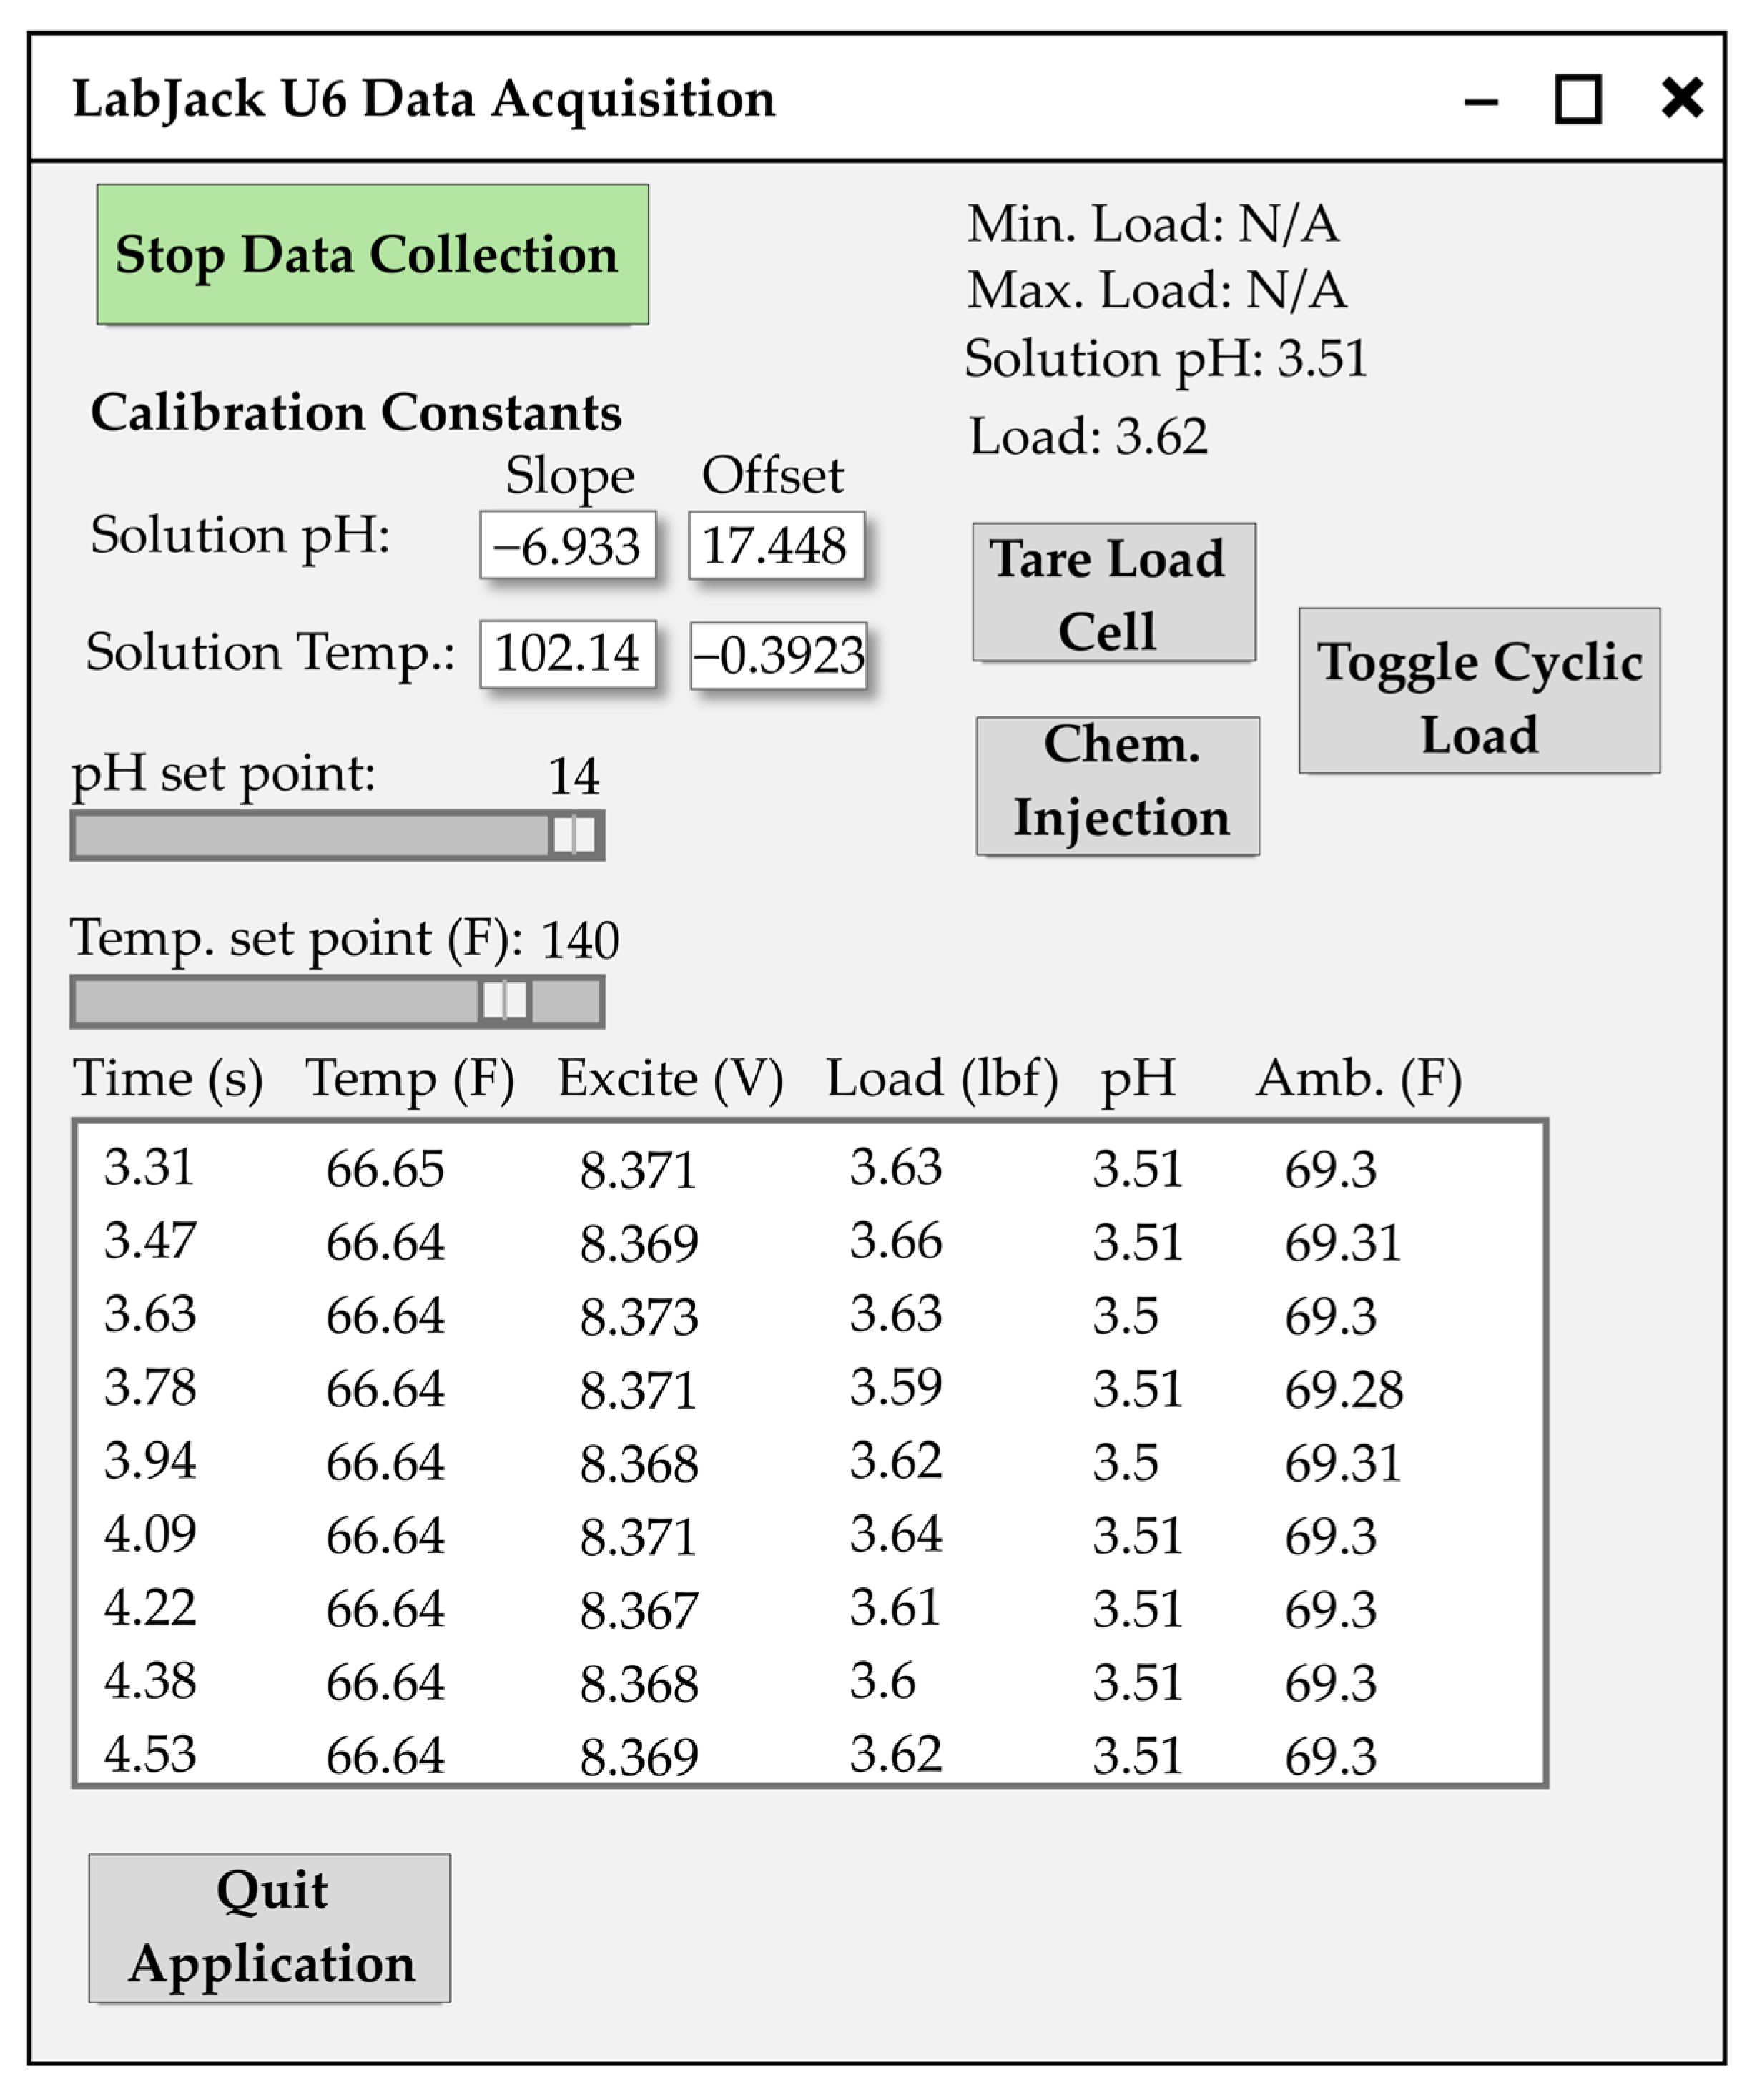
The application software for the testing system was developed in Python version 3.10 using the LabJack Windows UD library/driver Version 3.52 (LabJack Corporation, Lakewood, CO, USA). Generative AI assistance was used during the development of this work to iteratively explore Python programming options, clarify syntax, and assist in the integration of data acquisition and control functionalities. Multiple prompt sessions were used to gather and refine code sections, which were manually reviewed and assembled by the authors into the final programming. All code was validated by the authors through functional testing, as described in this article. The user interface (UI), shown in Figure 10, included the following design elements:
  • Start/stop data collection toggle command button;
  • pH and temperature calibration constant input fields;
  • Tare load cell command button;
  • Manual chemical injection command button;
  • Temperature set point input slider;
  • Visual streaming data collection window;
  • Data collected is written to a text file;
  • Quit application command button.
The design of the testing system incorporated basic Industry 4.0 principles through digital integration and remote operation, enabling real-time monitoring and control from distributed locations. An open-source remote access platform (DWService, DWSNET s.r.l., Naples, Italy, last accessed on 30 June 2025) was used to access the test system computer during testing. Streaming data displayed in the user interface enabled real-time remote monitoring of test progress. A webcam, installed on the control computer and positioned to observe the test system, provided visual feedback for remote operation. The user interface also supported remote adjustment of test parameters and control functions (Figure 10), including manual chemical injection, cyclic load drive motor control, real-time updating of setpoints, and data acquisition start/stop toggling. This configuration supported shared, decentralized monitoring and control of the test system after initial setup and enhanced flexibility during the long duration testing typical of EAC fatigue studies.

2.4. Compliance Calibration and Validation Technique

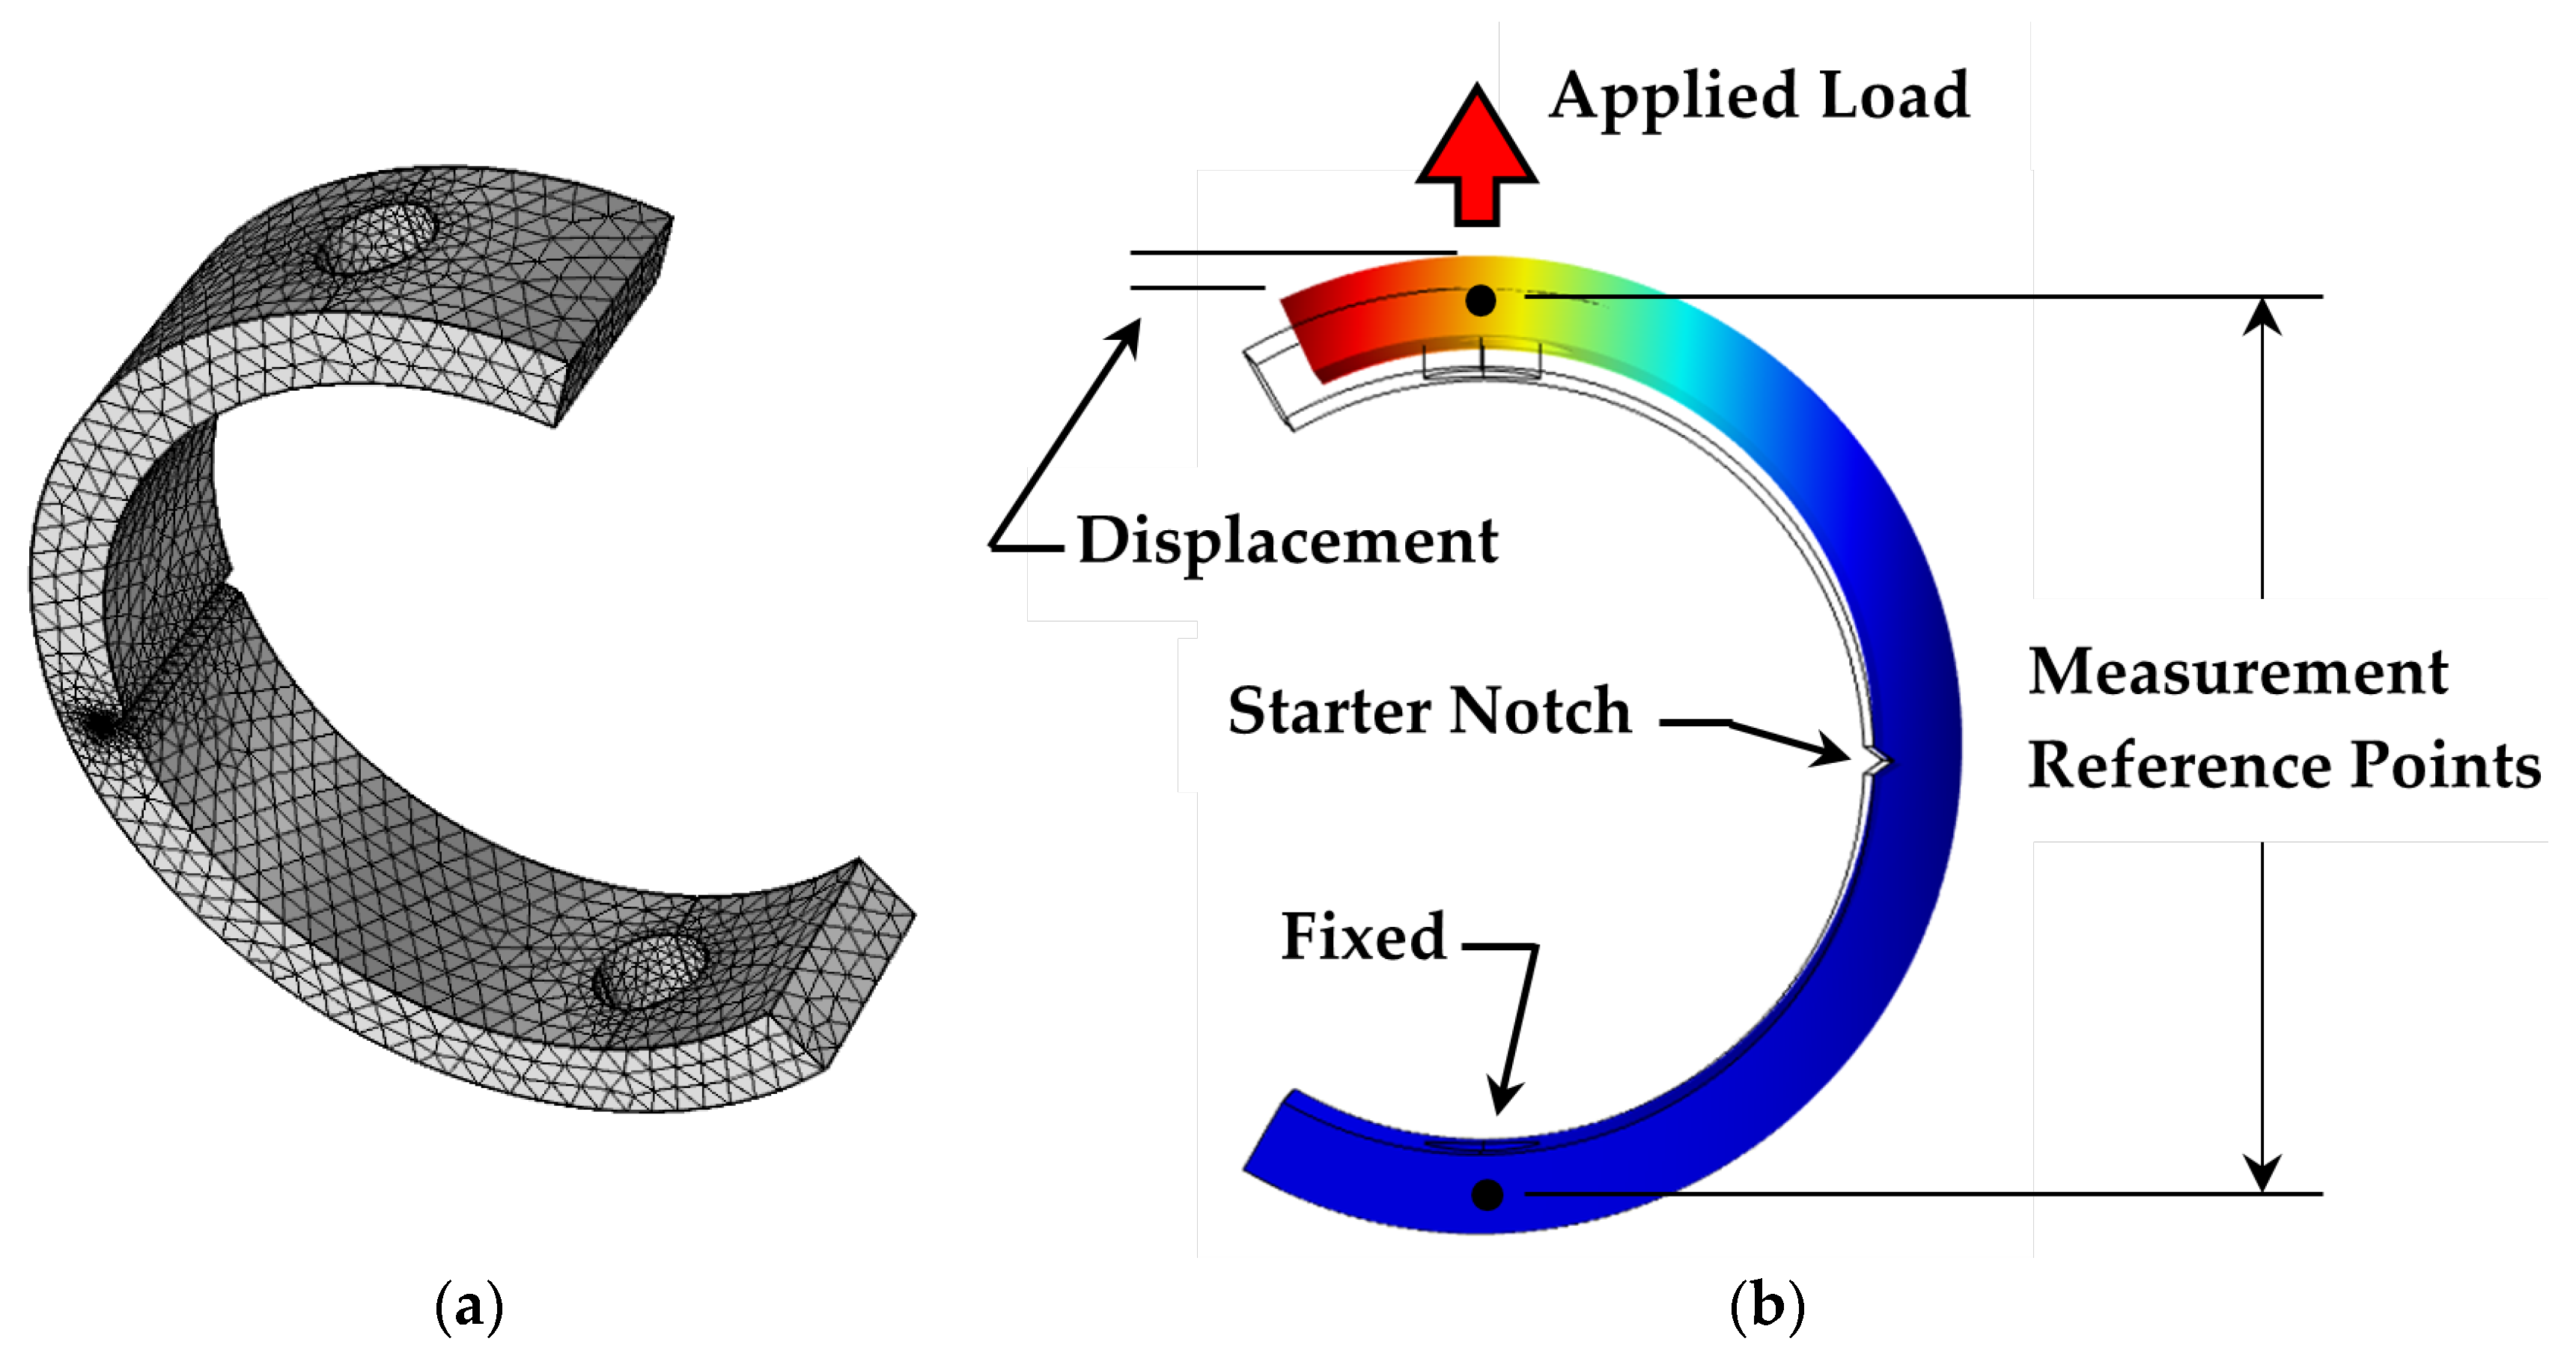
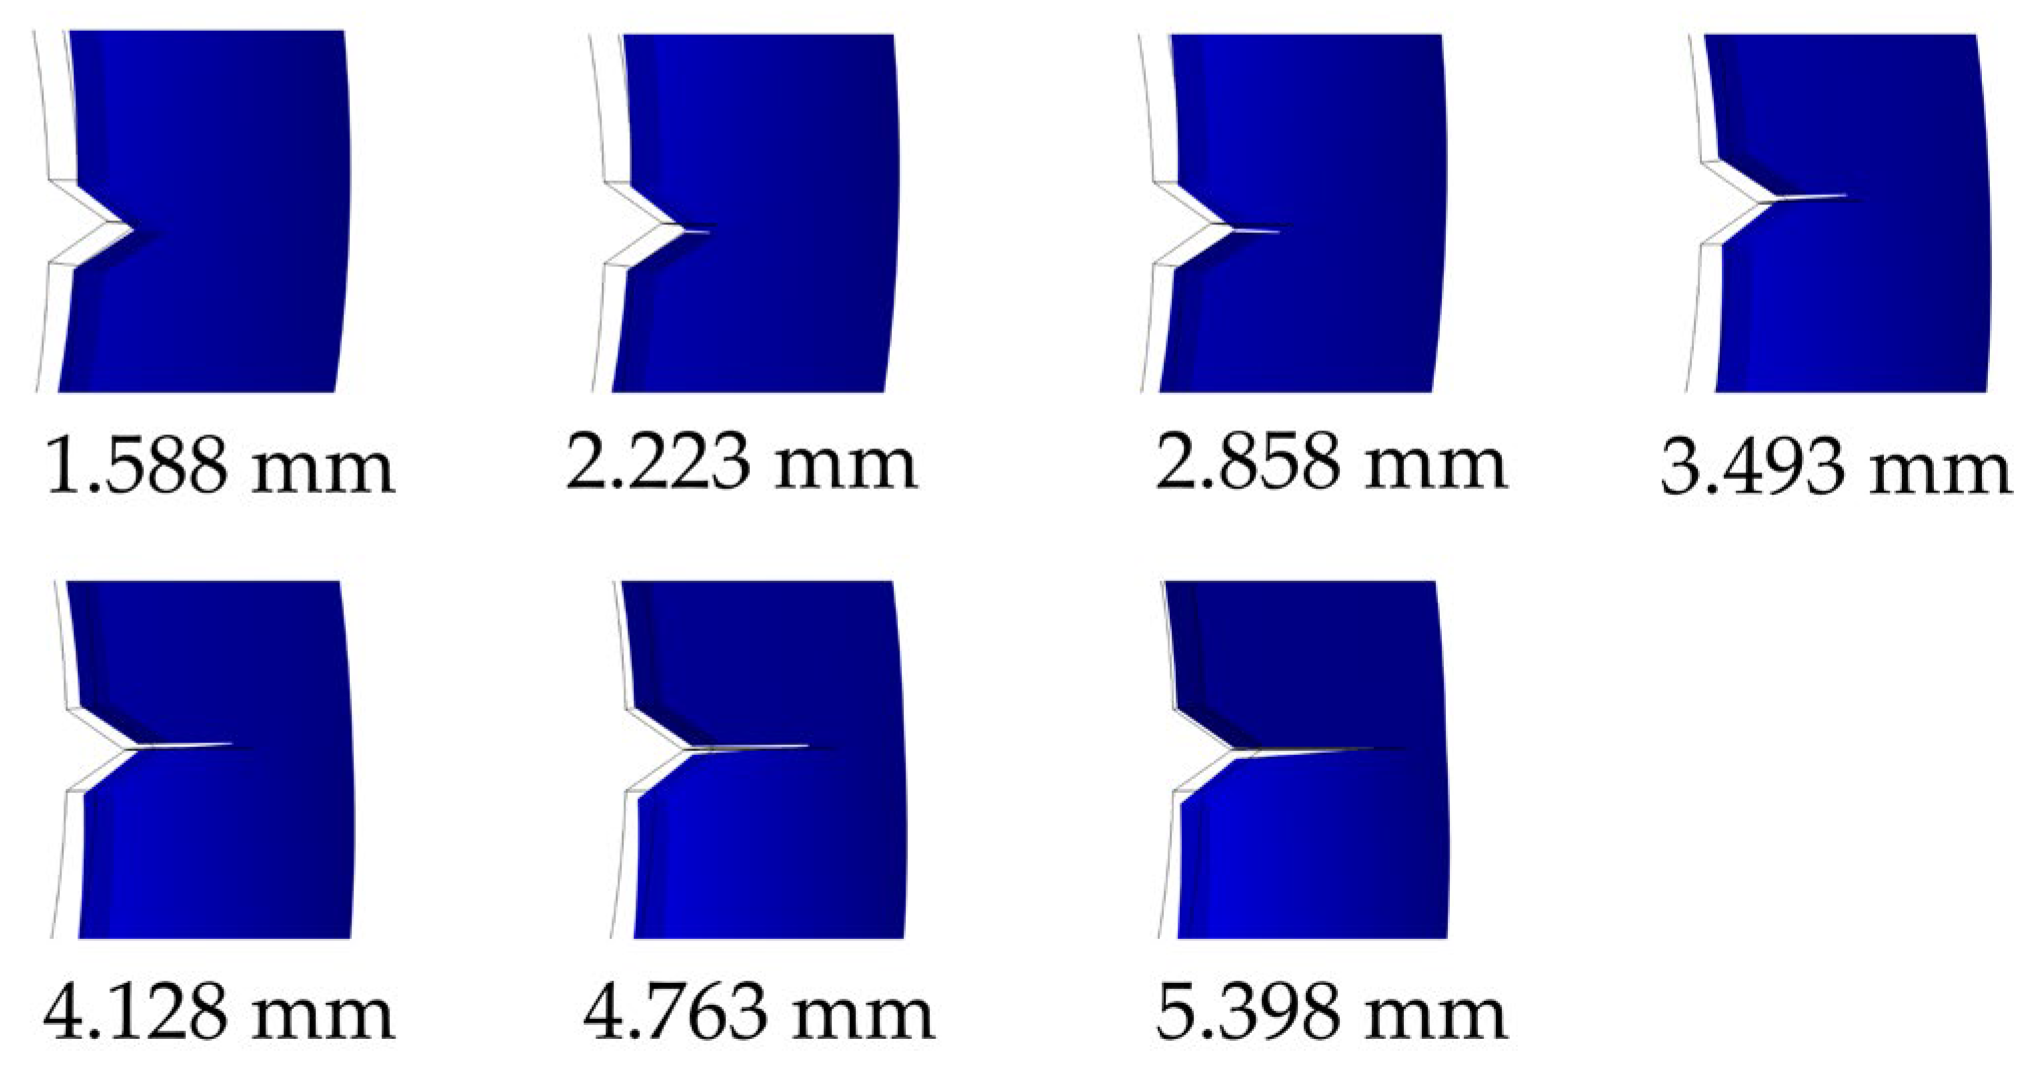
Finite element analysis using COMSOL® Multiphysics software Version 6.0, Build 405 (COMSOL, Inc., Burlington, MA, USA) established the compliance behavior for carbon steel (SA210-A1) C-ring samples. An isotropic, linear-elastic, material model was used to characterize stress–strain behavior and predict C-ring compliance using various static loads and crack lengths. Only the Structural Mechanics Module was used in this analysis. Other physics interfaces available from COMSOL, such as Fluid Flow and Heat Transfer, were not included. A parametric study was conducted to evaluate the relationship between the applied load and the resulting load point deflection for every combination of crack length from 1.588 mm to 5.398 mm in increments of 0.635 mm and for loads of 44.48 N to 444.82 N in increments of 44.48 N. Discretization of the C-ring model included a meshing of 65,659 tetrahedral elements, 7718 triangular elements, 940 edge elements, and 46 vertex elements resulting in a total of 12,940 meshed vertices. Mesh refinement was applied in the region surrounding the crack to enhance computational accuracy. The final meshed 3D geometry is shown in Figure 11a. The boundary conditions included a fixed edge at the bottom hole location. The static load was applied to the bottom edge of the top hole. A typical displaced model result with boundary condition annotations is shown in Figure 11b. The COMSOL Parametric Sweep function was employed to systematically solve for all combinations of applied load and crack length by passing these parameters to the solver, enabling efficient generation of the complete solution dataset. The crack length progression used for this parametric sweep may be seen in Figure 12. The corresponding simulation results, including load-point displacement versus applied load curves for each crack length, are presented and discussed in Section 3.3.
Validation of the FEA compliance model was provided by experimental load–displacement measurements of an SA-210-A1 carbon steel C-ring specimen. A digital hanging crane scale (CCWeigh, JiangYin Suofei Electronic Technology Co., Ltd., Jiangsu, China) and a 150 mm Pittsburgh digital caliper with 0.03 mm accuracy (Calabasas, CA, USA) were used to measure applied load and displacement, respectively. A centerpunch was used to mark measurement reference points at the mid-thickness location of both ends of the specimen, as shown in Figure 11, to assist in accurate measurement of displacement under applied load.

2.5. Test Procedure

Environmental control loops were independently tested using step response analysis to characterize system performance. The temperature control loop was evaluated using 15 L of tap water, starting at an ambient temperature of 20 °C and heating to a setpoint of 60 °C. The pH control function was assessed using 15 L of deionized water with an initial pH of 5.81 and a target setpoint of 9.5 pH. Once the setpoint was achieved and the pH stabilized, the system was intentionally perturbed by manually injecting 0.6 M HCl to evaluate the recovery response.
Crack growth testing was conducted on carbon steel (SA-210-A1) and PMMA C-ring specimens at 20 °C. Carbon steel specimens were pre-cracked using an automated MTS servo-hydraulic testing machine (MTS Systems Corp., Eden Prairie, MN, USA) under constant amplitude sinusoidal waveform at a frequency of 4 Hz. The applied load for pre-cracking was 900 N with stress ratio (R) of 0. A digital microscope was used to identify crack initiation and measure the crack length prior to moving the specimen to the EAC testing system chamber. An acidic chloride solution (0.1 M HCl + 0.5 M NaCl) was used to promote corrosion fatigue in the carbon steel samples, while xylene was employed to induce environmental cracking in the PMMA specimens. No pre-cracking of PMMA specimens was provided. For each material, a minimum of five specimens were tested in solution and compared to a control sample tested in open air. The 400 mL optional (Shown in Figure 3), removable PTFE beaker (McMaster-Carr, 3974T14, Elmhurst, IL, USA) was used to conduct environmentally accelerated fatigue crack growth testing with relatively low solution volumes.
Two-point calibrations were performed for both the temperature and pH measurement systems. Voltage signals corresponding to the extreme ends of each measurement range were recorded using known reference inputs and used to generate linear calibration curves. Temperature calibration was conducted using reference values of 20 °C and 60 °C, while pH calibration utilized standard buffer solutions at pH 4.00, pH 7.00 and pH 10.00 (Biopharm, Inc., Hatfield, AR, USA). The resulting calibration constants (slope and offset) were entered into the application software through the user interface (Figure 10).
The applied load measurement accuracy was verified by applying four known static loads and comparing the output to expected values based on the manufacturer’s calibration. The resulting error was found to be within acceptable limits as discussed in a later section, confirming the accuracy of the load cell response under test conditions.

3. Results and Discussion

This section presents the performance evaluation of the EAC fatigue testing system and results from crack propagation testing on SA-210-A1 carbon steel and PMMA specimens. The system’s environmental control stability and load measurement accuracy are first assessed. Crack growth behavior in carbon steel specimens exposed to acidic chloride solution is then analyzed using a compliance-based approach. Due to multiple interacting surface cracks, accurate crack length tracking in PMMA specimens exposed to xylene was not feasible; instead, failure progression is discussed based on load drop response and fracture surface characteristics. These findings demonstrate the system’s utility for EAC studies that pertain to various material systems and degradation mechanisms.

3.1. System Performance and Control Stability

3.1.1. Temperature Control Loop

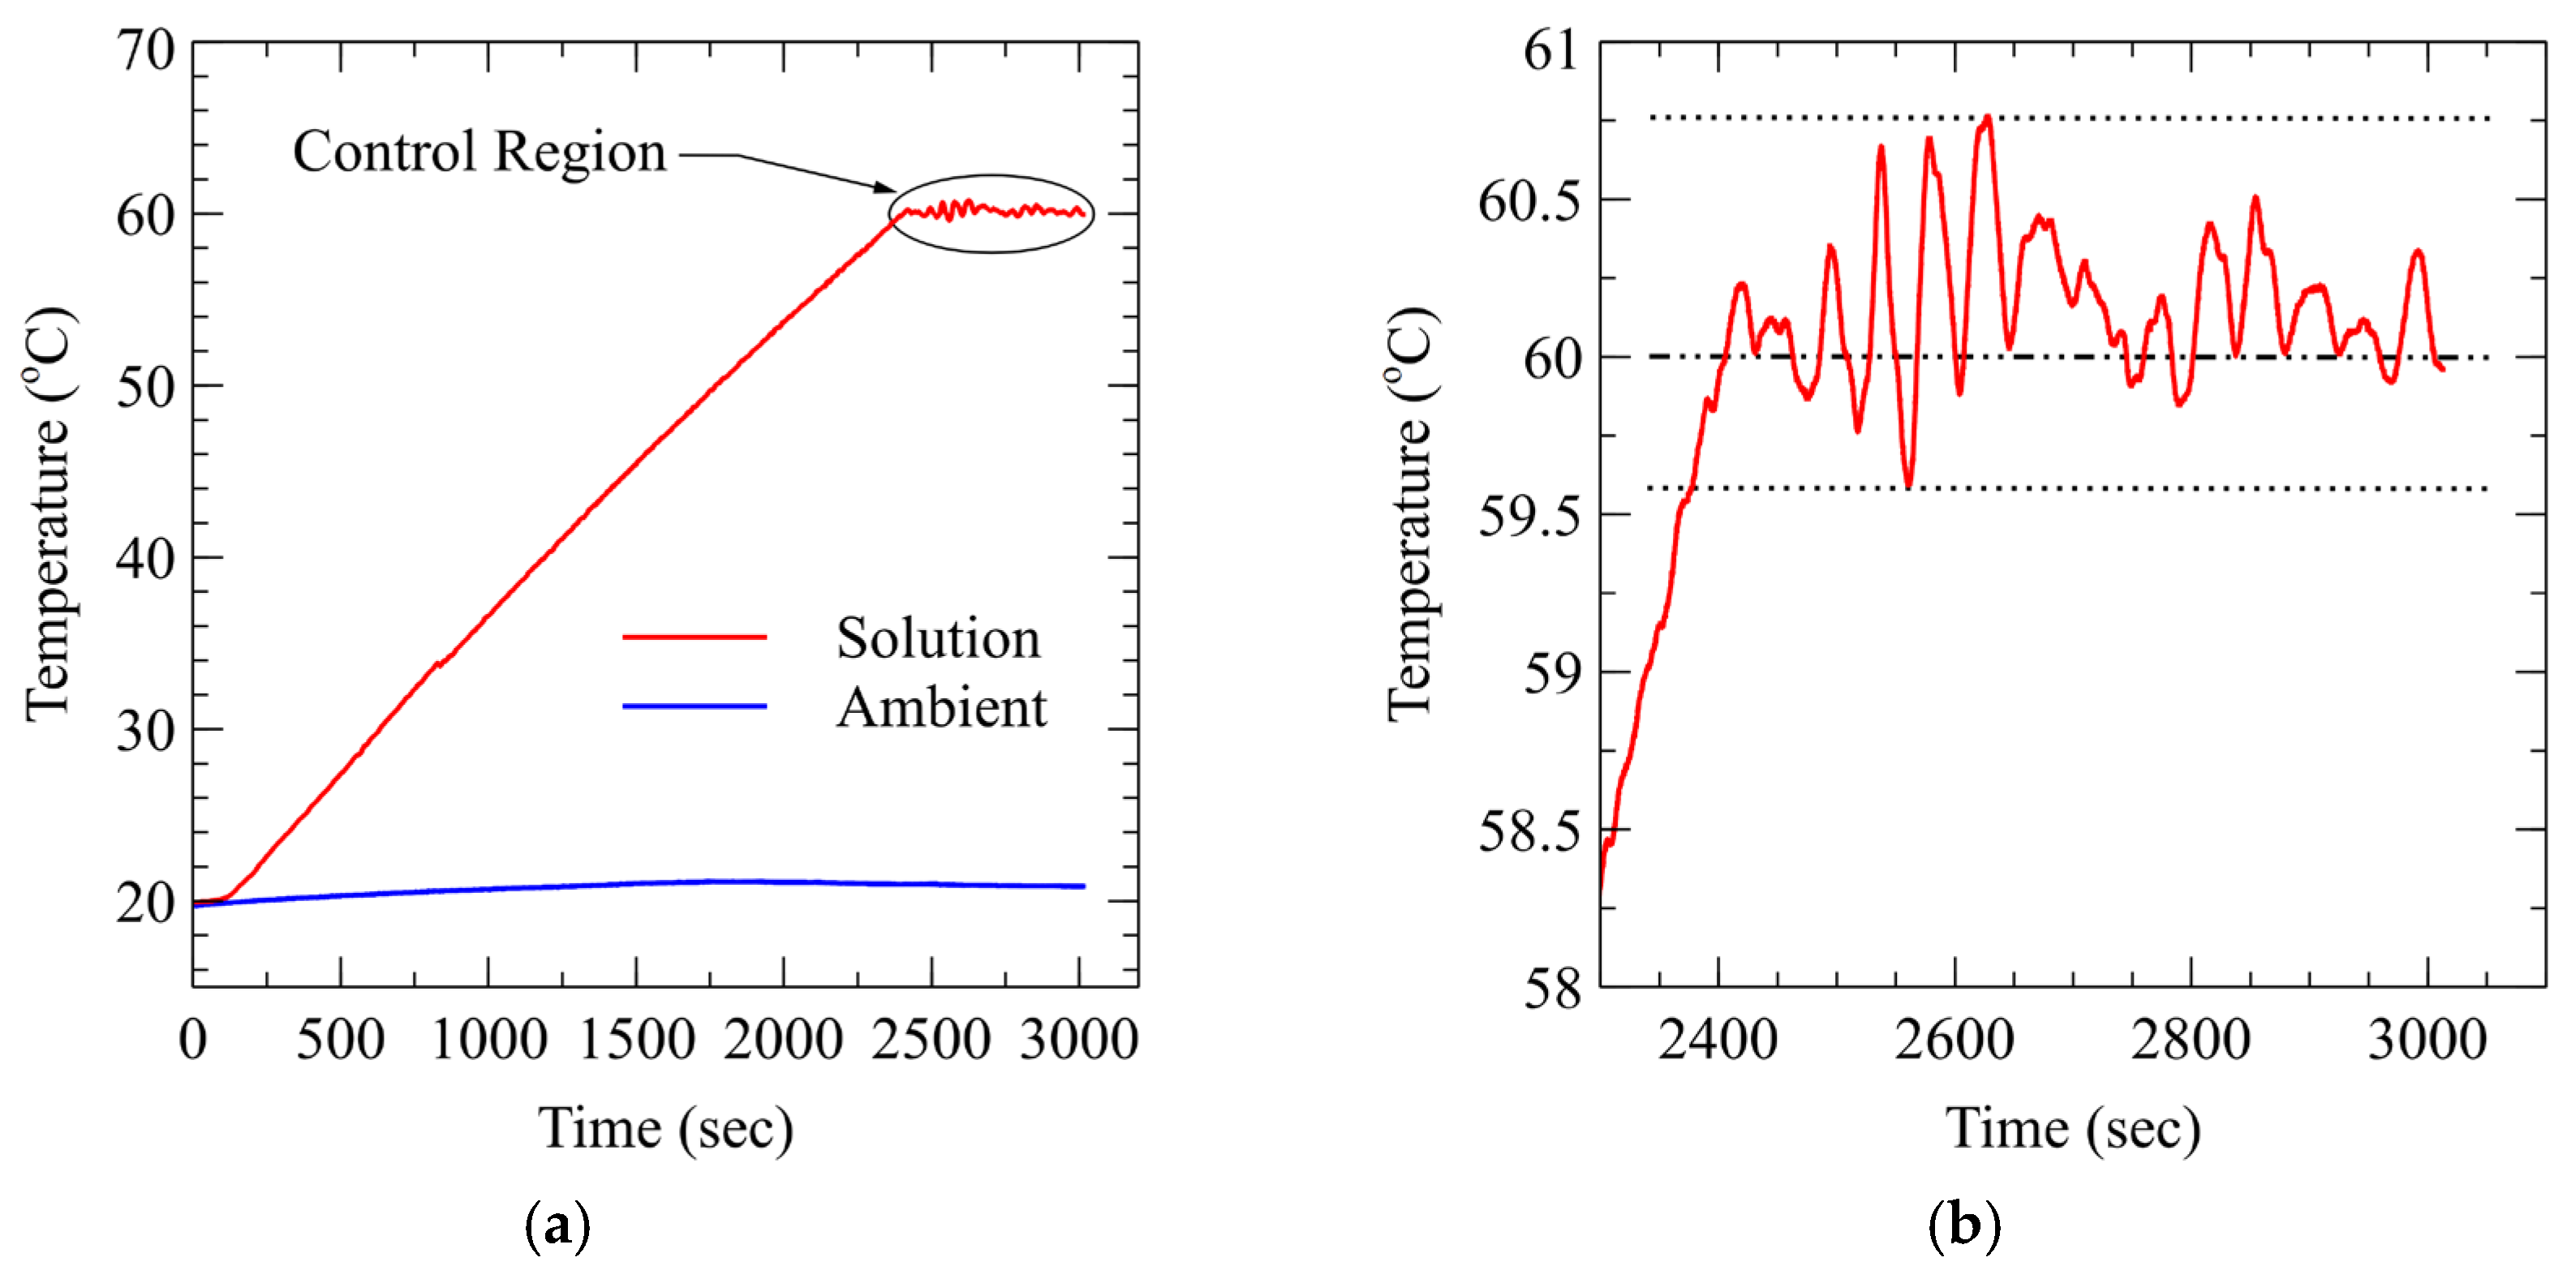
Accurate temperature regulation is essential in materials testing systems, as both chemical reaction kinetics and material properties can be highly sensitive to thermal conditions. To evaluate the responsiveness and stability of the system’s temperature control loop, a step response test was performed. Figure 13a illustrates the full system response to a programmed step increase in temperature, capturing both the ramp-up and soak (steady-state) regions. The test began at 20 °C, representative of ambient laboratory conditions, and the system reached the target setpoint of 60 °C in 2400 s (approximately 40 min), demonstrating the heating capacity of the selected hardware and control configuration. This test was conducted with a test chamber volume of 15 L of water, which was approximately half the available chamber volume.
After reaching the setpoint, the solution temperature was continuously monitored to assess the stability of the on/off control logic during steady-state operation. As shown in Figure 13b, the total temperature variation during the soak period ranged 1.17 °C. This was measured as the difference between the minimum and maximum observed temperatures. The maximum absolute error was 0.75 °C (1.3%). For applications requiring tighter control or reduced thermal fluctuations, particularly in small-volume systems, a more advanced control approach such as proportional-integral-derivative (PID) control may be warranted to minimize overshoot and maintain a relatively narrow temperature range.

3.1.2. pH Control Loop

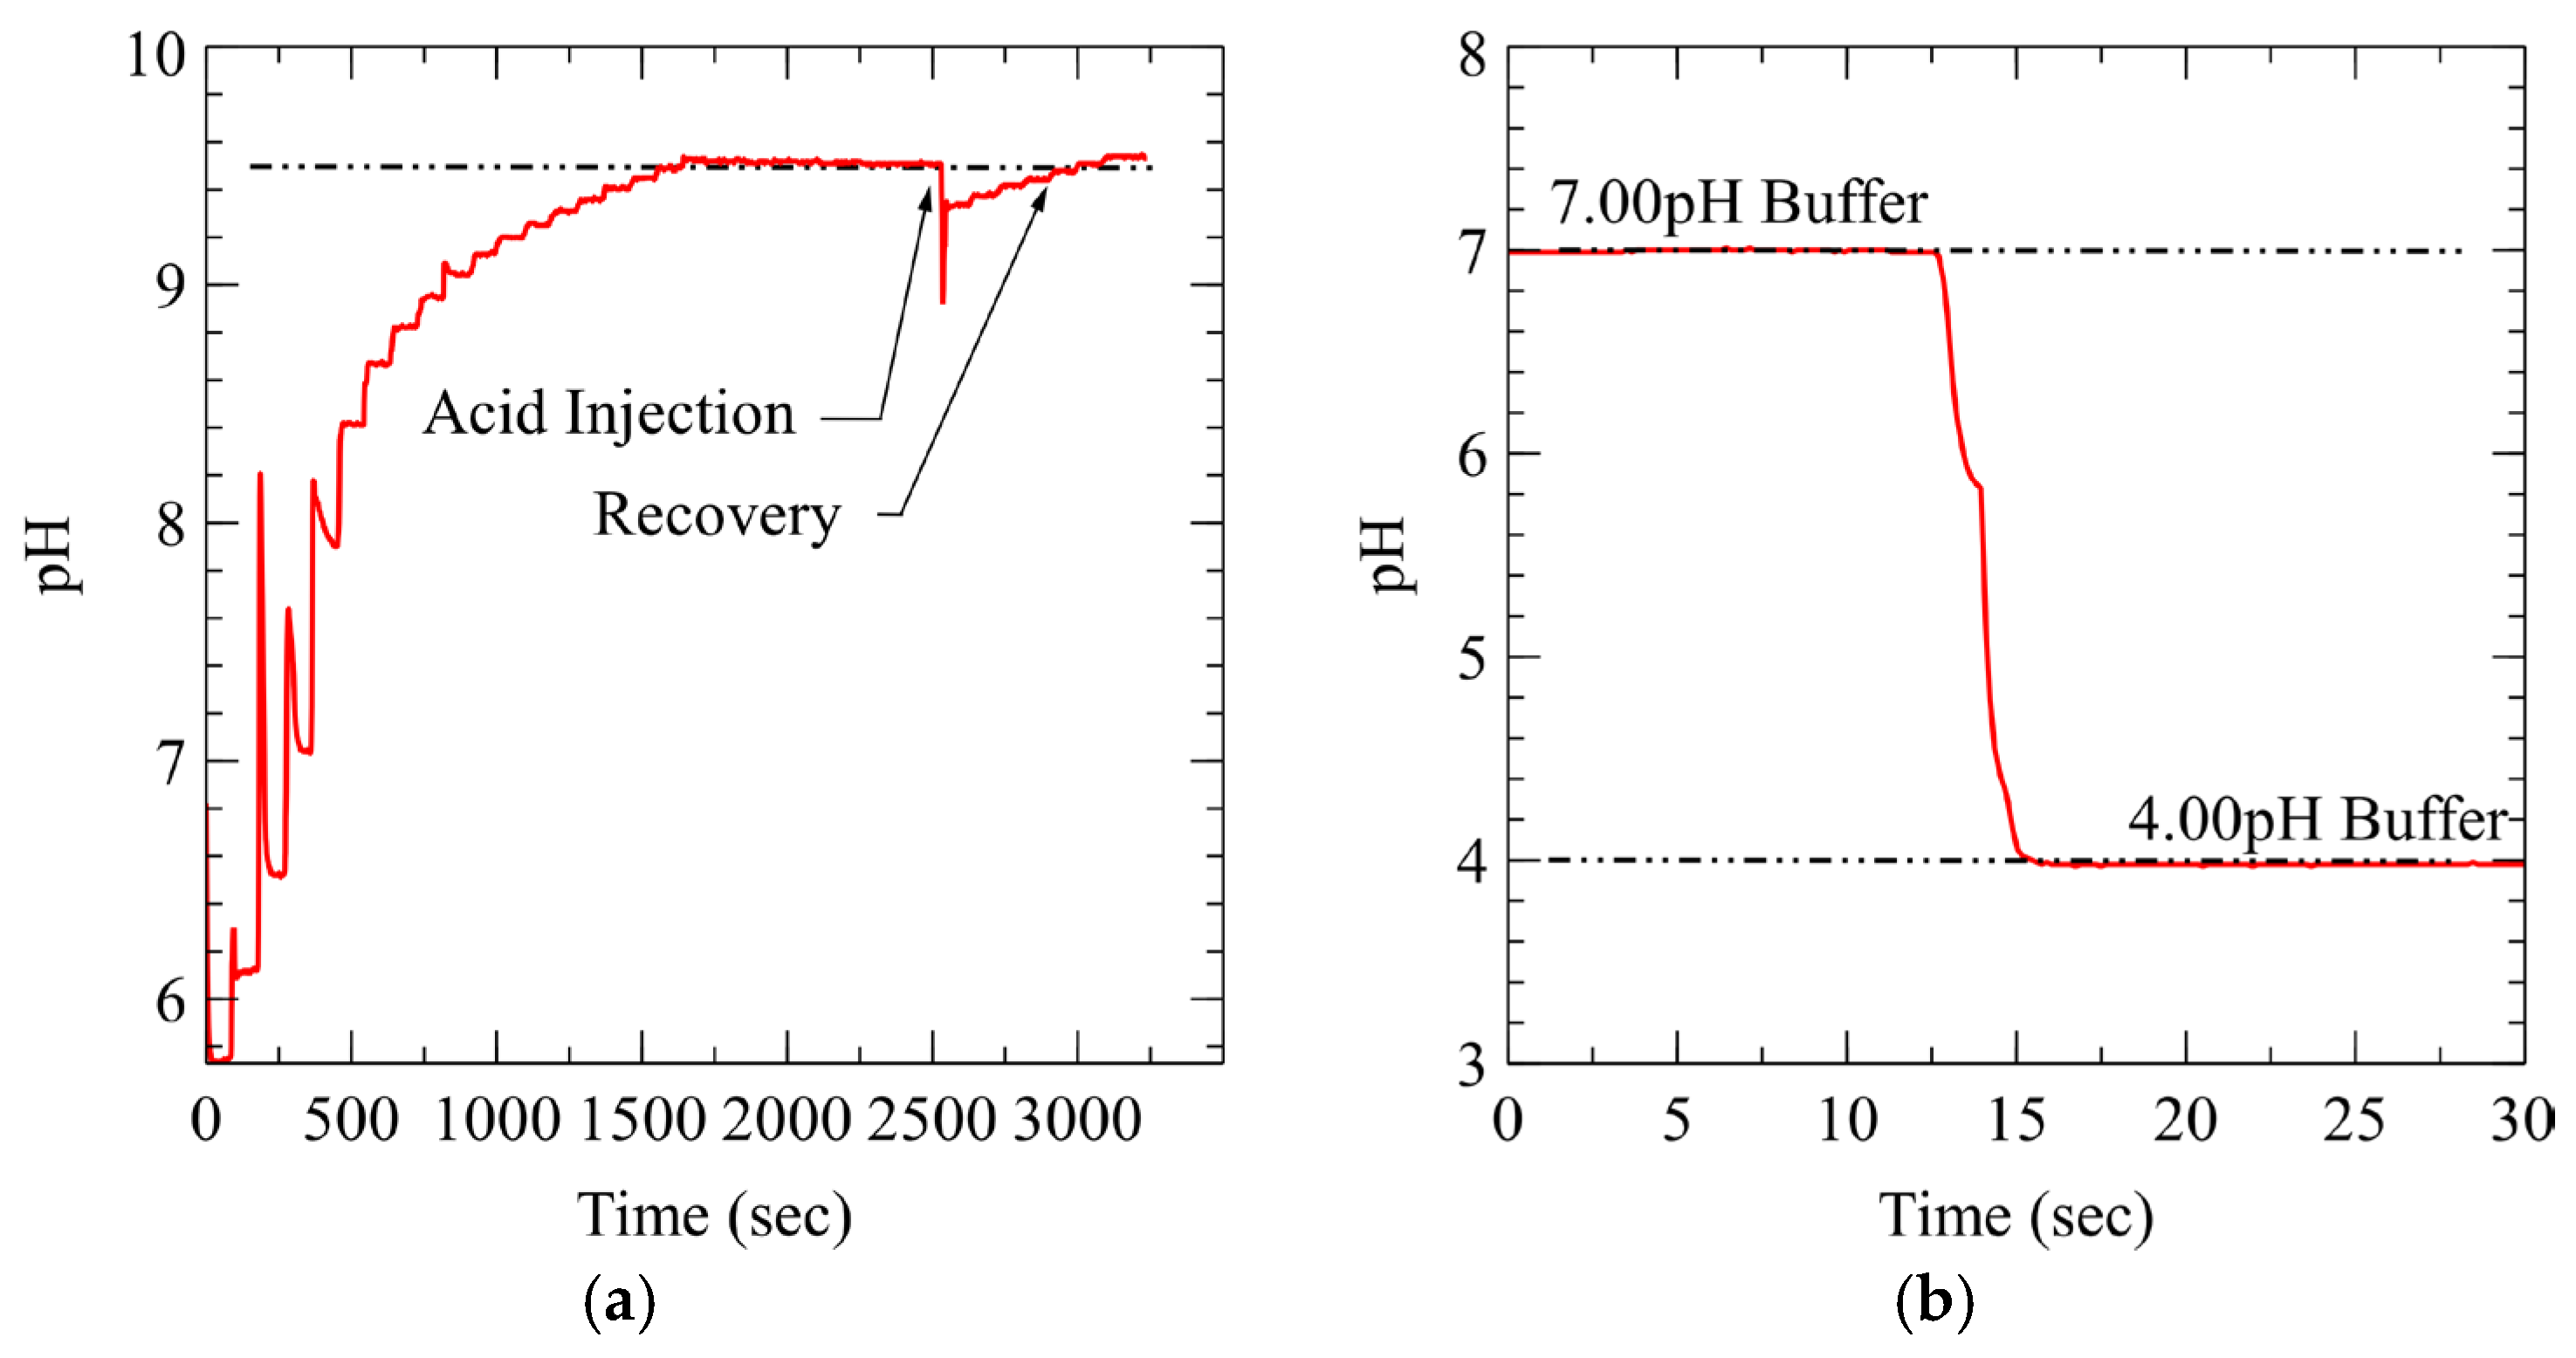
Solution pH is a critical parameter in corrosion-related materials testing, as both acidity and alkalinity can significantly influence electrochemical behavior, corrosion rates, and crack propagation mechanisms. To assess the responsiveness and stability of the pH control loop, a step response test was conducted following calibration of the pH sensor using pH 7.00 and 10.00 buffer solutions. The test was initiated with deionized water at an initial pH of 5.8, with a target setpoint of 9.50 selected to replicate alkaline conditions representative of industrial boiler water environments. Testing was conducted at 20 °C using the environmental chamber volume of 15 L. No stirring of the solution was provided during testing; however, air was continuously sparged into the bottom of the chamber with the bubbling providing a degree of solution mixing. Figure 14a illustrates the system response, including both the ramp-up and steady-state (soak) regions. The control system was configured to inject reagent (5 wt% ammonium hydroxide in water, Thermo Fisher Scientific, Waltham, MA, USA) every 60 s for a duration of 1 s until the pH setpoint was reached. The metering pump was driven by a control signal of 1.28 V (12.6 mA) during each injection event. These timing and signal parameters are adjustable within the application software to accommodate different fluid volumes or response requirements. With this setup, the system reached the 9.50 pH setpoint in 1600 s (26.4 min). During the subsequent soak period, the total pH variation was 0.07 units, with the system maintaining stable control. No overshoot was observed during the initial ramp-up.
To evaluate disturbance recovery, a manual injection of 0.6 M hydrochloric acid was introduced at 2530 s to simulate a sudden pH perturbation. The system returned to the 9.50 setpoint within 470 s (7.8 min), ultimately stabilizing at a final value of 9.54 pH. This corresponds to a slight overshoot of +0.04 pH units (0.42% error), which is considered acceptable for an on/off control strategy operating without proportional or integral feedback.
To assess low-pH measurement performance, the sensor was recalibrated using pH 7.00 and 4.00 buffer solutions. After calibration, the probe was immersed in the 7.00 pH buffer and then rapidly transferred to the 4.00 pH buffer. As shown in Figure 14b, the measured pH transitioned to 3.98 within approximately 4.15 s, indicating a relatively fast and accurate (0.5% error) sensor response suitable for low-pH monitoring in acidic test environments.

3.2. Load Measurement and Signal Quality

The load measurement system was calibrated using four known input loads distributed across the expected measurement range. The maximum calibration load was approximately 50% of the peak load that was applied during cyclic testing (that is described in a later section). Figure 15 contains the resulting linear calibration curve, showing the relationship between input load and measured output. Calibration results, including the applied input loads, measured (sensor output) values, and associated percent error, are summarized in Table 5. The maximum measurement error observed across the calibration range was 0.30%, and the coefficient of determination (R2) for the linear fit was 1.000, indicating a high degree of linearity and accuracy within the calibration range.
Calibration was performed only up to about 50% of the maximum load experienced during cyclic testing of carbon steel (SA-210-A1). This is deemed acceptable for the present study since the load cell and signal conditioning system are specified by the manufacturer to be linear across the full operating range. The high degree of linearity exhibited in the calibration curve (Figure 15) further supports the assumption of continued linearity at higher loads. While this extrapolation beyond the calibration range is not expected to introduce significant error during testing, the limitation is acknowledged.
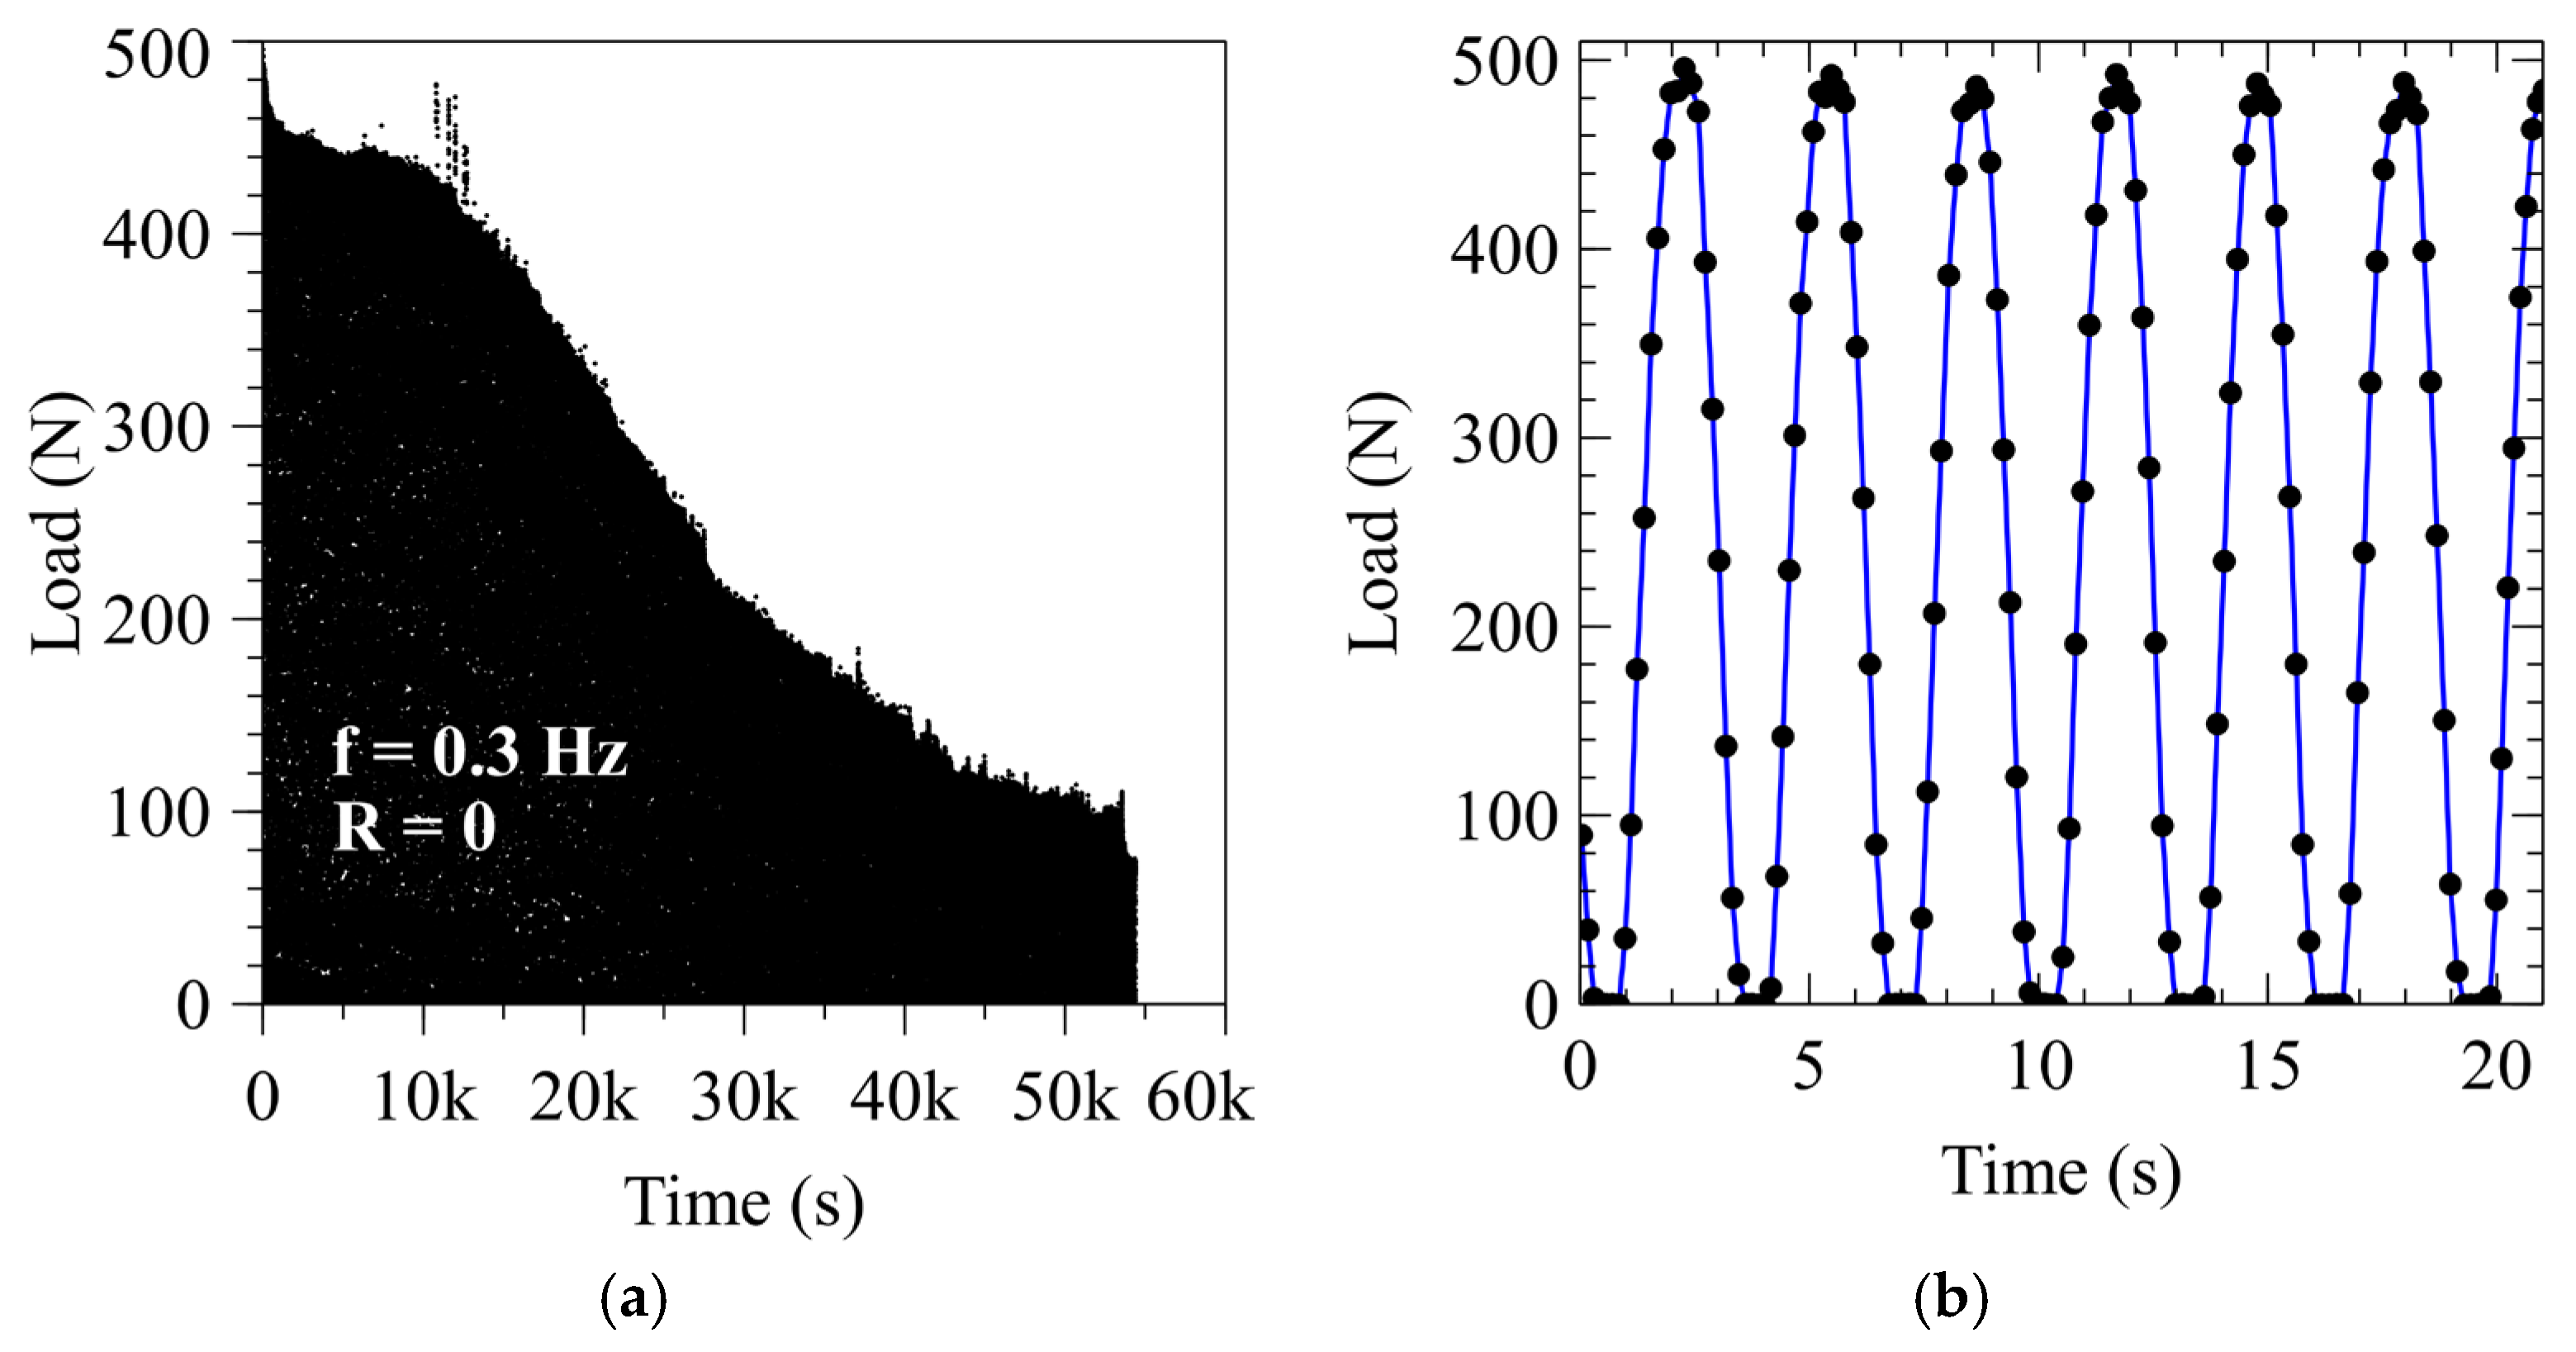
Figure 16a shows the raw transient load data collected from a carbon steel (SA-210-A1) C-ring specimen subjected to cyclic loading in ambient air. The specimen was initially loaded to 495 N and cycled at a frequency of 0.29 Hz (or 3.5 s per cycle) for a total duration of 54,391 s (15.11 h). The data acquisition system was configured to sample at 6.6 data points per second, resulting in a total of 376,407 data points over the course of the test.
To illustrate the cyclic loading profile, a subset of the data (representing the first 21 s) is presented in Figure 16b. As the specimen approaches peak load during each cycle, the increasing torque demand on the cyclic load drive motor causes a slight reduction in shaft rotation speed. This behavior leads to a denser clustering of data points near the peak load region of each cycle, effectively increasing resolution where precision is most desirable. As seen in Figure 16b, this adaptive resolution enhances the accuracy of peak load capture for each cycle. Elsewhere in the cycle, data points remain approximately evenly spaced.
Both the sampling rate and motor speed are adjustable, enabling users to tailor data resolution to specific testing requirements. Planned future enhancements to the system include the integration of a rotational position sensor (e.g., a rotary encoder) on the cyclic load drive motor shaft. This addition will allow for precise tracking of motor shaft position during each cycle, enabling more efficient data acquisition through strategic sampling rather than relying solely on high-frequency, uniform sampling.

3.3. Compliance Calibration and Validation

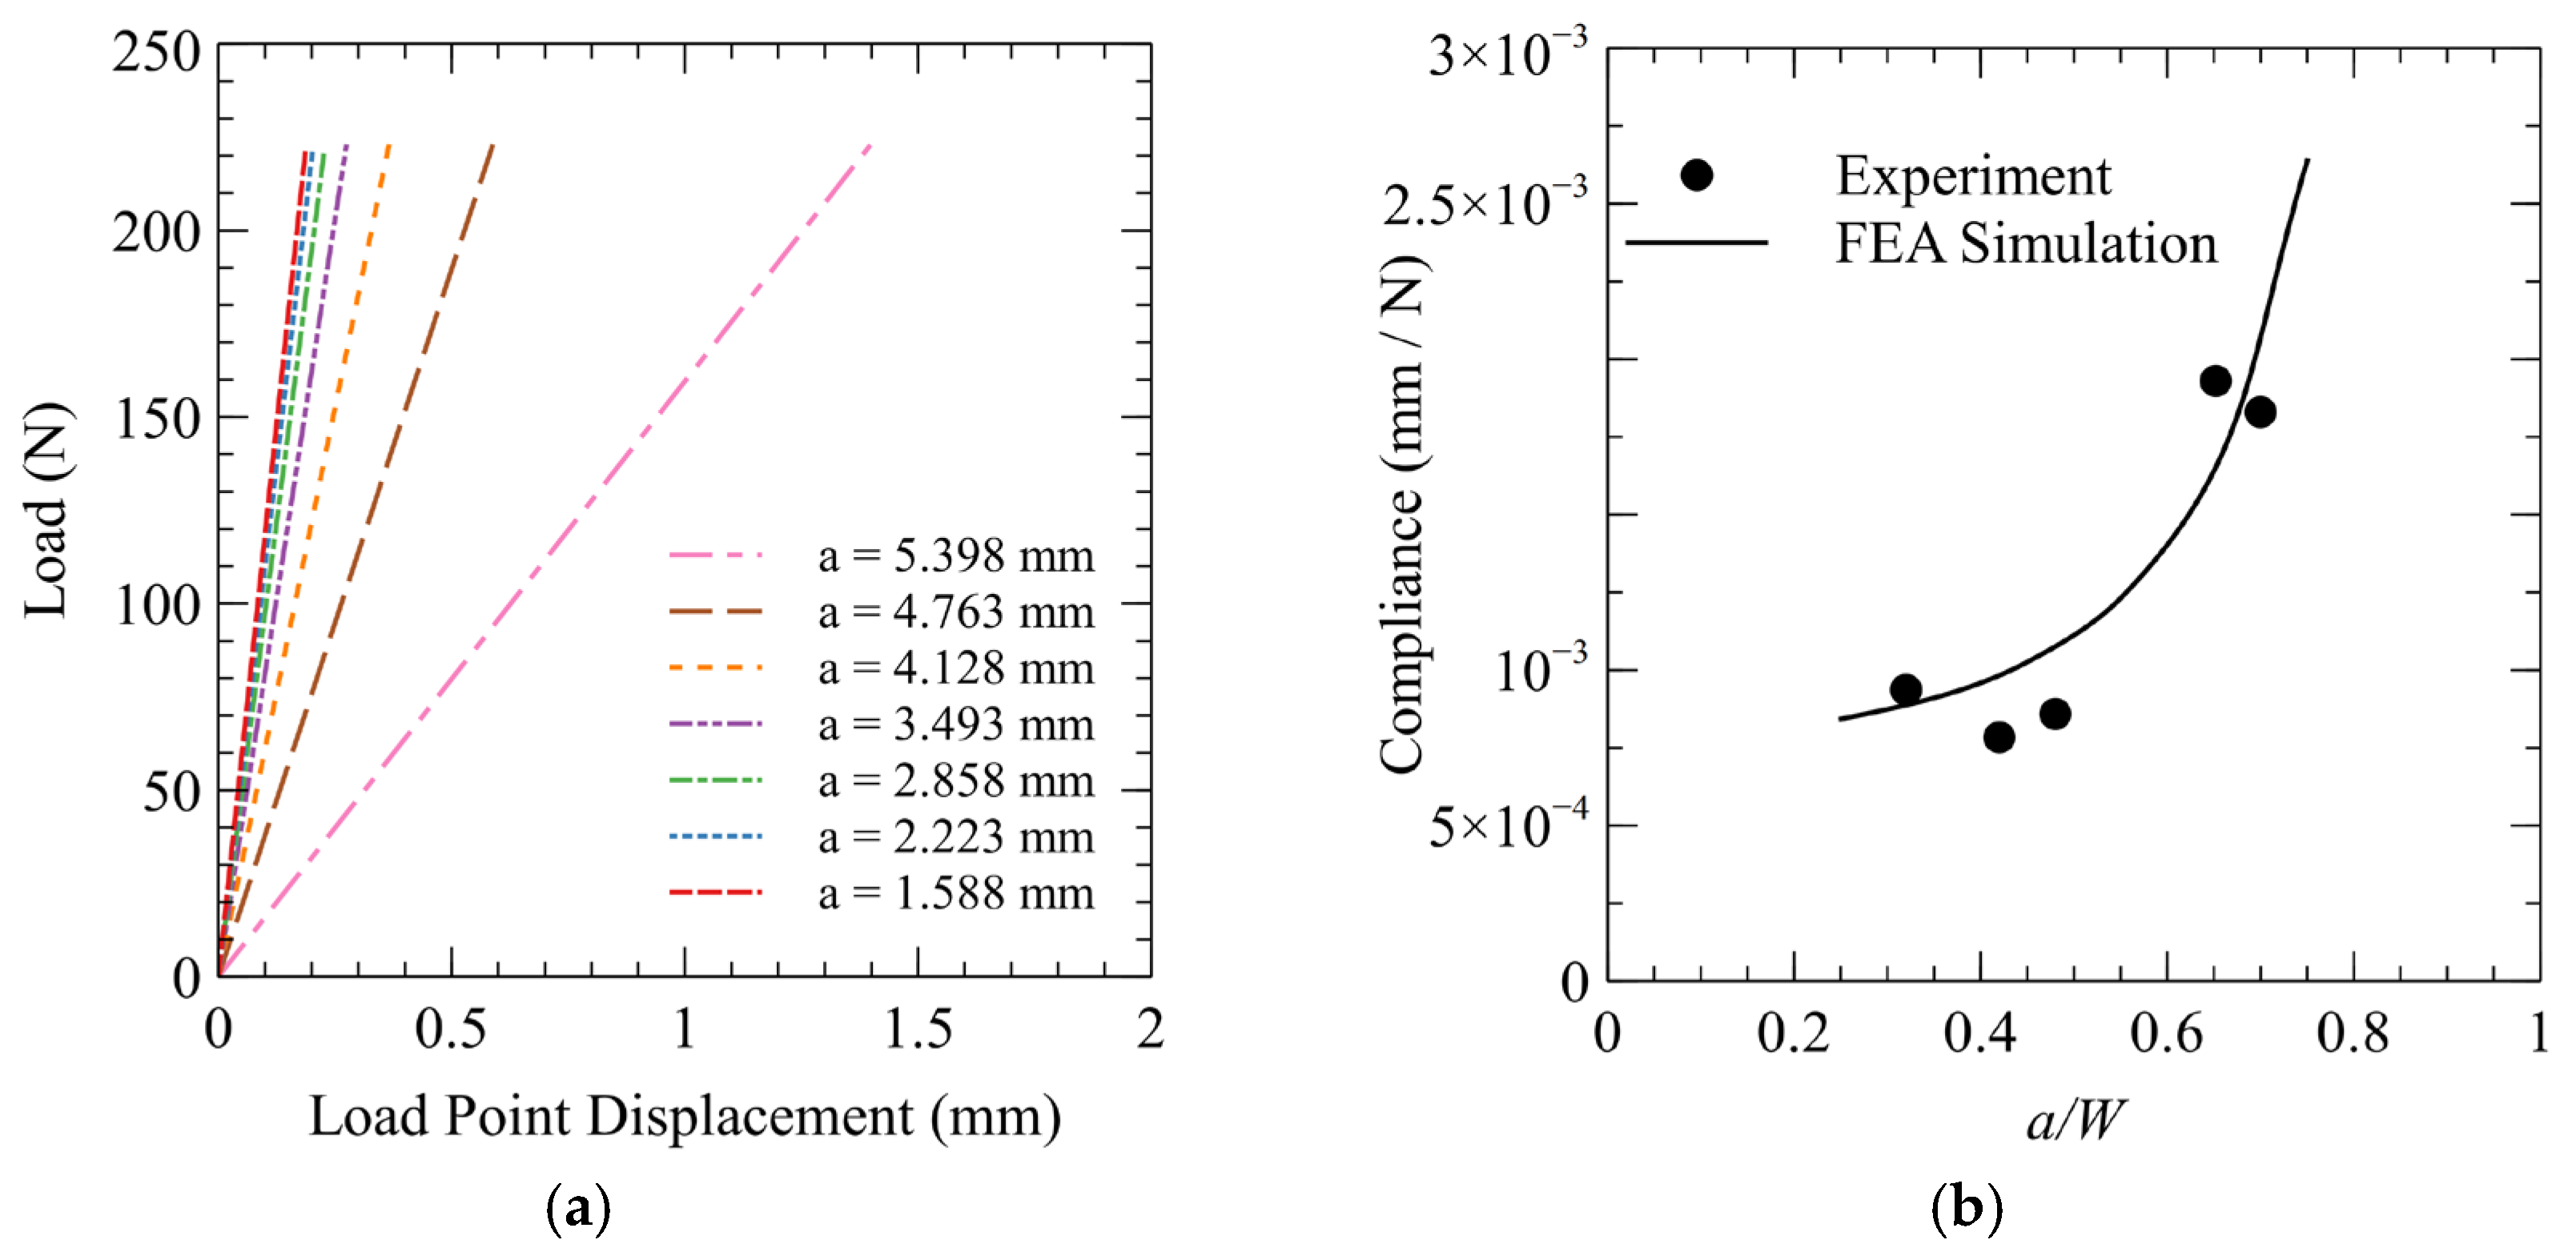
Applied load versus load-point displacement for the carbon steel (SA-210-A1) C-ring specimen was obtained from a finite element analysis (FEA) parametric sweep varying both crack length and applied load (see Figure 11 and Figure 12). Figure 17a illustrates the resulting load–displacement relationships for the seven crack lengths analyzed. As expected, displacement under a given load increased with crack length, and the slope of each curve defines the inverse compliance as a function of crack length. This compliance was then plotted in Figure 17b against the normalized crack length. Experimental data used to validate the FEA predictions are also included in Figure 17b.
The basic compliance ( C ) relation is defined as follows [31]:
C = δ P ,
where δ is the load-point displacement (mm) and P is the applied load (N). Since the test system maintains a constant displacement during each load cycle, the following relation is implied:
δ = C 1 P 1 = C 2 P 2 = = C n P n = c o n s t a n t
for n recorded data points. As a result, the change in compliance between two consecutive data points (i.e., from i 1 to i ) can be computed as follows:
Δ C i = δ 1 P i 1 P i 1 ,
This formulation enables estimation of the relative compliance change as a function of load drop, under the constraint of fixed displacement. This technique inherently eliminates any fixture flexibility since the load drop between data points relates only to specimen compliance change. Once the compliance at each point was established using this method, the corresponding crack length was obtained from the pre-established compliance–crack length relation (See Figure 17). To ensure the accuracy of the crack growth trend, the estimated crack lengths were further calibrated using linear interpolation between the known initial (pre-crack) and final measured crack lengths. This correction step was applied to mitigate systematic deviations arising from idealized FEA model assumptions, such as isotropic, linear-elastic material behavior or simplified geometry, as well as experimental setup variations. It preserved the shape of the compliance-derived growth curve while bounding it within experimentally verified endpoints.

3.4. Environmentally Assisted Fatigue Crack Growth

3.4.1. A210-A1 Carbon Steel (Acidic Chloride Exposure)

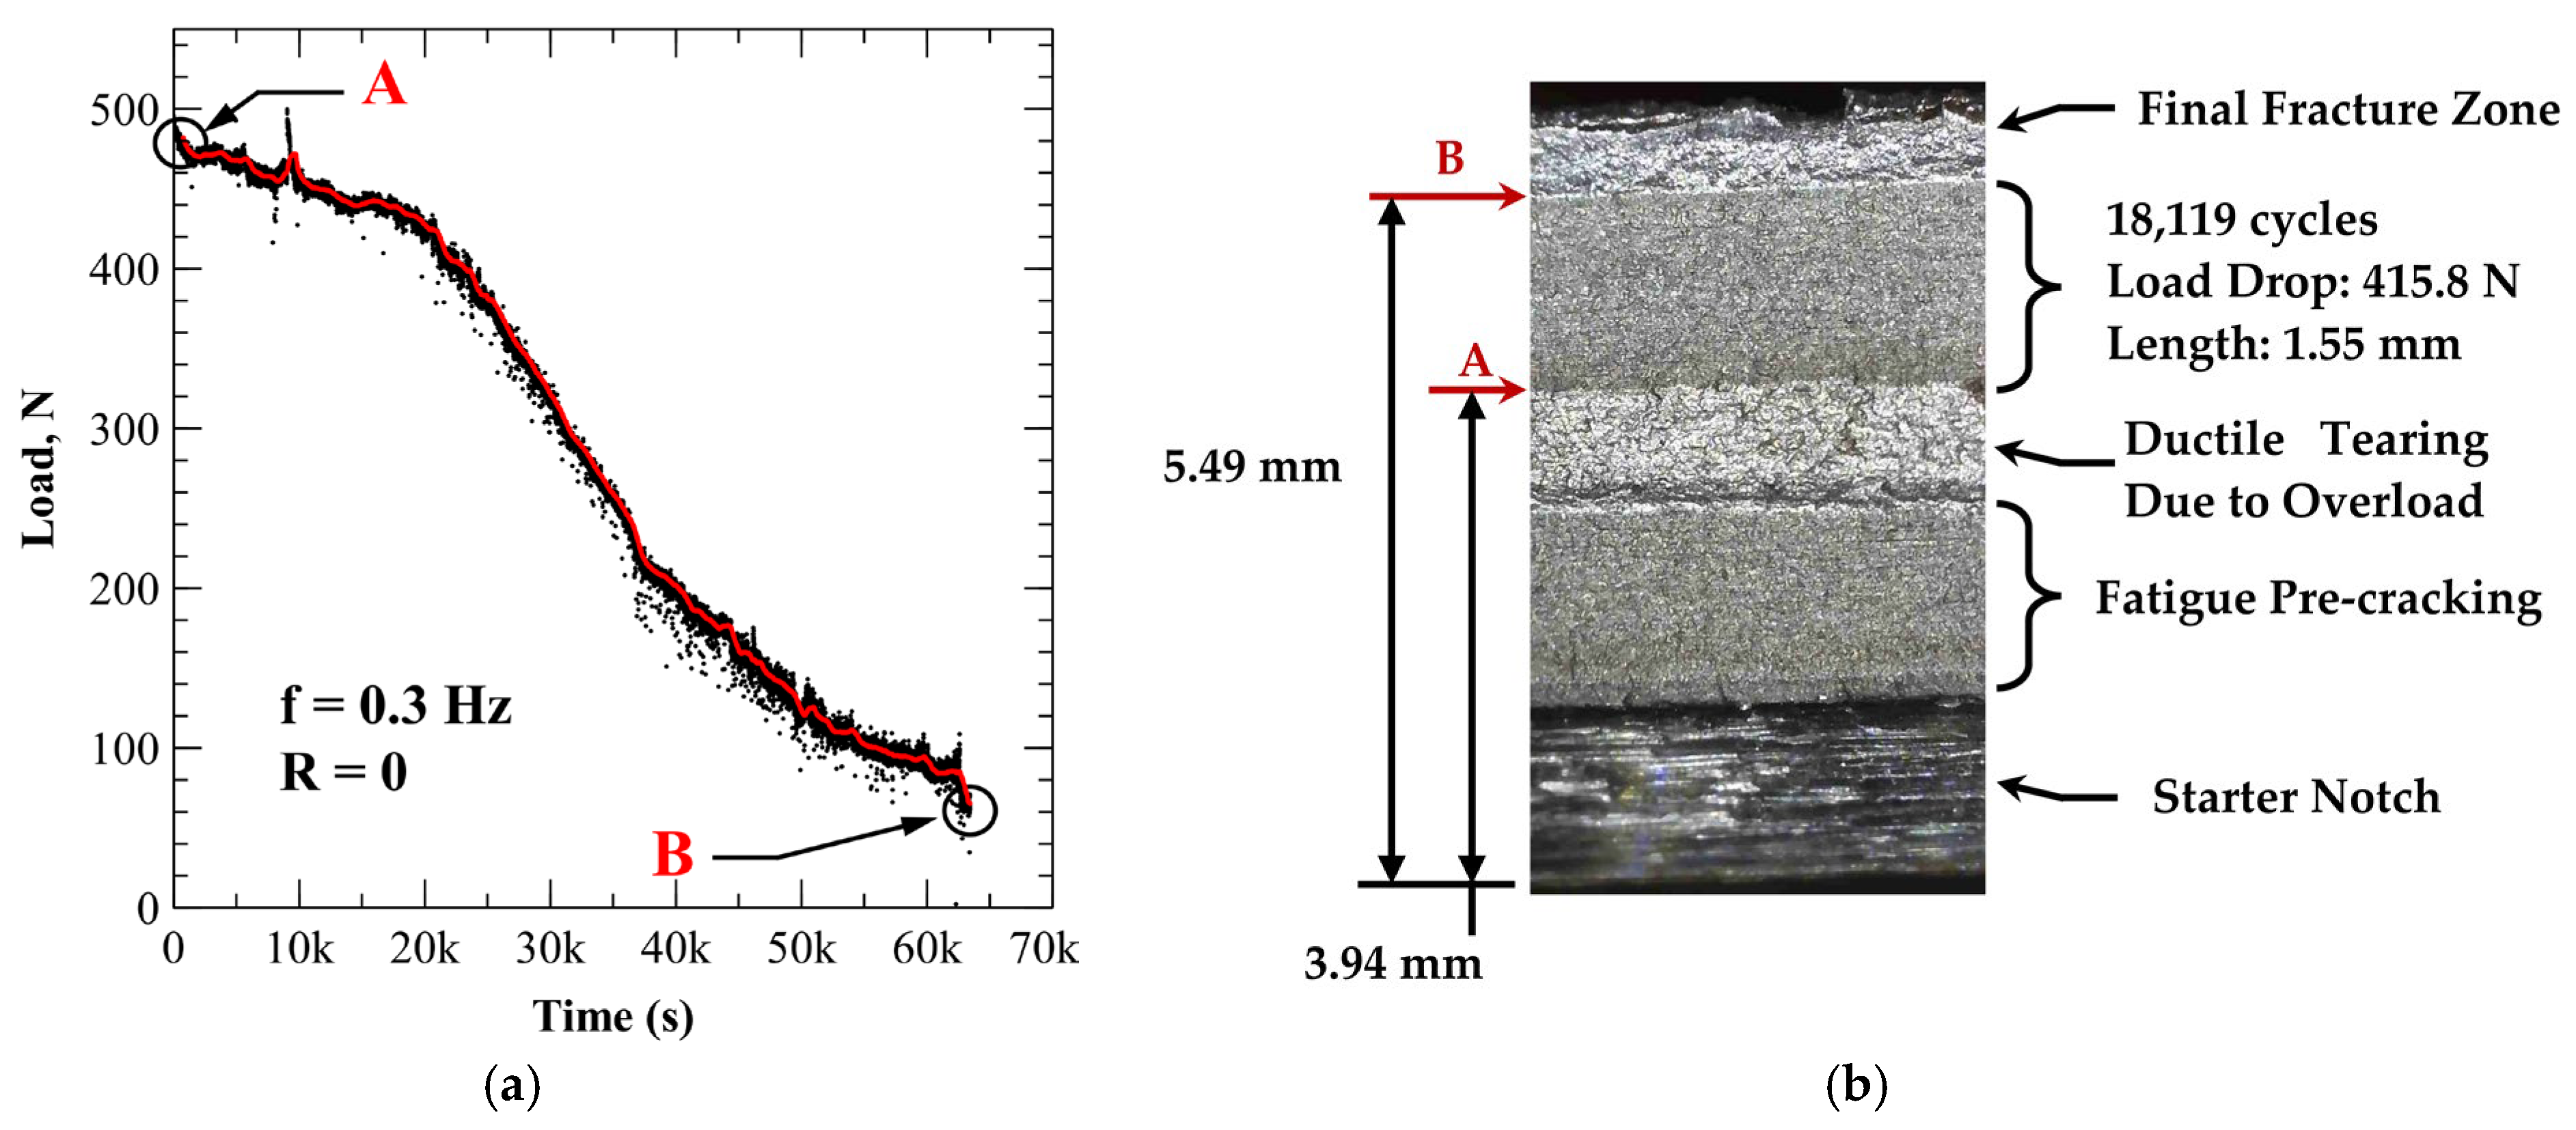
To establish a baseline for evaluating the EAC fatigue test system’s utility for investigating corrosion fatigue, a control experiment was performed in open air at 20 °C using a carbon steel (SA-210-A1) C-ring specimen (CR-001). Following pre-cracking, the specimen was subjected to a ductile overload to create a distinct marker on the crack surface, enabling differentiation between fatigue crack growth during pre-cracking and that which occurred under subsequent open-air fatigue testing. Figure 18 presents (a) the peak load versus time data collected during cyclic fatigue testing, overlaid with a moving average smoothing curve and (b) macroscopic fractography of the failed sample. The initiation and completion of testing in the EAC fatigue test system are marked as points A and B, respectively. The initial load was set to 495 N (Figure 18, point A). Cyclic load fatigue testing proceeded for a total duration of 17.62 h, resulting in 18,119 load cycles at a frequency of one cycle every 3.5 s. During this period, the load dropped by 416 N as the crack grew from 3.94 mm at point A to 5.49 mm at point B. The test was terminated by applying a static overload, producing a final ductile fracture zone (Figure 18b). In the steepest region of the loading curve shown in Figure 18a (21,000 to 35,000 s), the slope is about −11 N/s.
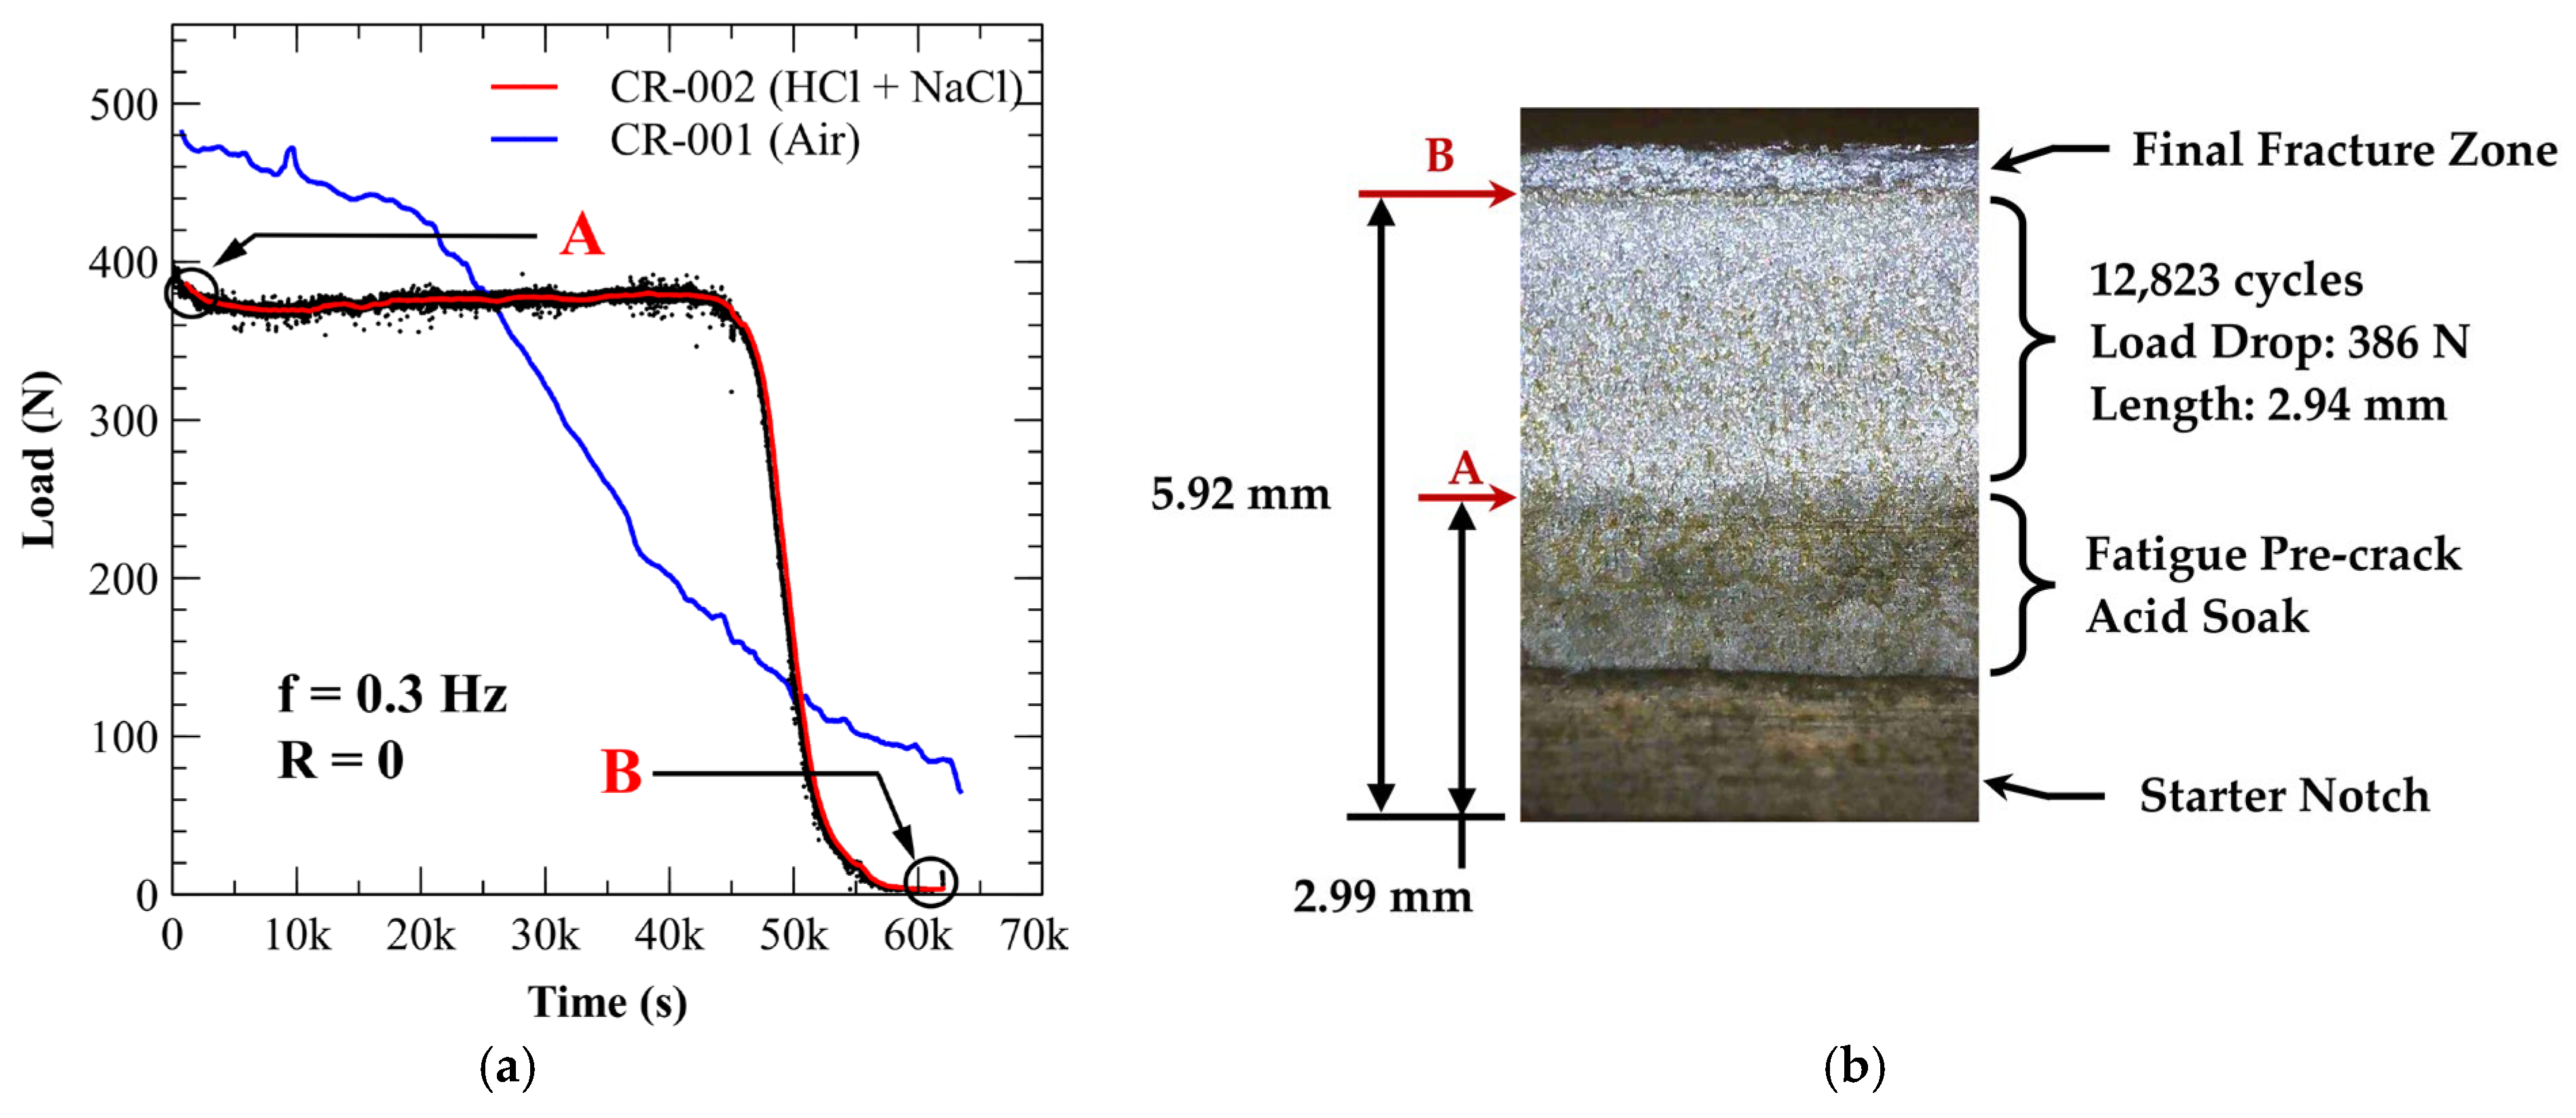
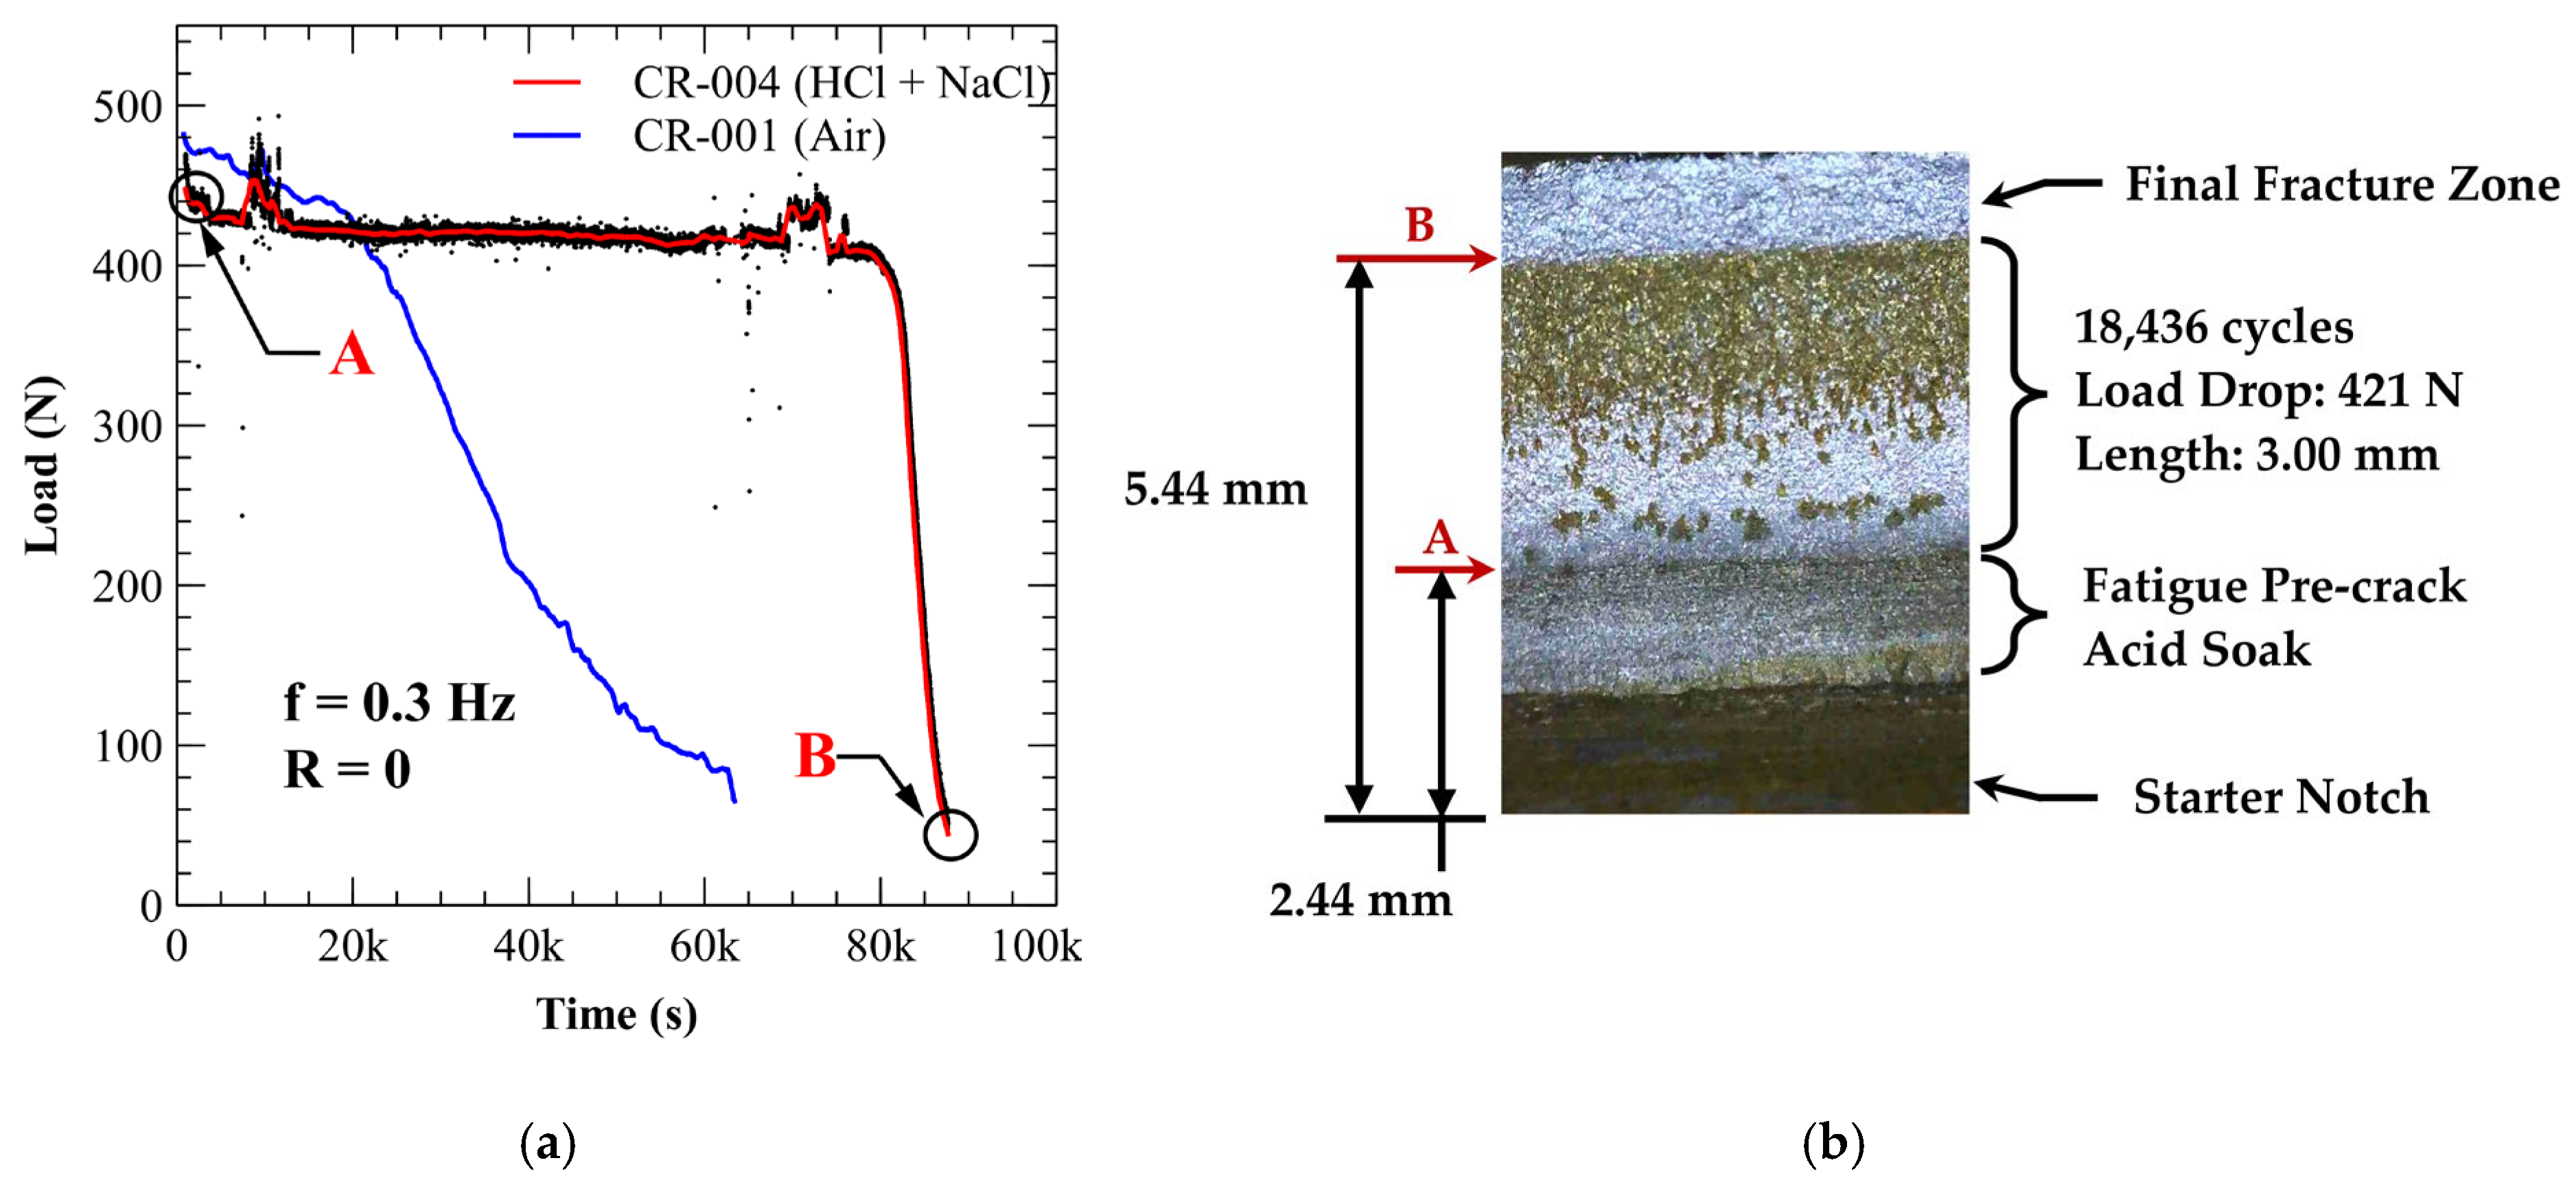
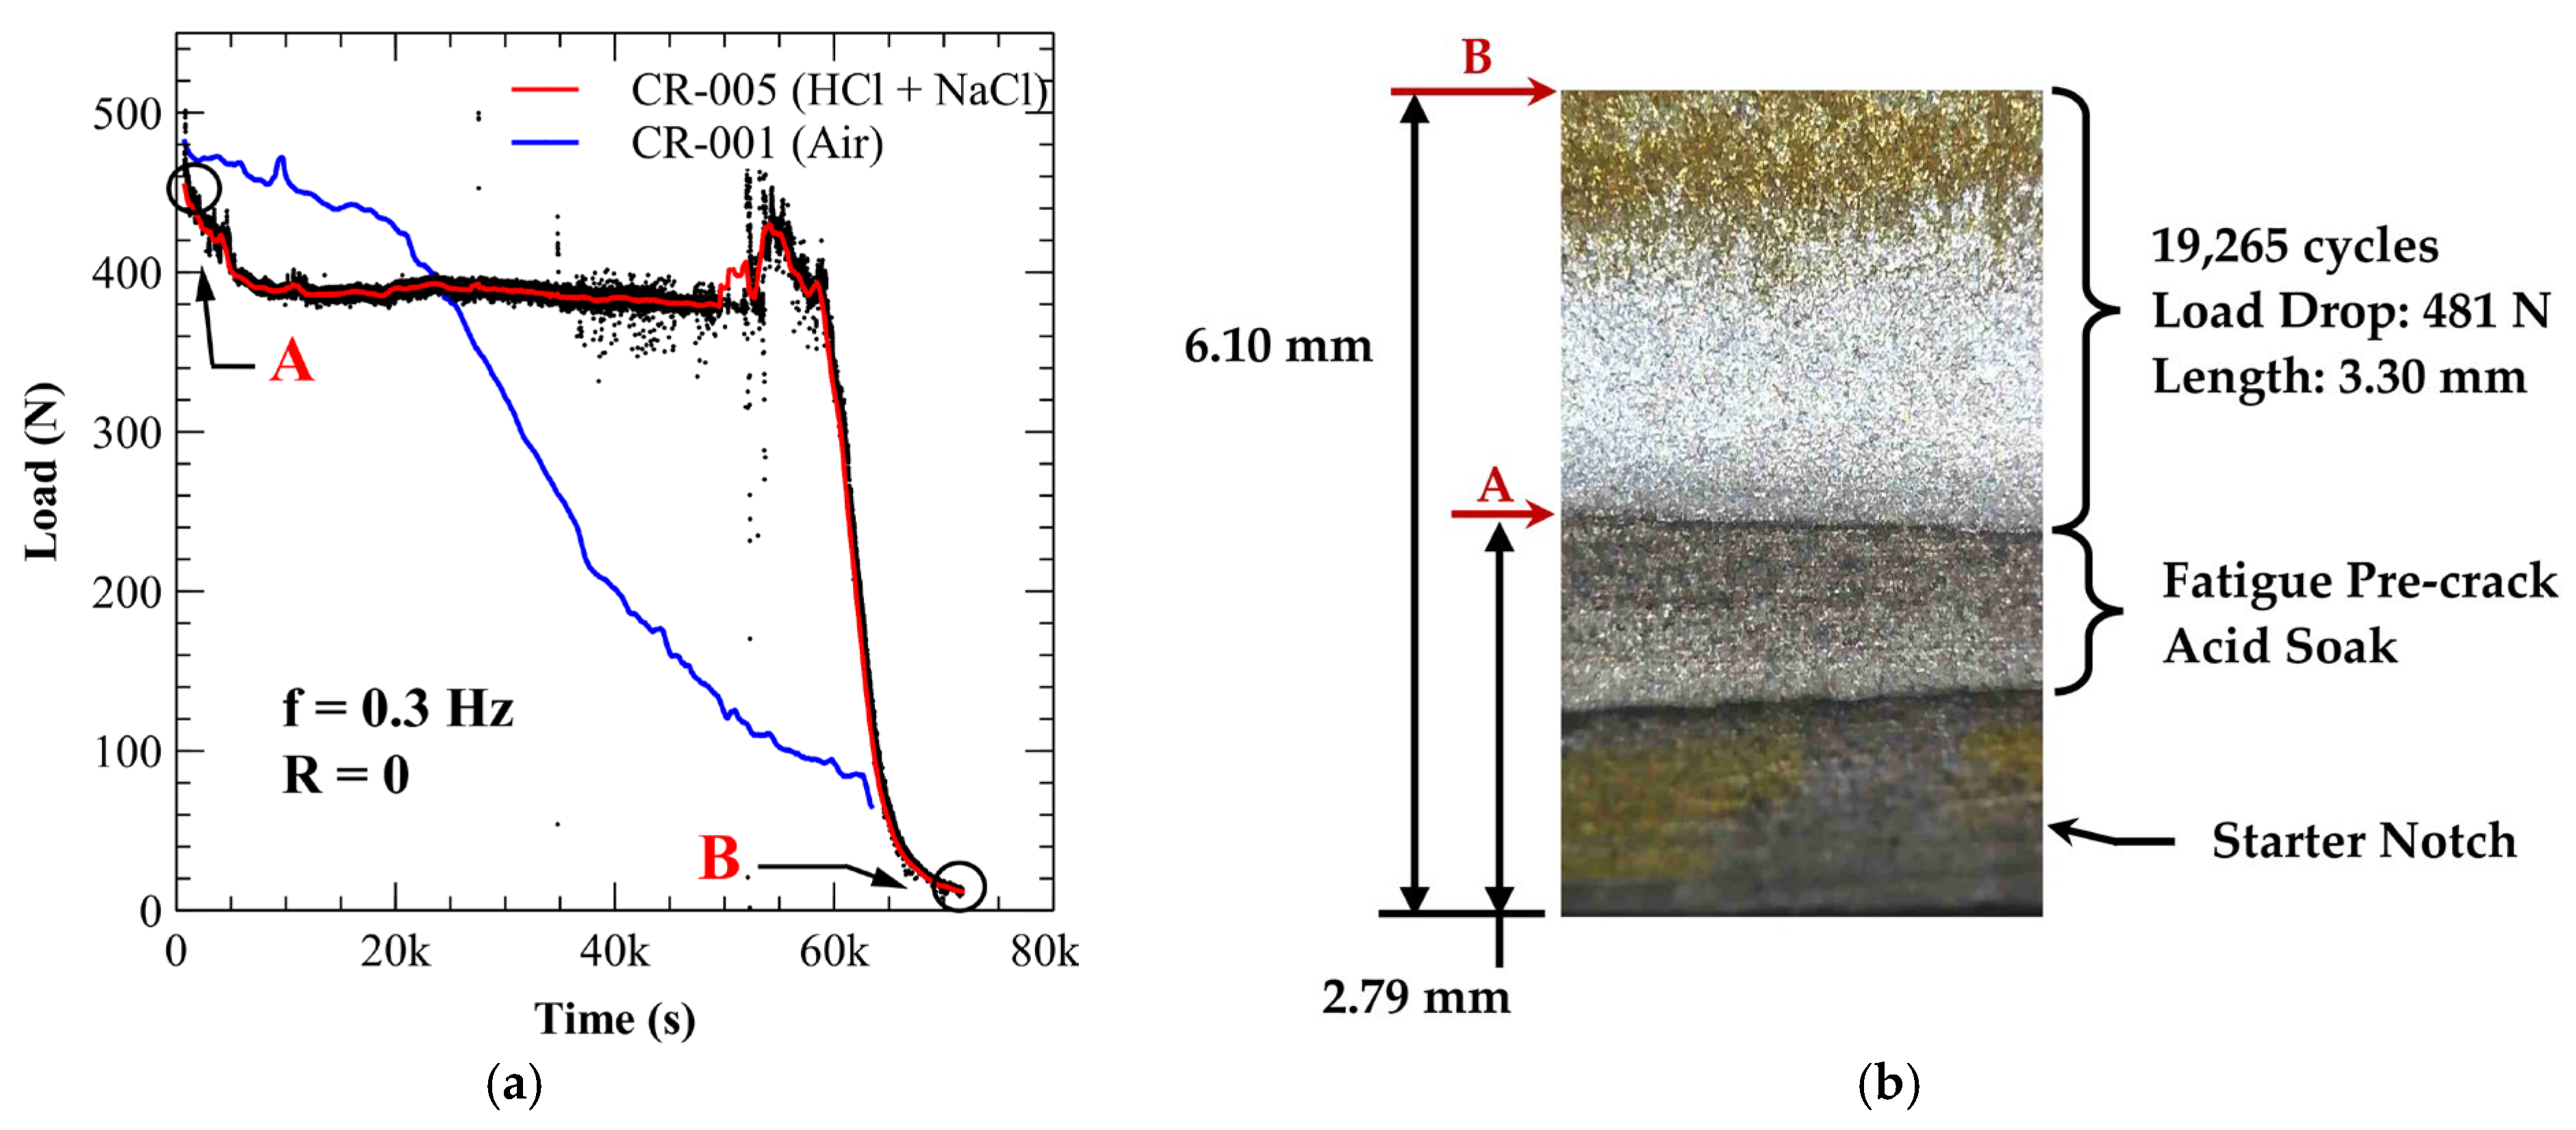
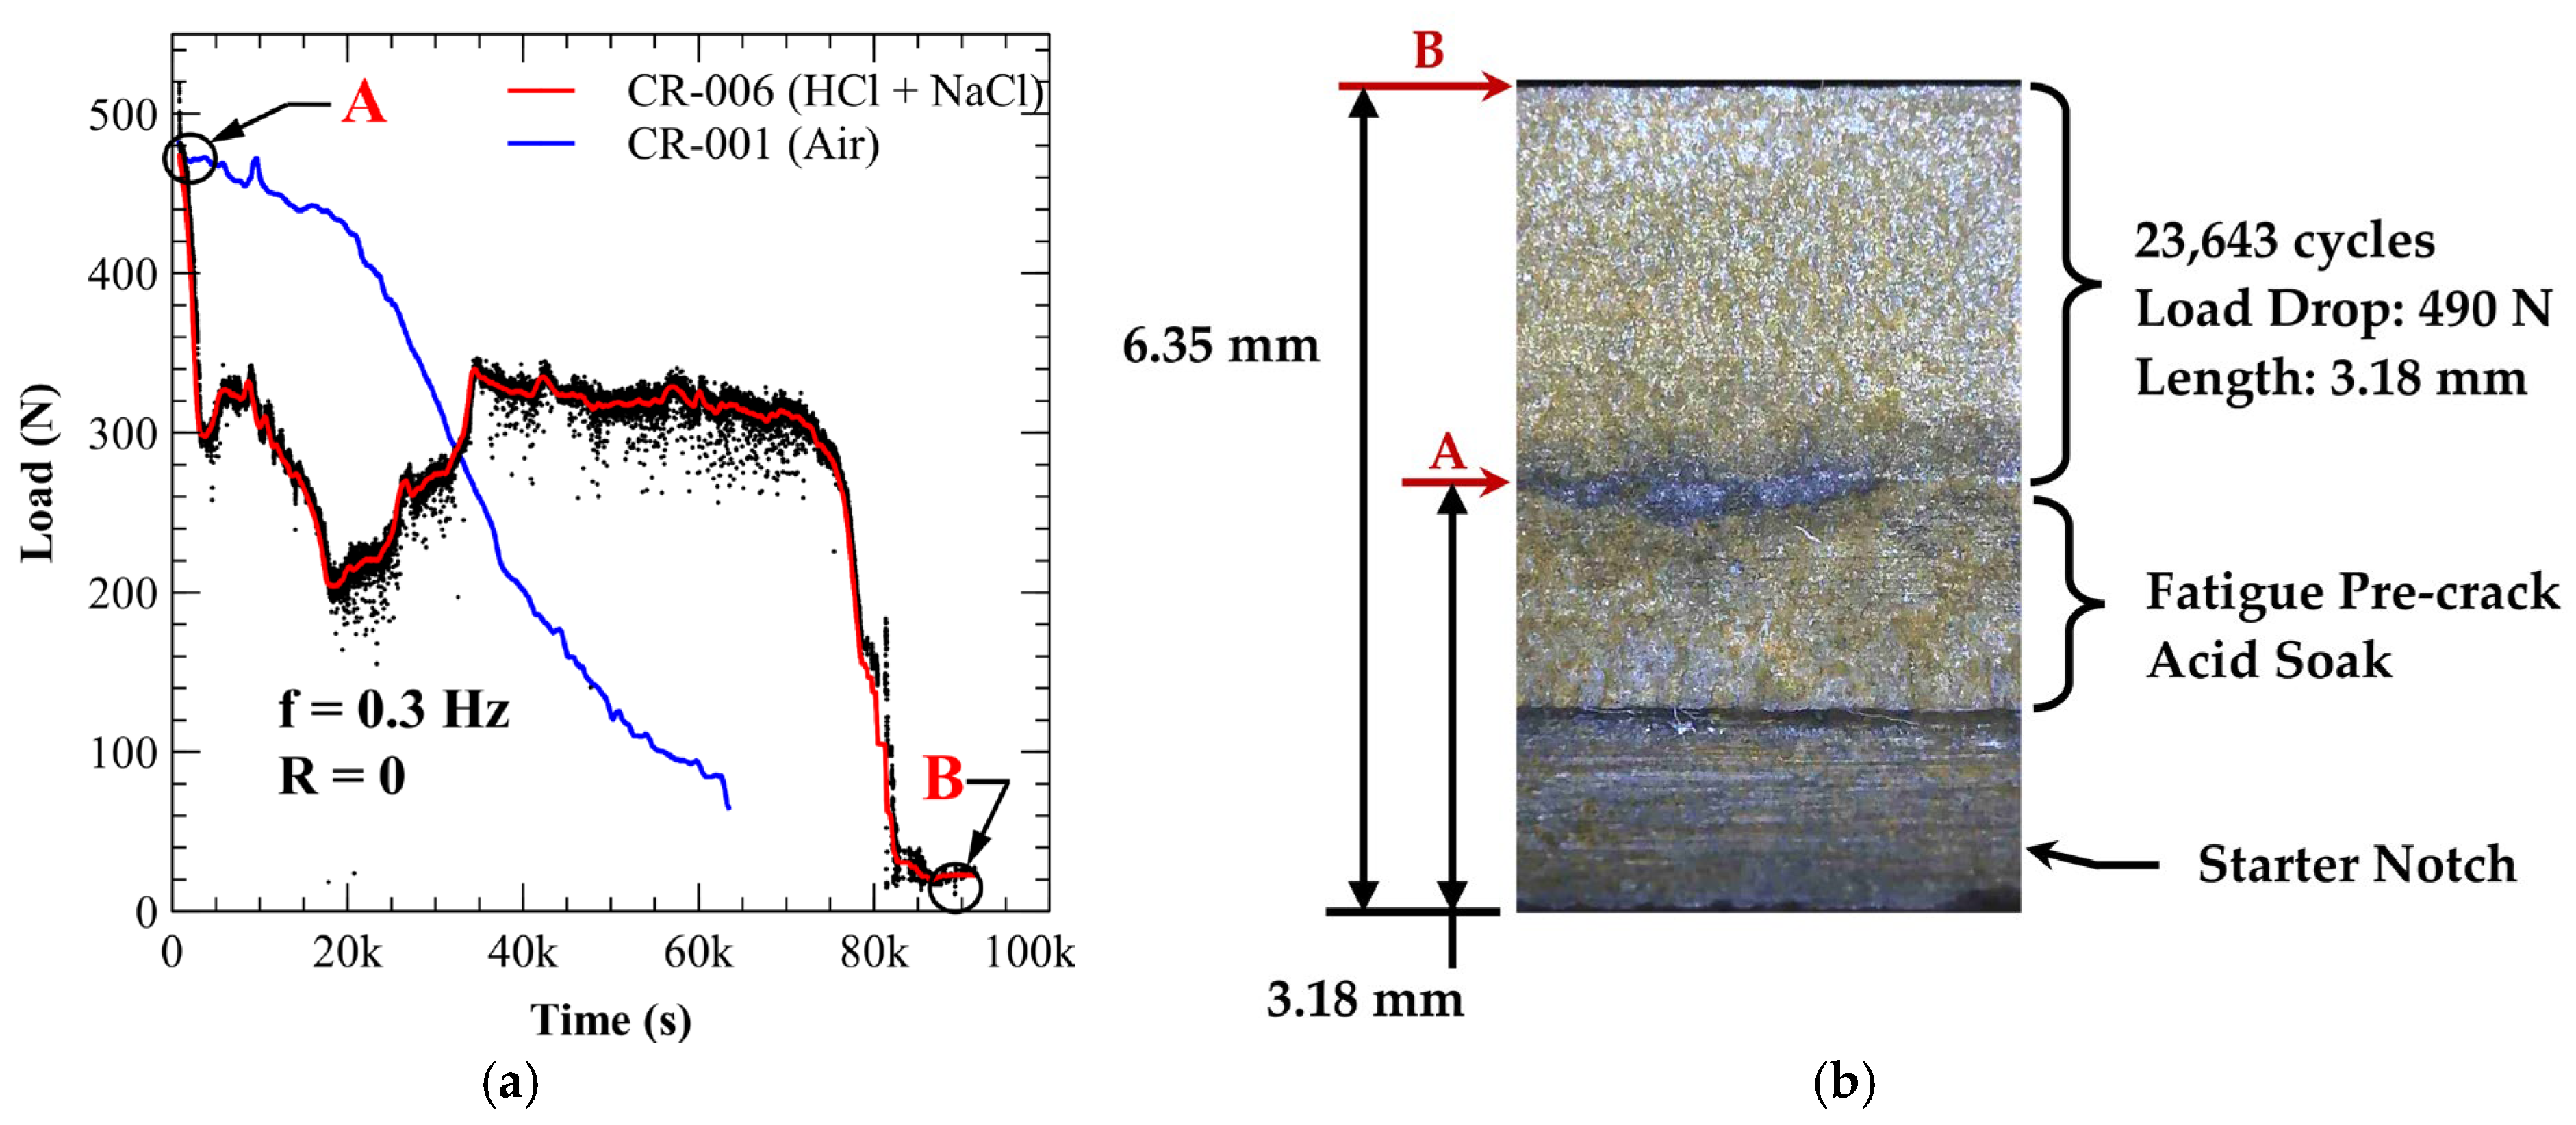
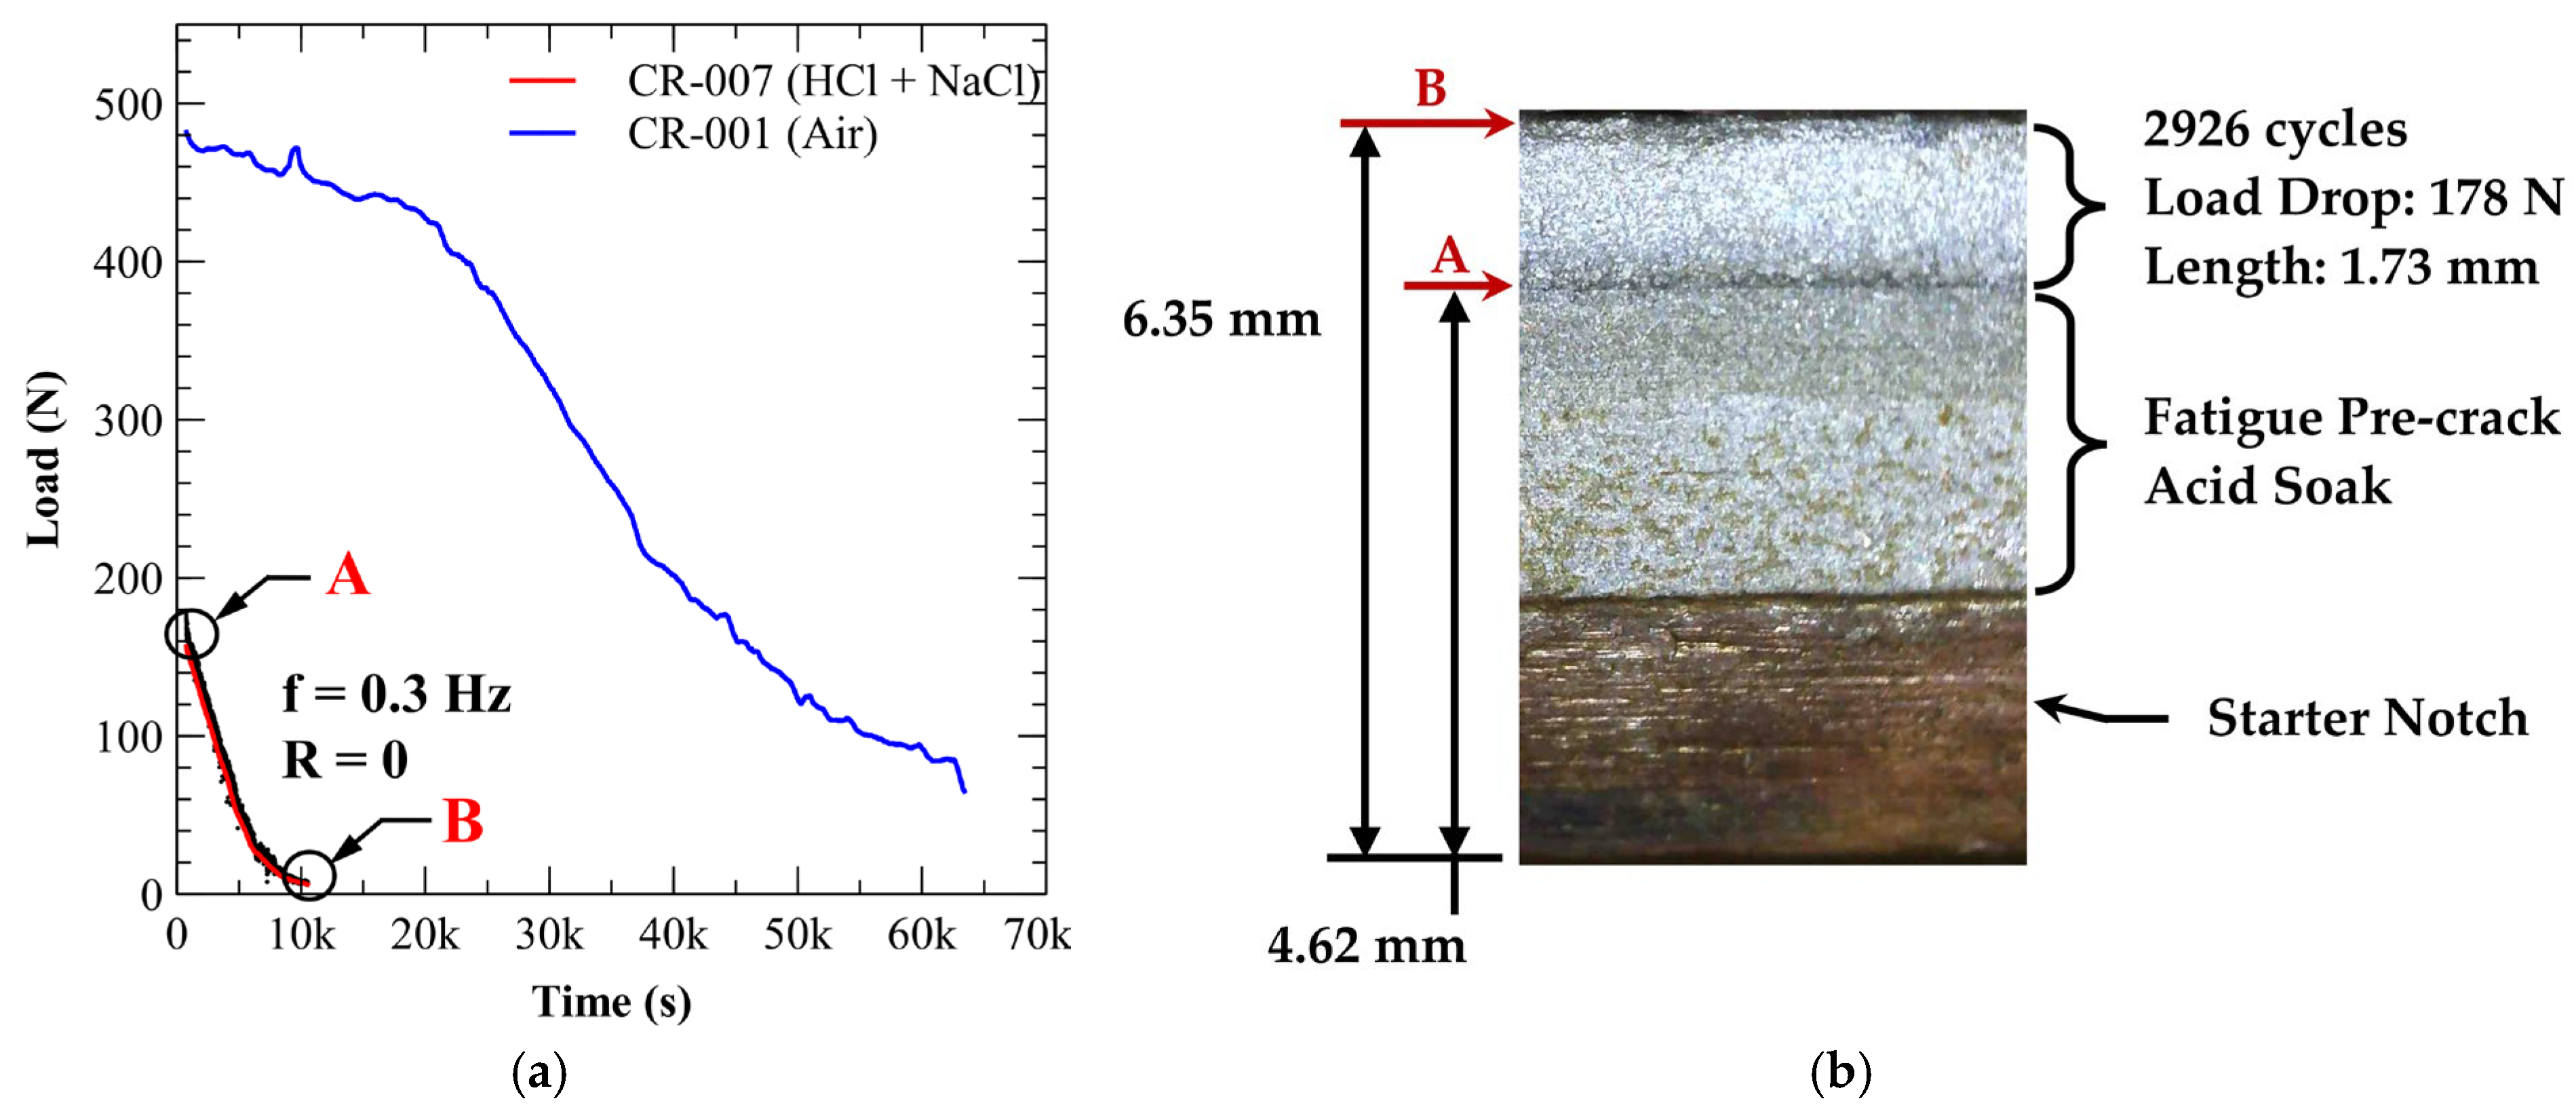
Once the baseline fatigue crack growth behavior was established under open-air conditions, five additional corrosion fatigue experiments were conducted using specimens immersed in a dilute acidic chloride solution (0.1 M HCl + 0.5 M NaCl) and included an air sparge for oxygen saturation. While minor variations in the initial load level were present among tests, the loading frequency and environmental conditions were held constant to enable meaningful comparisons. These experiments were designed to evaluate the influence of a corrosive environment on crack propagation behavior relative to the open-air baseline in 20 °C conditions. The results presented in this section highlight differences in crack growth trends, load drop behavior, and fracture surface characteristics between the open-air and corrosion fatigue conditions. Figure 19a, Figure 20a, Figure 21a, Figure 22a and Figure 23a show the peak load versus time, overlaid with a moving average smoothing curve, for each corrosion fatigue specimen (CR-002, CR-004, CR-005, CR-006, and CR-007) as compared to the open-air baseline specimen (CR-001 in Figure 18a). Corresponding macroscopic fractography of the failed corrosion fatigue specimens is shown in Figure 19b, Figure 20b, Figure 21b, Figure 22b and Figure 23b. As in previous tests, the initiation and completion of corrosion fatigue testing are identified as points A and B, respectively.
The pre-cracked regions of all five corrosion fatigue specimens were immersed in the dilute acidic chloride solution for a minimum of 10 h and up to 45.5 h prior to the onset of cyclic loading. This acidic pre-soak etched the pre-crack surface, facilitating accurate measurement of the initial crack length during post-test fractographic analysis. The dark regions observed in Figure 19b, Figure 20b, Figure 21b, Figure 22b and Figure 23b are attributed to the acidic soak, with a distinct dark line marking the location of the pre-crack tip. In contrast to the open-air fatigue test (CR-001), which exhibited relatively continuous crack growth as indicated by a steady load drop (Figure 18a), the pre-soaked specimens generally demonstrated an extended period of crack arrest (no load drop), followed by a region of rapid crack growth, a behavior clearly visible in Figure 19a, Figure 21a, and Figure 22a. The formation of corrosion products during pre-soaking likely contributed to crack closure effects that temporarily inhibited fatigue crack propagation in four of the five specimens (CR-002, CR-004, CR-005, and CR-006) [9]. The fifth specimen (CR-007), which had a substantially longer initial pre-crack, exhibited immediate crack growth upon the resumption of cyclic loading (Figure 23). In this case, the higher stress intensity associated with the longer crack length appeared to govern crack growth behavior, effectively overcoming any crack closure effects resulting from oxide formation during pre-soaking.
The duration of pre-soaking appeared to influence the extent of corrosion product formation at the crack tip prior to loading. This trend is evident when comparing Figure 18b, Figure 19b, Figure 20b, Figure 21b and Figure 22b at the initial crack tip location (denoted as Point A). Sample CR-002, which was pre-soaked for 10 h, exhibited the least amount of corrosion product accumulation at the crack tip. As the pre-soaking duration increased, more substantial oxide formation was observed. Samples CR-004 and CR-007, pre-soaked for 24.5 h and 25.75 h, respectively, showed a moderate degree of corrosion product buildup. The highest level of corrosion product formation occurred in samples CR-005 and CR-006, which were pre-soaked for 45.5 h and 33.5 h, respectively. These results indicate that longer pre-soaking times appeared to promote more extensive corrosion product development at the crack tip. This corrosion product buildup likely contributed to early crack closure behavior, delaying the onset of corrosion fatigue crack growth.
Specimens subjected to the longest pre-soaking durations (CR-005 and CR-006) exhibited a sharp and immediate load drop at the onset of cyclic loading, followed by eventual crack arrest (Figure 21a and Figure 22a). Of particular interest is the complex, multi-stage load response observed in Figure 22a. An initial sharp drop in load occurred over the first ~5000 s (1500 cycles) of testing, which may correspond to the disruption or displacement of loosely adhered corrosion products formed during the pre-soaking period. This is followed by a modest recovery in load, suggesting a transient phase of mechanical engagement potentially due to bridging of the crack faces by iron-based corrosion products such as oxides, hydroxides, or oxyhydroxides. Subsequently, a second, more gradual load drop occurred over the next ~10,000 s (3000 cycles), indicating continued degradation of the bridging material under repeated load cycling. Thereafter, the load exhibited a progressive Increase over the following ~19,000 s (5700 cycles), ultimately stabilizing at approximately 340 N. This plateau, during which crack growth was arrested, persisted for nearly 40,000 s (12,000 cycles), before rapid crack reinitiation and propagation to failure was observed. This behavior suggests that the formation, evolution, adhesion strength, and mechanical integrity of corrosion products may exhibit an observable influence on crack face bridging and closure mechanisms.
In agreement with the literature, reddish-brown corrosion products were observed along the open crack faces, consistent with the formation of ferric (oxyhydr)oxides such as FeOOH and Fe2O3 [32,33]. See Figure 19b, Figure 20b, Figure 21b, Figure 22b and Figure 23b. In contrast, a distinct dark bluish-black deposit was consistently observed at the crack tip (Point A in Figure 19b, Figure 20b, Figure 21b, Figure 22b and Figure 23b). This deposit was attributed to magnetite (Fe3O4), which likely formed under locally deoxygenated conditions during pre-soaking, where a stagnant electrolyte probably limited oxygen diffusion to the occluded crack tip [33,34]. Magnetite formation may have resulted from the direct oxidation of Fe(s) at the crack tip or from transformation from hematite (Fe2O3) depending on local electrochemical conditions [35]. The formation and evolution of corrosion products during pre-soaking and throughout testing is inherently complex. A variety of species (oxides, hydroxides, oxyhydroxides) may develop, each with distinct crystal structure, chemical composition, expansion coefficient, adhesion, and mechanical properties that may influence crack growth behavior [36,37,38]. These findings underscore the importance of careful control of environmental exposure in corrosion fatigue experiments and demonstrate the EAC fatigue test system’s ability to detect and characterize such effects. Given that real-world service conditions can vary widely, the ability to replicate realistic environmental exposure durations and loading histories enhances the accuracy and relevance of laboratory-based material performance assessments. This work demonstrates the EAC fatigue testing system’s sensitivity in evaluating environmentally assisted cracking behavior. Its capability to distinguish subtle variations in load response associated with pre-soaking conditions and corrosion product evolution are a valuable tool for advancing the understanding of corrosion fatigue mechanisms.
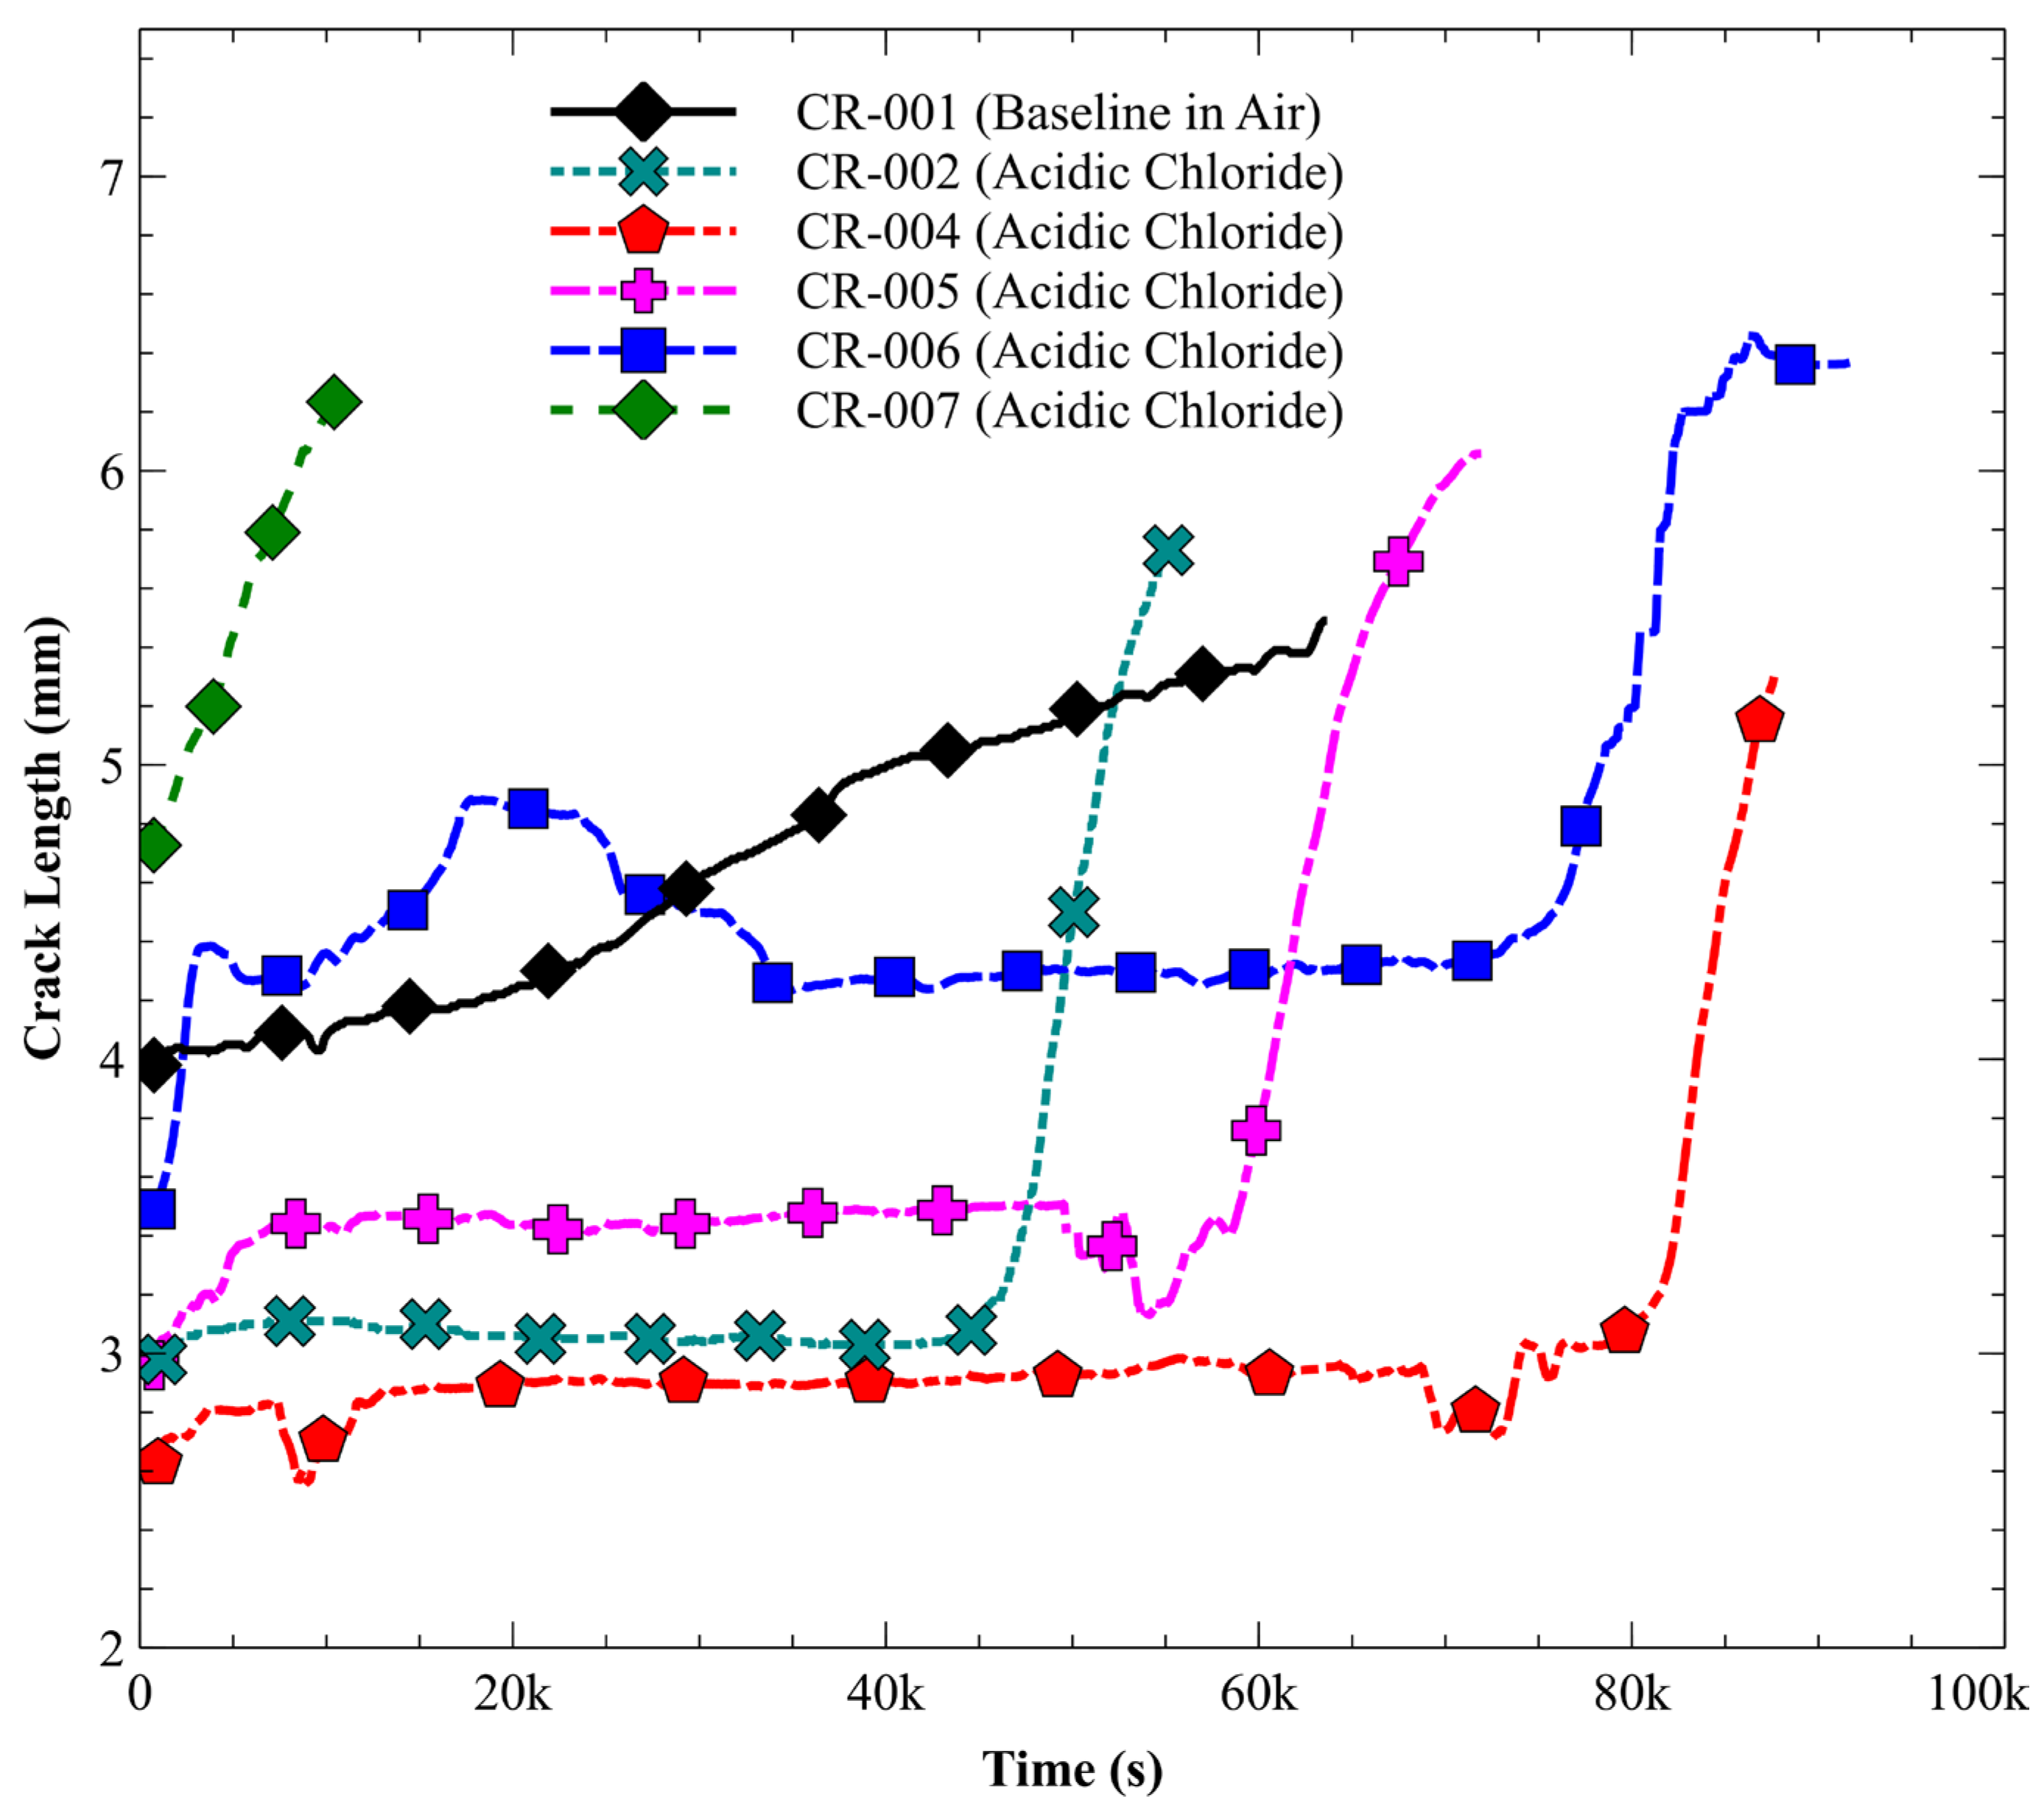
Using a compliance-based approach, the load drop measured for each carbon steel (SA-210-A1) specimen was used to compute crack length as a function of time. The resulting crack growth curves are presented in Figure 24. Specimens exposed to the corrosive environment (CR-002 through CR-007) exhibited significantly accelerated crack growth as compared to the open-air baseline specimen (CR-001), highlighting the pronounced effect of the acidic chloride solution on fatigue crack propagation. The influence of crack arrest behavior, attributed to corrosion product formation during the pre-soaking period, is also evident in the delayed growth response observed in all but one of the immersed specimens.
A tabulated summary of corrosion fatigue testing results for SA-210-A1 carbon steel is provided in Table 6. For each sample, the test environment, total load drop, measured crack growth, and the number of load cycles are reported. Where samples exhibited crack arrest behavior, the corresponding number of arrested cycles is also included. Based on this data, the average crack growth rate per cycle d a d N a v g , was calculated using the following relation:
d a d N a v g = a B a A N N d ,
where a A and a B are the crack lengths at the beginning and end of the corrosion fatigue test (points A and B in Figure 18, Figure 19, Figure 20, Figure 21, Figure 22 and Figure 23), N is the total number of load cycles, and Nd is the number of cycles during which crack growth was arrested (i.e., delayed crack propagation).
The specimen tested in open air (CR-001) exhibited an average crack growth rate of 8.6 × 10⁻⁵ mm/cycle. In contrast, specimens tested in the acidic chloride environment (0.1 M HCl + 0.5 M NaCl) showed significantly higher average growth rates, with an average value of 7.93 × 10⁻⁴ mm/cycle (±8.77 × 10⁻⁵ for a 90% CI). This nearly order-of-magnitude increase highlights the significant influence of the corrosive environment in accelerating fatigue crack propagation which was effectively observed with the EAC fatigue testing system.
The corrosion fatigue testing of SA-210-A1 carbon steel presented in this study demonstrated a clear dependence on environmental exposure conditions, with pre-soaking duration influencing corrosion product formation at the crack tip and contributing to early-stage crack closure. The presence of an acidic chloride environment resulted in a substantial increase in average crack growth rates compared to open-air testing, emphasizing the aggressive role of the environment in corrosion fatigue degradation. These findings validate the sensitivity of the EAC fatigue testing system and support its effectiveness in investigating environmentally assisted crack growth mechanisms in metallic materials.

3.4.2. PMMA (Xylene Exposure)

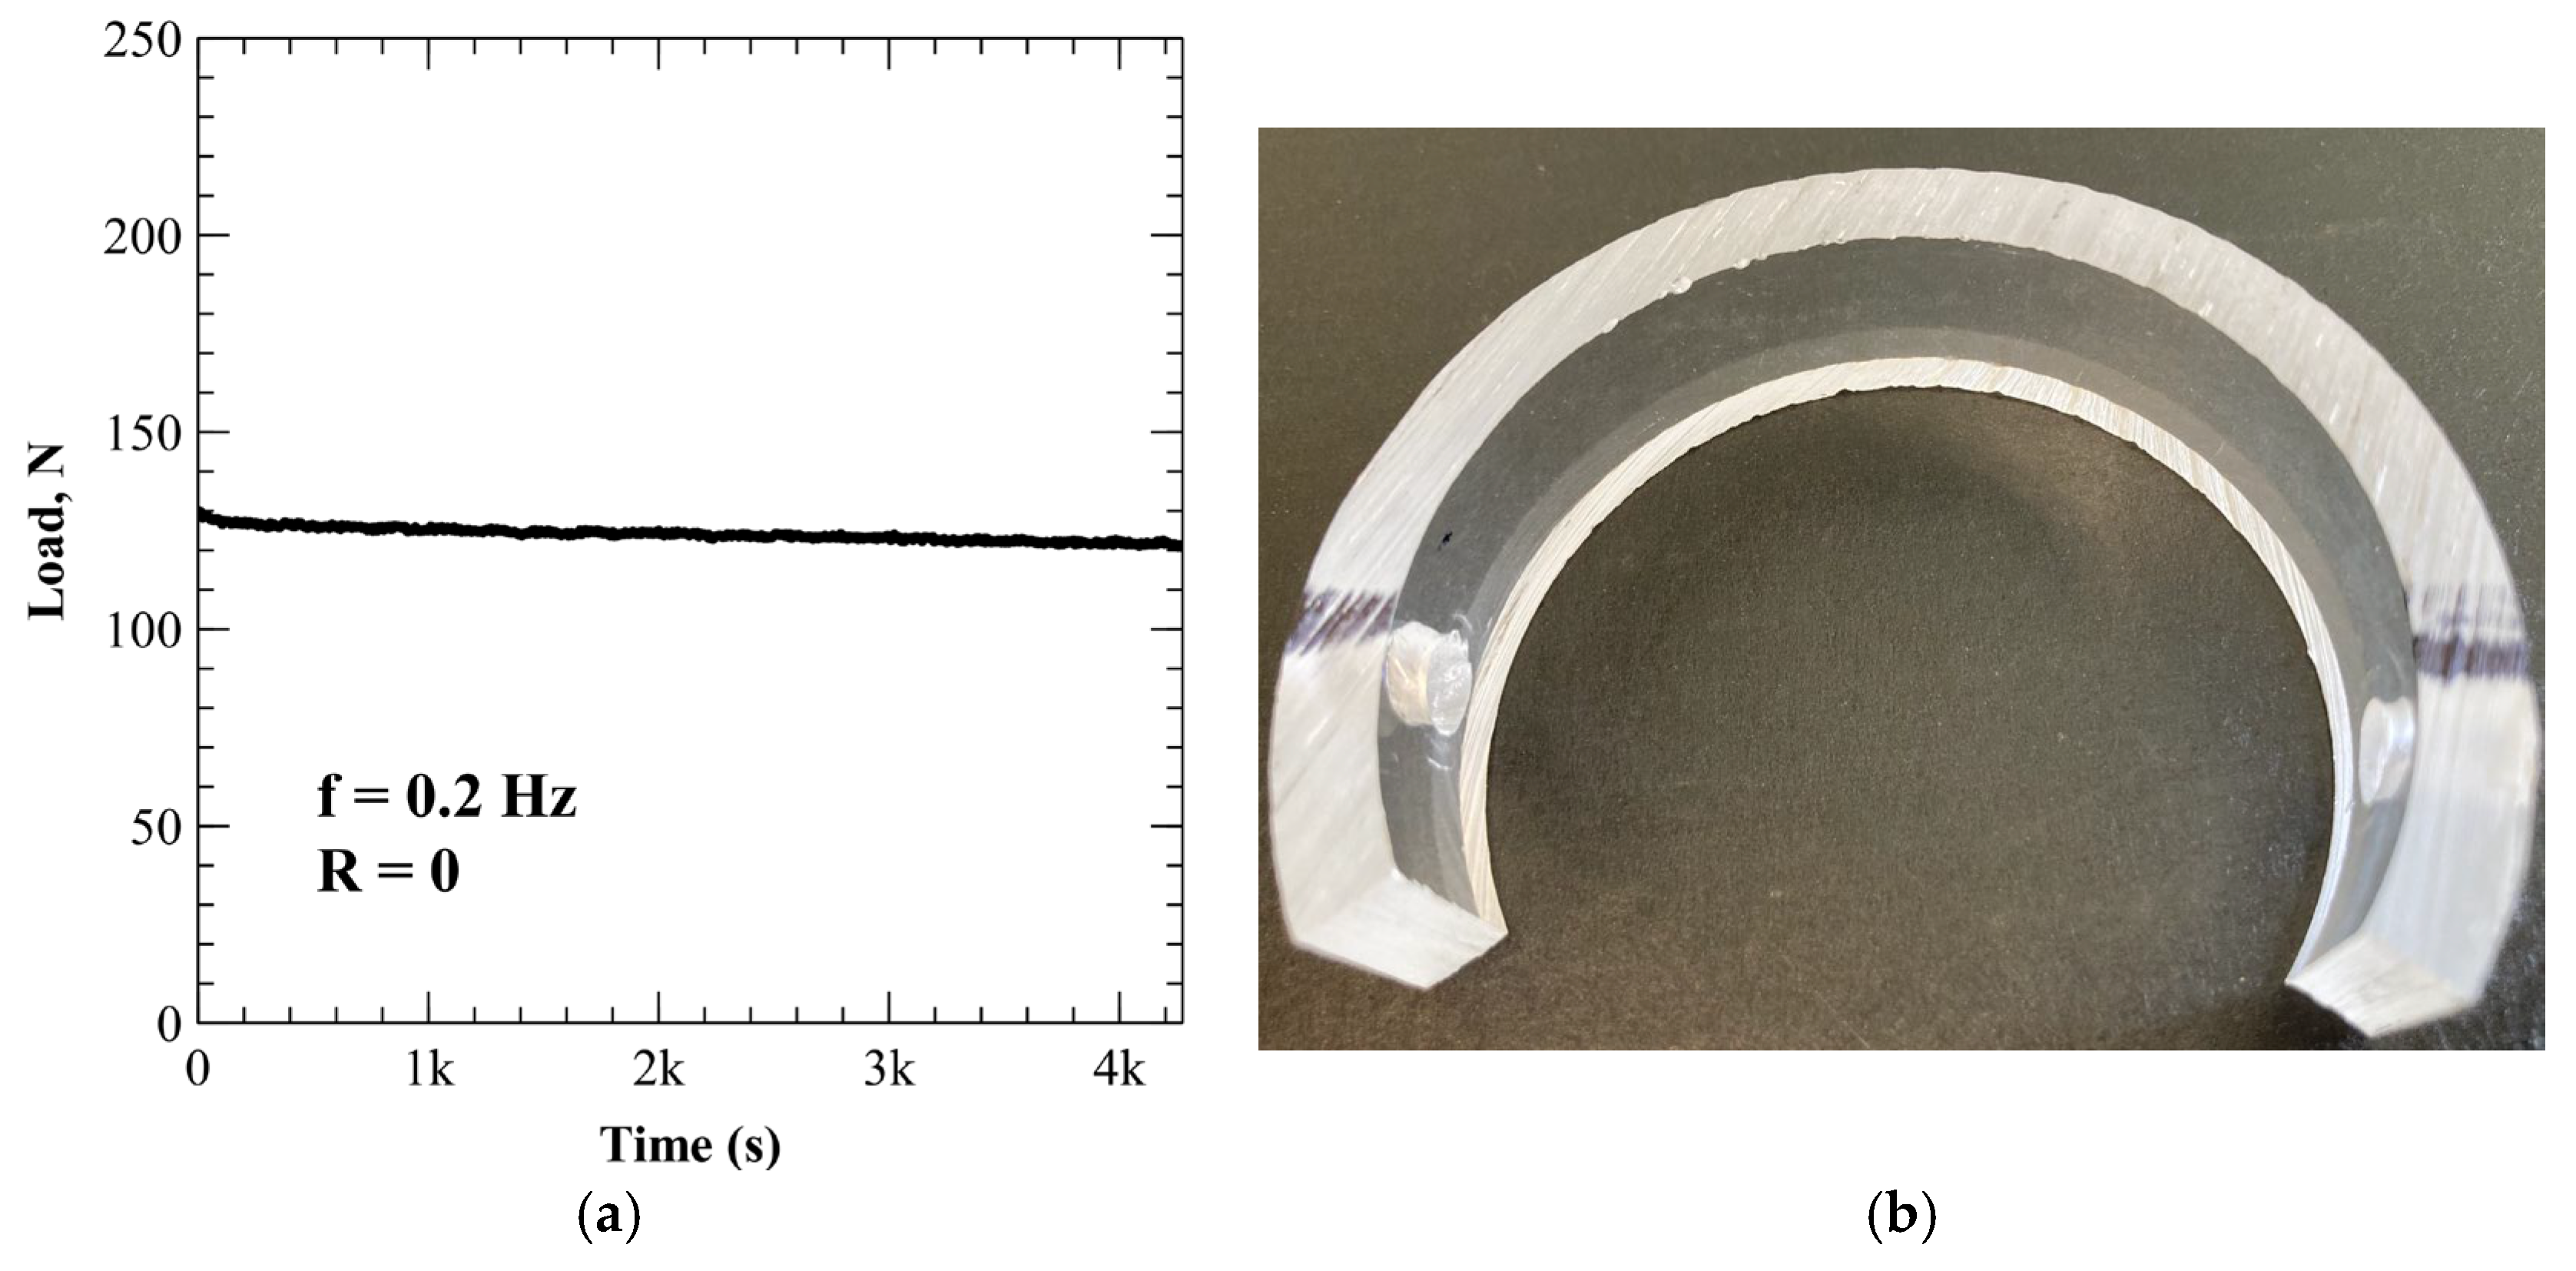
A baseline assessment of environmentally assisted cracking in PMMA was established by subjecting a C-ring specimen to cyclic loading in open air at a frequency of one cycle every 5.5 s. Figure 25a presents the load response over the full test duration of 4275 s. As shown in the figure, a total load drop of 9 N occurred during the test. No visible cracking was observed at the conclusion of the experiment (Figure 25b). The small and consistent slope in the load–time curve suggests that cyclic mechanical loading may have induced localized heating in the polymer, potentially leading to minor thermal softening and material weakening. Alternatively, this slope may be associated with wear at the load contact points. The cyclic softening response is consistent with previously reported behavior for PMMA under cyclic mechanical loading [39,40].
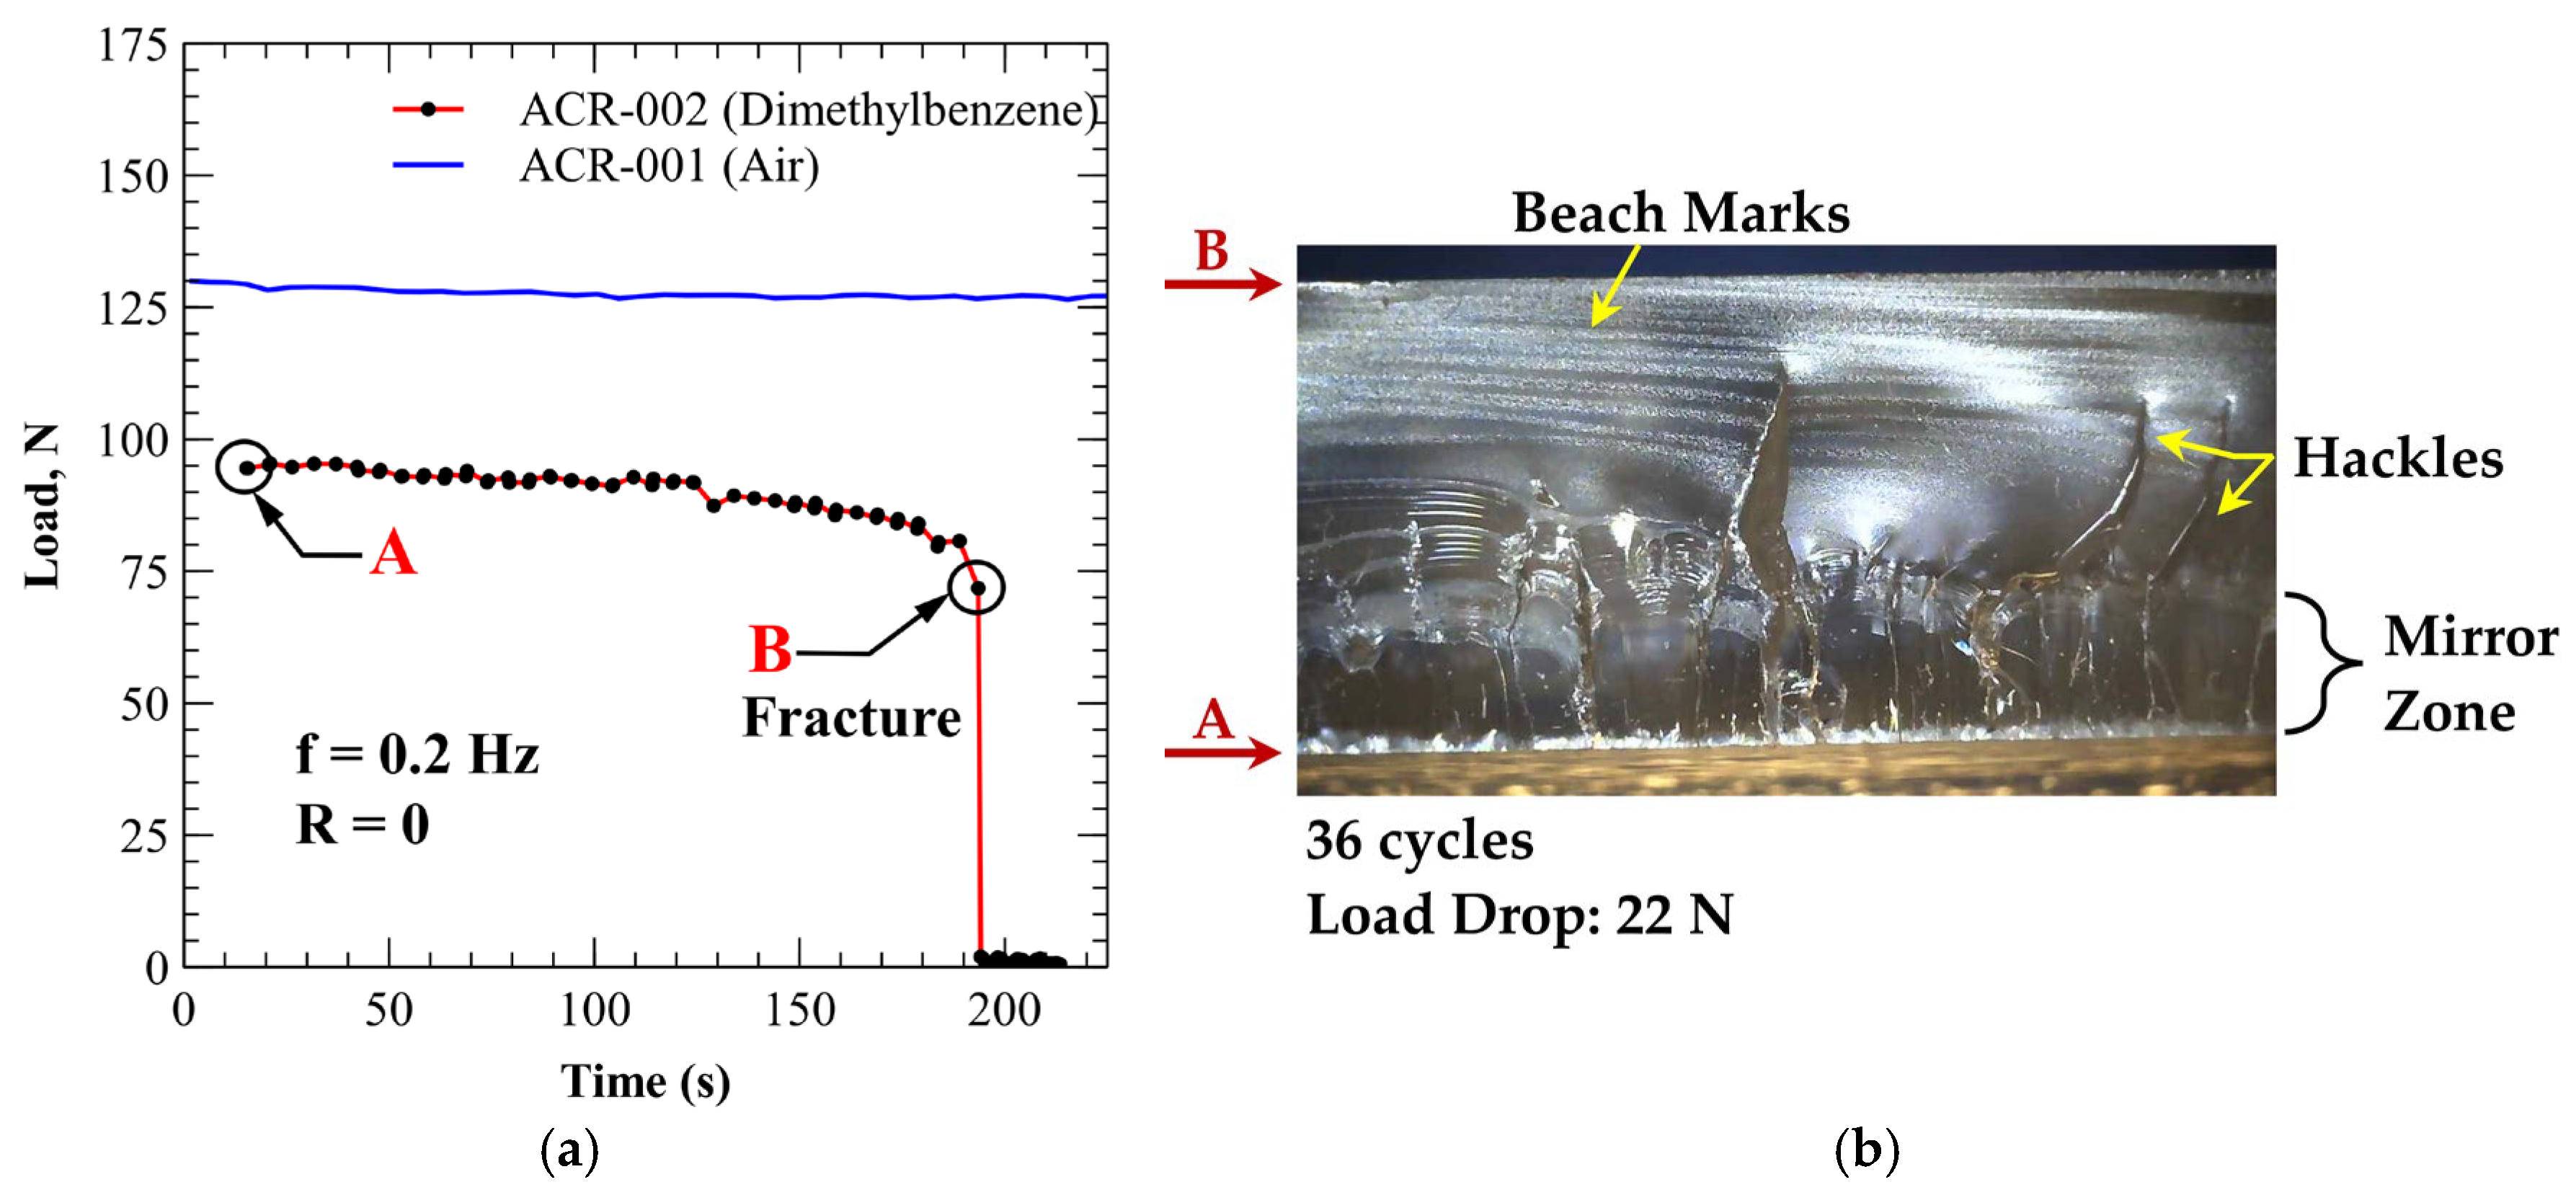
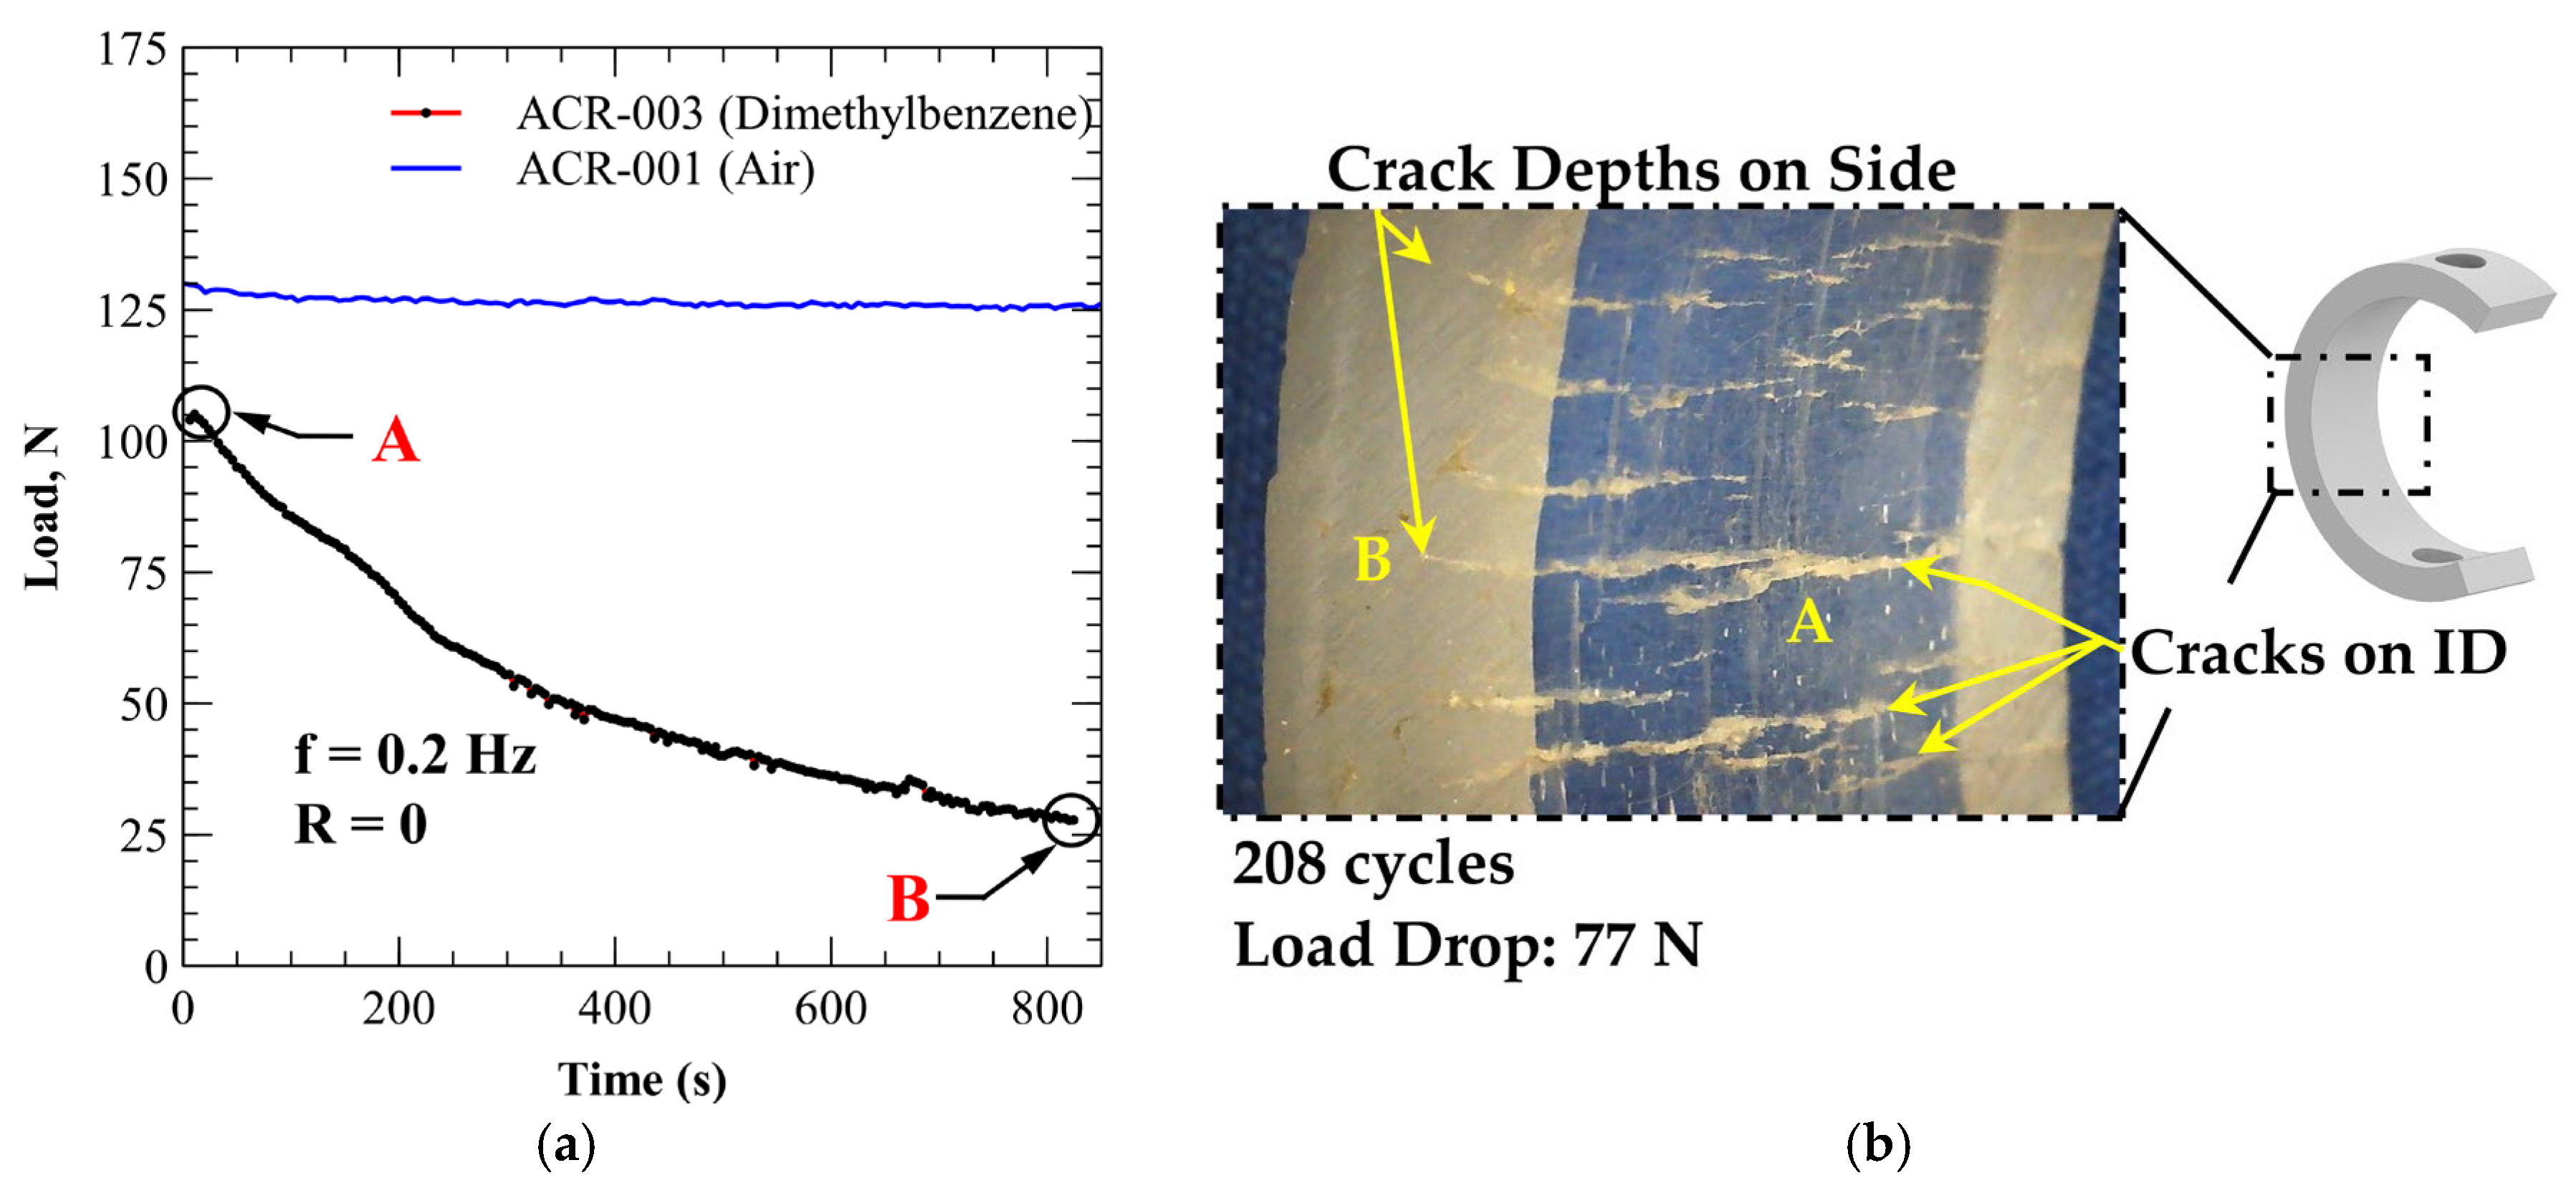
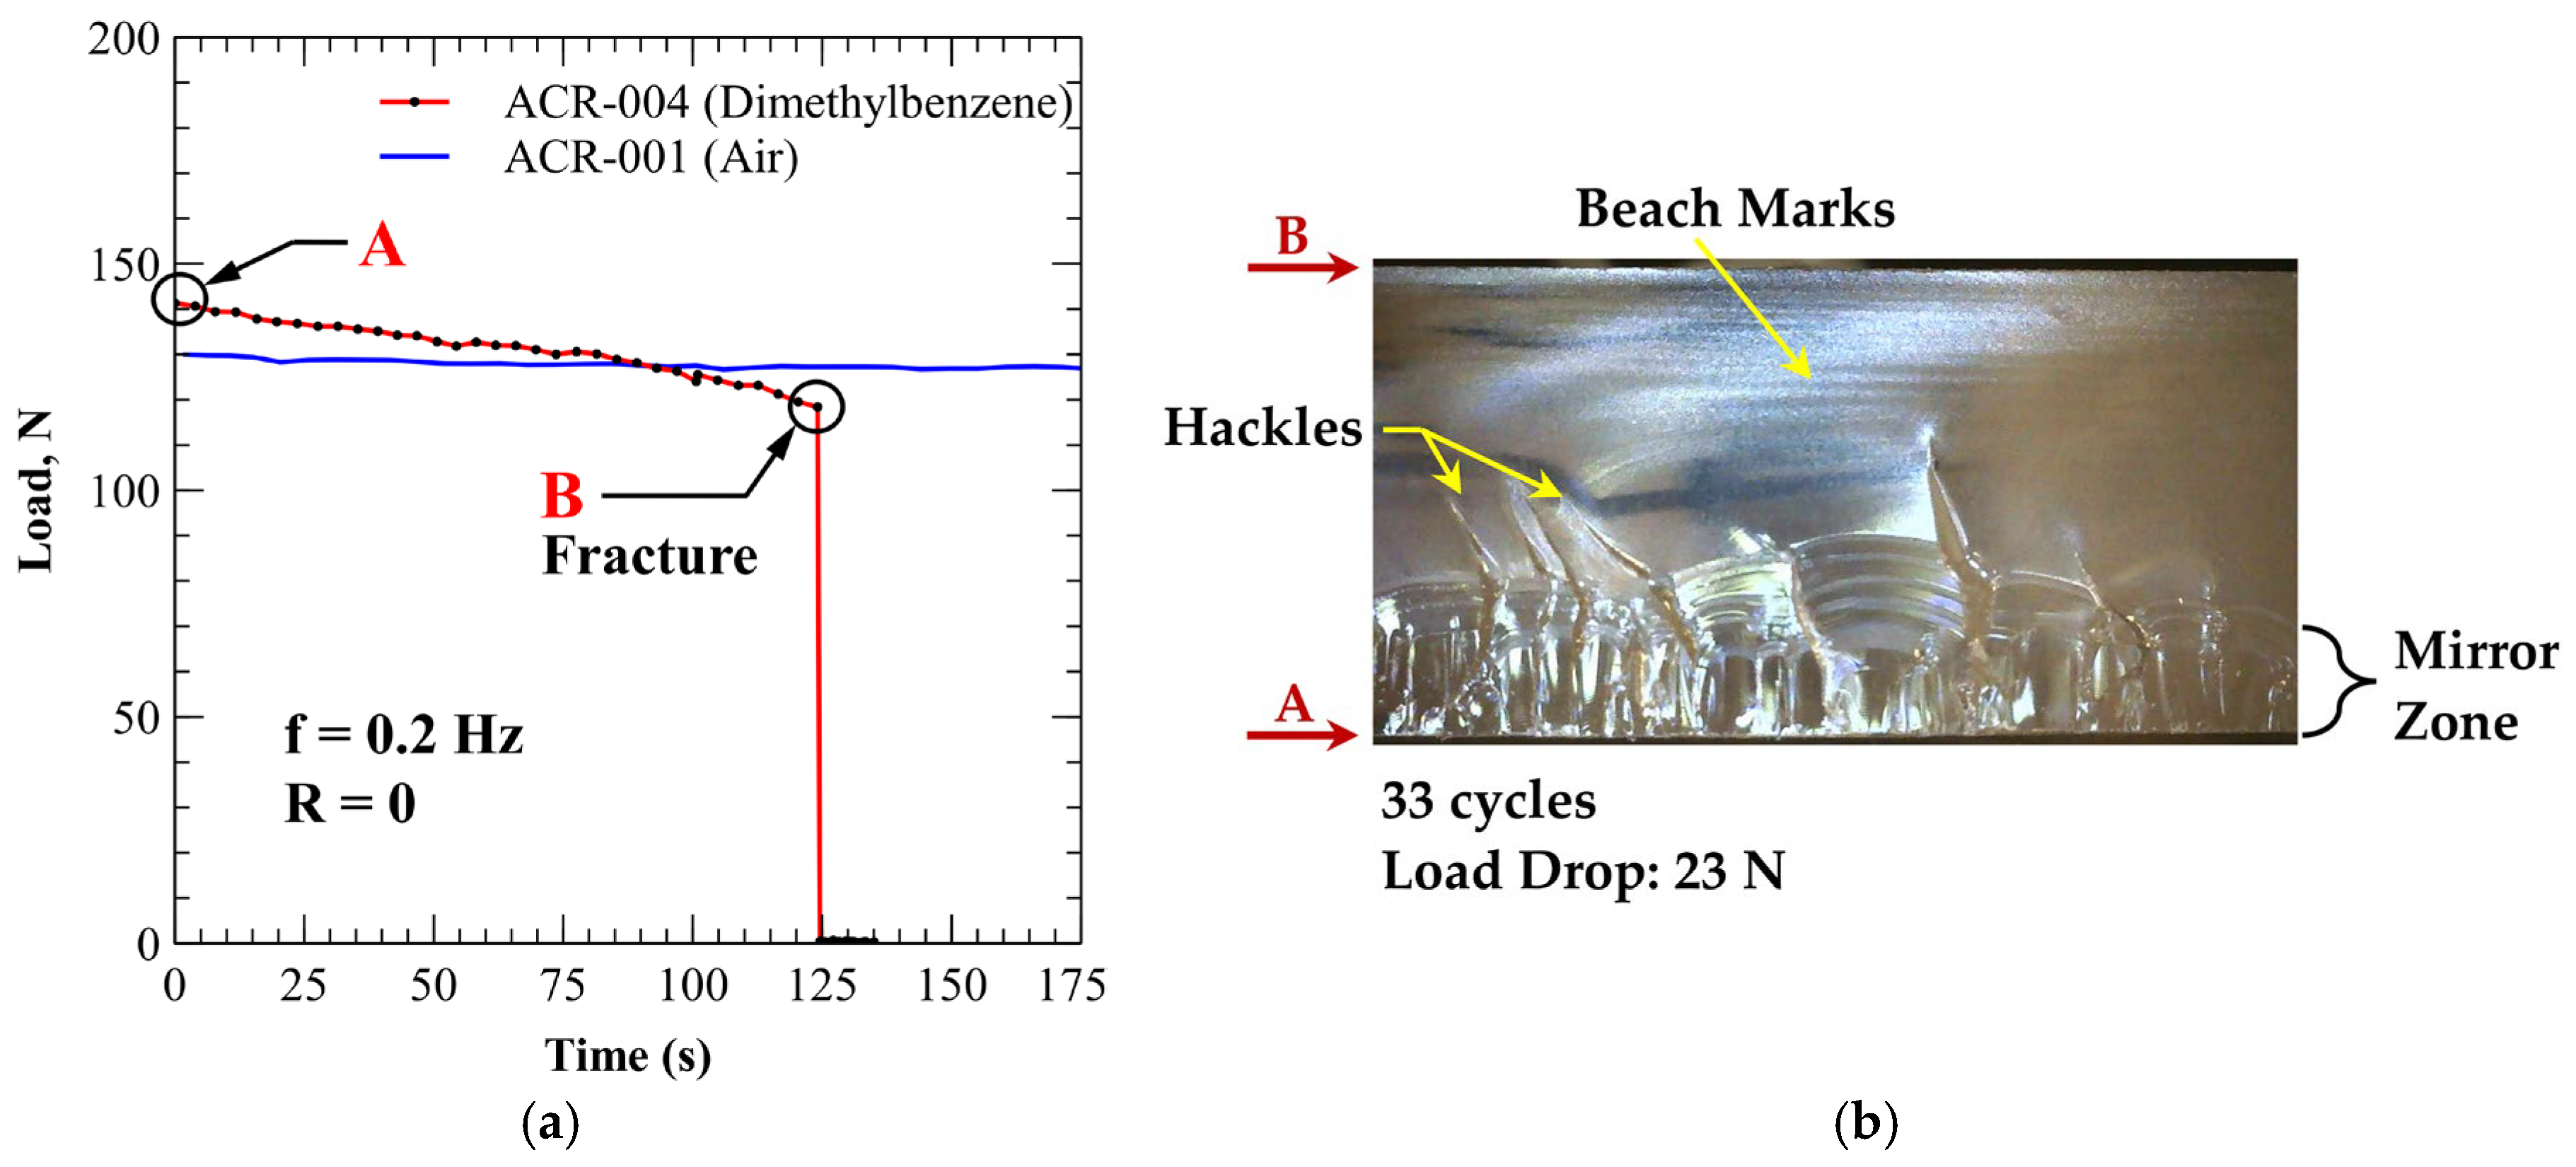
After establishing the open-air baseline, five additional tests were conducted using PMMA C-ring specimens immersed in xylene. Figure 26, Figure 27 and Figure 28 provide representative load drop responses along with post-test images of crack morphology and fracture surfaces for specimens ACR-002, ACR-003, and ACR-004, respectively. The highly aggressive xylene environment led to the rapid initiation and propagation of multiple cracks on the inner surface of the specimens under cyclic loading. Crack growth rates were greatest in regions corresponding to the highest tensile stresses, consistent with the expected stress distribution in the C-ring geometry. Figure 27b shows the distribution and depth of cracks around the region of highest stress. Final fracture consistently occurred on the inside surface at the center of the C-ring, where the tensile stresses are at their maximum. Figure 26b and Figure 28b show representative post-test fracture surfaces of failed specimens ACR-002 and ACR-004. Examination of these surfaces revealed a complex sequence of features. Crack initiation along the edge at point A (See Figure 26b and Figure 28b) exhibited numerous flat, transparent segments resembling a mirror zone, suggesting multiple initiation sites or unstable crack advance during early loading when stress was highest. From this region, several pronounced, gap-like features extended in the direction of crack growth. These sharp discontinuities are characteristic of macroscopic hackle marks that likely formed during high-energy dissipation due to localized plastic deformation during cycling [41]. The final regions of the fracture surfaces (Figure 25b and Figure 28b) exhibited a smoother texture with visible beach marks extending to the final fracture edge at point B in each case. Based on the load versus time plots (Figure 26a and Figure 28a), crack propagation proceeded at a relatively steady rate, with no indication of major shifts in crack growth behavior. The presence of numerous cracks of differing lengths along the high-stress inner surface supports the interpretation that the aggressive solvent environment facilitated widespread crack initiation, resulting in diffuse, concurrent crack growth rather than the propagation of a single dominant crack.
Table 7 summarizes the PMMA EAC fatigue testing results, including total load drop, number of cycles, and average load drop rate (N/cycle) for each of the seven specimens. ACR-001, tested in open air, exhibited minimal load loss over 855 cycles, with an average load drop rate of 0.01 N/cycle. In contrast, specimens exposed to pure xylene (ACR-002, ACR-004, and ACR-007) or a 1:1 xylene/ethanol mixture (ACR-003, ACR-005, and ACR-006) demonstrated substantially accelerated degradation, with load drop rates ranging from 0.19 to 0.69 N/cycle. The most severe responses were observed in ACR-004 and ACR-002, which failed within 33 and 36 cycles, respectively. Specimens exposed to the xylene/ethanol mixture generally endured longer-duration tests but still exhibited extensive and diffuse surface cracking, along with significantly higher load drop rates compared to the open-air baseline. Although only three specimens were tested per environment, the observed trends were consistent and pronounced, demonstrating the system’s ability to differentiate between subtle environmental effects. Future work will incorporate larger sample sizes to enable more rigorous statistical evaluation of EAC fatigue performance across varying environments.

4. Conclusions

This study highlights the design, validation, and application of a cost-effective, automated materials testing system for evaluating environmentally assisted cracking (EAC) under controlled laboratory conditions. The test system includes electromechanical actuation of cyclic mechanical loading, real-time load cell force measurement, and closed-loop environmental regulation of temperature and pH. A compliance-based method, established using finite element analysis, was used to track crack growth during testing. Environmental control loops were assessed using a step response method. The temperature control loop demonstrated a maximum steady-state error of 1.3% at the 60 °C setpoint, while the pH loop showed a maximum deviation of 0.42% at the 9.5 pH setpoint. Response time from a stable 7.00 pH to a pH 4.00 buffer solution was approximately 4.15 s, with the final output stabilizing at pH 3.98 (0.5% error), confirming both accuracy and responsiveness.
System functionality was demonstrated through fatigue testing of SA-210-A1 carbon steel in an acidic chloride solution and PMMA in xylene-based solvents. The results confirmed that the corrosive environment significantly accelerated crack growth in steel, with pre-soaking duration and the formation and evolution of iron (oxyhdr)oxides influencing crack growth behavior. For PMMA, immersion in xylene and xylene/ethanol mixtures resulted in widespread and rapid surface cracking, often leading to rapid fracture. The system was able to distinguish environmental severity based on differences in load drop response, confirming its utility for comparative EAC studies.
This work addresses a critical need for a cost-effective and versatile platform capable of simulating EAC behavior under service-like conditions, with integrated mechanical and environmental control. The system’s demonstrated sensitivity, repeatability, and stability make it well-suited for mechanistic studies and material degradation research relevant to safety-critical applications. Future work will make use of this system to evaluate boiler tubes and other pressure boundary materials exposed to representative field environments, with a focus on assessing the effectiveness of mitigation strategies such as electrochemical surface treatments. Recommended enhancements to the system include implementation of gas sparge control to regulate dissolved gas content, enabling more precise representation of field-relevant gas concentrations, such as dissolved oxygen concentration, and the integration of a rotational position sensor (e.g., rotary encoder) on the cyclic drive motor shaft to enable load cycle-synchronized data acquisition rather than simple time-based data collection.

Supplementary Materials

The following supporting information can be downloaded at https://www.mdpi.com/article/10.3390/app151810252/s1. Software S1: Python application software for control and data acquisition of the EAC fatigue testing system.

Author Contributions

Conceptualization, J.A.H. and H.E.C.; methodology, J.A.H. and H.E.C.; software, J.A.H. and S.A., formal analysis, J.A.H. and H.E.C.; data curation, J.A.H.; writing—original draft preparation, J.A.H.; writing—review and editing, J.A.H., H.E.C., and S.A.; visualization, J.A.H.; supervision, H.E.C.; funding acquisition, H.E.C. All authors have read and agreed to the published version of the manuscript.

Funding

This research was funded by the Louisiana Board of Regents Support Fund R&D Program under Industrial Ties Research Subprogram (ITRS) reference number 20130013610.

Institutional Review Board Statement

Not applicable.

Informed Consent Statement

Not applicable.

Data Availability Statement

The original contributions presented in this study are included in the article/Supplementary Material. Further inquiries can be directed to the corresponding author.

Acknowledgments

The authors gratefully acknowledge the endorsement and financial support provided for this work by Southwestern Electric Power Co., an American Electric Power company and LA New Product Development Team, LLC. During the preparation of this manuscript, the authors used ChatGPT (OpenAI, GPT-4, 2025, San Francisco, CA, USA) for the purposes of drafting and refining Python code for data acquisition, signal processing, and environmental control functionality, as well as for grammar checking, technical editing, and improving the clarity of the manuscript text. The authors have reviewed and edited the output and take full responsibility for the content of this publication.

Conflicts of Interest

The authors declare no conflicts of interest.

References

  1. Jones, D. Principles and Prevention of Corrosion, 2nd ed.; Prentice-Hall: Upper Saddle River, NJ, USA, 1996. [Google Scholar]
  2. API RP 571; Damage Mechanisms Affecting Fixed Equipment in the Refining Industry. 3rd ed. American Petroleum Institute: Washington, DC, USA, 2020.
  3. Stephens, R.; Fatemi, A.; Stephens, R.; Fuchs, H. Metal Fatigue in Engineering, 2nd ed.; John Wiley & Sons: New York, NY, USA, 2001. [Google Scholar]
  4. Guo, Y.; Shao, Y.; Gao, X.; Li, T.; Zhong, Y.; Luo, X. Corrosion Fatigue Crack Growth of Serviced API 5L X56 Submarine Pipeline. Ocean Eng. 2022, 256, 111502. [Google Scholar] [CrossRef]
  5. Cheng, A.; Chen, N.-Z. An Extended Engineering Critical Assessment for Corrosion Fatigue of Subsea Pipeline Steels. Eng. Fail. Anal. 2018, 84, 262–275. [Google Scholar] [CrossRef]
  6. Larrosa, N.O.; Akid, R.; Ainsworth, R.A. Corrosion-Fatigue: A Review of Damage Tolerance Models. Int. Mater. Rev. 2018, 63, 283–308. [Google Scholar] [CrossRef]
  7. Tan, J.; Zhang, Z.; Zheng, H.; Wang, X.; Gao, J.; Wu, X.; Han, E.-H.; Yang, S.; Huang, P. Corrosion Fatigue Model of Austenitic Stainless Steels Used in Pressurized Water Reactor Nuclear Power Plants. J. Nucl. Mater. 2020, 541, 152407. [Google Scholar] [CrossRef]
  8. Deng, Z.; Huang, M.; Wan, N.; Zhang, J. The Current Development of Structural Health Monitoring for Bridges: A Review. Buildings 2023, 13, 1360. [Google Scholar] [CrossRef]
  9. Fan, X.; Kong, J.; Wang, H.; Huang, K.; Zhao, T.; Li, L. Multi-Scale Electromechanical Impedance-Based Bolt Loosening Identification Using Attention-Enhanced Parallel CNN. Appl. Sci. 2025, 15, 9715. [Google Scholar] [CrossRef]
  10. El Moutaouakil, H.; Heimann, J.; Lozano, D.; Memmolo, V.; Schütze, A. Feature Extractor for Damage Localization on Composite-Overwrapped Pressure Vessel Based on Signal Similarity Using Ultrasonic Guided Waves. Appl. Sci. 2025, 15, 9288. [Google Scholar] [CrossRef]
  11. Preethichandra, D.M.G.; Suntharavadivel, T.G.; Kalutara, P.; Piyathilaka, L.; Izhar, U. Influence of Smart Sensors on Structural Health Monitoring Systems and Future Asset Management Practices. Sensors 2023, 23, 8279. [Google Scholar] [CrossRef]
  12. ASTM G38-01; Standard Practice for Making and Using c-Ring Stress-Corrosion Test Specimens. ASTM International: West Conshohocken, PA, USA, 2013.
  13. Wheeler, R.W.; Ronevich, J.; San Marchi, C.; Grimmer, P.; Emery, J.M. Development of C-Ring Geometry to Explore Fatigue Crack Extension and Verification in High-Pressure Vessels. In Proceedings of the ASME 2022 Pressure Vessels & Piping Conference, Las Vegas, NV, USA, 17–22 July 2022; American Society of Mechanical Engineers: New York, NY, USA, 2022. [Google Scholar]
  14. Elber, W. Fatigue Crack Closure under Cyclic Tension. Eng. Fract. Mech. 1970, 2, 37–45. [Google Scholar] [CrossRef]
  15. Suresh, S.; Zamiski, G.F.; Ritchie, D.R.O. Oxide-Induced Crack Closure: An Explanation for Near-Threshold Corrosion Fatigue Crack Growth Behavior. Metall. Trans. A 1981, 12, 1435–1443. [Google Scholar] [CrossRef]
  16. Halliday, M.D.; Beevers, C.J. Non-Closure of Cracks and Fatigue Crack Growth in β Heat Treated Ti-6A1-4V. Int. J. Fract. 1979, 15, R27–R30. [Google Scholar] [CrossRef]
  17. Hornbogen, E. Martensitic Transformation at a Propagating Crack. Acta Metall. 1978, 26, 147–152. [Google Scholar] [CrossRef]
  18. Sharp, P.K.; Clayton, J.Q.; Clark, G. Retardation and Repair of Fatigue Cracks by Adhesive Infiltration. Fatigue Fract. Eng. Mater. Struct. 1997, 20, 605–614. [Google Scholar] [CrossRef]
  19. Huang, J.; Cardenas, H. Fatigue Crack Arrest in Mild Steel via Iron Electroplating. Mater. Sci. Appl. 2021, 12, 484–503. [Google Scholar] [CrossRef]
  20. Ur-Rehman, A.; Thomason, P.F. The Effect of Artificial Fatigue-Crack Closure on Fatigue-Crack Growth. Fatigue Fract. Eng. Mater. Struct. 1993, 16, 1081–1090. [Google Scholar] [CrossRef]
  21. Song, P.S.; Sheu, B.C.; Chou, H.H. Deposition of Plating Metals to Improve Crack Growth Life. Int. J. Fatigue 2001, 23, 259–270. [Google Scholar] [CrossRef]
  22. Ahmad, Z. Principles of Corrosion Engineering and Corrosion Control; Elsevier: Burlington, MA, USA, 2006. [Google Scholar]
  23. Schlick, S.; Kruczała, K. ESR and ESR Imaging Methods for the Study of Oxidative Polymer Degradation. Compr. Anal. Chem. 2008, 53, 499–524. [Google Scholar]
  24. Hudson, J.A.; Cardenas, H.E. Corrosion Behavior of Fe-Ni Electrodeposited Coatings in Weak Ammonium Hydroxide Solution. Corros. Mater. Degrad. 2025, 6, 15. [Google Scholar] [CrossRef]
  25. ASTM D5436-15R20; Standard Specification for Cast Poly(Methyl Methacrylate) Plastic Rods, Tubes, and Shapes. ASTM International: West Conshohocken, PA, USA, 2020.
  26. Yang, X.; Wang, X.; Tang, Y. The Chemical Recovery of PMMA into Monomer. Chem.–Eur. J. 2025, 31, e202404030. [Google Scholar] [CrossRef]
  27. ASTM E399-12; Standard Test Method for Linear-Elastic Plane-Strain Fracture Toughness Kic of Metallic Materials. ASTM International: West Conshohocken, PA, USA, 2012.
  28. LabJack U6 Datasheet. Available online: https://support.labjack.com/docs/u6-datasheet (accessed on 24 May 2025).
  29. Ravikumar, A.; Rostron, P.; Vahdati, N.; Shiryayev, O. Parametric Study of the Corrosion of API-5L-X65 QT Steel Using Potentiostat Based Measurements in a Flow Loop. Appl. Sci. 2021, 11, 444. [Google Scholar] [CrossRef]
  30. Li, Y.; Bai, Z.; Xing, L.; Zhang, Q.; Ding, S.; Zhang, Y.; Gao, P.; Yu, Z.; Xu, D. Corrosion Monitoring Techniques in Subcritical and Supercritical Water Environments. Appl. Sci. 2024, 14, 2350. [Google Scholar] [CrossRef]
  31. Anderson, T.L. Fracture Mechanics: Fundamentals and Applications, 3rd ed.; CRC Press: Boca Raton, FL, USA, 2005. [Google Scholar]
  32. Samide, A.; Tutunaru, B.; Negrila, C.; Trandafir, I.; Maxut, A. Effect of Sulfacetamide on the Composi-Tion of Corrosion Products Formed onto Carbon Steel Surface in Hydrochloric Acid. Dig. J. Nanomater. Biostruct. 2011, 6, 663–673. [Google Scholar]
  33. Refait, P.; Grolleau, A.-M.; Jeannin, M.; Rémazeilles, C.; Sabot, R. Corrosion of Carbon Steel in Marine Environments: Role of the Corrosion Product Layer. Corros. Mater. Degrad. 2020, 1, 198–218. [Google Scholar] [CrossRef]
  34. Ruby, C.; Abdelmoula, M.; Naille, S.; Renard, A.; Khare, V.; Ona-Nguema, G.; Morin, G.; Génin, J.-M.R. Oxidation Modes and Thermodynamics of FeII–III Oxyhydroxycarbonate Green Rust: Dissolution–Precipitation versus in Situ Deprotonation. Geochim. Cosmochim. Acta 2010, 74, 953–966. [Google Scholar] [CrossRef]
  35. Ohmoto, H. Nonredox Transformations of Magnetite-Hematite in Hydrothermal Systems. Econ. Geol. 2003, 98, 157–161. [Google Scholar] [CrossRef]
  36. Liao, P.; Carter, E.A. Ab Initio DFT + U Predictions of Tensile Properties of Iron Oxides. J. Mater. Chem. 2010, 20, 6703–6719. [Google Scholar] [CrossRef]
  37. Hidaka, Y.; Anraku, T.; Otsuka, N. Deformation of Iron Oxides upon Tensile Tests at 600–1250 °C. Oxid. Met. 2003, 59, 97–113. [Google Scholar] [CrossRef]
  38. Balafas, I.; Burgoyne, C.J. Modeling the Structural Effects of Rust in Concrete Cover. J. Eng. Mech. 2011, 137, 175–185. [Google Scholar] [CrossRef]
  39. Rittel, D. An Investigation of the Heat Generated during Cyclic Loading of Two Glassy Polymers. Part I: Experimental. Mech. Mater. 2000, 32, 131–147. [Google Scholar] [CrossRef]
  40. Constable, I.; Williams, J.G.; Burns, D.J. Fatigue and Cyclic Thermal Softening of Thermoplastics. J. Mech. Eng. Sci. 1970, 12, 20–29. [Google Scholar] [CrossRef]
  41. Hayes, M.D.; Edwards, D.B.; Shah, A.R. Fractography Basics. In Fractography in Failure Analysis of Polymers; Elsevier: Oxford, UK, 2015; pp. 48–92. [Google Scholar]
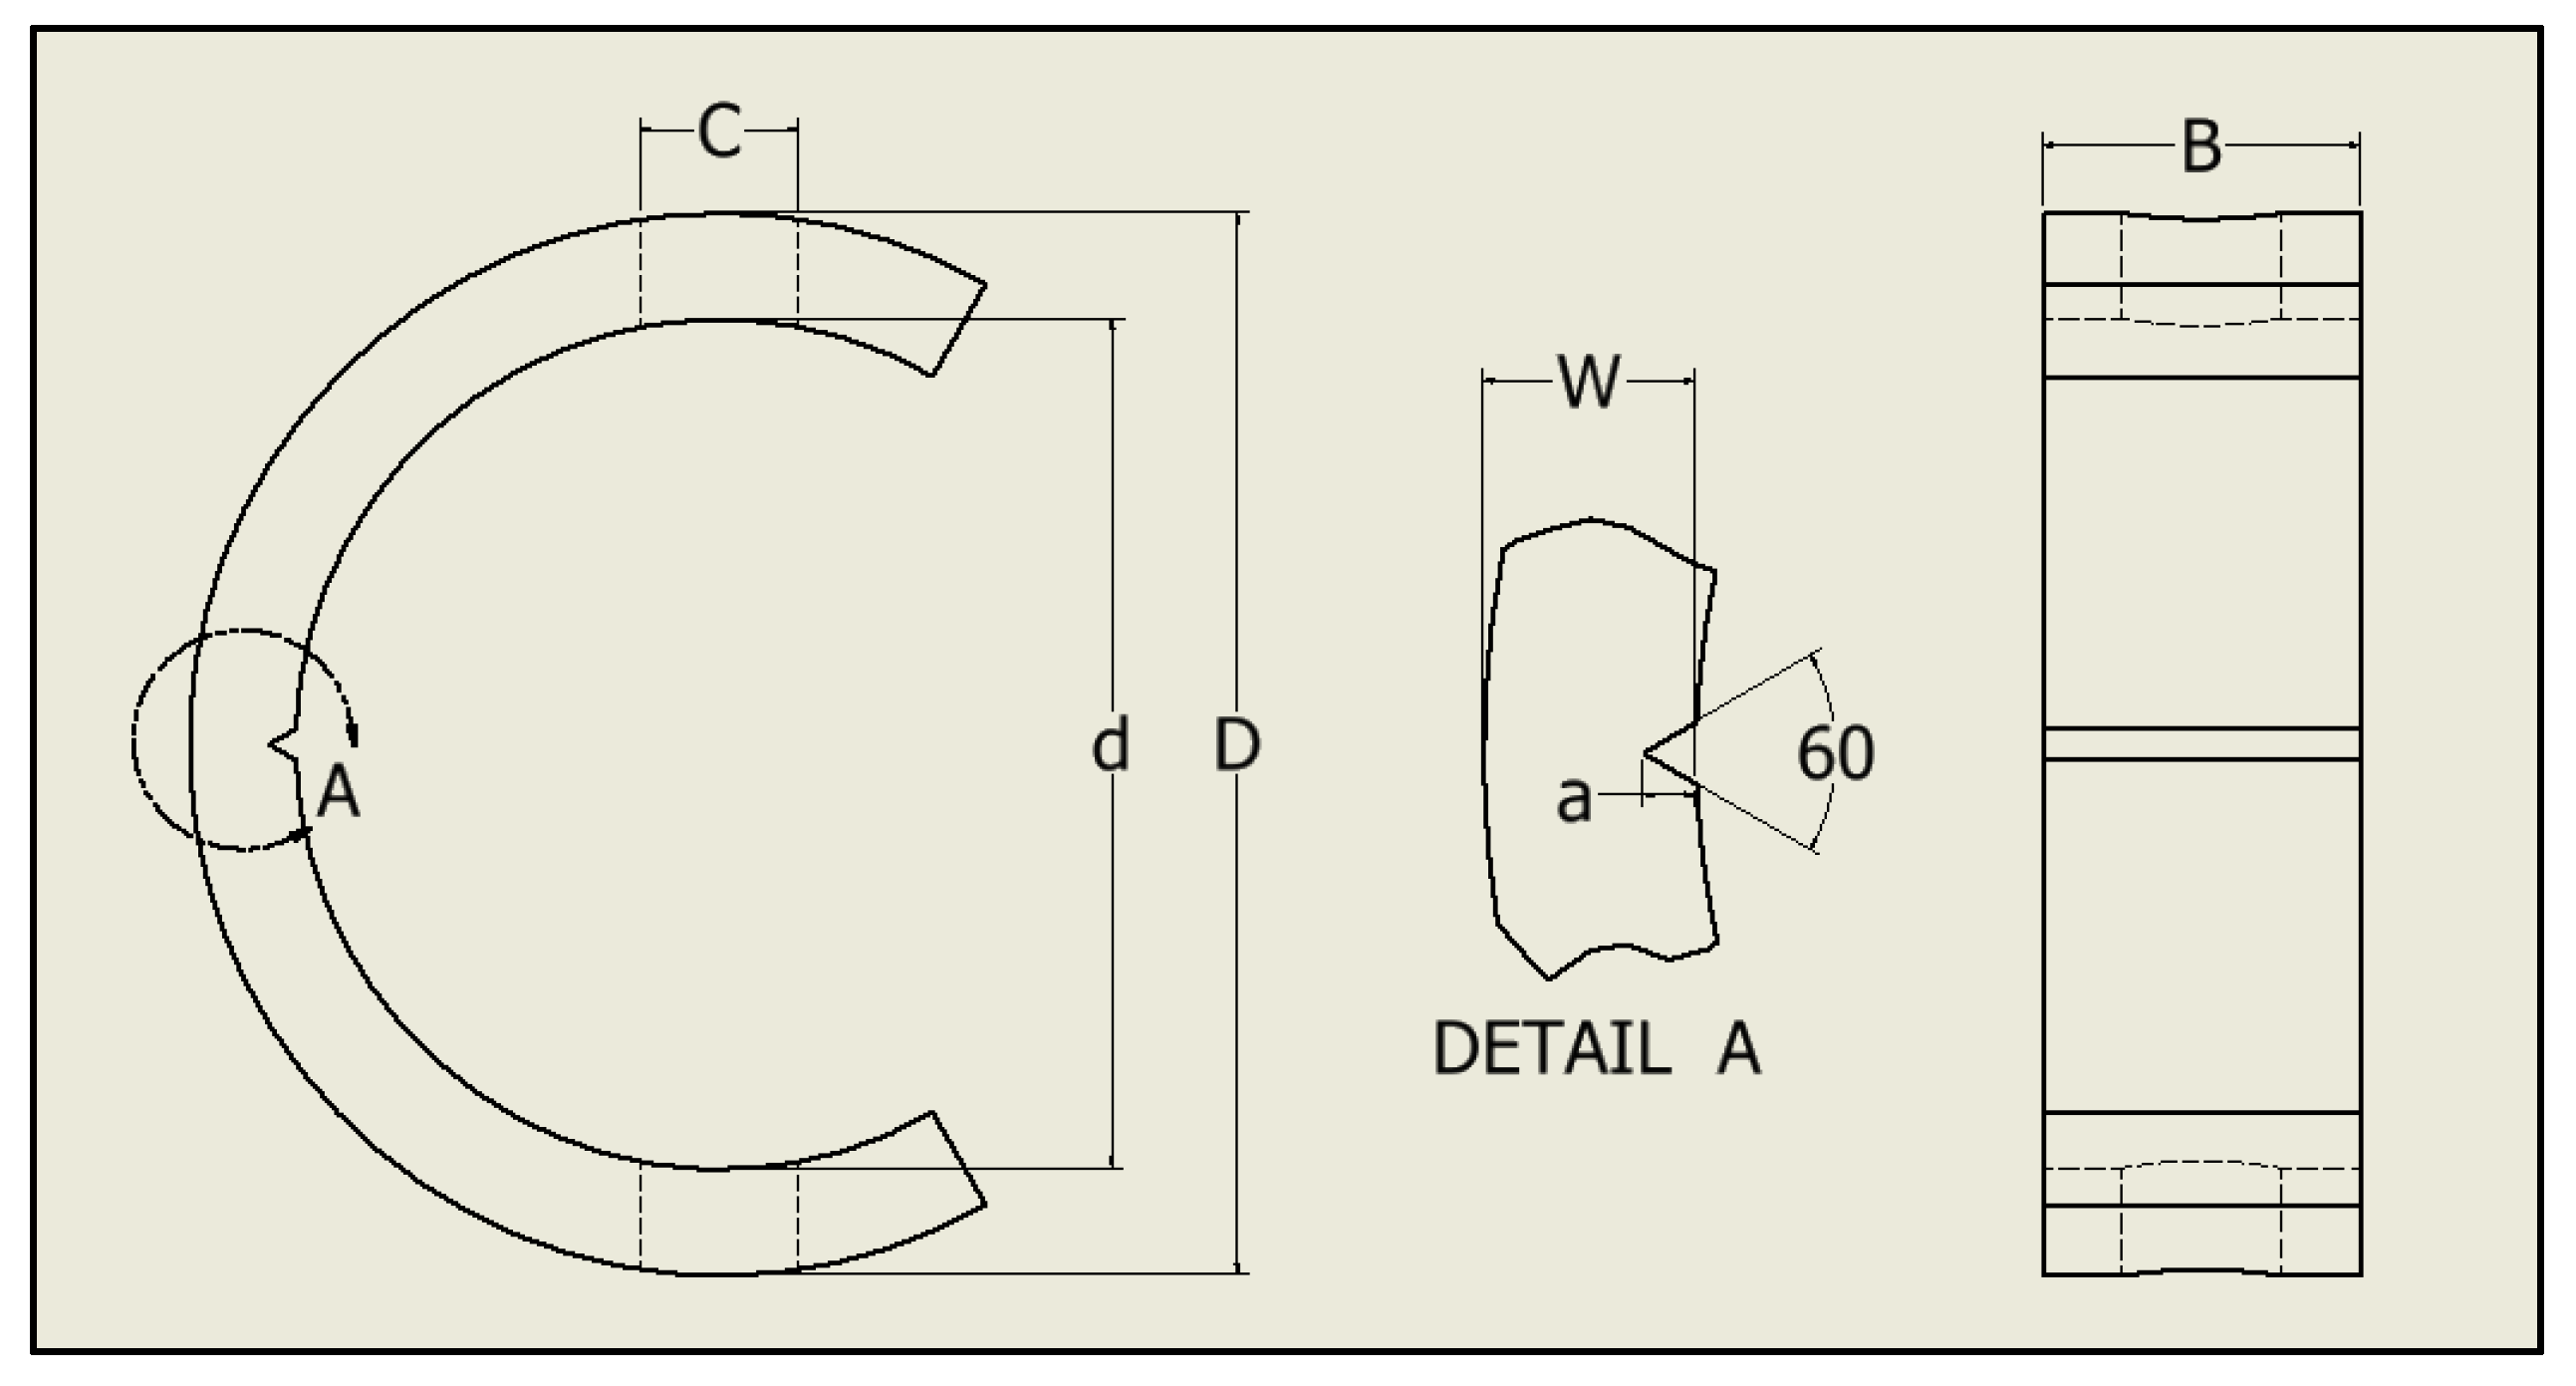
Figure 1. C-ring configuration for both SA-210-A1 carbon steel and PMMA specimens. The starter notch (Detail A) was used to promote controlled crack initiation in SA-210-A1 specimens but was not used for the PMMA specimens. Dimensions were D = 76.2 mm, d = 63.5 mm, W = 6.35 mm, a = 1.53 mm, B = 19.1 mm, and C = 9.53 mm.
Applsci 15 10252 g001
Figure 2. Simplified diagram of the EAC fatigue testing system identifying primary components.
Applsci 15 10252 g002
Figure 3. Simplified diagram of the test chamber (Detail A from Figure 2) including chemical control elements and the rod seal system.
Applsci 15 10252 g003
Figure 4. Block diagram of the Labjack U6 data acquisition unit. Adapted from [28], with permission from Labjack Corporation.
Applsci 15 10252 g004
Figure 5. Cam, follower, and rocker arm assembly. Dashed circles show range of displacement.
Applsci 15 10252 g005
Figure 6. Simplified wiring diagram of the cyclic load drive motor control circuit, where FIO1 is flexible input/output 1 configured as a digital output, DSC is a digital signal converter for 5V logic, SSR is the solid-state relay, and GND is the ground.
Applsci 15 10252 g006
Figure 7. Simplified load cell bridge circuit wiring diagram, where Eexc is the excitation voltage, Eo is the bridge signal voltage, R1 through R4 are resistance strain gauges, AIN1, AIN2, and AIN3 are the analog input channels 1, 2, and 3, and GND is the ground.
Applsci 15 10252 g007
Figure 8. Simplified temperature control loop wiring diagram, where AIN0 is analog input channel 0, VS is the +5V supply from the DAQ, FIO0 is flexible input/output 0 configured as a digital output, DSC is a digital signal converter for 5 V logic, SSR is the solid-state relay, and GND is the ground.
Applsci 15 10252 g008
Figure 9. Simplified wiring diagram for the pH control loop, where AIN4 is analog input 4, VS is the supply voltage (5 VDC), DAC0 is digital-to-analog converter (analog output) 0, GND is the ground, and A is the analog signal from the pH probe to the DAQ.
Applsci 15 10252 g009
Figure 10. Application software user interface (UI).
Applsci 15 10252 g010
Figure 11. Finite element model of the C-ring showing (a) meshed model and (b) typical results of displacement illustrating locations of lowest (blue) to highest (red) values.
Applsci 15 10252 g011
Figure 12. Crack length progression from 1.588 mm to 5.398 mm in increments of 0.635 mm obtained from FEA parametric sweep of the C-ring. Refer to Section 3.3 for FEA results.
Applsci 15 10252 g012
Figure 13. Temperature control loop (a) step response from 20 °C to a setpoint of 60 °C (red line) and ambient temperature (blue line) and (b) detail view of temperature variation within the control region.
Applsci 15 10252 g013
Figure 14. pH control loop of a 15 L chamber load: (a) step response from 5.8 pH to a setpoint of 9.5 pH and (b) acidic step response from 7.00 pH to 4.00 pH.
Applsci 15 10252 g014
Figure 15. Load cell calibration curve where the red dots represent discrete data points and the blue line is a linear curve fit.
Applsci 15 10252 g015
Figure 16. Carbon steel C-ring (Specimen: CR-001) load versus time data for (a) all 376,407 data points over the full test duration of 54,391 s and (b) data subset of the first 21 s. The black dots are data points collected every 0.15 s and the blue line is provided as a visual aid for the cycling load.
Applsci 15 10252 g016
Figure 17. C-ring specimen (a) applied load vs. load point displacement for various crack lengths obtained through finite element analysis (see Section 2.4) and (b) compliance vs. normalized crack length from finite element analysis as compared to experimental data.
Applsci 15 10252 g017
Figure 18. Carbon steel C-ring specimen CR-001 cycled in open air illustrating: (a) peak cyclic load drop versus time (data points in black) and moving average (red line); (b) Fracture surface evaluation. Point A represents the starting point of open-air fatigue testing using the EAC fatigue testing system and Point B is the stopping point of fatigue cycling.
Applsci 15 10252 g018
Figure 19. Corrosion fatigue behavior of carbon steel C-ring specimen CR-002, pre-soaked for 10 h and tested in an acidic chloride solution (0.1 M HCl + 0.5 M NaCl): (a) peak cyclic load versus time, showing raw data points (black), moving average smoothing (red line), and the moving average of the open-air control specimen CR-001 (blue); (b) post-test fracture surface of CR-002. Point A indicates the start of EAC fatigue testing, and point B marks the termination point of fatigue cycling.
Applsci 15 10252 g019
Figure 20. Corrosion fatigue behavior of carbon steel C-ring specimen CR-004, pre-soaked for 24.5 h and tested in an acidic chloride solution (0.1 M HCl + 0.5 M NaCl): (a) peak cyclic load versus time, showing raw data points (black), moving average smoothing (red), and the moving average of the open-air control specimen CR-001 (blue); (b) post-test fracture surface of CR-004. Point A indicates the start of EAC fatigue testing, and point B marks the termination point of fatigue cycling.
Applsci 15 10252 g020
Figure 21. Corrosion fatigue behavior of carbon steel C-ring specimen CR-005, pre-soaked for 45.5 h and tested in an acidic chloride solution (0.1 M HCl + 0.5 M NaCl): (a) peak cyclic load versus time, showing raw data points (black), moving average smoothing (red), and the moving average of the open-air control specimen CR-001 (blue); (b) post-test fracture surface of CR-005. Point A indicates the start of EAC fatigue testing, and point B marks the termination point of fatigue cycling.
Applsci 15 10252 g021
Figure 22. Corrosion fatigue behavior of carbon steel C-ring specimen CR-006, pre-soaked for 33.5 h and tested in an acidic chloride solution (0.1 M HCl + 0.5 M NaCl): (a) peak cyclic load versus time, showing raw data points (black), moving average smoothing (red), and the moving average of the open-air control specimen CR-001 (blue); (b) post-test fracture surface of CR-006. Point A indicates the start of EAC fatigue testing, and point B marks the termination point of fatigue cycling.
Applsci 15 10252 g022
Figure 23. Corrosion fatigue behavior of carbon steel C-ring specimen CR-007, pre-soaked for 25.75 h and tested in an acidic chloride solution (0.1 M HCl + 0.5 M NaCl): (a) peak cyclic load versus time, showing raw data points (black), moving average smoothing (red), and the moving average of the open-air control specimen CR-001 (blue); (b) post-test fracture surface of CR-007. Point A indicates the start of EAC fatigue testing, and point B marks the termination point of fatigue cycling.
Applsci 15 10252 g023
Figure 24. Crack growth rates, derived from the compliance model, for corrosion fatigue testing and the open-air baseline. The curves illustrate the progression of crack growth under corrosive conditions, emphasizing the difference in growth behavior relative to the baseline in air.
Applsci 15 10252 g024
Figure 25. PMMA C-ring specimen ACR-001 cycled in open air illustrating the following: (a) peak cyclic load drop versus time; (b) specimen after completion of cyclic load testing.
Applsci 15 10252 g025
Figure 26. EAC fatigue behavior of PMMA C-ring specimen ACR-002 tested in xylene: (a) peak cyclic load versus time; (b) post-test fracture surface of ACR-002. Point A indicates the start of EAC fatigue testing, and point B marks the termination point of fatigue cyclic.
Applsci 15 10252 g026
Figure 27. EAC fatigue behavior of PMMA C-ring specimen ACR-003 tested in xylene: (a) peak cyclic load versus time; (b) post-test fracture surface of ACR-003 against a blue background. Point A indicates the start of EAC fatigue testing, and point B marks the termination point. The blue colored region is an optical effect of the perspective angle of the view.
Applsci 15 10252 g027
Figure 28. EAC fatigue behavior of PMMA C-ring specimen ACR-004 tested in xylene: (a) peak cyclic load versus time; (b) post-test fracture surface of ACR-004. Point A indicates the start of EAC fatigue testing, and point B marks the termination point.
Applsci 15 10252 g028
Table 1. Chemical composition (wt.%) of ASME SA-210-A1 carbon steel.
Carbon
(Max)
Manganese
(Max)
Phosphorus
(Max)
Sulfur
(Max)
Silicon
(Min)
0.270.930.0350.0350.10
Table 2. Mechanical properties of PMMA and SA-210-A1 carbon steel.
PropertyPMMASA-210-A1
Tensile Strength, min, MPa55415
Yield Strength, min, MPa-255
Elongation, min, %2 (at break)30 (in 50 mm)
Table 3. Pinout for DAQ using DB37 terminal board.
Pin No.Pin NamePin No.Pin NamePin No.Pin Name
1GND 114AIN927Vs
2200 µA15AIN728Vm+
3FIO616AIN529DAC1
4FIO417AIN3 130GND
5FIO218AIN1 131AIN12
6FIO0 119GND32AIN10
7MI01/CI012010 µA33AIN8
8GND21FIO734AIN6
9Vm-22FIO535AIN4 1
10GND 123FIO336AIN2 1
11DAC0 124FIO1 137AIN0 1
12AIN1325MIO0/CIO0
13AIN1126MIO2/CIO2
1 Pins used for data acquisition and control of the EAC test system. Refer to Table 4 for descriptions.
Table 4. Input/Output list.
ChannelDescriptionSignal 1Type 2
AIN0Solution temperatureAISingle-ended
AIN1Load cell excitation voltageAISingle-ended
AIN2−AIN3Load cell bridgeAIDifferential
AIN4Solution pHAISingle-ended
AIN14Ambient temperatureAISingle-ended
DAC0Metering pump for chem. injectionAOSingle-ended
FIO0Heater relayDONA
FIO1Load cycle motor relayDONA
1 Signals are analog input (AI), analog output (AO), digital input (DI), or digital output (DO). 2 Not applicable (NA).
Table 5. Load cell calibration data.
Input (N)Output (N)% Error
3.783.780.00
92.3092.570.29
180.82181.350.30
269.34270.140.30
Table 6. Summary of carbon steel (SA-210-A1) corrosion fatigue testing results.
Specimen *EnvironmentLoad Drop (N)Crack Growth (mm)Total CyclesDelay
Cycles
Avg. Crack Growth Rate (mm/cycle)
CR-001Open air4161.5518,11908.55 × 10−5
CR-002Acidic Chloride3862.9412,83394758.76 × 10−4
CR-004Acidic Chloride4213.0018,43614,9868.70 × 10−4
CR-005Acidic Chloride4813.3019,26515,0427.81 × 10−4
CR-006Acidic Chloride4903.1823,64319,8908.48 × 10−4
CR-007Acidic Chloride1781.73292605.91 × 10−4
* CR-003 was excluded from analysis due to data loss resulting from an unexpected system reboot.
Table 7. Summary of PMMA EAC fatigue testing results.
SpecimenEnvironmentLoad Drop (N)Total CyclesAvg. Load Drop Rate (N/cycle)
ACR-001Open air98550.01
ACR-002Xylene (100%)22360.61
ACR-003Xyl/ethanol (1:1) 772080.37
ACR-004Xylene (100%)23330.69
ACR-005Xyl/ethanol (1:1) 1216370.19
ACR-006Xyl/ethanol (1:1)1284330.30
ACR-007Xylene (100%)361160.31
Disclaimer/Publisher’s Note: The statements, opinions and data contained in all publications are solely those of the individual author(s) and contributor(s) and not of MDPI and/or the editor(s). MDPI and/or the editor(s) disclaim responsibility for any injury to people or property resulting from any ideas, methods, instructions or products referred to in the content.