Article

Macro–Mesoscopic Analysis and Parameter Calibration of Rock–Soil Strength Degradation Under Different Water Contents

1
School of Civil Engineering, Henan University of Technology, Zhengzhou 450001, China
2
Department of Civil Engineering, Central South University, Changsha 410075, China
*
Author to whom correspondence should be addressed.
Appl. Sci. 2025, 15(18), 10254; https://doi.org/10.3390/app151810254
Submission received: 21 August 2025 / Revised: 12 September 2025 / Accepted: 16 September 2025 / Published: 20 September 2025

Abstract

Rainfall is a key triggering factor for numerous geotechnical hazards. Hence, it is necessary to investigate the degradation characteristics of rock–soil strength under different water contents. The existing macro–mesoscopic analysis methods for rock–soil strength degradation neglect the intrinsic connection between water content variations caused by external rainfall and mesoscopic mechanical mechanisms. In addition, there is a lack of discrete element method (DEM) mesoscopic parameter calibration methods for rock–soil strength under the influence of external environmental factors. Hence, this study aims to perform a macro–mesoscopic analysis and develop a parameter calibration model for the degradation of rock–soil strength under different water contents. First, the mesoscopic mechanical characteristics under different water contents are investigated by analyzing particle displacement, the bond failure rate, and the anisotropy coefficient. Interrelationships among shear strength, water content, and mesoscopic parameters are qualitatively analyzed, which indicated a macro–mesoscopic synergistic mechanism. A macro–meso-environment data set is constructed. Key mesoscopic parameters are determined using Pearson correlation (Pearson) and mutual information (MI) methods. Then, the mapping relationships are established based on ordinary least squares. The model accuracy is verified by comparing the calibrated simulation results with direct shear test results. The results show that the shear strength increases with vertical pressure under a constant water content. However, as the water content varies, the strength initially increases and then decreases. The average displacement of central particles and bond failure rate both decrease initially and then increase with rising water content, while the anisotropy coefficients show the opposite trend. Normal bond strength, tangential bond strength, and friction coefficient are determined as the key parameters. The goodness-of-fit R2 of the parameter calibration model exceeds 0.92. Among 45 validation working conditions, only two are found to have errors of 12.4% and 13.6%, and the remainder have errors below 5%.

1. Introduction

Rapid industrialization and sustained population growth have intensified the pace of global warming, triggering multiple chain reactions in the climate system. Of particular concern is the frequent occurrence of intense rainfall events and the increase in their intensity, which have become one of the significant impacts of global climate change. In recent years, a number of geotechnical engineering disasters have been triggered by the water content variations caused by rainfall. For example, in September 2022, multiple landslides occurred across much of central Italy, which were caused by unusual rainfall [1]. In July 2021, extreme rainfall events in Zhengzhou, Henan Province, triggered numerous ground collapses in areas overlaying loess deposits [2]. In the summer of 2020, a clay foundation pit in Chengdu, Sichuan Province, collapsed due to prolonged rainfall [3]. Rock–soil strength degradation under water content variations caused by rainfall is one of the important factors causing the instability of many rock–soil structures [4]. Against this backdrop, performing a comprehensive and systematic analysis of the influence of water content variations caused by rainfall on the mechanical degradation patterns of rock–soil structures is of great significance.
In the early stages of research, the academic community primarily employed direct shear tests and triaxial tests to investigate the macroscopic mechanical characteristics of rock–soil structures. Liu et al. [5] investigated the effects of dry–wet cycling on the compressive characteristics and shear strength of carbonate sand from the Xisha Islands using one-dimensional compression tests and direct shear tests. With the continuous development of the DEM, research on rock–soil strength degradation has increasingly focused on macro–mesoscopic synergistic analysis. Liu et al. [6] employed the 3D-DEM and triaxial tests to analyze the particle displacement, contact force distribution, and shear strength in both reinforced and unreinforced coral sand under high confining pressures. Chang et al. [7] used the DEM and triaxial tests to analyze the stress–strain curves, contact force chains, porosity, and coordination numbers of salt sand and identified the mechanism through which salt content influences its mechanics. Zhang et al. [8] employed DEM direct shear testing to analyze the effects of rock content and size on soil–rock mixture behavior, linking macroscopic shear strength to mesoscopic contact force chains and coordination number. Collectively, these scholars investigated the correlations between the macroscopic mechanical responses and mesoscopic mechanical evolutions of rock–soil structures under diverse influencing factors using the DEM. These works not only indicate the macro–mesoscopic mechanical interaction mechanisms of rock–soil structures but also provide critical evidence for exploring the patterns of their strength degradation. But the existing macro–mesoscopic analysis methods for rock–soil strength degradation neglect the intrinsic connection between water content variations caused by external rainfall and mesoscopic mechanical mechanisms.
The discrete element method, which effectively captures the mesoscopic mechanical change patterns of rock–soil structures, has become an indispensable tool in this research field [9,10]. The appropriate selection of parameters in DEM contact models is essential for ensuring the reliability of numerical simulations. However, the traditional trial-and-error calibration method is highly time-consuming and lacks systematic theoretical guidance [11,12]. To address this disadvantage, some scholars have conducted exploratory studies. Zhang et al. [13] calibrated the mesoscopic parameters of rockfill materials using orthogonal experimental designs and response surface methodology based on Box–Behnken designs. Suo et al. [14] developed linear regression equations to characterize the relationships between macroscopic and mesoscopic parameters of sandstone–shale through orthogonal experimental and linear regression analysis. Lei et al. [15], based on biaxial tests of similar material for surrounding rock, employed single-factor sensitivity analysis and multifactor variance analysis to establish a multivariate nonlinear multiscale mathematical model through regression analysis. Most scholars employ experimental design methods from mathematical statistics for parameter calibration. This approach transforms the parameter calibration problem into an equation-solving problem, thereby overcoming the limitations of trial and error and providing a robust foundation for parameter calibration in geotechnical engineering. The macroscopic and mesoscopic mechanical characteristics of rock–soil structures are not only related to the type of rock–soil but also are influenced by external factors such as rainfall and load. The majority of extant studies exclusively consider the mapping relationship between the internal contact parameters and macroscopic parameters of rock–soil structures, while neglecting the influence of external environmental factors. This results in parameter calibration models that are not targeted.
To address these problems, first, the rock–soil strength degradation across macroscopic and mesoscopic scales is analyzed through the integration of laboratory direct shear tests with DEM simulation. The meso–mechanical characteristics are studied under different water contents from the particle displacement evolution, the bond failure rate, and the anisotropy coefficient. To indicate the macro–mesoscopic synergistic mechanism of strength degradation, the relationships among mesoscopic parameters, water content, and shear strength are analyzed. To develop a DEM mesoscopic parameter calibration model incorporating external environmental influences, an external environment–macro–meso parameter data set is constructed. Pearson and MI methods are employed to determine the key mesoscopic parameters. Then, an ordinary least squares regression is employed to develop a mapping relationship among macroscopic parameters, key mesoscopic parameters, and external environment factors. The model is validated by comparing the numerical simulation after parameter calibration with direct shear tests.

2. Methods

(1) The methods of the direct shear test.
The quick shear method is employed. Samples of soil with specified dry density and water content are prepared. The samples are then placed into shear boxes and mounted on a direct shear apparatus. Then, vertical pressure is applied and shear is initiated at a constant rate. The horizontal shear force is applied at a rate of 0.8 mm/min. The shear stress–shear displacement curve is continuously recorded until the shear displacement reaches 6 mm. Shear strength is then obtained from the stress–strain curve.
(2) The methods of DEM.
The DEM can directly simulate the motion and interaction of particles in discrete media, which provides a reliable tool for cross-scale analysis [16,17]. Based on Newton’s second law and the force–displacement law, the contact forces and positions are iteratively calculated and updated [18,19,20]. The force–displacement law is described by Equations (1) and (2). This study employs the linear contact bond model (LCBM) to simulate the interparticle bonding behavior. This is a simplification technique in modeling, which is designed to reduce the complexity of characterizing intricate physicochemical interactions within fine-grained soils. The model simplifies particle–particle interactions into rigid connections, with bond strength and friction coefficient set as fixed values, thereby facilitating numerical implementation and parameter analysis.
F n = k n U n n i
Δ F s = k s Δ U s
where Fn is the normal contact force between particles, ∆Fs is the tangential contact force between particles, kn is the normal stiffness, ks is the tangential stiffness, ni is the unit normal vector, Un is the normal deformation superposition quantity, and ∆Us is the tangential deformation superposition quantity.
(3) The methods of Pearson and MI.
The correlation between each LCBM parameter and the shear strength is to be calculated based on the Pearson algorithm.
γ = i = 1 n x i x ¯ y i y ¯ i = 1 n x i x ¯ 2 i = 1 n y i y ¯ 2
where xi is the LCBM parameter, x ¯ is the average of the LCBM parameter, yi is the shear strength, and y ¯ is the average of the shear strength.
The correlation between each LCBM parameter and the shear strength is to be calculated based on the MI algorithm.
γ = H F k + H S o u t H F k , S o u t = P j S k i , S t + 1 j log 2 P j S k i , S t + 1 j P S k i , P S t + 1 j d S k i d S t + 1 j
where Fk is the characteristic sequence, Sout is the output matrix composed of prediction data, H(Fk) and H(Sout) are the information entropies of the characteristic sequence and output matrix, H(Fk, Sout) is the two-dimensional joint entropy of the characteristic sequence and output matrix, P is the marginal probability distribution of a single variable, and Pj is the joint probability distribution between two variables.

3. Macro–Mesoscopic Analysis of Rock–Soil Strength Degradation

3.1. Methodology

As shown in Figure 1, this study presents a macro–mesoscopic analysis method for the strength degradation of rock–soil under different water contents. First, a macroscopic analysis of rock–soil strength degradation is performed through laboratory direct shear tests. Second, PFC is used to simulate direct shear tests and compare them with laboratory tests, and the rock–soil strength degradation patterns are analyzed at the mesoscopic scale. Then, the evolution patterns of the particle displacement, the particle bond failure rate, and the anisotropy coefficient are analyzed to investigate the mesoscopic mechanical characteristics under different water contents. Finally, by analyzing the relationships between mesoscopic and macroscopic parameters, this study accomplishes a synergistic analysis of macro–mesoscopic strength degradation in rock–soil. The specific steps are as follows.
Step 1: Macroscopic analysis of rock–soil strength degradation based on direct shear test.
First, the Standard for Geotechnical Testing Method [21] is consulted to determine the water content, dry density, and soil type through a water content test, density test, and Atterberg limits test. Next, soil samples for each direct shear test working condition are prepared based on the target dry density and required water content values. Then, multiple working conditions are designed based on soil types and water contents, and direct shear tests are performed under different vertical pressures for each working condition. Finally, this study performs a macroscopic analysis of rock–soil strength degradation mechanisms based on the shear strength obtained across various working conditions.
Step 2: Mesoscopic analysis of rock–soil strength degradation based on PFC.
First, the PFC 6.0 software is employed to simulate direct shear tests of rock–soil under various working conditions, generating simulated stress–strain curves. These curves are compared with laboratory direct shear tests to validate the accuracy of the PFC simulations. Second, a mesoscale analysis of the simulation is performed, primarily encompassing four aspects: particle motions, interparticle network analysis, stress field changes, and anisotropy evolution. The particle motions are analyzed to investigate the variations in particle displacement during the shearing process. The interparticle network is used to analyze the evolution of the force chain between particles during shearing and to explore the mechanisms of force transmission among particles. By analyzing the evolution of the stress field, stress magnitudes and principal stress direction distributions in model samples are investigated. The anisotropy of contact normal, normal contact forces, and tangential contact forces during shearing is analyzed to indicate the evolutionary patterns of anisotropy parameters. Finally, a mesoscopic analysis of rock–soil strength degradation is performed through two levels: model validation and mesoscopic mechanism analysis.
Step 3: Analysis of meso–mechanical characteristics under different water contents.
The evolution patterns of the particle displacement, the particle bond failure rate, and the anisotropy coefficient at different water contents are analyzed to investigate the mechanism of rock–soil degradation under different water contents.
First, by analyzing the evolution of particle displacement post-shear in models with different water contents, it is possible to determine the difficulty of particle reorganization during shearing for samples with different water contents and to investigate the influence of particle reorganization difficulty on shear strength. Second, to analyze post-shear interparticle bond failure in models with different water contents, the bond failure rate is introduced to quantify this failure mode and investigate its degradation pattern. Finally, the evolution pattern of the anisotropy coefficient under different water contents is analyzed, and its influence on rock–soil degradation is investigated.
Step 4: Macro–mesoscopic synergistic analysis of rock–soil strength degradation.
First, the relationship between mesoscopic parameters and water contents is analyzed to investigate their relationship with rainfall intensity. Second, the relationship between mesoscopic parameters and the shear strength is examined to explore their influence on rock–soil strength degradation. Finally, by analyzing the relationships between mesoscopic parameters and two macroscopic parameters (the water content and the shear strength), a macro–mesoscopic synergistic analysis of rock–soil strength degradation is performed across two levels.

3.2. Research Results

3.2.1. Project Overview

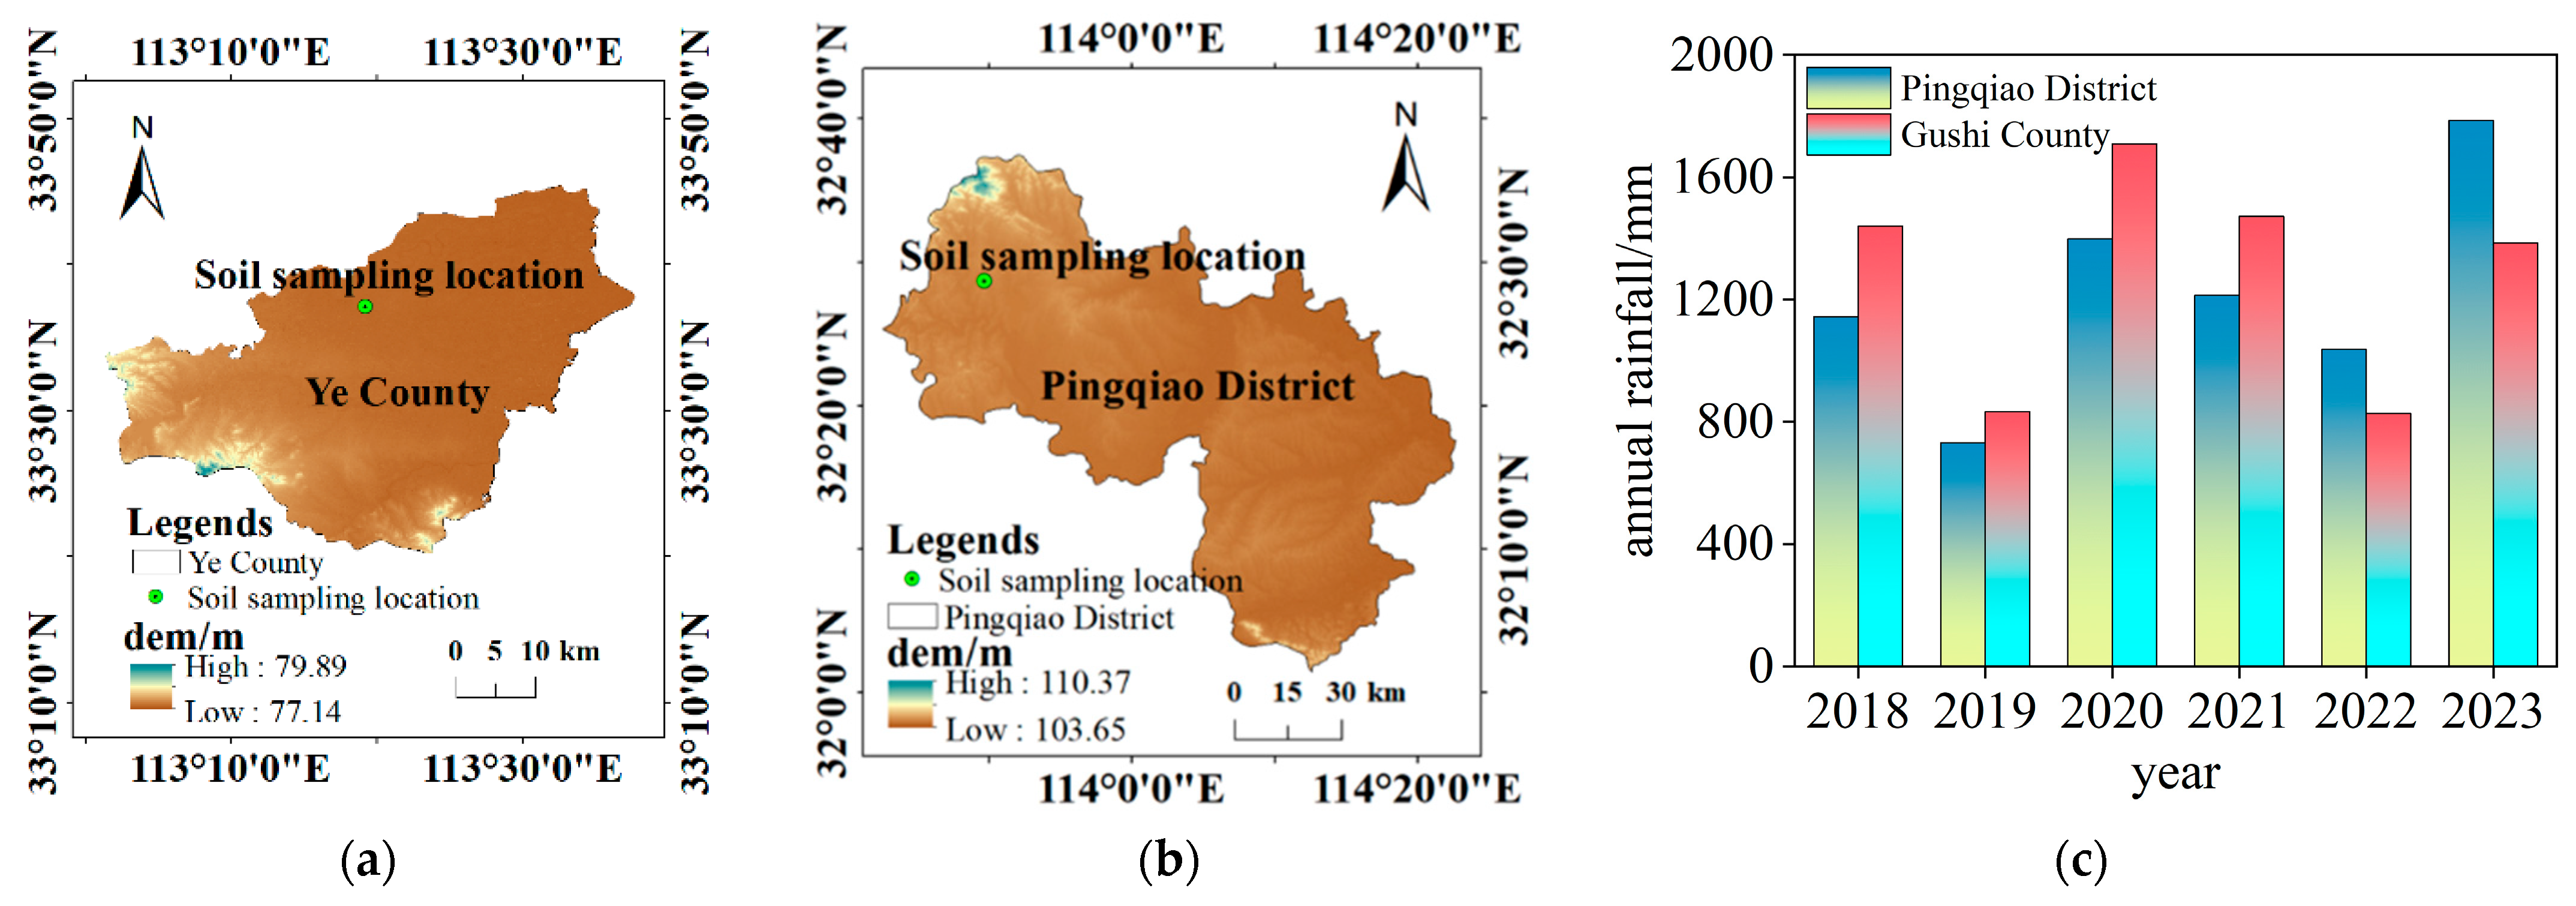
The sampling locations for silty clay, clay, and silt are Ye County (Pingdingshan City, Henan Province), Pingqiao District (Xinyang City, Henan Province), and Gushi County (Xinyang City, Henan Province), respectively. All sampling locations are geotechnical engineering structures, as shown in Figure 2a,b. The sampling location in Ye County has an elevation ranging from 77.14 m to 79.89 m. The soil stratum exhibits a brownish-yellow color, containing iron and manganese oxides. The sampling location in Pingqiao District has an elevation ranging from 103.65 m to 110.37 m. The soil stratum, primarily grayish-brown, exhibits uneven quality with locally high sand particle content and abundant gravel. The sampling locations experience abundant rainfall, with average annual totals of 1218.9 mm and 1277.9 mm, respectively, as shown in Figure 2c. Intense rainfall can induce a range of engineering problems, such as landslides [22,23], ground collapse [24,25], and significant deformation of foundation pits [26,27]. These problems cause substantial damage and pose severe risks, so it is necessary to investigate the patterns of rock–soil strength degradation under rainfall influence.

3.2.2. Macroscopic Analysis of Rock–Soil Strength Degradation Based on Direct Shear Test

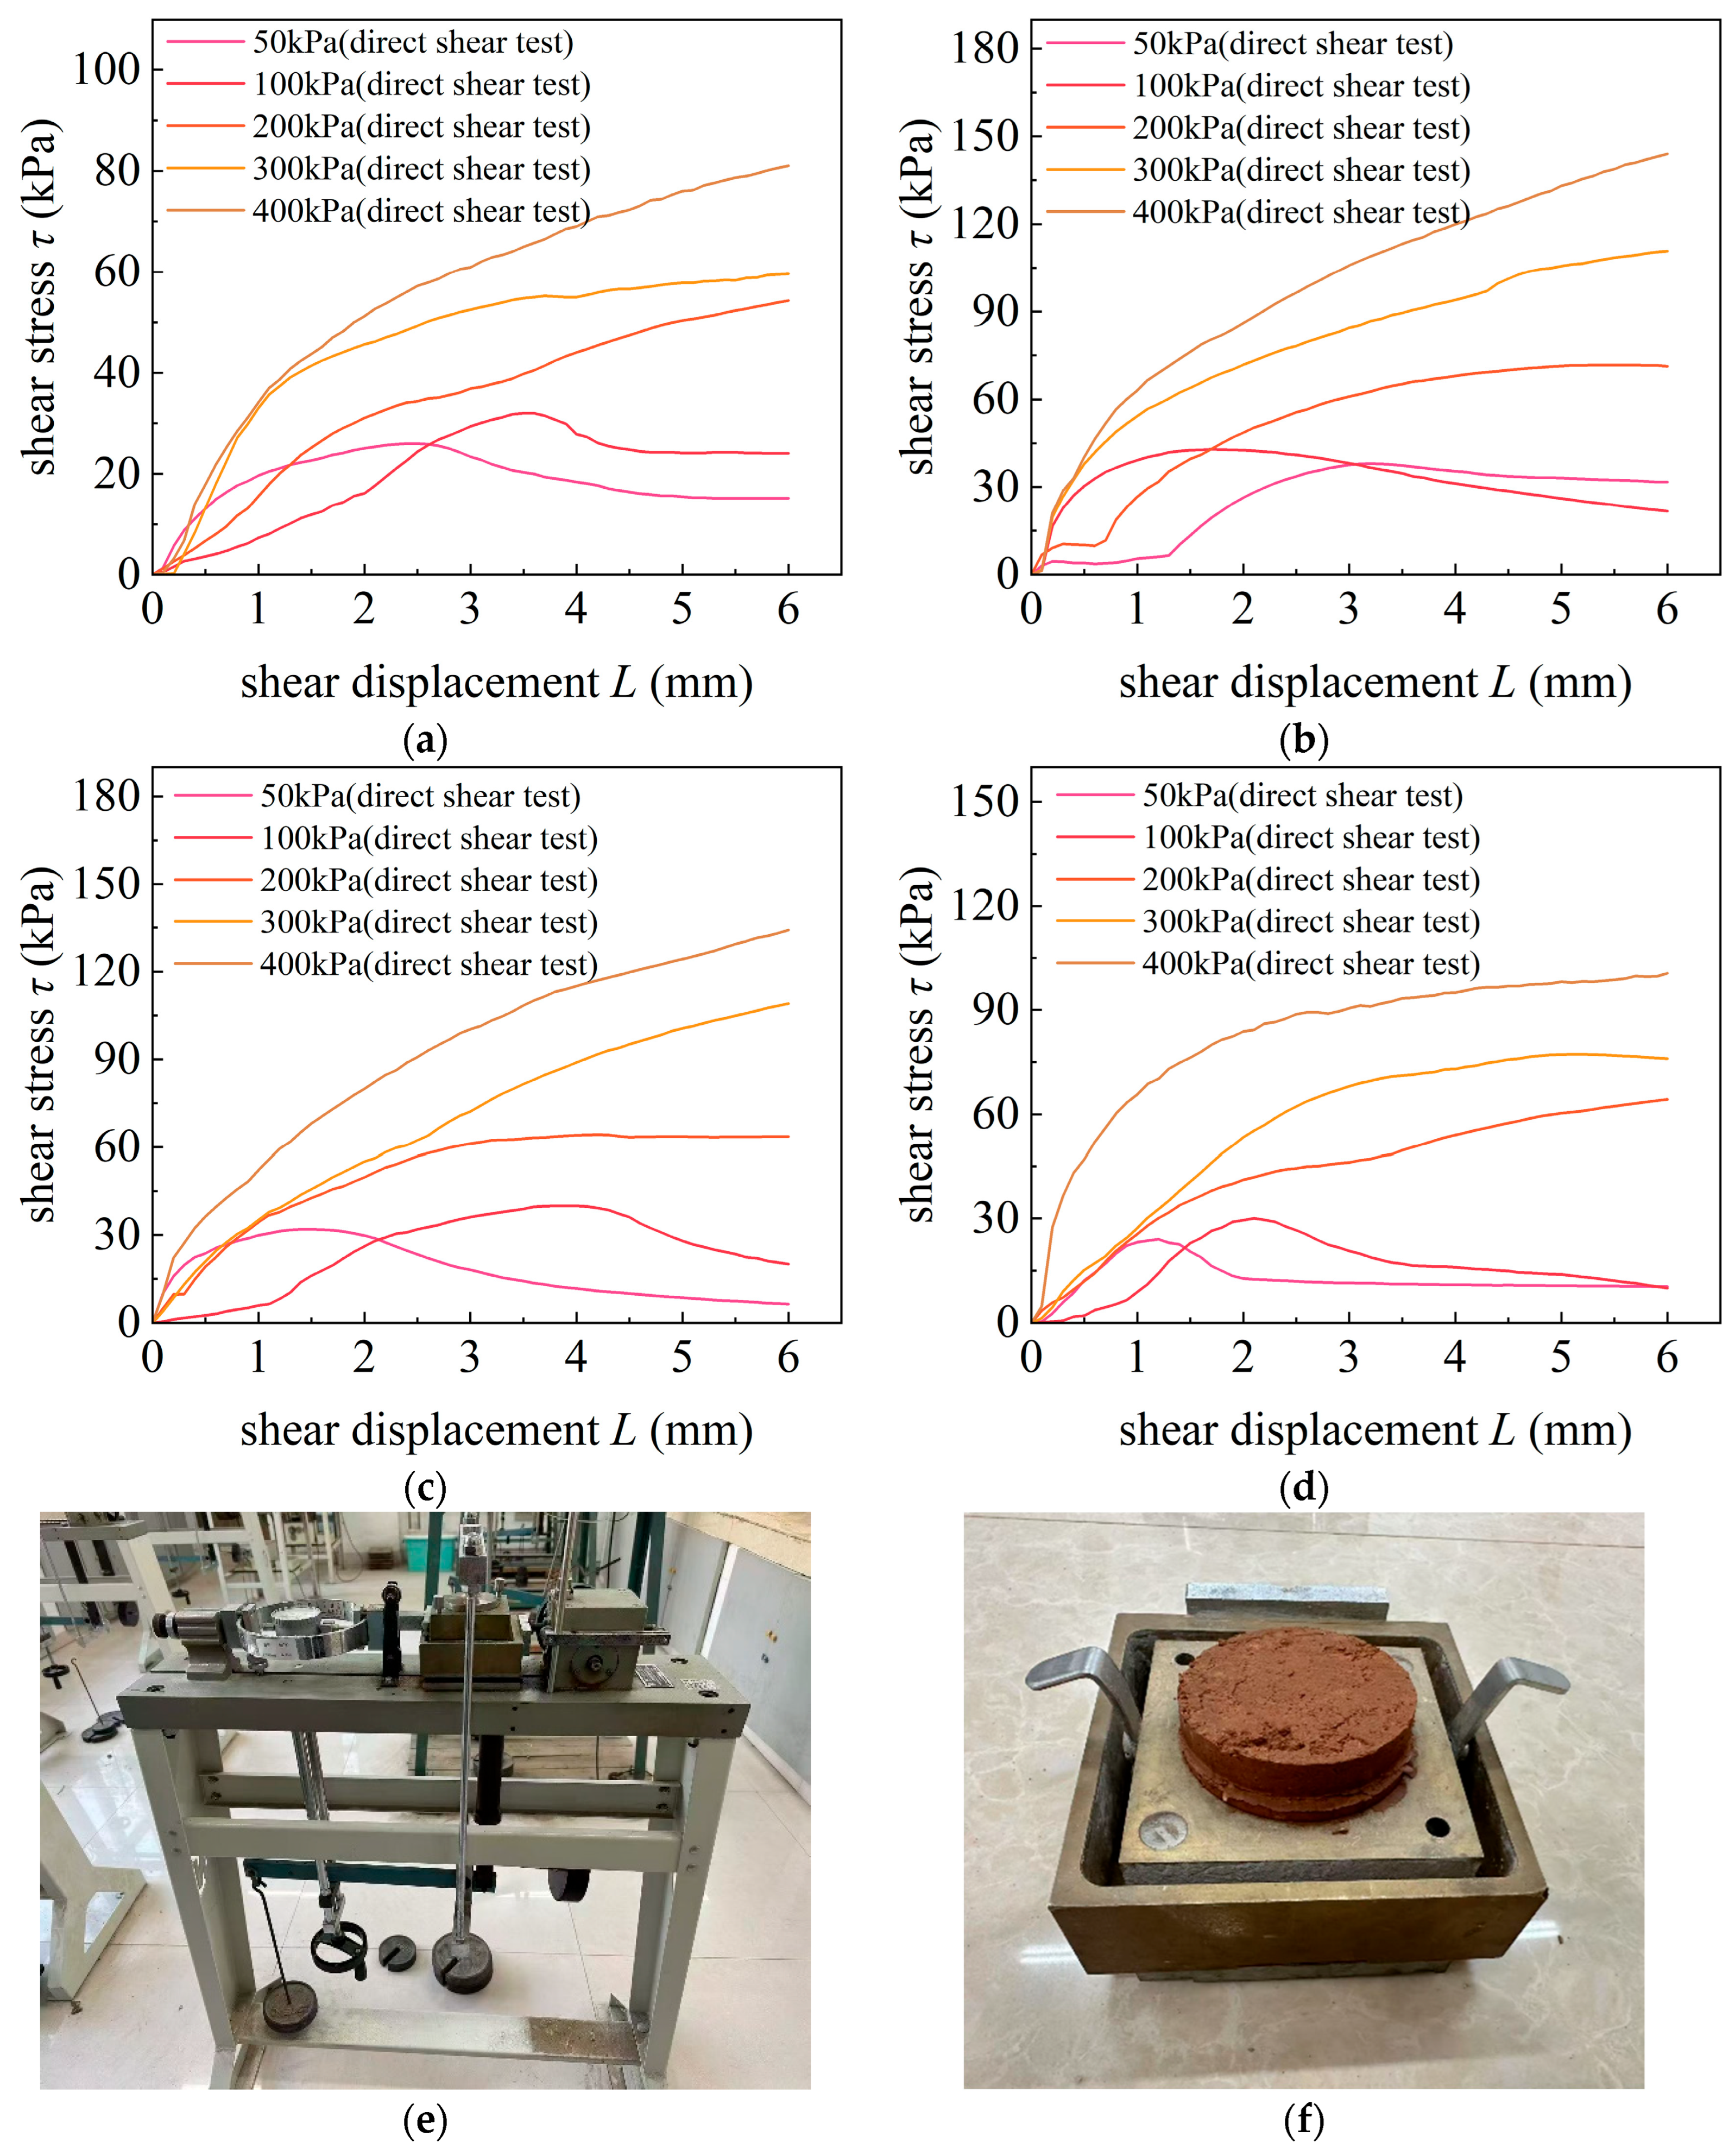
This study employs a strain-controlled direct shear apparatus. To investigate the variation patterns of shear strength under different water contents and soil types, the test soils are divided into three groups of silty clay, clay, and silt, with 10 samples of distinct water contents in each group. Each sample underwent direct shear tests under five vertical pressures (50, 100, 200, 300, and 400 kPa). The quick shear test method is applied with a shear rate of 0.8 mm/min, and testing is terminated when the shear displacement reaches 6 mm. Stress–strain curves are plotted to derive the soil’s shear strength.
Taking silty clay as an example, the stress–strain curve and laboratory test images are shown in Figure 3. The results in Figure 3a–d indicate that, under a constant water content condition, as the vertical pressure increases, the shear stress on the stress–strain curve correspondingly increases. Analysis of the stress–strain curves under the same vertical pressure across different water contents found that the shear strength first increases and then decreases with increasing water content. This phenomenon is attributed to the increase in shear strength as the water content approaches the optimum water content, followed by a gradual reduction as it exceeds this optimum water content, consistent with the findings of Wang et al. [28]. Based on the comparative analysis of a part of the shear strength values for silty clay and clay in Table 1, the two soils exhibit similar variation patterns of the shear strength. The comparative analysis above indicates that, before reaching the optimum water content, increased water content inhibits the degradation of rock–soil strength. In contrast, beyond this optimum, further increases in water content promote such degradation.

3.2.3. Mesoscopic Analysis of Rock–Soil Strength Degradation Based on PFC

The direct shear test model and boundary conditions for silty clay are shown in Figure 4e. To facilitate comparison with laboratory tests, the sample dimensions (61.8 mm in length × 20 mm in height) are consistent with the actual dimensions. The discrete element model is developed using PFC2D version 6.0 and consists of 17,889 circular particles. During shearing, the lower shear box remains fixed, while the upper shear box moves at a constant velocity. At the same time, a constant vertical pressure is applied to the top of the upper shear box. Excessively high shear speeds can cause significant fluctuations in the stress–strain curve, while excessively low speeds may lead to high time consumption. Hence, considering both laboratory direct shear test requirements and computational efficiency, the shear speeds during the shearing process are set to 0.005 mm/s. To validate the accuracy of the model, four groups of water content levels of 16.1%, 21.8%, 22.2%, and 24.9% are chosen as comparative work conditions for silty clay. The parameters for DEM simulation are shown in Table 2. Figure 4a–d show a comparison of curve results between laboratory direct shear tests and PFC simulations. Although minor discrepancies exist between the simulated and test curves, the shear strengths obtained from both methods are close, and most curves exhibit similarity. This confirms that the mesoscopic parameters obtained from the simulation are effective. The model is calibrated primarily against the peak shear strength, and as a result, it does not fully capture other critical aspects of the stress–strain response. The key limitations include its inability to accurately replicate the contraction and dilation behavior throughout shearing, the shape of the pre- and post-peak stress–strain curve, and the precise post-peak softening or hardening behavior.
Table 3 presents the particle motion of silty clay and clay under a vertical pressure of 200 kPa. As shown in the table, during shearing, particles in the upper shear box move with the shear box and exhibit significant displacement, while those in the lower shear box undergo minor displacement due to particle misalignment during the shearing process. Overall, the upper shear box exhibited the largest displacement at both ends, whereas the lower shear box displayed the smallest displacement. Analysis revealed that the particle motion of both soil types adhered to this pattern, confirming the accuracy of this pattern.
Table 4 shows the evolution of the force chain network and stress field of silty clay and clay under a vertical pressure of 200 kPa. A force chain represents the propagation path of contact forces between particles, with its thickness reflecting the magnitude of these contact forces. Larger contact forces accumulate to form strong force chains, whereas smaller contact forces give rise to weak force chains. The external load is primarily borne through the strong force chains. At a shear displacement of 0 mm, the strong force chain appears vertically, consistent with the direction of the external load. As displacement increases, there is a concentration of strong force chains in the upper-left and lower-right corners, whereas weak force chains develop in the upper-right and lower-left corners. The stress field is monitored using measurement circles arranged within the model. The stress field is monitored using measurement circles arranged within the model. During shearing, the principal stress direction is shifted. Near the shear plane, the direction of the major principal stress aligns with that of the strong force chains. Overall, the stress field distribution shows that the area between the upper-left and lower-right corners exhibits stronger stress, while the area between the upper-right and lower-left corners shows relatively lower stress.
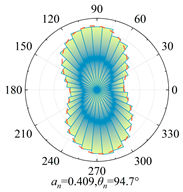
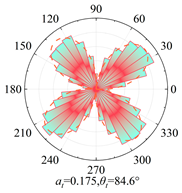
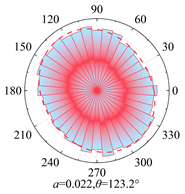
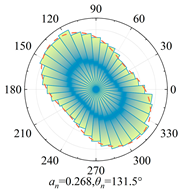
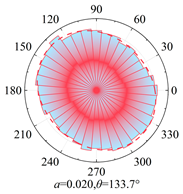
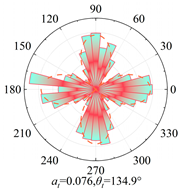
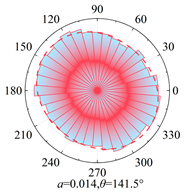
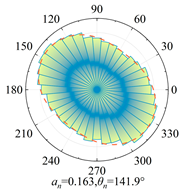
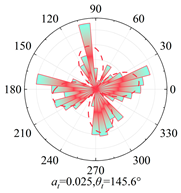
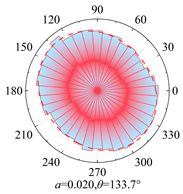
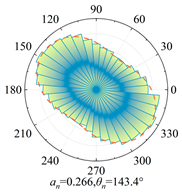
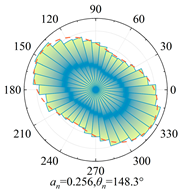
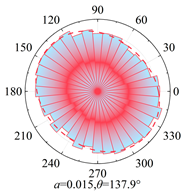
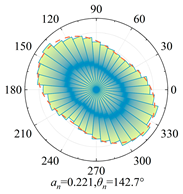
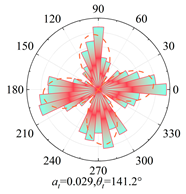
To characterize the evolution of anisotropy during the shearing process, the equation proposed by R.J. Bathurst et al. [29] is employed for fitting analysis, as shown in Equations (5)–(7).
E ( θ ) = 1 2 π 1 + a cos [ 2 ( θ θ a ) ]
f n ( θ ) = f 0 1 + a n cos [ 2 ( θ θ n ) ]
f t ( θ ) = f 0 a t sin [ 2 ( θ θ t ) ]
where a, an, and at are the anisotropy coefficients of the contact normal, normal contact force, and tangential contact force, respectively. θa, θn, and θt are the principal directions of the contact normal, normal contact force, and tangential contact force, respectively. And f0 is the average normal contact force across all contacts.
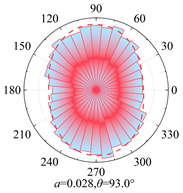
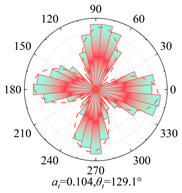
Silty clay is taken as an example to show the anisotropy during shearing and the results are shown in Table 5. The analysis shows that, at zero shear displacement, the principal directions of contact normal, normal contact force, and tangential contact force are all 90°. With increasing shear displacement, the principal directions of anisotropy gradually rotate counterclockwise. The contact normal gradually evolves into an elliptical morphology. The normal contact force exhibits a peanut-shaped distribution, where the maximum contact forces are concentrated in the principal direction. The tangential contact force exhibits a four-leaf clover shape, with its principal directions positioned between two leaves. By comparing the anisotropy coefficients of the two soil types, it is found that a and at are significantly smaller than an. The findings indicate that the load is primarily borne by the normal contact force during shearing and that it also contributes most to the shear strength.

3.2.4. Analysis of Meso–Mechanical Characteristics Under Different Water Contents

To investigate the intrinsic connection between the water content variations caused by external rainfall and mesoscopic mechanical characteristics of rock–soil structures, an analysis of mesoscopic mechanical characteristics under different water contents is performed based on particle displacement evolution pattern, the particle bond failure rate, and the anisotropy coefficient evolution pattern.
Four groups of clay with water contents of 16.1%, 23.8%, 26.7%, and 28% are chosen. The post-shear simulation samples under a vertical pressure of 200 kPa are selected as working conditions to investigate the evolution of particle displacement. The results are shown in Table 6. An analysis of Table 6 found that the average displacement of central particles decreases initially and then increases with rising water content, which is opposite to the trend in the shear strength. During shearing, lower shear box particles are driven to move by upper shear box particles due to interparticle friction and compression, resulting in particle movement and reorganization. The difficulty of reorganization is indicated through the displacement magnitude, where the smaller the displacement, the greater the reorganization difficulty and the higher the shear strength.
Four groups of silty clay with water contents of 16.1%, 21.8%, 22.2%, and 24.9%, along with another four groups of clay with water contents of 16.1%, 23.8%, 26.7%, and 28%, are chosen. The post-shear simulation samples under a vertical pressure of 200 kPa are used as working conditions to investigate the evolution of the particle bond failure rate.
Within the linear contact bond model, when the shear force acting on the interparticle bond exceeds its limit strength, bond failure occurs, after which interparticle interactions degrade to a linear contact relationship. The intrinsic mechanisms governing the mesoscopic mechanical characteristics of soils can be performed through the analysis of the bond failure behavior in different water contents. To quantify the degree of bond failure, the bond failure rate is employed as a quantitative indicator, as shown in Equation (8).
B d = N i N
where Bd is the bond failure rate, Ni is the number of linear contacts under different conditions, and N is the total number of contacts.
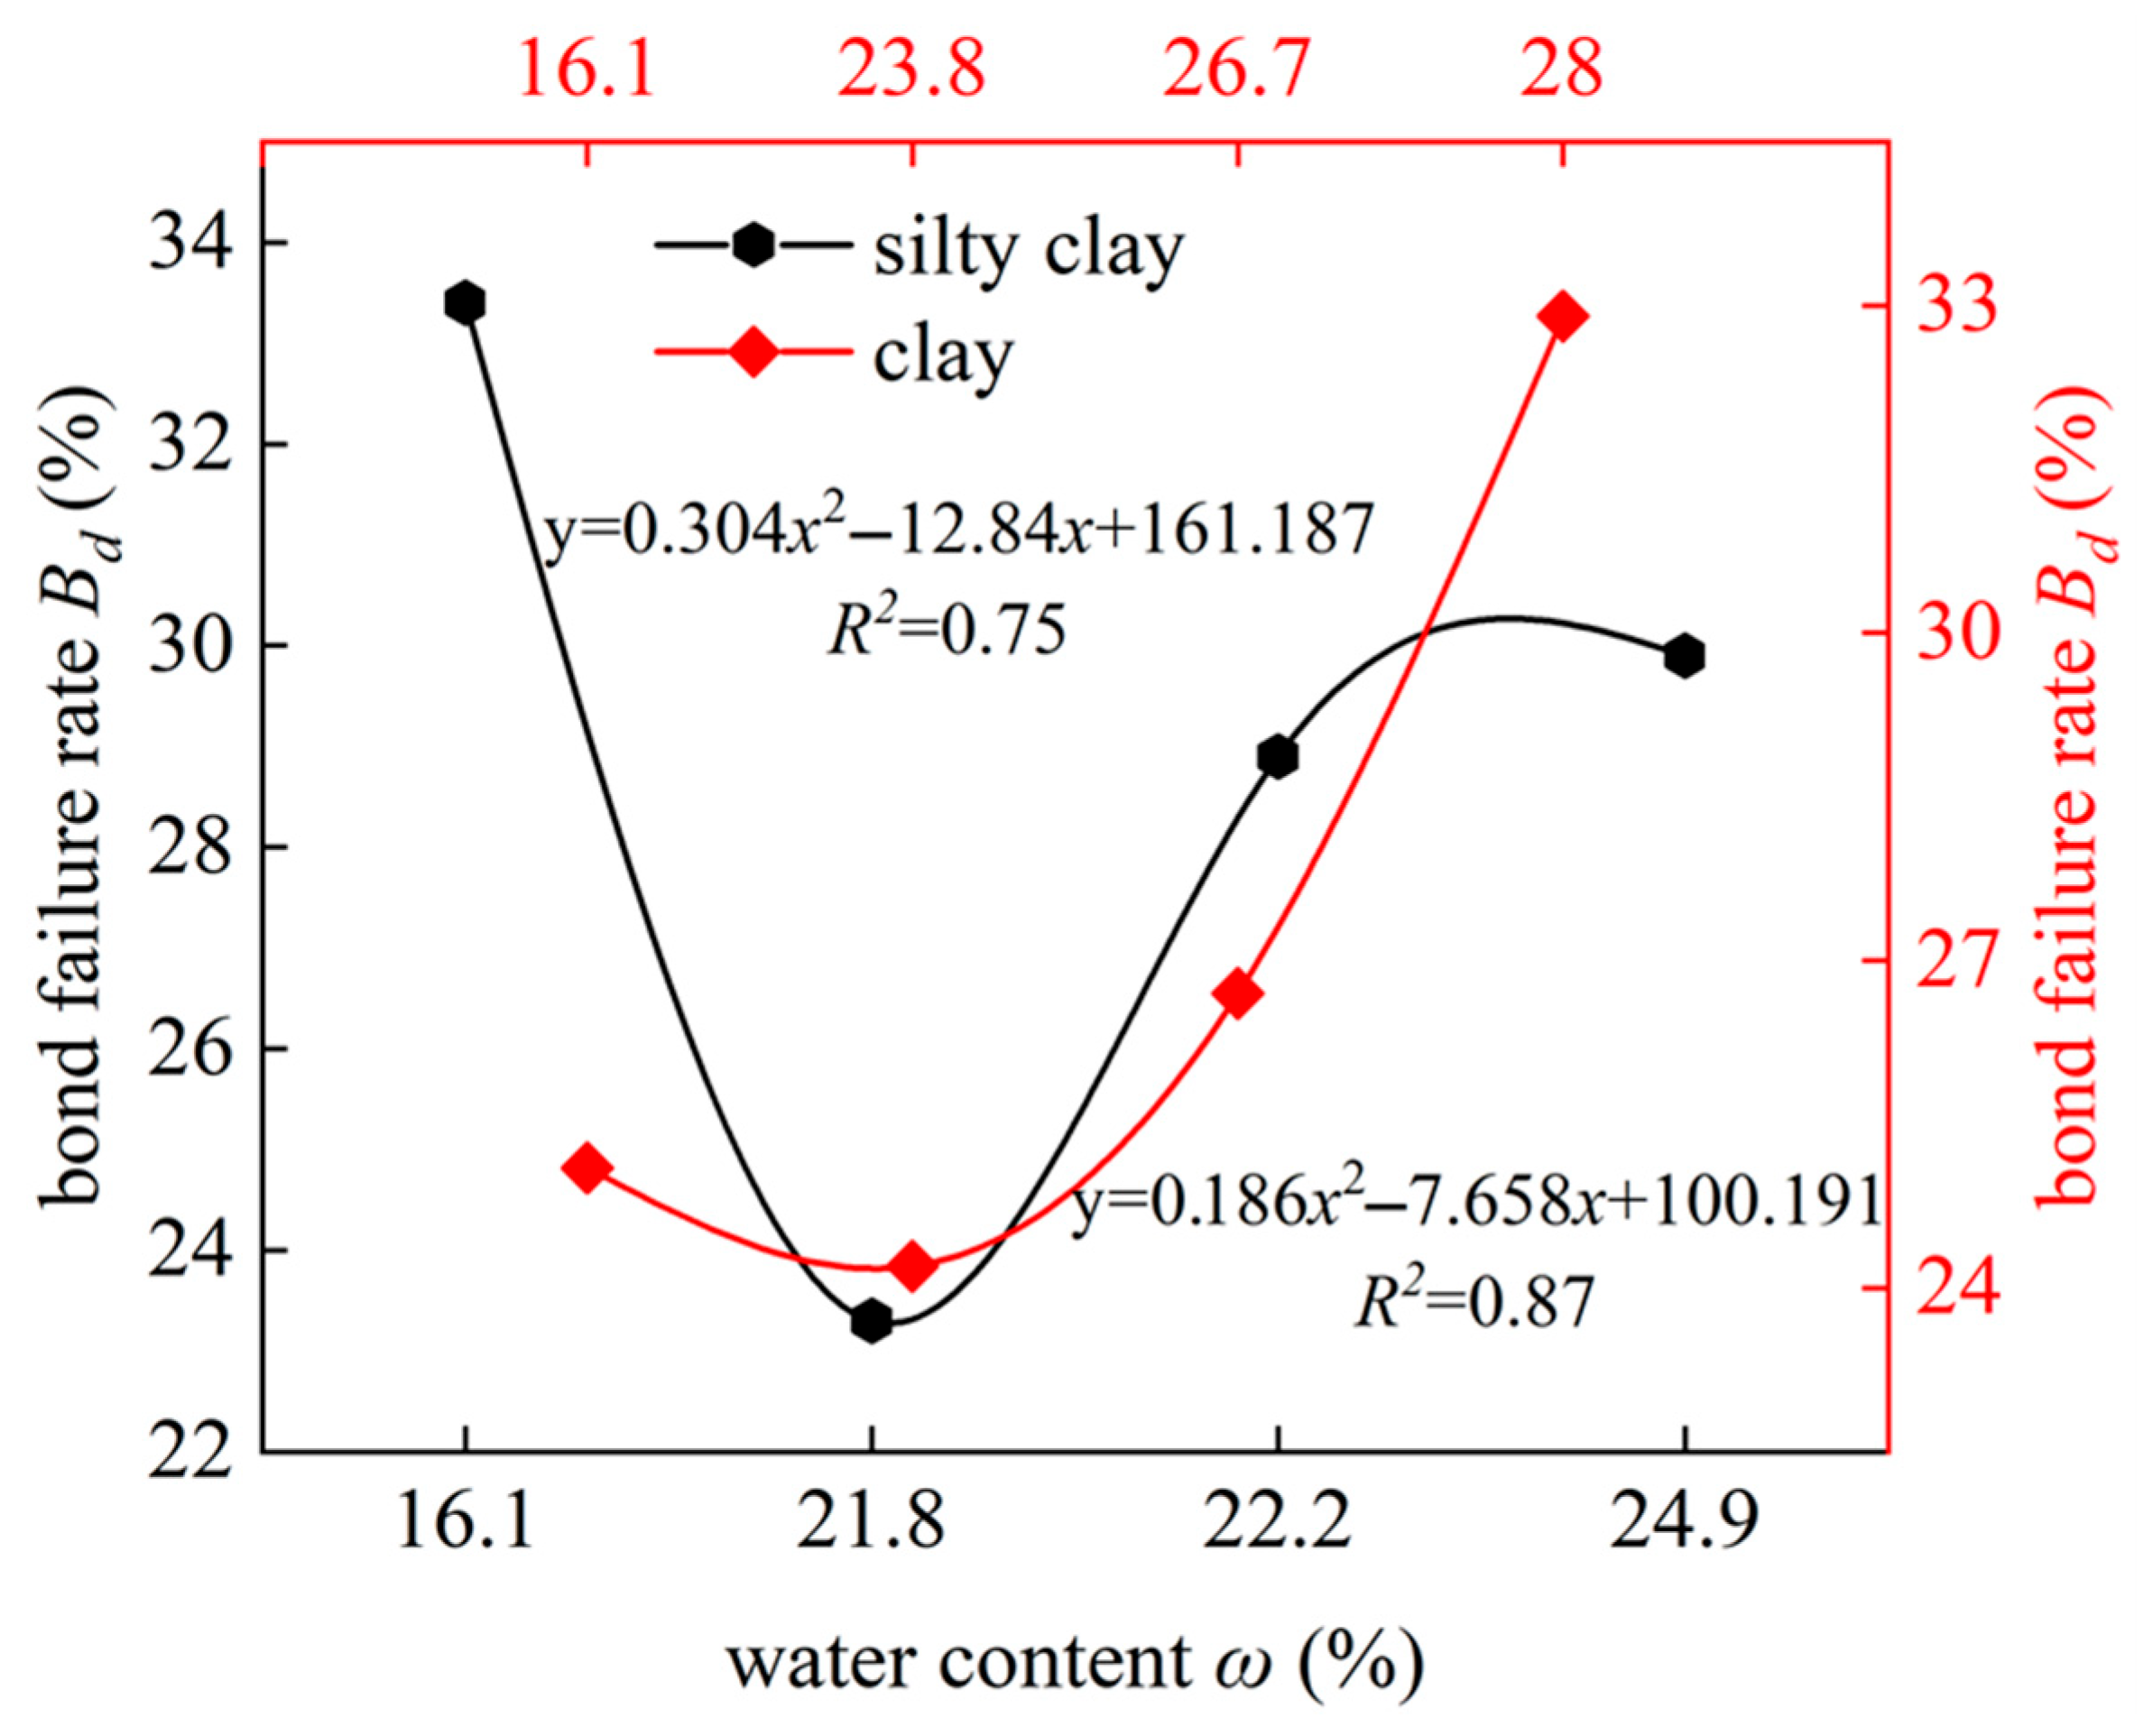
Figure 5 shows the change in the bond failure rate of silty clay and clay samples with water content and the quantitative relationships between the water content and the bond failure rate. The results indicate that the relationship between the bond failure rate and the water content follows an upward-opening parabolic curve. When the water content is below the optimum level, the bond failure rate decreases with increasing water content. Conversely, when the water content exceeds the optimum level, the bond failure rate increases accordingly. Notably, the trend in bond failure rate with varying water content opposes that of the shear strength. This comparison indicates that there is a significant negative correlation between the macroscopic shear strength of soil and the interparticle bond failure rate, consistent with the findings reported by Zhang et al. [30].
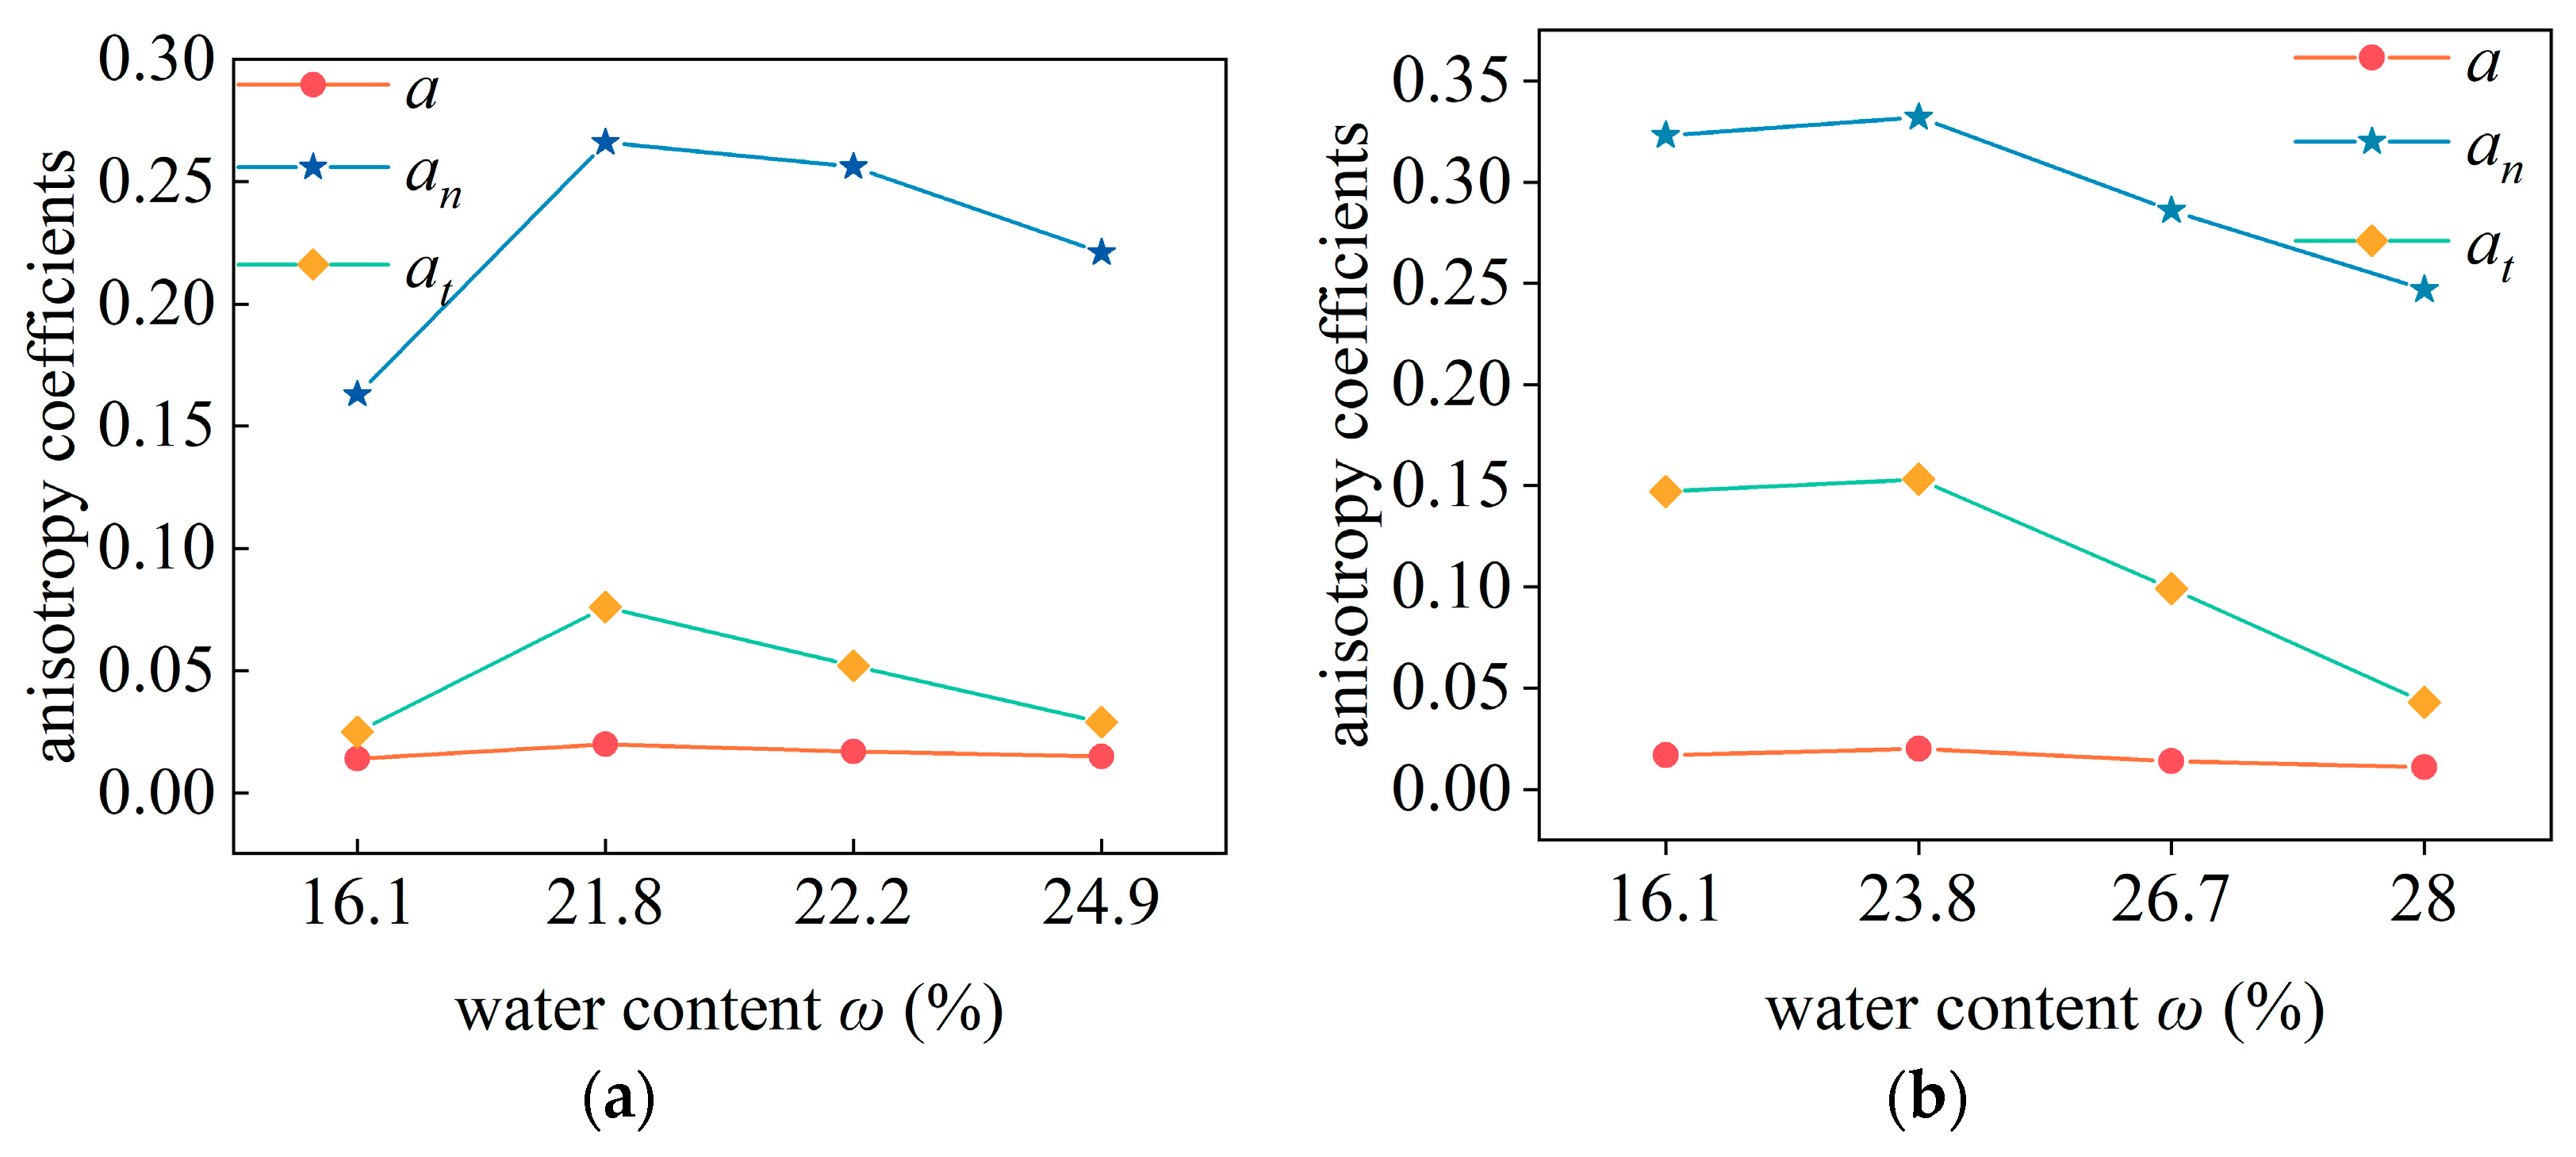
The post-shear samples of silty clay (water content 16.1%, 21.8%, 22.2%, 24.9%) and clay (water content 16.1%, 23.8%, 26.7%, 28%) under a vertical pressure of 200 kPa are chosen as the research conditions. Using Equations (5) and (6) to fit the samples, the anisotropy evolution results are shown in Figure 6 and Table 7. Analysis shows that, with increasing water content, the anisotropy coefficients a, an, and at all exhibit a nonlinear trend of initial increase followed by a subsequent decrease.
The anisotropy coefficient a characterizes the degree of anisotropy in the contact normal distribution among particles [29]. During shearing, the particle system dynamically adjusts its contact direction to optimize the force transmission pathways and adapt to stress variations. Soils with different water contents exhibit varying resistance to shear deformation, leading to distinct distributions of particle contact directions post-shear. When the soil is close to its optimal water content, the contact force chains become more concentrated along the principal direction. And there is an increase in the anisotropy coefficient a, at the same time macroscopically showing as an increase in the shear strength of the soil. After exceeding the optimum water content, the concentration of the contact force chain in the principal direction decreases. And the anisotropy coefficient a gradually decreases, and at the same time the soil’s shear strength weakens.
The anisotropy coefficient an characterizes the degree of difference in the magnitude of normal contact force across different directions. The normal contact force is the main contributor to the shear strength, which can reflect the normal load-bearing capacity of the force chain [31]. Prior to optimum water content, the anisotropy coefficient an increases with increasing water content, enhancing force chain load-bearing capacity, and at the same time, the shear strength is improved. Conversely, beyond the optimum water content, these trends are reversed.
The anisotropy coefficient at characterizes the degree of difference in the magnitudes of tangential normal forces across different directions. The tangential contact force is provided by the tangential bond strength and friction resistance [32,33]. Below the optimum water content, soil interparticle bond strength is enhanced through capillary action. This strengthened bonding increases the force required for interparticle relative sliding, and at the same time the tangential anisotropy coefficient at shows an increase. However, beyond the optimum water content, interparticle water lubrication becomes dominant, with tangential bond strength and interparticle frictional resistance being reduced, and at the same time the tangential anisotropy coefficient at decreases. This trend is consistent with the pattern of the shear strength changes.

3.2.5. Macro–Mesoscopic Synergistic Analysis of Rock–Soil Strength Degradation

To explore the macro–mesoscopic intrinsic mechanisms of rock–soil strength degradation, a synergistic macro–mesoscopic analysis is performed based on the relationships among the water content, the shear strength, and the mesoscopic parameters. This analysis further provides a foundation for parameter calibration. The linear contact bond model is employed to simulate the mechanical characteristics of rock–soil, with mesoscopic parameters continuously adjusted to ensure numerical simulation results gradually tend toward laboratory test data. When the two are substantially consistent, this group of parameters is deemed capable of effectively characterizing the soil’s macroscopic mechanical characteristics. It is shown that the normal bond strength, the tangential bond strength, and the friction coefficient are found to be the primary parameters affecting the shear strength of soil under different water contents [34].
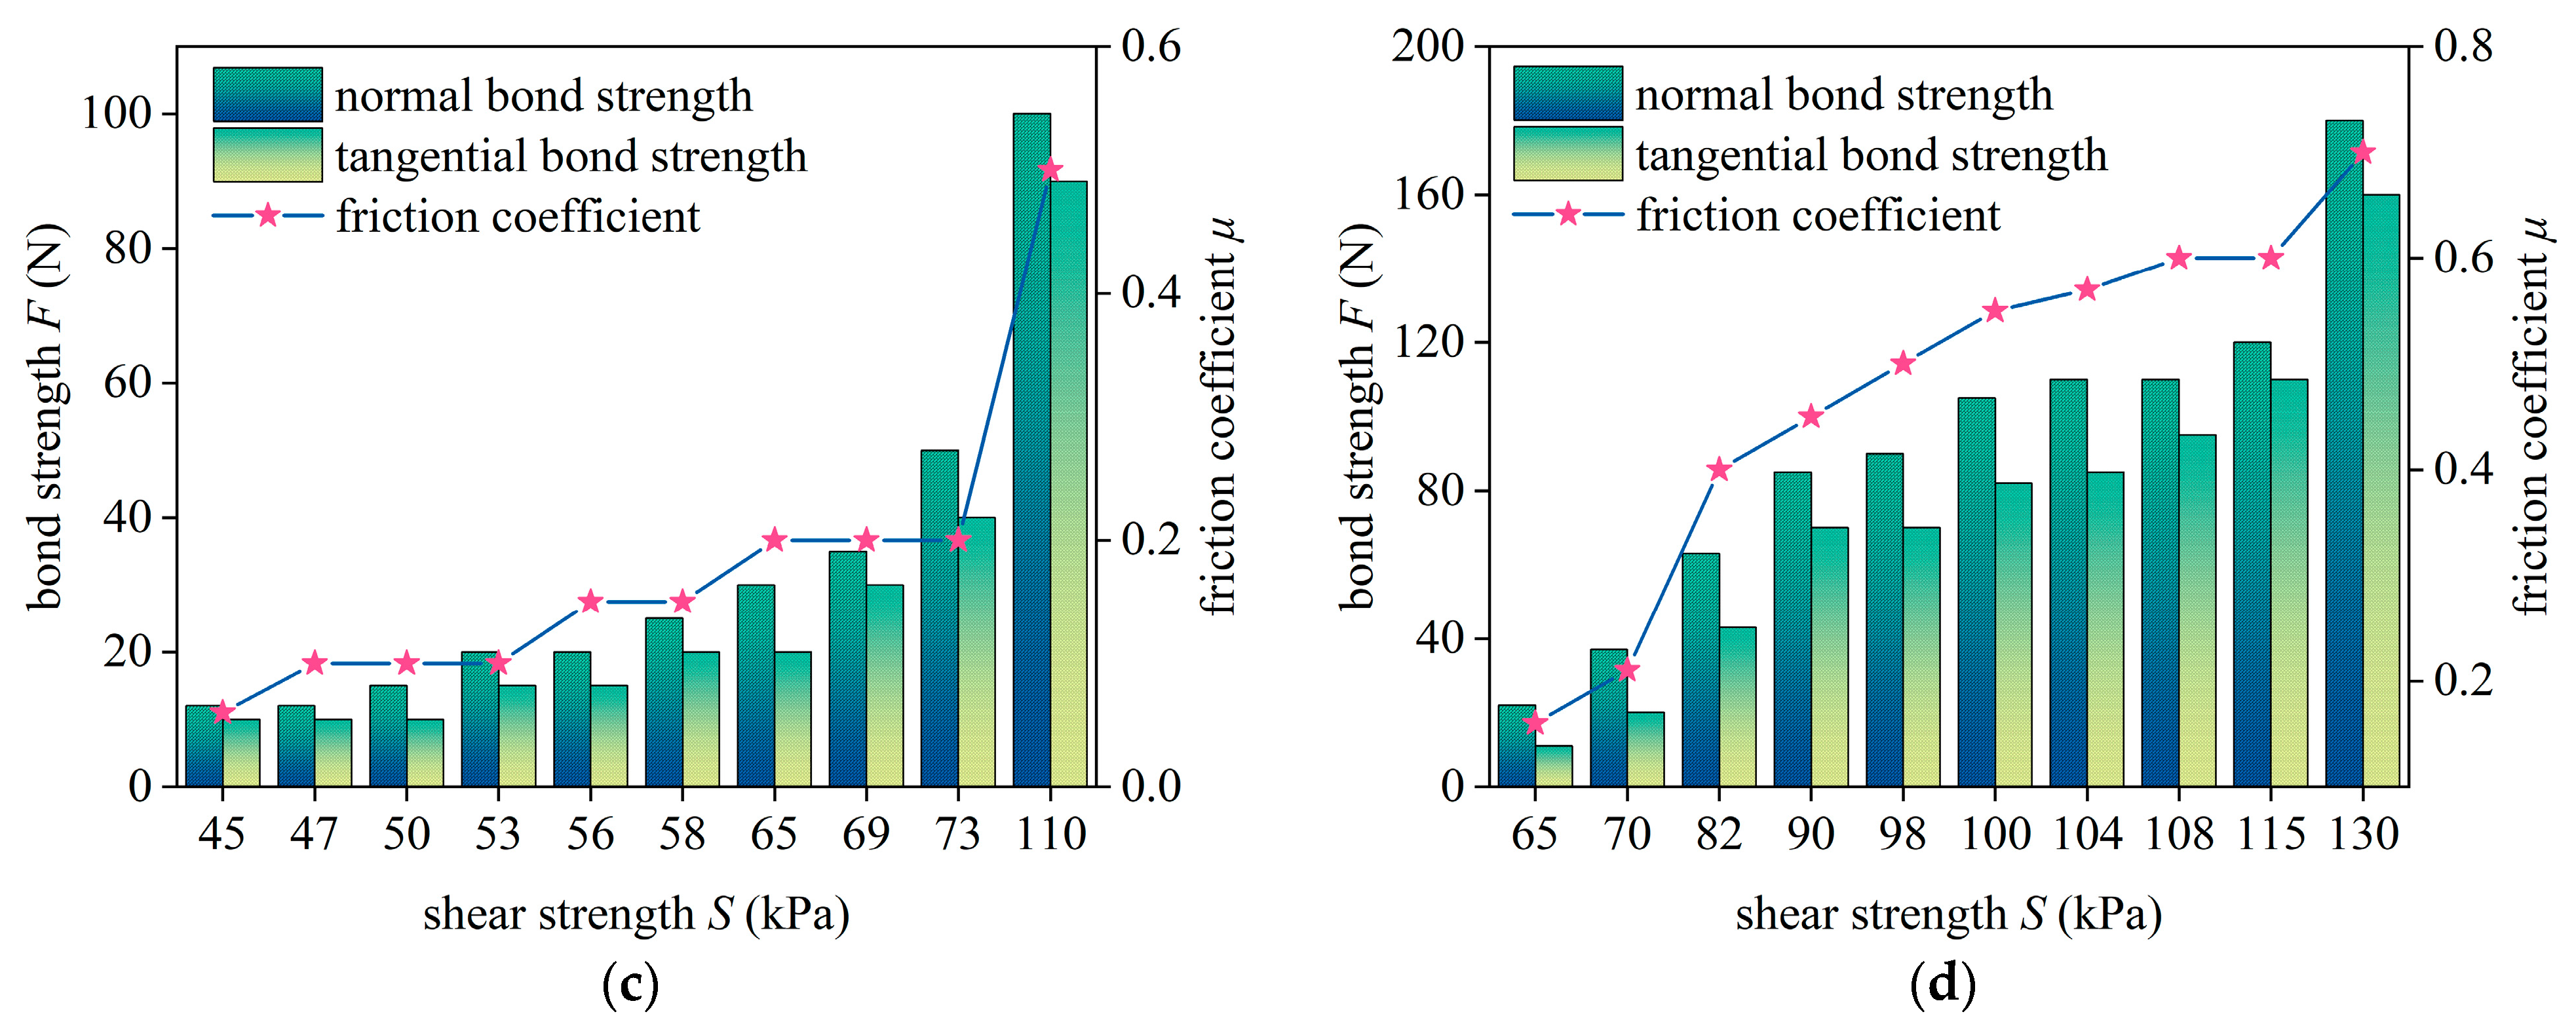
To investigate the intrinsic relationships among the water content, the shear strength, and the mesoscopic parameters, working conditions are designed under a vertical pressure of 200 kPa based on different water contents. A total of 20 working conditions are employed, including 10 groups of silty clay and 10 groups of clay. The relationships between mesoscopic parameters and water content are shown in Figure 7a,b. The results indicate that both the bond strength and the friction coefficient initially increase and then decrease with increasing water content. As the water content approaches the optimum, it enhances interparticle bonding, bringing particles into closer contact and gradually increasing bond strength and the friction coefficient. When exceeding the optimum water content, water acts as a lubricant between particles, reducing interparticle bond strength and the friction coefficient. This reduction leads to a decrease in the macroscopic shear strength and exhibits rock–soil strength degradation [35,36].
Figure 7c,d show that the bond strength and the friction coefficient exhibit a positive correlation with the shear strength. As the bond strength increases, the shear force required to break the bond also increases, with the shear strength hence being enhanced. Meanwhile, the friction coefficient reflects the interparticle resistance. It is indicated by the increase in its value that particles face greater difficulty sliding past each other, requiring a higher shear force for movement and hence enhancing the shear strength [37]. Comparative analysis of Figure 7 reveals that the water content of rock–soil gradually approaches the optimum under rainfall, increasing interparticle bond strength and hence enhancing the shear strength. The water content in rock–soil is driven beyond the optimum by continuous rainfall, leading to reduced bond strength and friction coefficient, which in turn leads to degradation of rock–soil strength.

4. DEM Parameter Calibration Model Considering External Environmental Factors

4.1. Methodology

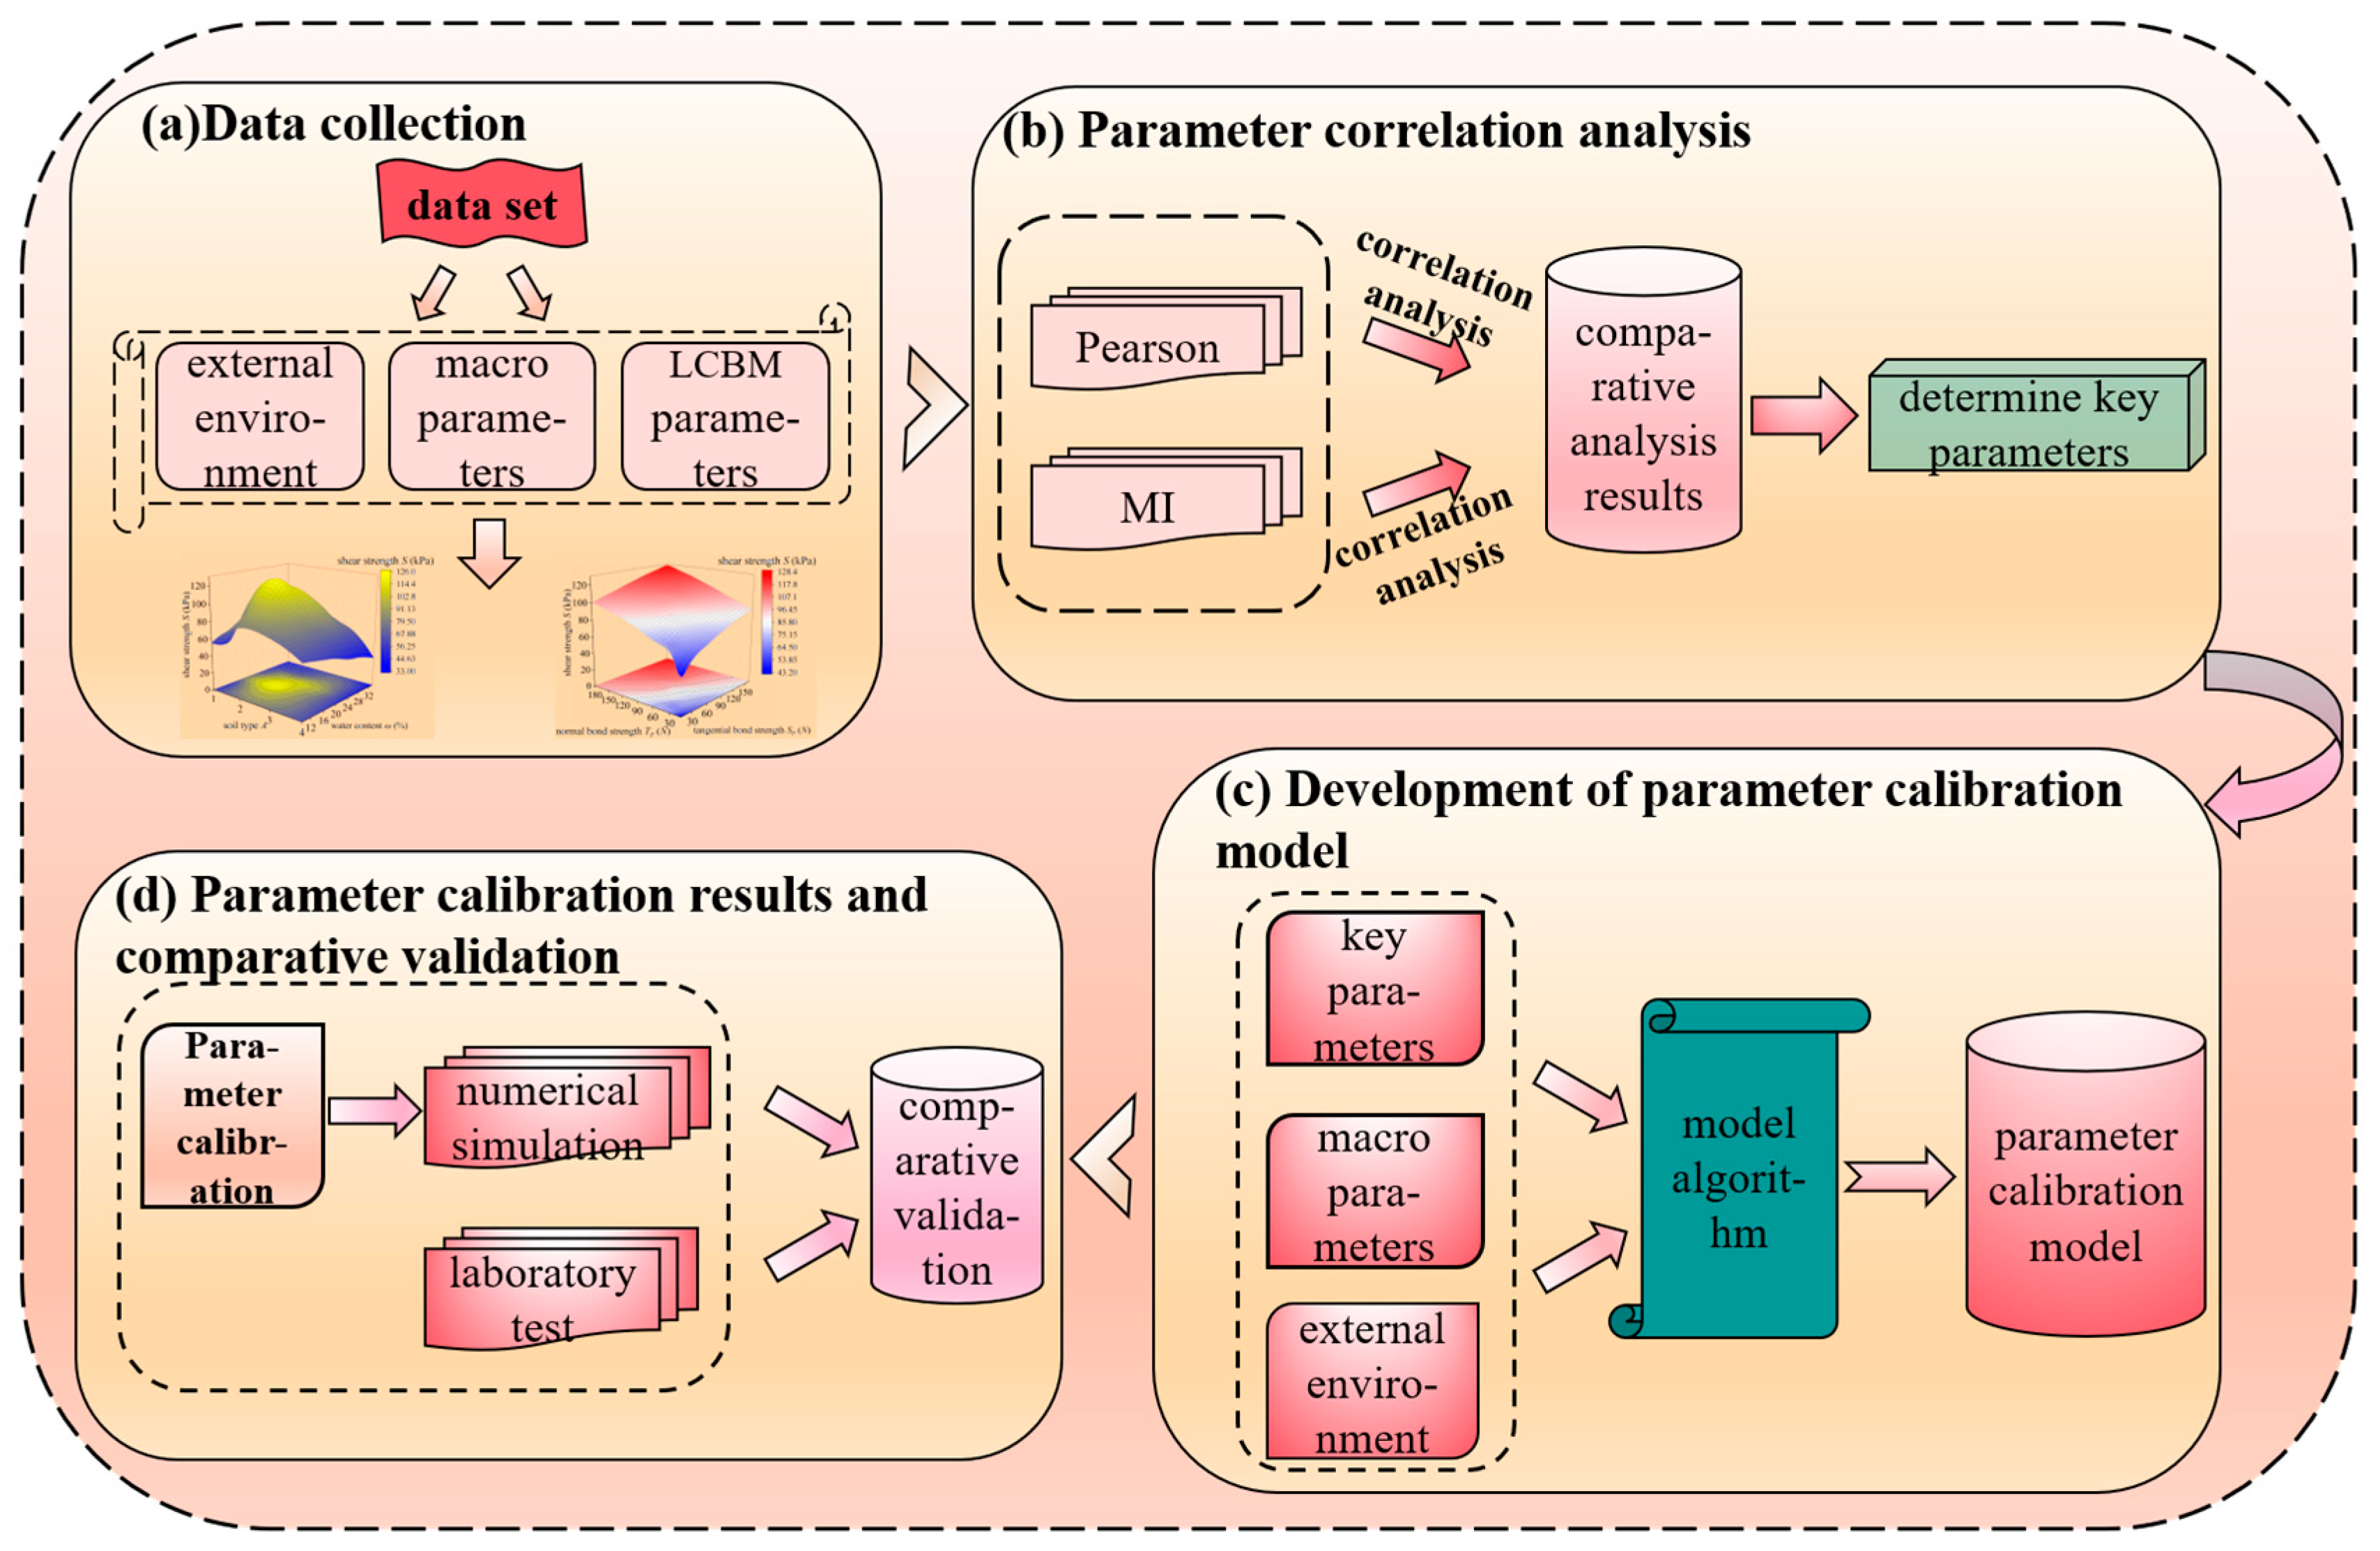
The choice of contact model parameters is pivotal to determining the accuracy of simulation results in the DEM. The traditional parameter calibration method is trial and error, but it is time-consuming and arbitrary. Most extant parameter calibration models only consider the relationship between internal contact parameters and macroscopic parameters of rock–soil structures, while neglecting the influence of external environmental factors, resulting in a lack of specificity. Hence, a method for LCBM parameter calibration considering external environmental influences is proposed, as shown in Figure 8. First, a data set is constructed using multiple sets of macro–mesoscopic parameters obtained from simulations. Second, diverse correlation analysis methods are employed on these parameters to determine key LCBM parameters. Then, statistical methods are employed to analyze the mapping relationship between macro key parameters and the external environment, and a parameter calibration model is developed. Finally, the model accuracy is verified by comparing the calibrated simulation results with laboratory test results.
Step 1: Data collection.
First, four types of soil samples with different water contents are designed. And each sample underwent a numerical simulation of a direct shear test under different vertical pressures, comprising a total of 180 working conditions. Secondly, the PFC 6.0 software is employed to perform numerical direct shear simulations on the 180 working conditions, from which the macroscopic shear strength and corresponding LCBM parameters are derived. The macroscopic parameter is the shear strength S. The external environment includes water content ω, density ρ, vertical pressure σ, and soil type A, where soil types are replaced by 1, 2, 3, and 4 in the data set. The LCBM parameters include effective modulus E, stiffness ratio k, normal bond strength TF, tangential bond strength SF, and friction coefficient μ. Finally, a structured data set is constructed based on the numerical simulation results, integrating macroscopic parameters across all working conditions with LCBM parameters derived from calibration. This data set is intended to develop a quantitative relationship between the macroscopic parameters of soil under external environments and the mesoscopic contact parameters of the DEM.
Step 2: Parameter correlation analysis.
The Pearson [38] and MI [39] methods are employed to perform correlation analyses between the LCBM parameters and the shear strength, aiming to determine LCBM parameters exhibiting strong correlations with the shear strength. The algorithms are shown in Equations (3) and (4). By comparing the results from the two algorithms, parameters with high correlation are determined as key parameters, which are subsequently used to develop a parameter calibration model.
Step 3: Development of parameter calibration model.
First, statistical methods are used to explore the mapping relationship among the external environment, key parameters and the macroscopic parameters, and a predictive model targeting key parameters is developed. Secondly, the accuracy of the model is validated using the goodness-of-fit R2. Bar charts and error distribution diagrams of the calculated shear strength predictions and the real values derived from DEM simulations are plotted. Finally, to account for interactions between parameters, each parameter within the key parameters is fixed as a reference value, and the remaining parameters are inverted using the developed model. The inversion parameters are then compared with the original simulated parameters, and the small error verifies the strong mathematical correlation of submodels.
Step 4: Parameter calibration results and comparative validation.
First, the calibration working conditions are designed. Three water contents are selected for silty clay, clay, and silt, with five vertical pressures applied for each water content. The macroscopic shear strength is obtained from laboratory direct shear tests. Secondly, key parameters are calculated using parameter calibration models. The middle values of the respective value ranges of the remaining LCBM parameters are chosen to form a complete set of LCBM parameters. Finally, numerical simulations of the corresponding working conditions are performed using this parameter set. The accuracy of the parameter calibration model is validated through comparison with laboratory test results.

4.2. Research Results

4.2.1. Design of Working Conditions and Construction of Data Sets

Four types of typical soil samples are designed, including 10 different water content levels for silty clay, clay, and silt, and 6 different water content levels for sandy clay. Each soil water content sample is subjected under five vertical pressures of 50, 100, 200, 300, and 400 kPa to perform laboratory tests and numerical simulations of the direct shear tests. This results in a total of 180 simulated working condition combinations. Each working condition includes the macroscopic parameters, the mesoscopic LCBM parameters, and the external environment factors. The water content values were selected based on a comprehensive review of existing literature [40,41]. The water content of the 180 test samples in this study ranged from 9.5% to 32%, while the corresponding ranges in the literature were 11% to 21% and 10% to 22%. The range was designed to encompass the typical values reported in previous studies for similar soils and testing conditions. Furthermore, we appropriately extend this range beyond the values commonly found in the literature to ensure a more comprehensive investigation of the soil’s behavior under a wider spectrum of conditions.
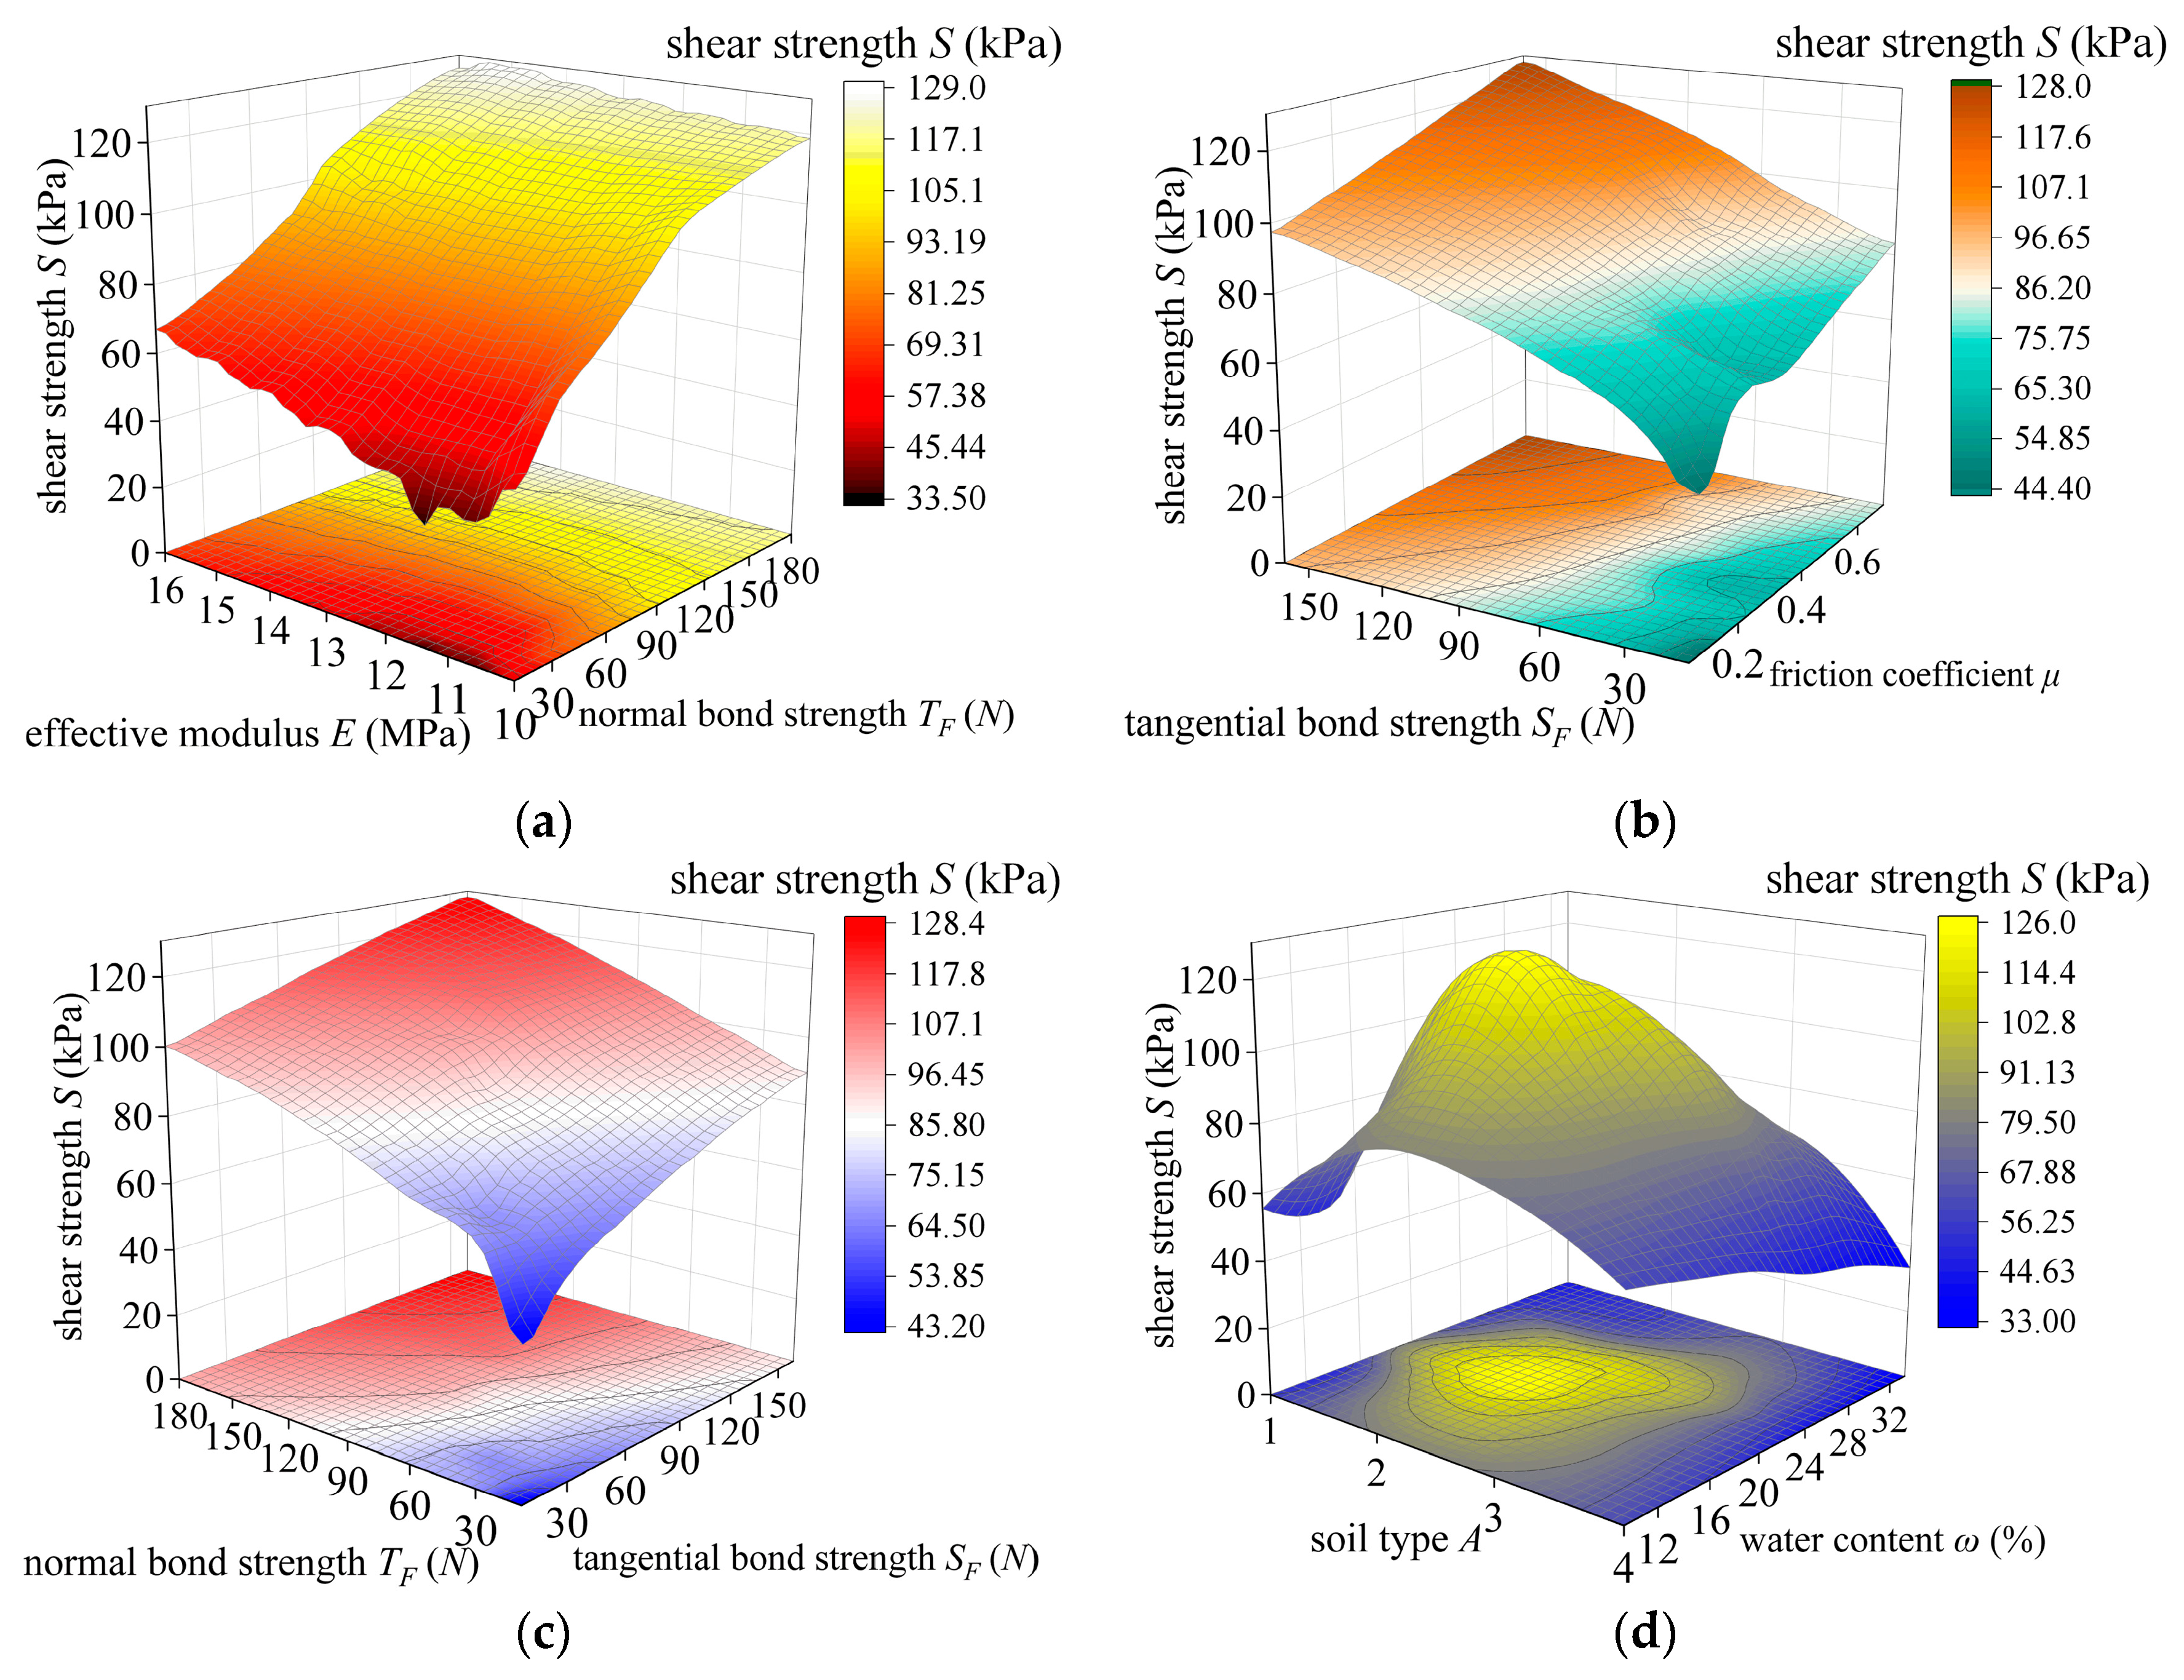
A part of the parameter data and their relationships are shown in Figure 9. Due to minor discrepancies in the fitting surfaces generated through Origin 2024 software, slight deviations exist between the data presented in the figure and the original data. Nevertheless, the overall patterns remain consistent. The analysis shows that the shear strength increases with the mesoscopic parameters, but the degree of enhancement depends on the parameter. Both effective modulus and normal bond strength boost the shear strength, with normal bond strength exerting a more pronounced effect. The tangential bond strength and the friction coefficient also enhance the shear strength, where the tangential bond strength dominates. When analyzed separately, the normal and the tangential bond strengths contribute comparably to the shear strength improvement. Across soil types, the effect of water content follows a common pattern where the shear strength first rises, then declines, as the water content increases.

4.2.2. Correlation Analysis of Macro–Mesoscopic Parameters

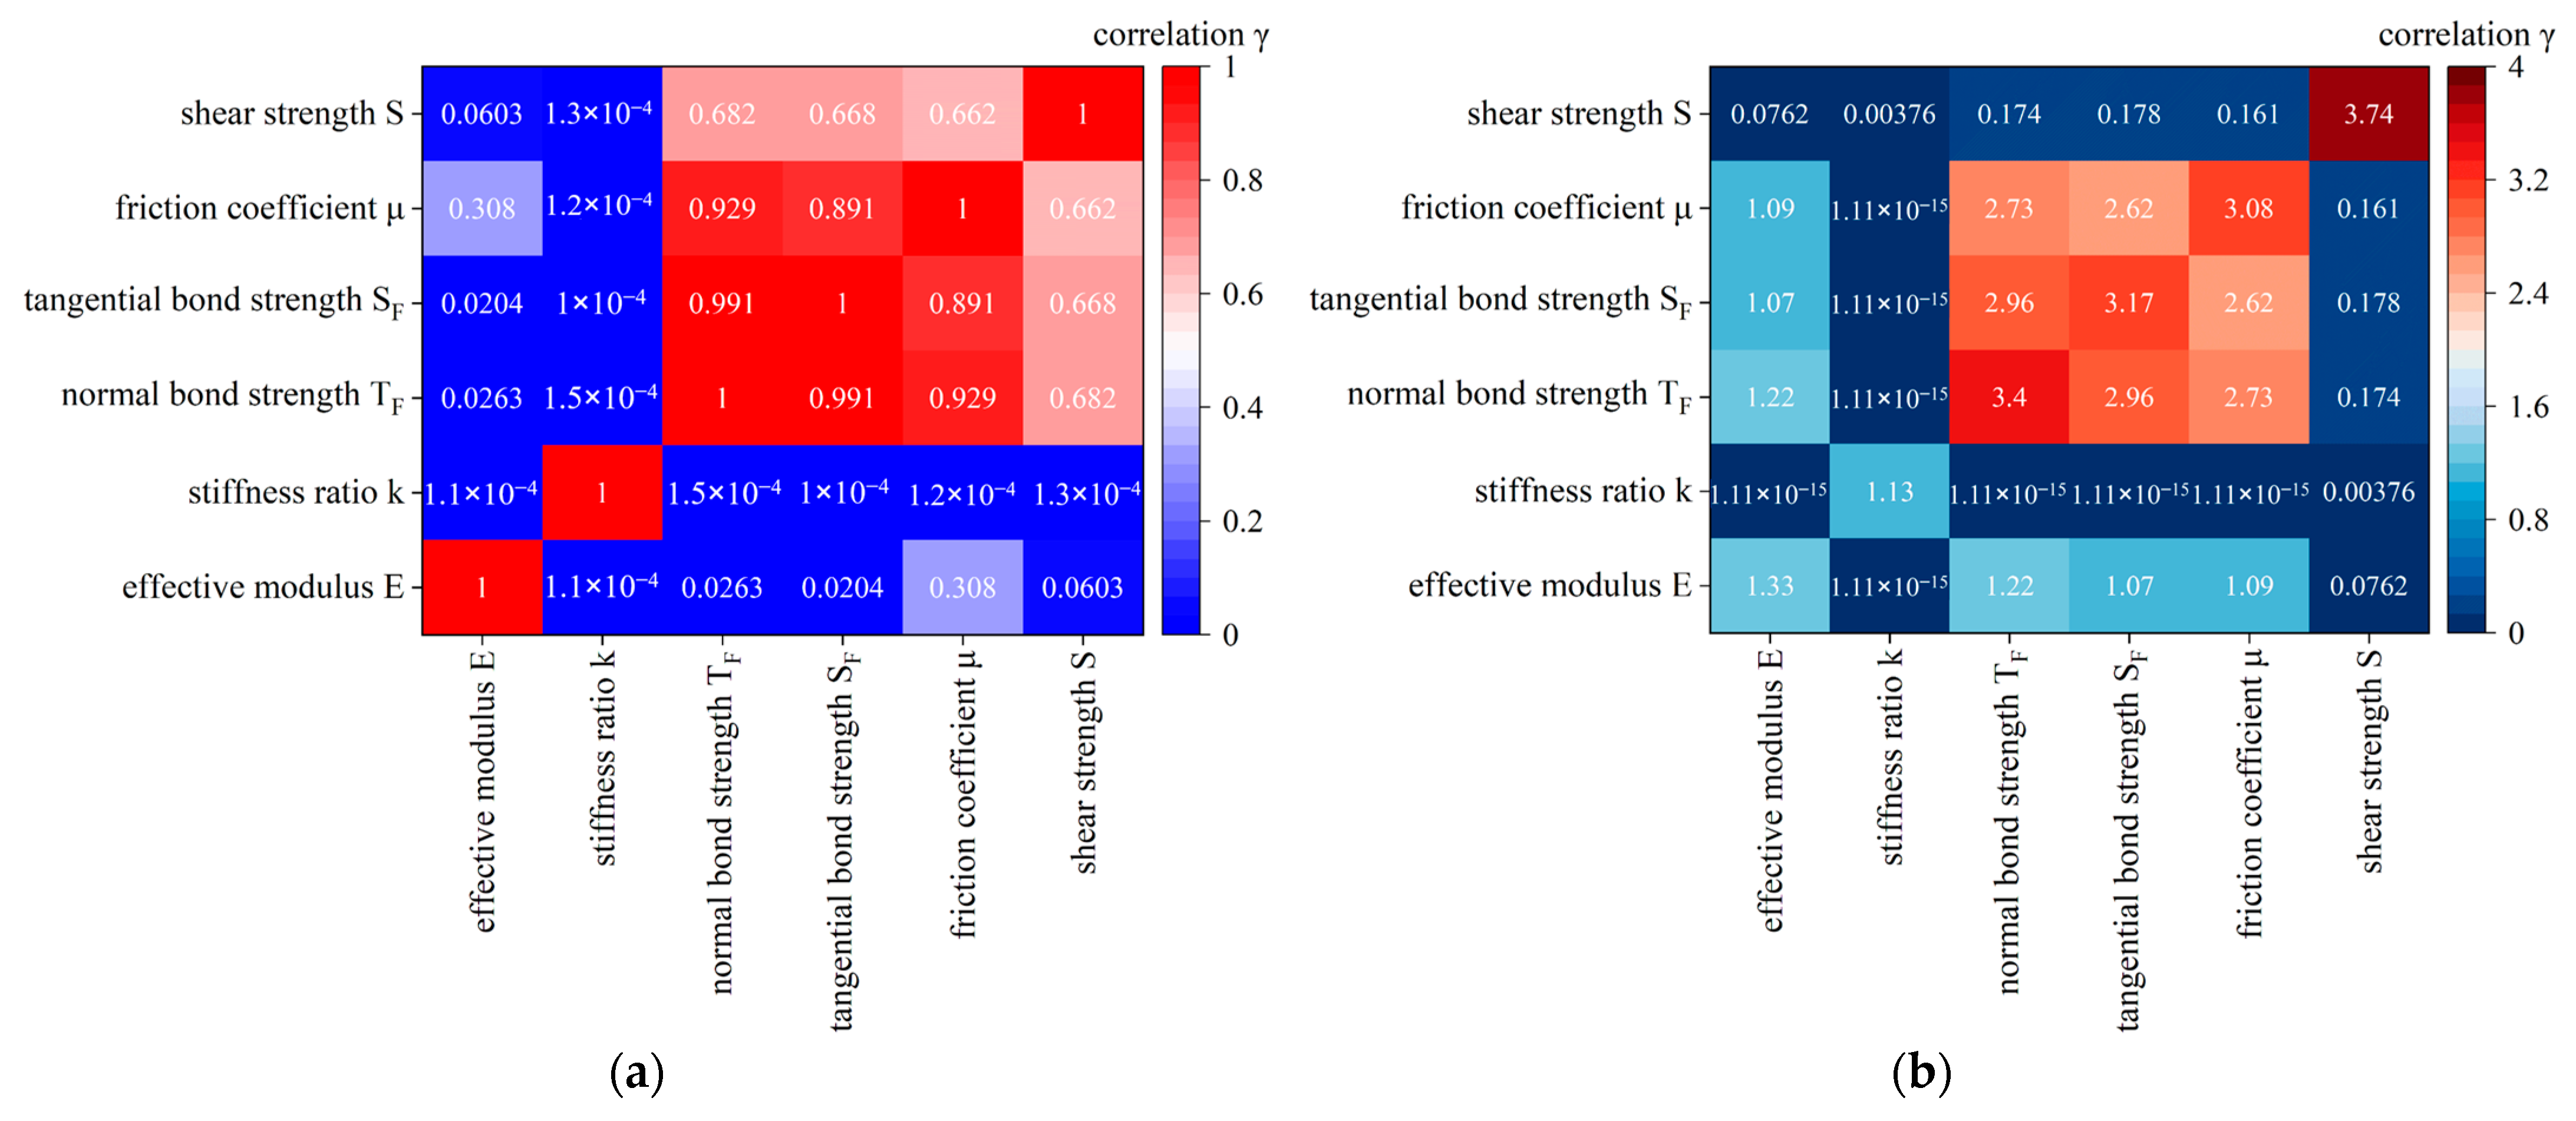
To determine the mesoscopic parameters that most significantly affect macro shear strength in the constructed data set, the study focuses on two key methods. Pearson and MI analyses were applied to quantify their correlation. Among them, the Pearson analysis measures the linear correlation between parameters. A correlation coefficient approaching 1 indicates a strong correlation, while for this study, a value exceeding 0.6 is defined as a strong correlation. Similarly, MI characterizes the degree of statistical dependence among multiple random variables, where a higher MI value corresponds to a stronger correlation. The two methods are combined synergistically to indicate the interaction patterns between macroscopic and mesoscopic parameters.
Figure 10a presents the Pearson analysis results, indicating that mesoscopic LCBM parameters with a correlation coefficient exceeding 0.6 with macroscopic shear strength are ranked in order as normal bond strength, tangential bond strength, and friction coefficient. Correspondingly, the MI analysis in Figure 10b shows that the mesoscopic LCBM parameters are ranked as tangential bond strength, normal bond strength, and friction coefficient in order of their dependence on shear strength. Higher correlations than the friction coefficient are exhibited by the normal and tangential bond strengths in both approaches, as indicated by the correlation results from both methods. This consistency confirms the reliability of both methods’ results. Through cross-validation results from the above statistical methods, the normal bond strength, the tangential bond strength, and the friction coefficient are ultimately determined as key parameters.

4.2.3. Development of Parameter Calibration Model

The ordinary least squares (OLS) method is employed to perform regression analysis on the mapping relationship among the external environment, the macroscopic parameters, and the three key parameters, developing three submodels, namely Equations (9)–(11). The goodness-of-fit R2 values for these submodels all exceed 0.92.
y 1 = 95.2187 2.3478 x 1 1.4441 x 2 + 70.0204 x 3 + 0.2679 x 4 + 0.4458 x 5    ( R 2 = 0.92719 )
y 2 = 133.5734 1.3568 x 1 2.0252 x 2 + 99.8899 x 3 + 0.2679 x 4 + 0.4512 x 6    ( R 2 = 0.92506 )
y 3 = 6.4066 6.0348 x 1 0.6291 x 2 + 10.4313 x 3 + 0.2679 x 4 + 105.0771 x 7    ( R 2 = 0.92348 )
where y1, y2, and y3 are shear strength, x1 is soil type, x2 is water content, x3 is density, x4 is vertical pressure, x5 is normal bond strength, x6 is tangential bond strength, and x7 is friction coefficient.
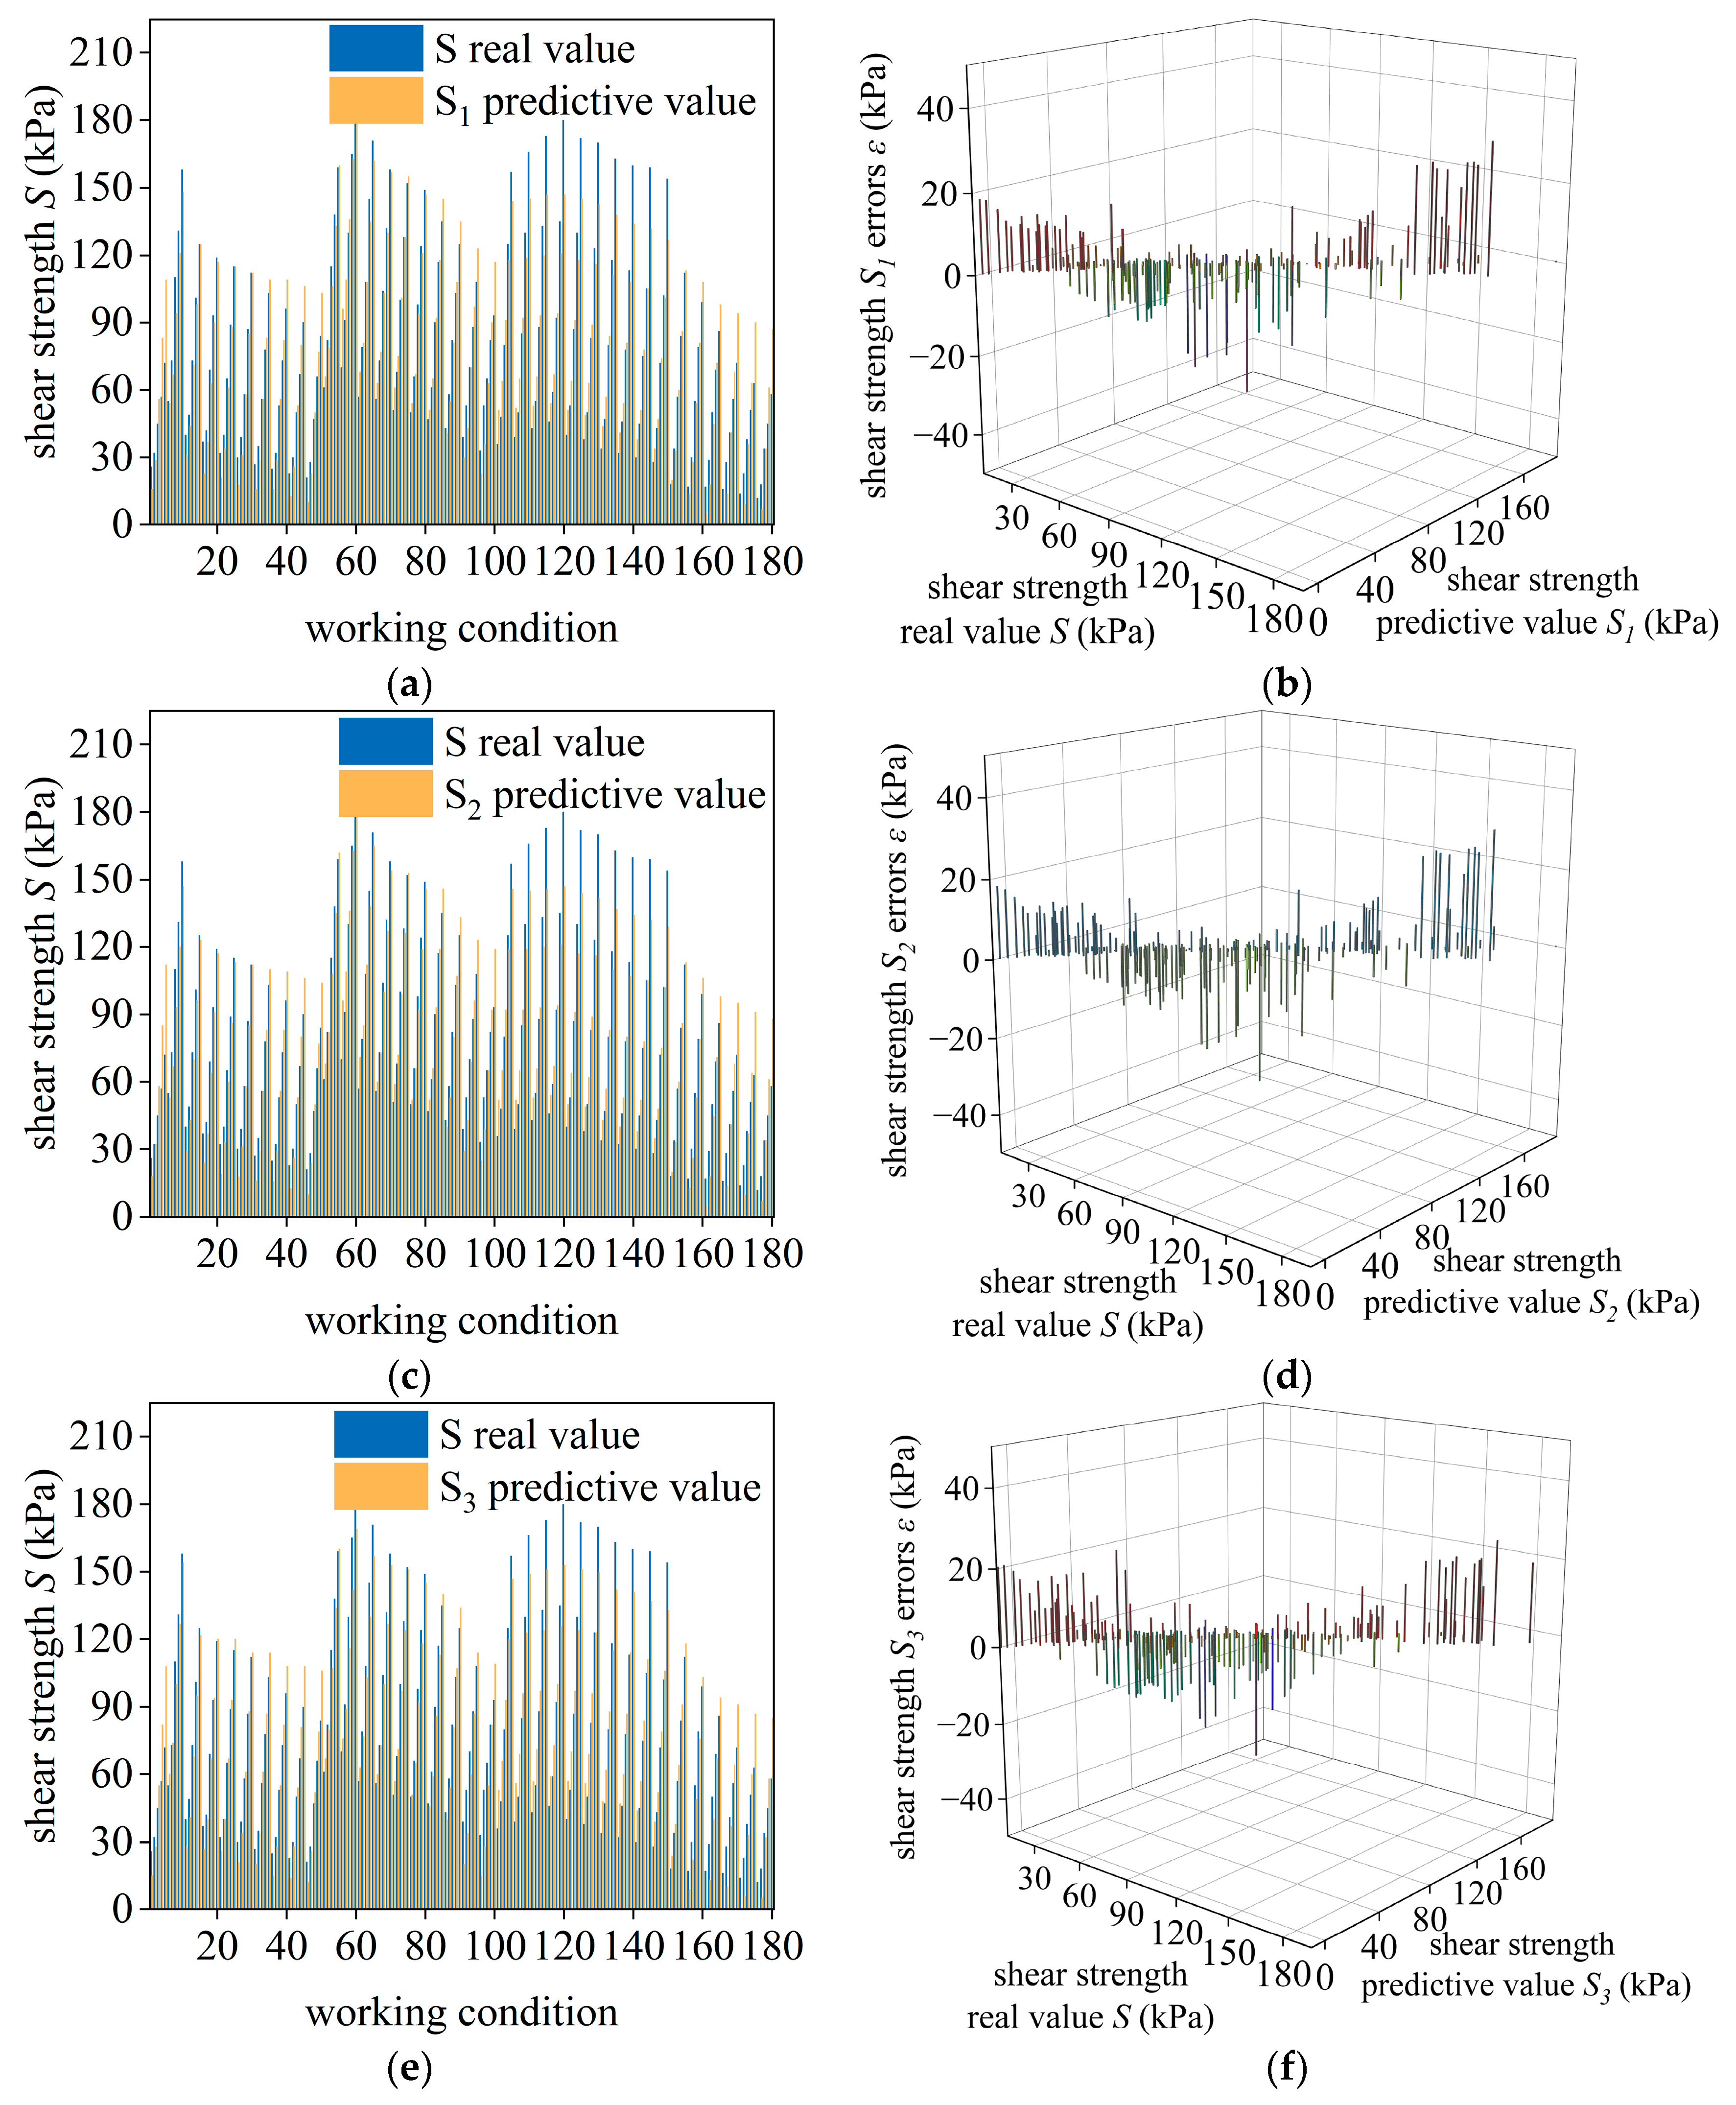
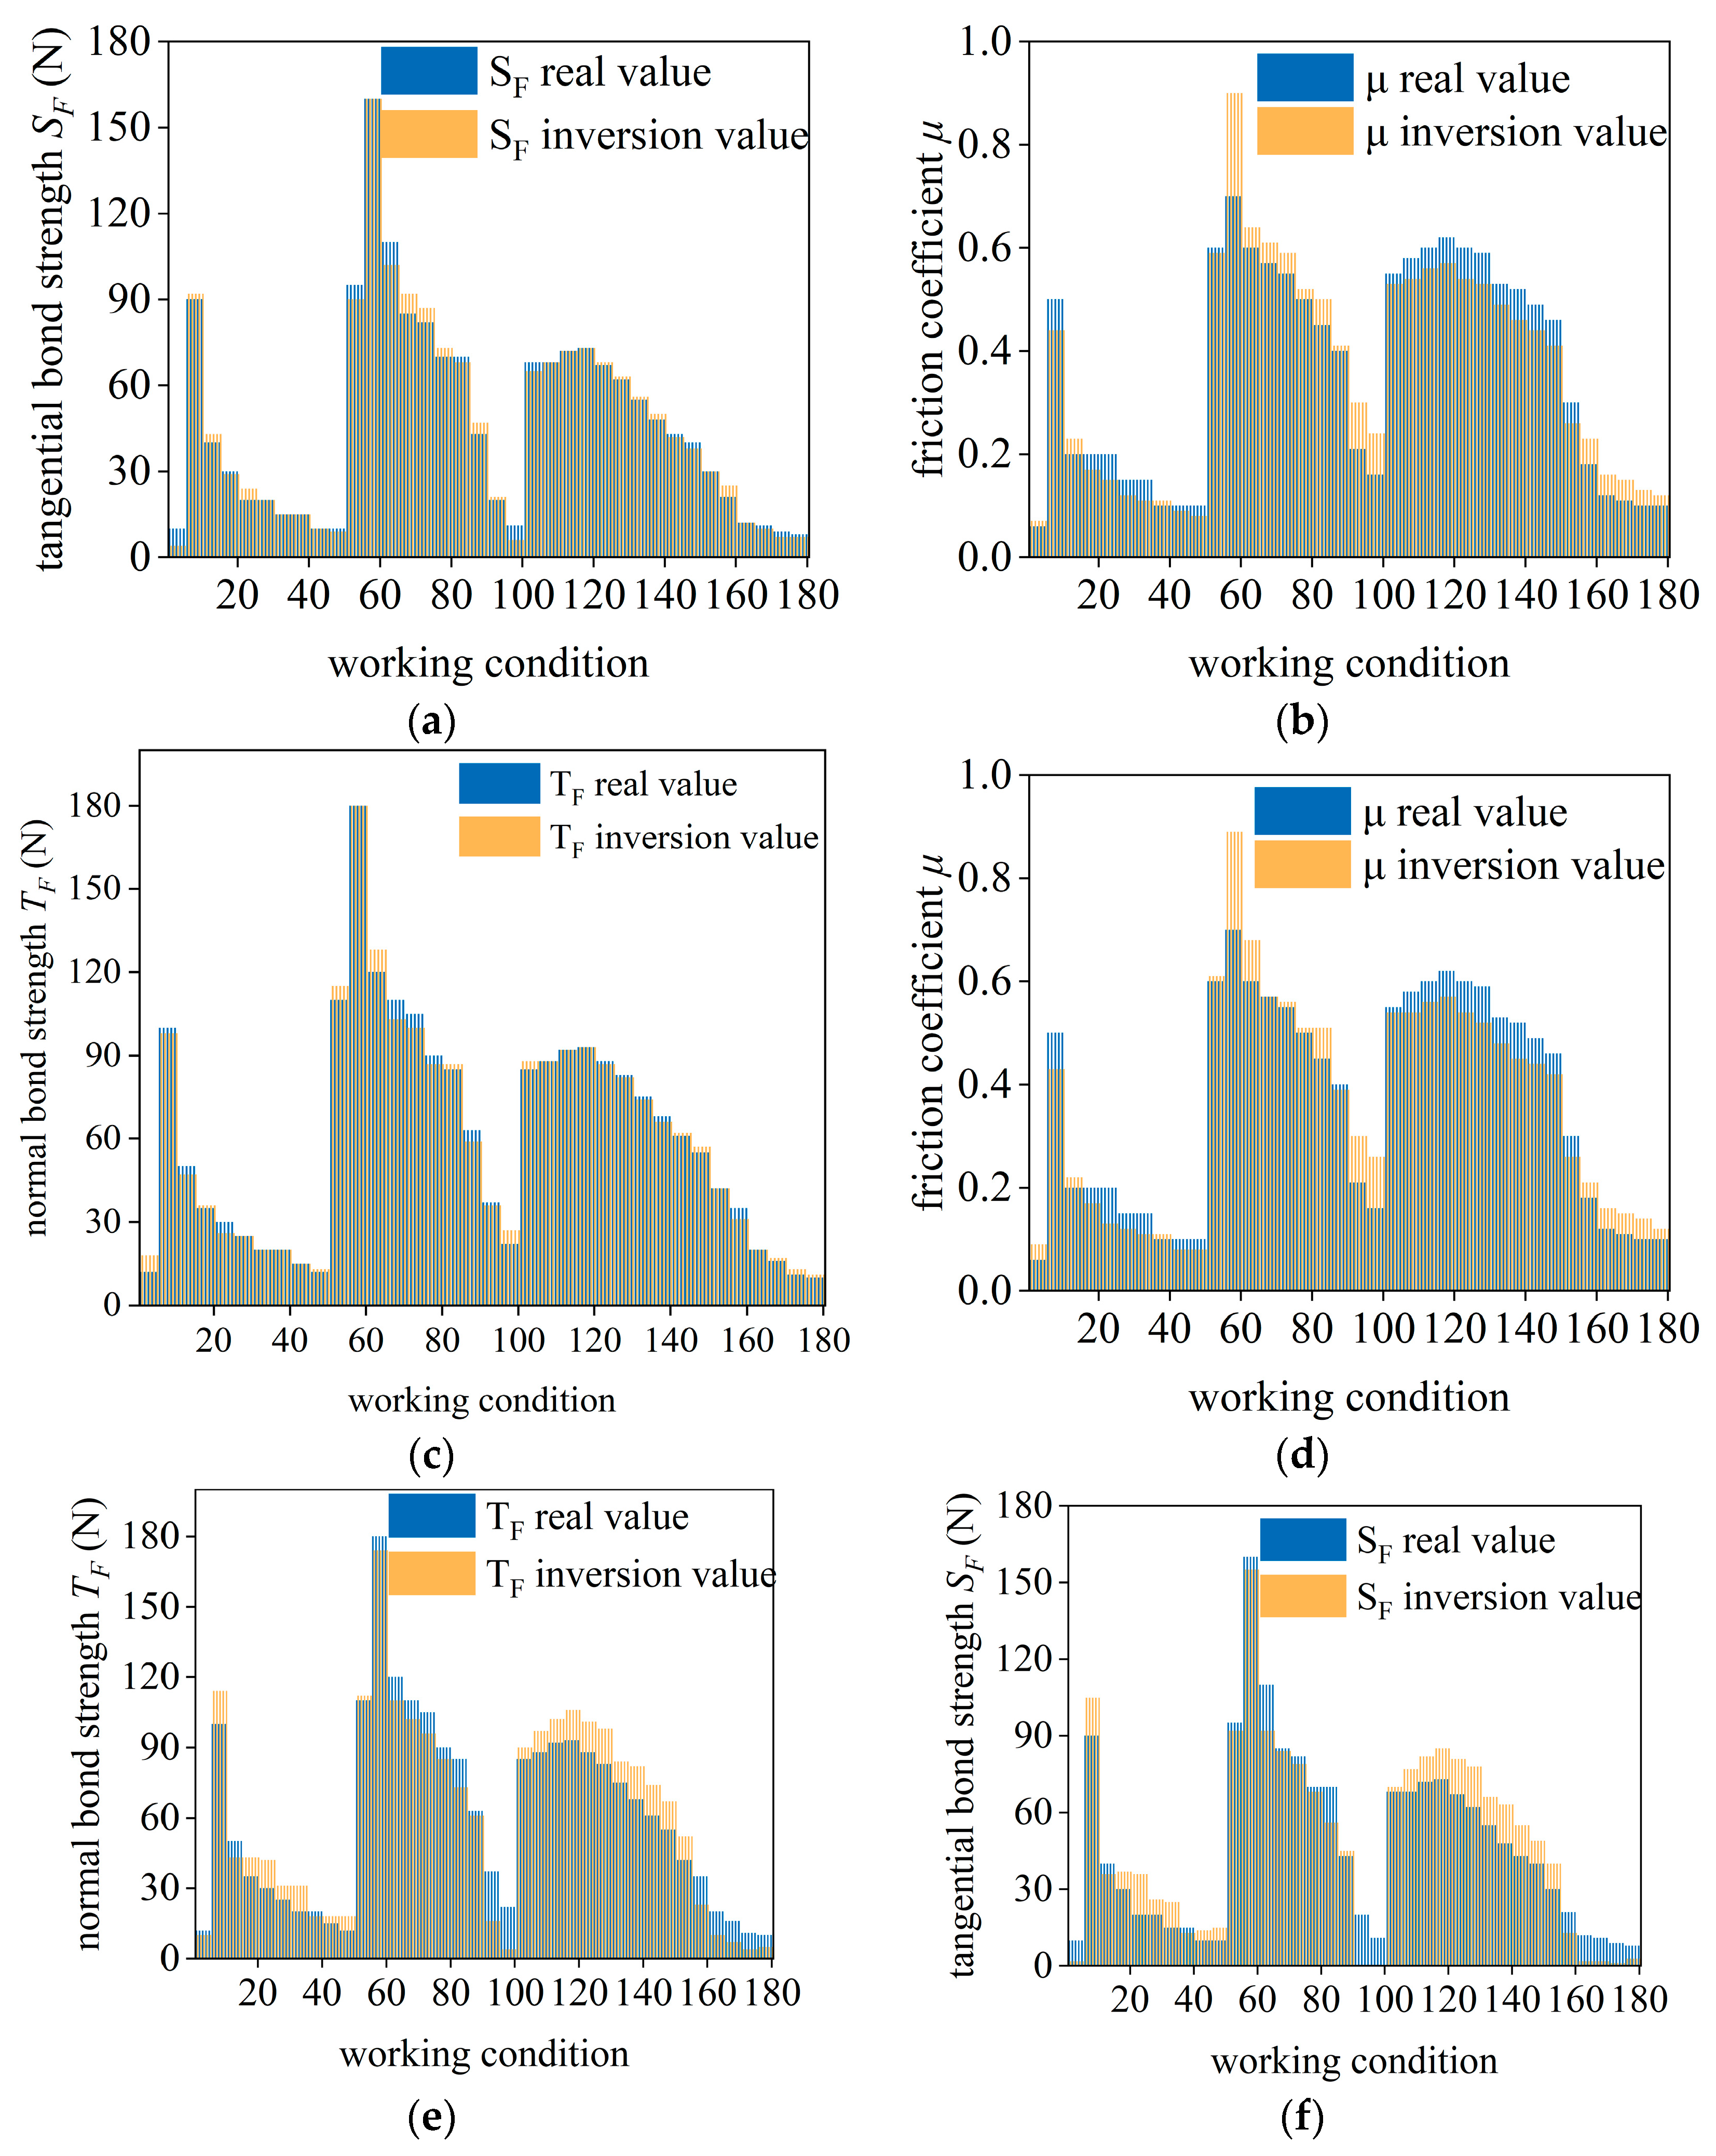
Figure 11 shows the comparative results and error distributions between the shear strengths predicted through the three submodels and the real values across 180 sample sets. These results indicate that the prediction values align closely with the real values, with errors controlled within a reasonable range. Furthermore, Figure 12 shows the verification results of inverting the other two parameters using the normal bond strength, the tangential bond strength, and the friction coefficient as reference parameters. These results indicate that the inverted values align closely with the real values, with only minor errors observed. Combined validation through goodness of fit, shear strength prediction, and parameter inversion confirms that the calibrated model fits the data set well and accurately characterizes the mapping mechanism between macroscopic and key parameters.

4.2.4. Parameter Calibration Results and Comparative Validation

To verify the accuracy and generalization ability of the parameter calibration model, samples are resampled from the soil sampling locations for three types of soil: silty clay, clay, and silt. For each type, three water content levels are set, and laboratory direct shear tests are performed under five vertical pressures (50, 100, 200, 300, and 400 kPa), resulting in a total of 45 working conditions. Based on the macroscopic shear strength values measured from the test, three key parameters are inverted using the parameter calibration model. The middle values of the respective value ranges of the remaining LCBM parameters are selected to construct a complete set of parameters. The inversion results are shown in Figure 13.
Direct shear test simulations under different working conditions are performed using PFC 6.0 software based on an established mesoscopic parameter set. The simulated shear strength values are compared with experimental results in Figure 14. Analysis of Figure 14 shows that, among the 45 working conditions, there are only two sets where errors exceed 5%, specifically 12.4% and 13.6%, while the remaining sets have errors below 5%. The results prove that the developed parameter calibration model exhibits high predictive accuracy and good generalization ability.

5. Conclusions

The intrinsic relationships between water content variations caused by external rainfall and mesoscopic mechanical mechanisms in rock–soil strength degradation are explored. The DEM mesoscopic parameter calibration methods are also investigated. A macro–mesoscopic analysis method for rock–soil strength degradation and a parameter calibration method under different water contents are proposed. A corresponding macro–mesoscopic analysis system and a DEM parameter calibration model are developed. The following main conclusions are drawn:
  • The direct shear test results demonstrate strong alignment with DEM simulations, enabling a systematic macro–mesoscopic analysis of rock–soil strength degradation. It is shown that, under constant water content, the shear strength increases with higher vertical pressure, whereas with varying water content, it initially increases and subsequently decreases.
  • During shearing, the strong force chains between particles are concentrated in the upper left and lower right corners, and a relatively strong stress field is observed. Notably, the orientation of the major principal stress near the shear plane coincides with that of the strong force chains.
  • With increasing water content, the average displacement of particles in the center and the bond failure rate both exhibit a trend of first decreasing and then increasing. Similarly, the anisotropy coefficients a, an, and at also exhibit an initial increase followed by a decrease. A synergistic macro–mesoscopic analysis further confirms that mesoscopic parameters correlate positively with the shear strength and display the trend of first increasing and then decreasing with elevated water content.
  • A total of 180 sets of test conditions are designed, and an external environment and macro–mesoscopic parameter data set is constructed. Correlation analyses conducted using both Pearson correlation and mutual information methods identified the normal bond strength, the tangential bond strength, and the friction coefficient as the mesoscopic LCBM parameters most strongly linked to macroscopic shear strength. They are consequently determined as key parameters.
  • The goodness-of-fit R2 of the parameter calibration model considering external environmental influences is above 0.92. The predictions of shear strength derived from the model, along with inversions of other key parameters, align closely with empirical values, with errors generally within an acceptable range. Among the 45 validation conditions, only two show errors exceeding 10% (12.4% and 13.6%), while the rest fall within 5%, demonstrating the model’s strong predictive accuracy and generalization capability.
The study is based on macro–meso correlations rather than on the framework of soil mechanics in a critical state.

Author Contributions

Conceptualization, B.Y. and Z.D.; methodology, B.Y.; software, S.Z. and D.Z.; validation, B.Y., S.Z. and S.C.; formal analysis, Z.D. and S.Z.; investigation, S.C. and N.S.; resources, B.Y.; data curation, S.Z.; writing—original draft preparation, S.Z.; writing—review and editing, S.Z., B.Y. and Z.D.; visualization, D.Z.; supervision, S.C. and D.Z.; project administration, N.S.; funding acquisition, B.Y. All authors have read and agreed to the published version of the manuscript.

Funding

This research was funded by Henan Key Scientific and Technological Project (Grant No. 252102110373) and the Open Research Subject of Henan Key Laboratory of Grain and Oil Storage Facility & Safety (Grant No. 2022KF06).

Institutional Review Board Statement

Not applicable.

Informed Consent Statement

Not applicable.

Data Availability Statement

The data presented in this study are available on request from the corresponding author due to their connection with an ongoing research project that has not yet been completed.

Conflicts of Interest

The authors declare no conflicts of interest.

References

  1. Donnini, M.; Santangelo, M.; Gariano, S.L.; Bucci, F.; Peruccacci, S.; Alvioli, M.; Althuwaynee, O.; Ardizzone, F.; Bianchi, C.; Bornaetxea, T.; et al. Landslides triggered by an extraordinary rainfall event in Central Italy on September 15, 2022. Landslides 2023, 20, 2199–2211. [Google Scholar] [CrossRef]
  2. Zhuang, Y.; Xing, A. History must not repeat itself-urban geological safety assessment is essential. Nat. Hazards 2022, 111, 2141–2145. [Google Scholar] [CrossRef]
  3. Ren, D.; Xue, P.; Ye, F.; Zhou, X.; Gao, X.; Luo, D. Shallow slope stability analysis of cohesive soil foundation pit under rainfall infiltration. J. Chengdu Univ. Technol. (Sci. Technol. Ed.) 2022, 49, 204–212. (In Chinese) [Google Scholar]
  4. Ma, J.; Zeng, R.; Meng, X.; Zhang, Z.; Zhao, S.; Wei, Z. Field research on preferential infiltration in rainfall-induced loess landslides. Eng. Geol. 2025, 354, 108184. [Google Scholar] [CrossRef]
  5. Liu, X.; Li, S.; Yin, J.; Li, T. The effect of drying and wetting cycles on the mechanical properties and particle breakage of carbonate sand. Acta Geotech. 2022, 17, 4641–4654. [Google Scholar] [CrossRef]
  6. Liu, L.; Chen, Z.; Ding, X.; Ou, Q. Effect of High-Stress Levels on the Shear Behavior of Geosynthetic-Reinforced Marine Coral Sands. J. Mar. Sci. Eng. 2024, 12, 2081. [Google Scholar] [CrossRef]
  7. Chang, D.; Feng, L.; Yan, Y.; Xu, A. Investigation on the macro-mesoscopic mechanical characteristics of saline sand. Bull. Eng. Geol. Environ. 2025, 84, 364. [Google Scholar] [CrossRef]
  8. Zhang, H.; Lei, M.; Wang, L.; Cao, M.; Huang, W.; Ding, S. Multiscale numerical investigation into the effects of rock content and rock particle size on the macroscopic and mesoscopic mechanical characteristics of soil rock mixture. Sci. Rep. 2025, 15, 7336. [Google Scholar] [CrossRef]
  9. Lu, R.; Luo, Q.; Wang, T.; Connolly, D.P.; Liu, K.; Zhao, C. Discrete element modelling of the effect of aspect ratio on compaction and shear behaviour of aggregates. Comput. Geotech. 2023, 161, 105558. [Google Scholar] [CrossRef]
  10. Binaree, T.; Kwunjai, S.; Jitsangiam, P.; Azéma, E.; Jing, G. Assessment of macro and micro mechanical properties of fresh and deteriorated ballast combining laboratory tests and 2D-discrete element methods. Constr. Build. Mater. 2024, 420, 135525. [Google Scholar] [CrossRef]
  11. Xia, R.; Li, B.; Wang, X.; Li, T.; Yang, Z. Measurement and calibration of the discrete element parameters of wet bulk coal. Measurement 2019, 142, 84–95. [Google Scholar] [CrossRef]
  12. Coetzee, C. Calibration of the discrete element method: Strategies for spherical and non-spherical particles. Powder Technol. 2020, 364, 851–878. [Google Scholar] [CrossRef]
  13. Zhang, P.; Sun, X.; Zhou, X.; Zhang, Y. Experimental simulation and a reliable calibration method of rockfill microscopic parameters by considering flexible boundary. Powder Technol. 2022, 396, 279–290. [Google Scholar] [CrossRef]
  14. Suo, Y.; Su, X.; He, W.; Fu, X.; Pan, Z. Study on the mechanical properties of sandstone-shale composite continental shale gas based on the discrete element method. Powder Technol. 2024, 432, 119118. [Google Scholar] [CrossRef]
  15. Lei, Z.; Wang, G.; Yan, Z. Calibration Method of Microscopic Parameters for Similar Material of Surrounding Rock based on DEM. Int. J. Multiscale Comput. Eng. 2024, 22, 65–90. [Google Scholar] [CrossRef]
  16. Toledo, P.; Moncada, M.; Ruiz, C.; Betancourt, F.; Rodríguez, C.G.; Vicuña, C. A review of the application of the discrete element method in comminution circuits. Powder Technol. 2025, 459, 121027. [Google Scholar] [CrossRef]
  17. Zhang, S.; Liu, F.; Zeng, W.; Ying, M. Test and DEM study on cyclic shear behavior of sand–irregular concrete interface under dynamic normal loading. Acta Geotech. 2025, 20, 4775–4802. [Google Scholar] [CrossRef]
  18. Hossein, S.; Asghar, A.M.; Moein, K. Numerical simulation of creep behavior of clay using discrete element method. Powder Technol. 2024, 432, 119121. [Google Scholar] [CrossRef]
  19. Zhou, X.; Chen, S.; Ge, D.; Jin, D.; You, Z. Investigation of asphalt mixture internal structure consistency in accelerated discrete element models. Constr. Build. Mater. 2020, 244, 118272. [Google Scholar] [CrossRef]
  20. Ai, X.; Yi, J.; Pei, Z.; Zhou, W.; Feng, D. Advances in Discrete Element Modeling of Asphalt Mixture: A Literature Review. Arch. Comput. Method Eng. 2024, 31, 4003–4029. [Google Scholar] [CrossRef]
  21. GB/T 50123-2019; Standard for Geotechnical Testing Method. China Planning Press: Beijing, China, 2019. (In Chinese)
  22. Zhao, W.; Li, Y.; Huang, Y.; Li, G.; Ma, F.; Zhang, J.; Wang, M.; Zhao, Y.; Chen, G.; Meng, X.; et al. An Integrated Approach for Emergency Response and Long-Term Prevention for Rainfall-Induced Landslide Clusters. Remote Sens. 2025, 17, 2406. [Google Scholar] [CrossRef]
  23. Toan, T.D.; Duc, M.D.; Quynh, T.D.; Khang, D.Q.; Van Dong, B. Extreme-rainfall-induced series of landslides and large flow-like landslides in Ho Bon commune, Mu Cang Chai district, Yen Bai province, Vietnam, in August 2023. Landslides 2025, 22, 2607–2622. [Google Scholar] [CrossRef]
  24. Wang, X.; Xu, Y. Investigation on the phenomena and influence factors of urban ground collapse in China. Nat. Hazards 2022, 113, 1–33. [Google Scholar] [CrossRef]
  25. Hu, Q.; Zhang, Q.; Liu, W.; Wang, F.; Che, D.; Ma, M. Mitigation of urban road collapses based on machine learning via integrating susceptibility assessment and geophysical detection validation. Int. J. Disaster Risk Reduct. 2024, 111, 104667. [Google Scholar] [CrossRef]
  26. Wei, X.; Cheng, S.; Chen, R.; Wang, Z.; Li, Y. ANN deformation prediction model for deep foundation pit with considering the influence of rainfall. Sci. Rep. 2023, 13, 22664. [Google Scholar] [CrossRef] [PubMed]
  27. Zhang, X.; Li, M.; Chen, J. Hydro-mechanical analysis of a braced foundation pit affected by rainfall and excavation in unsaturated soils. Acta Geotech. 2022, 17, 5675–5690. [Google Scholar] [CrossRef]
  28. Wang, S.; Li, Y.; Li, S.; Liu, J.; Zhang, Z.; Lu, T. Experimental study on the influence of sample preparation and testing methods on the shear mechanical properties of silt. Sci. Rep. 2025, 15, 15816. [Google Scholar] [CrossRef]
  29. Rothenburg, L.; Bathurst, R.J. Analytical study of induced anisotropy in idealized granular materials. Geotechnique 1989, 39, 601–614. [Google Scholar] [CrossRef]
  30. Zhang, Y.; Hou, J.; Luan, Y.; Tao, Z.; Li, J. Meso-mechanism of weakening characteristics of interface between gas hydrate-bearing sand and mining well under cyclic shear. J. China Univ. Pet. (Ed. Nat. Sci.) 2024, 48, 91–100. (In Chinese) [Google Scholar]
  31. Chen, D.; Li, Y.; Cao, X.; Wu, T. Microscopic mechanical properties and fabric anisotropic evolution law of open graded gravel permeable base under dynamic loading. Constr. Build. Mater. 2023, 402, 132948. [Google Scholar] [CrossRef]
  32. Gong, J.; Zou, J.; Zhao, L.; Li, L.; Nie, Z. New insights into the effect of interparticle friction on the critical state friction angle of granular materials. Comput. Geotech. 2019, 113, 103105. [Google Scholar] [CrossRef]
  33. Zhang, B.; Wang, N.; Shen, S.; Gao, X.; Yang, S.; Yin, Z.; Wu, Q. Impact of heterogeneity on mechanical properties of gas hydrate-bearing coal: Experimental and numerical simulation study. J. China Coal Soc. 2025, 1–23. (In Chinese) [Google Scholar] [CrossRef]
  34. Liu, K.; Yang, G.; Li, L.; Xu, Y. Analysis of the relevance between macro-microparameters for clays based on particle flow simulation. J. Exp. Mech. 2020, 35, 1147–1156. (In Chinese) [Google Scholar]
  35. Liu, T.; Wang, B.; Zhang, J.; Li, S. A study on the degradation of dynamic and static mechanical properties of loose soil slopes induced by rainfall. China Min. Mag. 2025, 34 (Suppl. S1), 145–154. (In Chinese) [Google Scholar]
  36. Wu, J.; Yang, N.; Li, P.; Yang, C. Influence of Moisture Content and Dry Density on the Compressibility of Disturbed Loess: A Case Study in Yan’an City, China. Sustainability 2023, 15, 6212. [Google Scholar] [CrossRef]
  37. Ding, Y.; Qian, A.; Lu, H. Three-dimensional discrete element modeling of the shear behavior of cemented hydrate-bearing sands. J. Nat. Gas Sci. Eng. 2022, 101, 104526. [Google Scholar] [CrossRef]
  38. Zhang, M.; Li, W.; Zhang, L.; Jin, H.; Mu, Y.; Wang, L. A Pearson correlation-based adaptive variable grouping method for large-scale multi-objective optimization. Inf. Sci. 2023, 639, 118737. [Google Scholar] [CrossRef]
  39. Sharmin, S.; Shoyaib, M.; Ali, A.A.; Khan, M.A.H.; Chae, O. Simultaneous feature selection and discretization based on mutual information. Pattern Recognit. 2019, 91, 162–174. [Google Scholar] [CrossRef]
  40. Kang, Q.; Xia, Y.; Li, X.; Zhang, W.; Feng, C. Study on the effect of moisture content and dry density on shear strength of silty clay based on direct shear test. Adv. Civ. Eng. 2022, 1, 2213363. [Google Scholar] [CrossRef]
  41. Tong, L.; Xue, W.; Ding, H. Influence of water content on clay deformation characteristics subjected to periodic intermittent loading. Soil Dyn. Earthq. Eng. 2023, 171, 107996. [Google Scholar] [CrossRef]
Figure 1. Macro–mesoscopic analysis method for the strength degradation of rock–soil under different water contents: (a) macroscopic analysis of rock–soil strength degradation based on direct shear test; (b) mesoscopic analysis of rock–soil strength degradation based on PFC; (c) analysis of meso–mechanical characteristics under different water contents; and (d) macro–mesoscopic synergistic analysis of rock–soil strength degradation.
Applsci 15 10254 g001
Figure 2. Soil sampling locations and rainfall for direct shear tests: (a) soil sampling location for silty clay; (b) soil sampling location for clay; and (c) annual rainfall at sampling locations.
Applsci 15 10254 g002
Figure 3. Stress–strain curve of silty clay in direct shear test and laboratory test photos: (a) ω = 16.1%; (b) ω = 21.8%; (c) ω = 22.2%; (d) ω = 24.9%; (e) ZJ type strain-controlled direct shear tester; and (f) samples after shearing.
Applsci 15 10254 g003
Figure 4. Results of laboratory direct shear tests and numerical simulations for silty clay and the DEM model: (a) ω = 16.1%; (b) ω = 21.8%; (c) ω = 22.2%; (d) ω = 24.9%; and (e) the DEM model and boundary conditions.
Applsci 15 10254 g004
Figure 5. Bond failure rate under different working conditions.
Applsci 15 10254 g005
Figure 6. Anisotropy coefficients under different working conditions: (a) anisotropy coefficients for silty clay and (b) anisotropy coefficients for clay.
Applsci 15 10254 g006
Figure 7. The evolution pattern among the mesoscopic parameters, water contents, and shear strength: (a) the evolution of the mesoscopic parameters and the water contents for silty clay; (b) the evolution of the mesoscopic parameters and the water contents for clay; (c) the evolution of the mesoscopic parameters and the shear strength for silty clay; and (d) the evolution of the mesoscopic parameters and the shear strength for clay.
Applsci 15 10254 g007aApplsci 15 10254 g007b
Figure 8. Parameter calibration framework.
Applsci 15 10254 g008
Figure 9. A part of macro–mesoscopic parameters and external environment data: (a) effective modulus–normal bond strength–shear strength; (b) tangential bond strength–friction coefficient–shear strength; (c) normal bond strength–tangential bond strength–shear strength; and (d) soil type–water content–shear strength.
Applsci 15 10254 g009
Figure 10. Correlation analysis results: (a) Pearson and (b) MI.
Applsci 15 10254 g010
Figure 11. Comparison and error distributions between the shear strengths predicted and the real values: (a) comparison results of submodel y1; (b) error distribution of submodel y1; (c) comparison results of submodel y2; (d) error distribution of submodel y2; (e) comparison results of submodel y3; and (f) error distribution of submodel y3.
Applsci 15 10254 g011
Figure 12. Inversion verification based on key parameters: (a) Inversion values of SF based on TF; (b) Inversion values of μ based on TF; (c) Inversion values of TF based on SF; (d) Inversion values of μ based on SF; (e) Inversion values of TF based on μ; and (f) Inversion values of SF based on μ.
Applsci 15 10254 g012
Figure 13. Parameter calibration results.
Applsci 15 10254 g013
Figure 14. Comparative validation of the simulation values and test values for the shear strength: (a) silty clay; (b) clay; and (c) silt.
Applsci 15 10254 g014
Table 1. Shear strength of silty clay and clay under different water contents.
Soil Type AWater Content ω (%)Vertical Pressure σ (kPa)Shear Strength S (kPa)
silty clay16.15026
10032
20045
30057
40072
21.85037
10042
20069
30093
400119
24.95025
10032
20053
30073
40096
clay16.15061
10082
200108
300138
400159
23.85057
10079
200115
300145
400171
285039
10053
20070
30088
400108
Table 2. Parameters for DEM simulation.
Soil Type AWater Content ω (%)Density ρ (g/cm3)Effective Modulus E (MPa)Stiffness Ratio kNormal Bond Strength TF (N)Tangential Bond Strength SF (N)Friction Coefficient μPorosity
silty clay16.11.68101.512100.060.16
21.81.76101.535300.20.16
22.21.77101.530200.20.16
24.91.81101.520150.10.16
Table 3. Particle motion during shearing of different soils under 200 kPa vertical pressure.
Shear DisplacementSilty Clay (ω = 21.8%)Clay (ω = 23.8%)
2 mmApplsci 15 10254 i001Applsci 15 10254 i002
4 mmApplsci 15 10254 i003Applsci 15 10254 i004
6 mmApplsci 15 10254 i005Applsci 15 10254 i006
Table 4. Force chain network and stress field evolution during shearing of different soils under 200 kPa vertical pressure.
Shear Displacement Silty Clay (ω = 21.8%)Clay (ω = 23.8%)
0 mmforce chainApplsci 15 10254 i007Applsci 15 10254 i008
stress fieldApplsci 15 10254 i009Applsci 15 10254 i010
2 mmforce chainApplsci 15 10254 i011Applsci 15 10254 i012
stress fieldApplsci 15 10254 i013Applsci 15 10254 i014
6 mmforce chainApplsci 15 10254 i015Applsci 15 10254 i016
stress fieldApplsci 15 10254 i017Applsci 15 10254 i018
Table 5. The evolution of anisotropy during shearing of silty clay under 200 kPa vertical pressure.
Shear DisplacementSilty Clay (ω = 21.8%)
Contact Normal E(θ) (%)Normal Contact Force fn (N)Tangential Contact Force ft (N)
0 mmApplsci 15 10254 i019Applsci 15 10254 i020Applsci 15 10254 i021
2 mmApplsci 15 10254 i022Applsci 15 10254 i023Applsci 15 10254 i024
6 mmApplsci 15 10254 i025Applsci 15 10254 i026Applsci 15 10254 i027
Table 6. Particle displacement evolution of different working conditions under 200 kPa vertical pressure.
Soil Type AWater Content ω (%)Post-Shear Simulation SamplesAverage Displacement of Central ParticlesShear Strength S (kPa)
clay16.1Applsci 15 10254 i0282.7 mm108
23.8Applsci 15 10254 i0292.3 mm115
26.7Applsci 15 10254 i0302.9 mm90
28Applsci 15 10254 i0313.1 mm70
Table 7. Anisotropy of silty clay under 200 kPa vertical pressure.
Water Content ω (%)Contact Normal E(θ) (%)Normal Contact Force fn (N)Tangential Contact Force ft (N)
16.1Applsci 15 10254 i032Applsci 15 10254 i033Applsci 15 10254 i034
21.8Applsci 15 10254 i035Applsci 15 10254 i036Applsci 15 10254 i037
22.2Applsci 15 10254 i038Applsci 15 10254 i039Applsci 15 10254 i040
24.9Applsci 15 10254 i041Applsci 15 10254 i042Applsci 15 10254 i043
Disclaimer/Publisher’s Note: The statements, opinions and data contained in all publications are solely those of the individual author(s) and contributor(s) and not of MDPI and/or the editor(s). MDPI and/or the editor(s) disclaim responsibility for any injury to people or property resulting from any ideas, methods, instructions or products referred to in the content.