Abstract
The fracture evolution of brittle rock under 3D stress states remains poorly understood, particularly the role of deviatoric stress symmetry as characterized by the Lode angle (θσ). To address this knowledge gap, we systematically investigated sandstone using a true triaxial loading apparatus under a constant mean stress (100 MPa) while varying θσ from −30° to +30°, integrated with real-time acoustic emission (AE) monitoring and post-failure X-ray computed tomography. Our results demonstrate a critical linear reduction in peak strength with increasing θσ. This strength reduction is accompanied by a corresponding transition in failure mechanism, from a progressive mode dominated by dilation to an abrupt mode characterized by shear localization. Innovatively, we introduce a novel AE-based parameter (C), derived from the coupled evolution of AE energy and hit rates, which quantifies fracturing intensity in real-time without pre-defined lithological and monitoring scale. Furthermore, digital reconstruction reveals that consistent X-shaped polymodal fault networks are governed by sequential tensile–shear interactions. This key mechanistic insight prompts us to propose a new “deflected shear–tensile hybrid kinked fracture” classification, which more accurately captures the topological complexity of fractures under 3D stresses than conventional monomodal schemes. This study provides fundamental insights into 3D rock fracture mechanics and practical tools for enhancing safety and efficiency in deep geo-engineering.
1. Introduction
Brittle rock is a natural geomaterial widely encountered in geotechnical engineering practice. Its failure involves complex fracture propagation, strongly influenced by both the rock’s mechanical properties and in situ stress conditions [1,2,3]. In deep geological environments, tectonic stresses and overburden pressure often lead to significant differences among the three principal stresses (σ1 > σ2 > σ3), resulting in 3D (or true triaxial) stress states [4]. Under such conditions, the strength and fracture behavior of brittle rock are governed not only by the maximum and minimum principal stresses (σ1 and σ3) but also by the intermediate principal stress (σ2) [5]. Even when the mean stress remains constant, changing the symmetry of the deviatoric stress, for example by adjusting σ2, can significantly alter the yield surface and failure strength [6]. Therefore, understanding fracture processes under 3D stress is essential for predicting the stability of underground structures and optimizing oil and gas extraction strategies. Many constitutive models incorporate σ2 to improve predictions of rock strength [7,8,9]. These studies provide valuable methodologies for tunnel support design, hydraulic fracturing optimization, and stability assessment of deep underground spaces. However, they often overlook the quantitative analysis of the fracture process under 3D stress conditions. Furthermore, both experiments and numerical simulation studies show that fracture geometry (length, height, branching, and tortuosity) is highly sensitive to the 3D stress [10,11]. Additionally, the fracture aperture, roughness, and connectivity strongly influence permeability and the movement of proppant [2].
Traditional rock mechanics testing typically relies on conventional triaxial loading (where σ 2= σ3 > 0) or uniaxial compression (where σ2 = σ3 = 0) [12,13]. A key limitation of these methods is the inability to independently control the σ2. Recent developments in true triaxial loading systems have overcome this constraint, enabling fully independent application of σ1, σ2 and σ3, thereby facilitating systematic investigation into the role of σ2 [14,15]. Within this framework, the Lode angle (θσ) serves as a fundamental parameter to quantitatively describe the relative magnitudes of the three principal stresses. It is derived from the third invariant of the deviatoric stress tensor and reflects the position of σ2 within the 3D stress state, providing a concise measure of deviatoric stress symmetry in 3D rock strength theory [16,17]. Consequently, many advanced strength criteria explicitly incorporate θσ to model rock yielding and failure across different deviatoric stress conditions [18,19,20].
However, despite these advancements, several critical research gaps persist, which this study aims to address. Firstly, while the influence of the σ2 is widely acknowledged, a systematic experimental investigation covering a continuous spectrum of the θσ under a constant mean stress remains notably lacking. It is because most previous studies have focused on discrete stress states rather than mapping the entire deviatoric symmetry space. Secondly, the evolution of brittle rock fracture processes under such 3D stress states remains unclear. There is a scarcity of studies that quantitatively characterize, in real-time, the intensity and progression of fracturing as a function of θσ. And existing AE monitoring methodologies often remain qualitative or descriptive. Furthermore, the mechanisms governing fracture initiation, propagation, and interaction under 3D stress states are still poorly understood. Conventional fracture classifications (e.g., tensile, shear, or mixed) are inadequate for describing the complex polymodal fault networks observed under 3D stress states, necessitating a new mechanistic framework to link the 3D stress state to the resulting fracture topology. Closing these knowledge gaps directly benefits the design and safety of underground excavations. It allows for the optimization of support systems in high-stress environments and improves the efficiency of hydraulic fracturing operations by enabling better control over fracture networks [21,22,23,24].
In this work, we vary the θσ in 3D stress loading experiments while keeping the mean stress constant. Fracturing processes are monitored using AE, and the macroscopic fracture surfaces are characterized by CT scanning digital reconstruction. Furthermore, we propose a new parameter, the C-value, based on AE energy rate and AE counts rate, to quantify the intensity of fracturing under different θσ conditions in real-time.
The remainder of this paper is organized as follows. Section 2 introduces the entire 3D stress experimental setup and methodology. Experimental results and analysis are presented in Section 3, followed by discussion in Section 4. Finally, Section 5 concludes the paper with the main findings. This work aims to fill an experimental gap in 3D brittle rock failure research, as well as improve the understanding of how 3D stress influences fracture processes to contribute to safer underground engineering design.
2. Materials and Methods
2.1. Three-Dimensional Loading and AE Acquisition System
A true triaxial servo-controlled loading system that self-developed by Chongqing University, was used to investigate fracture evolution in cubic sandstone specimens (Figure 1). And this loading system is integrated with acoustic emission (AE) acquisition capabilities. Detailed technical specifications of this system can be found in previous publications [25,26]. The system provides independent servo loading along three orthogonal axes, with maximum forces of 6000 kN applied in the σ1- and σ2-directions, and 4000 kN in the σ3-direction, suitable for standard cubic specimens with 100 mm edge length. Each axis is equipped with two linear variable differential transformers (LVDTs) with a resolution of ±0.5 μm to monitor specimen deformation. A schematic of the 3D loading chamber is provided in Figure 1b. The system also incorporates real-time AE monitoring functionality [27]. As shown in Figure 1c, two specialized AE-integrated loading platens were symmetrically installed along the σ3-axis, each incorporating four AE senor units. Each AE senor unit mainly consists of a waveguide rod, a Nano-30 AE sensor, a resetting platen and a spring (see Figure 1d). This design facilitates the transmission of AE signals through the waveguide while preventing direct contact between the ceramic face of the AE sensor and rock fragments. The loading method ensures stable AE sensor-specimen coupling and significantly reduces external mechanical noise. To further enhance signal fidelity, friction-reduction measures were comprehensively implemented across hardware, software and control interfaces. The DISP series AE workstation produced by the American Physical Acoustics Company is used to record, segment, and digitize the AE signals in this work. AE signals were acquired using eight channels with a threshold of 55 dB to suppress background noise. The preamplifier gain was set to 40 dB and AE data were sampled at 20 MHz. The hit lockout time (HLT), peak definition time (PDT), and hit definition time (HDT) were configured to 100 µs, 50 µs, and 30 µs, respectively.
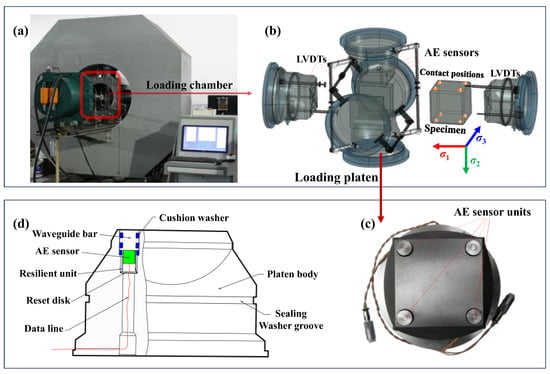
Figure 1.
Experimental system. (a) 3D loading and AE acquisition system, (b) 3D stress chamber with loading platens, (c) the loading platen integrated with AE sensor units and (d) the inner structure of an individual AE unit.
2.2. Testing Specimen
The sandstone used in this study was sourced from Chongqing, situated on the eastern margin of the Sichuan Basin, China (Figure 2a). This material was selected due to its prevalence in underground engineering projects. All specimens were machined to precise dimensions conforming to ISRM standards, resulting in 100 mm cubes with dimensional tolerances of ±0.02 mm, and flatness and parallelism within ±0.01 mm. To minimize stress concentrations and avoid interference between loading directions, all edges were chamfered by 5 mm (Figure 2b). The high geometric symmetry of the cubic specimens enables flexible and controlled loading paths [28,29].
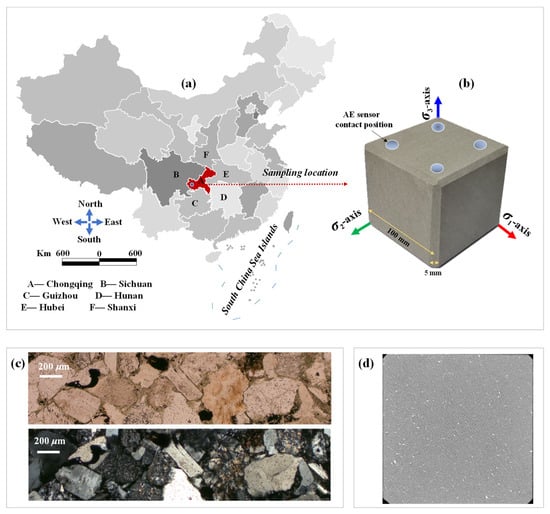
Figure 2.
Testing sandstone specimen. (a) sampling location, (b) precisely machined specimen, (c) SEM images, (d) CT scanning image.
Moreover, basic mechanical tests of the sandstone material indicated a density of 2247 kg/m3, uniaxial compressive strength (UCS) of 62.5 MPa, a Brazilian tensile strength (BTS) of 3.96 MPa, elastic modulus of 4.99 GPa, and Poisson’s ratio of 0.201. Microscopic analysis revealed a porosity of 4.78%, and microstructural features illustrated in Figure 2c. To ensure material homogeneity, all specimens were subjected to high-resolution X-ray computed tomography prior to 3D loading tests (Figure 2d).
2.3. Three-Dimensional Stress Loading Paths
Figure 3 illustrates the mechanical significance of the loading paths used in this study. Figure 3a presents the geometrical representation of the 3D stress space, where the blue elliptical surface denotes the π-plane, representing the deviatoric stress (q) plane with a constant mean stress (p) state. Figure 3b shows the distribution of 3D loading paths with varying θσ on this π-plane. In a 3D stress state, rock failure is governed not only by the magnitude of the p but also by the q. The θσ represents the relative magnitudes of the three principal stresses, and is commonly defined as the polar coordinate on the π-plane, characterizes the distribution of q [30]. For instance, θσ = 0° indicates equal shear contributions from σ1-σ2 and σ2-σ3 planes, whereas positive and negative values indicate a dominance shift toward σ2 and σ3, respectively. The mathematical relationships among p, q, θσ, σ1, σ2 and σ3 are given in Equations (1)–(3).
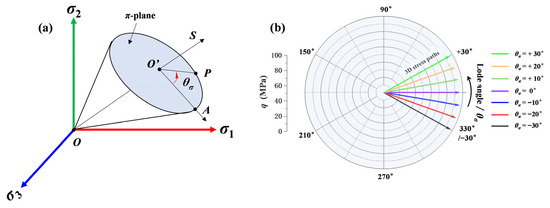
Figure 3.
Significance of the loading paths. (a) 3D stress space, (b) the variation of θσ in the π-plane.
In this work, a series of 3D stress loading tests were conducted under a constant p = 100 MPa, while systematically varying the θσ from −30° to +30°. The reason for setting this loading paths is that an average stress of 100 MPa roughly corresponds to a burial depth of 4000 m underground [31], which is commonly encountered in the development of deep metal mines, the construction of high-level radioactive waste repositories, and the extraction of petroleum and natural gas (particularly tight sandstone gas). Regarding the θσ range from −30° to +30°, this choice is grounded in the fundamental symmetry of the deviatoric stress plane (π-plane). The π-plane exhibits six-fold symmetry, and the θσ range from −30° to +30° encompasses one complete characteristic sector. The boundaries of this sector are defined by the tensile meridian (θσ = −30°) and the compressive meridian (θσ = +30°), which represent distinct fundamental stress states. Testing within this 60° sector is sufficient to capture the entire spectrum of rock failure behavior from tensile-dominated to shear-dominated modes. Given the mechanical isotropy of the homogeneous sandstone tested, the results within this sector can be considered representative of the material’s response under any 3D stress state, as responses in other sectors are symmetrically equivalent. This approach is a well-established and efficient experimental methodology in 3D stress loading tests.
Table 1 summarizes the 3D stress loading paths, the “+” symbol denotes loading and the “−” symbol denotes unloading. Due to the mechanical isotropy of homogeneous sandstone, varying the θσ within one-sixth of the π-plane is sufficient to capture the representative mechanical behavior across the entire π-plane. Such loading schemes enable a deeper understanding of fracturing processes and instability mechanisms in deep buried brittle rock masses under 3D stress redistribution.

Table 1.
Three-Dimensional stress loading paths.
2.4. Testing Procedure
The testing procedure was carried out in the following sequence: (1) The sandstone specimen was placed in the 3D loading chamber, and two AE-integrated loading platens were symmetrically installed along the σ3-direction. A uniform layer of couplant was applied between the AE sensors and the specimen to enhance acoustic signal transmission; (2) All AE and displacement sensor cables were connected to ensure stable signal acquisition, and the system was grounded to minimize electrostatic interference; (3) An isotropic preload was applied in all three directions until the p reached 100 MPa; (4) After stresses and displacements stabilized, loading and unloading were conducted following the 3D stress paths outlined in Table 1. All data were recorded in real-time until specimen failure occurred; (5) Finally, the failed specimen was carefully wrapped in plastic film to preserve fracture morphology and transported for post-failure CT scanning and digital reconstruction.
3. Results and Analysis
3.1. Fracturing Processes
Figure 4 illustrates the strength of the specimen at failure across a range of θσ from −30° to +30°. The σ1 (red markers and trend band) shows a pronounced linear decrease with increasing θσ, declining from 198.8 MPa to 140.8 MPa. In contrast, the σ2 (blue markers and trend band), increases from 50.2 MPa to 140.0 MPa, while the σ3 (green markers and trend band), decreases from 48.2 MPa to 15.0 MPa. These results clearly demonstrate the strong influence of the θσ on rock failure behavior. This systematic variation demonstrates that θσ governs the micromechanical fracture pathway, thereby resulting in the distinct failure modes described subsequently.
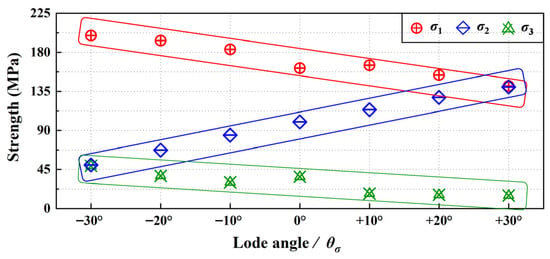
Figure 4.
Strength at specimen failure.
Figure 5 shows the relationship between the maximum principal strain (ε1) and volumetric strain (εv), with colors indicating different θσ values. The ε1-εv curves exhibit a distinct concave-upward nonlinearity, marking a transition from volumetric compaction to dilation during 3D loading. This nonlinear response reflects the intrinsic dilatancy of the rock, in which volumetric expansion increases with accumulated shear strain. The onset of dilatancy is linked to the initiation and subsequent propagation of microfractures within the rock matrix. The primary deformation characteristics of sandstone under 3D stress loading can be summarized in two distinct stages:
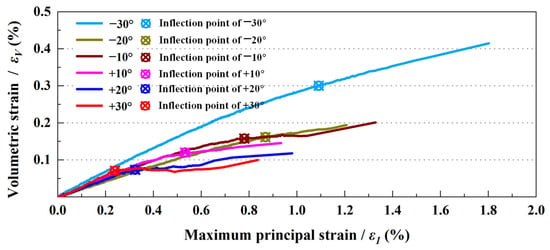
Figure 5.
The relationship of maximum principal strain and volumetric strain.
(1) Initial quasi-linear stage (minimal volumetric change). At small strains (ε1 < 0.2%), εv varies nearly linearly with ε1, and all curves following a similar trend regardless of θσ. During this stage, pre-existing micro-voids and microfractures are progressively closed under compaction, resulting in minimal volumetric change and no significant dilatancy. This behavior corresponds to the linear-elastic regime. The inflection point (“⊗” symbol) signifies the start of accelerated critical damage accumulation and the onset of through-going fracture formation. At this inflection point, the rate of volumetric compaction with respect to maximum principal strain begins to slow. This indicates the end of pure compaction and the onset of the dilation phase, which is driven by the initiation of new fractures.
(2) Volumetric expansion stage (rapid dilatancy). With stress loading approaches peak strength, εv increases with ε1. All curves exhibit upward trends in the high-strain regime, reflecting substantial shear-induced dilatancy under high confining pressures. This behavior is driven by widespread growth and coalescence of microfractures into macroscopic fractures. The degree of dilatancy varies systematically with θσ. The smallest volumetric expansion occurs at θσ = +30° (red curve), likely due to early formation of a through-going failure plane that suppresses distributed microfractures. In contrast at θσ = −30° (light blue curve), the curve is smoother and volumetric expansion is most pronounced, suggesting more gradual fracture evolution with delayed localization and prolonged dilatant deformation.
Furthermore, the degree of upward convexity in the ε1-εv curve serves as an indicator of fracture propagation intensity. Greater convexity corresponds to a smaller incremental volumetric contribution from newly formed fractures with increasing ε1, suggesting a slower accumulation of microfractures. For instance, at θσ = −30°, the specimen withstands higher stress levels prior to failure and develops a greater number of microfractures during 3D stress loading, leading to more extensive volumetric expansion. In contrast, at θσ = +30°, a through-going fracture plane forms at a relatively lower σ1, resulting in abrupt failure with limited progressive microfracture development. Overall, the ε1-εv curves confirm that post-yielding dilatancy is a dominant behavior. The nonlinear increase in εv captures the entire process from the initiation and stable growth of microfractures to their rapid propagation and eventual failure. This response is consistent with the fundamental theory of rock dilatancy, in which volumetric expansion arises from the nonlinear opening and sliding of internal microfractures from yield initiation to ultimate failure.
Figure 6 shows the evolution of AE hit rates under different θσ values over loading time. A linear fitting was applied to the sharp-rise stage to determine the corresponding slopes. The AE hit rate, representing the number of AE events per unit time, serves as an indicator of both fracture accumulation rate and proximity to failure. Under all θσ conditions, the AE hit rate increases progressively with loading. However, θσ markedly influences the growth pattern, especially during the sharp-rise (accelerated damage) stage. As θσ increases from −30° to +30°, the AE hit rate exhibits a clearly rise, with slopes increase from approximately 0.0848 to 0.2698. This indicates that higher θσ lead to a more rapid surge in AE activity as rock failure approaches, while lower θσ are associated with a more gradual increase. These slope differences reflect the rate of fracture generation within the rock: steeper slopes correspond to more fractures forming per unit time. When interpreted alongside the ε1-εv curves in Figure 5, it becomes evident that under higher θσ, the volumetric strain inflection point occurs earlier and is more pronounced, suggesting an earlier transition into accelerated failure accompanied by more abrupt fracturing. In contrast, under lower θσ, the inflection point is either unobvious or only appears near rock failure, implying more gradual damage accumulation and a smoother fracture process without a well-defined acceleration stage.
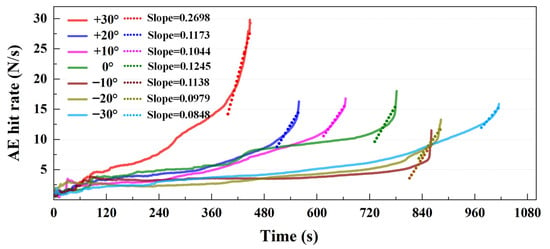
Figure 6.
The AE hit rate evolution with loading time.
3.2. Fracturing Quantitative Evaluation
To quantitatively relate fracture development to energy release, AE parameters were analyzed using a reverse time window on a logarithmic scale (log10), constructed from the inter-arrival times of AE hits. This reverse time window is defined as the time interval from any point during loading up to the moment of ultimate failure, effectively shifting the time axis to emphasize the evolution of signals immediately preceding and following failure. This approach enables clearer identification of AE parameter trends, especially during critical periods near rock failure [32,33].
As shown in Figure 7, this framework was applied to visualize the evolution of AE energy rate and AE hit count rate under 3D stress. The AE energy rate (black curve) represents the energy released by AE signals per unit time (unit: aJ/s), while the AE hit count rate (blue curve) denotes the number of AE signals exceeding the detection threshold per unit time (unit: N/s) [34]. Both AE parameters increase progressively with loading time and exhibit similar fluctuating trends. Their evolution can be categorized into three characteristic stages: initial fluctuation during early loading, a stable increase in the mid-loading phase, and a sustained high level approaching failure. These patterns reflect the dynamic process of microfracture nucleation, accumulation, and coalescence, underscoring the close correlation between AE signal characteristics and the progression of internal damage in rock under complex 3D stress states.
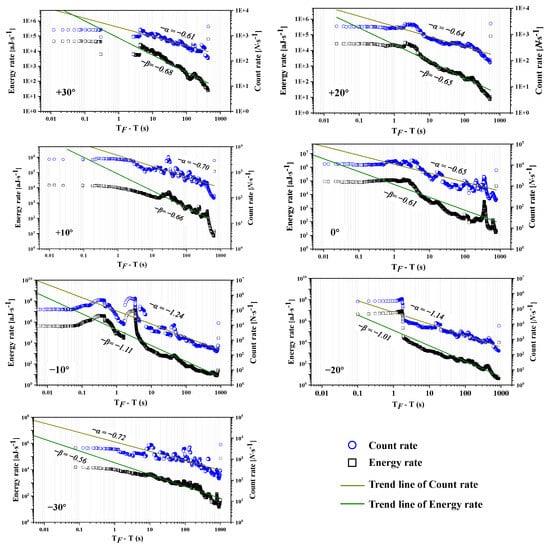
Figure 7.
Evolution of AE energy rate and count rate with inverted loading time using logarithmic scales.
To facilitate a clearer analysis of the AE energy rate and AE hit count rate across the entire data window, normalized coordinate axes were used to plot fitted trend lines (generated by the commercial data analysis software Origin 2024). The corresponding slopes of these trend lines were subsequently extracted. A new parameter denoted as C = −β/−α was then defined, where β and α denote the slopes of the fitted AE energy rate and hit count rate curves, respectively. This parameter C serves as a quantitative real-time indicator of fracturing intensity in rocks under 3D stress. As illustrated in Figure 8, C increases consistently with increasing θσ, indicating enhanced severity of rock failure at higher Lode angles. This trend is consistent with the observations from Figure 4, Figure 5 and Figure 6, further corroborating that elevated θσ promote more abrupt and intense fracture behavior.
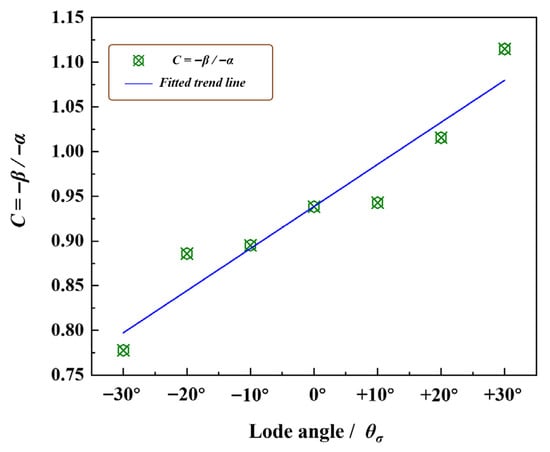
Figure 8.
The ratio of −β to −α evolution processes with θσ.
Moreover, this analytical approach demonstrates considerable potential for practical engineering applications. It enables evaluation of rock fracturing intensity under actual geo-stress conditions, offering significant advantages including real-time assessment capability, adaptability to various lithologies, and actionable operational feedback. For example, during hydraulic fracturing operations in tight sandstone gas reservoirs, real-time microseismic monitoring combined with the C can provide a robust basis for evaluating fracturing efficiency and dynamically optimizing treatment parameters. Furthermore, in deep granite cavern excavation using blasting methods, monitoring AE or microseismic activity and applying the C can facilitate real-time assessment of fracture development evolution and overall cavern stability throughout construction.
3.3. Macroscopic Fracture Surfaces
Figure 9a presents CT-based digital reconstructions of the internal fracture networks formed after failure under various θσ. The macroscopic fractures typically consist of two or more X-shaped through-going faults, extending between the σ1- and σ2-axes and intersecting at ~35°. Regardless of θσ, the specimens exhibit consistent dilatational deformation along the σ3-axis. The dominant fracture morphologies and orientations show little variation with θσ, indicating minimal influence of the 3D loading path on the ultimate fracture geometry. This configuration is characteristic of polymodal faulting, a phenomenon widely documented in previous studies through theoretical analyses and field observations (Figure 9e,f) [35,36].
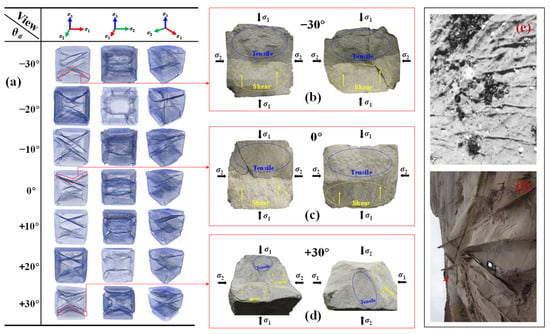
Figure 9.
Fracture networks of specimen failure under various θσ; (a) 3D fracture surfaces in different view angles, (b–d) fracture surfaces of θσ = −30°, 0°, +30°, respectively; (e,f) field observations.
Figure 9b–d distinguish two types of fracture surfaces: tensile fractures (blue areas) and shear fractures (yellow areas). Tensile fractures are characterized by clearly visible mineral grains and an absence of distinct frictional features, while shear fractures exhibit obscured grain boundaries and pronounced frictional striations. These observations indicate that the polymodal faulting patterns formed under 3D stress arise from a complex interaction between tensile and shear fracturing mechanisms. Temporally, the two processes tend to occur in sequence, potentially with transitional phases. The earliest microfractures are predominantly tensile and oriented subparallel to σ3, forming a preliminary fracture framework prior to major shear fractures. As deviatoric stress increases, shear fractures nucleate and propagate near these pre-fractured zones. Guided and constrained by the initial tensile network, the shear fractures advance along tensile bands, extend at their tips, and ultimately generate the characteristic X-shaped offsets.
This process evolves through two sequential stages. Stage I involves the early activation of the pre-existing tensile network, during which numerous small tensile microfractures nucleate independently and form a loosely connected network. This stage is reflected in the gradual increase in AE activity during initial loading. As the principal shear fracture initiates, it preferentially propagates along these pre-formed tensile paths, facilitating rapid growth. Subsequently, Stage II entails the reorientation of the principal shear fracture: to release accumulated mechanical energy through a through-going fracture, the shear fracture alters its trajectory, deviating from its initial plane to connect with tensile fractures on the opposite side. This reorientation ultimately gives rise to the macroscopic through-going fracture geometry.
Consequently, at the macroscopic scale, the fracture path displays characteristic kinks and offsets, commonly forming X-shaped intersections. This progression demonstrates that tensile and shear fracturing mechanisms are sequentially coupled and mutually reinforcing. Specifically, tensile fractures reduce local stiffness and create weakened zones that facilitate shear failure, while shear fractures interconnect these tensile fractures, promoting the formation of through-going fault systems.
Many researchers have classified rock fracture modes based on fracture morphology [37,38]. For example, conventional classifications often categorize failure modes into tensile, shear and tensile–shear mixed types [39]. However, these existing schemes primarily describe individual fractures and fail to adequately represent complex networks formed through the interaction of multiple fractures. To better characterize such intricate fracture systems, this study proposes a new fracture pattern termed the “deflected shear–tensile hybrid kinked fracture” (Figure 10). Under 3D stress loading, rock specimens develop alternating tensile and shear fractures along the fracture path, with different segments dominated by distinct failure mechanisms. This results in kinked, often X-shaped fracture patterns where tensile segments connect with shear segments at bends or intersections. These fracture networks exhibit clear kinks and segmented trajectories featuring multiple X-shaped intersections, ultimately forming a complex topological structure.

Figure 10.
Different classifications of rock fractures; (a) tensile fracture, (b) shear fracture, (c) tensile–shear mixed fracture, (d) deflected shear–tensile hybrid kinked fracture.
4. Discussion
4.1. Implications of θσ on Rock Strength for Stability Assessment
The peak value of σ1 decreases linearly from 198.8 MPa at θσ = −30° to 140.8 MPa at θσ = +30°, accompanied by an increase in σ2 and a decrease in σ3. This trend offers direct guidance for in situ stress management in underground engineering. Higher θσ are typical in tectonically active regions and near fault zones, where load-bearing capacities are lower and collapse risks during excavation are elevated. For instance, in deep-buried caverns susceptible to rock bursts, advance mapping of in situ stress orientations can identify high θσ zones prone to shear-dominated and rapid failure [40]. This observation aligns with theoretical frameworks emphasizing deviatoric invariants. Under higher θσ, elevated deviatoric stress q lowers the threshold for shear localization. Accordingly, reinforced support systems should be implemented to mitigate predicted strength reductions. Furthermore, in hydraulic fracturing operations, drilling modifies the 3D stress field around wellbores. Neglecting θσ variations has led to wellbore collapses, causing economic losses through non-productive time and remediation costs [41].
Moreover, the variation in shear stress distribution with θσ explains these implications. At lower θσ, shear stress is more evenly distributed across multiple planes, enabling gradual energy dissipation and providing longer windows for monitoring and intervention. In contrast, higher θσ concentrates shear stress on the σ2-σ3 planes, accelerating fracture propagation and necessitating proactive mitigation strategies. Implementing such measures not only enhances safety but also improves economic efficiency by lowering fracture initiation pressures and mitigating environmental impacts from uncontrolled fracturing.
4.2. Construction Effectiveness Through Deformation and AE Monitoring
The nonlinear convexity evident in the ε1-εv curves offers critical insight into the volumetric response of rock under 3D stress. The θσ plays an important role in controlling the dilatancy pattern. Dilatancy is most pronounced at θσ = −30°, where it is driven by sustained microcrack growth, and least evident at θσ = +30°, where abrupt macro-fracturing dominates. Fracture initiation is promoted by both sliding and opening mechanisms, a process influenced by θσ-dependent stress ratios that regulate the mobilization of frictional resistance.
From an engineering perspective, the observed dilatancy behavior has direct implications for deformation control in practical applications. Constitutive models incorporating θσ can improve predictions of dilatancy thresholds and guide the design of support systems such as liners [42]. In hydraulic fracturing, lower θσ conditions promote extended dilatancy, which enhances permeability through the development of widespread microfracture networks [43]. Furthermore, experimental data indicate that volumetric expansion surges are frequently accompanied by bursts of AE signals. This correlation supports the adoption of an integrated monitoring approach that combines rock mass deformation measurements with acoustic emission data. Such synergy enables predictive analytics capable of reducing seismic-related risks in deep engineering projects.
4.3. Fracture Network Analysis for Optimized Design
Post-failure CT reconstructions consistently reveal X-shaped polymodal fracture networks consisting of tensile and shear segments arranged in hybrid kinked patterns. Tensile microfractures typically initiate during early loading stages, facilitating subsequent shear fracture development. This sequential evolution promotes stress redistribution and energy dissipation through localized offsets, consistent with established fault nucleation models [44,45]. The θσ also markedly influences kink geometry: as θσ increases, kink acuity becomes more pronounced and topological complexity escalates due to the emergence of X-shaped bifurcations. This trend likely reflects a transition in failure mechanisms governed by deviatoric stress components [46,47,48]. Additionally, microseismic monitoring techniques are increasingly used to characterize the location and morphology of internal rock fractures, further advancing the understanding of correlations between acoustic signatures and fracture morphology [49,50,51].
These observations provide valuable guidance for hydraulic fracturing design. Avoiding regions with high θσ promotes tensile dominant fracture networks, which enhances fracture connectivity and reduces fluid loss. Moreover, this approach helps mitigate shear-dominated fracturing and frequent induced seismicity associated with high-pressure water injection. A temporally phased fracturing strategy is recommended: initiating fractures under low-pressure tensile conditions, followed by a gradual pressure increase to promote controlled extension. This approach can significantly reduce the risk of induced seismicity in deep rock masses.
This new fracture classification proposed in this study offers a more comprehensive framework than conventional monomodal schemes, delivering both mechanistic insights and practical guidance for optimizing fracture treatments in complex geological conditions.
4.4. Study Limitations
Although this study provides systematic insights into the Lode angle-dependent fracture mechanisms of brittle rock under 3D stress conditions, several limitations should be acknowledged.
Firstly, all experiments were conducted under a constant mean stress of 100 MPa, which corresponds approximately to a burial depth of 4000 m. While this stress level is representative of many deep engineering scenarios, it may not fully capture rock behavior under significantly shallower or deeper conditions where mean stress differs substantially. The influence of varying mean stress on the Lode angle effect, particularly on the transition between dilatant and shear-localized failure modes, remains an important topic for future investigation.
Secondly, the study utilized homogeneous and intact sandstone specimens. While this allows for a clear investigation of fundamental mechanisms without the confounding effects of pre-existing fractures or strong heterogeneities, it limits the direct extrapolation of the results to in situ rock masses. Natural rock masses contain joints, faults, bedding planes, and mineralogical variations that can significantly alter fracture initiation, propagation, and interaction patterns. The scale of the laboratory specimens also precludes the analysis of large-scale fracture network connectivity and size effects, which are critical for field-scale applications such as predicting reservoir stimulation volume or excavation damage zones. This limitation should also be addressed in future studies.
Finally, the proposed AE-based parameter C, while effective in quantifying fracturing intensity in real-time under these controlled laboratory conditions, relies on high-frequency acoustic signal acquisition and may be sensitive to sensor coupling, waveguide design, and background noise. While calibrated for our specific sensors and settings, its direct use in field-scale monitoring requires further validation due to greater signal attenuation and environmental noise.
5. Conclusions
This study systematically decoupled the influence of deviatoric stress symmetry from mean stress to unveil the fundamental controls on the fracture evolution of in brittle rock under 3D stress states. The critical findings, which bridge critical gaps between classical rock strength theory and real-time fracture process monitoring, are summarized as follows:
- (1)
- The Lode angle θσ plays a critical role in governing rock strength, fracturing process, and failure mode. Under a constant mean stress (p = 100 MPa), an increase in θσ from −30° to +30° leads to a pronounced linear reduction in peak strength. More importantly, it fundamentally alters the fracturing mechanism, from a progressive dilation-dominated mode at lower θσ values to an abrupt shear-localized mode at higher θσ values. This result highlights the essential role of deviatoric stress symmetry in predicting the timing and the mode of rock failure.
- (2)
- A real-time diagnostic for fracturing intensity has been established. The introduced parameter C, derived from the coupled evolution of AE energy rate and hit rate, provides a quantitative measure of the intensity of the fracturing process. This parameter moves beyond traditional AE analysis by offering a lithology- and scale-adaptive tool for real-time assessment of rock damage evolution, with direct implications for monitoring and managing hazards in deep engineering operations.
- (3)
- A new fracture classification emerges from 3D stress states. Post-failure CT reconstructions consistently reveal complex X-shaped polymodal fault networks, governed by a sequential tensile–shear interaction mechanism. This prompts the proposal of a “deflected shear–tensile hybrid kinked fracture” typology. This classification captures the inherent topological complexity of fractures born under 3D stress states, offering a more nuanced framework than conventional monomodal schemes for interpreting fracture patterns in both experimental and field settings.
Author Contributions
Conceptualization, Z.S. and J.H.; methodology, J.H. and Z.S.; software, Z.S.; validation, J.H.; investigation, J.H. and Q.L.; resources, Z.S. and C.H.; data curation, J.H.; writing—original draft preparation, J.H.; writing—review and editing, Z.S. and C.H.; visualization, Z.S. and J.H.; supervision, Z.S. and J.H.; project administration, Z.S. and J.H.; funding acquisition, Z.S. and J.H. All authors have read and agreed to the published version of the manuscript.
Funding
This research was funded by the National Natural Science Foundation of China (U21A2030, 52104075), the Brain-Gain Plan of New Chongqing—Young Elite Program (Grant No. CSTB2024YCJH-KYXM0046), the Postdoctoral Fellowship Program of CPSF (Grant No. GZC20242132), 75th China Postdoctoral Science Foundation Funded Project (Grant No. 2024MD754008), the Open Funding of State Key Laboratory of Coal Mine Disaster Prevention and Control (Grant No. 2024SKLKF08) and the Chongqing Special Project for Technological Innovation and Application Development (Grant No. CSTB2025TIAD-KPX0029).
Institutional Review Board Statement
Not applicable.
Informed Consent Statement
Not applicable.
Data Availability Statement
The data and material to support the findings of this study are available from the corresponding author upon reasonable request.
Conflicts of Interest
The authors declare no conflicts of interest.
References
- Li, F.D.; Chen, T.Y.; Shan, G.J.; Ma, L.L.; Yu, X.J.; Zheng, X.B.; Zhang, S.J.; Chai, X. Experimental investigation on the failure mechanism of water-bearing sedimentary rocks under true-triaxial stress. Eng. Fail. Anal. 2025, 175, 109605. [Google Scholar] [CrossRef]
- Gao, L.; Zhao, H.B.; Liu, C. Study on the influence of true triaxial principal stress loading and unloading on gas permeability characteristics of coal seams containing gangue. Results Eng. 2025, 27, 105667. [Google Scholar] [CrossRef]
- Liu, X.J.; Ge, Z.L.; Zhou, Z.; Tang, Y.L.; Zhang, D. Stress-induced borehole deformation mechanism of self-rotating waterjets drilling under true triaxial stress conditions. Geoenergy Sci. Eng. 2025, 254, 214021. [Google Scholar] [CrossRef]
- Gu, L.J.; Zhu, G.Q.; Yu, S.; Zhou, Y.Y.; Zhang, Y.; Hu, Y. Directional development mechanism of hard rock fracture under true triaxial stress: Insights from macroscopic and microscopic fracture perspectives. Eng. Fract. Mech. 2025, 319, 111000. [Google Scholar] [CrossRef]
- Liu, Y.X.; Gao, Y.; Wang, G.; Cheng, W.M.; Xu, C.H.; Cheng, J.X. Development of experimental system for rock anisotropic seepage under true triaxial stress. Geomech. Energy Environ. 2025, 42, 100677. [Google Scholar] [CrossRef]
- Sethi, C.; Motra, H.B.; Hazra, B.; Ostadhassan, M. Influence of lithological contrast on elastic anisotropy of shales under true-triaxial stress and thermal conditions. Int. J. Rock Mech. Min. 2025, 190, 106100. [Google Scholar] [CrossRef]
- Goto, R.; Sakaguchi, K.; Parisio, F.; Yoshioka, K.; Pramudyo, E.; Watanabe, N. Wellbore stability in high-temperature granite under true triaxial stress. Geothermics 2022, 100, 102334. [Google Scholar] [CrossRef]
- Cao, S.; Wang, X.J.; Ge, Z.L.; Zhang, L.; Yang, Y.; Hu, H.R. Dynamic damage mechanism of coal with high true triaxial stress level subject to water jets. Powder Technol. 2024, 437, 119583. [Google Scholar] [CrossRef]
- Zhang, Y.; Wang, Z.F.; Xu, D.P.; Gao, Y.H.; Zhou, Y.Y.; Gu, L.J. True triaxial stresses mobilizing dilatant fracturing and engineering failure of hard rocks. Eng. Fail. Anal. 2023, 154, 107652. [Google Scholar] [CrossRef]
- Browning, J.; Meredith, P.G.; Stuart, C.E.; Healy, D.; Harland, S.; Mitchell, T.M. Acoustic characterization of crack damage evolution in sandstone deformed under conventional and true triaxial loading. J. Geophys. Res. Solid Earth 2017, 122, 4395–4412. [Google Scholar] [CrossRef]
- Zhang, D.C.; Liu, Z.W.; Song, Y.Q.; Huang, J.C.; Wu, B.L.; Ranjith, P.G.; Perera, M.S.A.; Kong, L.; Nie, W. DEM simulation on the damage of sandstone with a three-dimensional embedded rough fracture with different width and inclination angle under true-triaxial stress conditions. Theor. Appl. Fract. Mech. 2024, 133, 104528. [Google Scholar] [CrossRef]
- Luo, Y.; Gong, H.L.; Xu, K.; Pei, C.H.; Wei, X.Q.; Li, X.P. Progressive failure characteristics and energy accumulation of granite with a pre-fabricated fracture during conventional triaxial loading. Theor. Appl. Fract. Mech. 2022, 118, 103219. [Google Scholar] [CrossRef]
- Chen, L.; Yin, S.F.; Chang, L.F.; Wang, E.; Zhang, M.Y.; Li, D.J. A damage evolution model of red sandstone under uniaxial compressive loading with different loading rates based on infrared thermography. Infrared Phys. Technol. 2025, 145, 105664. [Google Scholar] [CrossRef]
- Yang, W.M.; Wang, M.X.; Zhou, Z.Q.; Li, L.P.; Yuan, Y.C.; Gao, C.L. A true triaxial geomechanical model test apparatus for studying the precursory information of water inrush from impermeable rock mass failure. Tunn. Undergr. Space Technol. 2019, 93, 103078. [Google Scholar] [CrossRef]
- Feng, X.T.; Yu, X.J.; Zhou, Y.Y.; Yang, C.X.; Wang, F.Y. A rigid true triaxial apparatus for analyses of deformation and failure features of deep weak rock under excavation stress paths. J. Rock Mech. Geotech. Eng. 2023, 15, 1065–1075. [Google Scholar] [CrossRef]
- Song, Z.L.; Zhang, Z.G.; Ranjith, P.G.; Zhao, W.C.; Liu, C. Experimental study on the influence of hydrostatic stress on the Lode angle effect of porous rock. Int. J. Min. Sci. Technol. 2022, 32, 727–735. [Google Scholar] [CrossRef]
- Chemenda, A.; Mas, D. Dependence of rock properties on the Lode angle: Experimental data, constitutive model, and bifurcation analysis. J. Mech. Phys. Solids 2016, 96, 477–496. [Google Scholar] [CrossRef]
- Liu, J.C.; Li, X.; Xiao, J.J.; Xie, Y.C.; Xia, K. Three-dimensional strength criterion for rocks: A review. Energy Rev. 2024, 3, 100102. [Google Scholar] [CrossRef]
- Liu, J.C.; Li, X.; Wang, C.L.; Xu, Y.; Xia, K.W. A three-dimensional elastoplastic constitutive model incorporating Lode angle dependence. Geomech. Energy Environ. 2024, 38, 100567. [Google Scholar] [CrossRef]
- Zhou, J.S.; Gardner, L. New void growth-based ductile fracture models incorporating interaction effects of stress triaxiality and Lode angle parameter. Theor. Appl. Fract. Mech. 2025, 140, 105204. [Google Scholar] [CrossRef]
- Li, F.D.; Elsworth, D.; Feng, X.T.; Chen, T.Y.; Zhao, J.; Li, Y.C.; Zhang, J.Y.; Wu, Q.; Cui, G.L. Revisiting the normal stiffness–permeability relations for shale fractures under true triaxial stress. J. Rock Mech. Geotech. Eng. 2025, 17, 5001–5017. [Google Scholar] [CrossRef]
- Liu, Y.X.; Jiang, C.R.; Wang, G.; Gao, Y.; Cheng, J.X.; Ni, G.H. Evolution of the hydraulic wetting path in fractured coal under true triaxial stress and the influence mechanism of fracture orientation. J. Hydrol. 2024, 640, 131692. [Google Scholar] [CrossRef]
- Chen, J.; Gui, Z.; Rui, Y.C.; Zhao, X.; Pan, X.; Wang, Q.; Pu, Y.; Li, Z.; Liu, M. A dual attention-based deep learning model for lithology identification while drilling. J. Rock Mech. Geotech. Eng. 2025, S1674775525002562. [Google Scholar] [CrossRef]
- Li, B.L.; Jiang, J.Y.; Zhang, J.Z.; Zheng, L.; Long, Y. Influences of initial damage on the saturated granite failure characteristics under true triaxial stress with a free face: Insights into the rockburst prevention and control. Eng. Fract. Mech. 2025, 324, 111263. [Google Scholar] [CrossRef]
- Li, M.L.; Li, K.G.; Wu, S.H.; Qin, Q.C.; Zheng, Z. Tunnel rockburst with a single set of joints under true-triaxial stress condition. J. Rock Mech. Geotech. Eng. 2025, 17, 4827–4851. [Google Scholar] [CrossRef]
- Li, M.H.; Yin, G.Z.; Xu, J.; Li, W.P.; Song, Z.L.; Jiang, C.B. A Novel True Triaxial Apparatus to Study the Geomechanical and Fluid Flow Aspects of Energy Exploitations in Geological Formations. Rock Mech. Rock Eng. 2016, 49, 4647–4659. [Google Scholar] [CrossRef]
- Song, Z.L.; Yin, G.Z.; Ranjith, P.G.; Li, M.H.; Huang, J.; Liu, C. Influence of the intermediate principal stress on sandstone failure. Rock Mech. Rock Eng. 2019, 52, 3033–3046. [Google Scholar] [CrossRef]
- Huang, J.; Qin, C.Z.; Niu, Y.; Li, R.; Song, Z.L.; Wang, X.D. A method for monitoring acoustic emissions in geological media under coupled 3-D stress and fluid flow. J. Pet. Sci. Eng. 2022, 211, 110227. [Google Scholar] [CrossRef]
- Nasseri, M.H.B.; Goodfellow, S.D.; Lombos, L.; Young, R.P. 3-D transport and acoustic properties of Fontainebleau sandstone during true-triaxial deformation experiments. Int. J. Rock Mech. Min. 2014, 69, 1–18. [Google Scholar] [CrossRef]
- Yang, Z.H.; Elgamal, A. Multi-surface Cyclic Plasticity Sand Model with Lode Angle Effect. Geotech. Geol. Eng. 2008, 26, 335–348. [Google Scholar] [CrossRef]
- Zhang, J.C.; Zheng, H.R.; Wang, G.L.; Liu, Z.Q.; Qi, Y.C.; Huang, Z.W.; Fan, X. In-situ stresses, abnormal pore pressures and their impacts on the Triassic Xujiahe reservoirs in tectonically active western Sichuan basin. Mar. Pet. Geol. 2020, 122, 104708. [Google Scholar] [CrossRef]
- Kabwe, E. Confining stress effect on the elastoplastic ground reaction considering the Lode angle dependence. Int. J. Min. Sci. Technol. 2020, 30, 431–440. [Google Scholar] [CrossRef]
- Triantis, D.; Kourkoulis, S.K. An Alternative Approach for Representing the Data Provided by the Acoustic Emission Technique. Rock Mech. Rock Eng. 2018, 51, 2433–2438. [Google Scholar] [CrossRef]
- Niu, Y.; Zhou, X.P.; Berto, F. Temporal dominant frequency evolution characteristics during the fracture process of flawed red sandstone. Theor. Appl. Fract. Mech. 2020, 110, 102838. [Google Scholar] [CrossRef]
- Healy, D.; Jones, R.R.; Holdsworth, R.E. New insights into the development of brittle shear fractures from a 3-D numerical model of microcrack interaction. Earth. Planet. Sci. Lett. 2006, 249, 14–28. [Google Scholar] [CrossRef]
- Healy, D.; Blenkinsop, T.G.; Timms, N.E.; Meredith, P.G.; Mitchell, T.M.; Cooke, M.L. Polymodal faulting: Time for a new angle on shear failure. J. Struct. Geol. 2015, 80, 57–71. [Google Scholar] [CrossRef]
- Cai, J.X. A super-critical stress model for polymodal faulting of rocks. J. Geodyn. 2019, 130, 12–21. [Google Scholar] [CrossRef]
- Zou, Y.S.; Zhang, S.C.; Ma, X.F.; Zhang, X.H.; Zhang, S.P. Hydraulic fracture morphology and conductivity of continental shale under the true-triaxial stress conditions. Fuel 2023, 352, 129056. [Google Scholar] [CrossRef]
- Chen, B.; Shen, B.T.; Zhang, S.C.; Li, Y.Y.; Jiang, H.Y. 3D morphology and formation mechanism of fractures developed by true triaxial stress. Int. J. Min. Sci. Technol. 2022, 32, 1273–1284. [Google Scholar] [CrossRef]
- Du, K.; Li, X.F.; Tao, M.; Wang, S.F. Experimental study on acoustic emission (AE) characteristics and crack classification during rock fracture in several basic lab tests. Int. J. Rock Mech. Min. 2020, 133, 104411. [Google Scholar] [CrossRef]
- Wu, Z.R.; Xu, T.T.; Arson, C. Effect of the Intermediate principal stress on pre-peak damage propagation in hard rock under true triaxial compression. Rock Mech. Rock Eng. 2022, 55, 6475–6494. [Google Scholar] [CrossRef]
- Racine, J.S. Conditional Probability Density and Cumulative Distribution Functions; Cambridge University Press: Cambridge, UK, 2019. [Google Scholar] [CrossRef]
- Rouhani, H.; Farrokh, E. Failure analysis of Nehbandan granite under various stress states and strain rates using a calibrated Riedel-Hiermaier-Thoma constitutive model. Geomech. Geophys. Geo-Energy Geo-Resour. 2024, 10, 157. [Google Scholar] [CrossRef]
- Pradhan, S.; Stroisz, A.M.; Fjær, E.; Stenebråten, J.; Lund, H.K.; Sønstebø, E.F.; Roy, S. Fracturing tests on reservoir rocks: Analysis of AE events and radial strain evolution. arXiv 2015, arXiv:1512.05184. [Google Scholar] [CrossRef]
- Euser, B.; Rougier, E.; Lei, Z.; Knight, E.E.; Frash, L.P.; Carey, J.W.; Viswanathan, H.; Munjiza, A. Simulation of Fracture Coalescence in Granite via the Combined Finite-Discrete Element Method. Rock Mech. Rock Eng. 2019, 52, 3213–3227. [Google Scholar] [CrossRef]
- Fei, F.; Choo, J.Y. Double-phase-field formulation for mixed-mode fracture in rocks. Comput. Methods Appl. Mech. Eng. 2021, 376, 113655. [Google Scholar] [CrossRef]
- Haghighat, E.; Santillán, D. An efficient phase-field model of shear fractures using deviatoric stress split. Comput. Mech. 2023, 72, 1263–1278. [Google Scholar] [CrossRef]
- Xiao, X.K.; Zhang, W.; Mu, Z.C.; Wei, G.; Guo, Z.T. Experimental and numerical investigation on the deformation and failure behavior in the Taylor test. Mater. Des. 2011, 32, 2663–2674. [Google Scholar] [CrossRef]
- Algarni, M.; Ghazali, S.; Zwawi, M. The Emerging of Stress Triaxiality and Lode Angle in Both Solid and Damage Mechanics: A Review. Mech. Solids 2021, 56, 787–806. [Google Scholar] [CrossRef]
- Rui, Y.C.; Chen, J.; Du, J.S.; Peng, X.; Zhou, Z.; Zhu, C. Optimizing microseismic sensor networks in underground space using Cramér–Rao Lower Bound and improved genetic encoding. Undergr. Space 2025, 23, 307–326. [Google Scholar] [CrossRef]
- Rui, Y.C.; Chen, J.; Pu, Y.Y.; Du, X. An innovative analytical solution of AE/MS source location with singular value decomposition and weight estimation. Measurement 2025, 253, 117652. [Google Scholar] [CrossRef]
Disclaimer/Publisher’s Note: The statements, opinions and data contained in all publications are solely those of the individual author(s) and contributor(s) and not of MDPI and/or the editor(s). MDPI and/or the editor(s) disclaim responsibility for any injury to people or property resulting from any ideas, methods, instructions or products referred to in the content. |
© 2025 by the authors. Licensee MDPI, Basel, Switzerland. This article is an open access article distributed under the terms and conditions of the Creative Commons Attribution (CC BY) license (https://creativecommons.org/licenses/by/4.0/).