Article

Performance of Fault-Controlled Hydrothermal System: Insights from Multi-Field Coupled Rock Mechanics Analysis

1
School of Mechanics and Civil Engineering, China University of Mining and Technology, Xuzhou 221116, China
2
MOE Key Laboratory of Deep Coal Resource Mining, School of Mines, China University of Mining and Technology, Xuzhou 221116, China
*
Author to whom correspondence should be addressed.
Appl. Sci. 2025, 15(18), 10064; https://doi.org/10.3390/app151810064
Submission received: 19 August 2025 / Revised: 8 September 2025 / Accepted: 10 September 2025 / Published: 15 September 2025
(This article belongs to the Special Issue Advances and Technologies in Rock Mechanics and Rock Engineering)

Abstract

As is typical of deep rock engineering, fault-controlled hydrothermal systems (FHS) have emerged as a highly promising solution for geothermal energy exploitation. The stability and thermal recovery performance of such systems are critical to their long-term efficiency and viability. In this study, we establish a coupled Thermo-Hydro-Mechanical (THM) model to investigate the mechanical response and thermal output of an FHS. The stability of the system is evaluated based on the evolution of the failure zone within the fault. Key findings include the following: (1) The pore pressure distribution between injection and production wells leads to an elliptical failure pattern in the fault, caused by the constraint exerted by the negative pore pressure zone around the production well on the positive pressure zone around the injection well along the well connectivity direction; (2) Reducing the injection flow rate by 50% can result in a 76% decrease in the thermal recovery efficiency. Meanwhile, reducing the number of reinjection sub-wells from seven to three can lead to a 95% reduction in the failure volume; and (3) Larger fault thickness diminishes both failure volume and thermal performance; specifically, increasing the fault thickness from 5 m to 30 m can result in an 89% reduction in the failure volume. The fault damage zone volume exhibits a sharp decrease as permeability rises from 2 × 10⁻¹² m2 to 8 × 10⁻¹² m2. This study provides scientific insights and practical guidelines for the design and stability assessment of FHS-based geothermal systems.

1. Introduction

Geothermal energy, as a typical renewable energy source, has attracted considerable attention due to its clean, stable, and environmentally friendly characteristics [1,2,3,4]. Natural geothermal reservoirs are limited in efficiency by hydrogeological conditions, while technologies for enhancing thermal recovery efficiency through artificial stimulation remain underdeveloped [5,6,7,8]. As shown in Figure 1, fault-controlled hydrothermal systems (FHS) show great potential, with their core feature being the utilization of natural high-permeability geological faults as geothermal reservoirs for working fluid circulation and heat extraction. However, the development of FHS faces critical challenges: the interactions between geological heterogeneity and multiphase heat transfer processes may not only lead to geological stability risks but also induce the degradation of thermal performance. On the one hand, long-term fluid injection and heat exchange processes may activate fault slip, and thermoelastic stress changes could even trigger seismic activities. On the other hand, the degradation of thermal performance directly restricts the economy and sustainability of the systems [9,10,11]. Therefore, in-depth research on the stability and thermal performance of FHS is paramount for ensuring engineering safety, achieving long-term operation, improving energy output and economy, and optimizing resource utilization.
The stability of fault rock mass under different external disturbances has been studied by numerous researchers through numerical simulations and laboratory experiments. Kivi et al. studied the influence of fluid injection of the nearby fracture network on fault stability. The results showed that fault stability is controlled by fault dip-angle (from 30° to 70°) and fluid properties (e.g., fluid flow velocity, fluid pressure, and viscosity) [12]. Jeanne et al. studied the influence of the fluid injection of enhanced geothermal systems (EGS) on fault stability, and the results indicated an increased likelihood of fault activation following cessation of fluid injection [13]. Gan et al. studied the influence of thermal stress of rock mass on fault stability during fluid injection and found that thermal stress significantly influences the permeability of fault mass [14]. Yu et al. studied the influence of fluid injection of bridge-type EGS on the fault stability [15]. Wu et al. studied the influence of cold fluid injection on fault stability, and the results showed that the convective heat transfer coefficient controlled the time of fault instability [16]. Ji et al. studied the influence of circulating fluid injection on fault stability, and the results showed that reasonable injection parameters can reduce the disturbance to the fault rock mass [17]. The above studies mostly focused on the disturbance of the process of fluid injection for fault stability. However, the peak pore pressure of rock mass at the reinjection well and production well coordinately affect fault stability during geothermal production. From a scientific mechanism perspective, the influence of thermal stress on fault zone permeability is primarily achieved through two pathways [8,12]: (1) Thermoelastic effect: Injection of low-temperature fluids causes rock cooling and contraction, while high-temperature fluids induce heating and expansion, both of which generate inhomogeneous thermal stress in the rock matrix. This stress can cause existing fractures to open or close, and even generate new microfractures, thereby significantly altering fluid flow paths and permeability. (2) The thermo-chemo-mechanical coupling effect: Temperature changes may affect the physicochemical properties of fault fillings (such as the expansibility of clay minerals) and stress states, thereby altering their mechanical strength and pore structure. In the laboratory, cores taken from fault zones can be subjected to controlled temperature gradients and confining pressures, while changes in their permeability are measured (e.g., using the transient pulse method or steady-state flow method [10,16]). On-site, changes in the underground stress field and permeability are inferred by monitoring the temperature and pressure of injected fluids, as well as through microseismic monitoring. To avoid adverse effects of thermal stress on fault stability and permeability (such as inducing seismic activity or fluid short-circuiting), it is crucial to control the temperature difference between injected fluids and formation temperature, and to adopt stepped or low-rate injection strategies to avoid excessive thermal shock [8]. The influence of production process on fault stability cannot be ignored. Hence, the stability of FHS, that considers both production pressure and reinjection pressure, needs further study.
The pore pressure, coulomb failure stress (CFS), normal stress, shear stress, and displacement of fault rock mass have been used by researchers to evaluate the stability of fault rock mass. Sabah et al. conducted a shear stress analysis on fault rock mass to study the influence of different injection schemes on fault stability, and the results showed that the cyclic injection scheme has a smaller impact on fault stability [18]. Ishii studied the displacement of fault rock mass to reveal the influence of fluid injection on the fault stability [19]. Gan et al. used the CFS as a direct quantitative indicator for judging whether a fault tends to rupture, and a value of CFS > 0 indicates instability of part of the fault zone [20]. Li et al. studied the body strain of fault rock mass to understand the evolution of fault stability under drainage conditions [21]. Zhao et al. studied the normal stress of fault rock mass to analyze the frictional evolution of faulted rock mass [22]. Jing et al. studied the pore pressure of fault rock mass to explain the impact of CO2 injection on the fault stability [23]. The above studies mostly focus on the stress state of the fault rock mass and lack a quantitative characterization of instability of fault rock mass. The failure volume and the morphology of the failure zone of the fault rock mass are important quantitative indicators of fault instability. Normal stress provides anti-slip resistance through the friction law, while shear stress is the main force driving fault sliding. The ratio of the two determines the stable state of the fault [20]. In addition, the displacement is a consequence of fault instability, but its accumulation pattern and rate can be used to infer the mechanical state and stress accumulation of the fault [22]. These indicators are also the key to understanding the effect mechanism of equilibrium reinjection/production on fault stability. Hence, the evolution of the failure volume and the morphology of the failure zone of the fault rock mass under equilibrium reinjection/production need further research.
The well distance, reinjection/production flow rate, fault permeability, and fault dip-angle are important factors affecting the fault stability [23,24,25]. Meanwhile, these factors are also important factors affecting the TRP of FHS [26,27]. For instance, Soltanzadeh et al. [24] demonstrated that, under similar geological conditions, reducing the distance between the injection well and the fault from 500 m to 300 m increases the pore pressure on the fault surface by up to 4.90 MPa, significantly elevating the risk of slip. Numerical simulation results of Li et al. [21] showed that when the injection rate exceeds 6.3 m3/day, the frequency of induced seismic activities increases significantly. Furthermore, fault properties such as permeability are critical. Konrad et al. [10] found that high-permeability faults (>1.0 × 10⁻⁹ m2) act as fast channels for pressure transmission. The stability and the TRP of FHS may exhibit different changing patterns under different influence factors. The influence of different factors on the stability and the TRP of FHS may not be consistent. The factors that improve the TRP while minimizing the disturbance to the fault stability are the favorable factors for the FHS. However, most of the aforementioned studies focus on the analysis of single factors, and there is currently a lack of a systematic framework to quantify the coupled effects of these multiple factors. Therefore, the relationship between the stability and the TRP of FHS under different factors need further study.
In this study, a THM-coupled rock mechanics model of FHS was established. The evolution of the seepage-stress-temperature characteristics of the fault rock mass under equilibrium reinjection/production within 20 years was analyzed. The influence of well parameters and fault parameters on the pore pressure, normal stress, shear stress, CFS, and failure volume of the fault rock mass was studied. The relationships between the failure volume and the TRP of FHS under different well parameters and fault parameters were revealed. The influence mechanism of the well parameters and fault parameters on fault stability is elucidated through the morphology of fault failure zones. This study provides scientific guidance for the development of FHS.

2. Model Description

2.1. Geometric Model

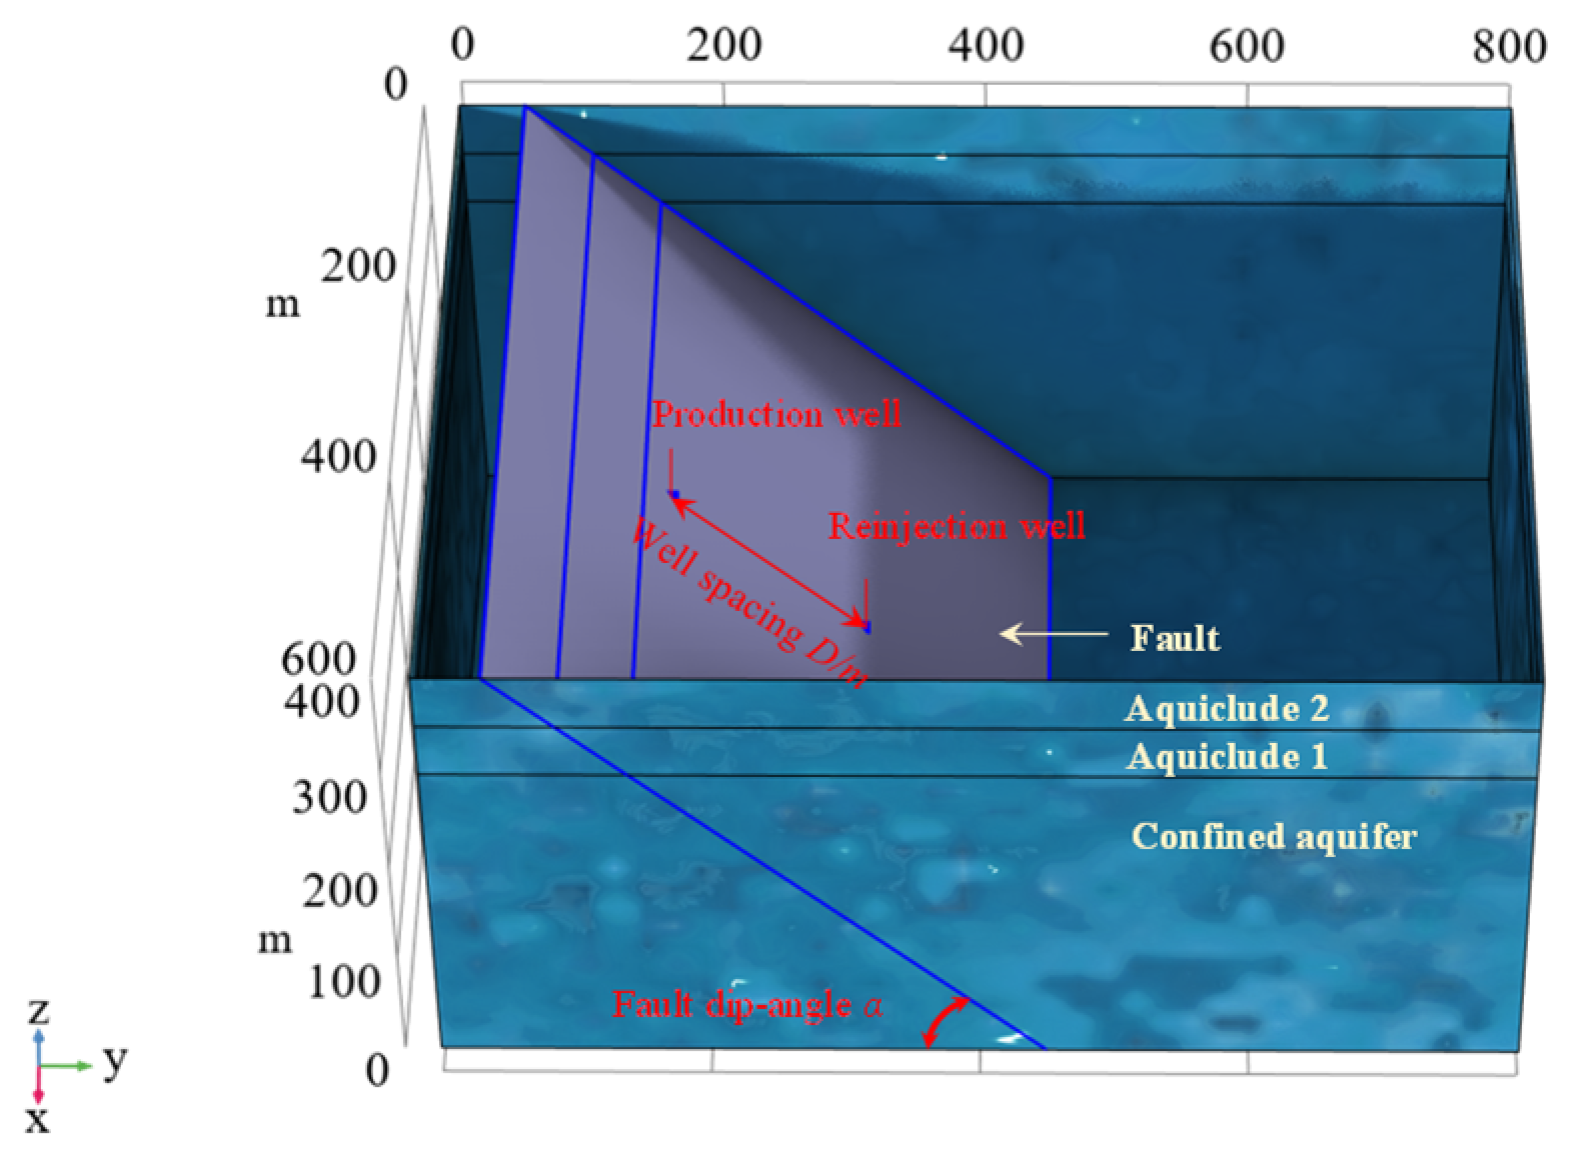
Figure 2 shows the numerical model of the FHS in this study. The numerical model consists of four parts, including the confined aquifer, aquiclude 1, aquiclude 2, and fault. The numerical model is 800 m long and 600 m wide, with the confined aquifer being 500 m high, aquiclude 1 being 50 m high, and aquiclude 2 being 50 m high. The reinjection well and production well are set on the middle line of the fault. The production well is above the reinjection well.

2.2. Model Definition and Assumption

The fault is considered as a cracked zone in this study. The internal rock mass of the fault exhibits a fragmented structure, characterized by strong permeability. The rock mass of the confined aquifer shows porous and highly permeable. The rock mass of the aquiclude exhibits lower permeability.
In order to facilitate numerical models several assumptions are proposed:
(1) The rock masses of the fault and confined aquifer are isotropic rock masses [27].
(2) The deformation of rock mass by pore pressure and thermal strain is small deformation during the geothermal energy extraction [25].
(3) The rock masses of the fault and confined aquifer are saturated porous media [15].
(4) The geothermal fluid is single-phase flow [20].
(5) The rock masses of the fault and confined aquifer do not incur erosion during geothermal extraction [23].

2.3. THM Coupling Mathematical Model of Fault-Aquifer

2.3.1. Seepage Control Equations

Darcy’s law is used to describe the seepage of geothermal fluid in confined aquifer, aquiclude 1, and aquiclude 2 [28]:
u = k μ p
where u is the fluid flow rate, m/s; k is permeability of rock mass, m2; μ is the fluid dynamic viscosity, and Pa∙s; p is pore pressure of rock mass, Pa.
The fluid velocity inside the fault increases significantly under the production pressure. Hence, the inertial forces of the fluid to the rock mass cannot be neglected. The Forchheimer equation is employed to describe the seepage in the rock mass of the fault [29]:
p = μ k u + β ρ l u u
where ρl is the fluid density, kg/m3; and β is the non-Darcy factor. The second term on the right of the equation is the inertia term, which represents the inertial force of the fluid.
The laboratory tests of cracked rock mass show a power function relationship between the permeability and porosity of the cracked rock mass [30,31]. The Kozeny–Carman equation can effectively estimate the permeability of the cracked rock masses of fault, confined aquifers, and aquicludes:
k = k 0 φ 3 / ( 1 φ ) 2
where k0 is the initial permeability of rock mass, m2; and φ is the porosity of the rock mass.
According to the laboratory tests of cracked rock mass, the non-Darcy factor β is inversely proportional to the permeability and porosity of rock mass [32]:
β = M 1 / k φ
where MS1 is the inertial resistance material parameter, m;
Simultaneous with Equations (3)–(6), the seepage control equation of aquifer, aquicludes, and fault can be obtained:
u = k 0 φ 3 μ ( 1 φ ) 2 p
p = μ ( 1 φ ) 2 k 0 φ 3 u + M 1 ρ l ( 1 φ ) 2 R φ 4 u u

2.3.2. Mechanical Constitutive and Porosity Evolution Equations

Linear elastic model is used to describe the deformation of rock mass [33]:
σ i j = υ E ( 1 2 υ ) ( 1 + υ ) δ i j ε k k + E ( 1 + υ ) ε i j
The thermal strain and the seepage strain are taken into account [34]:
σ i j = υ E ( 1 2 υ ) ( 1 + υ ) δ i j ε k k + E ( 1 + υ ) ε v δ i j φ p δ i j E 3 ( 1 2 υ ) α T Δ T δ i j
where E is the elastic modulus of rock mass, MPa; υ is Poisson’s ratio of rock mass; and αT is the thermal expansion coefficient of rock mass.
The balance definition of rock mass is as follows [35]:
σ i j , j + F i = 0
The relationship between the strain and deformation of rock mass is as follows [36]:
ε i j = 1 2 ( u i , j + u j , i )
Simultaneous with Equations (11)–(13), the deformation governing equation of rock mass:
υ E 2 ( 1 2 υ ) ( 1 + υ ) u i , k k + E 2 ( 1 + υ ) u k k , i φ p i E 3 ( 1 2 υ ) α T T i + F i = 0
(3) Porosity evolution equation of rock mass
The initial porosity is φ0, the dynamic porosity is φ, the skeleton volume is Vg, the pore volume is Vk, the volume strain is εv, and the volume change is ∆Vg and ∆Vk. Assuming the deformation of porous media skeleton is small deformation, as ∆Vg/V ≈ 0, the porosity evolution can obtain the following [37]:
φ = V k Δ V k V k + V g Δ V k Δ V g = 1 1 φ 0 Δ V g / V 1 ε V 1 1 φ 0 1 ε V

2.3.3. Control Equations of Thermal Transfer

The governing equation of thermal conduction in porous medium skeleton is as follows [38]:
𝜕 𝜕 t ρ g C g ( 1 φ ) T λ g ( 1 φ ) T α T T 𝜕 ε V 𝜕 t E 3 ( 1 2 υ ) = ( 1 φ ) Q g
where ρg is the density of the porous medium skeleton, kg/m3; Cg is the thermal capacity of the porous media skeleton, J/(kg∙K); λg is the thermal conductivity of the porous media skeleton, W/(m∙K); T is the temperature field of the porous medium skeleton, K; and Qg is the thermal source, W/m3.
Assuming that the fluid thermal transfer in porous media is only thermal conduction and thermal convection, the governing equation of thermal conduction in fluid is as follows [39]:
𝜕 𝜕 t ρ l C l φ T + ( ρ l C l v T ) λ l φ T = φ Q l
where ρl is the fluid density, kg∙m−3; Cl is the thermal capacity of the fluid, J∙(kg∙K)−1; λl is the thermal conductivity of the fluid, W∙(m∙K)−1; and Ql is the fluid thermal source, W∙m−3.
The governing equation of thermal transfer in porous media can be obtained by Equations (16) and (17):
𝜕 T 𝜕 t ρ C + T ρ l C l v ( λ T ) α T T 𝜕 ε V 𝜕 t E 3 ( 1 2 υ ) = ( 1 φ ) Q g + φ Q l
The thermal capacity C and the thermal conductivity λ of the porous media are as follows [40]:
C = ( 1 φ ) ρ g C g + φ ρ l C l
λ = ( 1 φ ) λ g + φ λ l

2.3.4. Evaluation Equation of the Thermal Recovery Performance

Production power is determined by the production temperature and the production flow rate [41]:
Q w = ( T 2 T 0 ) C l ρ l q
where Qw is the production power, MW; T0 is the reinjection temperature, set as 283.15 K; T2 is the production temperature, K; and q is the production flow rate, kg∙s−1.

2.3.5. Evaluation Equation of Fault Stability

Coulomb failure stress, CFS, is used to characterize the stability of the rock mass of the fault [42,43]:
C F S = σ τ ( c + σ n tan ϕ )
where σn is the normal stress of the rock mass of the fault, Pa; στ is the shear stress of the rock mass of the fault, Pa; c is the cohesion force the rock mass of the fault, set as 4.0 Pa; and ϕ is the friction angle of the rock mass of the fault, set as 30°.
The failure volume of fault can be calculated by integrating over the area where CFS > 0:
S F = 0 Ω ( C F S > 0 ) dS
where SF is the failure volume of fault, m3; and Ω is the total range of fault.

2.3.6. Parameter Analysis and Discussion

(1) In the seepage control equation, the permeability k, which governs both Darcy and non-Darcy flow, is a critical parameter controlling flow rate. A higher k value results in a greater geothermal production flow rate. Higher porosity φ leads to increased k, thereby enhancing the geothermal production flow rate. A larger non-Darcy factor β indicates stronger inertial forces in fluid flow, which reduces flow velocity.
(2) In the mechanical constitutive equation, the elastic modulus E is a key parameter controlling rock deformation. A higher E value corresponds to smaller rock deformation. A larger thermal expansion coefficient αT results in greater thermal stress in the rock. Higher porosity φ leads to increased effective stress exerted by fluids on the rock.
(3) In the heat transfer control equation, the thermal conductivity λ is a crucial parameter governing heat transfer efficiency. A higher λ value improves the heat exchange efficiency of cold fluids. A larger heat capacity C enhances the heat storage capacity of the rock mass, delaying the occurrence of thermal breakthrough.

2.4. Boundary Conditions and Initial Conditions

2.4.1. Boundary Conditions

(1) Mechanical boundary conditions of the numerical model: The roller supports and normal pressure of 6 MPa are applied to the surface around the numerical model. The fixed constraints are applied to the bottom of the numerical model. The normal pressure of 6 MPa is applied to the top of the numerical model.
(2) Hydraulic boundary conditions of the numerical model: A constant gradient water head is applied to the surface around the confined aquifer.
(3) Thermal boundary condition of the simulation model: The surface around the confined aquifer is set as an open boundary. The upstream temperature around the confined aquifer Tup is
T u p = 333.15 0.02 z
where, z is the depth, m.

2.4.2. Initial Conditions

(1) The initial solution conditions are as follows:
Mechanical initial conditions: p = 0 MPa at t = 0 d for the numerical model.
Hydraulic initial conditions: uxyz = 0 MPa at t = 0 d for the numerical model.
Thermal initial condition: T = Tup at t = 0 d for the numerical model.
(2) The initial solution parameters are as follows:
The reinjection temperature is 283.15 K, the well distance is 140 m, the reinjection/production flow rate is 17.5 kg∙s−1, the fault dip-angle is 45°, the fault thickness is 10 m, and the initial permeability of fault is 5 × 10⁻¹² m2.

2.4.3. Mesh Generation

The model was meshed using free tetrahedral meshes, with the minimum element size of 4 m, the maximum element size of 15 m, and the average element quality of 0.7221. The independence of the mesh quantity was verified, and the results indicated that when the number of meshes was between 1,000,000 and 1,500,000, the difference in the model calculation results was within 2%.

2.4.4. Computer Implementation

The model in this paper was solved by the finite element method using COMSOL Multiphysics 4.4 software. This software has mature applications and wide recognition in solving multi-field coupling models. The computer operating system used was Windows 11, with 64 GB of memory. The total number of mesh elements for building the model was 1,206,895.

2.5. Parameters of the Numerical Model

Table 1 shows the parameters for the numerical model. The seepage material has a resistance coefficient M1 of 1.16 × 10⁻¹² m2. The thermal expansion coefficient αT is 2 × 10⁻⁶ [44].

2.6. Model Verification

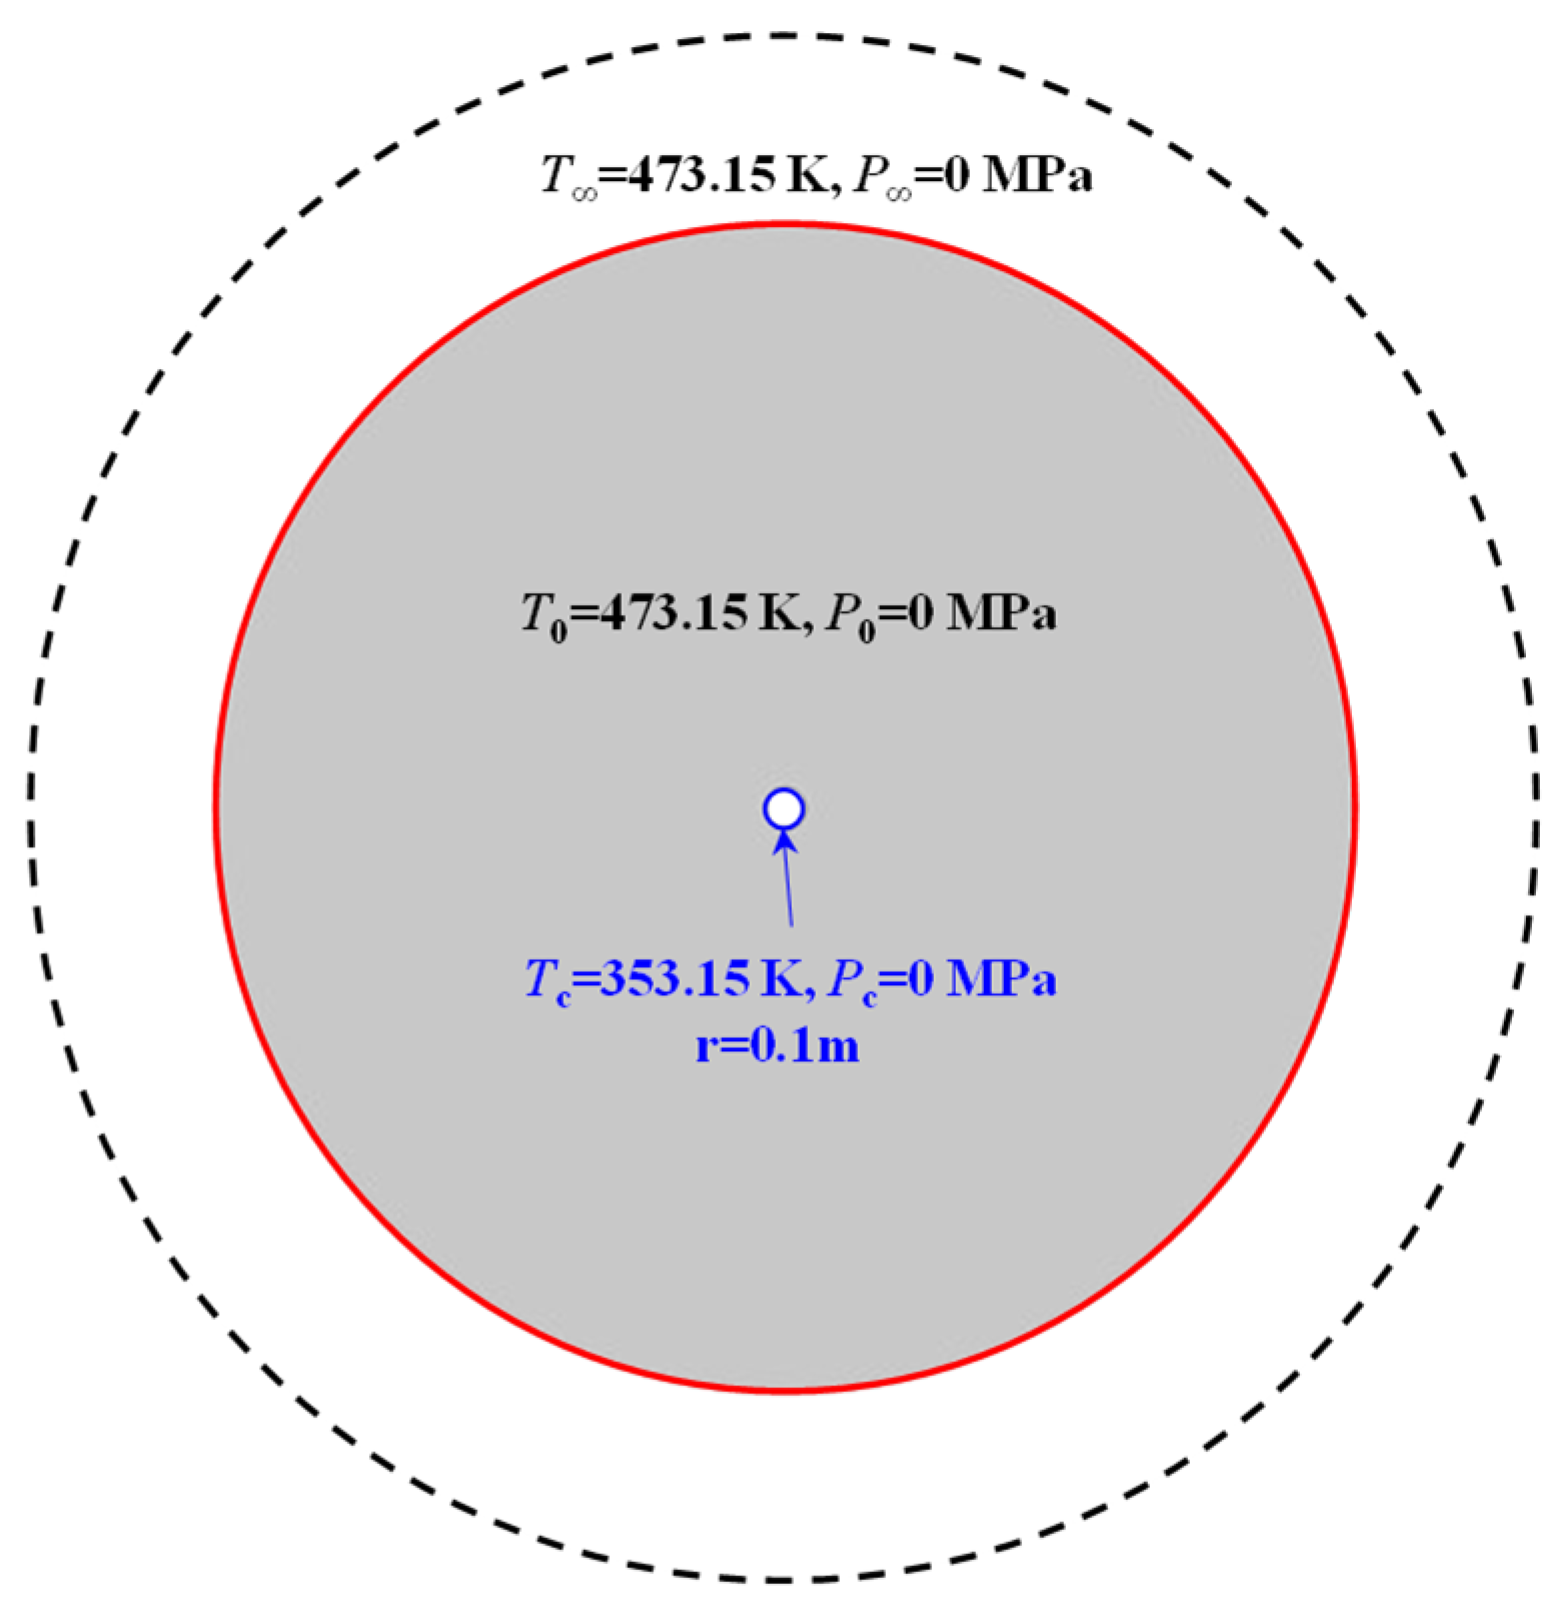
The verification model is derived from the study of Zhang [45]. Figure 3 depicts the initial and boundary conditions of the verification model. The initial temperature and pore pressure of the verification model are set at 473.15 K and 0 MPa, respectively. A temperature boundary condition of 353.15 K is specified within the wellbore. The constant pore pressure boundary of 0 MPa and unconstrained stress boundary are applied within the wellbore. The stress and pore pressure boundary maintained at 0 MPa at infinite distance, and the temperature remains at the value of 473.15 K. Table 2 shows the parameters of the verification model.
Figure 4 shows that the comparison results demonstrate a strong agreement between the numerical solutions and analytical solutions. This validates the accuracy of the THM-coupled process.

3. Results

3.1. Evolution of Seepage-Stress-Temperature Characteristics of Fault Rock Mass Under Equilibrium Reinjection/Production

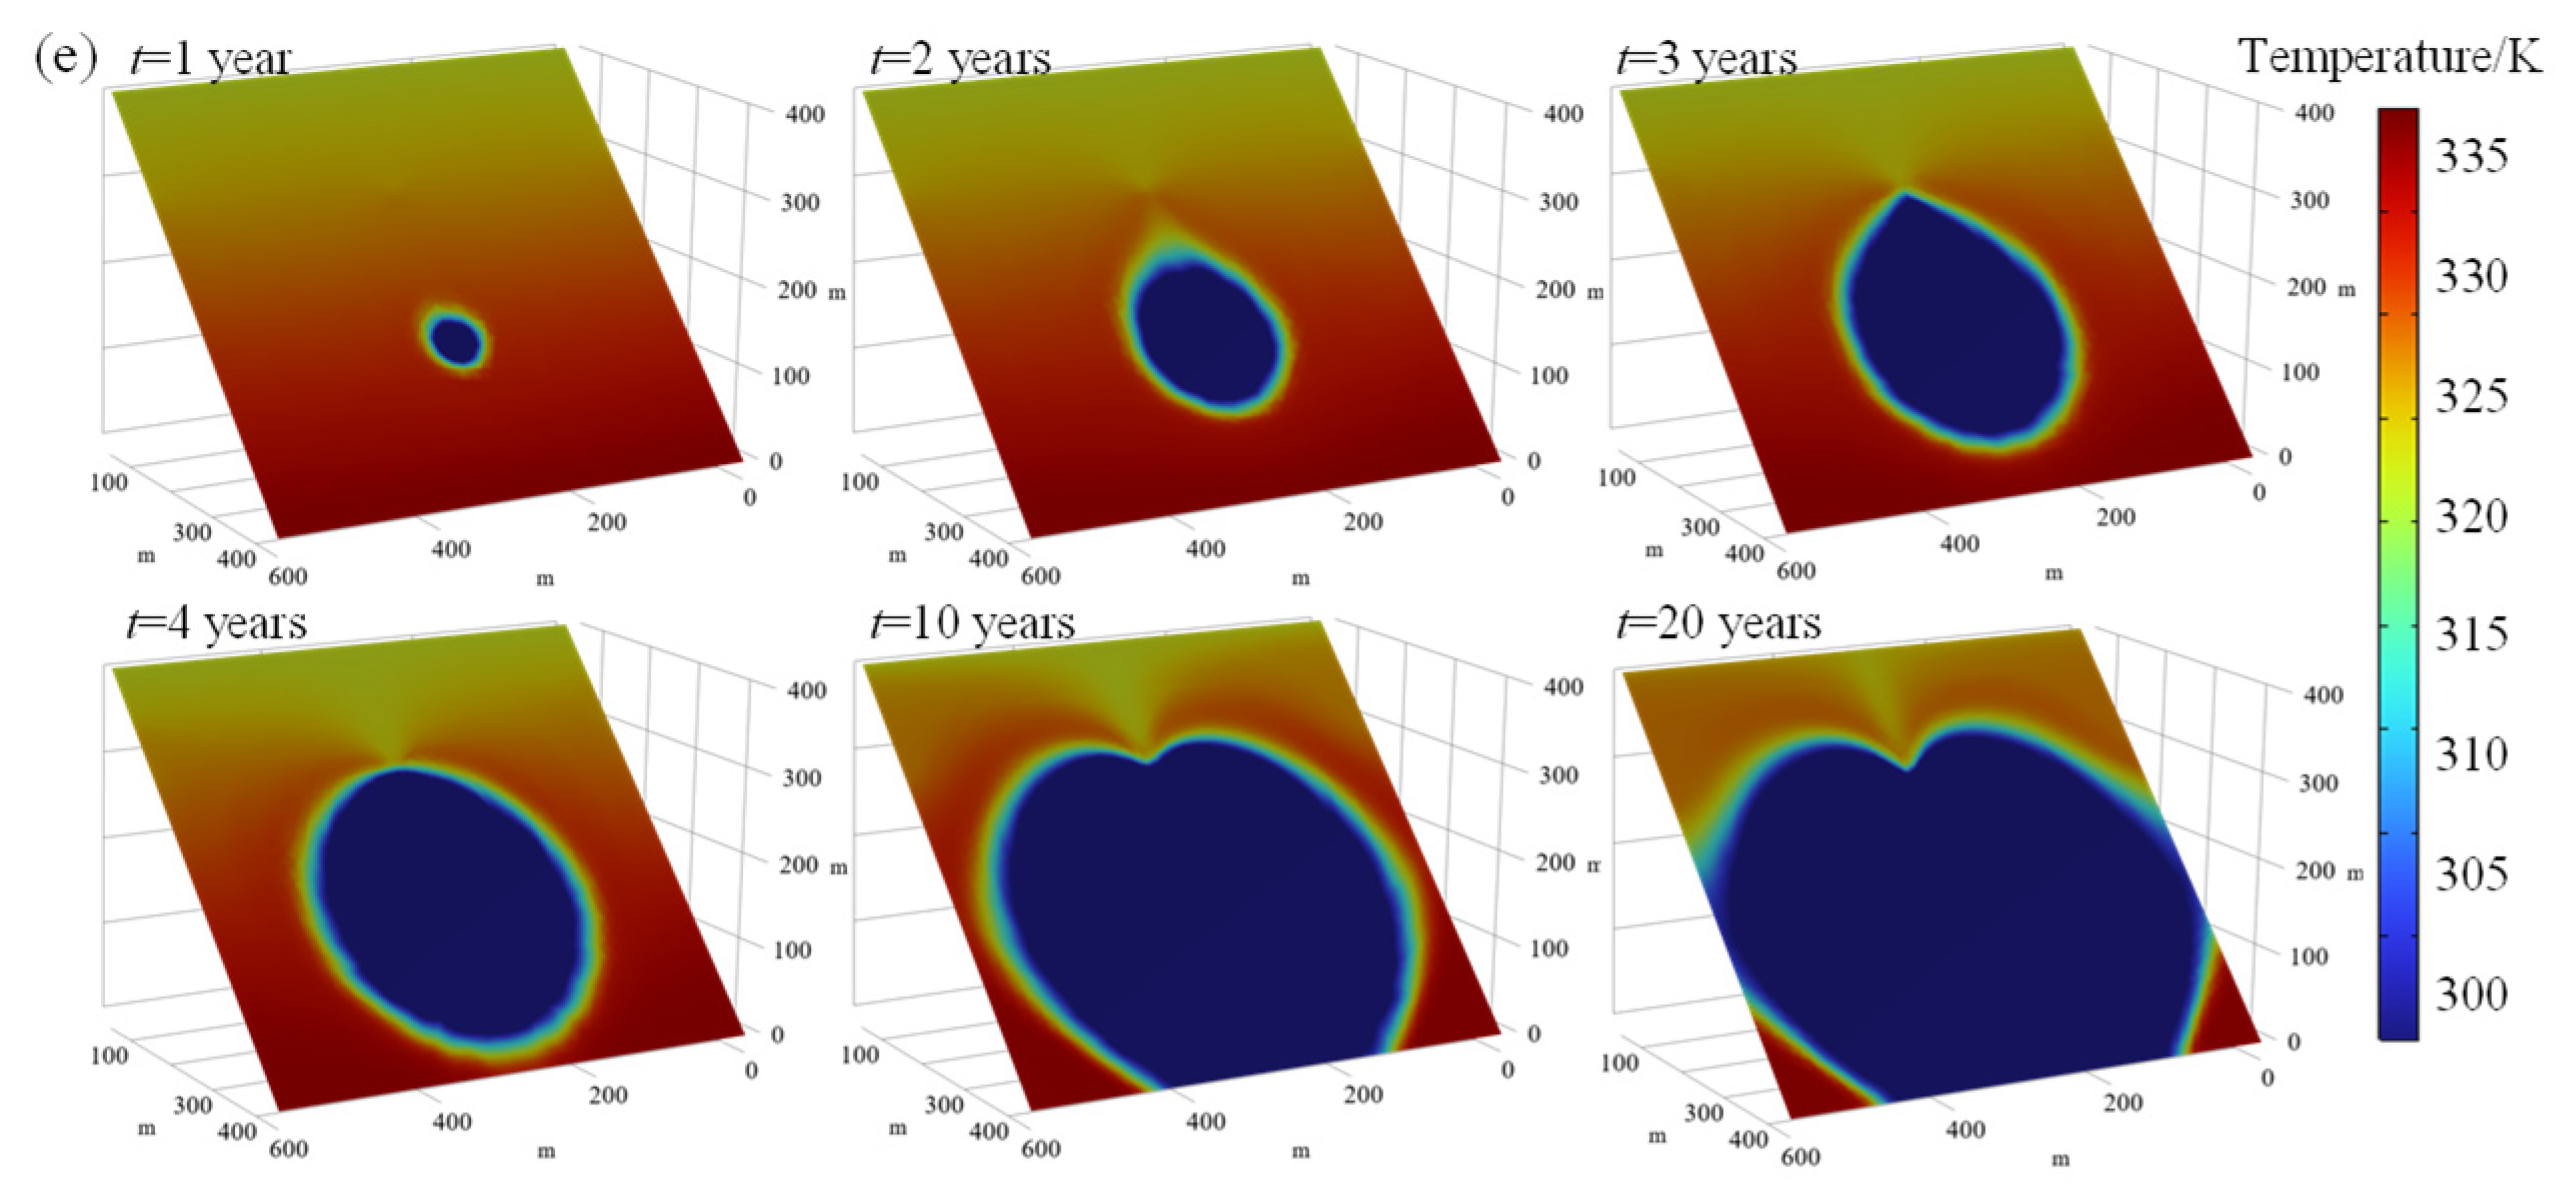
The evolution of the seepage-stress-temperature characteristics of the fault rock mass under continuous reinjection and extraction within 20 a using the initial solution parameters in Section 2.4.2 are as follows:
Figure 5a shows the evolution of the pore pressure of the fault rock mass within 20 a. Within 0 to 4 years, the pore pressure of the rock mass around the production well and reinjection well increases rapidly. A high negative pore pressure zone of the rock mass develops around the production well, and a high positive pore pressure zone of rock mass develops around the injection well. Within 4 to 20 years, the increase in the pore pressure of the rock mass around the injection and production well tends to stabilize. The observed variation in effective stress with pore pressure is a direct consequence of the fundamental principle of soil mechanics, namely the effective stress principle [34]. Accordingly, a decrease in pore water pressure leads to an increase in effective stress. This strengthening of the fault rock mass enhances its shear resistance and promotes fault stability. Conversely, an increase in pore water pressure reduces the effective stress, thereby weakening the rock mass and potentially triggering shear failure along the fault zone.
Figure 5b–d show the stress state of the fault rock mass changing with the change in pore pressure. The normal stress of fault rock mass is increased by negative pore pressure around the production well, while the shear stress of fault rock mass is increased by the positive pore pressure around the reinjection well. Therefore, the CFS of the faulted rock mass can be divided into two regions: the stable region influenced by the negative pore pressure around production well and the unstable region influenced by the positive pore pressure around the reinjection well. The existence of the stable region of the fault rock mass can restrict the expansion of the unstable region of the fault rock mass.
Figure 6 analyzes the stress state at the monitoring points of the fault rock mass. Under the progress of reinjection and production, the normal stress of the fault rock mass at the production well and reinjection well changes more obviously, while the shear stress of the fault rock mass at the nearby point of the reinjection well and production well changes more obviously. Therefore, the stress response of the fault rock mass at different positions during reinjection and production process has certain differences. This difference is caused by the gradient difference in the pore pressure from all directions.
Figure 7 analyzes the failure volume and the production temperature of FHS within the 20 years. Within 0 to 4 years, the failure volume of the fault rock mass sharply increases. Within 4 to 20 years, the increasing rate of the failure of the fault rock mass volume sharply decreases and then gradually stabilizes. Within the 0 to 20 years, the production temperature gradually decreases. It can conclude that the risk of fault instability increases gradually, and the production temperature gradually decreases under long-term continuous reinjection and production. Therefore, the long-term continuous reinjection and production method is not friendly to FHS.

3.2. The Influence of Well Parameters on Fault Stability

Table 3 lists the parameters used in the numerical model of this section. P represents production, while RE represents reinjection in Table 3.

3.2.1. Well Spacing

Based on the parameters in Section 2.4.2, we changed the well spacing to study influence of well distance on the fault stability.
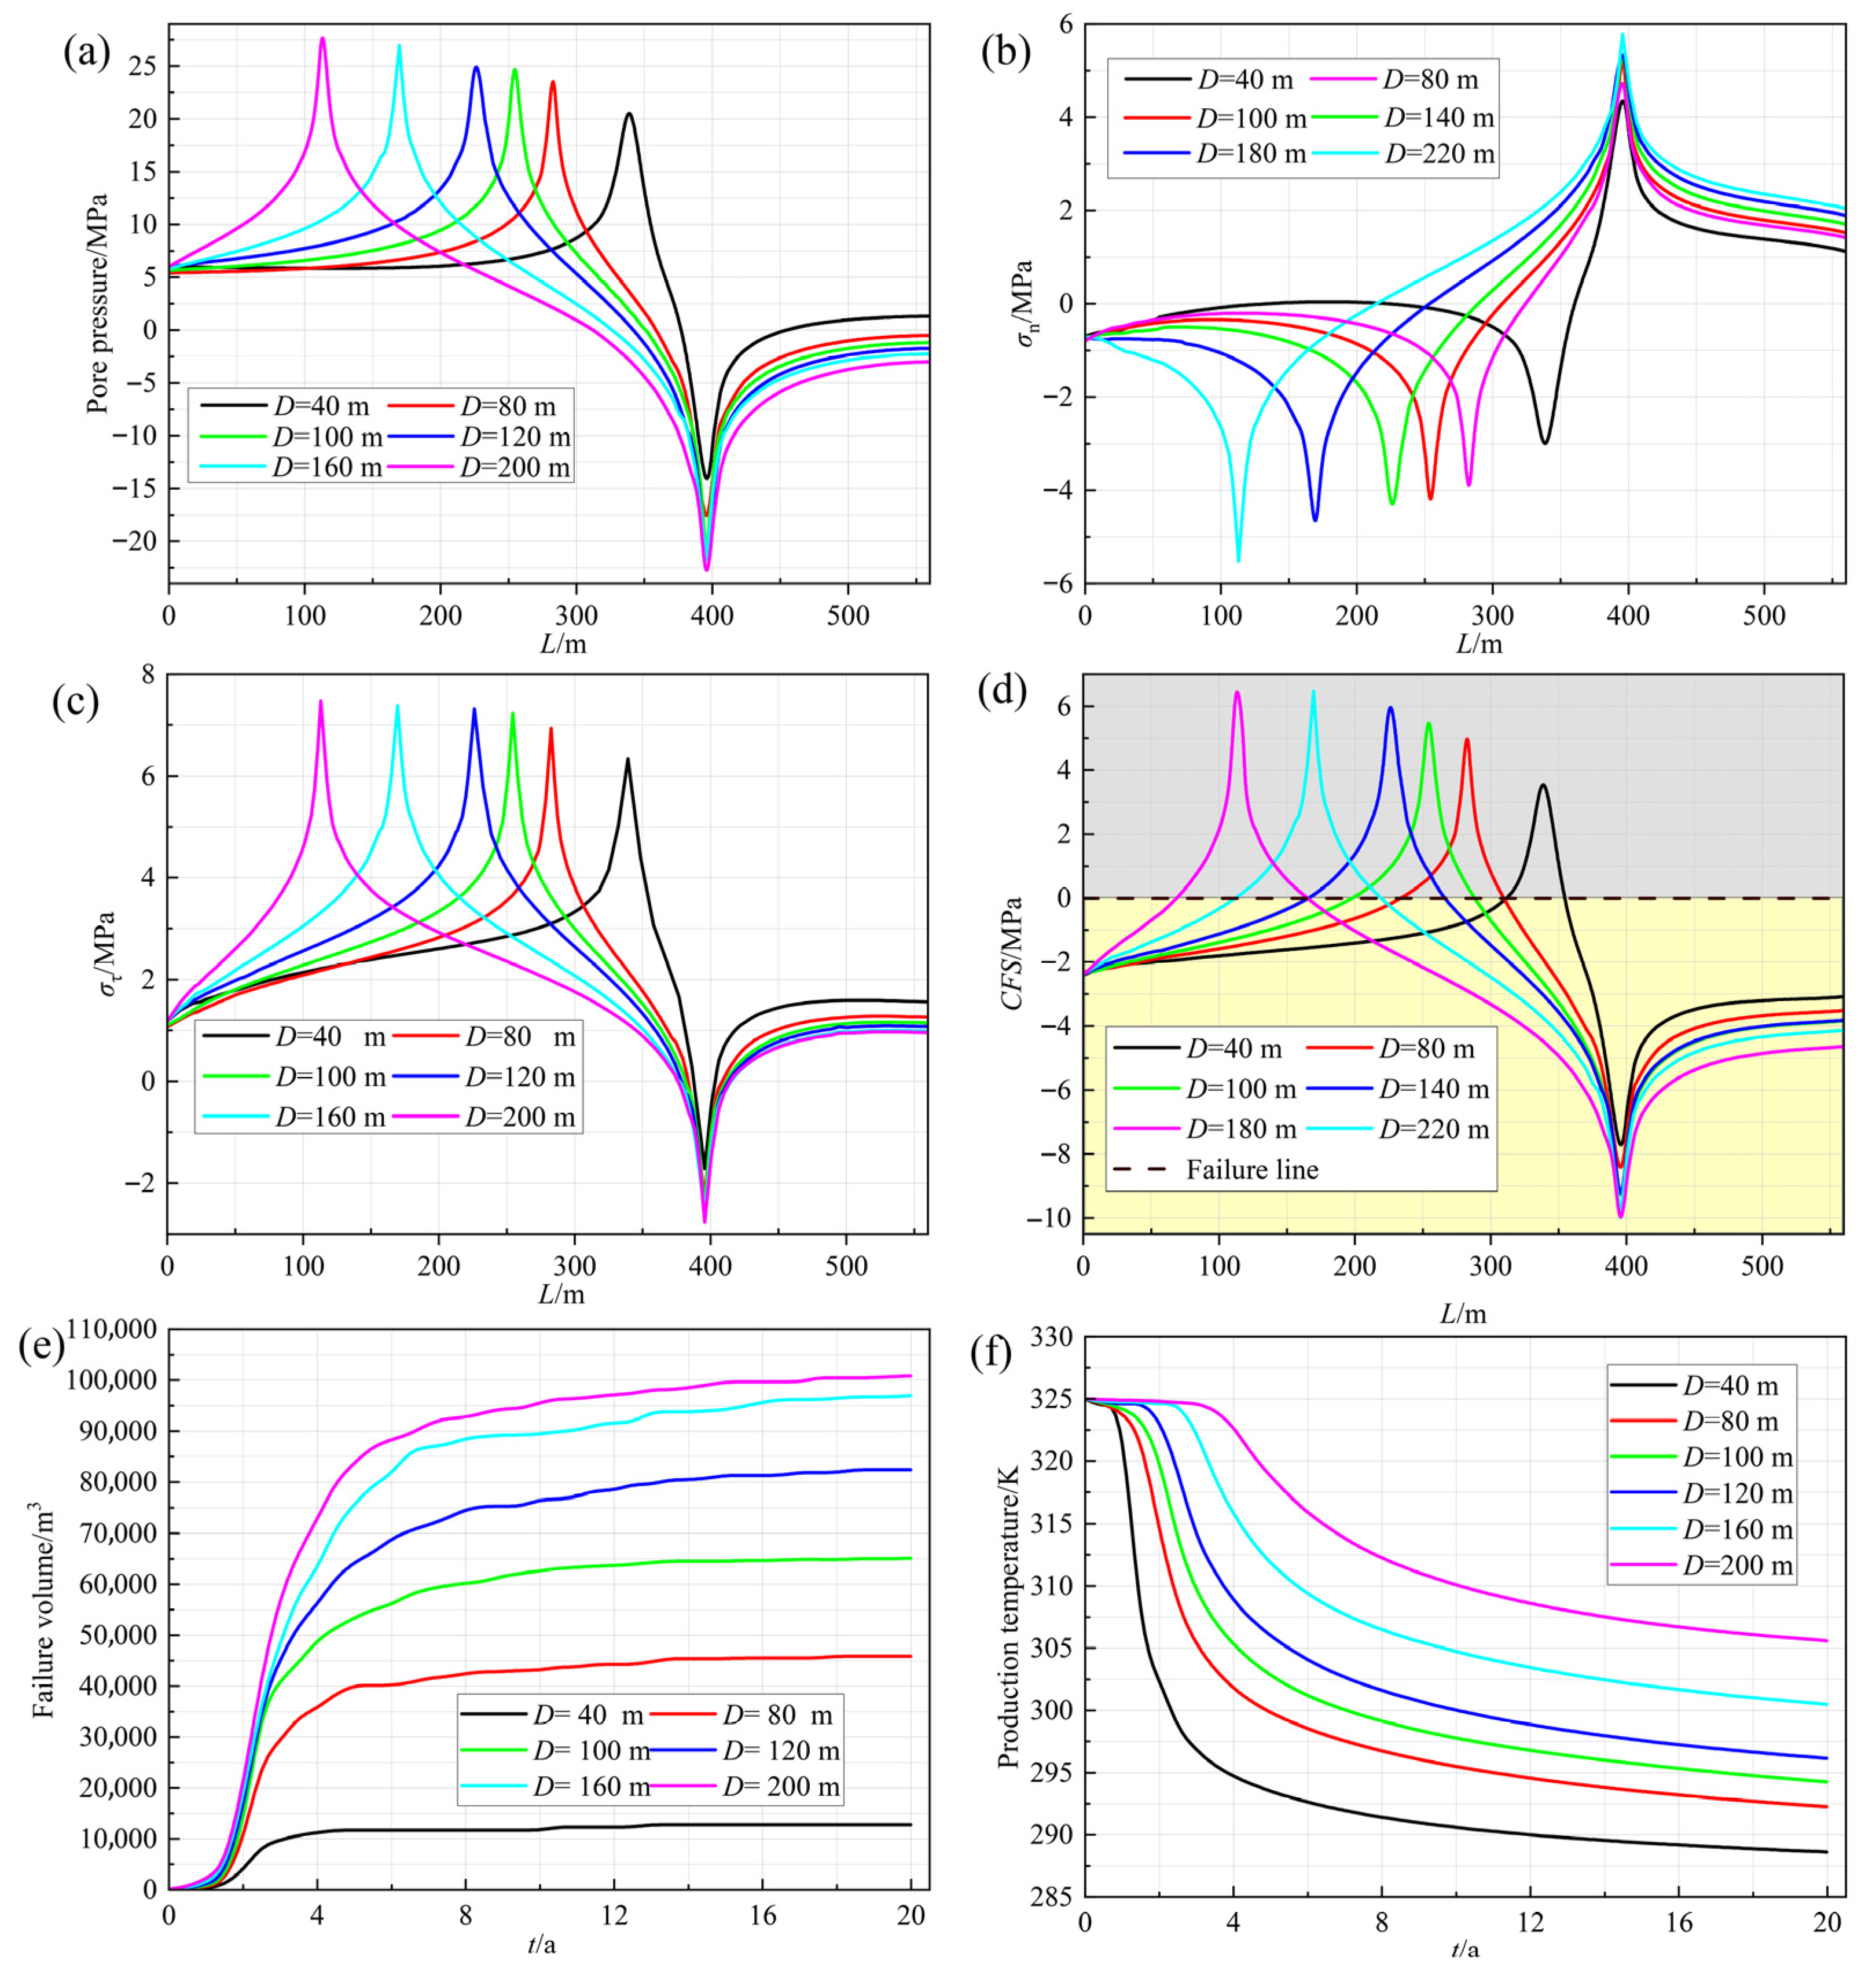
Figure 8a shows the pore pressure of rock mass along the middle line of fault at the 20th year under different well distance. As the well distance increases, the peak pore pressure of rock mass at the reinjection well and production well gradually increases, and the increasing rate of the peak pore pressure decreases. Meanwhile, as the well distance increases, the range of the positive pore pressure zone and the negative pore pressure zone of the fault rock mass gradually increases. This result indicates that the restriction effect of the negative pore pressure zone around the production well on the positive pore pressure zone around the reinjection well decreases with the increase in well distance.
Figure 8b–d show the stress state of the fault rock mass. As the well distance increases, the normal stress of the fault rock mass around the reinjection well decreases and the shear stress increases, whereas the normal stress of the fault rock mass around the production well increases and the shear stress decreases. Therefore, the CFS of the fault rock mass around the production well and the reinjection well decreases and increases, respectively. The area of fault rock mass where the CFS is positive gradually increases with the increase in well distance due to the increasing influence range of the positive pore pressure zone around the reinjection.
Figure 8e shows the failure volume of the fault rock mass under different well distances. The evolution trend of failure volume of the fault rock mass under different well distance within 20 years is similar. As well distance increases, the failure volume of fault rock mass at the 20th year increases, and the increasing rate of failure volume at the 20th year gradually decreases. Obviously, the change in well distance leads to a smaller change degree in the pore pressure of the rock mass around injection and production well, while receiving a higher change degree in the failure volume of the fault rock mass.
Figure 8f analyzes the production temperature within 20 years under different well distance. The larger the well distance, the longer the heat exchange path for the return flow of cold fluid. Hence, as the well spacing increases, the production temperature increases.

3.2.2. Production/Reinjection Flow Rate

Based on the parameters in Section 2.4.2, we changed the reinjection/production flow rate to study the influence of reinjection/production flow rate on the fault stability.
Figure 9a shows the pore pressure of rock mass along the middle line of fault under different reinjection/production flow rates at the 20th year. As the reinjection/production flow rate increases, the average value of the negative pore pressure zone of rock mass around the production well and the positive pore pressure zone of rock mass around reinjection well steadily increases, while the range of these two zones changes little. Moreover, as the reinjection/production flow rate increases, the difference between the positive pore pressure peak and negative pore pressure peak of the fault rock mass gradually increases. This difference is caused by the different influence mechanisms of the reinjection and production wells on the permeability of the nearby rock mass.
Figure 9b–d shows the stress state of the fault rock mass. As the reinjection/production flow rate increases, the shear stress of the rock mass around the reinjection well decreases, while the normal stress of the rock mass around the production well increases. Therefore, as the reinjection/production flow rate increases, the CFS of the rock mass around the reinjection well increases, and the range of the fault rock mass that is CFS > 0 increases stably.
Figure 9e shows the failure volume of the fault rock mass within 20 a under different reinjection/production flow rates. As the reinjection/production flow rate increases, the failure volume of the fault rock mass at the 20th year gradually increases, and the increase rate of the failure volume first increases and then stabilizes. Hence, under the limitation of negative pore pressure around the production well, the growth of the failure volume under high reinjection/production flow rate is relatively stable.
Figure 9f shows the production temperature within 20 years under different reinjection/production flow rate. The production temperature is higher under the reinjection/production flow rate of 5 kg/s and 10 kg/s, and the influence of these reinjection/production flow rates on fault stability is minimal. Therefore, the well network geothermal development pattern with small flow rate is more friendly to the FHS.

3.2.3. Number of Production/Reinjection Sub-Wells

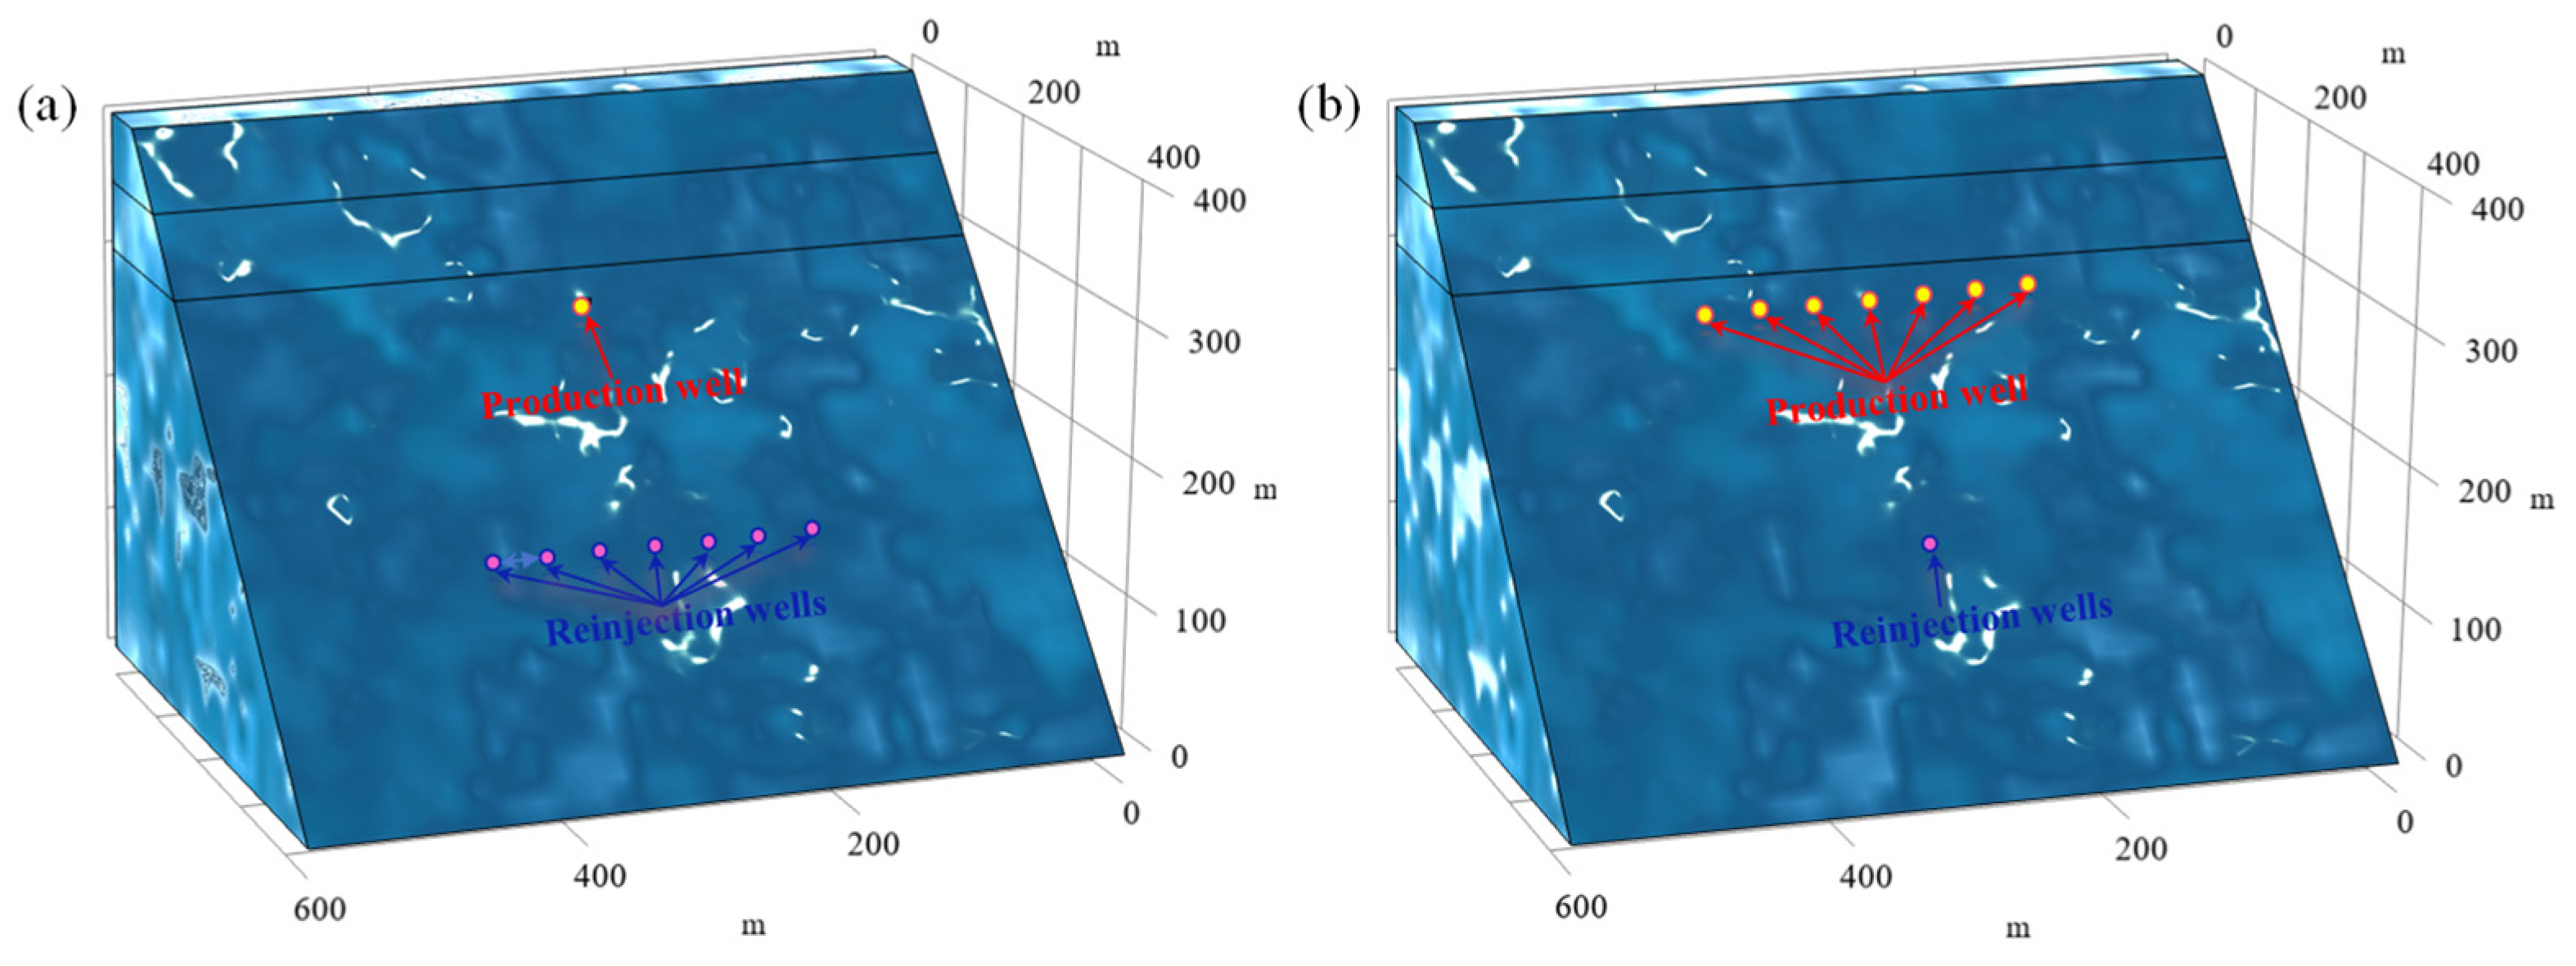
Figure 10 shows the arrangement of sub-wells in this section. The flow rate of one well is divided into 3, 5, and 7 injection, or production, sub-wells under the same total reinjection and production flow rate with an interval of 5 m between each sub-well. The influence of the number of reinjection and production sub-wells on fault stability is studied separately through simulations in Table 3.
Figure 11a shows the pore pressure of the rock mass along the middle line of fault at the 20th year. As the number of production sub-wells increases, the average value of the negative pore pressure zone of the rock mass around the production well decreases, while the range of positive pore pressure zone of the rock mass around the reinjection well expands. Conversely, as the number of reinjection sub-wells increases, the average value of positive pore pressure zone of the rock mass around the reinjection well decreases, while the range of negative pore pressure zone of the rock mass around the reinjection well expands. Thus, the well arrangement of the multiple reinjection sub-wells and single production well can alleviate the pore pressure of the rock mass at the reinjection well and expand the range of the negative pore pressure zone of the fault rock mass.
Figure 11b–d show the stress state of the fault rock mass at the 20th year. As the number of production sub-wells increases, the positive stress of rock mass around the production well decreases and the shear stress increases. The increase in the number of reinjection sub-wells leads to a conversely changing trend of the stress state of the fault rock mass. Therefore, the well arrangement of the multiple production sub-wells and single reinjection well can weaken the adsorption force of the production well on the fault rock mass. This leads to the range of fault rock mass that CFS > 0 expands. The well arrangement of the multiple reinjection sub-wells and single production well can weaken the compressive force of the reinjection well on the fault rock mass. This leads to the range of fault rock mass that CFS > 0 decreases.
Figure 11e shows the failure volume of the fault rock mass within 20 years. As the number of production sub-wells increases, the failure volume of fault rock mass at the 20th year increases slowly. As the number of reinjection sub-wells increases, the failure volume of the fault rock mass at 20 years decreases significantly. Therefore, the well arrangement of the multiple reinjection sub-wells and single production well effectively alleviates the influence of reinjection process on the fault stability.
Figure 11f compares the long-term thermal performance under different well layouts, showing the production temperature over a 20-year period. Interestingly, the temperature curves under various configurations exhibit remarkably small differences, within a 5% range. The overall thermal sweep efficiency of the system appears to be largely unaffected by the geometric arrangement of the wells. This can be attributed to the fact that, although multi-well layouts alter the local concentration of pore pressure, they do not significantly affect the heat exchange path of the cold fluid. Thus, this method can be considered an effective production strategy that achieves good energy efficiency while mitigating potential hazards.

3.3. The Influence of Fault Parameters on Fault Stability

This study comprehensively addresses fault stability and heat extraction efficiency, offering guidance for fault geothermal system parameters, as showen in Table 4.

3.3.1. Initial Permeability of Fault

Based on the parameters in Section 2.4.2, we changed the initial permeability of fault to study the influence of permeability on the fault stability.
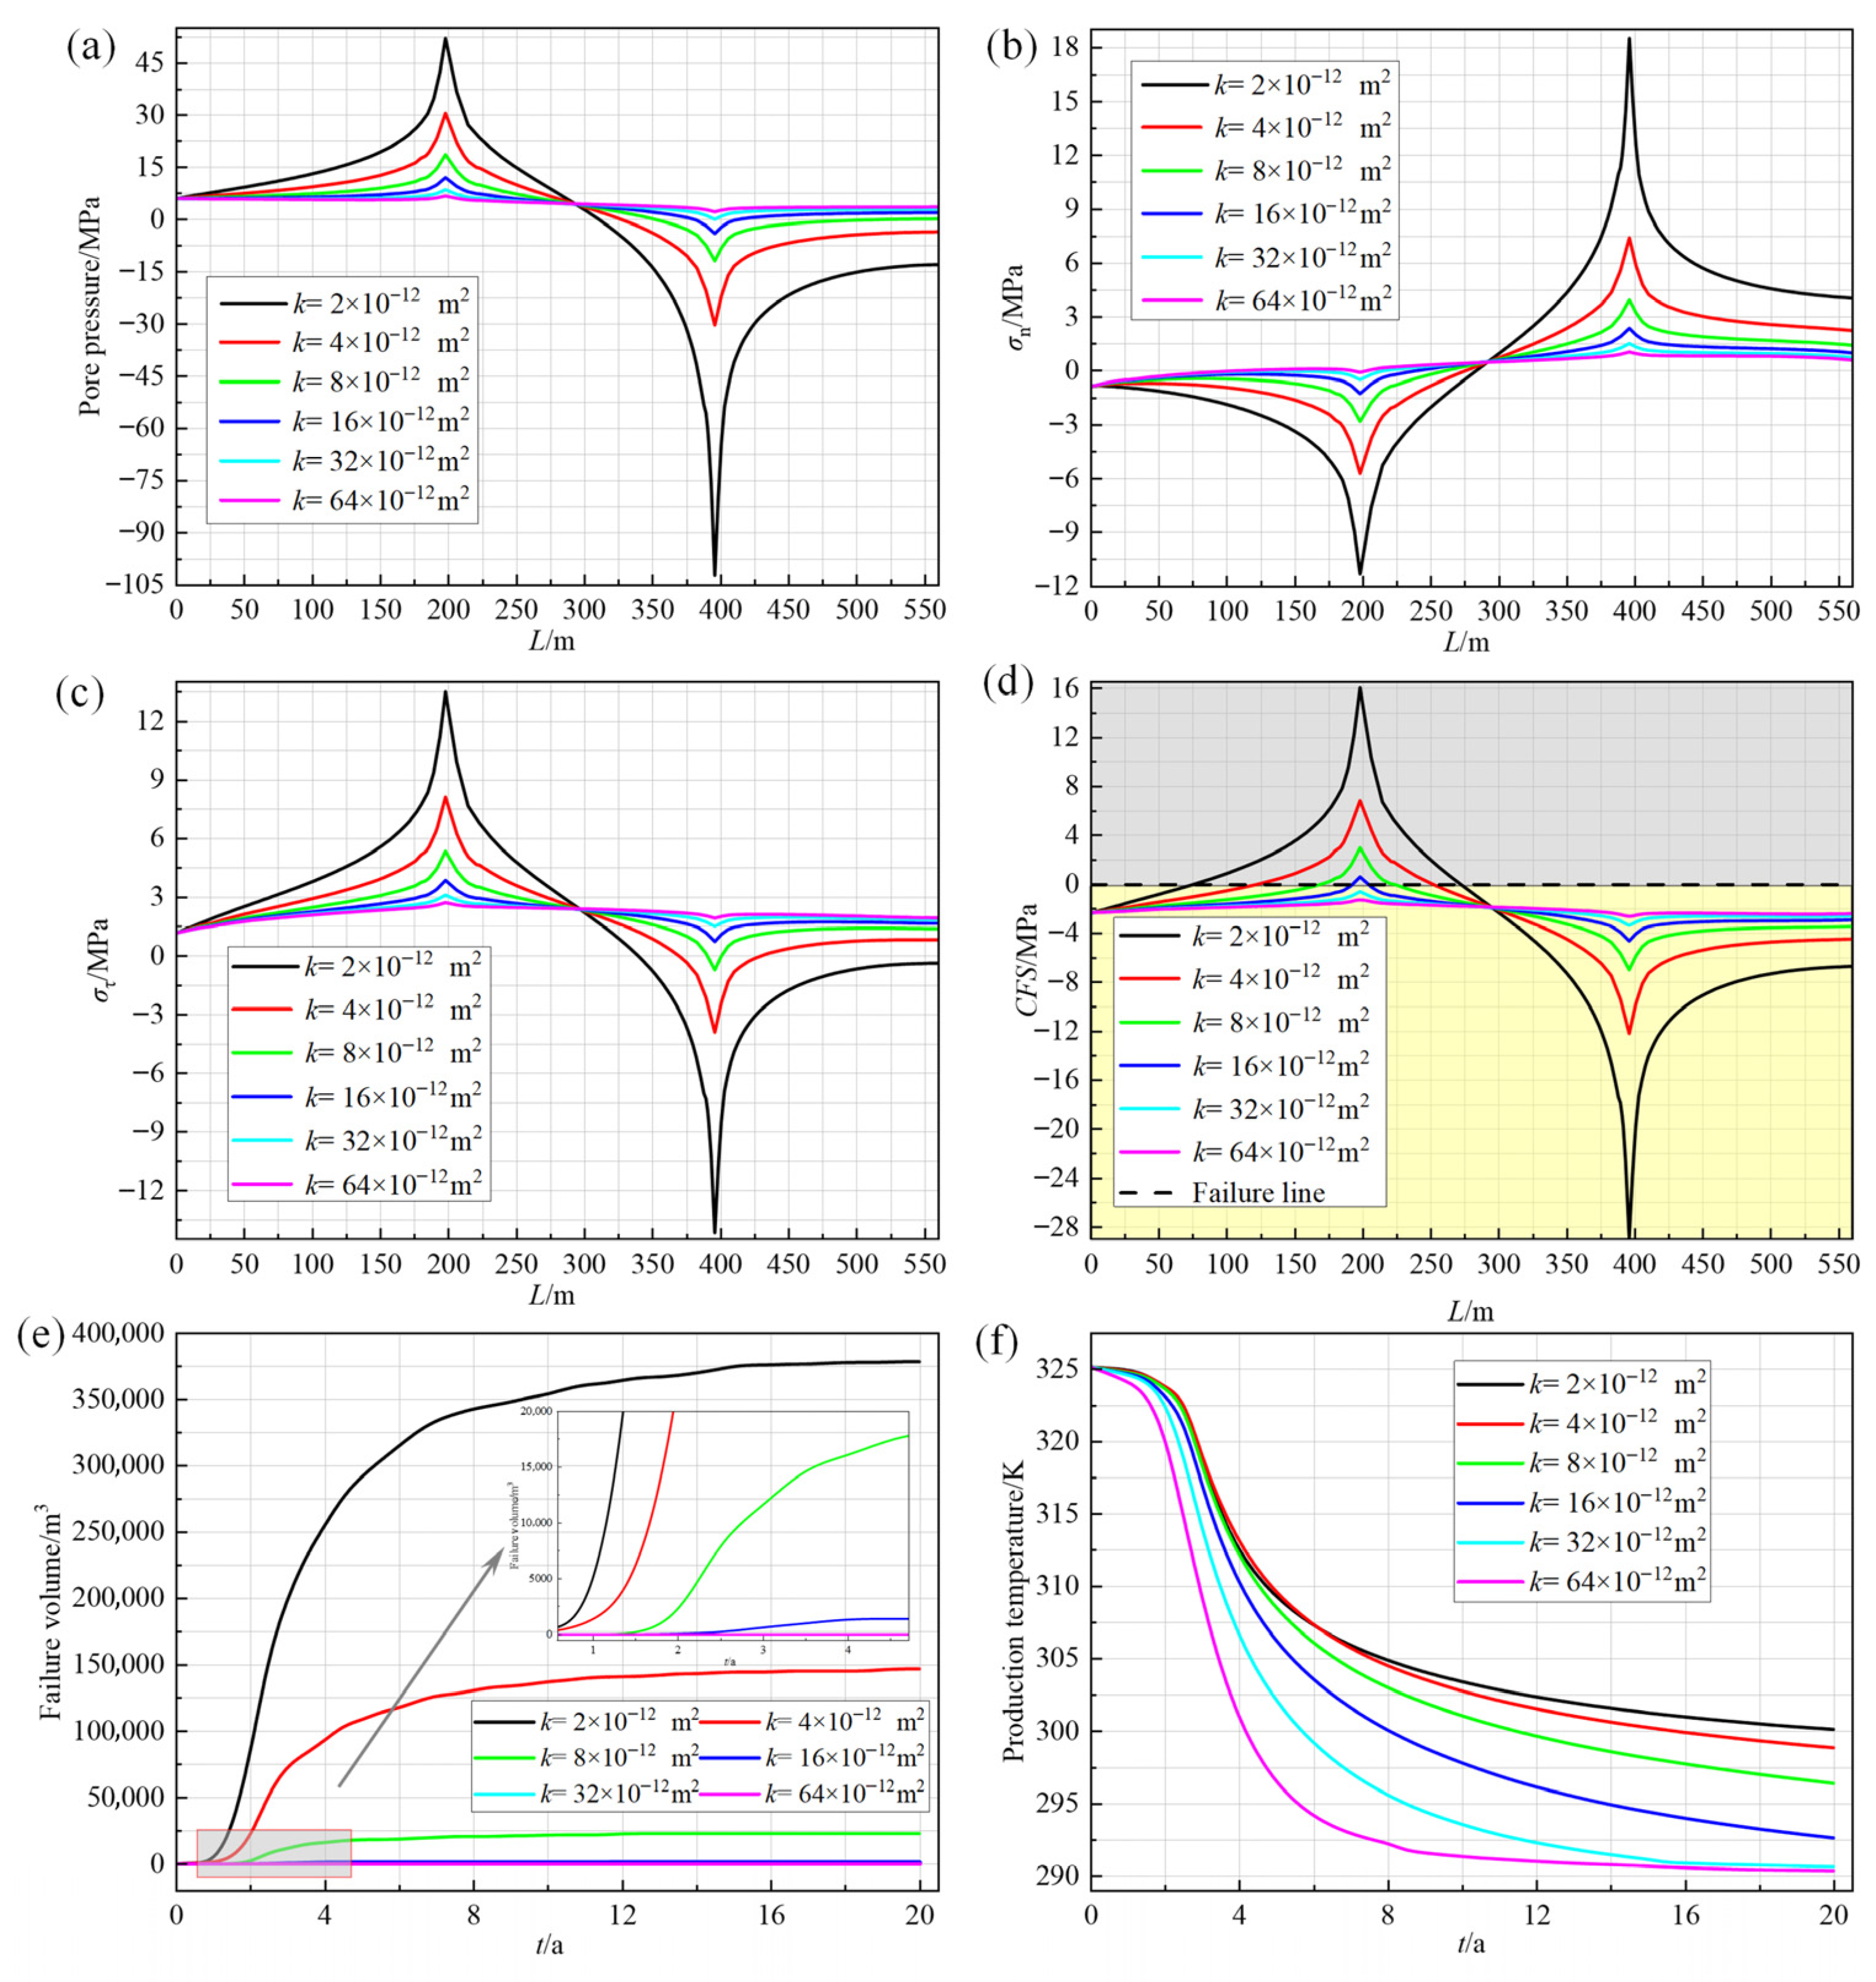
Figure 12a shows the pore pressure of rock mass along the fault middle line at the 20th year under different initial fault permeability. As the initial permeability of fault increases, the average pore pressure of rock mass around the reinjection well and production well gradually decreases. The positive pore pressure of rock mass at the reinjection well is obviously smaller than the negative pore pressure at the production well under lower initial permeability. This is the result of the different change in rock mass permeability. Therefore, the diffusion of pore pressure in the high permeability rock mass is faster. This can promote the mutual influence of the pore pressure at the reinjection well and production well.
Figure 12b–d shows the stress state of the fault rock mass. As the initial permeability of fault increases, the normal stress concentration of fault rock mass at the production well and the shear stress concentration of the fault rock mass at the injection well gradually dissipate. Hence, the CFS of the rock mass around the reinjection well decreases significantly. There is no zone that CFS > 0 of the fault under higher initial permeability (k > 16 × 10−12 m2).
Figure 12e shows the failure volume of fault rock mass within 20 years. As the initial permeability of fault increases, the failure volume of the fault rock mass at the 20th year increases exponentially. The influence of reinjection and production on the fault stability is nearly negligible under k = 16 × 10−12 to 64 × 10−12 m2.
Figure 12f shows the production temperature within 20 years. The increase in initial permeability of fault enhances the generation of an advantage path of cold fluid. This can reduce the heat exchange path of cold fluid. Hence, as the initial permeability of fault increases, the production temperature decreases.

3.3.2. Fault Thickness

Based on the parameters in Section 2.4.2, we changed the thickness of the fault to study the influence of thickness of the fault on the fault stability.
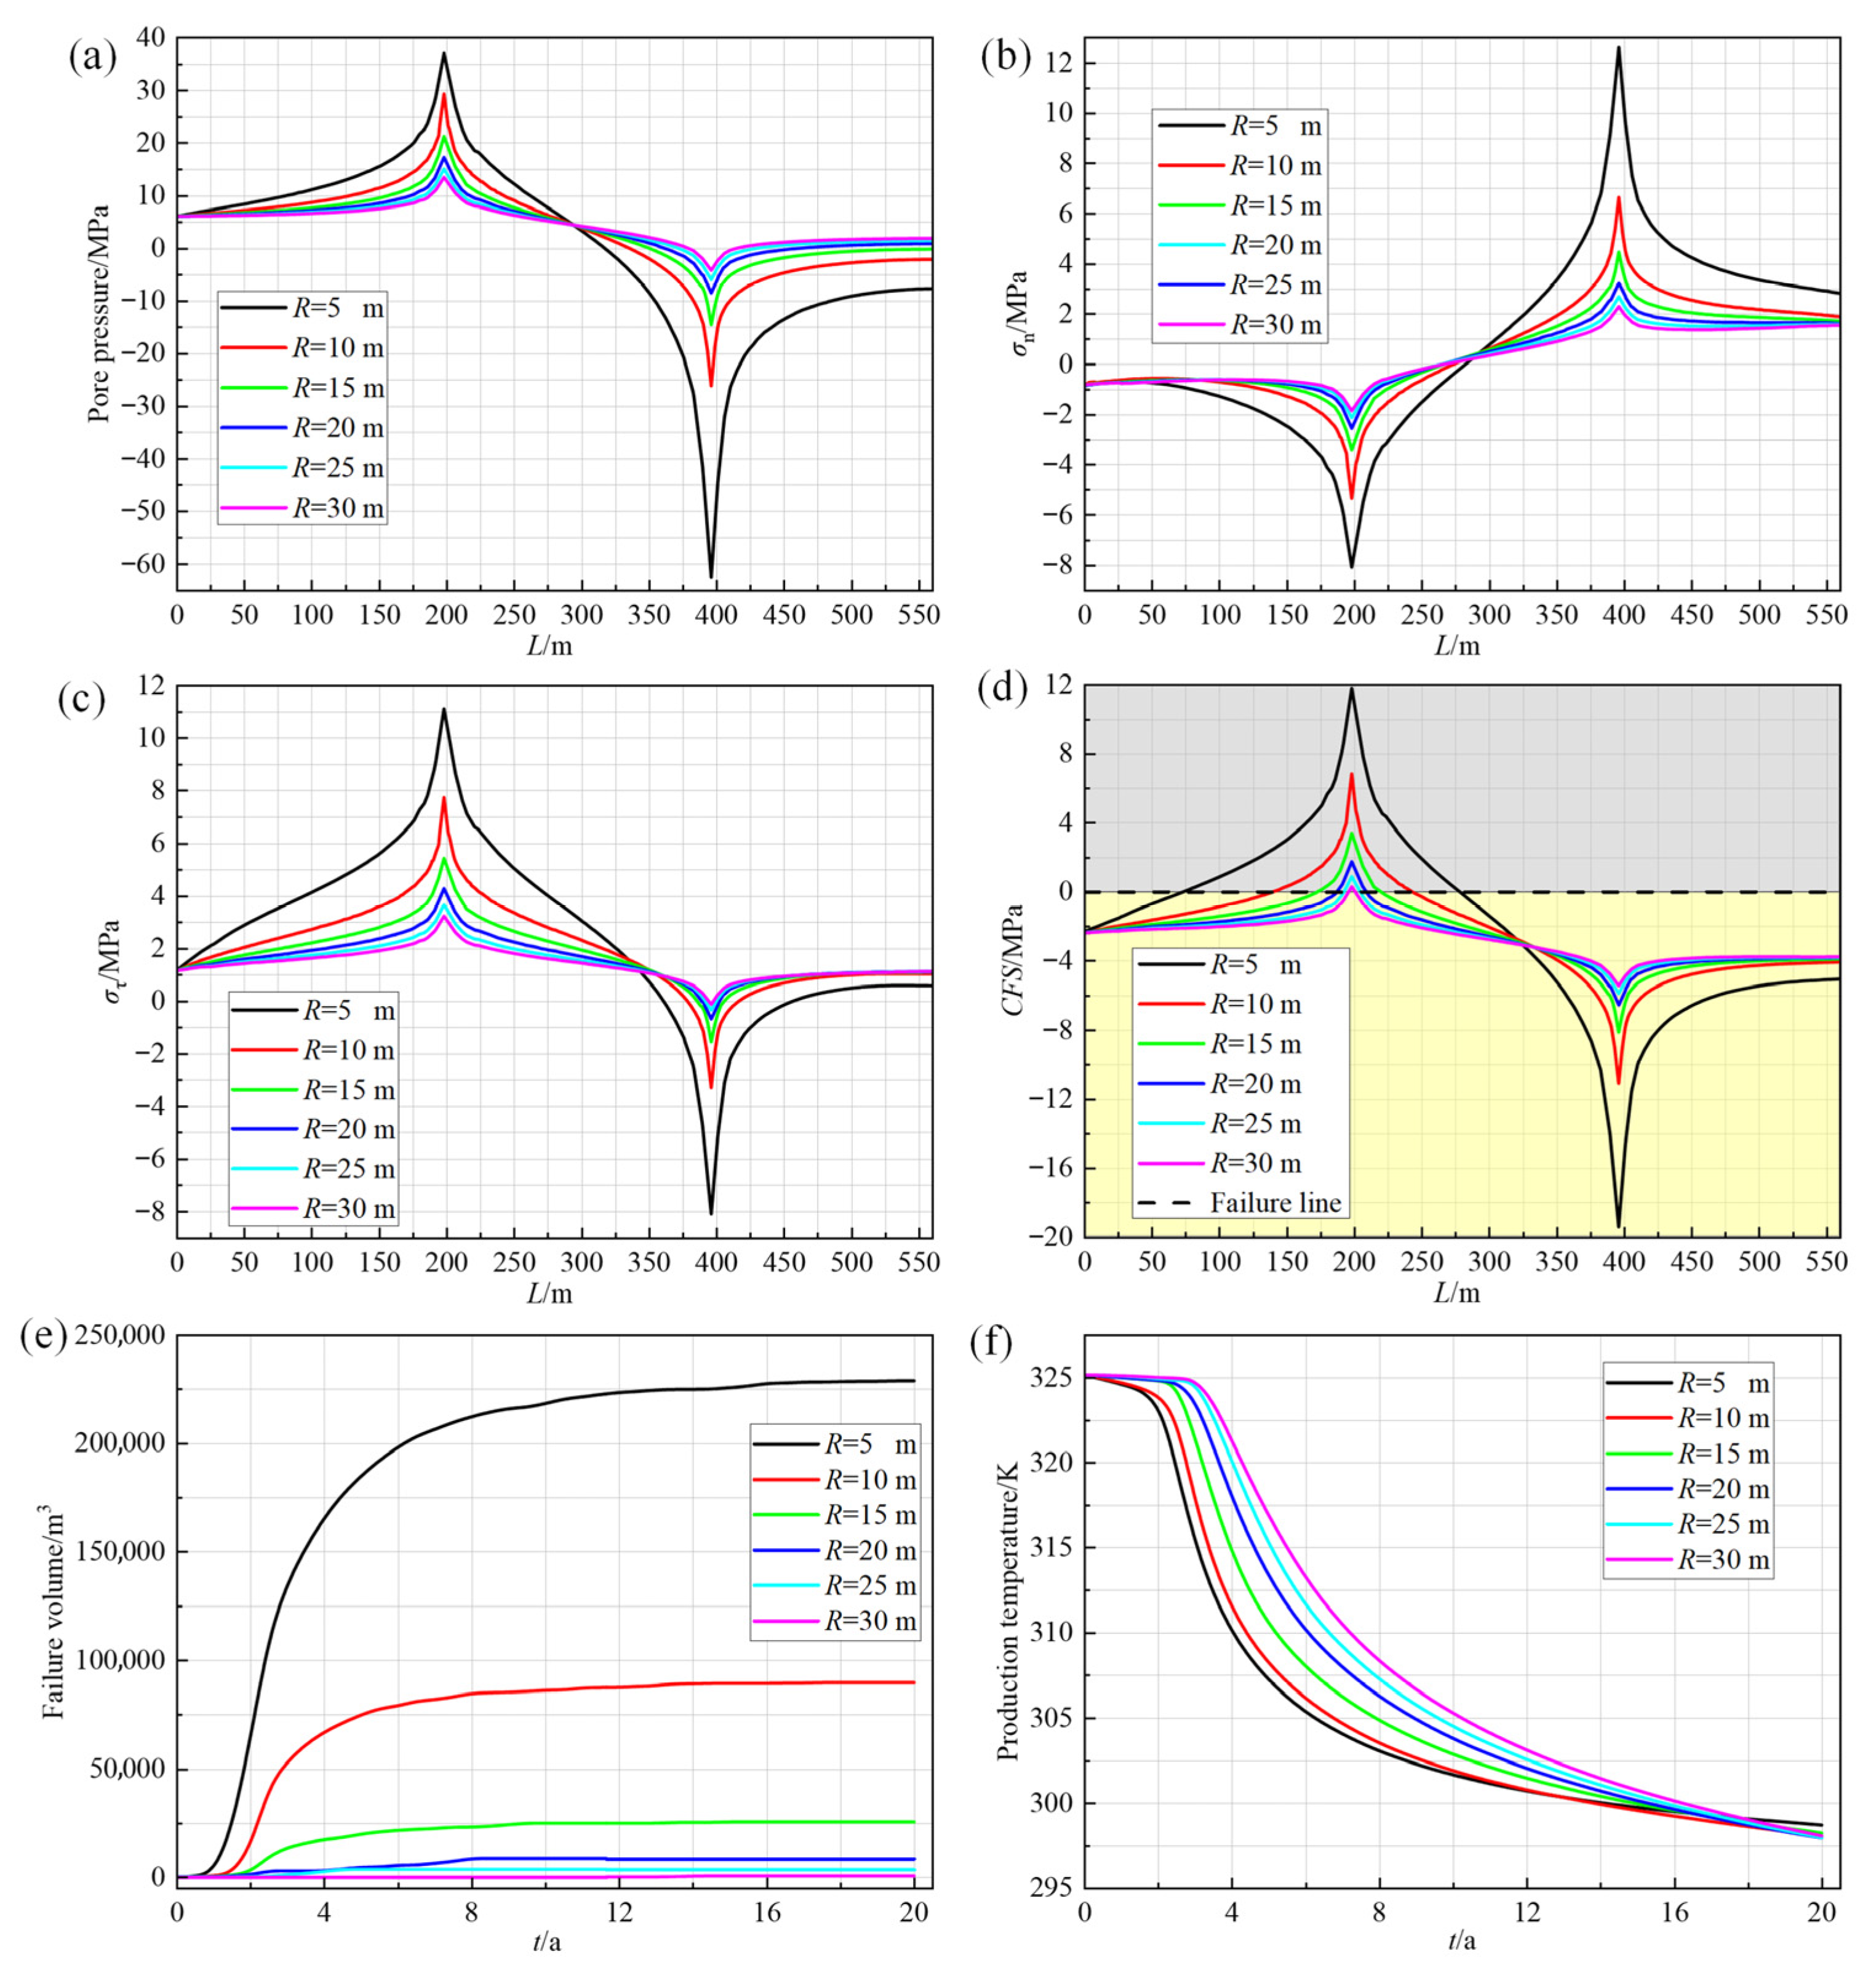
Figure 13a shows the pore pressure of rock mass along the middle line of the fault at the 20th year. As fault thickness increases, the average value of pore pressure of the rock mass around the reinjection well and production well decreases. The increase in fault thickness promotes the mutual influence of pore pressure at the reinjection well and production well.
Figure 13b–d shows the stress state of the fault rock mass. As the thickness of the fault increases, the degree of stress concentration around the reinjection well and production well decreases. The CFS of the fault rock mass around the reinjection well and production well decreases.
Figure 13e shows the failure volume of fault rock mass within 20 years. As fault thickness increases, the failure volume of fault rock mass at the 20th year significantly decreases. The influence of injection and production on the fault’s stability is nearly negligible under R = 25 m, 30 m.
Figure 13f shows the production temperature within 20 years. The increase in fault thickness enhances the heat exchange area of cold fluid. As the fault thickness increases, the production temperature increases.

3.3.3. Fault Dip-Angle

Based on the parameters in Section 2.4.2, we changed the dip angle of the fault to study the influence of fault dip-angle on the fault’s stability.
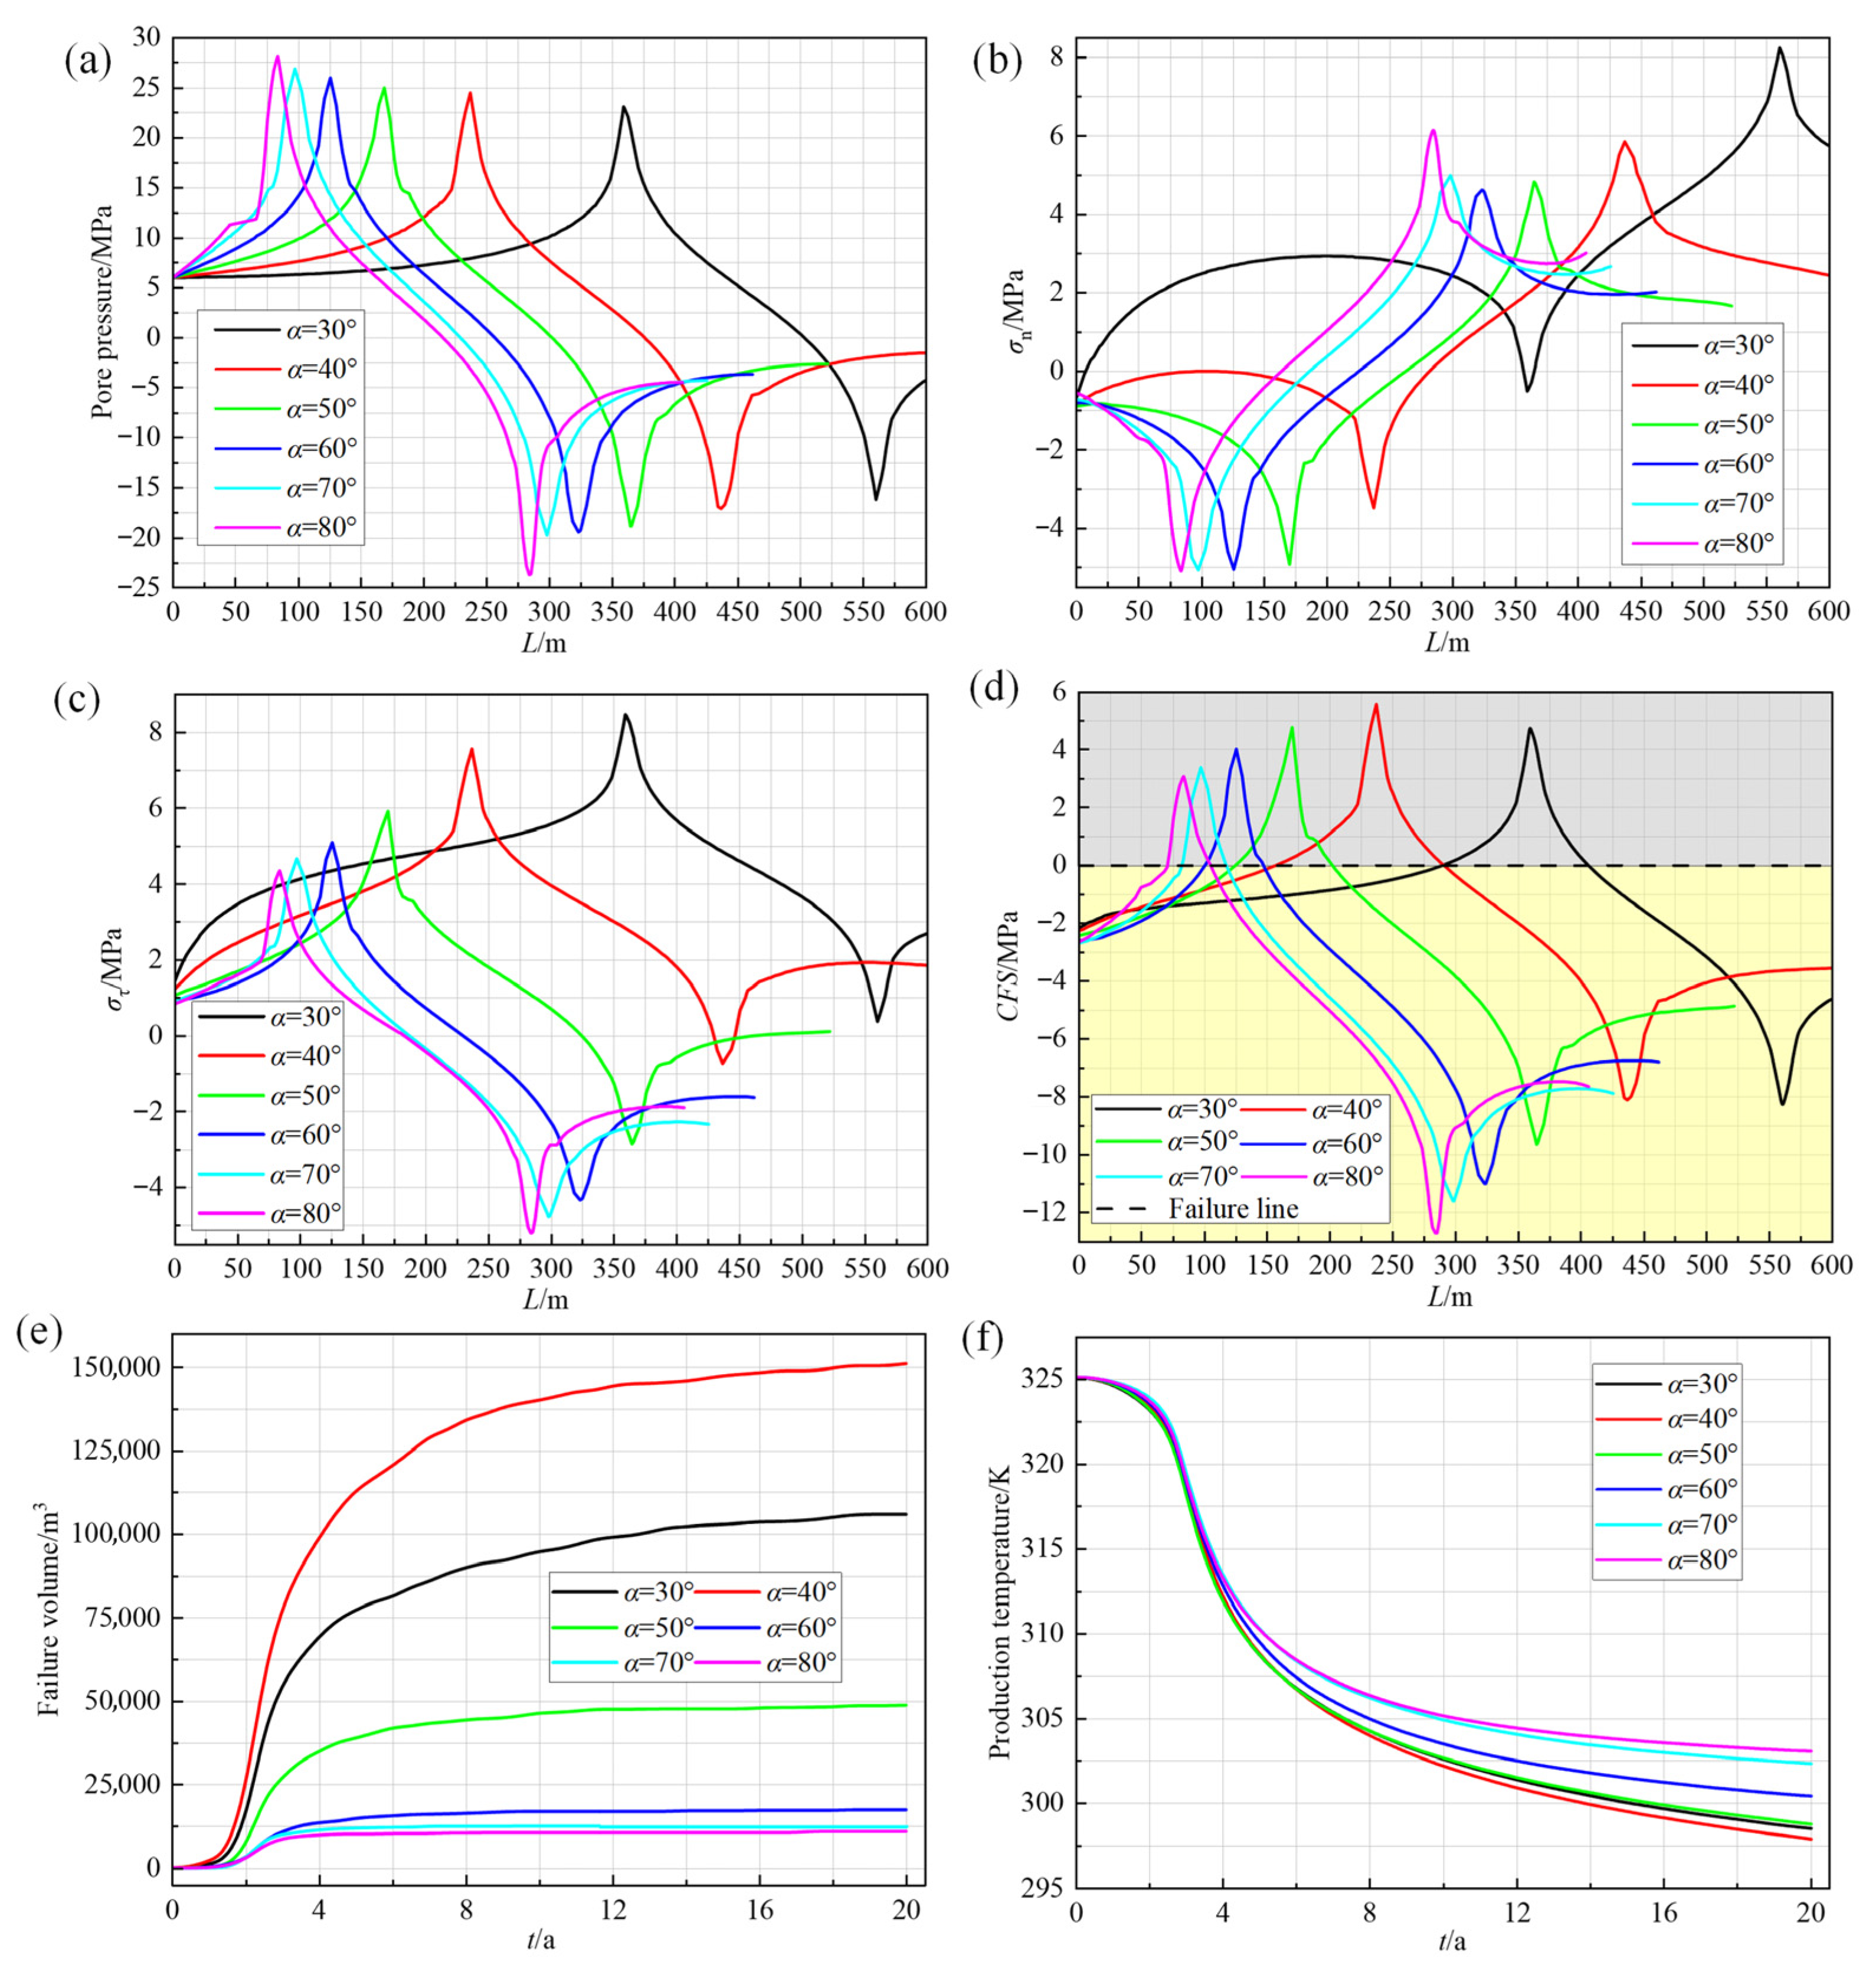
Figure 14a shows the pore pressure of rock mass along the middle line of the fault at the 20th year under different fault dip-angles. As the fault dip-angle increases, the average value of positive pore pressure around the reinjection well increases, and the average value of the negative pore pressure around the production well increases. The influence mechanism of the fault dip-angle on pore pressure is as follows: as the fault dip-angle increases, the compressive stresses in X and Y direction of the fault rock mass gradually increase. The increase in the compressive stress leads to the increase in the initial strain of the fault rock mass. Hence, as the fault dip angle increases, the decrease in the initial permeability of the fault leads to an increase in the pore pressure of rock mass.
Figure 14b–d show the stress state of fault rock mass. As the fault dip-angle increases, the normal stress of rock mass around the production well first decreases and then increases, while the shear stress of rock mass around the injection well decreases gradually. The CFS of rock mass around the injection well first decreases and then increases with the increase in fault dip-angle. The trend of the stress state on the fault plane is different from that of the pore pressure. This the original stress of the fault rock also changes with the dip-angle of the fault, leading to the stress state of fault influenced by the original stress condition and the pore pressure.
Figure 14e shows the failure volume of the rock mass within 20 years. As the fault dip-angle increases, the failure volume of rock mass at the 20th year first increases and then decreases. The influence of reinjection and production on the fault’s stability is relatively small under α = 60°, 70°, and 80°.
Figure 14f shows the production temperature within 20 years. As the fault dip-angle increases, the production temperature first decreases and then increases. The increase in production temperature can be attributed to the higher compressive stress that reduces the permeability of the fault rock mass.

4. Discussion

4.1. The Stress Path of Fault Rock Mass Under Different Fault and Well Parameters

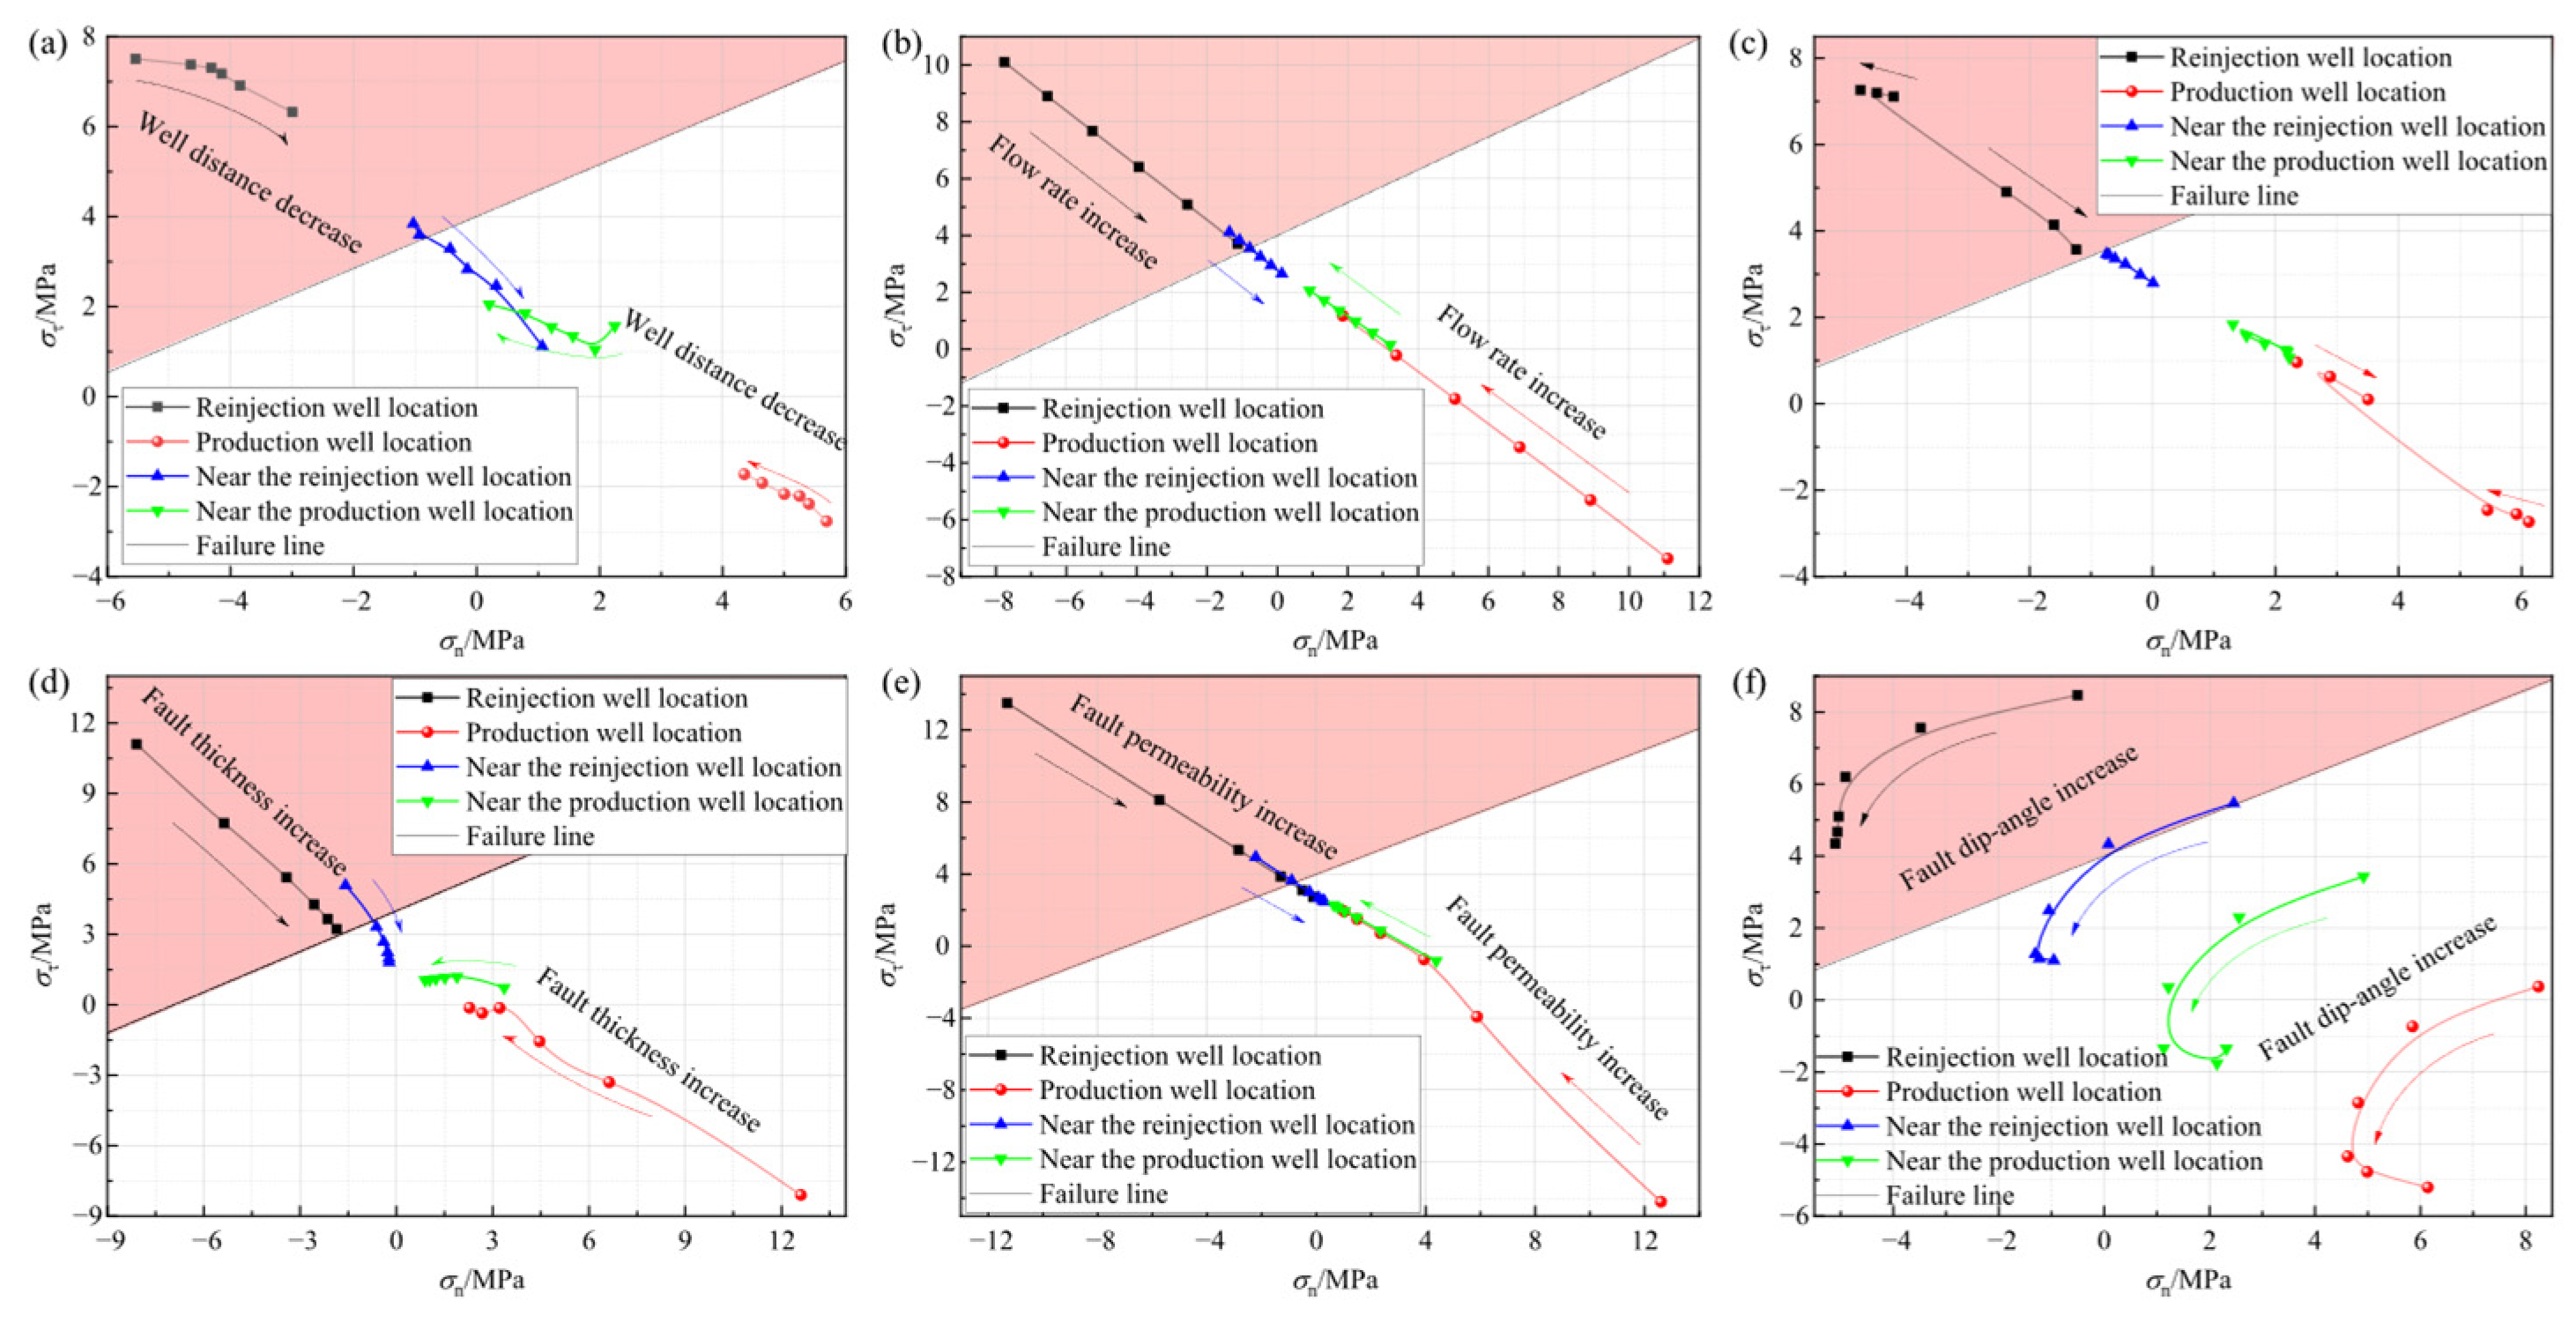
To further understand the influence of equilibrium reinjection and production on the fault stability under different fault and well parameters, this section takes certain points on the fault to further analyze the evolution of stress paths of fault rock mass near injection and production wells. Figure 15 shows the evolution of the stress paths at the production well location, near the production well location, at the reinjection well location, and near the injection well location under different fault and well parameters.
The degree of influence of different parameters on the stress state of the fault rock mass is quite different. The fault thickness, initial fault permeability, and reinjection/production flow rate show a more significant degree of impact on the stress state of the fault rock mass. The influence evaluation of different parameters on the stress state of the fault rock mass also shows certain differences. The influence evaluation of the reinjection/production flow rate, fault thickness, and initial fault permeability on the stress state of the fault rock mass is similar. The decrease in the reinjection/production flow rate and the increase in the fault thickness, and initial fault permeability, all make the stress path of the fault rock mass at the reinjection well and production well change in the opposite direction. The essence of the influence of these factors is changing the diffusion rate of pore pressure at the reinjection and production wells. Moreover, the influence evaluation of the well distance and the number of reinjection and production wells on the stress state of the fault rock are similar. The increase in the well distance and the number of production wells all make the stress path of the fault rock at the reinjection and production wells change in the same direction. The essence of the influence of these factors is changing the degree of mutual influence between the pore pressure at the reinjection and production wells. The influence evaluation of the fault dip-angle on the stress state of fault is quite different from that of other factors. The essence of the influence of the fault dip-angle is adjusting the stress distribution of the fault rock mass.

4.2. Relationship Between the Failure Volume and Thermal Recovery Performance

This section discusses the relationship between the TRP and the failure volume of fault under different factors.
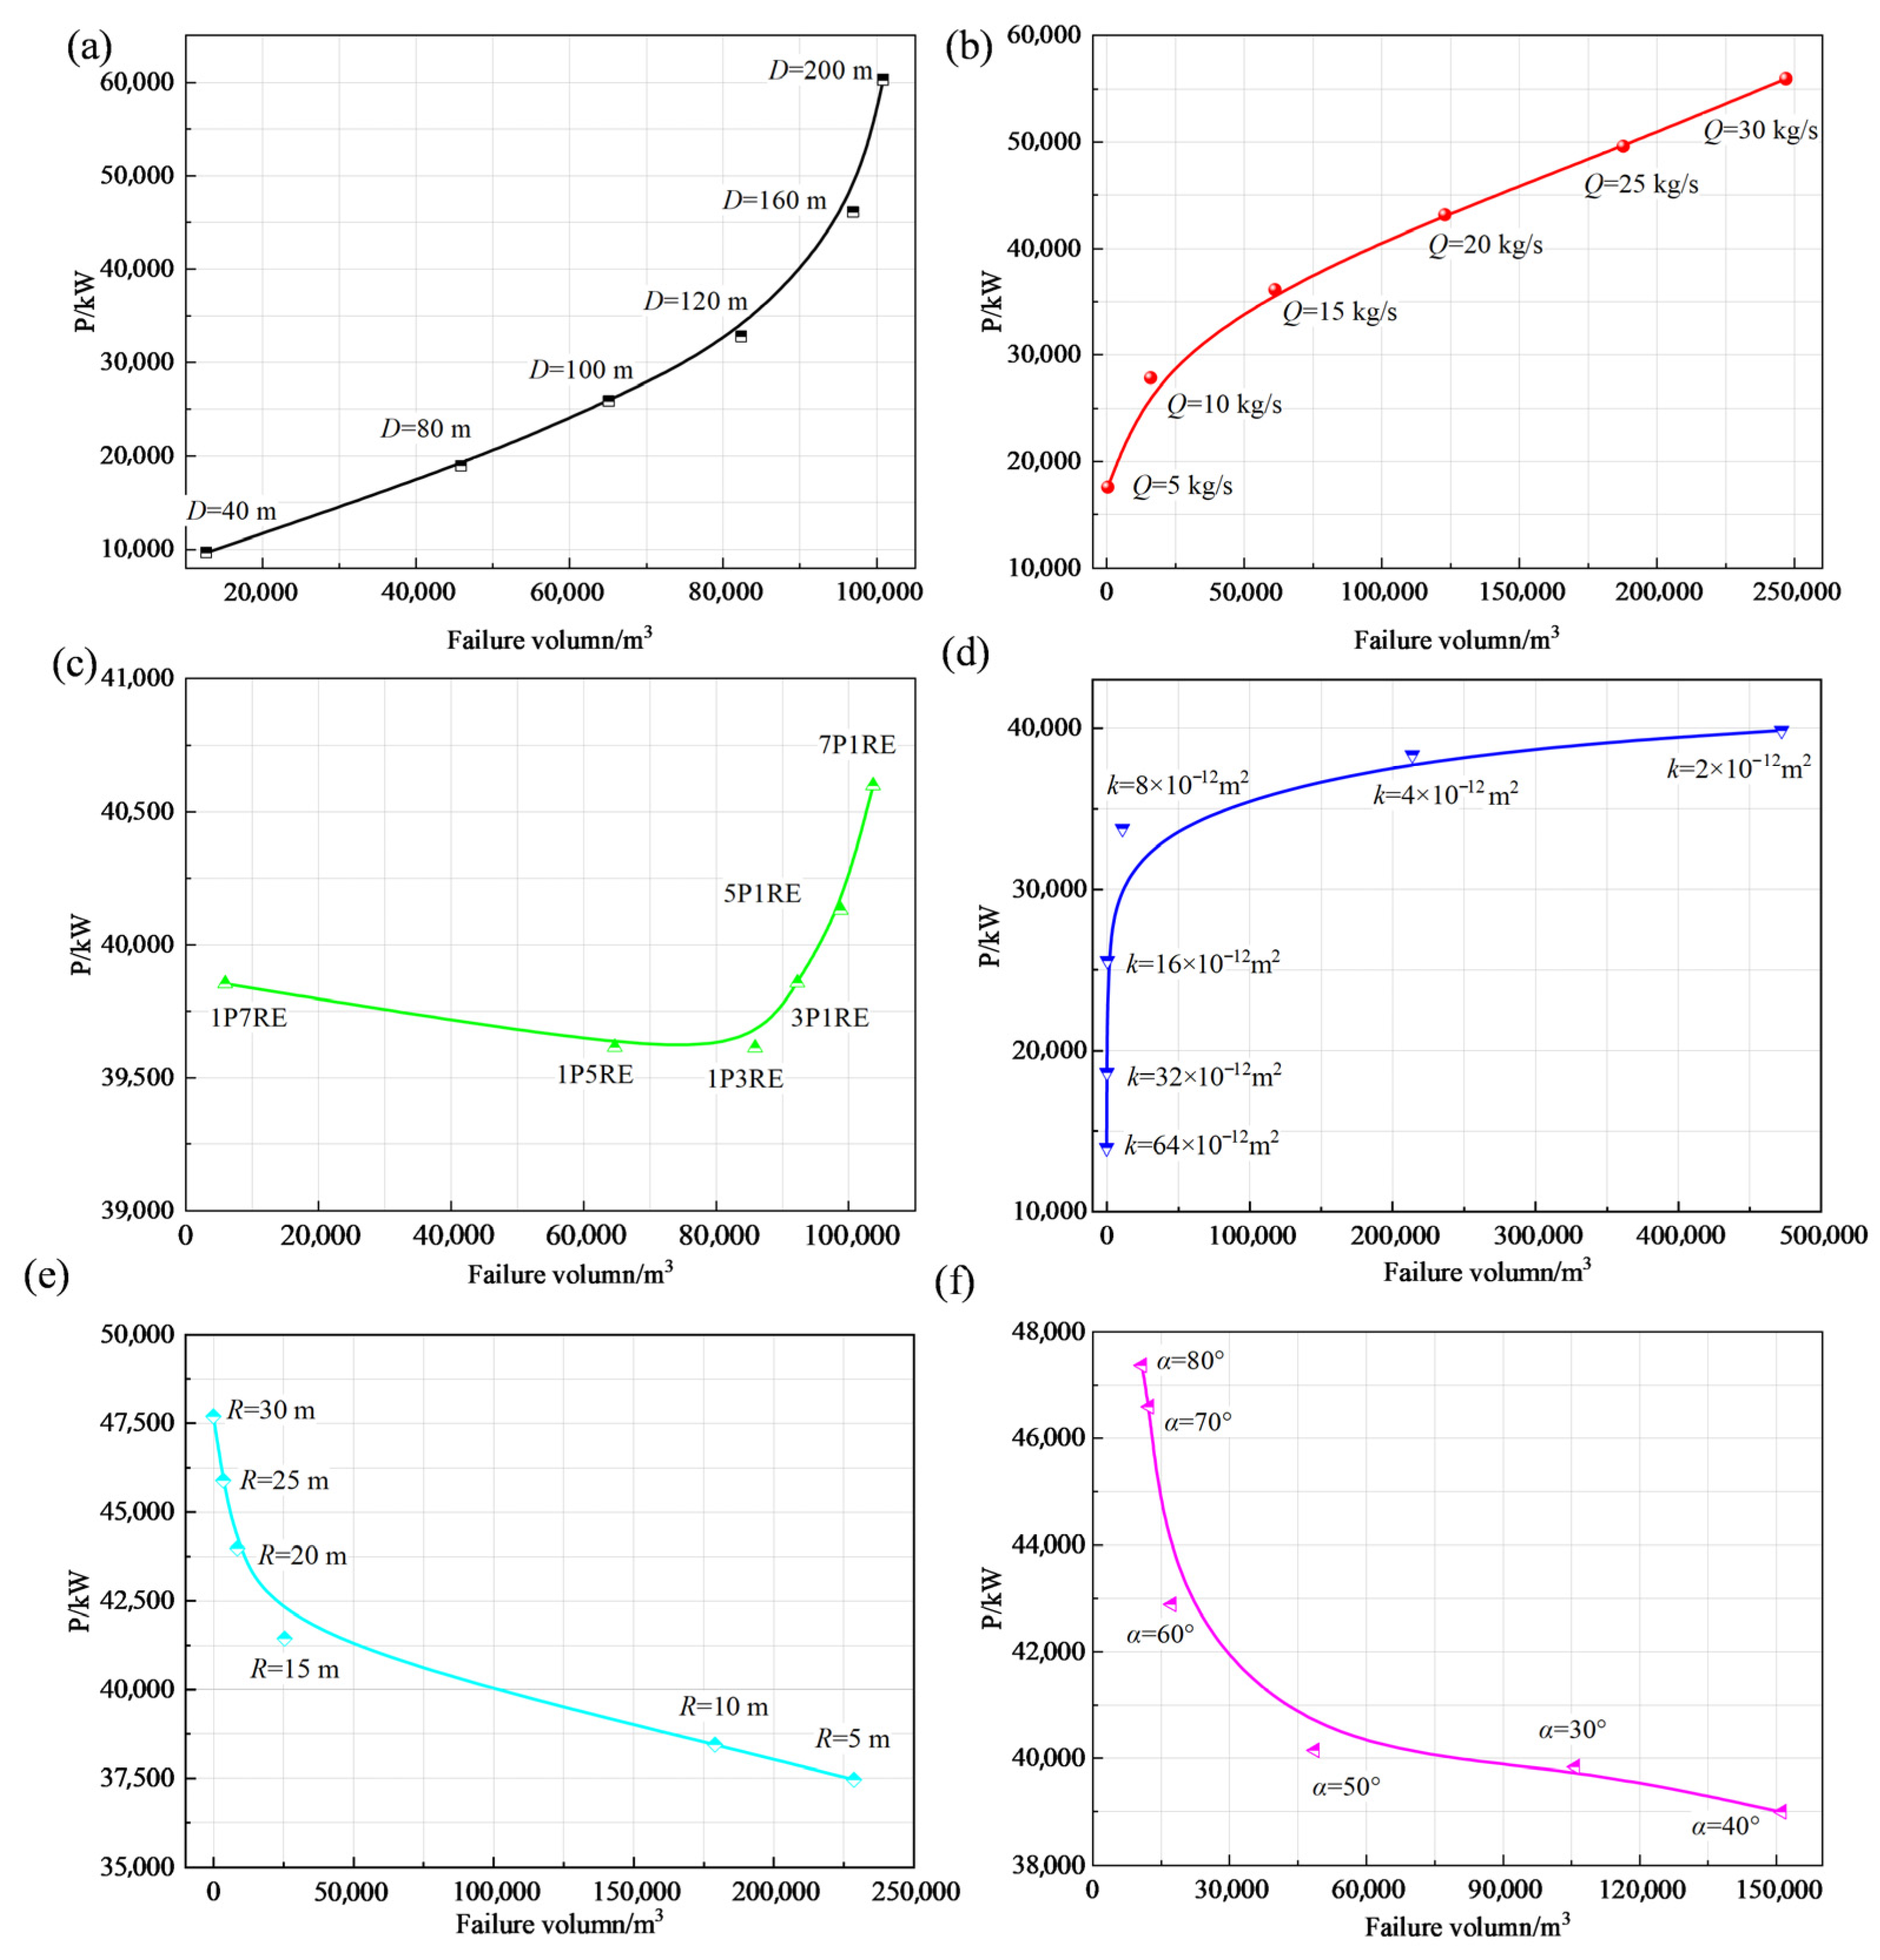
Figure 16 shows the relationship between the failure volume of fault rock mass and the accumulative thermal power under different factors. The accumulative thermal power and failure volume of the fault are proportional under different well distance, reinjection/production flow rate, and initial permeability of fault. This means that directly adjusting the well distance and reinjection/production flow rate to improve the TRP of the FHS is not advisable. Moreover, the accumulative thermal power increases rapidly while the failure volume of the fault increases negligibly with the decrease in initial permeability of the fault from 8 × 10⁻¹² m2 to 64 × 10−12 m2. This indicates that an appropriate smaller fault permeability can ensure better TRP and fault stability. According to previous studies [27,37], the better TRP of FHS has a larger well distance, reinjection/production flow rate, and initial permeability of the fault, which is consistent with this study. However, the difference is that excessively large values of these parameters are not conducive to maintaining fault stability.
The accumulative thermal power and failure volume of the fault are inversely proportional under different fault thicknesses and fault dip-angles. This means that improving these factors to enhance the TRP of FHS is feasible. Therefore, selecting faults with larger thickness and dip-angles can achieve better TRP while ensuring the fault stability. Konrad et al. confirmed that a higher thickness and dip-angle of the fault results in better TRP [10]. Meanwhile, this study shows that an increase in these factors can also reduce the instability risk of the fault rock mass. This proves that these factors are favorable factors for improving the TRP of FHS.
The difference in accumulative thermal power between the different well arrangements is relatively small. However, the well arrangements of multiple reinjection sub-wells and single production wells can significantly reduce the failure volume of a fault. Therefore, the well arrangements of multiple reinjection sub-wells and single production well are suitable for FHS.

4.3. Relationship Between the Fault Parameters and Failure Zone

Figure 17 shows the failure volume of fault at the 20th year under different fault parameters. As the fault parameters decrease, the failure volume of fault rock mass initially increases slowly. After the fault parameters decrease to a certain value, the increasing rate of failure volume of the fault rock mass accelerates sharply. The study calls this value of the fault parameter the critical value of fault instability. The reason for the sharp increase in failure volume of the fault rock mass can be attributed to the evolution of fault permeability. As the fault parameters decrease, the pore pressure of the fault rock mass increases. Before the pore pressure of fault can lead to significant deformation of the rock mass, the fault permeability changes negligibly. After the pore pressure of fault can lead to significant deformation of the rock mass, the permeability of the fault changes dramatically. This can amplify the increase in pore pressure of the fault rock mass, causing the instability zone of the fault rock mass to expand sharply. The existence of the critical value of fault instability indicates that a certain range of smaller fault parameters is adverse to the operation of FHS. Previous studies showed that the increase in fault parameters leads to a proportional increase in shear stress and slip of fault, with no abrupt change in increasing rate [20,38]. The difference between previous studies and this study can be attributed to the existence of production well pressure. This also indicates that the interaction of the pore pressure between the production well and reinjection well is more pronounced before the fault parameters are less than the critical values.
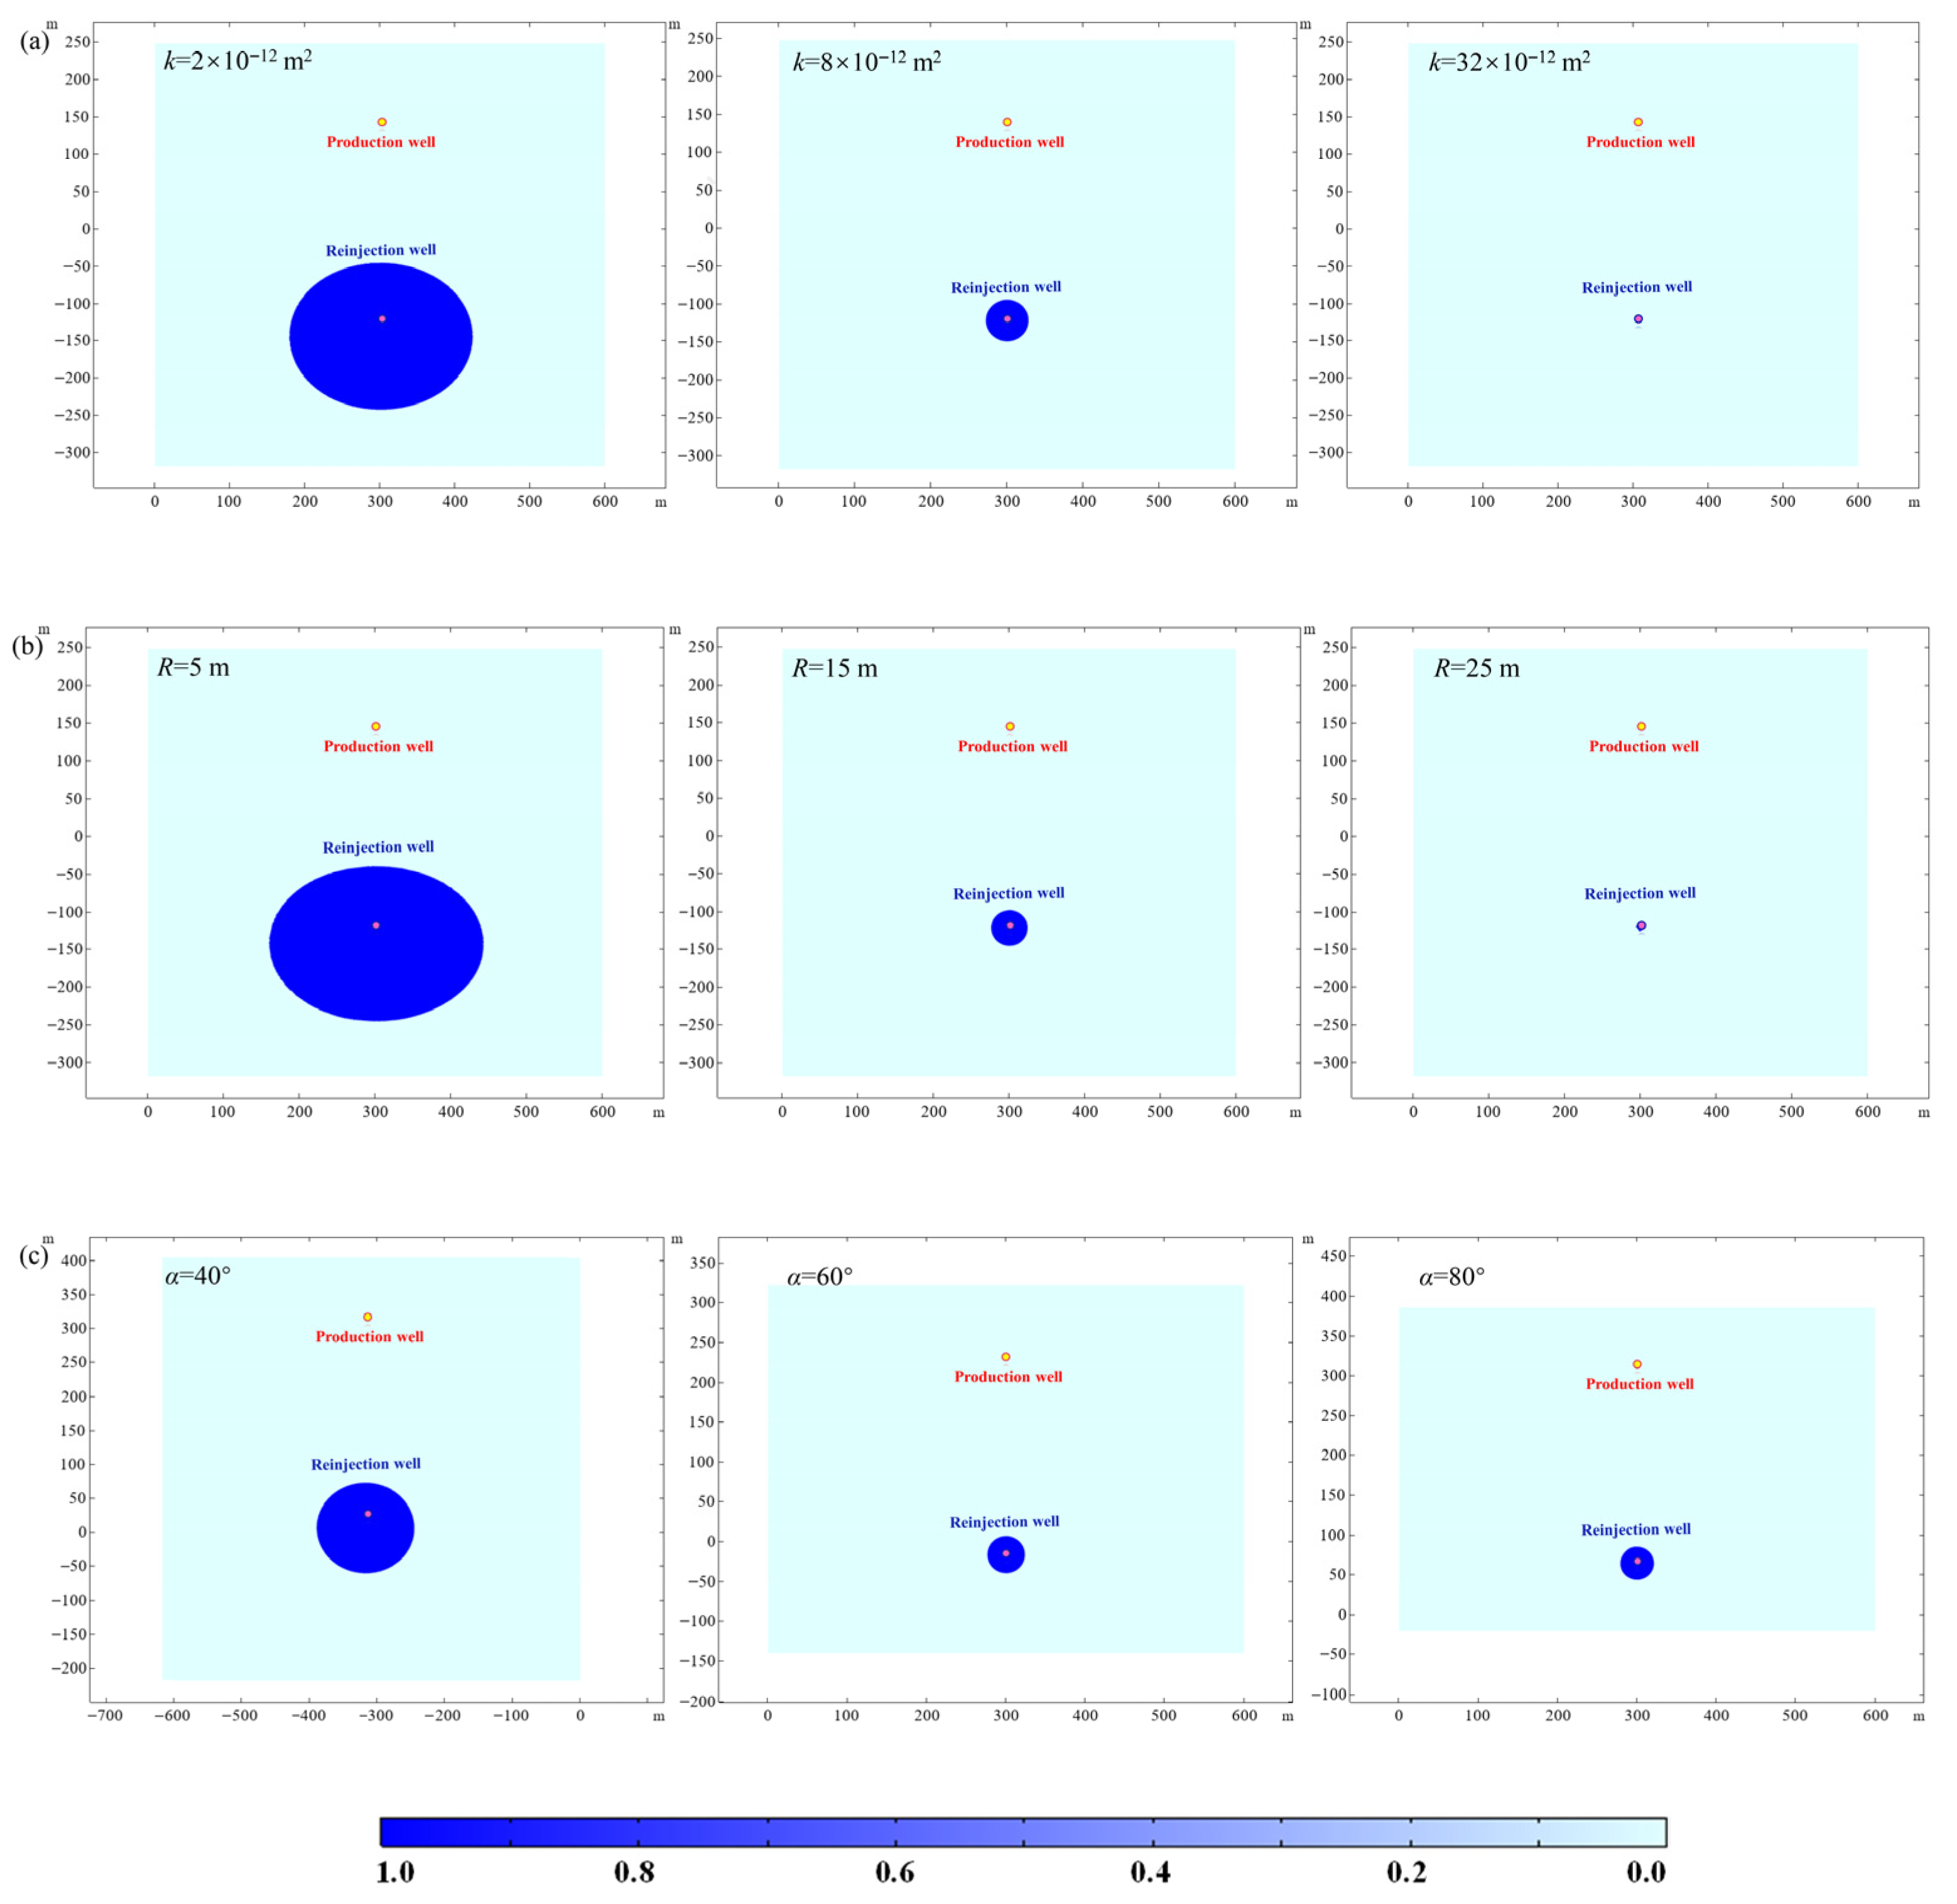
The morphology of the failure zone of the fault rock mass is the key to understanding the influence mechanism of different fault parameters on the fault stability. Figure 18 shows the morphology of the failure zone under different fault parameters.
Figure 18a,b show the same expansion evolution of the morphology of the failure zone under different fault permeability and thickness. As the initial permeability and thickness of the fault increases, the failure zone expands sharply, and the morphology of failure zone changes from a circular shape to an elliptical shape. This change in the morphology of the failure zone is caused by the mutual interaction between the pore pressure of the reinjection well and production well. The pore pressure at the reinjection well and production well is relatively small when the initial permeability and thickness of the fault are larger, and the mutual interaction between the pore pressure of the reinjection well and production well is not obvious. The morphology of the failure zone is circular under this condition. The pore pressure at the reinjection well and production well increases sharply when the initial permeability and thickness of the fault are smaller. This causes the extension of the failure zone to be limited significantly in the direction of the connecting line of the reinjection well and production well by the negative pore pressure zone around the production well. The failure zone tends to expand away from the area affected by the negative pore pressure zone. Hence, the morphology of the failure zone is elliptical under smaller fault parameters. The previous studies mostly focus on the instability of faults in one direction under the two-dimensional simulation model [46,47,48,49]. However, this study shows that the failure zone of faults varies in different directions under different factors. This indicates the importance of three-dimensional modeling analysis for FHS.
Figure 18c shows that the morphology of the failure zone is relatively similar under different fault dip-angles. Therefore, the influence of the fault dip-angle on the mutual interaction of pore pressure at the reinjection well and production well is relatively small.

4.4. Relationship Between Production Well Parameters and Failure Zone

The results presented in Figure 19 demonstrate a strong correlation between operational parameters and fault stability. Specifically, the volume of the fault failure zone exhibits a positive correlation with well distance, reinjection/production flow rate, and the number of production sub-wells. This phenomenon can be explained by the following mechanisms: (1) Well distance: A larger distance between injection and production wells extends the fluid flow path and increases the pore pressure distribution area within the reservoir [20]. This broader pressure perturbation is more likely to interact with, and destabilize, nearby faults, leading to a larger potential failure volume. (2) Flow rate: A higher flow rate significantly enhances the pressure propagation and increment near the fault zone due to increased fluid influx [35]. According to the effective stress principle, a more pronounced increase in pore pressure results in a greater reduction in effective stress acting on the fault, thereby weakening it and promoting shear failure over a larger volume. (3) Number of production sub-wells: Increasing the number of production wells creates a more complex and extensive pressure drawdown cone [41]. This creates stronger pressure gradients and stress concentrations around the fault, which act as a flow barrier or conduit, further mobilizing larger segments of the fault.
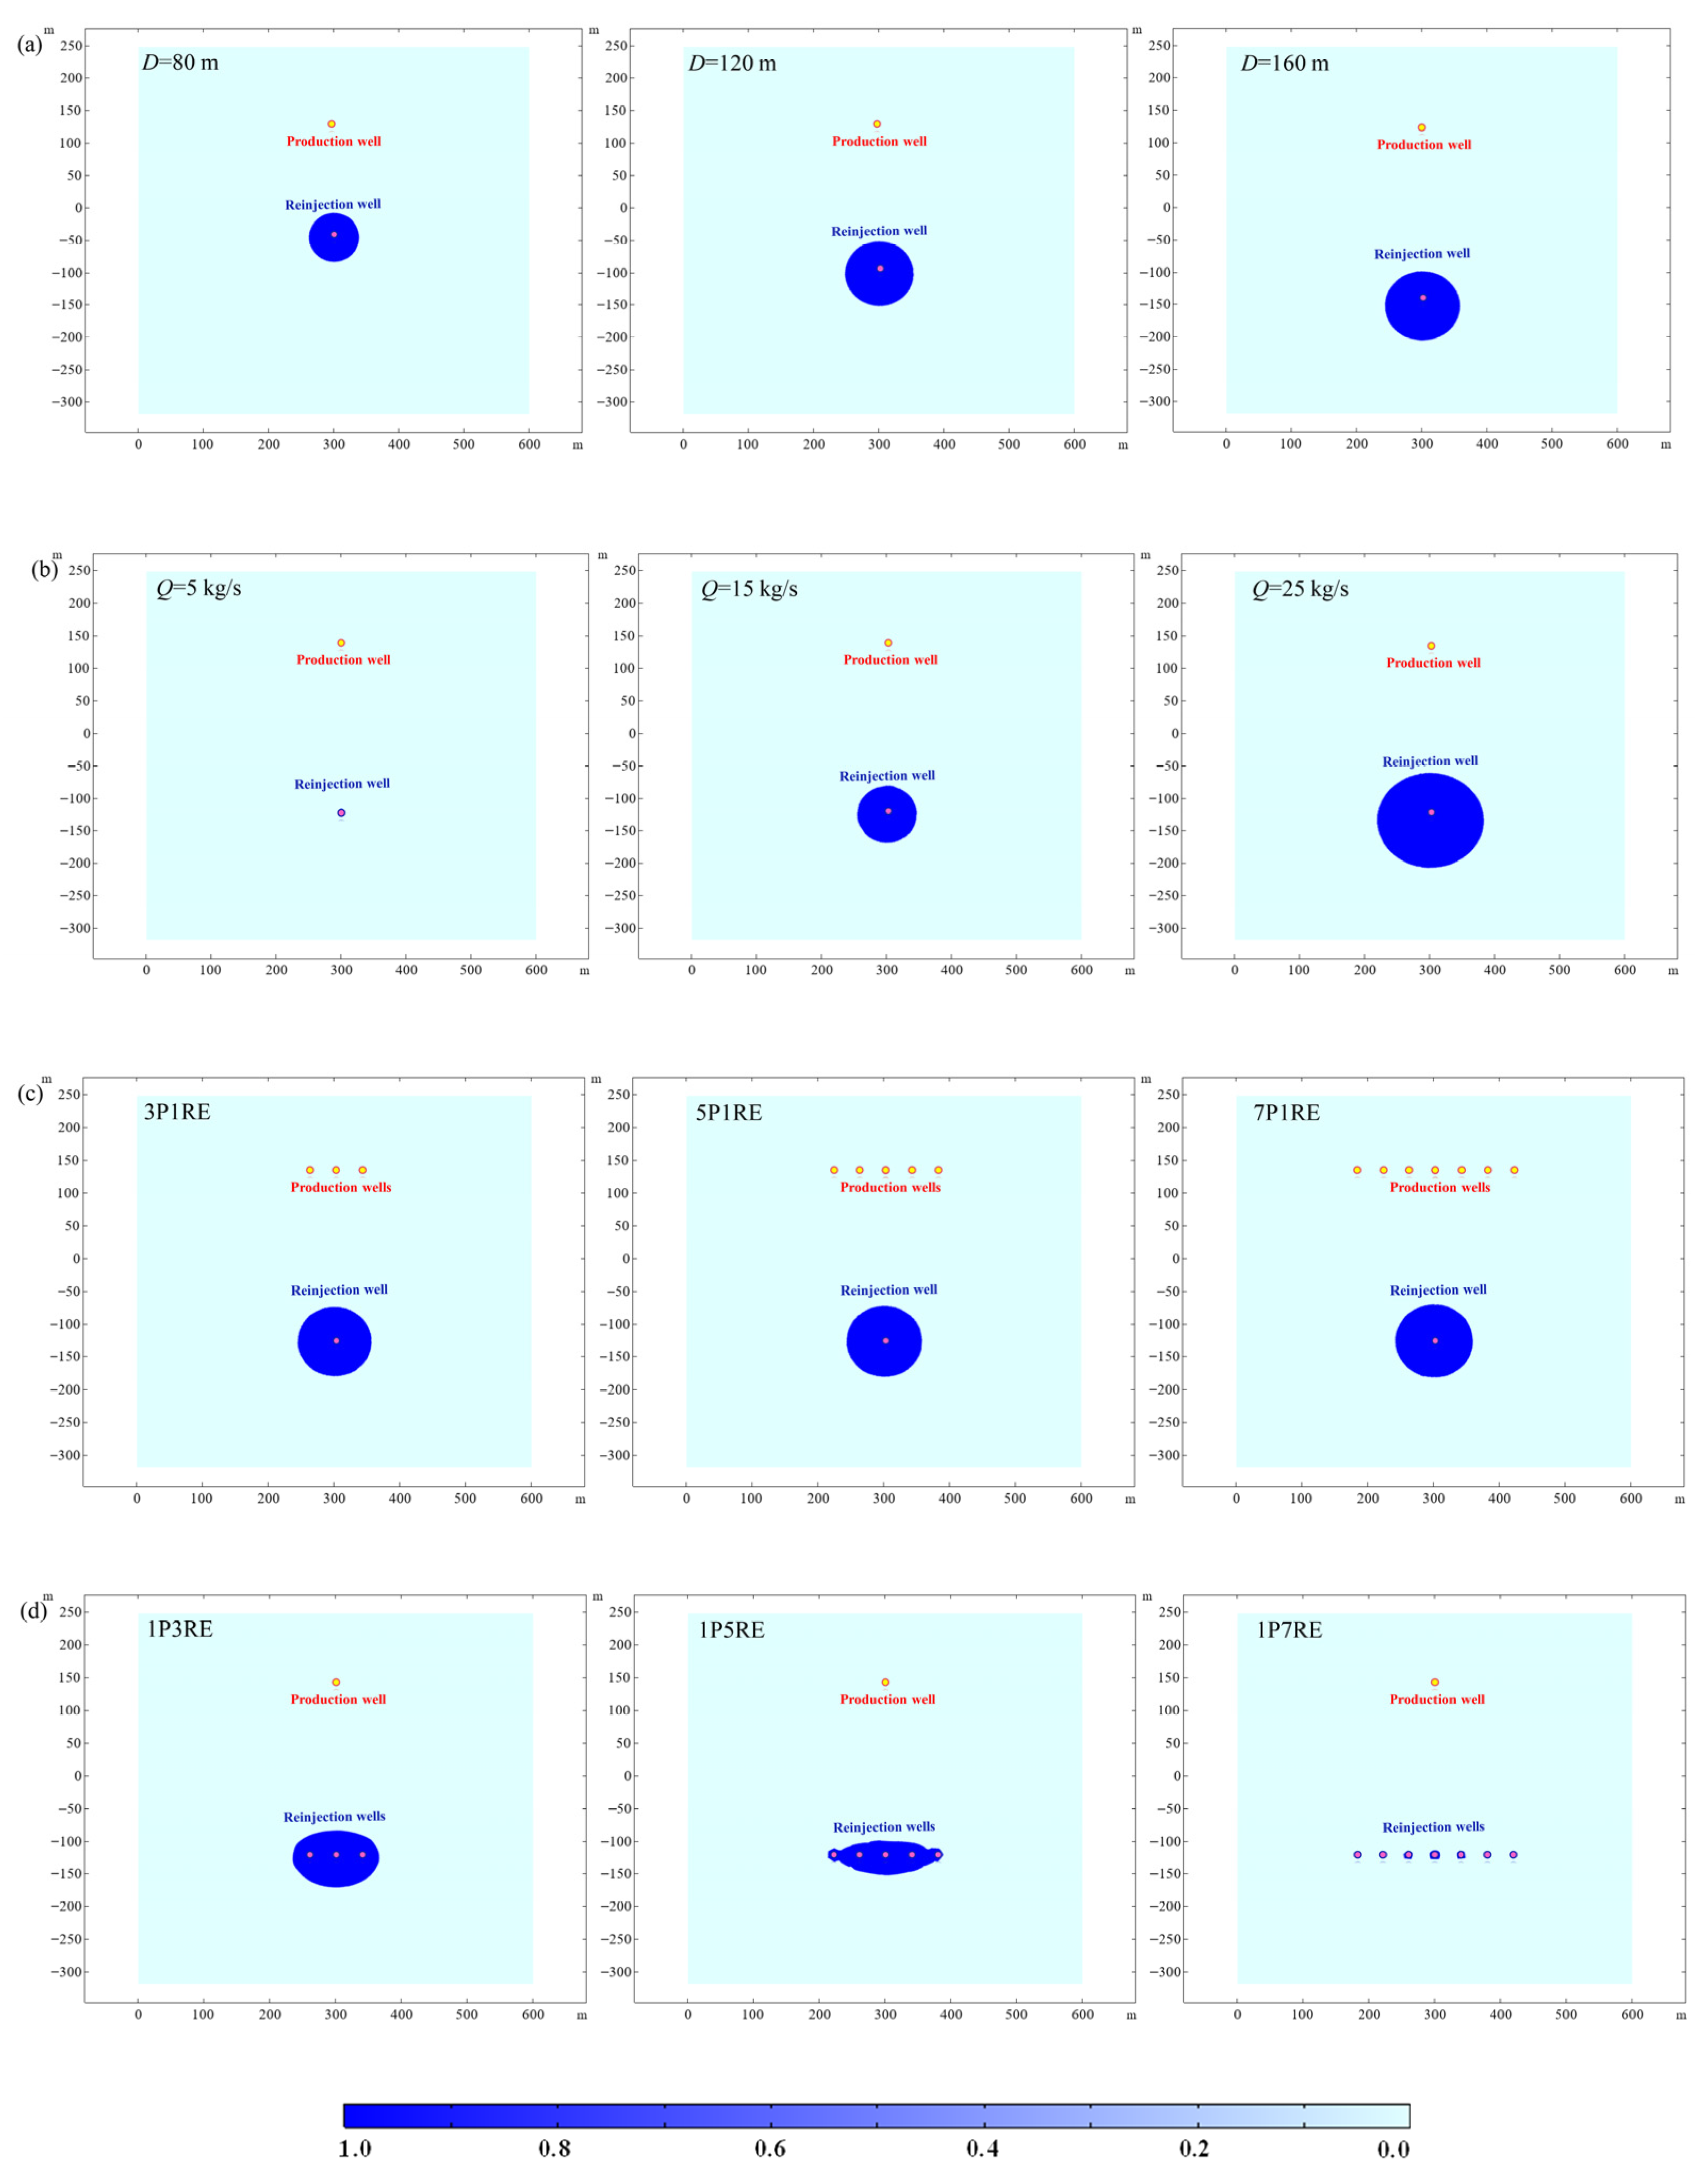
As the well distance increases, the morphology of the failure zone of the fault changes from a circular zone to an elliptical zone, as shown in Figure 20a. The failure zone is limited in all directions by the negative pore pressure zone around the production well under lower well distance. As the well distance increases, the limiting effect of pore pressure of the production well on the failure zone is obviously weakened at the vertical direction of the connecting line of the injection well and production well. This causes the failure zone of the fault to expand more widely at the vertical direction of the connecting line of the injection well and production well.
Figure 20b shows that the increase in the reinjection/production flow rate leads to the shape of the failure zone of the fault changes from a circular zone to an elliptical zone. Similarly, this can be attributed to the limiting effect of the pore pressure of the production well.
Figure 20c shows that the morphology of the failure zone under the different number of production sub-wells is negligible. Figure 20d shows that the morphology of the failure zone under the different number of reinjection sub-wells is significantly different. As the number of reinjection sub-wells increases, the failure zone of the rock mass decreases in the direction of the connecting line of the reinjection well and production well. The morphology of the failure zone changes from an elliptical to a bar-type shape, and, finally, the failure zone only appears at the reinjection sub-wells. The decrease in the failure area is the decrease in the pore pressure concentration of the rock mass at the reinjection well. As the number of reinjection sub-wells increases, the peak pore pressure of each sub-well sharply decreases. Therefore, the positive pore pressure zone of the fault rock mass gradually shrinks, leading to the decrease in the failure zone. Previous studies also confirmed that reinjection/production sub-wells can reduce the pore pressure of a reservoir [50]. This study suggests that the pattern of reinjection sub-wells is more suitable for FHS.

4.5. Comparison of Key Findings with Previous Studies

Table 5 places this study’s findings in context by comparing the key factors controlling geothermal production efficiency in faulted systems with results from other numerical studies. While direct quantitative comparisons are difficult due to variations in reservoir properties, stress conditions, and operational parameters, several key conclusions can still be drawn. This study systematically examines both heat extraction efficiency and system stability. Increasing operational parameters, like flow rate and well spacing, boosts efficiency but also significantly raises instability risks. In contrast, greater fault thickness improves both efficiency and stability. These findings highlight that the intrinsic properties of faulted systems are critical for long-term, stable performance—factors overlooked in previous studies.

4.6. Future Work and Perspective

It is important to note that this study has several limitations that also point toward valuable future research directions. First, the anisotropy of fault zone parameters was not considered in the current model. Second, the simulations did not fully incorporate non-isothermal processes, such as temperature-dependent fluid properties and rock mechanical behavior. Furthermore, while this work investigated the effect of the number of injection and production sub-wells on fault stability, it did not examine the influence of different spatial arrangements of well patterns.
Future efforts should, therefore, focus on developing more comprehensive models that integrate heterogeneous distributions of permeability, mechanical, and thermal parameters. In addition, the impact of various multi-well layout configurations, such as clustered, linear, or staggered patterns on both long-term thermal productivity and fault reactivation risk, warrants in-depth analysis. Such studies would provide more realistic and practical insights for the optimization of engineered geothermal systems under complex geological conditions.

5. Conclusions

This paper establishes a THM-coupled model to study the stability and performance of fault-controlled hydrothermal systems. Effects of well parameters and fault parameters on the fault stability under equilibrium reinjection/production was studied. The main conclusions are as follows:
(1) As the reinjection and production process progresses, positive pore pressure zones around the injection well and negative pore pressure zones around the production well expand rapidly in the first 4 years and tend to stabilize from the 5th to the 20th year. Under the combined effect of the above positive and negative pore pressure zones, the failure zone of the fault develops into an elliptical shape.
(2) As the reinjection/production flow rates and well distances increase, the fault damage zone and thermal recovery performance within 20 years increase proportionally. As the number of reinjection sub-wells increases, the peak positive pore pressure of the fault decreases, leading to a significant decrease in the fault failure zone volume. As the number of production sub-wells increases, the peak negative pore pressure of the fault decreases, leading to the increase in the fault failure zone volume, which deteriorates the stability of the FHS.
(3) The fault failure zone volume and thermal recovery performance observed within 20 years varies inversely with increasing fault thickness, dip angle, and permeability. The fault damage zone volume exhibits a sharp decrease as permeability rises from 2 × 10⁻¹² m2 to 8 × 10⁻¹² m2, and beyond this range, and the damage zone volume shows negligible sensitivity to further permeability increases.

Author Contributions

Conceptualization, methodology, and writing—original draft preparation, B.C.; writing—review and editing, X.G.; funding acquisition, project administration, funding acquisition, and resources, Q.L.; software, validation, formal analysis, and investigation, Y.L.; data curation, visualization, and supervision, J.Y. All authors have read and agreed to the published version of the manuscript.

Funding

This research was supported by the Deep Earth Probe and Mineral Resources Exploration-National Science and Technology Major Project (2024ZD1004003), and the National Natural Science Foundation of China (52304104).

Institutional Review Board Statement

Not applicable.

Informed Consent Statement

Not applicable.

Data Availability Statement

The data and materials used to support the findings of this study are included within the article.

Acknowledgments

Authors would like to thank the editors and reviewers for their profound comments and suggestions.

Conflicts of Interest

The authors declare no conflicts of interest.

Abbreviations

The following abbreviations are used in this manuscript:
FHSFault-controlled hydrothermal system
THMThermo-Hydro-Mechanical
TRPThermal recovery performance
EGSEnhanced geothermal systems
CFSCoulomb failure stress

References

  1. Barbier, E. Geothermal energy technology and current status: An overview. Renew. Sustain. Energy Rev. 2002, 6, 3–65. [Google Scholar] [CrossRef]
  2. Liu, T.; Xu, G.; Cai, P.; Tian, L.H.; Huang, Q.L. Development forecast of renewable energy power generation in China and its influence on the GHG control strategy of the country. Renew. Energy 2011, 36, 1284–1292. [Google Scholar] [CrossRef]
  3. Bertani, R. Geothermal power generation in the world 2010–2014 update report. Geothermics 2016, 60, 31–43. [Google Scholar] [CrossRef]
  4. Soltani, M.; Kashkooli, F.M.; Souri, M.; Rafiei, B.; Jabarifar, M.; Gharali, K.; Nathwani, J.S. Environmental, economic, and social impacts of geothermal energy systems. Renew. Sustain. Energy Rev. 2021, 140, 110750. [Google Scholar] [CrossRef]
  5. Yang, W.F.; Xiao, C.L.; Jia, Z.L.; Liang, X.J.; Feng, B. Evaluation of the viability of exploitation of hydrothermal resources in the Southern Songliao Basin (China) by integrating resource, demand, and economy. Geothermics 2024, 120, 103022. [Google Scholar] [CrossRef]
  6. Luo, J.; Xue, W.; Lu, X.S. Characterization of the hydrothermal potential for the cap strata of Yangzte Block (YB), China. Geothermics 2021, 96, 102148. [Google Scholar] [CrossRef]
  7. An, Q.S.; Wang, Y.Z.; Zhao, J.; Luo, C.; Wang, Y. Direct utilization status and power generation potential of low-medium temperature hydrothermal geothermal resources in Tianjin, China: A review. Geothermics 2016, 64, 426–438. [Google Scholar] [CrossRef]
  8. Li, Q.; Li, X.B.; Yin, T.B. Factors affecting pore structure of granite under cyclic heating and cooling: A nuclear magnetic resonance investigation. Geothermics 2021, 96, 102198. [Google Scholar] [CrossRef]
  9. Hou, W.T.; Ma, D.; Liu, X.W.; Zhang, J.X. Experimental study on hydraulic and mechanical properties of fault rock under the thermal-hydraulic-mechanical coupling. Geothermics 2024, 119, 102975. [Google Scholar]
  10. Konrad, F.; Savvatis, A.; Degen, D.; Wellmann, F.; Einsiedl, F.; Zosseder, K. Productivity enhancement of geothermal wells through fault zones: Efficient numerical evaluation of a parameter space for the Upper Jurassic aquifer of the North Alpine Foreland Basin. Geothermics 2021, 95, 102119. [Google Scholar] [CrossRef]
  11. Duwiquet, H.; Magri, F.; Lopez, S.; Guillon, T.; Arbaret, L.; Bellanger, M.; Guillou-Frottier, L. Tectonic Regime as a Control Factor for Crustal Fault Zone (CFZ) Geothermal Reservoir in an Amagmatic System: A 3D Dynamic Numerical Modeling Approach. Nat. Resour. Res. 2022, 31, 3155–3172. [Google Scholar] [CrossRef]
  12. Kivi, I.R.; Vilarrasa, V.; Kim, K.; Yoo, H.; Min, K. On the role of poroelastic stressing and pore pressure diffusion in discrete fracture and fault system in triggering post-injection seismicity in enhanced geothermal systems. Int. J. Rock Mech. Min. Sci. 2024, 175, 105673. [Google Scholar] [CrossRef]
  13. Jeanne, P.; Rutqvist, J.; Dobson, P.F.; Walters, M.; Hartline, C.; Garcia, J. The impacts of mechanical stress transfers caused by hydromechanical and thermal processes on fault stability during hydraulic stimulation in a deep geothermal reservoir. Int. J. Rock Mech. Min. Sci. 2014, 72, 149–163. [Google Scholar] [CrossRef]
  14. Gan, Q.; Lei, Q.H. Induced fault reactivation by thermal perturbation in enhanced geothermal systems. Geothermics 2020, 86, 101814. [Google Scholar] [CrossRef]
  15. Yu, P.L.; Dempsey, D.; Archer, R. A three-dimensional coupled thermo-hydro-mechanical numerical model with partially bridging multi-stage contact fractures in horizontal-well enhanced geothermal system. Int. J. Rock Mech. Min. Sci. 2021, 143, 104787. [Google Scholar] [CrossRef]
  16. Wu, Z.J.; Cui, W.J.; Weng, L.; Liu, Q.S. Modeling geothermal heat extraction-induced potential fault activation by developing an FDEM-based THM coupling scheme. Rock Mech. Rock Eng. 2023, 56, 3279–3299. [Google Scholar] [CrossRef]
  17. Ji, Y.L.; Yoon, J.S.; Zang, A.; Wu, W. Mitigation of injection-induced seismicity on undrained faults in granite using cyclic fluid injection: A laboratory study. Int. J. Rock Mech. Min. Sci. 2021, 146, 104881. [Google Scholar] [CrossRef]
  18. Sabah, M.; Ameri, M.J.; Hofmann, H.; Ebrahimi, M. Numerical modeling of injection-induced earthquakes based on fully coupled thermo-poroelastic boundary element method. Geothermics 2022, 105, 102481. [Google Scholar]
  19. Ishii, E. A conventional straddle-sliding-packer system as a borehole extensometer: Monitoring shear displacement of a fault during an injection test. Eng. Geol. 2020, 275, 105748. [Google Scholar] [CrossRef]
  20. Gan, Q.; Feng, Z.J.; Zhou, L.; Li, H.L.; Liu, J.; Elsworth, D. Down-dip circulation at the united downs deep geothermal power project maximizes heat recovery and minimizes seismicity. Geothermics 2021, 96, 102204. [Google Scholar] [CrossRef]
  21. Li, X.Y.; Lei, X.L.; Li, Q. Fault nucleation of tight sandstone by investigation of mechanical, acoustic, and hydraulic responses. Eng. Geol. 2021, 292, 106254. [Google Scholar] [CrossRef]
  22. Zhao, C.X.; Liu, J.F.; Dai, H.Y.; Huang, H.Y.; Shi, X.C. Frictional evolution process and stability properties of Longmaxi shale under fluid injection. Energy 2024, 294, 130910. [Google Scholar] [CrossRef]
  23. Jing, J.; Yang, Y.L.; Cheng, J.M.; Ding, Z.J.; Wang, D.D.; Jing, X.W. Analysis of the effect of formation dip angle and injection pressure on the injectivity and migration of CO2 during storage. Energy 2023, 280, 128021. [Google Scholar] [CrossRef]
  24. Soltanzadeh, H.; Hawkes, C.D. Assessing fault reactivation tendency within and surrounding porous reservoirs during fluid production or injection. Int. J. Rock Mech. Min. Sci. 2009, 46, 1–7. [Google Scholar] [CrossRef]
  25. Schwartzkopff, A.K.; Sainoki, A.; Elsworth, D. Numerical simulation of mixed aseismic/seismic fault-slip induced by fluid injection using coupled X-FEM analysis. Int. J. Rock Mech. Min. Sci. 2021, 147, 104871. [Google Scholar] [CrossRef]
  26. Daniilidis, A.; Saeid, S.; Doonechaly, N.G. The fault plane as the main fluid pathway: Geothermal field development options under subsurface and operational uncertainty. Renew. Energy 2021, 171, 927–946. [Google Scholar] [CrossRef]
  27. Daniilidis, A.; Nick, H.M.; Bruhn, D.F. Interference between geothermal doublets across a fault under subsurface uncertainty; implications for field development and regulation. Geothermics 2021, 91, 102041. [Google Scholar] [CrossRef]
  28. Duan, H.Y.; Ma, D.; Zou, L.C.; Xie, S.J.; Liu, Y. Co-exploitation of coal and geothermal energy through water-conducting structures: Improving extraction efficiency of geothermal well. Renew. Energy 2024, 228, 120666. [Google Scholar]
  29. Zimmerman, R.W.; Al-Yaarubi, A.; Pain, C.C.; Grattoni, C.A. Non-linear regimes of fluid flow in rock fractures. Int. J. Rock Mech. Min. Sci. 2004, 41, 384. [Google Scholar]
  30. Ma, D.; Miao, X.X.; Chen, Z.Q.; Mao, X.B. Experimental investigation of seepage properties of fractured rocks under different confining pressures. Rock Mech. Rock Eng. 2013, 46, 1135–1144. [Google Scholar] [CrossRef]
  31. Lee, D.J.; Chen, G.W.; Liao, Y.C.; Hsieh, C.C. On the free-settling test for estimating activated sludge floc density. Water Res. 1996, 30, 541–550. [Google Scholar] [CrossRef]
  32. Ma, D.; Duan, H.Y.; Zhang, J.X. Solid grain migration on hydraulic properties of fault rocks in underground mining tunnel: Radial seepage experiments and verification of permeability prediction. Tunn. Undergr. Space Technol. 2022, 126, 104525. [Google Scholar] [CrossRef]
  33. Taghipour, M.; Ghafoori, M.; Lashkaripour, G.R.; Moghaddas, N.H.; Molaghab, A. A geomechanical evaluation of fault reactivation using analytical methods and numerical simulation. Rock Mech. Rock Eng. 2021, 54, 695–719. [Google Scholar]
  34. Hyman, J.D.; Sweeney, M.R.; Frash, L.P.; Carey, J.W.; Viswanathan, H.S. Scale-bridging in three-dimensional fracture networks: Characterizing the effects of variable fracture apertures on network-scale flow channelization. Geophys. Res. Lett. 2021, 48, e2021GL094400. [Google Scholar]
  35. Kang, P.K.; Lei, Q.H.; Dentz, M.; Juanes, R. Stress-induced anomalous transport in natural fracture networks. Water Resour. Res. 2019, 55, 4163–4185. [Google Scholar] [CrossRef]
  36. Gu, S.H.; Liu, Y.T.; Chen, Z.X. Numerical study of dynamic fracture aperture during production of pressure-sensitive reservoirs. Int. J. Rock Mech. Min. Sci. 2014, 70, 229–239. [Google Scholar] [CrossRef]
  37. Xu, H.R.; Cheng, J.R.; Zhao, Z.H.; Lin, T.Y.; Liu, G.H.; Chen, S.C. Coupled thermo-hydro-mechanical-chemical modeling on acid fracturing in carbonatite geothermal reservoirs containing a heterogeneous fracture. Renew. Energy 2021, 172, 145–157. [Google Scholar] [CrossRef]
  38. Huang, N.; Liu, R.C.; Jiang, Y.J.; Cheng, Y.F.; Li, B. Shear-flow coupling characteristics of a three-dimensional discrete fracture network-fault model considering stress-induced aperture variations. J. Hydrol. 2019, 571, 416–424. [Google Scholar] [CrossRef]
  39. Igbokwe, O.A.; Timothy, J.J.; Kumar, A.; Yan, X.; Mueller, M.; Verdecchia, A.; Meschke, G.; Immenhauser, A. Impact of stress regime change on the permeability of a naturally fractured carbonate buildup (Latemar, the Dolomites, northern Italy). Solid Earth 2024, 15, 763–787. [Google Scholar] [CrossRef]
  40. Yan, J.H.; Ma, D.; Gao, X.F.; Duan, H.Y.; Li, Q.; Hou, W.T. Geothermal energy production potential of karst geothermal reservoir considering mining-induced stress. Int. J. Min. Sci. Technol. 2025, 35, 1153–1170. [Google Scholar] [CrossRef]
  41. Baghbanan, A.; Jing, L.R. Stress effects on permeability in a fractured rock mass with correlated fracture length and aperture. Int. J. Rock Mech. Min. Sci. 2008, 45, 1320–1334. [Google Scholar] [CrossRef]
  42. Sainoki, A.; Mitri, H.; Chinnasane, D. Characterization of aseismic fault-slip in a deep hard rock mine through numerical modelling: Case study. Rock Mech. Rock Eng. 2017, 50, 2709–2729. [Google Scholar] [CrossRef]
  43. Azarfar, B.; Ahmadvand, S.; Sattarvand, J.; Abbasi, B. Stability analysis of rock structure in large slopes and open pit mine: Numerical and experimental fault modeling. Rock Mech. Rock Eng. 2019, 52, 4889–4905. [Google Scholar] [CrossRef]
  44. Li, Q.; Li, X.B.; Yin, T.B. Effect of microwave heating on fracture behavior of granite: An experimental investigation. Eng. Fract. Mech. 2021, 250, 107758. [Google Scholar] [CrossRef]
  45. Zhang, X.; Huang, Z.W.; Li, G.S.; Wu, X.G.; Wang, T.Y.; Zhou, X.X. Enhancing reservoir stimulation and heat extraction performance for fractured geothermal reservoirs: Utilization of novel multilateral wells. Energy 2024, 291, 130410. [Google Scholar] [CrossRef]
  46. Liang, X.; Xu, T.F.; Feng, B.; Jiang, Z.X. Optimization of heat extraction strategies in fault-controlled hydro-geothermal reservoirs. Energy 2018, 164, 853–870. [Google Scholar] [CrossRef]
  47. Cappa, F.; Guglielmi, Y.; Nussbaum, C.; Birkholzer, J. On the relationship between fault permeability increases, induced stress perturbation, and the growth of aseismic slip during fluid injection. Geophys. Res. Lett. 2018, 45, 11012–11020. [Google Scholar] [CrossRef]
  48. Hosseini, N.; Priest, J.A.; Eaton, D.W. Extended-fem analysis of injection-induced slip on a fault with rate-and-state friction: Insights into parameters that control induced seismicity. Rock Mech. Rock Eng. 2023, 56, 4229–4250. [Google Scholar] [CrossRef]
  49. Parisio, F.; Vilarrasa, V.; Wang, W.; Kolditz, O.; Nagel, T. The risks of long-term re-injection in supercritical geothermal systems. Nat. Commun. 2019, 10, 4391. [Google Scholar] [CrossRef] [PubMed]
  50. Kamila, Z.; Kaya, E.; Zarrouk, S.J. Reinjection in geothermal fields: An updated worldwide review 2020. Geothermics 2021, 89, 101970. [Google Scholar] [CrossRef]
  51. Hou, W.T.; Yan, J.H.; Ma, D.; Su, H.M.; Li, Q. Effects of extraction well assisted by the fault on thermal recovery performance in hydrothermal system. Case Stud. Therm. Eng. 2025, 69, 105962. [Google Scholar] [CrossRef]
  52. Yan, J.H.; Ma, D.; Gao, X.F.; Li, Q.; Hou, W.T. Fault zone mechanical response under co-exploitation of mine and geothermal energy: The combined effect of pore pressure and mining-induced stress. Int. J. Coal Sci. Technol. 2025, 12, 33. [Google Scholar]
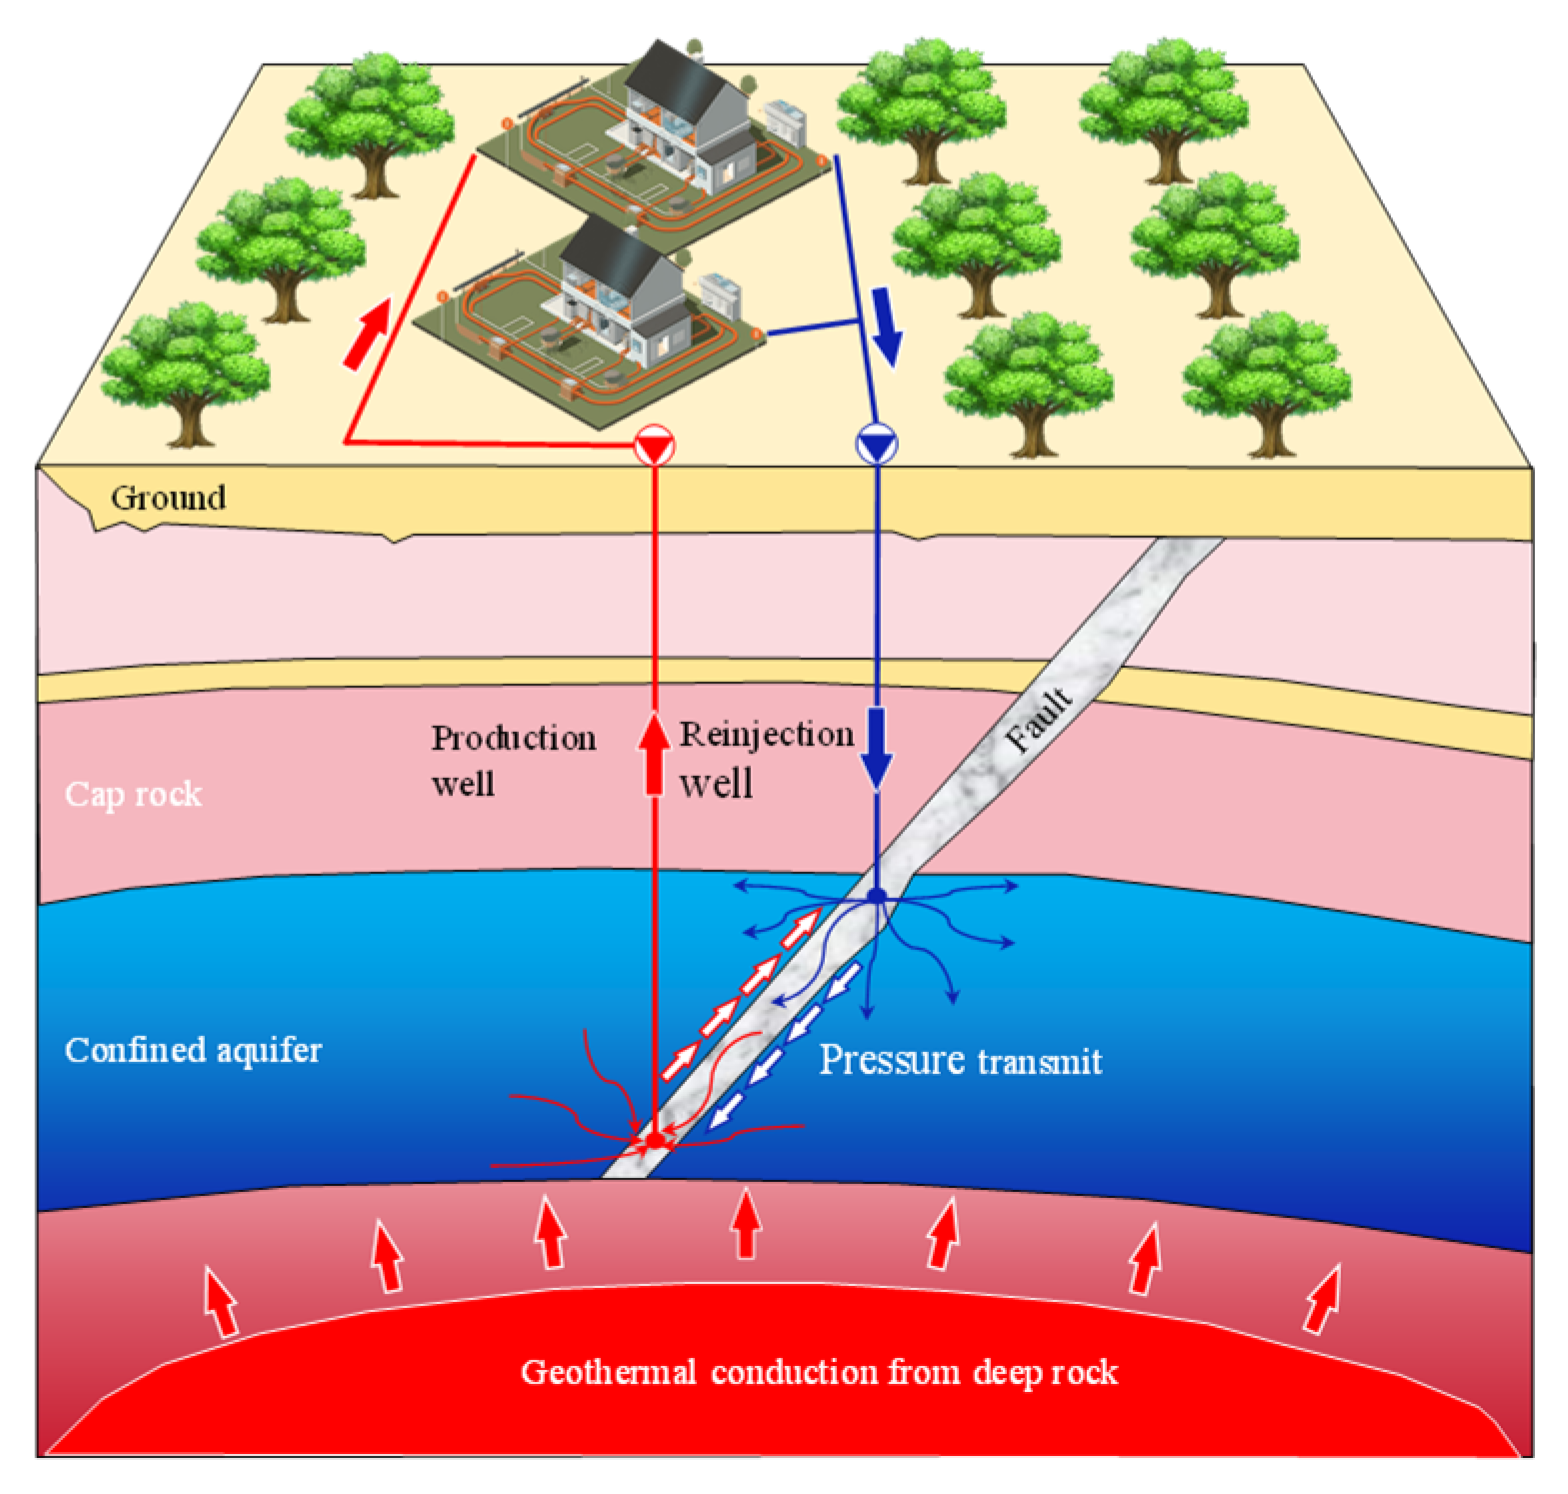
Figure 1. Schematic diagram of fault-controlled hydrothermal system.
Applsci 15 10064 g001
Figure 2. Numerical model of fault-controlled hydrothermal system.
Applsci 15 10064 g002
Figure 3. Boundary conditions of verification model.
Applsci 15 10064 g003
Figure 4. Model verification: (a) temperature evolution; (b) pore pressure evolution; (c) radial stress evolution; and (d) tangential stress evolution.
Applsci 15 10064 g004
Figure 5. The evolution of the seepage-stress-temperature characteristics of faulted rock mass during 20 a: (a) pore pressure; (b) σn; (c) στ; (d) CFS; and (e) temperature.
Applsci 15 10064 g005aApplsci 15 10064 g005b
Figure 6. Evolution of stress state at monitoring points during 20 a.
Applsci 15 10064 g006
Figure 7. Evolution of fault failure volume and production temperature during 20 a.
Applsci 15 10064 g007
Figure 8. Simulation results under different well distances at 20th year: (a) pore pressure; (b) σn; (c) στ; (d) CFS; (e) failure volume; and (f) temperature.
Applsci 15 10064 g008
Figure 9. Simulation results under different production/reinjection flow rates at 20th year: (a) pore pressure; (b) σn; (c) στ; (d) CFS; (e) failure volume; and (f) temperature.
Applsci 15 10064 g009
Figure 10. Well arrangement pattern in this section: (a) 1P7RE; and (b) 7P1RE.
Applsci 15 10064 g010
Figure 11. Simulation results under different number of production/reinjection wells after 20 a: (a) pore pressure; (b) σn; (c) στ; (d) CFS; (e) failure volume; and (f) temperature.
Applsci 15 10064 g011
Figure 12. Simulation results under different fault permeability wells at 20th year: (a) pore pressure; (b) σn; (c) στ; (d) CFS; (e) failure volume; and (f) temperature.
Applsci 15 10064 g012
Figure 13. Simulation results under different fault thickness wells at 20th year: (a) pore pressure; (b) σn; (c) στ; (d) CFS; (e) failure volume; and (f) temperature.
Applsci 15 10064 g013
Figure 14. Simulation results under different fault dip-angles at 20th year: (a) pore pressure; (b) σn; (c) στ; (d) CFS; (e) failure volume; and (f) temperature.
Applsci 15 10064 g014
Figure 15. Stress paths at the production well location, near the production well location, at the reinjection well location, and near the injection well location: (a) well distance; (b) reinjection/production flow rate; (c) sub-well number; (d) initial permeability of fault; (e) fault thickness; and (f) fault dip-angle.
Applsci 15 10064 g015
Figure 16. The relationship of failure volume and the accumulative thermal power at 20th year: (a) well distance; (b) reinjection/production flow rate; (c) sub-well number; (d) initial permeability of fault; (e) fault thickness; and (f) fault dip-angle.
Applsci 15 10064 g016
Figure 17. Relationship between failure volume and the fault parameters: (a) initial permeability of fault; (b) fault thickness; and (c) fault dip-angle.
Applsci 15 10064 g017
Figure 18. The morphology of failure zone under different the fault parameters: (a) initial permeability of fault; (b) fault thickness; and (c) fault dip-angle.
Applsci 15 10064 g018
Figure 19. Relationship between failure volume and the reinjection/production parameters: (a) well distance; (b) reinjection/production flow rate; and (c) well number.
Applsci 15 10064 g019
Figure 20. The morphology of failure zone under different reinjection/production parameters: (a) well distance; (b) reinjection/production flow rate; (c) the number of production sub-wells; and (d) the number of reinjection sub-wells.
Applsci 15 10064 g020
Table 1. Parameters of the numerical model.
ParametersFaultAquiclude 2Aquiclude 1Confined Aquifer
Young modulus K∙GPa−12606060
Poisson’s ratio ν0.20.30.30.3
Initial Porosity φ00.20.050.050.12
Initial Permeability k0∙m−25.0 × 10−121.0 × 10−161.0 × 10−161.0 × 10⁻¹⁴
Thermal Conductivity λ∙(W∙(m∙K)−1)−11.32.32.32.3
Specific thermal capacity C∙(J/kg∙K)−1650850850850
Density ρ∙(kg∙m−3)−12200260026002600
Table 2. Parameters of verification model.
ParametersValueParametersValue
Density2700 kg∙m−3Initial permeability4.053 × 10−7 m2
Thermal conductivity790 J∙(kg∙K)−1Initial porosity rate0.01
Specific heat capacity2.4 W∙(m∙K)−1M11.0 × 10−7
Young modulus37.5 GPaαT3 × 10−6 K−1
Poisson’s ratio0.25
Table 3. Different well parameters of the numerical model.
ParametersValue
Well distance D/m40, 80, 100, 120, 160, 200
Production/reinjection flow rate Q/kg∙s−15, 10, 15, 20, 25, 30
Number of production/reinjection wells1P3RE, 1P5RE, 1P7RE, 3P1RE, 5P1RE, 7P1RE
Table 4. List of the parameters used in the numerical model of this section.
ParametersValue
Initiation permeability of fault k/1 × 10−12 m22, 4, 8, 16, 32, 64
Fault spacing R/m5, 10, 15, 20, 25, 30
Fault dip-angle/°30, 40, 50, 60, 70, 80
Table 5. Comparison of Key Findings with Previous Studies.
Comparative ItemThis StudyHou et al. (2025) [51]Yan et al. (2025) [52]Daniilidis et al. (2021) [26]Gan et al. (2020) [14]Remarks
Model TypeTHMHMHMTHMTHMThis study incorporates nonlinear flow.
Controlling factors of heat extraction efficiencyFlow rate, well spacing, fault thickness, etc.Flow rate, well spacing, et al.Well spacingFlow rate, well spacing and permeabilityThis study reveals that the thickness and dip angle of the fault are also important factors.
Main factors of fault stability disturbanceFlow velocity, well spacing, fault thickness, etc.Well spacingWell spacingRecharge temperature and flow rate.This study reveals that the thickness and dip angle of the fault itself are also important factors for fault stability.
The relationship between fault stability and heat recovery efficiencyIncreasing well spacing and flow rate improves heat extraction efficiency but raises instability risks. Higher fault permeability and thickness enhance efficiency and safety.This study reveals the relationship between fault stability and heat recovery efficiency.
Key FindingThe results show that artificial methods to enhance heat extraction efficiency may compromise fault stability, whereas natural faults offer better efficiency and safety.Recharge temperature is the main factors.Well spacing is the main factor affecting fault instabilityWell spacing is the main factor affecting fault instabilityRecharge flow rate is the main factor affecting the stability of faults.This study comprehensively addresses fault stability and heat extraction efficiency, offering guidance for fault geothermal system parameters.
Disclaimer/Publisher’s Note: The statements, opinions and data contained in all publications are solely those of the individual author(s) and contributor(s) and not of MDPI and/or the editor(s). MDPI and/or the editor(s) disclaim responsibility for any injury to people or property resulting from any ideas, methods, instructions or products referred to in the content.