1. Introduction
Gas–liquid two-phase flow refers to the flow state in which two system phases of gas and liquid coexist. If the gas phase is a discrete medium in the gas–liquid two-phase flow, it is called the dispersed phase or granular phase, and this flow state is relatively common. Gas–liquid two-phase flow is widely used in chemical engineering, energy engineering and environment engineering, such as fluidized beds, underwater explosion, liquid metal processing and so on. Bubble movement has an important impact on heat and mass transfer. In the process of sewage treatment, such as aeration and air flotation, the presence of bubbles can accelerate the mixing of reactive substances and the conversion between energies, thereby accelerating the chemical reaction rate, reducing energy consumption and improving treatment efficiency. The bubbles can change the flow field state of the fluid. The difference in the shape and rising speed of the bubbles generated in the bubbling tower will change the surface energy and kinetic energy of the gas phase and the flow pattern of the liquid phase, thus affecting the efficiency of the bubbling tower [
1,
2]. In the gas–liquid reactor, the presence of bubbles will create holes in different positions and thus form different pressure differences, reducing the reaction efficiency [
3]. The research on the characteristics and mechanism of gas–liquid two-phase flow is of great value in engineering theory and application. In actual production, the movement, deformation and velocity of the bubble will become more complicated under the dual action of a solid wall and shear flow field. The interaction between the bubble, wall and liquid shear flow is directly related to the change in kinetic energy and surface energy of gas–liquid two-phase flow.
The surface energy of the bubble is related to the deformation of the bubble. Zaruba et al. [
4] predicted the change in bubble bounce motion with fluid velocity, and found that when the flow velocity of the fluid was low, the bubble obtained additional energy through shape oscillation to compensate for the damping effect caused by the collision with the wall, so that the bubble bounce amplitude remained almost unchanged. Jeong et al. [
5] experimentally studied the influence of different initial distances and different material walls in still water on the upward motion of large deformation bubbles (deq ≈ 3.92 mm), and found that the wall effect could lead to four kinds of movement behaviors, such as sliding along the wall, periodic bouncing, outward migration and the non-collision non-periodic oscillation of bubbles. The surface deformation of the bubble is closely related to the energy transfer. When the bubble collides with the wall, the surface energy compensates for the lack of kinetic energy, so that the deformable bubble can maintain a relatively constant motion. Zhang Yang et al. [
6] simulated the collision–rebound motion of the bubble on the horizontal wall and found that the increase in Galileo number (Ga) can aggravate the deformation of the bubble and promote the rebound motion of the bubble. Chen et al. [
7] studied the shape oscillation and energy conversion of deformable bubbles near the wall surface, and calculated the frequency of bubble shape oscillation in two modes based on the long axis and short axis of the bubble in space.
The instantaneous velocity of the bubble moving upward is the main influence on the kinetic energy of the bubble. According to the potential flow theory, Moctezuma et al. [
8] found that the interaction between the bubble and the wall would produce corresponding velocity fluctuations based on the wall action and upward motion of the spherical bubble in the ideal fluid, and proposed the measurement result with velocity variance as the parameter. For normal bounce on a horizontal top wall, Krasowska et al. [
9,
10] tested the change in bubble–wall collision dynamics with wall boundary conditions. In these studies, the rising bubbles are initially spherical and only deform when they collide with a horizontal wall. Krasowska found that air pockets trapped in smooth walls caused approaching bubbles to attach to the wall after bouncing back less often than non-slip walls. The transfer of kinetic energy to surface energy during the collision was estimated. In the case of hydrophobic surfaces, the energy transfer was small (that is, the energy loss was large), so that the approaching bubble adhered to the wall, but after multiple collisions with large energy transfer (that is, the energy loss was small), the bubble stayed under the hydrophilic wall. Zenit et al. [
11] studied the ratio of the normal velocity of the bubble wall before and after the collision to indirectly measure the energy dissipation caused by the bubble wall collision. They found that normal collision processes were well characterized by modified Stokes numbers (which also take into account additional mass effects) and capillary numbers, unlike collisions with solid particles. Fei Yang et al. [
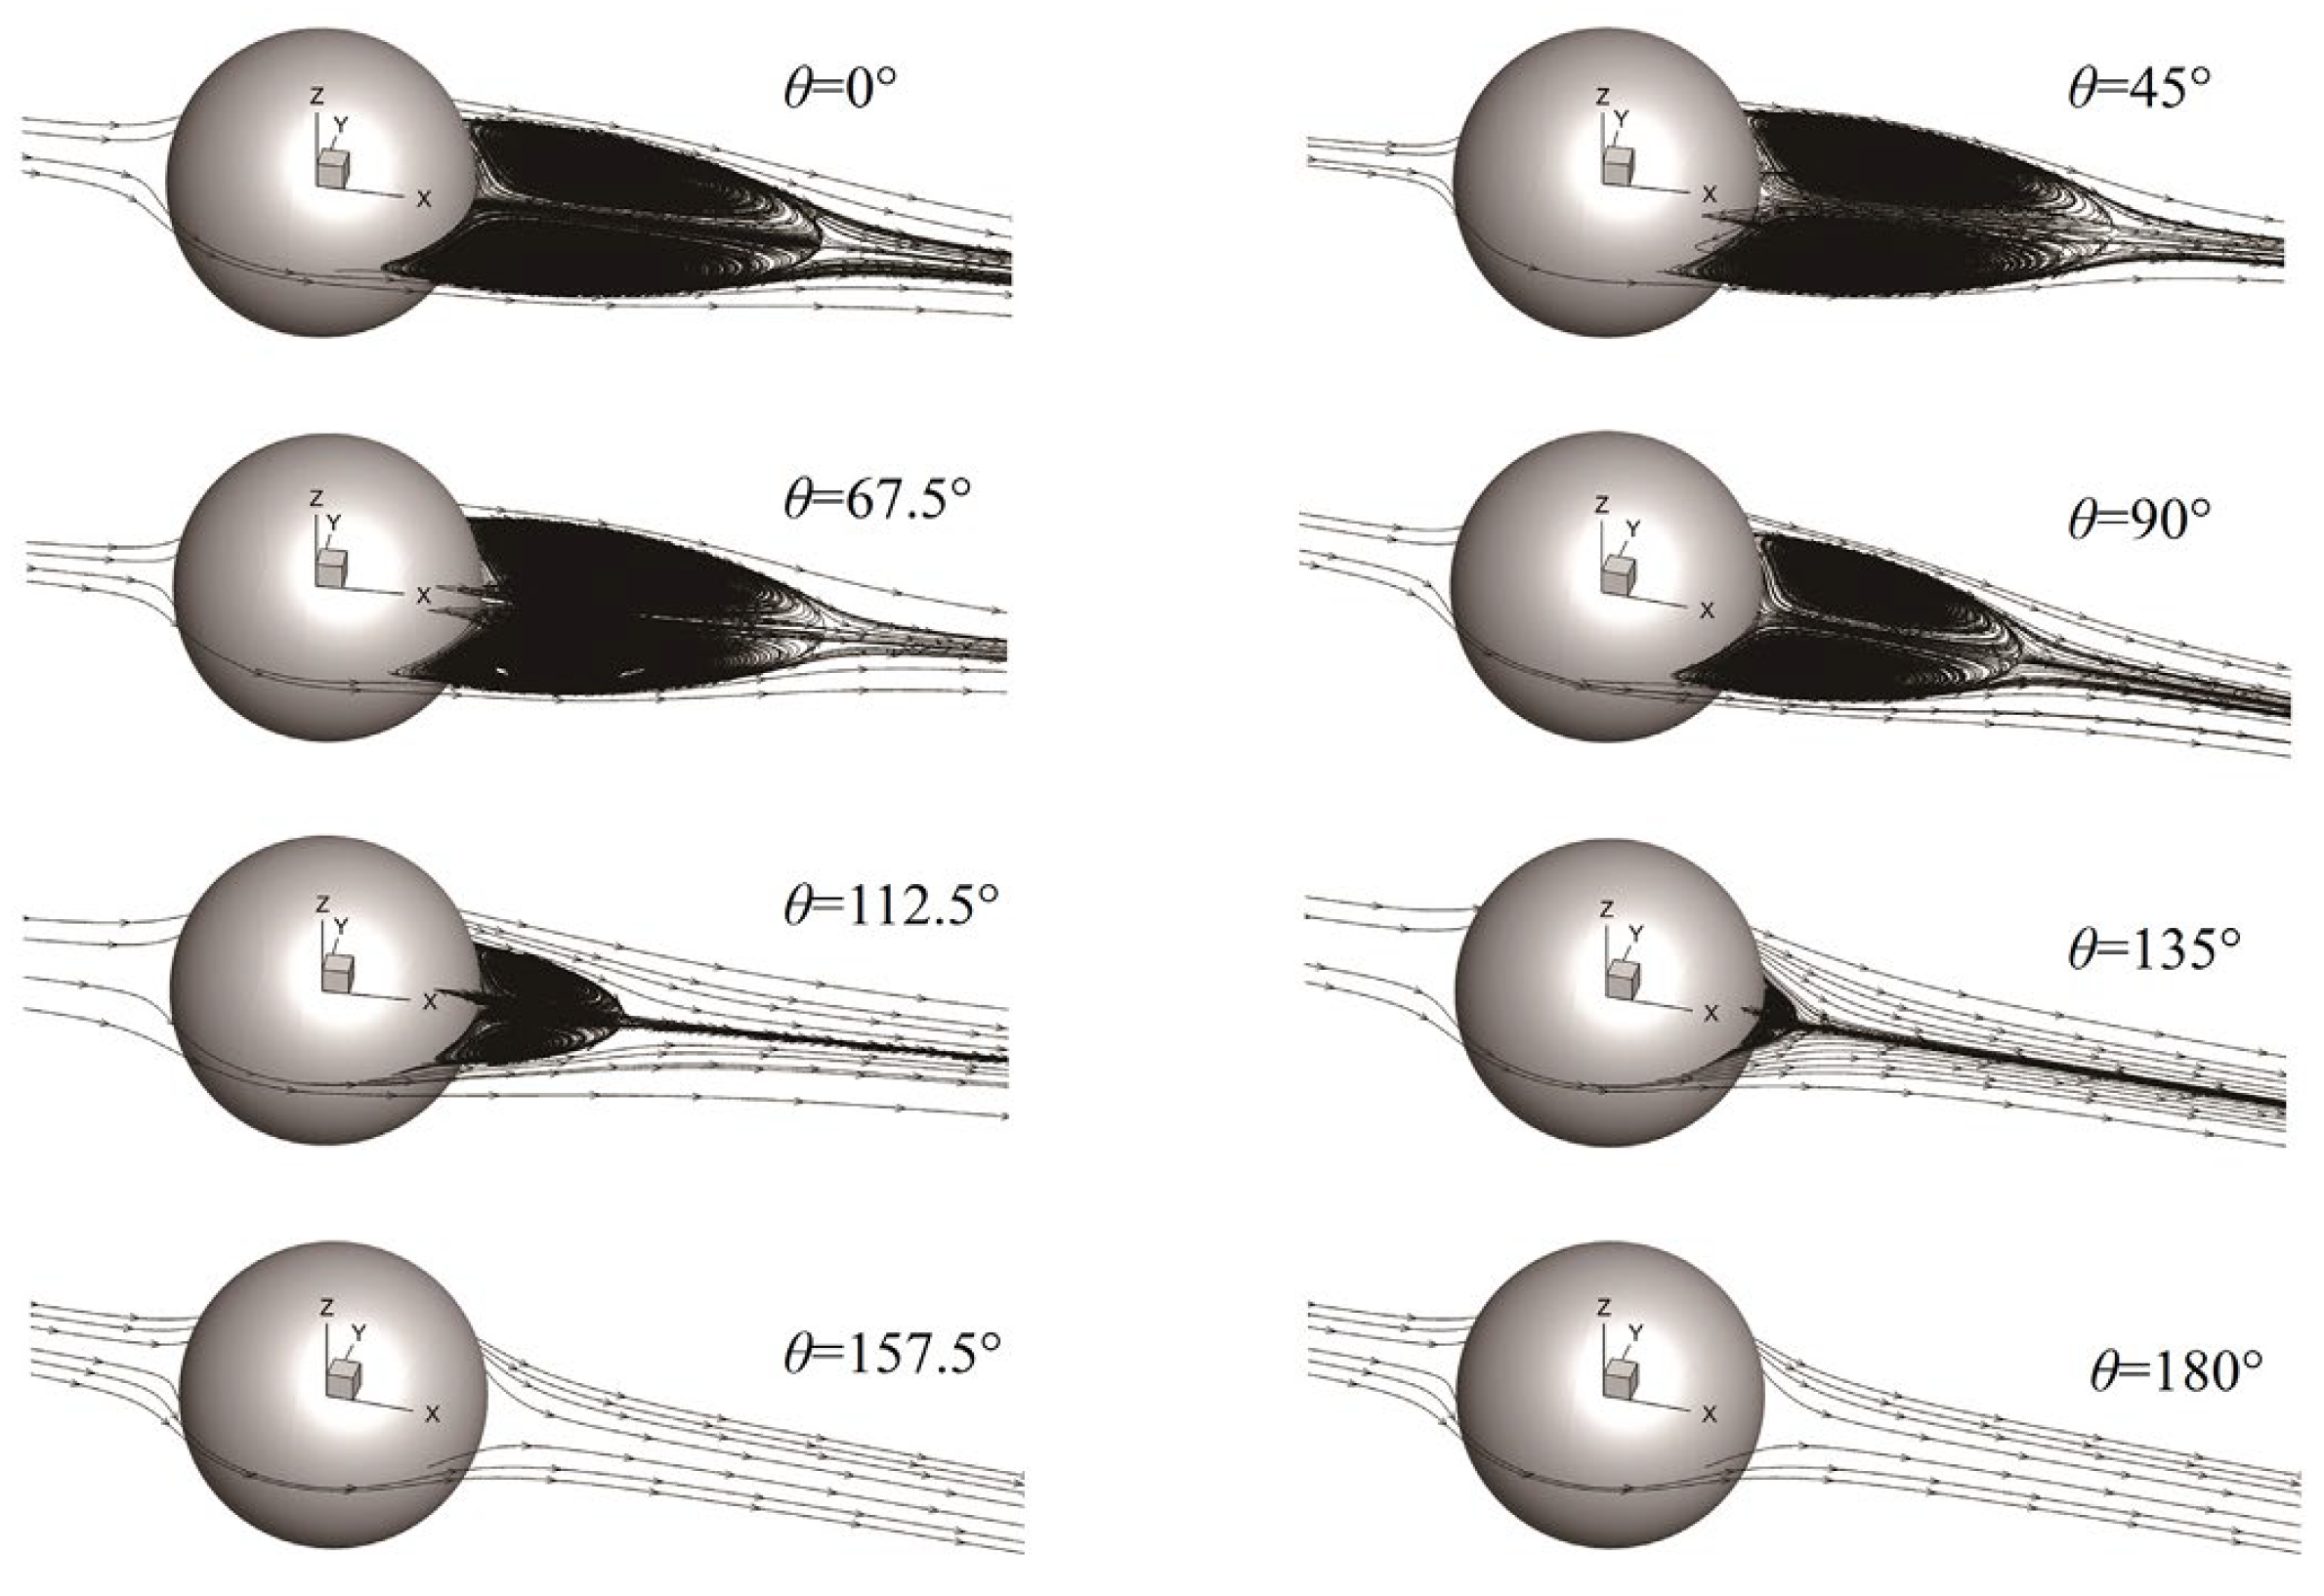
12] investigated the wake structure of bubbles with a medium Reynolds number through numerical modeling, as shown in
Figure 1. They found that the increase in the trailing vortex area of the pollution bubble led to an increase in the resistance coefficient of the bubble, that the kinetic energy of the bubble was consumed by the trailing vortex, and that the rising speed of the bubble was reduced.
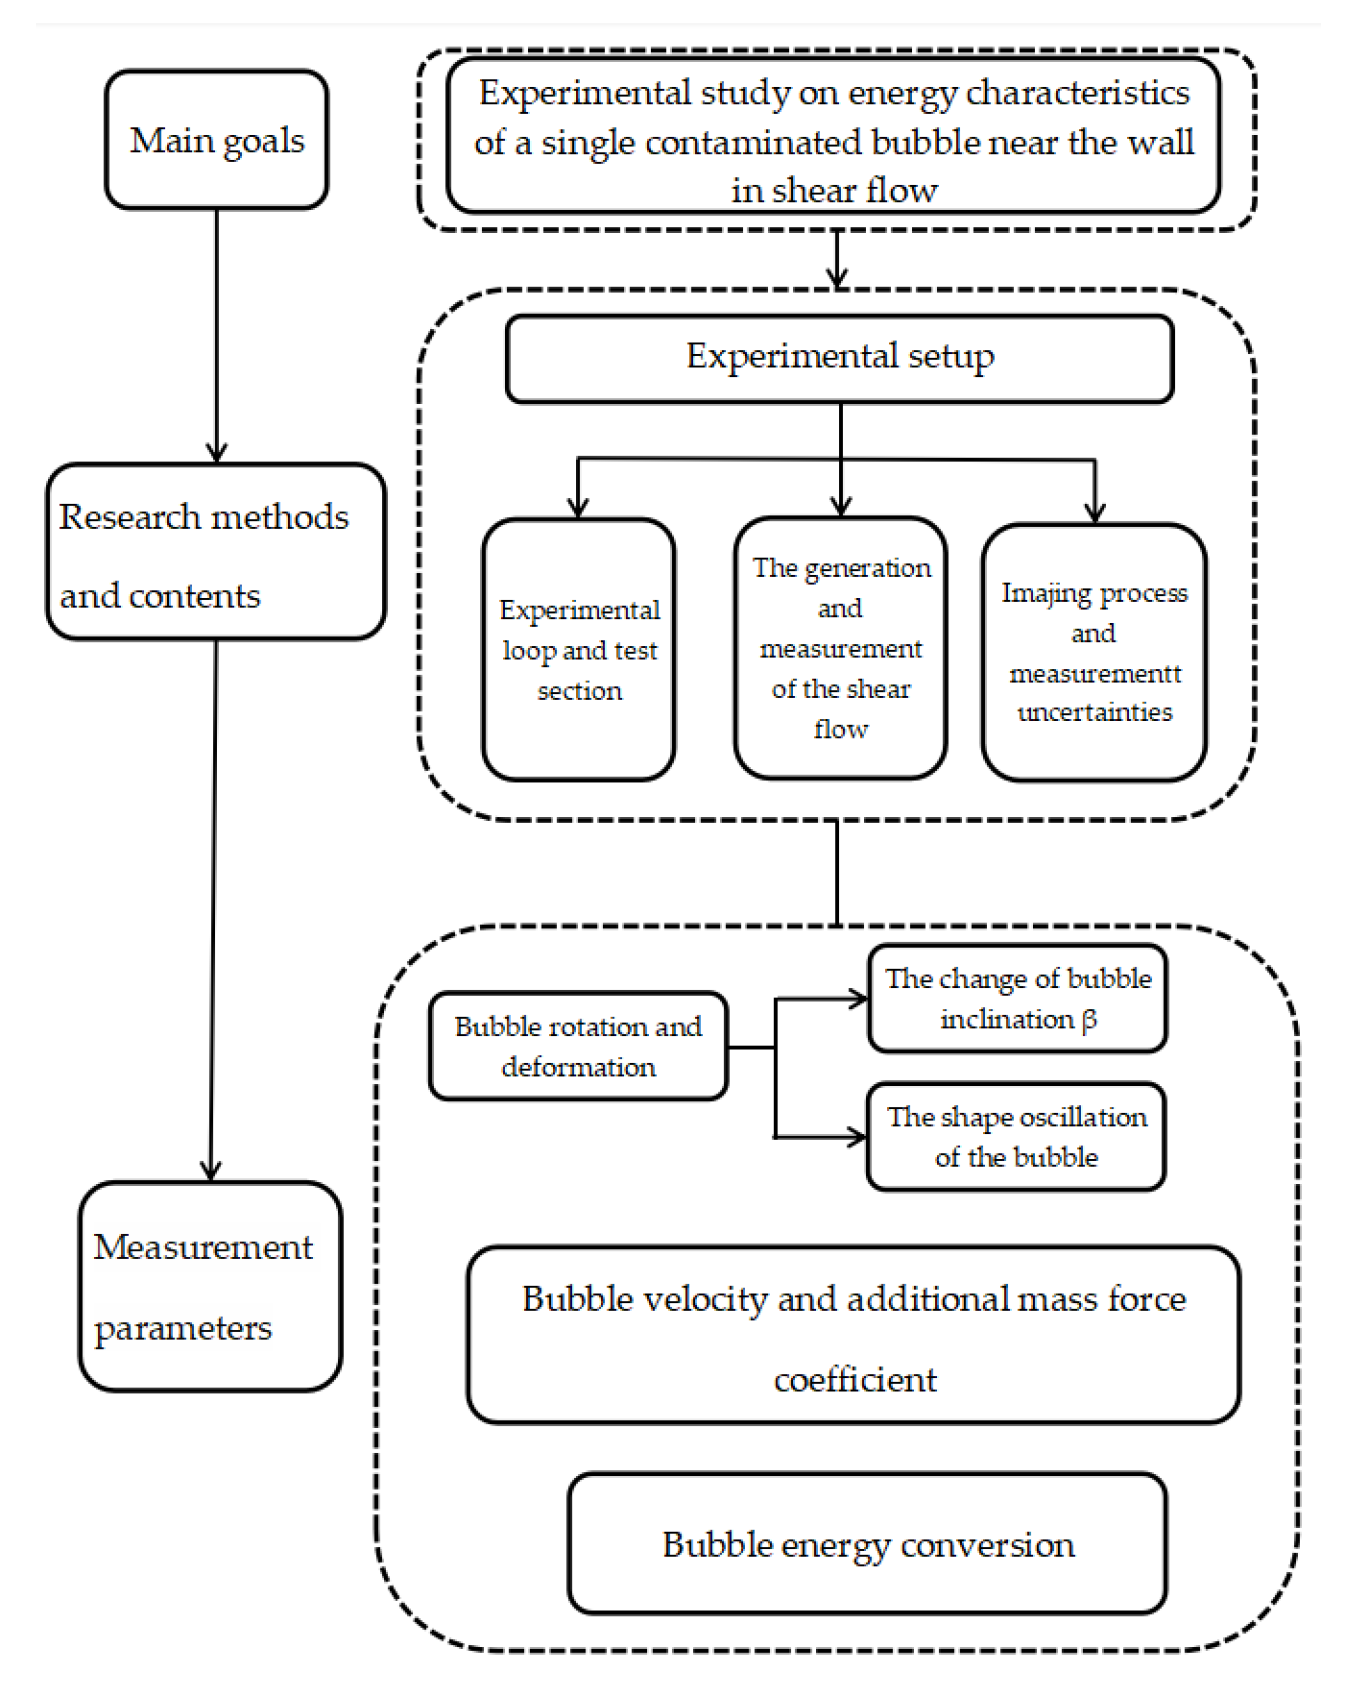
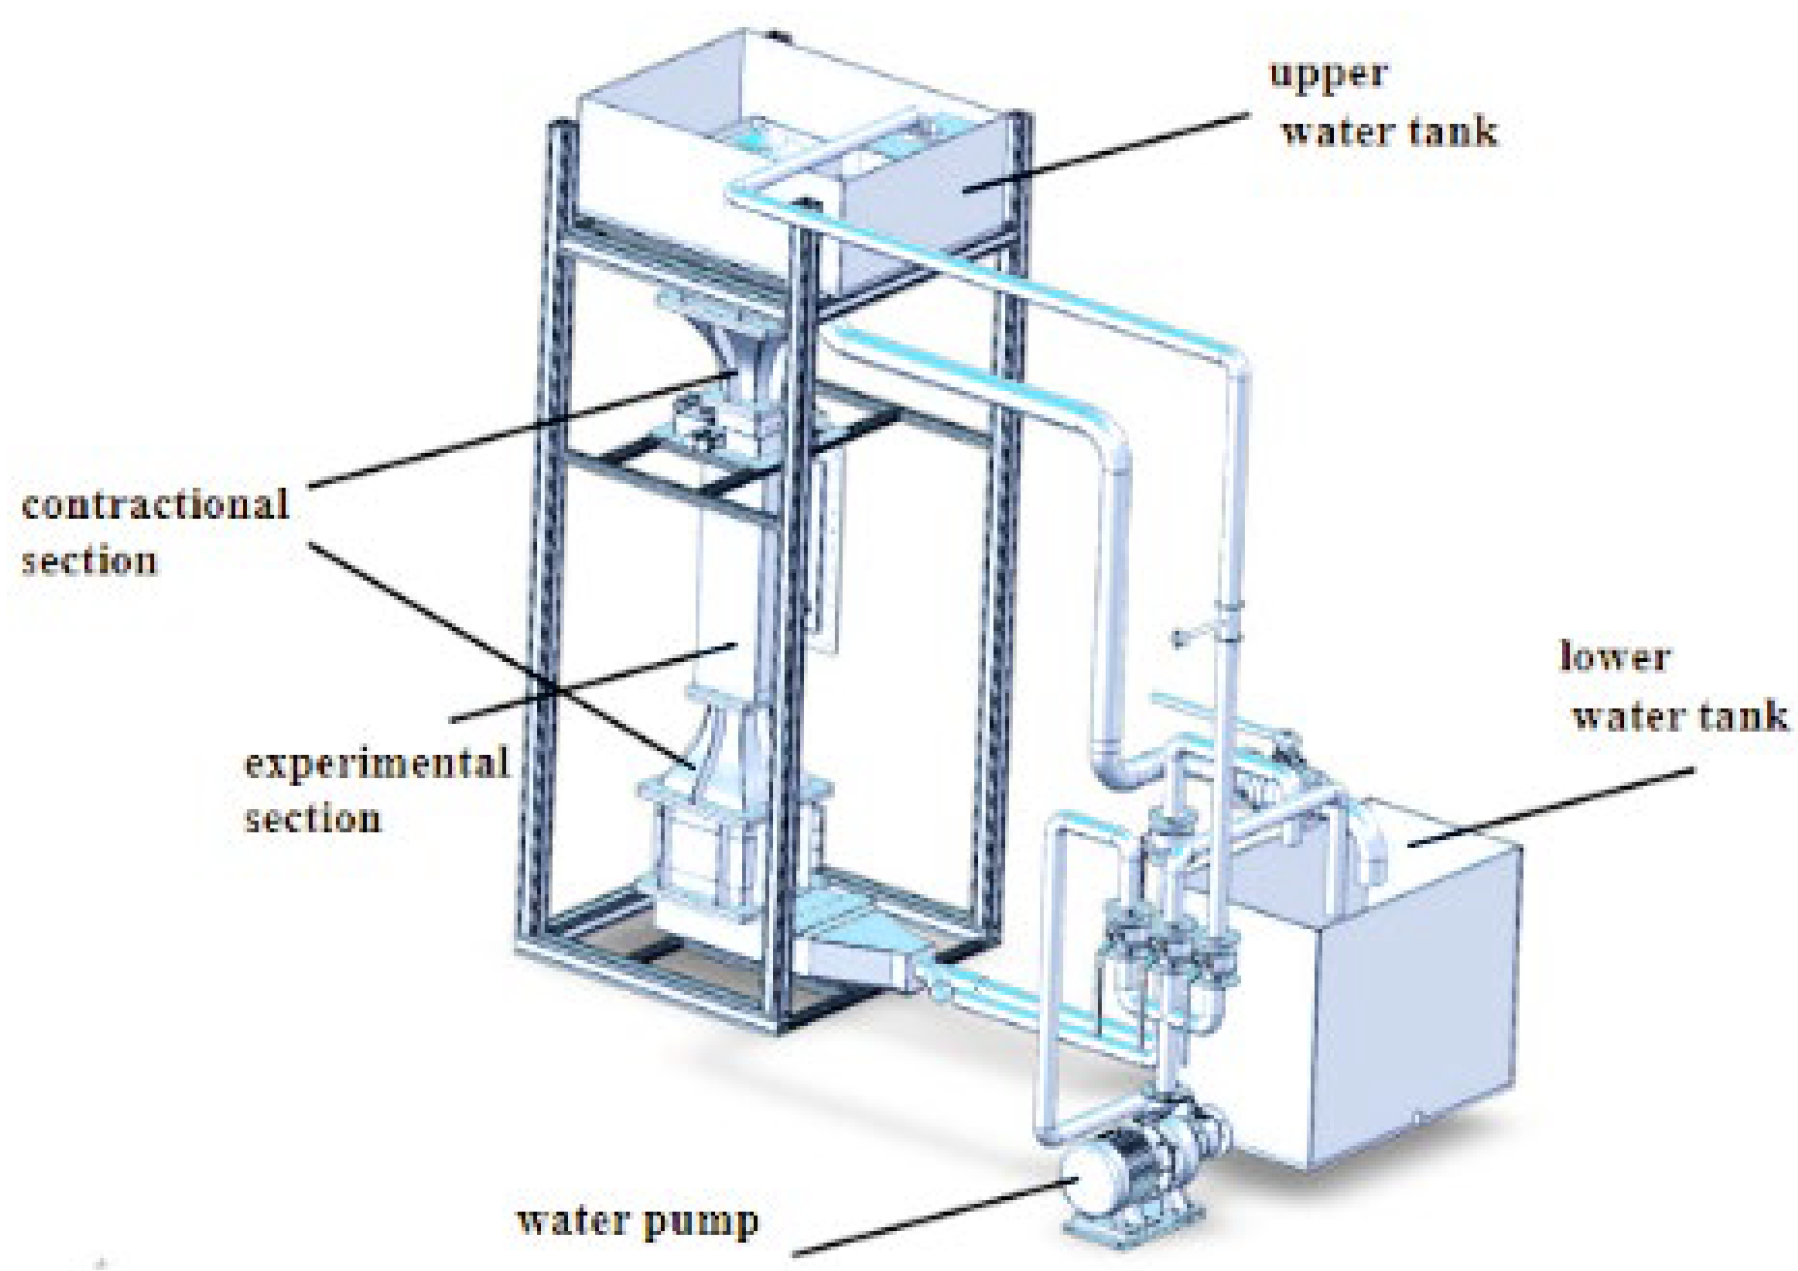
In summary, the upward movement behavior of bubbles in the near-wall region is closely related to their flow field environment, contamination state, and inherent scale, forming a typical multi-factor coupling problem. Near vertical walls, bubbles are subject to combined effects including wall effects, shear flow disturbances, and interfacial tension gradients (Marangoni effect). Existing research has primarily focused on trajectory evolution and shape changes in clean and contaminated bubbles under static or shear flow conditions. However, kinematic and dynamic studies of contaminated near-wall bubbles in complex shear boundaries or multiphase fluids remain challenging. Therefore, a linear shear flow experimental platform was built in the vertical water tunnel, and the dynamic characteristics and energy conversion characteristics of a single near-wall bubble contaminated by surfactant (deq = 2.49–3.54 mm) in the linear shear flow field were studied by combining high-speed photography and the shadow method. This will advance the application refinement and safety optimization of gas–liquid two-phase flow theory in engineering practice.
Analyzing the trajectory of individual bubbles is fundamental to understanding multiphase flow mechanisms. The evolution of bubble trajectories not only reveals the competitive and coupled interactions between various hydrodynamic forces—including buoyancy, drag, lift, wall effects, and Marangoni effects induced by surfactants—but also provides critical parameters for modeling and simulating complex gas–liquid systems. Specifically, bubble trajectory characteristics (such as ascent angles, lateral drift, and oscillation patterns) serve as essential input parameters and validation benchmarks for numerical models like the Euler–Lagrange method and population dynamics simulations. Moreover, bubble trajectories directly determine the contact area and residence time at gas–liquid interfaces, thereby influencing the efficiency of momentum, heat, and mass transfer. These insights offer direct guidance for engineering processes including gas–liquid reactors, bubble column systems, and boiling heat transfer in nuclear energy applications. Therefore, studying single-bubble trajectories not only enriches the theoretical framework of multiphase flows but also provides robust experimental support for numerical simulations and the engineering optimization of complex multiphase systems.
Our research elucidates how surfactant-induced Marangoni stress and wall repulsion alter the flow characteristics of bubbles near walls, providing a physical theoretical foundation for improving boiling heat transfer models. Beyond boiling phenomena, similar mechanisms hold significant value in bubble column systems, chemical reactors, and environmental applications such as aeration treatment and flotation operations.
3. Results and Discussion
Through trajectory analysis of bubbles generated under different nozzle conditions with varying surfactant concentrations in shear flow, it was found that bubbles rapidly stabilized after exiting the nozzle and exhibited spiral upward motion under the combined effects of shear effect and wall lift. The upward movement patterns of bubbles produced by different needles showed similar regularities. Since the 5# needle nozzle (23G model, inner diameter 0.32 mm) generated bubbles with a smaller size and lower deformation degree, the bubble motion data from the 5# needle nozzle experimental conditions was selected as the representative source for spiral bubble movement analysis.
3.1. Bubble Rotation and Deformation
The bubble will be accompanied by rotation and shape change during the ascending movement. By observing the change in bubble inclination β and calculating the shape oscillation of the bubble under the shape oscillation, the rotation and deformation of the bubble can be reflected. In the repeatability experiment, the variation frequency of the bubble dip angle is similar to the numerical value, which indicates that the consistency of bubble rotation angle and deformation degree can be guaranteed under the same experimental conditions.
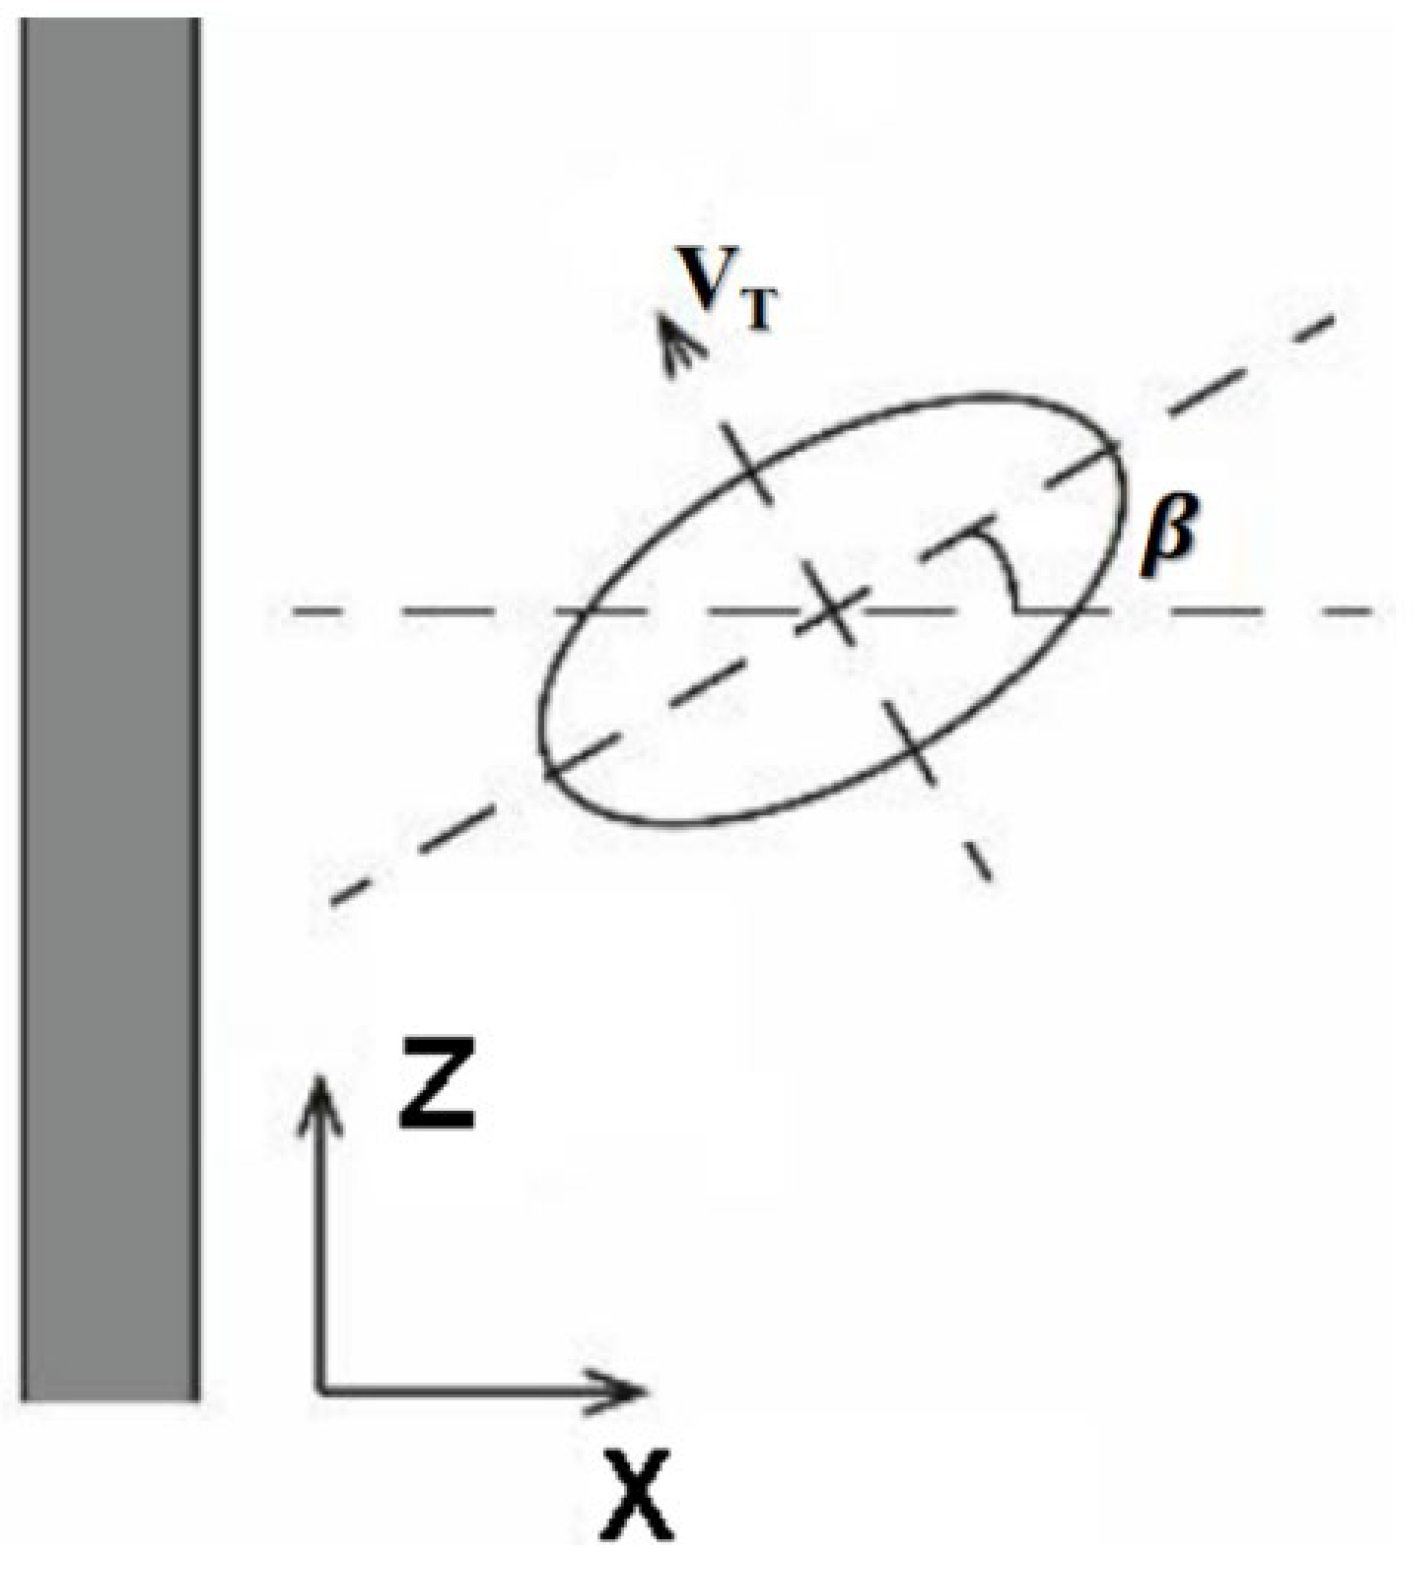
During ascent, bubbles rotate and roll along their trajectory. As shown in
Figure 7, the upward movement of a bubble can be considered as occurring within the X-Z vertical plane. Throughout this process, the bubble’s principal axis remains perpendicular to its direction of motion. The angle between this principal axis and the positive
z-axis is defined as the bubble’s tilt angle β.
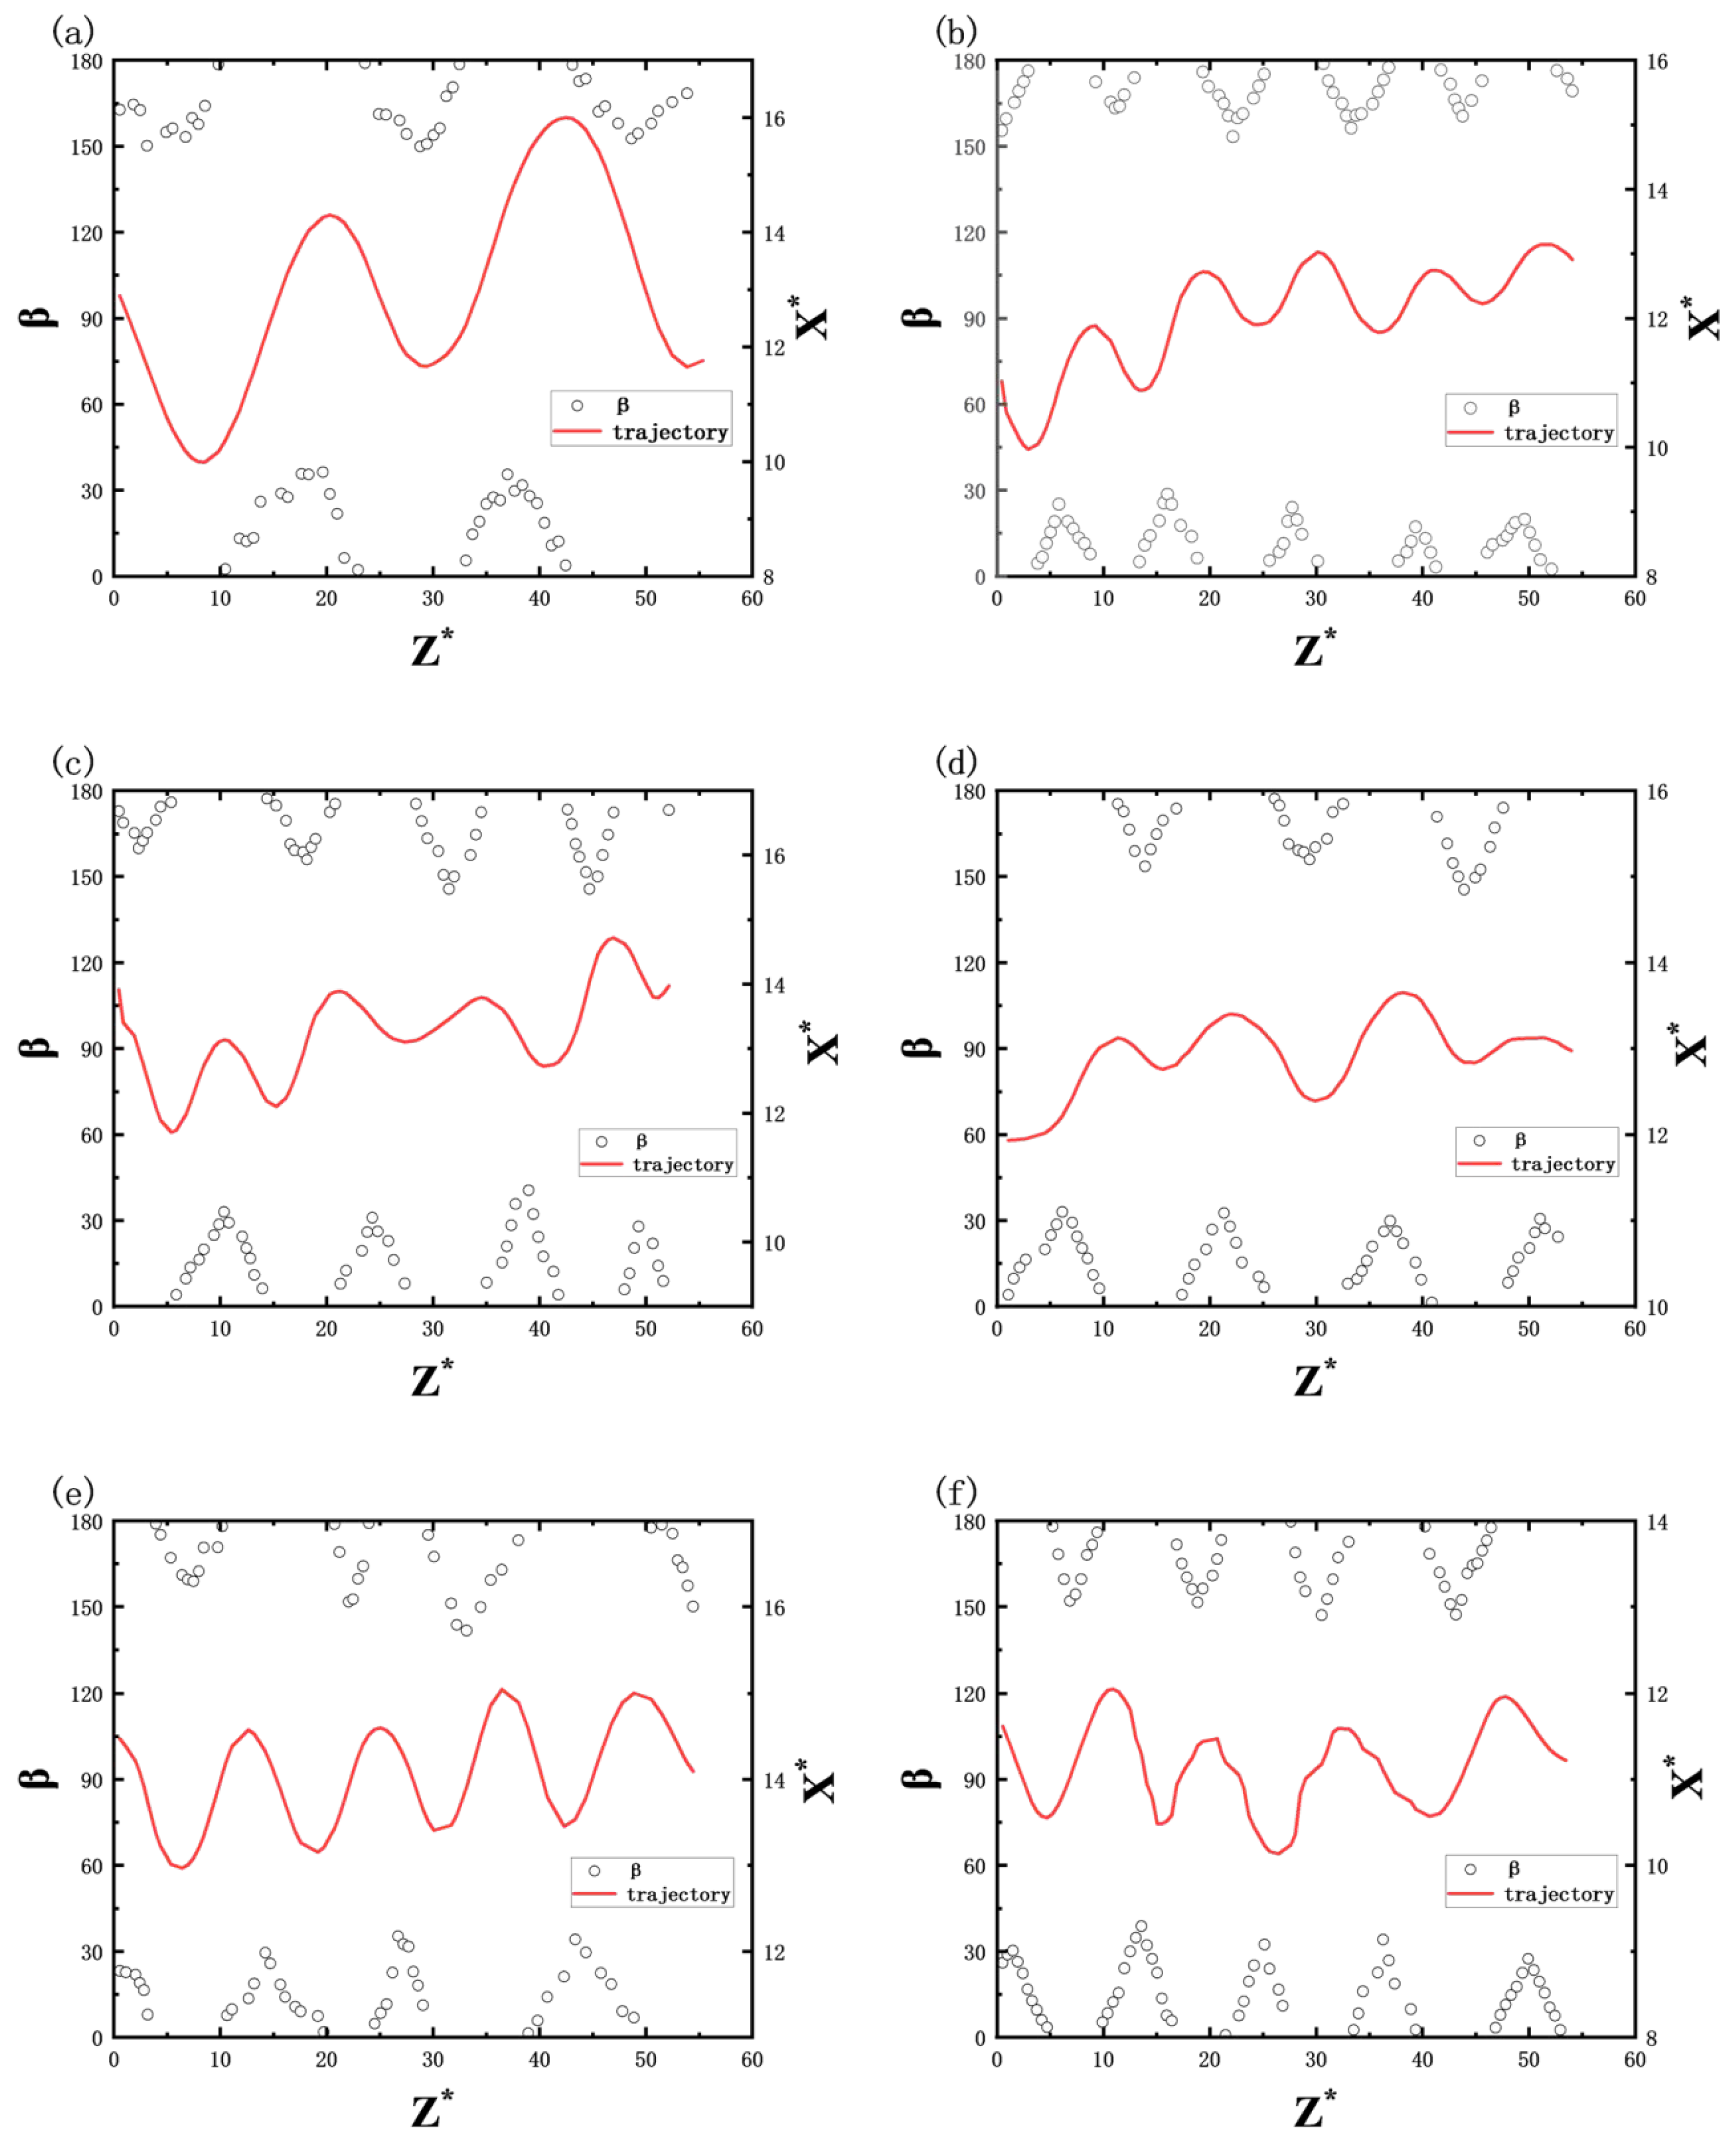
Figure 8 illustrates the variation in bubble inclination angles during ascent under different SDS concentrations (0 ppm to 50 ppm), with the rising trajectory marked by red solid lines (X* = X/
deq, Z* = Z/
deq). As bubbles ascend through the shear flow field, their inclination angles exhibit periodic fluctuations, with maximum and minimum values alternating between positions where the bubbles are farthest and closest to the wall, respectively, demonstrating an extreme value interchange characteristic.
Figure 8b–f further reveal that as the surfactant concentration increases, bubble surface contamination intensifies while deformation suppression occurs, resulting in progressively reduced inclination fluctuation ranges. At concentrations from 0 ppm to 20 ppm, the inclination angles fluctuate between 145 and 180° and 0–40°. When concentrations rise to 30–50 ppm, these ranges further narrow to 150–180° and 0–35°, respectively.
The shape oscillation of the bubble in the rising process can be divided into modes (2, 0) and (2, 2) [
31], as shown in
Figure 9. d
D and d
M are the two equivalent spindles of the bubble, respectively. Based on d
D and d
M, the frequencies of the two types of modes are calculated, as shown in Equations (3) and (4) [
32], which are applicable to diameters of 1.4 mm ≤ d
eq ≤ 14 mm. The mode (2, 0) reflects the simultaneous oscillation of the bubble, that is, the oscillation of the ellipticity. The mode (2, 2) reflects the reverse oscillation of the bubble, that is, when the two main axes differ greatly, the bubble will rotate around axis e.
where
χ is the bubble aspect ratio (
χ =
dh/
dv), σ is the surface tension coefficient,
ρ is the density, and
req is the equivalent radius of bubbles.
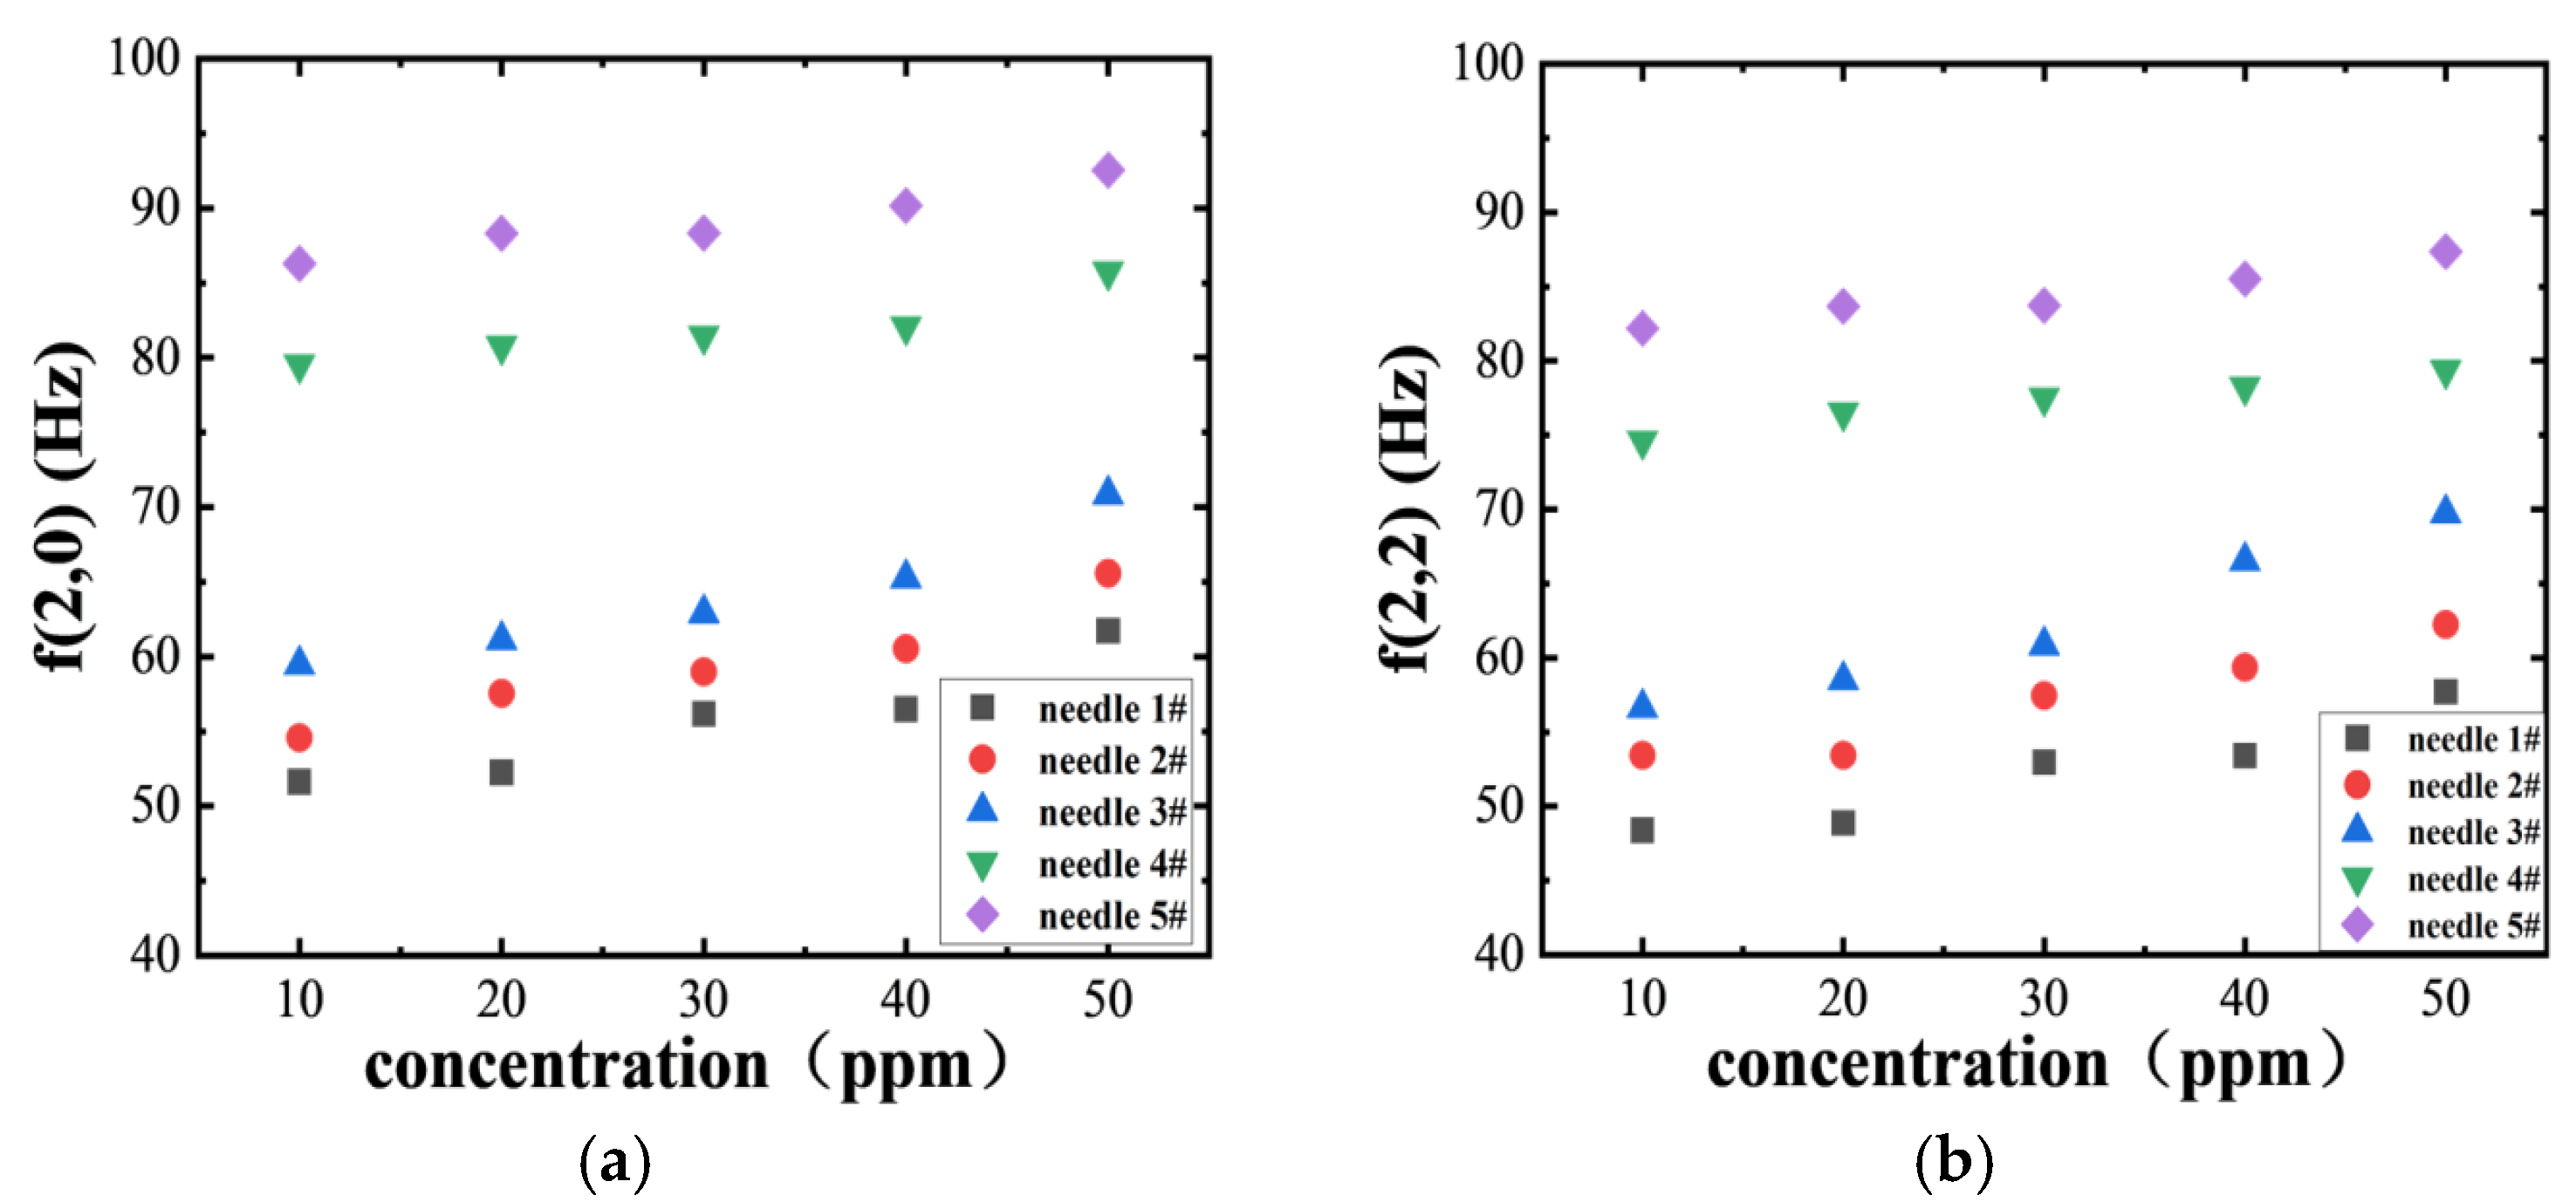
Figure 10 illustrates the frequency variations in bubbles under two oscillation modes (2, 0) and (2, 2) with surfactant concentrations, measured at different needle numbers (needle 1#~5#, representing bubble scales from largest to smallest). The results demonstrate that the oscillation frequency increases significantly with higher needle numbers. Notably, even among needles of the same number, the frequency rises with increasing SDS concentration. Compared to the (2, 0) mode, the (2, 2) mode exhibits slightly lower frequencies across all conditions, indicating that exciting higher-order modes presents greater challenges and requires more sophisticated interface perturbations.
In linear shear flow fields, velocity gradients induce periodic bubble deformations. Smaller-scale bubbles exhibit reduced inertial effects and demonstrate higher oscillation frequencies due to their greater responsiveness to shear disturbances. When bubbles approach the wall, deformation is constrained by boundary conditions, limiting their shape evolution and resulting in lower oscillation frequencies. Conversely, as bubbles move away from the wall, reduced wall interference enhances their oscillation freedom. Additionally, an increased SDS concentration strengthens the interfacial tension gradient, restricting flow at the interface and making bubble surfaces more rigid, thereby boosting their response frequency to disturbances. Notably, (2, 2) mode oscillations show slight enhancement under high contamination conditions, indicating that the Marangoni effect promotes higher-order mode excitation.
Figure 11 illustrates the variation in bubble frequency with a dimensionless wall distance under two oscillation modes (2, 0) and (2, 2) at different SDS concentrations (10 ppm to 50 ppm). As bubbles move away from the wall, the shear strength in their vicinity increases, resulting in greater local velocity gradients that enhance interfacial perturbations and induce high-frequency oscillations. Conversely, when near the wall, bubbles experience reduced deformation freedom due to flow compression and geometric constraints, limiting their oscillations. An elevated surfactant concentration intensifies the interfacial tension gradient, thereby strengthening Marangoni stress and amplifying both the rotational effect and ellipsoidal oscillations of the bubbles.
In summary, when bubbles rise in shear flow fields, they exhibit rotational motion and periodic inclination fluctuations. Their deformation becomes restricted near the wall while oscillations become more free away from it. The morphology primarily manifests as two modes: modes (2, 0) and (2, 2). Smaller-scale bubbles demonstrate higher frequencies, while higher-order modes are less likely to be excited. As the SDS concentration increases, surface fouling intensifies on bubbles, narrowing the range of inclination fluctuations. However, oscillation frequencies rise due to enhanced interfacial tension gradients and Marangoni effects, even promoting the emergence of higher-order modes.
3.2. Bubble Velocity and Additional Mass Force Coefficient
The change in the kinetic energy of the bubble will be affected by the bubble velocity and the additional mass force. By calculating the instantaneous velocity VT, the time average velocity and the additional mass force coefficient Cm during the rise of the bubble, the magnitude and the change law of the kinetic energy of the bubble are explored. The bubble instantaneous velocity (VT) can be divided into three directional components: wall normal velocity (Vx), spanwise velocity (Vy) and vertical velocity (Vz).
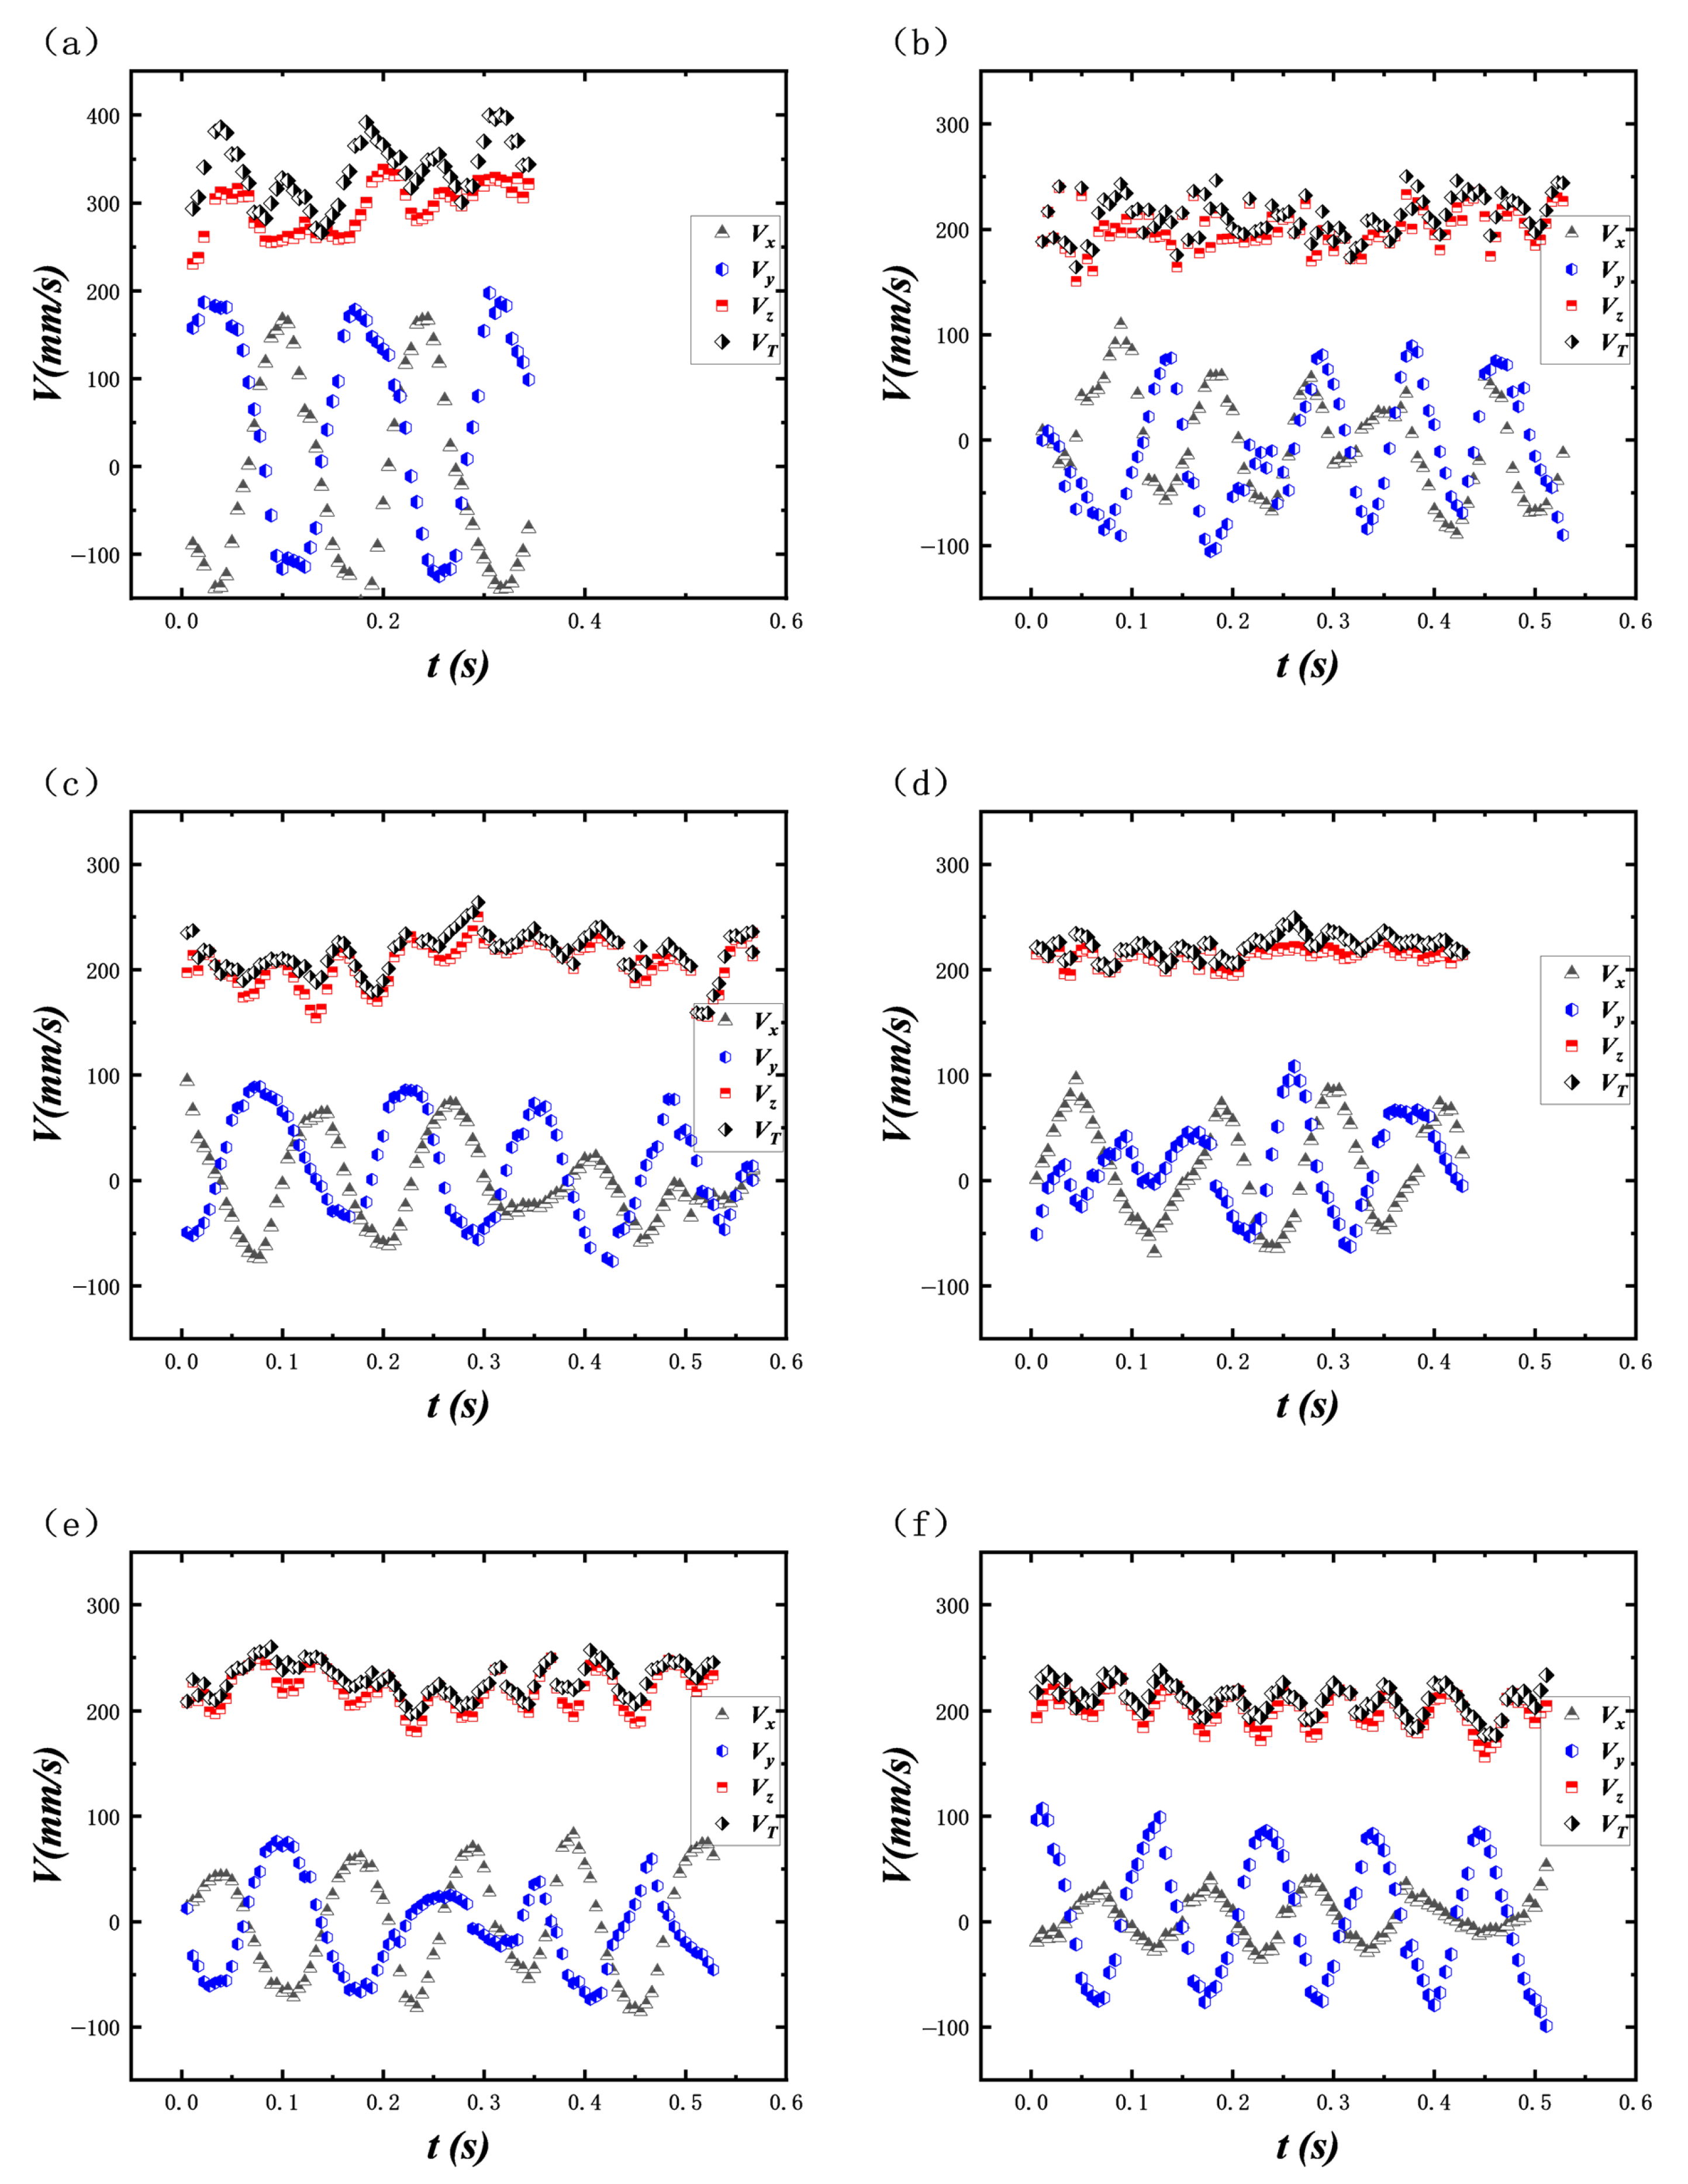
Figure 12 illustrates the instantaneous bubble velocity (V
T) and its three components, namely vertical velocity (V
z), wall-normal velocity (V
x), and spanwise velocity (V
y), as they change over time during the rise of near-wall bubbles in a shear flow field, under different surfactant concentrations ranging from 0 ppm to 50 ppm.
Figure 12a–f correspond to surfactant concentrations of 0 ppm to 50 ppm, respectively. As shown in
Figure 11a, in the absence of surfactant (0 ppm), the wall-normal velocity V
x exhibits significant periodic fluctuations with a wide range, and the spanwise velocity V
y also shows noticeable fluctuations, indicating that the bubble periodically approaches and moves away from the wall due to the combined effects of lift, shear, and buoyancy. As the surfactant concentration increases from 10 ppm to 50 ppm, the amplitude of V
x oscillations gradually decreases, and the periodicity weakens, suggesting that the fluidity of the bubble interface decreases, and the interaction between the bubble and the wall is inhibited. Simultaneously, the fluctuations in V
y also diminish, indicating that the spanwise migration is restricted. When the surfactant concentration reaches 50 ppm, the amplitude of V
x oscillations is minimal, and the bubble rises steadily, with the shear-induced lateral movement being significantly suppressed. Notably, regardless of the surfactant concentration, the vertical velocity V
z remains positive and changes minimally. During the process of bubble rising, the wall-normal velocity V
x fluctuates around a fixed lateral positive velocity value, indicating that the bubble is subjected to continuous lifting force in the shear flow field, and then the lateral displacement gradually occurred on the rising path. The lateral positive velocity corresponds to the lateral net migration velocity of the bubble.
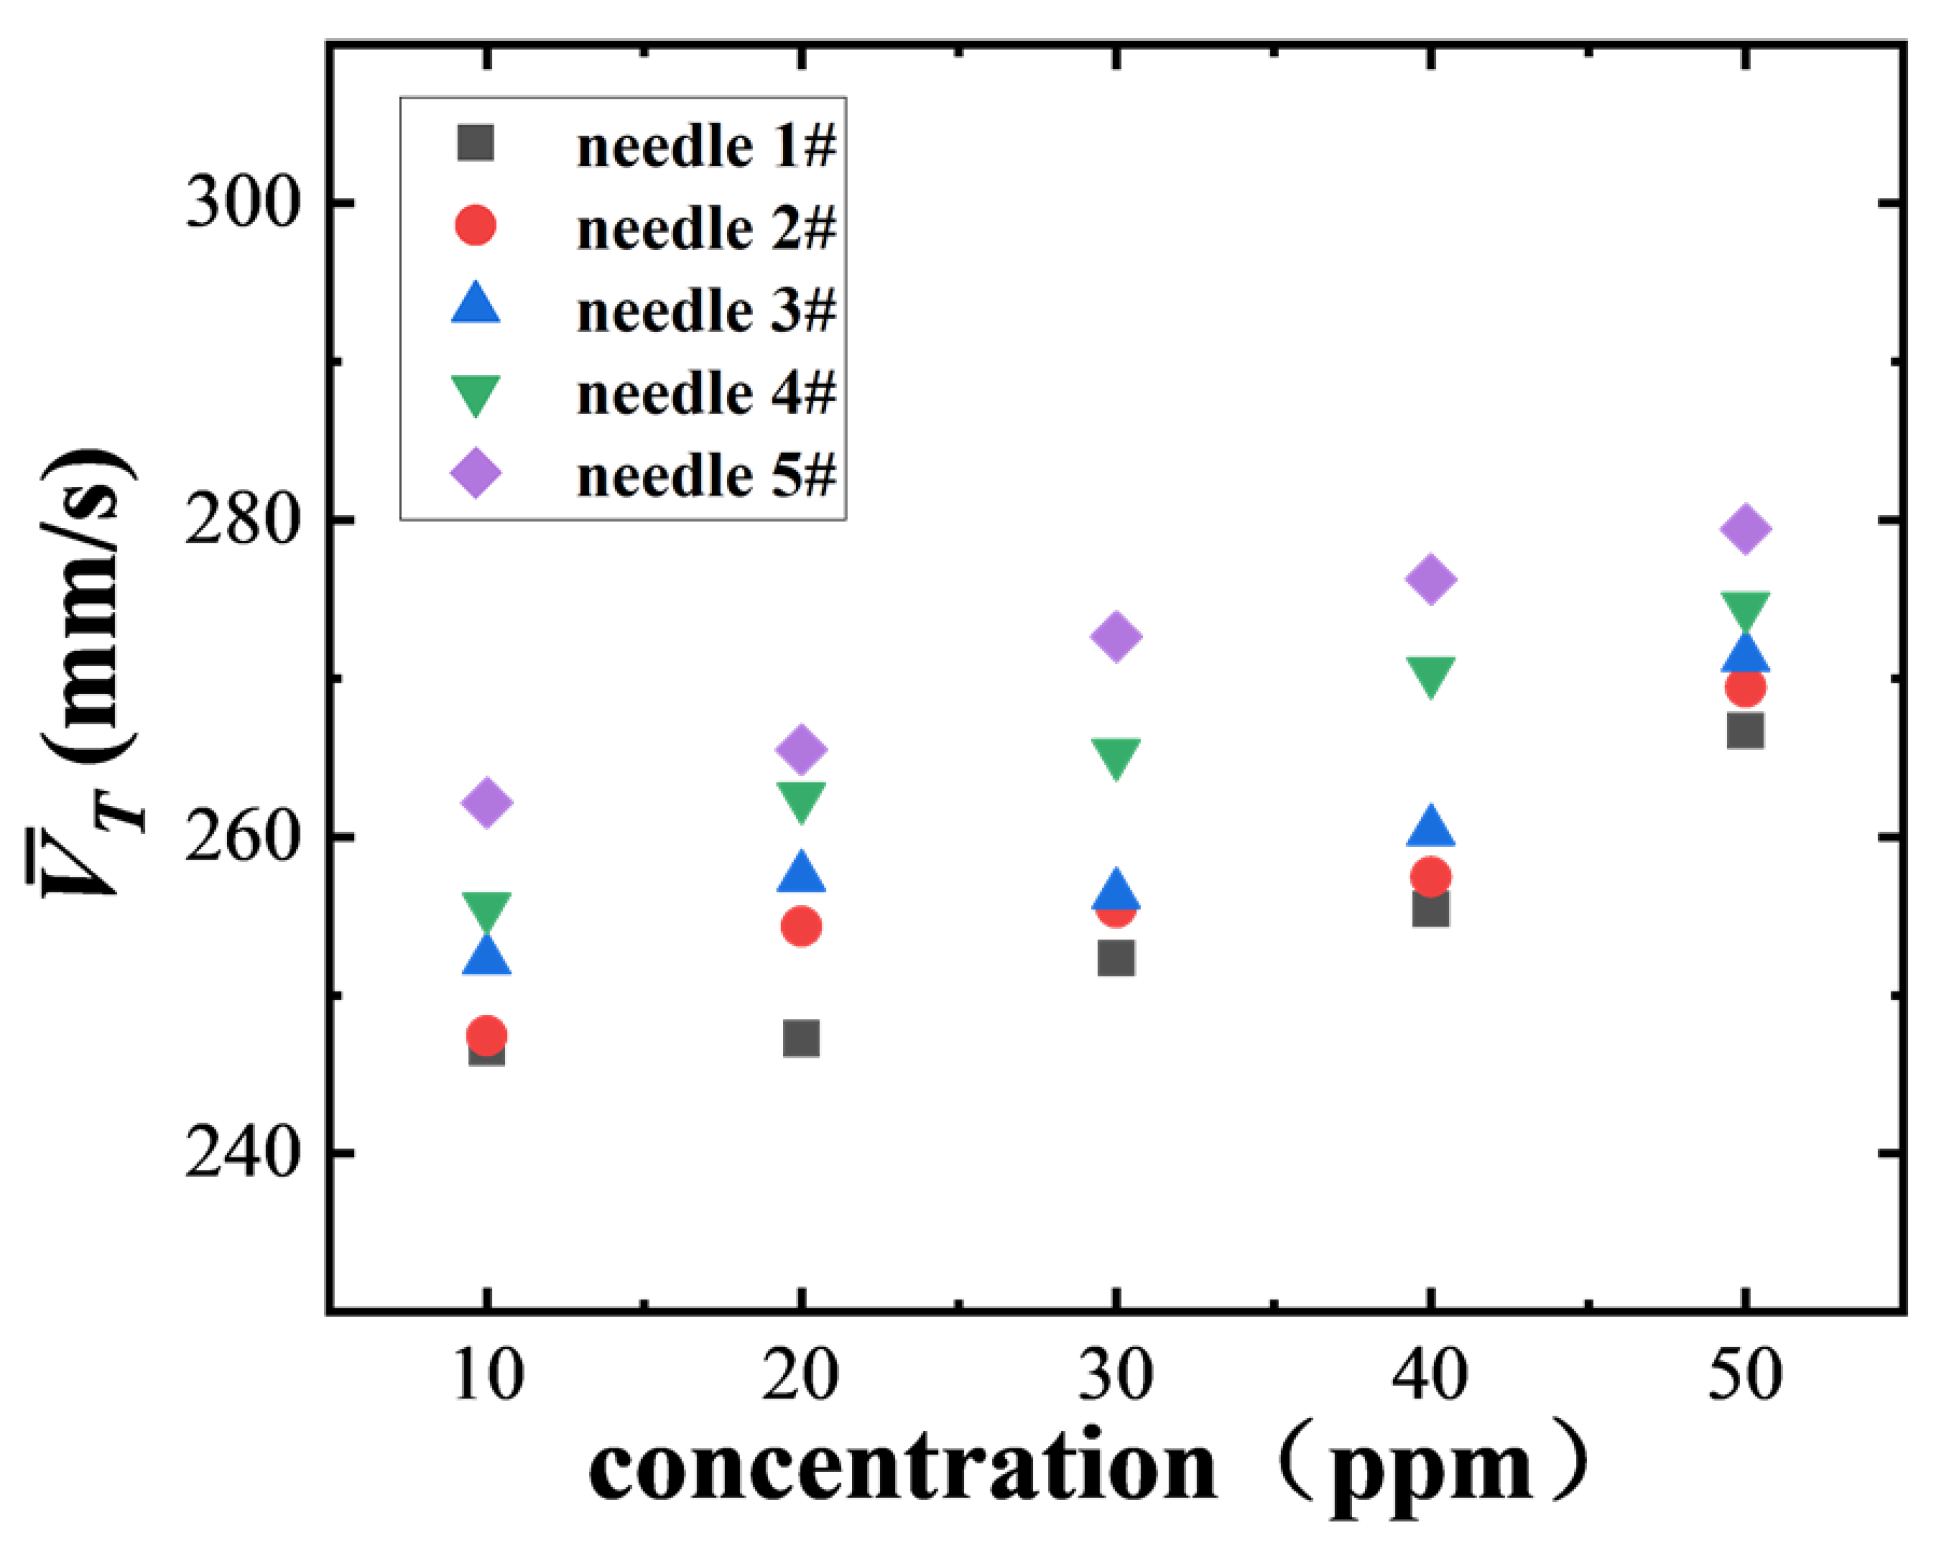
Figure 13 illustrates the trend in the average Z-directional rise rate of bubbles produced by different numbered needles (needle 1# to 5#) at SDS concentrations ranging from 10 ppm to 50 ppm. The results show that the average rise rate of all bubbles increases as the concentration rises. Additionally, the larger the needle number (i.e., the smaller the bubble size), the higher the corresponding Z-directional velocity, demonstrating a clear scale dependence. Larger bubbles are more susceptible to non-uniform flow field disturbances in shear flow, leading to a decrease in the Z-directional velocity component. Conversely, smaller bubbles are less affected by shear interference and move more stably in the vertical direction, thus exhibiting a higher average rise rate. The current concentration range (10 ppm to 50 ppm) is below the critical micelle concentration (CMC), where the interfacial tension gradient is still active, potentially promoting interfacial slip and reducing bubble movement resistance, thereby increasing the rise rate. As the concentration increases, Marangoni stress tends to increase, but it has not yet fully inhibited bubble slip within this range, so the rise rate continues to increase with concentration.
When the bubble moves up and accelerates in the fluid, the surrounding fluid will also be driven to accelerate. The fluid itself has a certain inertia, and the fluid has a tendency to maintain a state of motion when there is no bubble, so it will act on the bubble in the opposite direction of the reaction force, which has a hindering effect on the bubble. The force pushing the bubble in the opposite direction is greater than the inertia force of the bubble itself, and the force greater than the inertia force of the bubble itself is defined as the additional mass force C
m, which cannot be ignored during the rise of the bubble. The calculation of the additional mass force coefficient is shown in Equations (5) and (6) [
5].
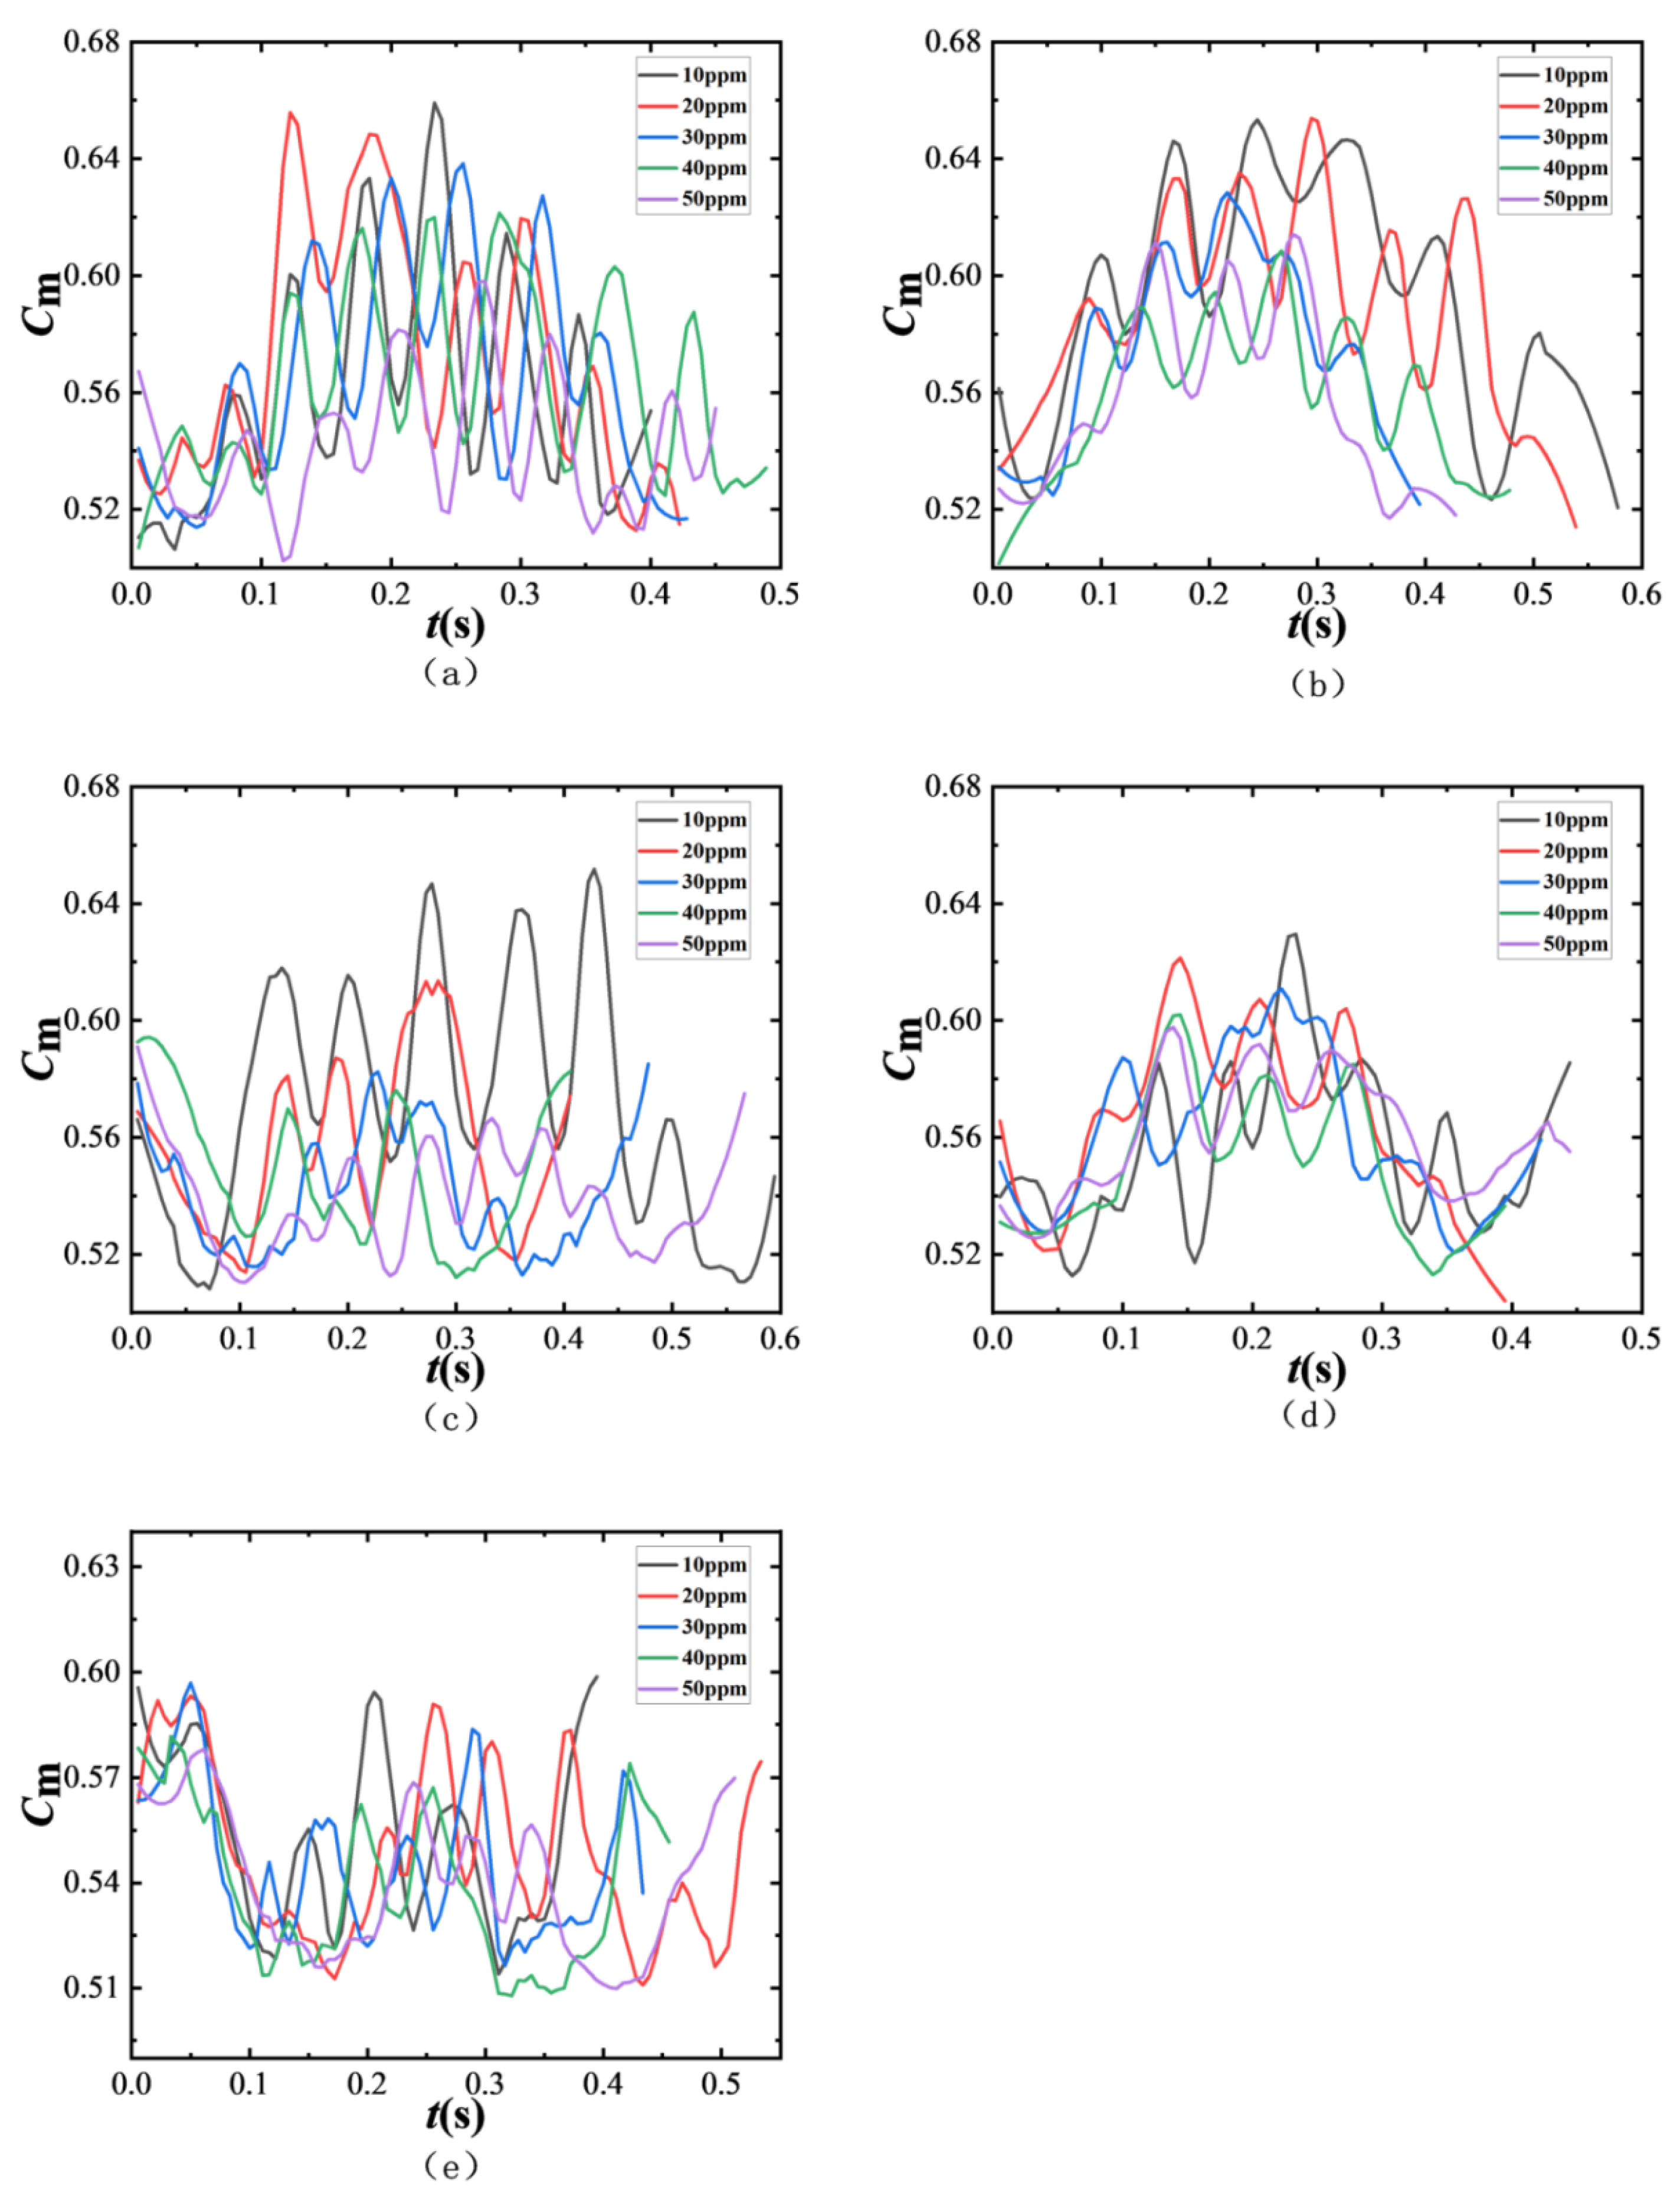
The time-dependent variations in additional mass coefficients for bubbles generated by different needle numbers (1#~5#) under varying surfactant concentrations are shown in
Figure 14. As previously discussed, the equivalent diameter of bubbles increases with the needle’s inner diameter but decreases with a rising surfactant concentration. Larger bubbles exhibit smaller dimensionless distances, meaning they are closer to the wall and thus more susceptible to wall effects. In shear flow fields, larger bubbles demonstrate stronger additional mass forces, particularly at low SDS concentrations where bubble morphology becomes more irregular. Smaller bubbles typically maintain a more spherical shape with an aspect ratio closer to 1, which reduces surface tension effects and weakens deformation. Smaller bubbles have larger dimensionless distances, being farther from the wall and experiencing weaker wall effects, resulting in lower additional mass coefficients. As the SDS concentration increases, the fluctuation amplitude of
Cm decreases for smaller bubbles. Furthermore, the Marangoni effect induced by increased surfactant concentration further reduces
Cm fluctuations, with particularly pronounced effects observed in smaller bubbles.
In summary, when bubbles rise in shear flow fields, their velocity and additional mass force coefficient are significantly influenced by the bubble size and surface contamination levels. Instantaneous bubble velocity comprises vertical, normal, and lateral components. In the absence of surfactants, both normal and lateral velocities exhibit intense fluctuations, causing periodic proximity to and separation from the wall. As the SDS concentration increases, the interfacial fluidity decreases, restricting lateral and normal migration. Bubbles gradually stabilize into steady straight risers while maintaining consistently positive vertical velocity with minimal variation. The average upward velocity rises with increasing SDS concentration, with small-scale bubbles rising faster due to reduced shear interference, demonstrating clear size-dependent behavior. The additional mass force coefficient increases with bubble size, showing stronger wall effect effects in larger bubbles—particularly exhibiting irregular morphology and more pronounced Cm fluctuations at low concentrations. Conversely, smaller bubbles maintain spherical shapes with weaker wall effects and lower Cm values, where Cm fluctuations diminish further with an increased concentration, highlighting Marangoni’s enhanced rigidity effect on interfaces.
3.3. Bubble Energy Conversion
When the bubble moves upward in the near-wall shear flow, the energy conversion between the bubble’s kinetic energy and the surface energy plays an important role in the deformation and stress of the bubble. In this paper, the values of kinetic energy (total kinetic energy, anisotropic kinetic energy components) and surface energy and their proportion in the total energy of small-scale bubbles are studied, and the effects of bubble scale and distance from the wall on the dynamic characteristics of bubbles are analyzed from the perspective of energy conversion. The energy calculation process is shown in Equations (7)–(9) [
7]:
where
Ek is the total kinetic energy of the bubble,
Ekx,
Eky and
Ekz are the components of the total kinetic energy
Ek in the square direction of
x,
y and
z, respectively,
Es is the surface energy of the bubble, and
Et is the total energy of the bubble.
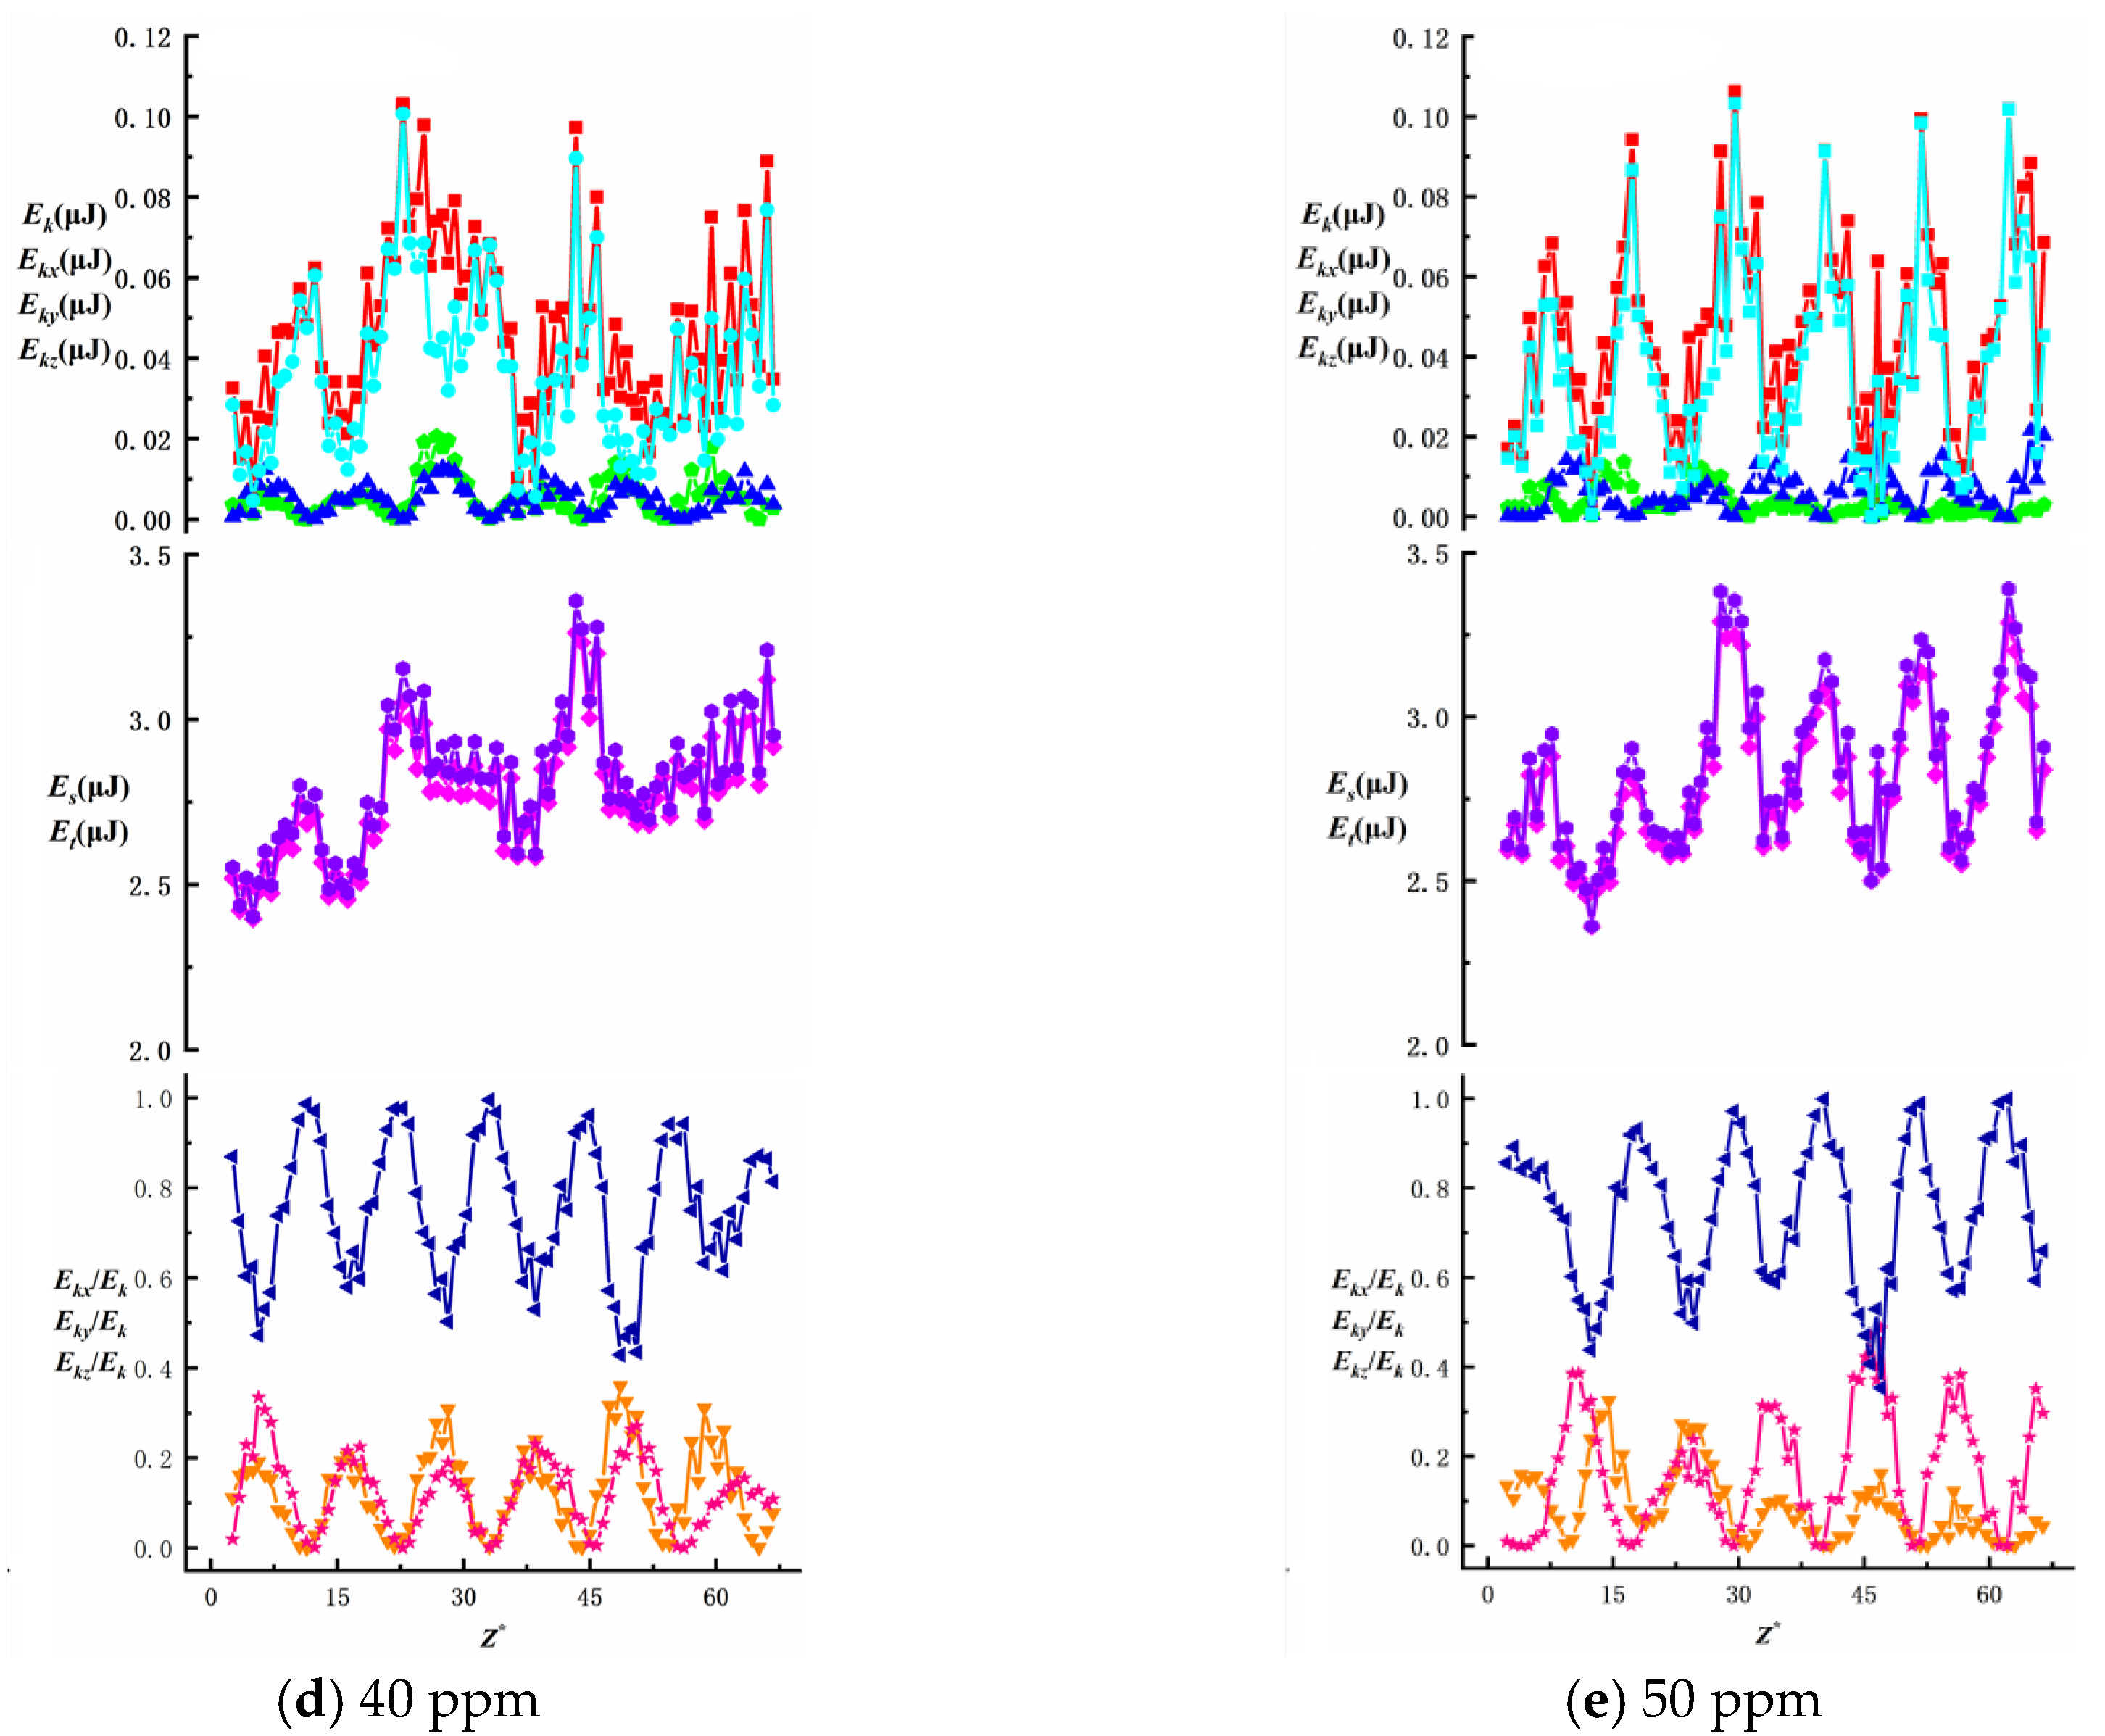
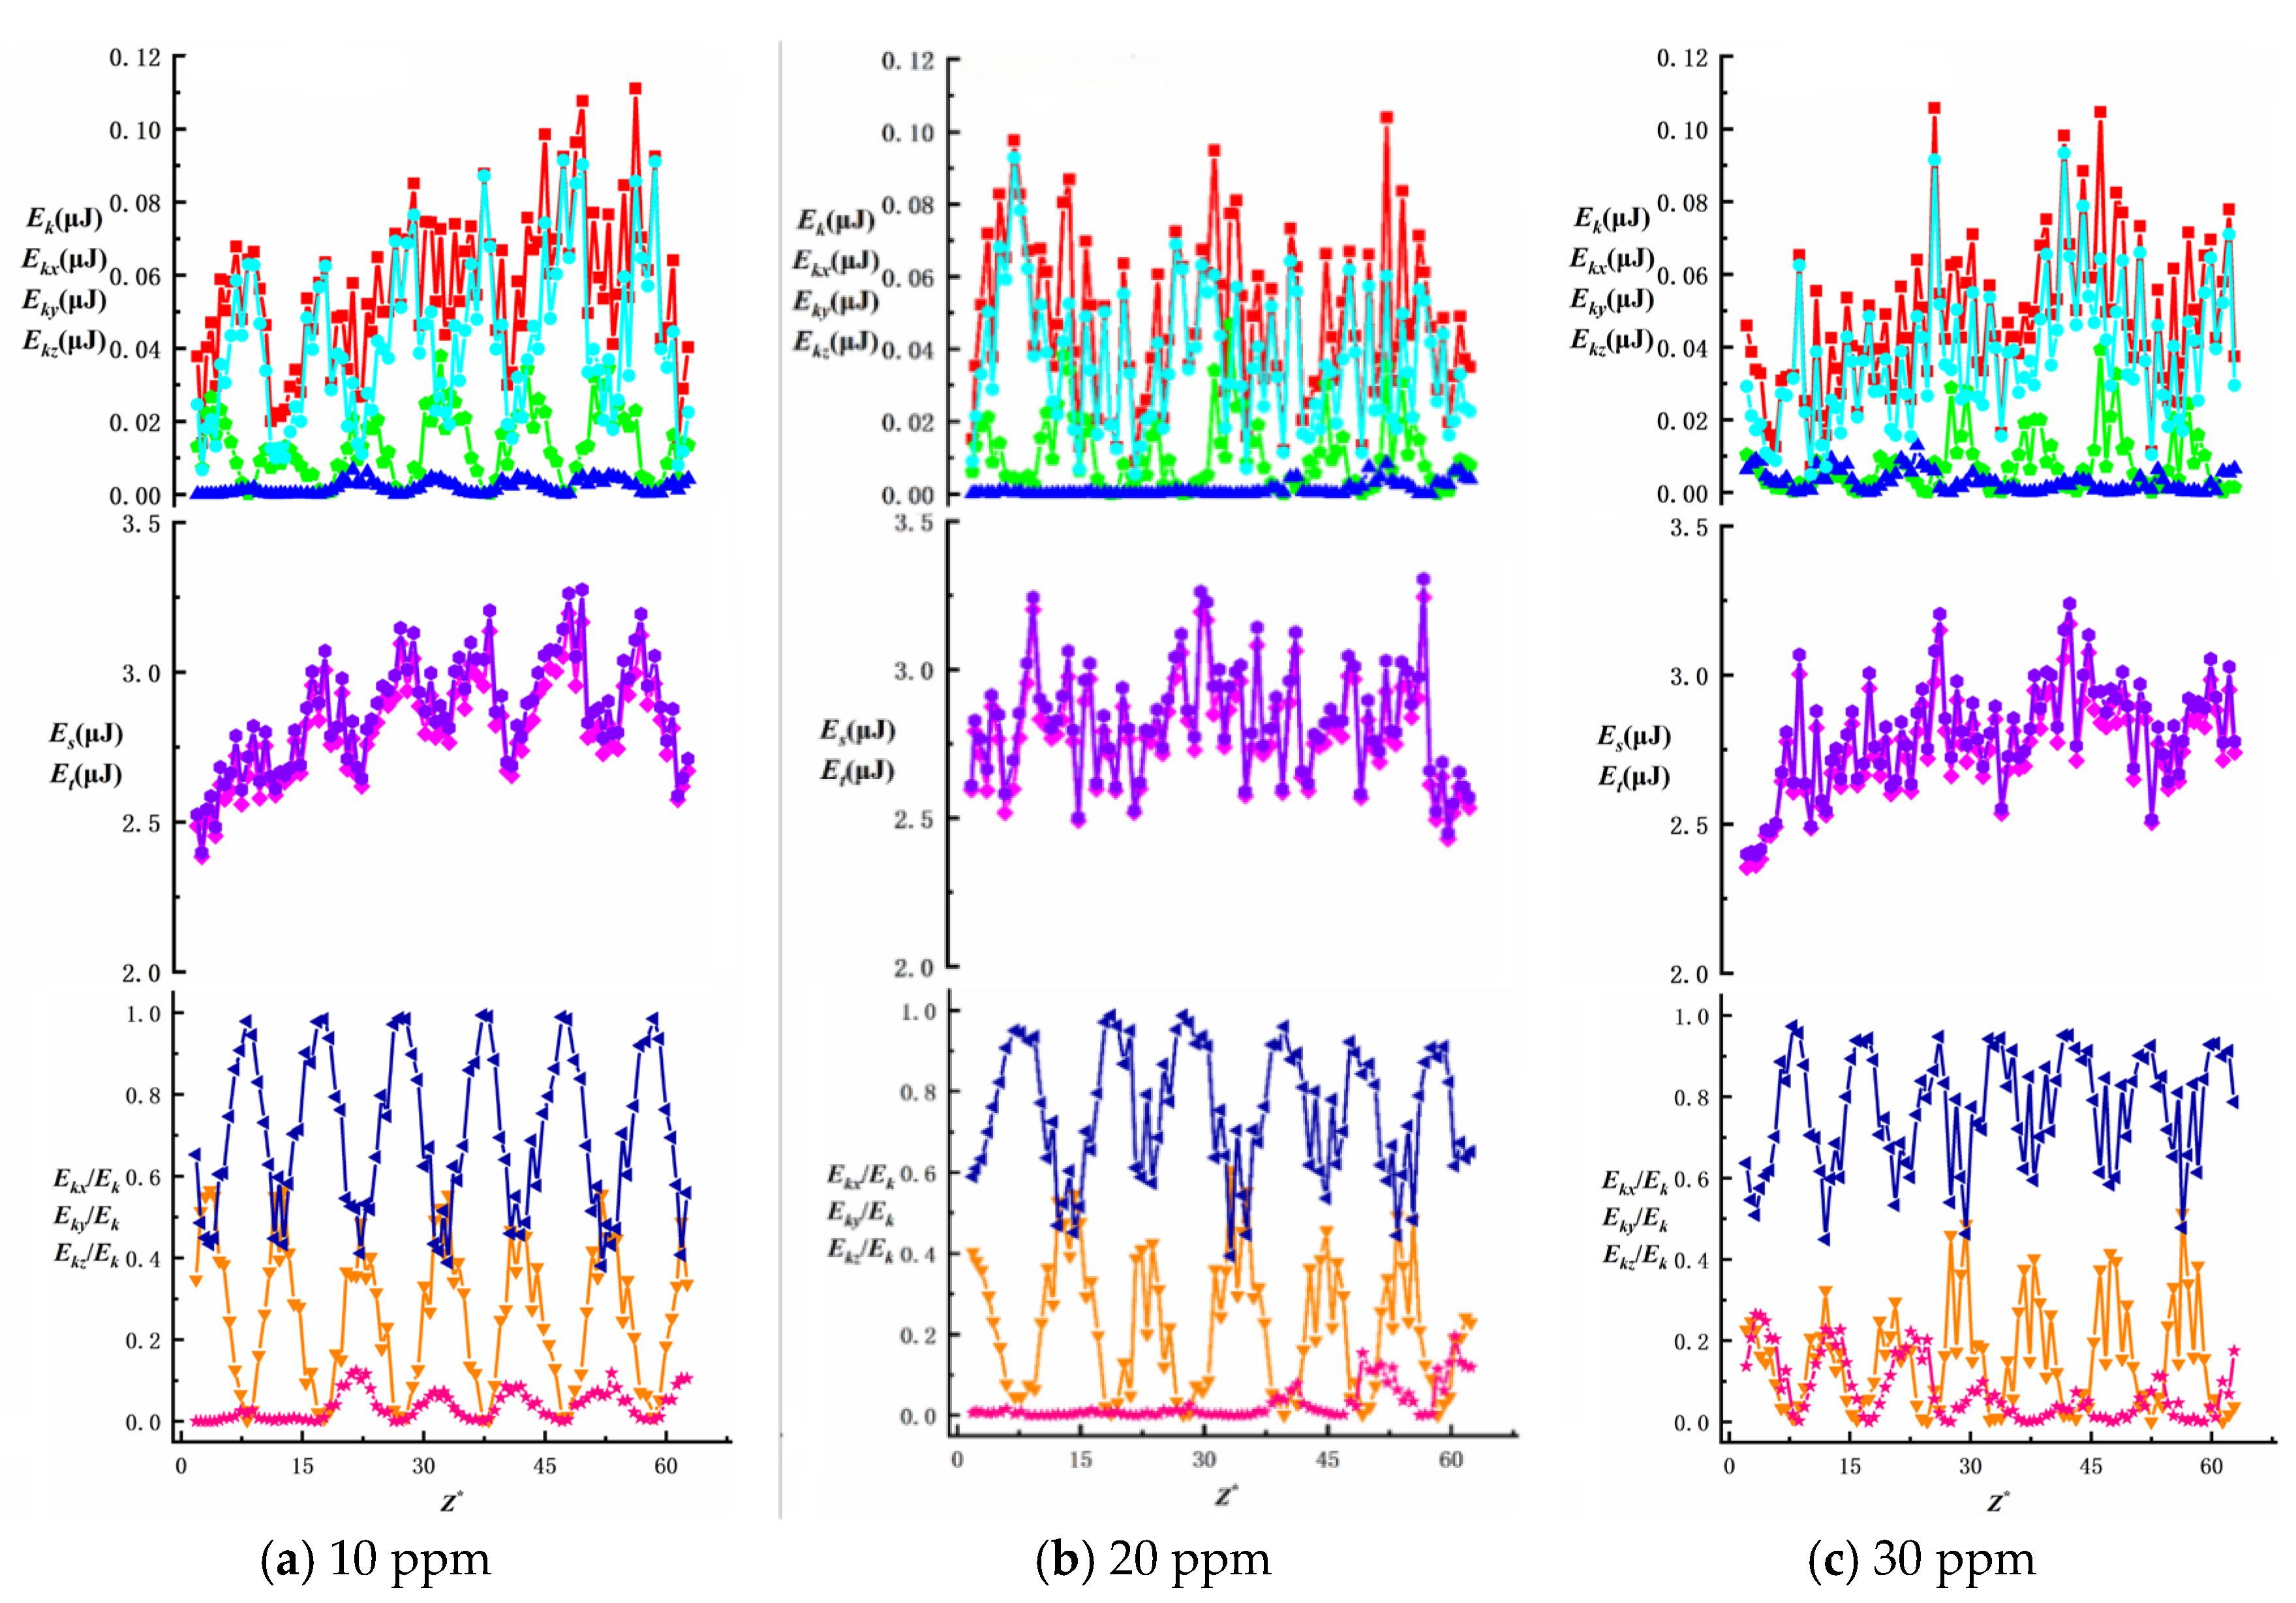
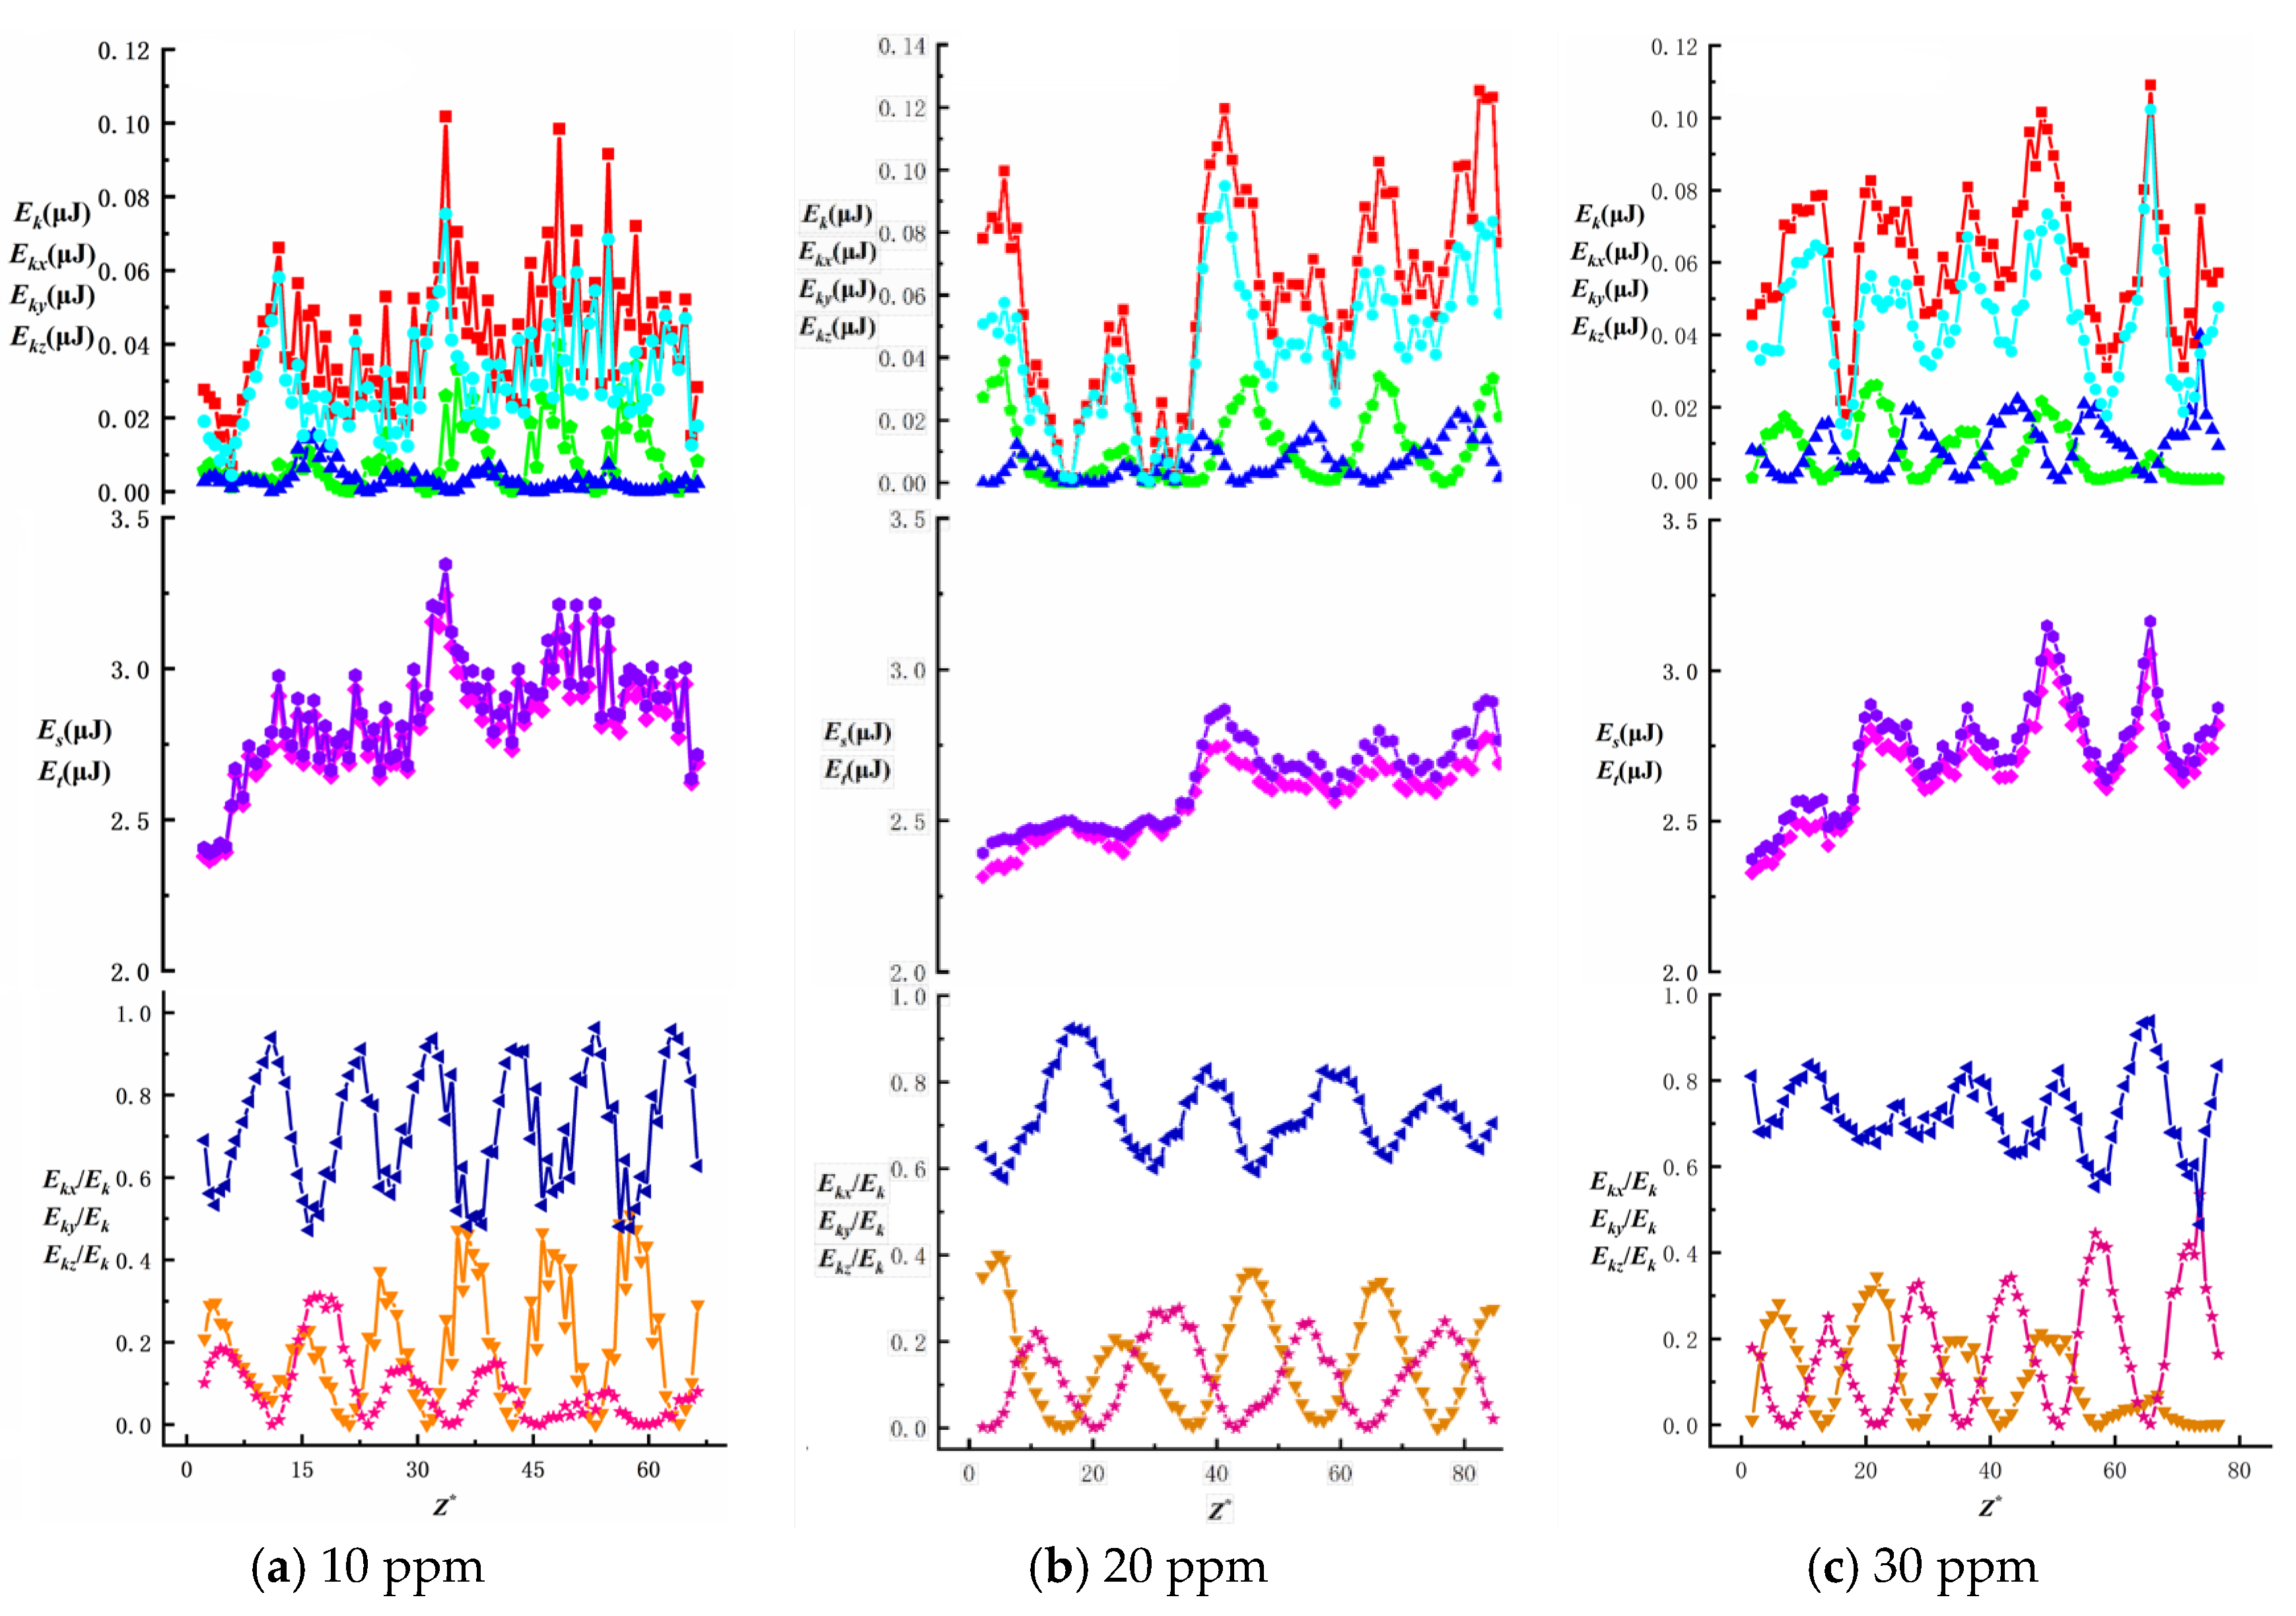
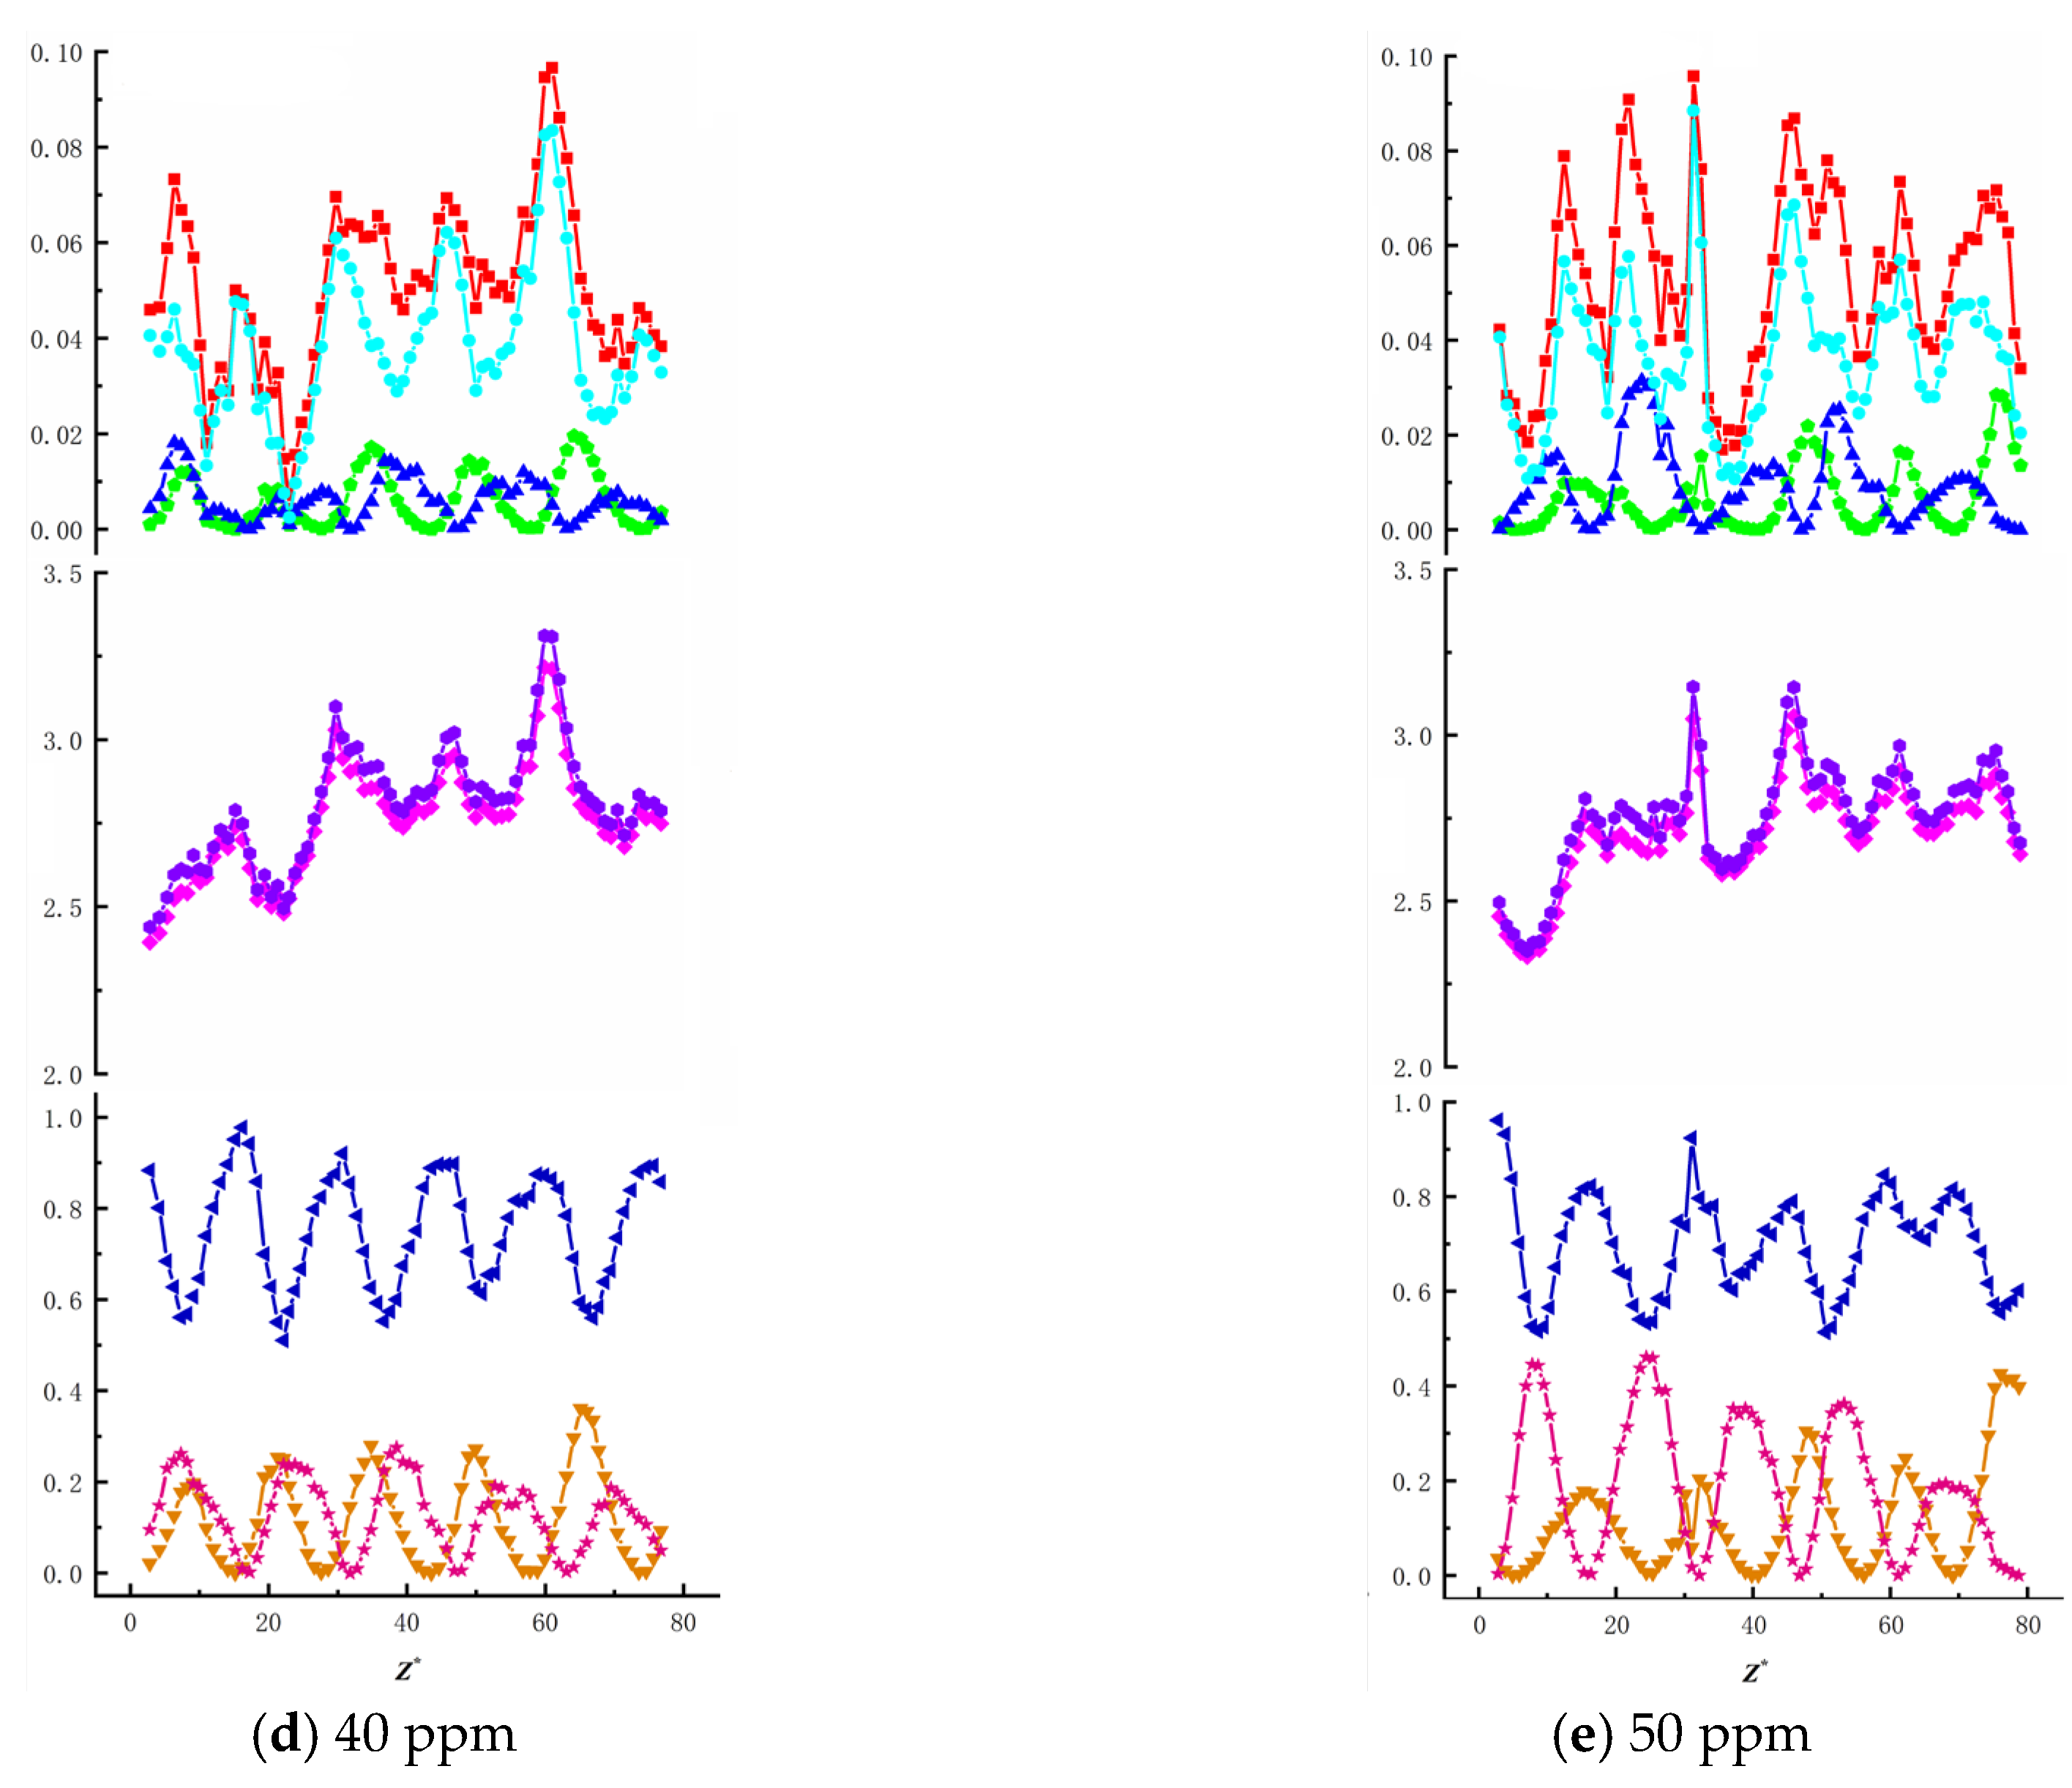
Figure 15 illustrates how the average total kinetic energy of bubbles with different equivalent diameters varies with surfactant concentration. Under identical needle configurations, the average total kinetic energy decreases as the SDS concentration increases, while the Marangoni effect intensifies with higher SDS concentrations. The average total kinetic energy of bubbles generated by different needles decreases by 0.017 μJ, 0.013 μJ, 0.011 μJ, 0.008 μJ and 0.007 μJ, respectively. At the same surfactant concentration, the average total kinetic energy increases with bubble size: at 10–50 ppm concentrations, the energy decrease is 0.026 μJ, 0.025 μJ, 0.022 μJ, 0.021 μJ and 0.016 μJ, respectively. These findings indicate that the total kinetic energy of surfactant bubbles is more susceptible to bubble size variations than other factors, particularly showing a significant influence from wall effects under low-concentration conditions.
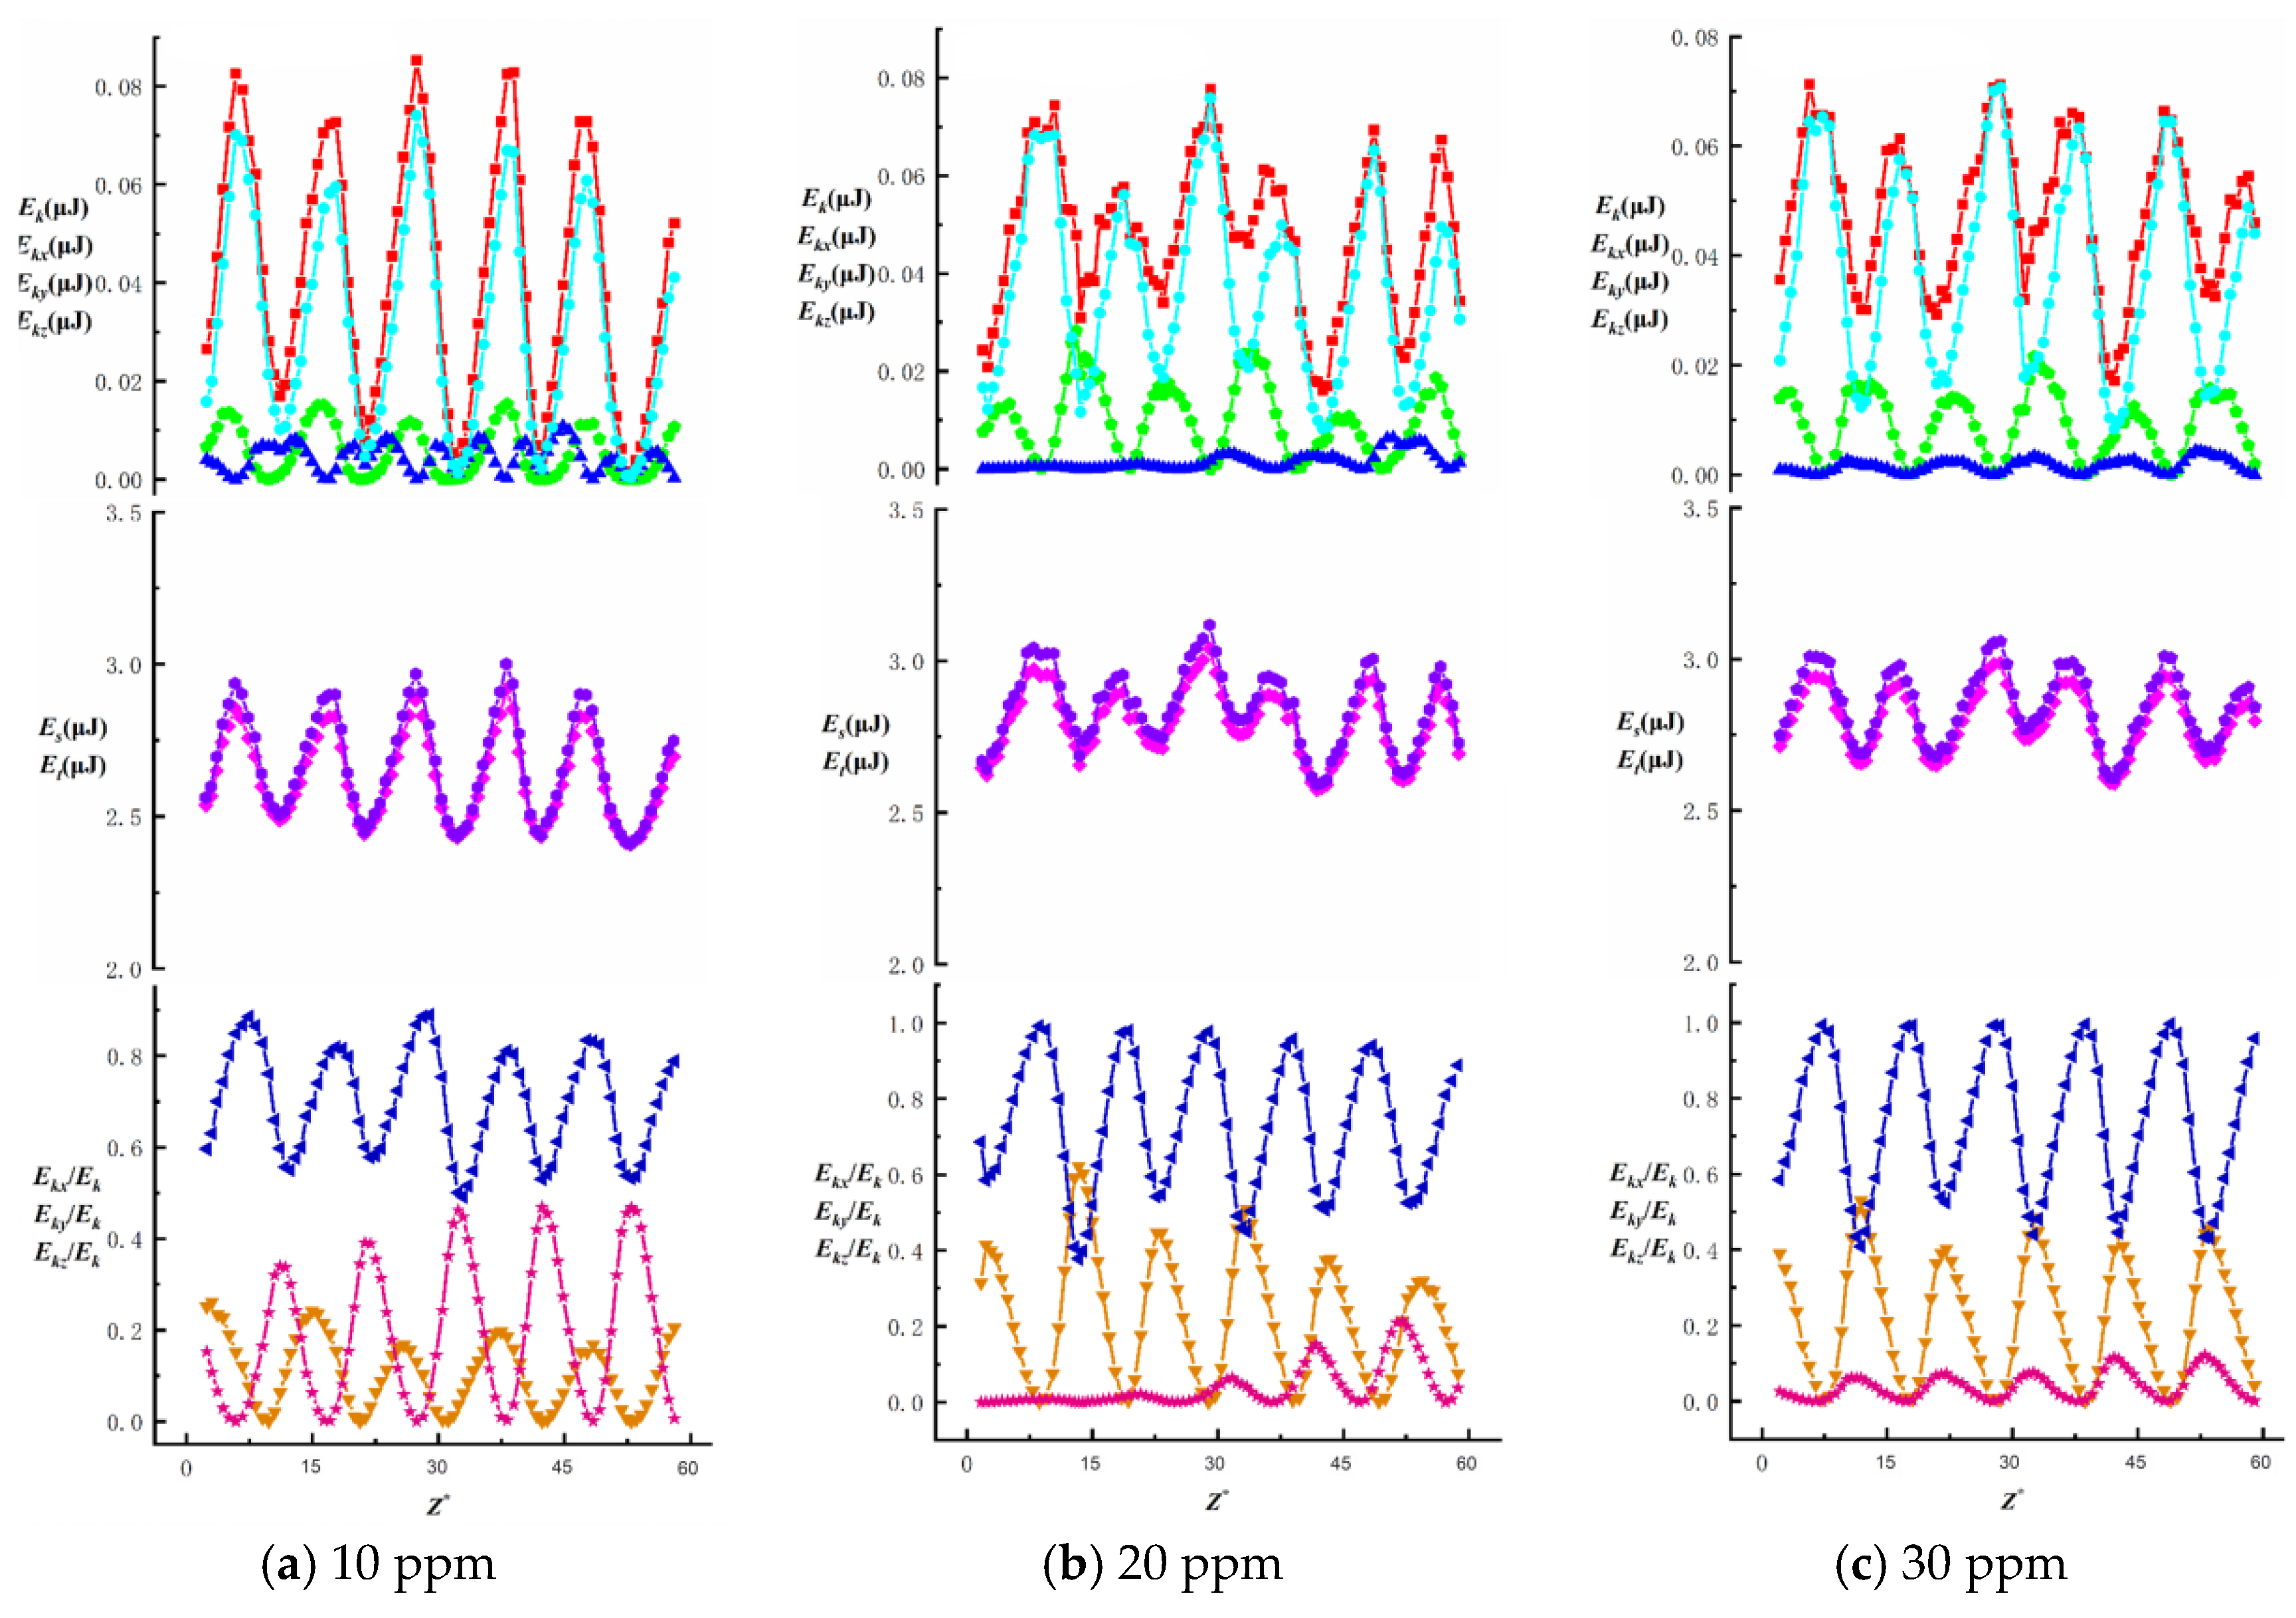
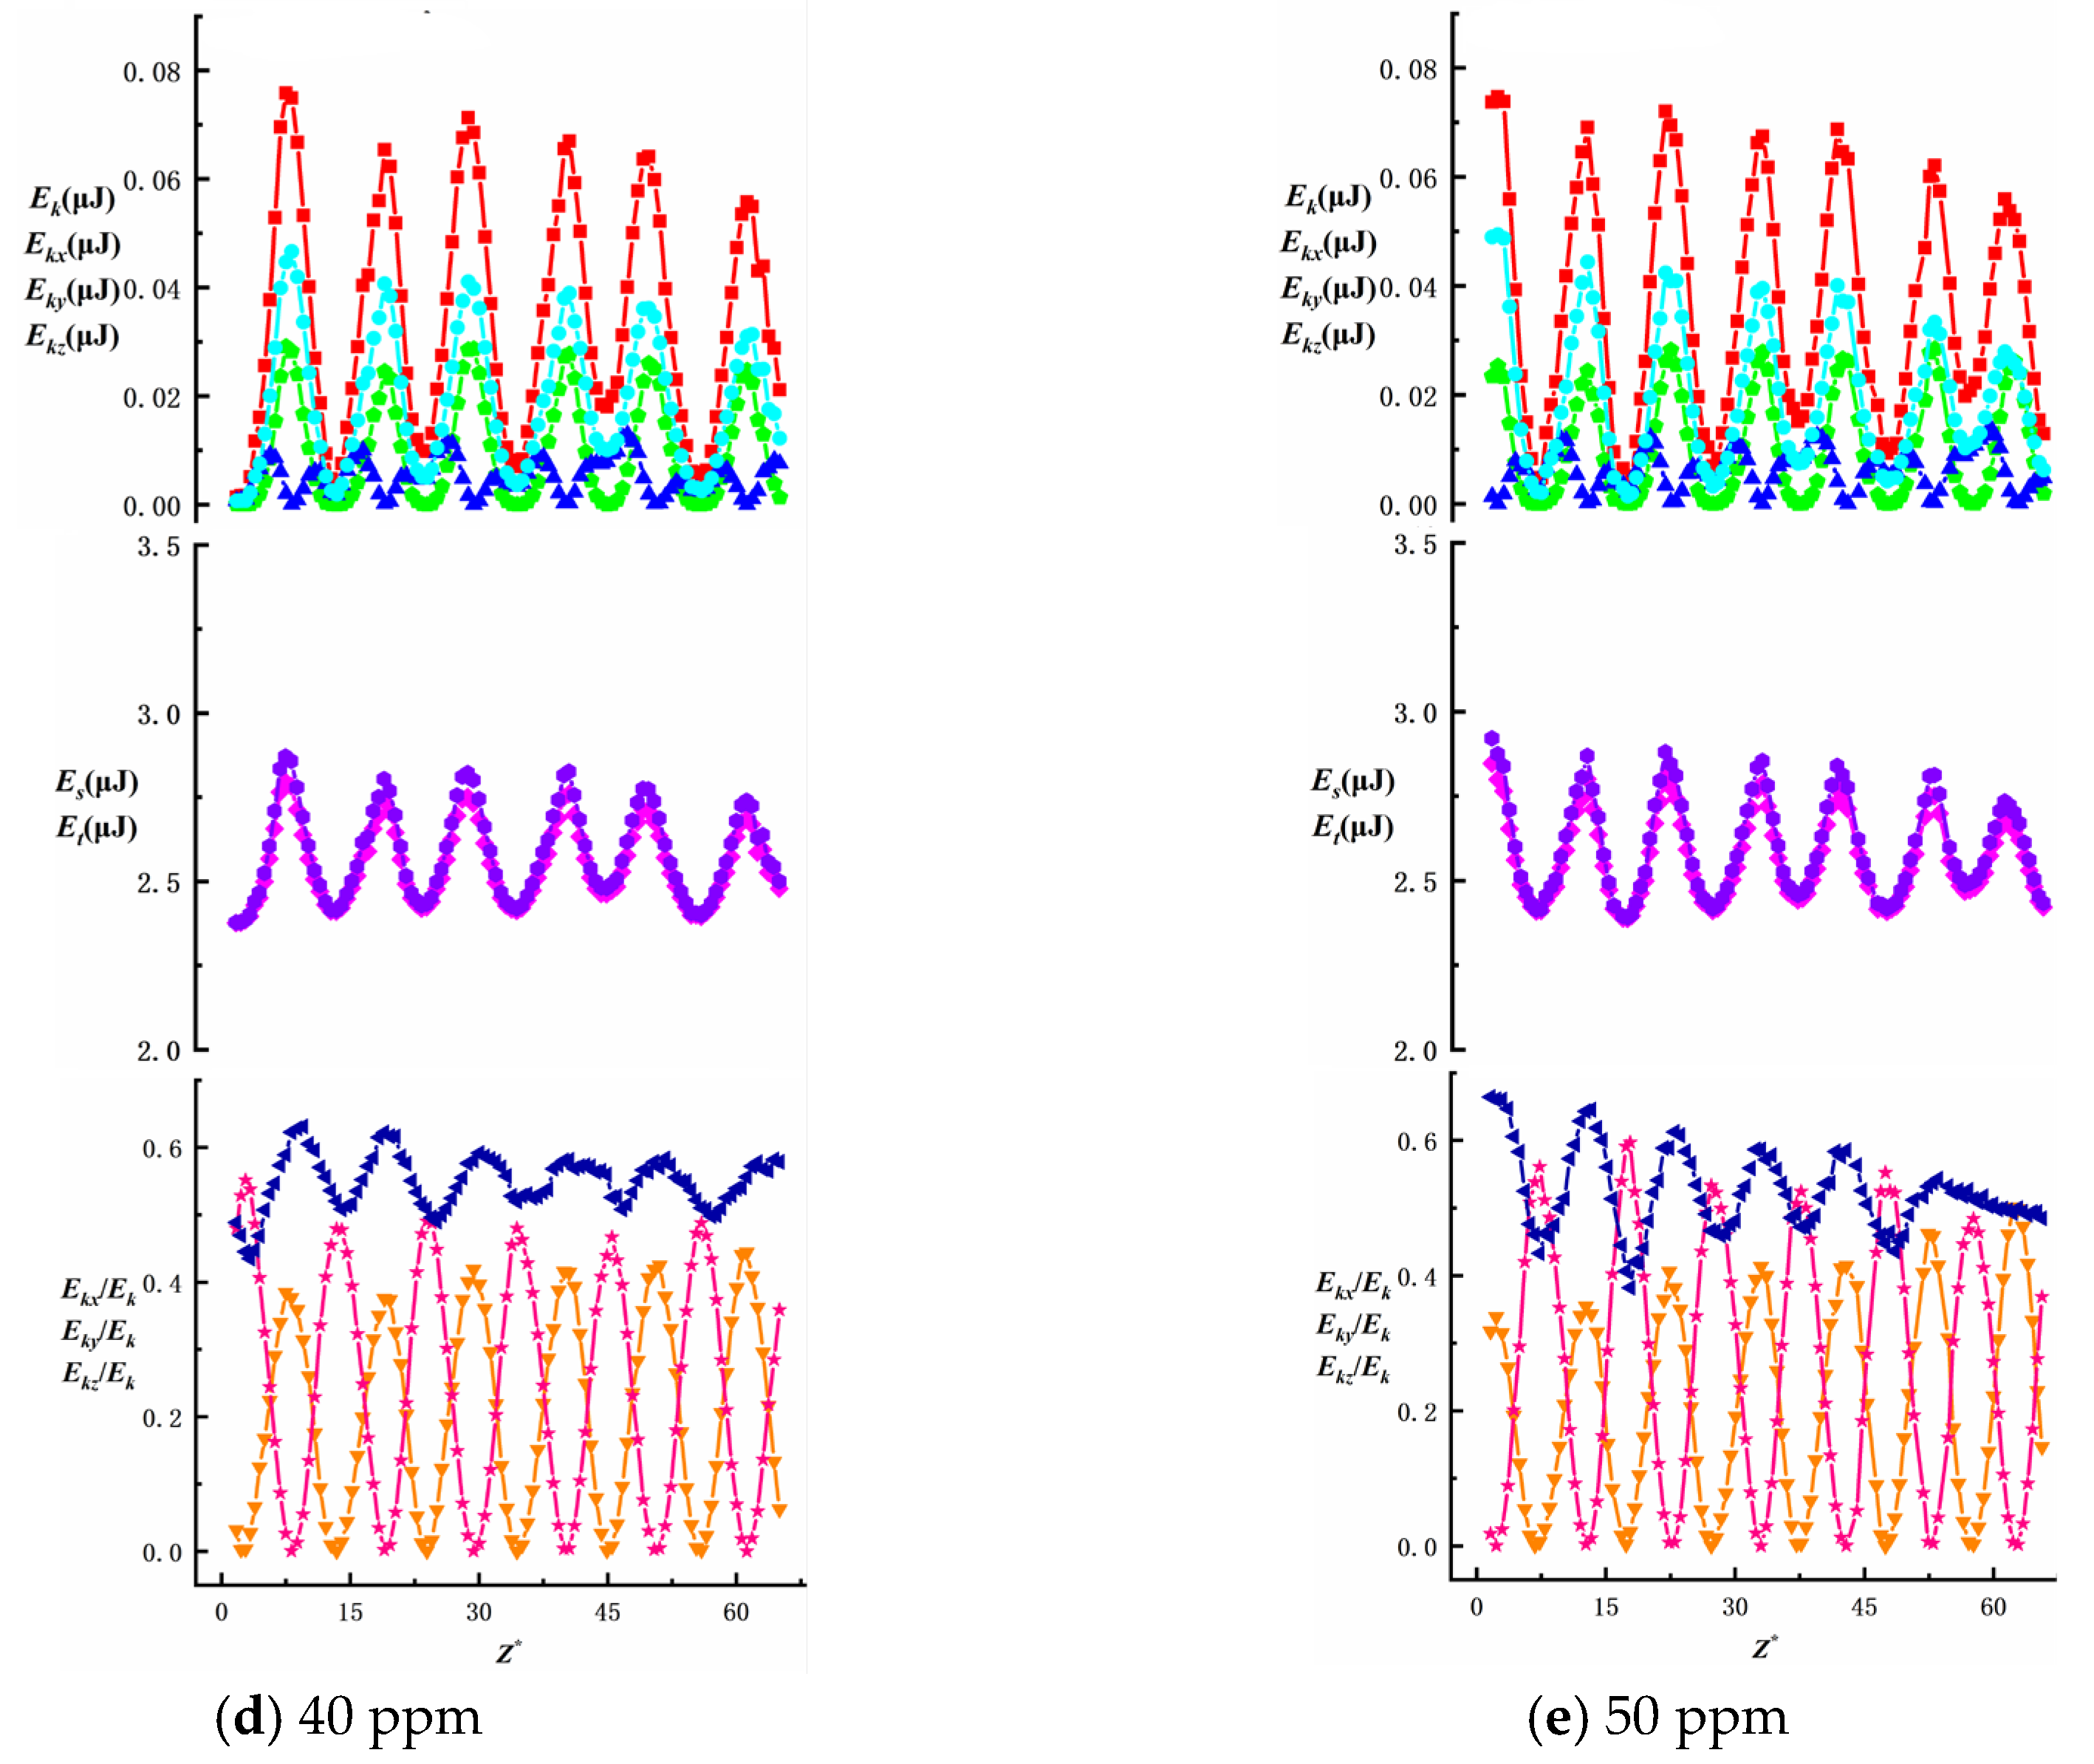
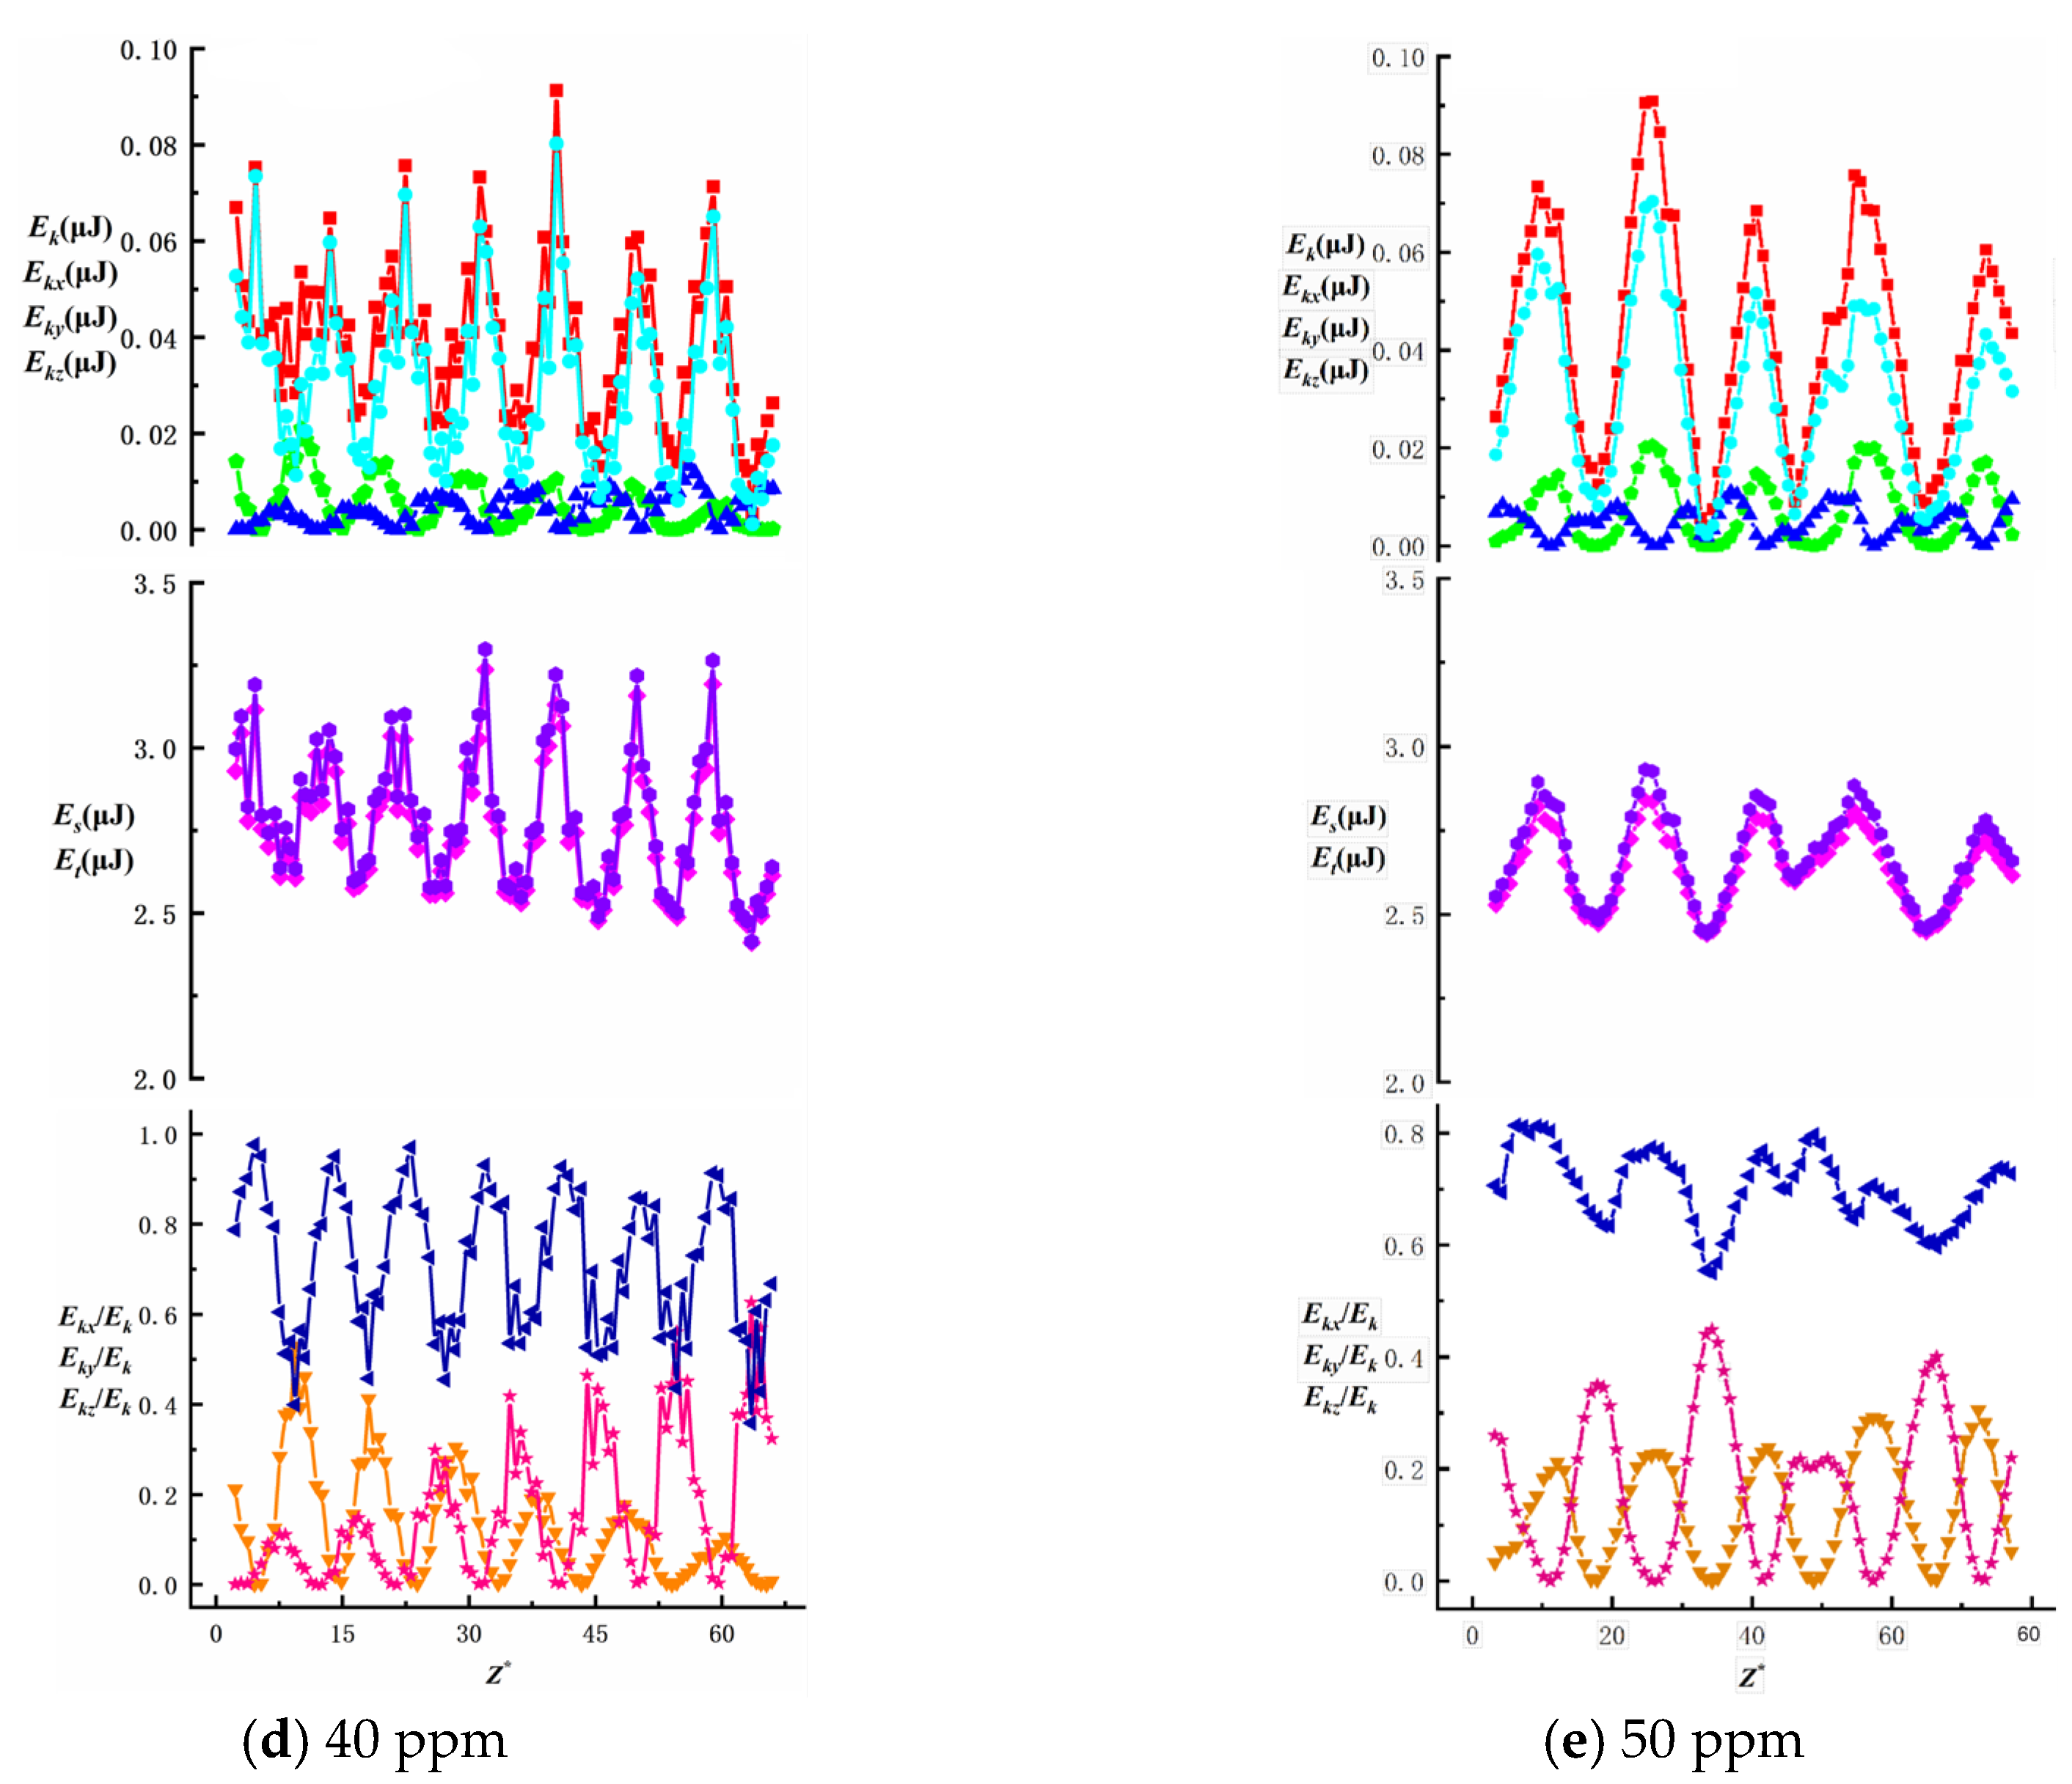
To investigate the effects of surfactant concentration and bubble size on energy changes during bubble ascent in shear flow fields, we present data on total energy variations and surface/kinetic energy ratios, as shown in
Figure 16,
Figure 17,
Figure 18,
Figure 19 and
Figure 20. The first row illustrates the composition patterns of total kinetic energy (
Ek) and its three directional components (
Ekx,
Eky,
Ekz). The second row shows the distribution of total energy and surface energy (
ES,
ET). The third row displays the proportion of kinetic energy components in total energy across different directions (
Ekx/Ek,
Eky/Ek,
Ekz/Ek). The total kinetic energy (
Ek) and its directional components exhibit periodic trends, with smaller needle-generated bubbles showing more pronounced periodicity.
According to Equation (7), the component of
Ek is affected by the bubble velocity in the corresponding direction, so the component of kinetic energy in the vertical direction has the highest proportion and its change trend is similar to that of the total kinetic energy. During bubble ascent, the kinetic energy of bubbles is significantly lower than their surface energy. The vertical kinetic energy component accounts for more than 68.9% of the total kinetic energy on average, while the wall normal and spanwise kinetic energy components account for less, which has little effect on the total kinetic energy. The total energy of the bubble is affected by kinetic energy and surface energy, and changes periodically along the trajectory of the bubble. In this experiment, the kinetic energy of the bubble is much lower than the surface energy of the bubble. In the process of bubble rise, the overall surface energy value of the bubble is stable in the range of 2.3 J ≤
Es ≤ 3.5 J, accounting for a significant proportion of the total energy (bubble surface energy accounts for more than 95.8% of the total energy). Therefore, the change trend of the total energy of the bubble is the same as that of the surface energy, and the influence of the surface energy of the bubble on the total energy is dominant. As the surfactant concentration increases, the proportion of total kinetic energy in the total energy remains unchanged, consistent with the findings of Ju [
33] on bubbles in static liquids. The maximum total kinetic energy E
kmax decreases with an increasing surfactant concentration. However, as the bubble size increases, enhanced wall effects lead to an increase in E
kmax. The Z-directional kinetic energy component accounts for over 70.2% of the total kinetic energy, while the X-directional component decreases markedly, indicating that bubble motion shifts from multidirectional disturbances to primarily vertical ascent with stabilized trajectories. Under low concentrations (10~20 ppm), wall effects and shear disturbances dominate bubble behavior, causing intense energy fluctuations and a significant X-directional kinetic energy component. In high concentrations (40~50 ppm), the Marangoni effect intensifies, with interfacial tension gradients suppressing flow freedom and making bubble surfaces non-slippable. This results in more uniform energy distribution and stable upward motion dominated by Z-directional kinetic energy components.
In addition to the Marangoni effect and geometric constraints imposed by wall surfaces on bubbles, electrostatic interactions may also play a significant role in near-wall bubble dynamics. Sodium dodecyl sulfate (SDS), as an anionic surfactant, adsorbs at the bubble interface to form a negatively charged layer, while similar charge accumulation may occur on channel walls. This interaction between the double electric layers creates electrostatic repulsion between bubbles and the wall. As bubbles approach the wall, the overlapping of interfacial charge layers intensifies, rapidly enhancing the repulsive effect that alters the equilibrium position and trajectory of bubbles. Simultaneously, these interfacial charges may inhibit localized surface slippage, thereby restricting asymmetric deformation and oscillation.
However, this study did not conduct an in-depth quantitative analysis of electrostatic effects due to two primary considerations. First, the SDS concentration range in the current experimental design was below the critical micelle concentration (CMC), resulting in a lower ionic strength system where electrostatic interactions contribute significantly less energy than surface tension and interfacial gradient effects. Second, both high-speed imaging and energy calculations demonstrate that bubble surface energy dominates total energy, masking potential electrostatic effects. Therefore, electrostatic repulsion is considered a secondary mechanism within this research framework without independent analysis. Future investigations incorporating different ionic strengths or wall surface electrochemical properties could further explore their corrective effects on near-wall bubble dynamics.
4. Conclusions
In this study, the dynamic behavior and energy conversion characteristics of contaminated bubbles rising near a vertical wall in a linear shear flow were experimentally investigated. By systematically varying the surfactant (SDS) concentration and bubble size (via different needle nozzles), the effects of wall-induced and shear-induced lift forces, as well as their synergistic interactions, were analyzed from both kinematic and energetic perspectives.
Bubbles exhibited periodic rotational and shape oscillations during ascent. The inclination angle fluctuated symmetrically around the bubble’s farthest and nearest points to the wall, and the presence of the surfactant suppressed the deformation and inclination amplitude. Shape oscillation analysis showed that both (2, 0) and (2, 2) modes increased in frequency with higher SDS concentrations and a smaller bubble size, revealing strong scale dependence and the Marangoni effect.
The wall-normal and spanwise velocity components fluctuated periodically, while the vertical velocity remained relatively steady. An increasing SDS concentration reduced the magnitude and periodicity of these fluctuations, indicating that bubble interfacial rigidity and reduced wall interactions stabilize the trajectory and suppress lateral motion.
Bubble kinetic energy decreased with an increasing surfactant concentration and was more sensitive to bubble size than concentration. Additional mass force coefficients were higher for larger bubbles and fluctuated less under higher SDS concentrations, especially for small bubbles, due to enhanced Marangoni stresses.
Across all cases, surface energy dominated the total energy budget, while kinetic energy—especially in the vertical direction—played a secondary yet significant role. The energy distribution became more uniform and vertically aligned as the surfactant concentration increased, reflecting the transition from three-dimensional motion to stabilized upward movement under strong interfacial constraints.





 ) Es; (
 ) Et; (
 ) Ekx; (
 ) Eky; (●) Ekz; (▼) Ekx/Ek; (
 ) Eky/Ek; (
 ) Ekz/Ek.
 ) Es; (
 ) Et; (
 ) Ekx; (
 ) Eky; (●) Ekz; (▼) Ekx/Ek; (
 ) Eky/Ek; (
 ) Ekz/Ek.
 ) Es; (
 ) Et; (
 ) Ekx; (
 ) Eky; (●) Ekz; (▼) Ekx/Ek; (
 ) Eky/Ek; (
 ) Ekz/Ek.
 ) Es; (
 ) Et; (
 ) Ekx; (
 ) Eky; (●) Ekz; (▼) Ekx/Ek; (
 ) Eky/Ek; (
 ) Ekz/Ek.

 ) Es; (
 ) Et; (
 ) Ekx; (
 ) Eky; (●) Ekz; (▼) Ekx/Ek; (
 ) Eky/Ek; (
 ) Ekz/Ek.
 ) Es; (
 ) Et; (
 ) Ekx; (
 ) Eky; (●) Ekz; (▼) Ekx/Ek; (
 ) Eky/Ek; (
 ) Ekz/Ek.
 ) Es; (
 ) Et; (
 ) Ekx; (
 ) Eky; (●) Ekz; (▼) Ekx/Ek; (
 ) Eky/Ek; (
 ) Ekz/Ek.
 ) Es; (
 ) Et; (
 ) Ekx; (
 ) Eky; (●) Ekz; (▼) Ekx/Ek; (
 ) Eky/Ek; (
 ) Ekz/Ek.
 ) Es; (
 ) Et; (
 ) Ekx; (
 ) Eky; (●) Ekz; (▼) Ekx/Ek; (
 ) Eky/Ek; (
 ) Ekz/Ek.
 ) Es; (
 ) Et; (
 ) Ekx; (
 ) Eky; (●) Ekz; (▼) Ekx/Ek; (
 ) Eky/Ek; (
 ) Ekz/Ek.