Abstract
The suspension arm is a crucial connecting component in the automotive powertrain system, required to withstand various working condition loads, thus necessitating high mechanical performance. With the continuous development of forming processes, the forming method of suspension arms has gradually shifted from traditional gravity casting to squeeze casting. Along with the demand for automotive lightweighting, there is an urgent need for lightweight requirements in suspension arm components. This study employs a multi-condition topology optimization method, incorporating the forming requirements of the squeeze casting process, to conduct lightweight design of a certain mounting bracket. The filling and solidification processes were numerically simulated using Anycasting, followed by mechanical property testing and microstructure analysis of the product. The results revealed that the topology-optimized suspension arm met the strength and stiffness requirements under all working conditions, with a mass reduction of approximately 54.7% compared to the pre-optimized version. Based on the forming process analysis of the suspension arm, the design of its squeeze casting mold was completed. Using AnyCasting software (AnyCasting 6.7), numerical simulations of the filling and solidification processes of the suspension arm were conducted. Combined with theoretical calculations, the forming process parameters for the suspension arm were finally determined as follows: extrusion speed of 15 cm/s-10 cm/s-5 cm/s (multi-stage speed), pouring temperature of 690 °C, mold temperature of 250 °C, extrusion pressure of 81.4 MPa, and holding time of 45 s. Through T6 heat treatment, the tensile strength, yield strength, and elongation after fracture of the suspension arm reached 326.05 MPa, 276.87 MPa, and 9.68%, respectively. Metallographic analysis showed that the eutectic silicon in the T6 heat-treated specimens was primarily spherical in shape, uniformly distributed without significant clustering. The reason for this difference may be that heat treatment affects the boundary dissolution degree of alloying elements. For eutectic Al-Si alloys, the boundary dissolution and diffusion of alloying elements are accelerated, which is beneficial for improving the mechanical properties of the alloy. Finally, in order to quantitatively analyze the microstructural properties of the material after heat treatment, analyses of secondary dendrite arm spacing and porosity were conducted, leading to the conclusion that the microstructure after heat treatment is more uniform and dense.
1. Introduction
The development of lightweight automobiles represents a critical technological pathway for the automotive industry to address energy crises, environmental pollution, and the demand for enhanced performance. The core focus lies in reducing the overall vehicle mass through the optimization of materials, processes, and structures, thereby advancing the evolution of automotive fluidity to achieve energy savings, reduced consumption, and improved power, handling, and safety. As a key component of the automobile powertrain mounting system, the suspension arm necessitates high mechanical performance. The lightweight design of the suspension arm must ensure that advanced structural design technologies are introduced to effectively reduce vehicle weight and enhance energy efficiency and economy, all without compromising safety.
The suspension arm serves as a connecting component within the automotive power suspension bracket assembly, enduring various working conditions. To achieve a lightweight design for the suspension arm, this study employs the topology optimization method, taking into account the diverse working conditions it encounters. Tomlin et al. [1] employed the topology optimization method to conduct a lightweight design of the hinge bracket for the Airbus A320 aircraft. Their investigation revealed that the optimized mass was reduced by 64% compared to the pre-optimization state, while also reducing the maximum stress and maintaining the original stiffness. Dubrovskaya et al. [2] found that after topology optimization, the overall mass of gas turbine engine components was reduced by 50% while maintaining the original performance without degradation. It is evident that topology optimization design has become one of the crucial research methods for the lightweight design of structural components today.
In addressing the multi-condition structural optimization problem of automotive components, a prevalent approach involves transforming multi-objective topology optimization problems into single-objective optimization problems [3,4,5]. This method facilitates the attainment of topology configuration designs that satisfy performance requirements. However, due to the inherent diversity and uncertainty associated with topology optimization results, the generated models cannot be directly implemented in actual production; they necessitate further optimization in alignment with product forming requirements and processing conditions. The forming processes applicable to the mount bracket include forging, low-pressure casting, gravity casting, and squeeze casting, among others. Notably, squeeze casting amalgamates the characteristics of both forging and casting. By applying pressure, the molten metal is sequentially introduced into the cavity and solidified with feeding, resulting in castings characterized by a dense and uniform microstructure, exceptional mechanical properties, and high dimensional accuracy [6]. Choosing squeeze casting for structurally complex components is often a decision that achieves the best overall performance after careful consideration. Simply put, the core reason lies in the fact that, compared to other processes (such as forging, low-pressure casting, and high-pressure casting), squeeze casting perfectly balances “complex structure forming capability” and “excellent mechanical properties,” which are difficult to achieve simultaneously with other single processes. Squeeze casting is characterized by “slow injection and high pressure,” ensuring smooth mold filling to avoid gas entrapment and solidification under high pressure. As a result, it produces complex parts like die casting but without porosity issues, and it can be heat-treated, making it suitable for structural components requiring high toughness and safety (such as new energy vehicle battery pack housings and body structural components). Consequently, the squeeze casting process, recognized for its superior forming capabilities, has found extensive application in the manufacturing of high-performance automotive structural components that demand high forming quality. This process not only ensures the mechanical properties of the components but also effectively reduces their weight, thereby demonstrating considerable advantages in the production of high-performance and lightweight components [7].
This study employs a multi-condition topology optimization method to establish a mathematical model for the topology optimization of the suspension arm structure under various conditions, yielding multi-condition topology optimization results to identify the optimized regions. Subsequently, the optimized topology is integrated with the squeeze casting process to finalize the design of the squeeze casting mold for the suspension arm, culminating in the final design configuration of the bracket. To mitigate and minimize defects during the casting process, filling and solidification simulation analyses are conducted on the suspension arm, accompanied by actual production validation to ascertain the final design parameters for the squeeze casting process. Finally, mechanical performance testing and microstructure analysis are performed on the resulting suspension arm component.
2. Multi-Condition Topology Optimization Method
Considering that multi-condition topology optimization design necessitates addressing various factors such as design space, load types, working conditions, and manufacturing requirements, it is crucial to effectively resolve multi-condition optimization problems for achieving optimal designs of automotive parts, which often operate under diverse conditions. Jiang et al. [8] modeled process planning as an optimization problem constrained by partial differential equations (PDEs), utilizing characteristic moments as design variables and deriving a continuous optimization model through density-based topology optimization. Liu et al. [9] compared the mechanical properties of hollow spherical joints under both single-condition and multi-condition topology optimization, fabricating the optimized joints via additive manufacturing to produce novel-shaped, lightweight components. Gunantara [10] identified that the objective subfunctions of the same attribute were linearly weighted using a scalarization method, effectively addressing the objective function challenges in multi-condition optimization. The aforementioned research underscores the significance of defining the objective function and allocating weighting coefficients when tackling multi-condition problems, particularly in the design of automotive components functioning under varying conditions.
2.1. Multi-Objective Topology Optimization Mathematical Model
In multi-condition topology optimization, each individual condition corresponds to an objective function, resulting in a multi-objective optimization problem. Generally, different objective functions yield distinct optimal solutions, which may be unrelated or even contradictory. To identify an overall optimal solution, it is essential to employ mathematical methods to construct a unified objective function, referred to as an evaluation function. This function integrates the optimization requirements across various conditions, thereby transforming the originally independent conditions of topology optimization into an equivalent single-condition topology optimization problem [11].
The linear weighting method combines multiple objectives into a comprehensive objective through linear combination, requiring that different objectives be comparable, i.e., on the same scale or measurement, meaning that multiple objectives share the same attribute (e.g., cost, time, etc., with common physical units or measurement methods) [12]. Therefore, the linear weighting method not only meets the requirements of multi-objective optimization but also simplifies the calculation process, making it highly suitable for scenarios where objectives share the same attribute. The basic principle involves assigning corresponding weight coefficients to each objective function and then combining the weighted single-objective functions in a linear relationship. Its general mathematical model is [13]:
In the formula, ρ represents the specific variable; n denotes the number of objectives; ωi signifies the weight of the second objective.
This study employs a mathematical model based on the variable density method to conduct multi-condition topology optimization for the mounting bracket. The variable density method boasts high computational efficiency and can effectively handle complex structures in engineering problems. Based on the variable density method, with the relative density of elements as the design variable and the volume ratio as the constraint condition, a multi-condition topology optimization mathematical model is constructed with the minimum compliance of the mounting bracket as the objective, combined with the linear weighting method [14]:
In the equation, n is the number of load cases; is the design variable (relative density); is the total structural compliance; is the structural displacement of the ith load case; is the total displacement vector; K is the global stiffness matrix; F is the load vector applied to the structure; is the upper limit of the volume of the optimized model; V is the total volume of the pre-optimization model; f is the retention ratio of the total volume of the optimized model; is the weight coefficient of the ith load case; is the lower limit of the relative density of the element; is the relative density of the eth element; in the multi-load case topology optimization in this paper, the number of load cases n = 6.
2.2. Calculation of Multi-Condition Weight Coefficients Based on Analytic Hierarchy Process
As indicated by the mathematical model of multi-condition topology optimization, the rational allocation of weight factors directly influences the accuracy and practicality of the optimization results [15]. Therefore, this study introduces the Analytic Hierarchy Process to determine the weight factors for each condition, ensuring a comprehensive balance of multi-condition requirements.
When constructing the structural model of the Analytic Hierarchy Process, relevant factors should be appropriately categorized into corresponding levels and their relationships should be visually represented through a hierarchical structure diagram. Factors at the same level are subordinate to or influence the factors at the higher level, while also determining or being constrained by the factors at the lower level. Based on the relationships between the decision objective, decision criteria, and alternative options, the Analytic Hierarchy Process typically divides the entire decision-making process into three main levels: the goal level, which represents the ultimate decision objective to be achieved; the criteria level, which serves as the evaluation standards for comparing the merits of the options; and the alternatives level, which consists of the specific options available for selection.
This study employs the Analytic Hierarchy Process (AHP) to assess the importance of different working conditions. The objective layer is the importance of working conditions, the criterion layer includes maximum deformation, maximum principal stress, and von Mises stress, and the scheme layer consists of six working conditions: full throttle acceleration, frontal collision, forward braking, rear collision, forward left turn, and forward right turn. For ease of observation, the six working conditions are subsequently numbered as case 1 to case 6, with the specific hierarchical analysis model illustrated in Figure 1.

Figure 1.
Hierarchical analysis model of the importance of working conditions.
The Analytic Hierarchy Process requires determining the importance ratio between each pair of working conditions (), constructing a judgment matrix (A), and setting the weight coefficient value () for each sub-condition.
In the formula: n is the number of operating conditions; is the weight value of the ith operating condition; is the importance level of operating condition relative to operating condition .
The scaling criteria for judging matrix element are shown in Table 1.

Table 1.
Scale Judgment Criteria.
In the hierarchical analysis model, to avoid significant errors in the eigenvalues and eigenvectors of the judgment matrix due to inconsistent importance judgments across various working conditions, a consistency index should be used to assess the consistency of the judgment matrix.
In the formula: is the consistency index; is the maximum eigenvalue of the matrix; n is the number of working conditions, i.e., the order of the matrix; is the correction value. When the consistency ratio < 0.1, it is considered that the degree of inconsistency is within the acceptable range, indicating satisfactory consistency, and the consistency test is passed. The relationship between and the order n of the judgment matrix is shown in Table 2 [15].

Table 2.
Coherence indicator table.
Conduct multi-condition weight coefficient calculations for the six operating conditions of the suspended arm. Assume the target layer is denoted as M, the criterion layer as B, where the maximum deformation is denoted as B1, the maximum principal stress as B2, and the von Mises stress as B3. The scheme layer is denoted as C, where full throttle acceleration is denoted as C1, frontal impact as C2, forward braking as C3, rear impact as C4, forward left turn as C5, and forward right turn as C6. Based on design experience, by comparing the importance of elements between layers, establish judgment matrices for the first layer to the second layer and the second layer to the third layer, as shown in Figure 2.
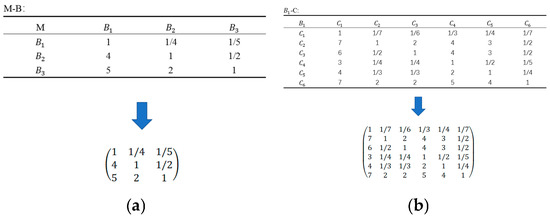
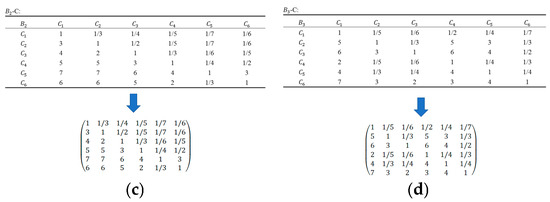
Figure 2.
Creation of judgment matrices (a) M-B Judgment Matrix (b) - Judgment Matrix (c) - Judgment Matrix (d) - Judgment Matrix.
Through solving, the eigenvalues, eigenvectors, and CR values of the aforementioned judgment matrix were obtained. It is generally accepted that if the consistency ratio index CR value is less than 0.1, the inconsistency level of the judgment matrix is within the acceptable range, meaning it has passed the consistency test. The specific solving results are shown in Table 3.

Table 3.
Solution Results.
By multiplying the M-B and B-C vector matrices, the corresponding weight values can be obtained. and . Finally, the weight coefficients for various working conditions are approximated to two decimal places, as shown in Table 4.

Table 4.
Multi-condition weighting coefficients.
2.3. Structural Optimization Analysis of the Suspension Arm
Based on the ductile iron suspension arm model (with overall dimensions of approximately 150 mm × 120 mm × 55 mm), a maximum material model of the aluminum alloy suspension arm (with overall dimensions of approximately 160 mm × 130 mm × 65 mm) was established, retaining the original assembly relationships and features. This model was then imported into HyperMesh for meshing, with a mesh size of 2 mm. The material used for the suspension arm is A356.2 aluminum alloy, which has a density of 2700 kg/m3, an elastic modulus of 72.4 GPa, and a Poisson’s ratio of 0.33. The suspension arm is primarily installed between the gearbox and the body shell via bolt connections. In the pre-processing stage, the bottom of the suspension arm is linked to the flange surface using REB2 units at a single point, with the six degrees of freedom at this point constrained to ensure the suspension arm does not move during loading. In practical use, the suspension arm mainly bears longitudinal, lateral, and vertical loads (loading conditions are detailed in Table 5). Since the connecting arm of the suspension arm is assembled with a metal sleeve and the arm is vulcanized to the side bracket, the loads transmitted to the suspension arm act on the connecting arm. Therefore, the lower side of the connecting arm is directly designated as the loading area.

Table 5.
Loading conditions of the suspension arm.
Open the TCL script editor, input the edited multi-condition topology optimization objective function for the suspension arm into the HyperMesh software (HyperMesh 2022), and begin creating the multi-condition topology optimization task for the suspension arm. In the response settings, establish load steps for six conditions, and sequentially assign the weight coefficients calculated through the Analytic Hierarchy Process in the previous section from one to six to each condition. Based on the design requirements of the suspension arm, to ensure sufficient design space to meet the needs of the forming process, and in combination with the practical engineering experience of the enterprise, set the volume optimization fraction to 30% (i.e., the ratio of the post-optimization volume to the pre-optimization volume ≤ 0.3). Additionally, to ensure that the optimized structure meets the strength requirements, set the maximum equivalent stress constraint to 250 MPa.
After completing the parameter configuration and boundary condition definition for the multi-condition topology optimization task of the suspension arm, the iterative calculation process was formally initiated based on the OptiStruct solver. The entire optimization process employed an optimization algorithm based on the optimality criterion method, achieving the topology optimization of the suspension arm structure through the dynamic evolution of the material density field. The optimization results showed that after 24 iterations, the total weighted compliance gradually decreased from the initial value of 16,789.7 N/mm to 6923.05 N/mm. However, at the 16th iteration, the weighted compliance rebounded to 7760.62 N/mm; subsequently, at the 21st iteration, the weighted compliance rose again to 8073.99 N/mm. Although there were two minor fluctuations, the overall downward trend of the compliance curve aligns with the optimization objectives for the entire topology optimization process. The small fluctuations observed in the later stages are considered “normal oscillations” before convergence, which may result from the algorithm’s need to balance the objective function (compliance) with the constraints. Ultimately, as the iteration proceeded, the weighted compliance gradually converged to 8007.14 N/mm, concluding the iteration process. The iteration curve of the weighted compliance is illustrated in Figure 3.
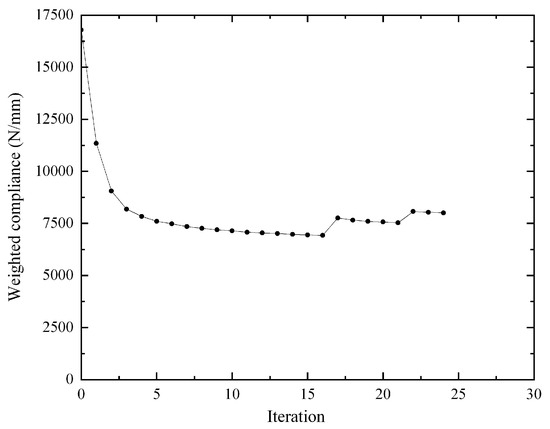
Figure 3.
Weighted compliance iteration curve.
After the iterative computation is completed, set the element density threshold to 0.3 in the HyperMesh post-processing, where parts with an element density threshold less than 0.3 are deleted, and parts greater than 0.3 are retained. On this basis, the optimized model is reconstructed using the OSsmooth function in OptiStruct. Figure 4 show the results after OSsmooth reconstruction, where the yellow areas represent the regions recommended for deletion, and the grey areas represent the regions not recommended for deletion. Through analysis, it is evident that the front and side of the suspension arm have fewer grey areas, while the yellow areas are larger and more continuous, indicating significant material redundancy in these regions. Most of the gray areas are concentrated near the holes, while the remaining gray areas are distributed within the interior of the suspension arm. The elements in these regions play a crucial role in the structural integrity of the suspension arm, and therefore should be retained in the subsequent lightweight design.
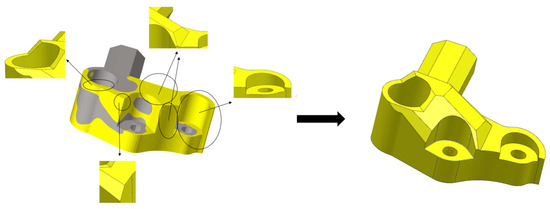
Figure 4.
Topology optimization design results of the suspension arm under multiple working conditions.
3. Design of Squeeze Casting Process for Suspension Arm
3.1. Squeeze Casting Process Design
When conducting the lightweight design of the suspension arm, it is also necessary to comprehensively consider its structural function, forming process, and manufacturing requirements. In the aforementioned multi-condition topology optimization process, the preliminary design model of the suspension arm has been determined. Next, the lightweight design will be further carried out in combination with the requirements of the squeeze casting process design and the product usage function. The suspension arm adopts the squeeze casting process. Considering the demolding requirements, the suspension arm is designed as a unidirectional draft structure (as shown in Figure 5).
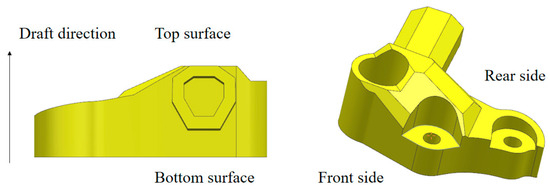
Figure 5.
Schematic diagram of draft direction for suspension arm.
Figure 6 illustrates the design of the squeeze casting process. According to the process requirements (as indicated in the marked area of Figure 6a), the draft angle is set to 5°, and the boss is subjected to a smoothing treatment. To ensure smooth filling of the mold cavity with molten metal, a feeding design was implemented in the front area of the suspension arm to create a smooth diversion path (as shown in Figure 6b). Since the bolt hole is a non-design domain and is mostly surrounded by gray areas, no material reduction is performed near the frustum of the suspension arm. Considering the impact of unidirectional demolding, according to the product design requirements, a quadrilateral slot is adopted on the bottom surface to facilitate the arrangement of ejector pins, which not only ensures wall thickness but also promotes flow and prevents hot spots during the solidification process (as shown in Figure 6c).
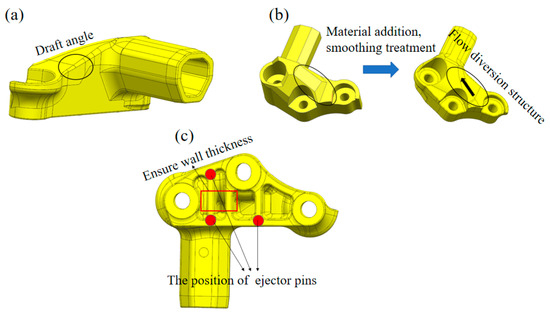
Figure 6.
The design suspension arm squeeze casting process. (a) The design draft angle; (b) The design of boss and flow diversion structure; (c) the design of Bottom quadrilateral slot.
After multi-condition topology optimization and extrusion casting process optimization design, the final model of suspension arm is shown in Figure 7. The original aluminum alloy suspension arm weighs 2.01 kg. The established maximum material design model for the aluminum alloy has a mass of 1.21 kg. After multi-condition topology optimization analysis and extrusion casting process design, the optimized suspension arm has dimensions of approximately 152 mm × 125 mm × 60 mm, with a minimum wall thickness of about 4.9 mm. The mass after optimization is 0.91 kg, representing a 54.7% reduction compared to the original ductile iron suspension arm, demonstrating significant lightweight design effects while meeting the overall product design requirements. Considering the moderate size of suspension arm casting, a one-mold-two-pieces process design is adopted to improve the production efficiency of the castings. In the gating system design, the sprue is directly positioned at the midpoint between the thick-walled ends of the two castings. Feeding from the midpoint ensures that the molten aluminum first enters the larger volume areas before flowing to other regions, which not only benefits the uniformity of the overall filling process of the casting but also facilitates pressure holding and feeding. In the venting system design, the overflow channels are placed at the areas where the casting is last filled and venting is inefficient, preventing phenomena such as vortex formation and air entrapment.
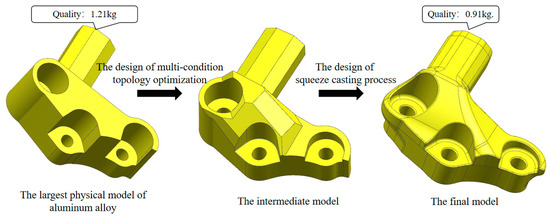
Figure 7.
The final model of suspension arm.
3.2. Structure and Process Analysis of Suspension Arm
After completing the structural optimization of the suspension arm model, perform a finite element verification under the same working conditions. Using A356.2 aluminum alloy, the product performance requirements specify that the strength of the suspension arm must meet the criterion that the maximum von Mises stress should be lower than the yield strength of the product material, i.e., 250 MPa; the strain of the suspension arm should be less than 1%, meaning the maximum permanent deformation should be less than 0.5 mm.
The research indicates that the maximum displacements of the aluminum alloy suspension arm under conditions 1 to 6 before optimization were 0.147 mm, 0.263 mm, 0.288 mm, 0.237 mm, 0.168 mm, and 0.161 mm, respectively. After optimization, the maximum displacements of the aluminum alloy suspension arm under conditions 1 to 6 were 0.111 mm, 0.123 mm, 0.11 mm, 0.09 mm, 0.082 mm, and 0.078 mm, respectively. Compared to pre-optimization, the displacements for conditions 1 to 6 all decreased post-optimization, with the extent of reduction as shown in Figure 8. It was observed that the maximum displacements under each condition decreased after optimization, indicating a significant improvement in the structural stiffness of the optimized design.
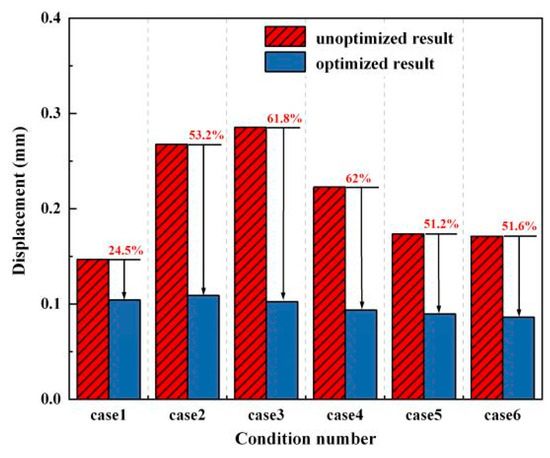
Figure 8.
The unoptimized and optimized maximum displacement curve diagram.
By analyzing the unoptimized and optimized von mises stress diagram (Figure 9), it was found that the maximum stress values for cases 1 to 6 before optimization were 129.7 MPa, 164.7 MPa, 142.5 MPa, 179.8 MPa, 120.9 MPa, and 117.9 MPa, respectively. The stress distribution on the suspension arm was uneven, with most stress values being low, indicating material redundancy in the structure. The maximum stress concentration occurred at the bolt holes in condition three and the connection between the bracket and the main body. After optimization, the stress values were 145 MPa, 186.3 MPa, 191.5 MPa, 189.9 MPa, 135.7 MPa, and 130.6 MPa, respectively. The overall stress distribution was significantly improved, and the stress concentration at the connections was essentially eliminated.
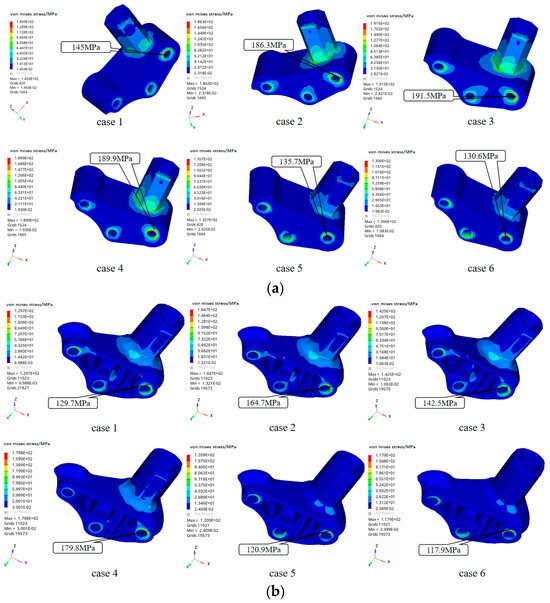
Figure 9.
Comparison of von mises stress cloud diagrams for suspension arm. (a) Unoptimized von mises stress distribution cloud map. (b) Optimized von mises stress distribution cloud map.
4. Structural Design of Suspension Arm Squeeze Casting Mold
4.1. Material Selection
In this study, A356 aluminum alloy was selected as the casting material for the suspension arm. A356 alloy is a typical lightweight alloy characterized by low density and high strength, offering excellent fluidity, plasticity, and corrosion resistance. With appropriate heat treatment, the yield strength of this alloy can exceed twice that of binary alloys with the same silicon content [16]. Additionally, A356 aluminum alloy boasts superior casting properties, performing well in the mold filling process of complex structural areas. This material selection not only enhances the overall forming quality of the suspension arm but also provides a strong guarantee for the improvement of its mechanical properties.
4.2. Structural Dimension Drawing
The overall shape and dimensions are as shown in the figure. The product features a non-axisymmetric structure, with an outline dimension of 163 mm × 139 mm × 63 mm. Figure 10 illustrates the dimensions of the suspension arm, and Figure 11 presents the three-dimensional view of the suspension arm.
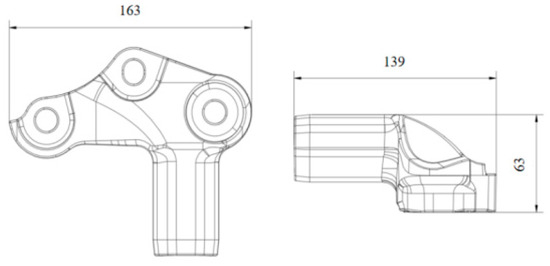
Figure 10.
The dimensional drawing of the suspension arm.
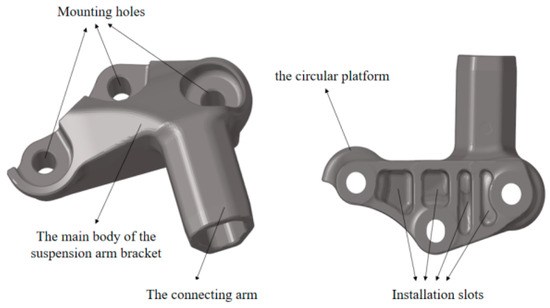
Figure 11.
The three-dimensional diagram of the suspension arm.
4.3. Mold Designing
Based on the comprehensive principles of parting surface design and the structural characteristics of the suspension arm, the parting method shown in Figure 12 was designed. The area marked as A in the figure indicates the parting line, where the yellow part represents the fixed die and the blue part represents the movable die.
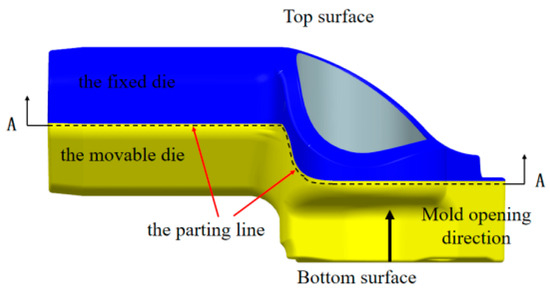
Figure 12.
Design of the parting surface for the suspension arm.
To ensure the smooth filling process of the casting and to avoid defects such as air entrapment, the runner was directly opened in the middle area between the thick walls of the two castings, facilitating the orderly and stable transfer of pressure. To ensure that the molten metal can uniformly and orderly fill the entire mold cavity, especially the thicker sections of the casting, four ingates were designed, each connected to the main body of the suspension arm. By pouring from the central position, the aluminum melt can preferentially fill the thicker and larger areas of the casting, then flow to the central region, and finally fill the thin-walled areas. Considering the size and mass of suspension arm, the runner connection is extended to the thick and large areas of the casting. To ensure smooth metal liquid replenishment and meet the forming requirements of the casting, the diameter of the biscuit in the pressure chamber is set to Φ90 mm, and the overall thickness is set to 35 mm. The overflow channels of the suspension arm are designed at the end of the metal liquid filling, the connecting arm, and the circular platform to optimize venting and filling effects. Taking into account the practical production experience of aluminum alloy squeeze casting, the gating system is designed as shown in Figure 13.
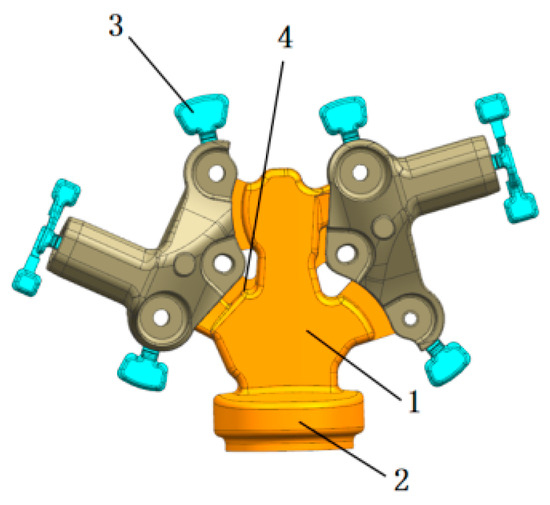
Figure 13.
Design of the suspension arm gating system. 1—runner connection; 2—biscuit; 3—overflow channel; 4—ingate.
The horizontal squeeze casting suspension arm mold mainly consists of a movable die, a fixed die, and various mechanisms such as core pulling, positioning, and ejection, as illustrated in Figure 14. This study adopts a mold structure with two cavities to ensure thorough pouring of the mount bracket, and the mold material used is alloy steel SKD61. The operational process of the mold is divided into two steps: open mold action and close mold action. During the mold closing process, the movable die 5 approaches the fixed die 8 driven by the equipment, during which the mold cavity gradually forms, providing space for the injection and filling of the aluminum melt. As the movable die and fixed die approach each other, the core pulling cylinder drives the core into the mold cavity. When the movable die and fixed die are completely closed, the mold cavity is locked, forming a sealed state. At this moment, the pre-melted aluminum liquid is injected into the mold cavity through the gating system under pressure. Since this design adopts a one-mold-two-cavity configuration, the aluminum liquid can simultaneously fill the cavities of two suspension arm castings, ensuring synchronized product formation. Within the cavity, the aluminum liquid gradually cools and solidifies, ultimately completing the formation of the suspension arm castings.
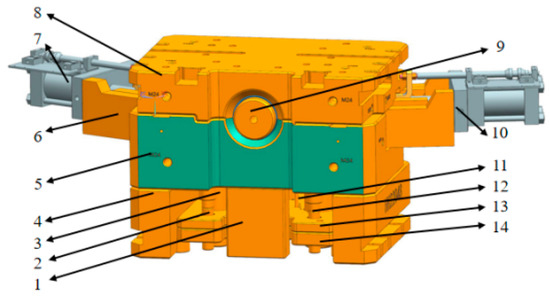
Figure 14.
The suspension arm mold structure diagram. 1—spacer block; 2—guide pin 1; 3—support pillar; 4—spacer block; 5—movable die; 6—cylinder connecting block; 7—core pulling cylinder; 8—fixed die; 9—biscuit core; 10—cylinder fixing block; 11—ejector pin; 12—guide pin 2; 13—retaining plate; 14—stripper plate.
Entering the mold opening stage, first, the core-pulling cylinder reverses its action, driving the core to gradually withdraw from the mold cavity, preparing for the separation of the casting from the mold. The mold opening process is exactly opposite to the mold closing process, with the mold cavity gradually opening. The support pin 3, guide pin 2, and guide pin 12 sequentially drive the movement of the ejector plate, and the movable die and the fixed die subsequently separate. After the mold cavity is fully opened, the ejector pin 11 ejects the casting from the movable die 5. The entire ejection process is smooth and precise, avoiding any damage to the surface and structure of the casting. After the casting is ejected, the robotic arm enters the movable die area, precisely grasps the casting, and then transfers it to the designated cooling zone. Once the robotic arm has completed the removal of the casting, the interior of the mold cavity is cleaned to remove residual debris and adhered casting material. Simultaneously, a release agent is sprayed to prepare for the next work cycle.
5. Numerical Simulation Analysis of the Suspension Arm
5.1. Process Parameter Setting
- (1)
- Mold temperature
The mold temperature refers to the working temperature of the mold when it reaches thermal equilibrium. Generally, when the mold temperature exceeds 300 °C, its lifespan will be significantly shortened, and defects such as bubbles and sticking films are prone to appear on the surface of the casting. Considering the actual production and the suitable mold temperature range for the release agent, this study designs the mold temperature to be 250 °C in the suspension arm squeeze casting process.
- (2)
- Casting temperature.
The liquidus temperature of the A356 aluminum alloy selected for the suspension arm bracket is 615 °C. According to the characteristics of aluminum alloys, a reasonable pouring temperature should be maintained within a range of 50 °C to 100 °C above the liquidus temperature. Therefore, it can be deduced that the reasonable range for the pouring temperature of A356 aluminum alloy should be 665 °C to 715 °C. Considering the actual conditions of on-site production, this study selected three different pouring temperatures for analysis, namely 670 °C, 690 °C, and 710 °C.
The Residual Melt Modulus Method is an analytical approach based on predicting the distribution of residual melt in castings. It assesses the probability of defects in castings by evaluating the ratio of residual melt volume to surface area. When the residual melt regions within a casting are small and evenly distributed, it indicates that the molten metal can effectively fill the mold cavity during solidification, resulting in a lower probability of shrinkage porosity and shrinkage cavities. Conversely, if the residual melt modulus is large, it suggests the presence of numerous and concentrated isolated melt regions, thereby increasing the risk of defects. The formula for calculating the residual melt modulus is [17]:
In the formula, m represents the residual melt modulus; V denotes the residual melt volume; S stands for the residual melt surface area.
Note: Considering that the residual melt during the pouring process approximates a spherical surface, for the convenience of measuring the surface area of the residual melt, it is approximated as a sphere. Therefore, the surface area of the residual melt is calculated as such (S = 4πr2), where r represents the radius of the residual melt.
By comparing the residual melt modulus at different pouring temperatures, the relationship between pouring temperature and casting defects can be clearly identified. As shown in the residual melt modulus simulation analysis diagram in Figure 15, at temperatures of 680 °C, 690 °C, and 710 °C, the residual melt moduli are 0.2226 cm, 0.1034 cm, and 0.2044 cm, respectively. The optimal pouring temperature is ultimately determined to be 690 °C.

Figure 15.
Comparative diagram of residual melt modulus.
- (3)
- Extruder specific pressure
By calculating the required clamping force, injection force, and ejection force for the suspension arm casting, the performance parameter requirements of the squeeze casting machine used for producing the suspension arm are shown in Table 6. Furthermore, the calculated extrusion pressure ratio is 81.4 MPa.

Table 6.
Performance parameter requirements for squeeze casting machines.
- (4)
- Pressure holding time
To ensure that all parts of the casting are adequately compensated for the volume changes caused by shrinkage, the holding time of the squeeze casting process is set to 45 s based on the actual production conditions and process requirements.
5.2. Filling Process Analysis
The selection of filling speed requires comprehensive consideration of the characteristics of the molten metal, mold design, casting geometry, and process requirements. A lower filling speed can reduce defects such as turbulence and gas entrapment, enhancing the compactness of the casting, but it results in a longer filling time. A higher filling speed can accelerate the filling process and refine the microstructure, but it may cause issues like vortexes, cold shuts, and mold erosion. Proper control of the filling speed is a crucial aspect of optimizing the squeeze casting process. It is usually necessary to determine the optimal value through experiments or numerical simulations to achieve a balance between filling efficiency and casting quality.
The suspension arm has a smaller size and uneven wall thickness, making it impossible to ensure the forming quality of the casting with a single filling speed. Therefore, based on the actual production punch speed, to optimize the filling process of the molten metal and improve the casting quality, this study adopts a multi-stage speed setting scheme for the filling speed: In the first stage, the aluminum flows from the biscuit to the end of the ingate, with the filling speed set at 15 cm/s; in the second stage, from when the molten metal enters the casting cavity until it fills to the forming end, the filling speed is adjusted to 10 cm/s; in the third stage, from the forming end to complete forming, the filling speed is further reduced to 5 cm/s. To evaluate the rationality and necessity of multi-stage velocity settings, this study compares and analyzes the mold filling process of this scheme with that of a single filling velocity of 15 cm/s. Through simulation and data comparison, the advantages of multi-stage velocity in enhancing the stability of mold filling and the quality of castings are validated.
When the pouring temperature of the aluminum melt is 690 °C and the mold temperature is 250 °C, with a single filling speed of 15 cm/s, the filling process of the suspension arm in squeeze casting is shown in Figure 16.
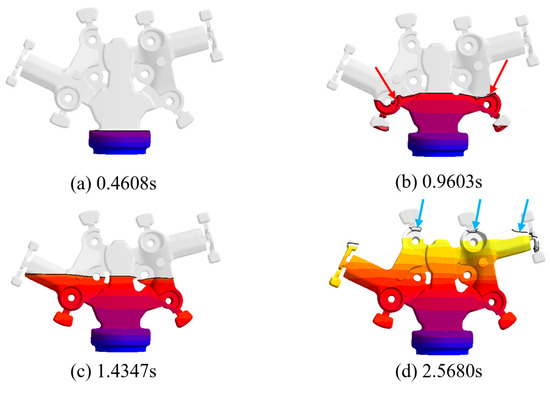
Figure 16.
The simulation process at a filling speed of 15 cm/s.
The entire filling process took 2.6470 s. As shown in Figure 16a, when the filling time was 0.4608 s, the molten aluminum entered the biscuit through the shot sleeve and exhibited a stable laminar flow state, preparing to enter the runner. At the filling time of 0.9603 s (as shown in Figure 16b), the molten aluminum passed through the lower half of the runner and gradually entered the main cavity of the suspension arm through the ingate. Due to the larger dimensions of the runner and ingate, which were designed as straight runners, the filling process of the molten aluminum was relatively smooth. However, when the molten aluminum filled the boss area of the mounting hole, the filling encountered some resistance due to the protruding structure of this area, causing part of the molten aluminum to flow into the overflow channel prematurely. During this process, gas entrapment was prone to occur, and a slight vortex formed at the location marked by the red arrow.
As shown in Figure 16c, at a filling time of 1.4347 s, the molten aluminum primarily undergoes sequential filling within the mold cavity, with a relatively uniform thickness in the filled area. Due to the adoption of a single-speed control, the filling of the main body part of the molten aluminum is relatively uniform. However, the higher and constant speed reduces the stability of the molten aluminum flow, affecting the smoothness of the filling. As depicted in Figure 16d, when the filling time reaches 2.5680 s, the molten aluminum fills up to the end of the casting. Because the filling speed remains consistently high, the molten aluminum may entrap air at the filling end. A vortex phenomenon is observed at the boss of the mounting hole, as indicated by the blue arrow. This vortex may lead to the entrapment of air bubbles within the cavity. If these bubbles cannot be discharged into the overflow tank in time, they will eventually form pores in the casting, leading to surface defects, gas entrapment, and oxide slag inclusions. Additionally, at the thin-walled area near the end of the connecting hole of the suspension arm, as indicated by the blue arrow, the aluminum liquid prematurely enters the overflow tank while the cavity in this area is not fully filled. This is due to the phenomenon of metal liquid cutoff or backflow caused by high-speed flow, resulting in insufficient filling or undercasting at the end of the suspension arm’s filling. These phenomena indicate that single high-speed filling may have an adverse effect on the quality of the casting.
Under the same conditions of maintaining the aluminum pouring temperature at 690 °C and the mold temperature at 250 °C, the filling speed was set to a multi-stage speed of 15 cm/s-10 cm/s-5 cm/s. The filling process is shown in Figure 17, with a total filling time of 3.5019 s.
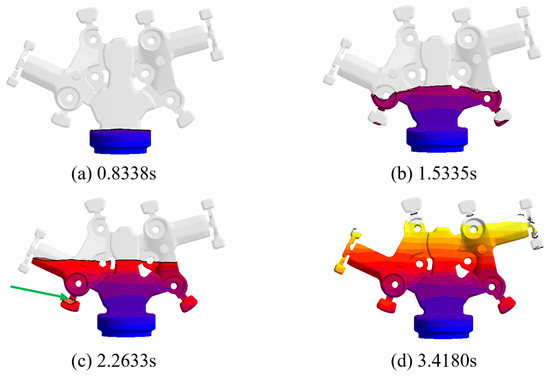
Figure 17.
The simulation process at a filling speed of 15 cm/s-10 cm/s-5 cm/s.
As shown in Figure 17a, at the filling time of 0.8338 s, the filling process of the aluminum melt entering the cavity from the biscuit remains relatively smooth. Subsequently, as shown in Figure 17b, at the filling time of 1.5335 s, the aluminum melt enters the runner and flows into the casting cavity through the ingate. Due to the implementation of a multi-stage deceleration filling scheme, when the aluminum melt reaches the boss area of the mounting hole, the filling speed has been reduced to 10 cm/s, maintaining a steady velocity and ensuring a stable laminar flow state within the cavity, gradually filling up to the boss area. As shown in Figure 17c, at the filling time of 2.2633 s, the aluminum melt fills with uniform thickness, the filling speed further decreases, and the gas is smoothly discharged into the overflow slot without any air entrapment. As shown in Figure 17d, when the filling time is 3.4180 s, the molten aluminum successfully fills to the end of the casting. Furthermore, as the filling speed is further reduced to 5 cm/s, no vortex or defects appear in the boss and connecting arm areas, ensuring the overall filling quality of the casting.
Compared to the filling process with a single-stage filling speed of 15 cm/s, the filling time with a multi-stage filling speed is extended by approximately 0.86 s. However, the entire filling process is smoother and more stable compared to a single filling speed, especially in the areas of the mounting hole boss, connecting arm, and the end of the filling, where no defects such as vortices or air entrapment occur. Therefore, based on the filling state from the simulation, setting a gradually decreasing filling speed is beneficial for the successful forming of the suspension arm.
5.3. Solidification Process Analysis
Figure 18 illustrates the solidification process of the casting under the conditions of a pouring temperature of 690 °C, a mold temperature of 20 °C, and a filling speed of 15 cm/s-10 cm/s-5 cm/s, with the solidification time lasting 83.621 s. As shown in Figure 18a, at a solidification time of 5.1564 s, the aluminum melt begins to solidify first from the overflow channel and the thin-walled end away from the sprue. At this stage, the cooling process of the casting starts from the most distal region and gradually progresses towards the main body of the casting. Over time, as depicted in Figure 18b, when the solidification time reaches 11.6935 s, the solidified areas of the casting have predominantly gathered in the main body of the suspension arm, by which time the overflow channels have completely solidified. As shown in Figure 18c, when the solidification time reaches 25.5847 s, the boss of the mounting hole of the suspension arm and the connecting arm area have almost completely solidified, and the solidification process is relatively stable. When the solidification time reaches around 67 s, as shown in Figure 18d, except for the sprue and the biscuit, the rest of the casting has completely solidified. It is worth noting that the solidification time of the biscuit is relatively long, which is due to its proximity to the gate and its large thickness, making it difficult for heat to dissipate quickly. Therefore, the suspension arm casting exhibits a top-to-bottom sequential solidification characteristic during the solidification process, and no obvious isolated island phenomenon occurs, which conforms to the basic principle of sequential solidification in squeeze casting.
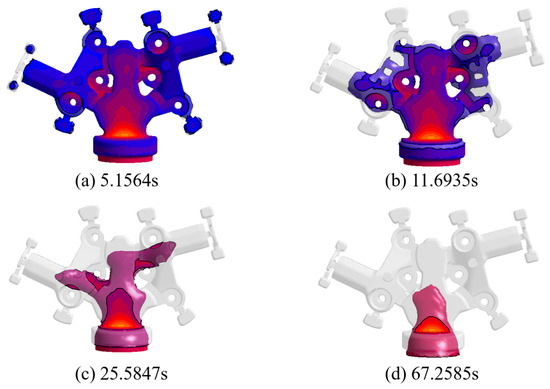
Figure 18.
The solidification simulation process of the suspension arm.
6. Mechanical Properties and Microstructure Analysis
To improve the internal microstructure of the material and enhance the mechanical properties of the castings, heat treatment is required. The T6 heat treatment process can strengthen the metal matrix, particularly by significantly increasing the quantity and distribution of strengthening phases (such as Mg2Si) in aluminum alloys, thereby effectively improving the mechanical properties of the castings. Additionally, heat treatment can release the residual stresses generated during the squeeze casting process, thereby reducing dimensional changes in the castings during subsequent processing and use, and enhancing their stability and reliability [18]. According to relevant research findings, after 2.5 h of treatment at temperatures up to 540 °C, the second-phase particles in A356 aluminum alloy decrease, and the overall performance is good. Due to the high solution temperature and the heating time required for the heat treatment furnace, the solution time is generally set between 5 and 8 h based on the performance requirements and cost budget of the suspension arm. Regarding aging treatment, studies have shown that artificial aging at temperatures between 100 and 200 °C affects the β′ strengthening phase. As the β′ phase precipitates, it maintains a semi-coherent state with the α-Al matrix, thereby inducing lattice distortion and achieving the effect of strengthening the matrix [19]. In summary, the solution temperature proposed in this study is 540 °C with a solution time of 5 h, and the aging temperature is 175 °C with an aging time of 5 h.
6.1. Mechanical Performance Analysis
The equipment used in this mechanical performance test is an electronic universal tensile testing machine, and the dimensions of the tensile specimens are shown in Figure 19. To ensure data reliability, the mechanical properties of specimens from two sampling locations were selected as the measurement basis. Three specimens were prepared from the selected areas 1-1 and 1-2 in Figure 20, and the maximum, minimum, average values, and standard deviation of the data were analyzed. The sampling location for the suspension arm should be chosen in a robust area or a location with uniform thickness, and sampling should be conducted using a combination of sawing and wire cutting.
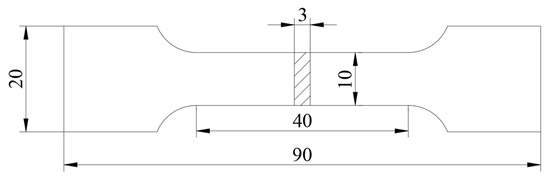
Figure 19.
Dimensions drawing of tensile test specimen.
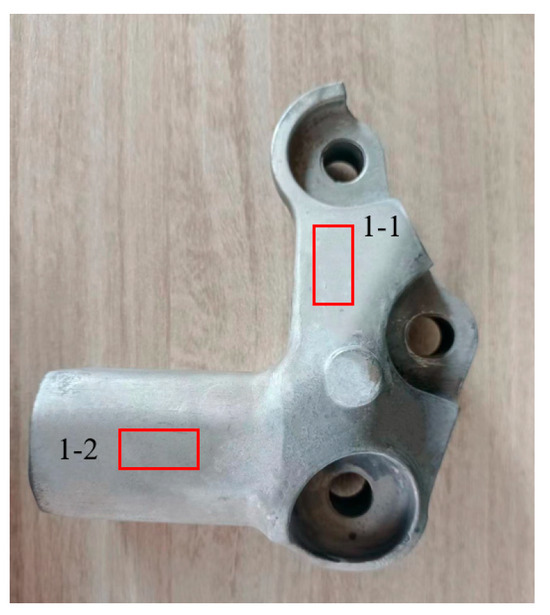
Figure 20.
Sampling location for mechanical properties testing.
After the completion of the test, the mechanical property data of the obtained samples are shown in Table 7. Through comparison, it was found that the maximum tensile strength is 327.76 MPa, and the minimum is 324.25 MPa, both exceeding the specified requirement value of the test. The tensile strength meets the requirements. The standard deviation of the tensile strength, calculated to be 1.11, indicates a low degree of data dispersion and that the data results are relatively concentrated. Therefore, the average value of the selected data, 326.05 MPa, is determined as the final measurement data. Using the same method, the maximum, minimum, standard deviation, and average values of yield strength and elongation after fracture were calculated sequentially. The data indicates that both yield strength and elongation after fracture meet the test requirements, with the standard deviation of elongation after fracture being very low. However, the standard deviation of yield strength is slightly higher, which may be related to the uneven distribution of the material’s microstructure.

Table 7.
The results of mechanical property test.
6.2. Microstructural Analysis
To investigate the reasons for the improvement in mechanical properties, the metallographic structures of the samples before and after heat treatment were analyzed. In the experiment, samples were taken from the main body of the suspension arm. After cold mounting the samples, they were ground and polished using sandpapers of different grits (400, 800, 1500). The samples were then etched with 8% hydrofluoric acid for 3 s, rinsed with clean water, and dried using a hair dryer. The prepared samples were observed under an optical microscope. Figure 21 shows the metallographic structure of the suspension arm casting before heat treatment.
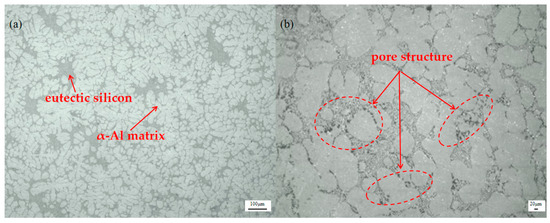
Figure 21.
Metallographic structure diagram of suspension arm in as-cast condition. (a) Distribution of α-Al matrix and eutectic silicon. (b) Distribution of pores.
As shown in Figure 21a, the microstructure of the conventional casting of the suspension arm bracket primarily consists of an α-Al matrix and eutectic silicon. The α-Al matrix exhibits coarse dendritic crystals, while the eutectic silicon is mainly distributed in the grain boundary regions in the form of needles or flakes. In addition, Figure 21b reveals the presence of distinct porosity structures. The morphology and distribution characteristics of this eutectic silicon significantly disrupt the continuity of the α-Al matrix, leading to a deterioration in the plasticity of the casting and thereby adversely affecting the overall mechanical properties of the suspension arm bracket casting.
As can be seen from Figure 22a, the metallographic structure of the sample exhibits significant optimization characteristics, with the α-Al dendrites and eutectic silicon uniformly distributed. The state of the eutectic silicon in the sample is mainly worm-like and dot-like. By measuring the secondary dendrite arm spacing, it is found that the average values for areas A, B, and C are 31.2 μm, 30 μm, and 45.7 μm, respectively, all not exceeding 50 μm, indicating a uniform distribution of the structure without obvious aggregation. Through observation of Figure 22b, it is evident that the spheroidization of eutectic silicon is pronounced. This may be attributed to the T6 heat treatment, which affects the boundary dissolution degree of alloying elements. For eutectic Al-Si alloys, the heat treatment accelerates the boundary dissolution and diffusion of alloying elements, promoting the spheroidization of eutectic silicon, thereby improving the mechanical properties of the alloy. In addition, to determine the porosity after T6 heat treatment, experimental measurements were conducted on regions 1-1 and 1-2 in Figure 20. The results revealed porosities of 0.12% and 0.24%, respectively, indicating the material’s excellent density.
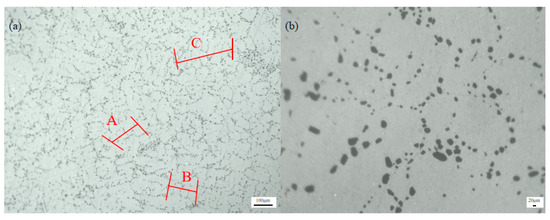
Figure 22.
Microstructure diagram of suspension arm under T6 heat treatment. (a) Secondary dendrite arm spacing measurement areas A, B, C. (b) Distribution of pores.
7. Conclusions
- (1)
- Based on the design requirements of the suspension arm, a multi-condition topology optimization mathematical model for the suspension arm was established using the variable density method, with linear weighting method applied. The weight coefficients for different conditions were determined through the Analytic Hierarchy Process. The allocation of weight coefficients was completed using HyperMesh software. After optimization, the overall dimensions of the aluminum alloy suspension arm changed slightly, but the mass was reduced by 54.7%, demonstrating a significant lightweight design effect.
- (2)
- Numerical simulation analysis was conducted on the filling process of the suspended arm. By comparing the numerical simulation results of two filling processes—single filling speed (15 cm/s) and multi-stage filling speed (15 cm/s-10 cm/s-5 cm/s)—it was found that using the multi-stage filling speed (15 cm/s-10 cm/s-5 cm/s) allowed the molten aluminum to fill smoothly, avoiding defects such as air entrapment and poor filling. Additionally, numerical simulation analysis of the solidification process indicated that the entire casting’s solidification process met the requirements of sequential solidification, preventing issues like cold shuts.
- (3)
- Through the analysis of mechanical properties and microstructure, it was found that when the heat treatment parameters were set to a solution temperature of 540 °C, solution time of 5 h, aging temperature of 175 °C, and aging time of 5 h, the microstructure of the suspension arm bracket performed optimally, with no significant eutectic silicon segregation and a notable improvement in the spheroidization of eutectic silicon. The specimens prepared under these conditions achieved an average tensile strength of 326.05 MPa, a yield strength of 276.87 MPa, and an elongation after fracture of 9.68%, all exceeding the required product performance values. Additionally, the secondary dendrite arm spacing of the microstructure was less than 50 μm, and the material exhibited low porosity and good densification after heat treatment. It is evident that the metallographic structure of the suspension arm improved significantly after heat treatment.
- (4)
- The study found that the inadequacy of not conducting research lies in the slightly higher standard deviation value of the material’s yield strength observed during the mechanical performance testing of the squeeze-cast suspension arm. This may be related to the inhomogeneity of the material’s microstructure during the preparation process. Further analysis of the material’s microstructure may be required subsequently to determine the cause, and other processes can be adopted for further optimization research on the material.
Author Contributions
Conceptualization, A.Z.; Methodology, S.D.; Validation, S.D.; Formal analysis, Y.C.; Investigation, A.Z.; Resources, A.Z.; Data curation, A.Z.; Writing—original draft, S.D.; Writing—review and editing, S.D.; Visualization, S.D.; Supervision, Y.C.; Project administration, Y.C. All authors have read and agreed to the published version of the manuscript.
Funding
This research received no external funding.
Institutional Review Board Statement
Not applicable.
Informed Consent Statement
Not applicable.
Data Availability Statement
The original contributions presented in this study are included in the article. Further inquiries can be directed to the corresponding author.
Conflicts of Interest
The authors declare no conflicts of interest.
References
- Tomlin, M.; Meyer, J. Topology optimization of an additive layer manufactured (ALM)aerospace part. In Proceedings of the 7th Altair CAE Technology Conference, Warwickshire, UK, 10 May 2011; Altair Engineering: Troy, MI, USA, 2011; pp. 1–9. [Google Scholar]
- Dubrovskaya, A.; Dongauzer, K.; Faskhutdinov, R. The design of lightweight gas turbine engine parts using topology optimization. MATEC Web Conf. 2017, 129, 4. [Google Scholar] [CrossRef]
- Mamun, M.M.; Singh, H.K.; Ray, T. An Approach for Computationally Expensive Multi-Objective Optimization Problems with Independently Evaluable Objectives. Swarm Evol. Comput. 2022, 75, 101146. [Google Scholar] [CrossRef]
- Luo, W.; Shi, L.; Lin, X.; Zhang, J.; Li, M.; Yao, X. Finding Top-K Solutions for the Decision-Maker in Multiobjective Optimization. Inf. Sci. 2022, 613, 204–227. [Google Scholar] [CrossRef]
- Aickelin, U.; Khorshidi, H.A.; Qu, R.; Charkhgard, H. Guest Editorial Special Issue on Multiobjective Evolutionary Optimization in Machine Learning. IEEE Trans. Evol. Comput. 2023, 27, 746–748. [Google Scholar] [CrossRef]
- Zhang, H.; Li, H.; Li, R.; Liu, B.; Wu, R.; Zhao, D.; Li, S. Effect of Initial Microstructure Prior to Extrusion on the Microstructure and Mechanical Properties of Extruded AZ80 Alloy with a Low Temperature and a Low Ratio. Chin. J. Mech. Eng. 2023, 36, 72. [Google Scholar] [CrossRef]
- Zhou, D.; Kang, Z.; Su, X. Novel Collaborative Design Method for Lightweight Optimization Design of Vehicle Load-Bearing Parts. Int. J. Automot. Technol. 2023, 24, 1269–1284. [Google Scholar] [CrossRef]
- Jiang, J.; Li, Z.; Hu, Y.; Chen, S.; Song, Y.; Hu, L. Density-based Topology Optimization of Multi-Condition Peening Pattern for Laser Peen Forming. Int. J. Mech. Sci. 2024, 267, 108968. [Google Scholar] [CrossRef]
- Liu, J.L.; Zhu, N.H.; Chen, L.J.; Liu, X. Structural multi-objective topology optimization in the design and additive manufacturing of spatial structure joints. Int. J. Steel Struct. 2022, 22, 649–668. [Google Scholar] [CrossRef]
- Gunantara, N. A review of multi-objective optimization: Methods and its applications. Cogent Eng. 2018, 5, 1502242. [Google Scholar] [CrossRef]
- Lee, H.-A.; Park, G.-J. Nonlinear dynamic response topology optimization using the equivalent static loads method. Comput. Methods Appl. Mech. Eng. 2015, 283, 956–970. [Google Scholar] [CrossRef]
- Sojobi, A.O.; Liew, K.M. Flexural Behaviour and Efficiency of CFRP-laminate Reinforced Recycled Concrete Beams: Optimization Using Linear Weighted Sum Method. Compos. Struct. 2021, 260, 113259. [Google Scholar] [CrossRef]
- Wu, N.; Liu, C.; Yang, Z.; Lian, Z. Structural Design of Special Vehicle Components Based on Topology Optimization. Int. J. Automot. Technol. 2023, 24, 541–549. [Google Scholar] [CrossRef]
- Andreassen, E.; Clausen, A.; Schevenels, M.; Lazarov, B.S.; Sigmund, O. Efficient topology optimization in MATLAB using 88 lines of code. Struct. Multidiscip. Optim. 2010, 43, 1–16. [Google Scholar] [CrossRef]
- Boukhari, S.; Mrad, D.; Dairi, S. Performance indicators and analytic hierarchy process to evaluate water supply services management in Algeria. AQUA—Water Infrastruct. Ecosyst. Soc. 2024, 73, 1013–1029. [Google Scholar] [CrossRef]
- Canyook, R.; Utakrut, R.; Wongnichakorn, C.; Fakpan, K.; Kongiang, S. The effects of heat treatment on microstructure and mechanical properties of rheocasting ADC12 aluminum alloy. Mater. Today Proc. 2018, 5, 9476–9482. [Google Scholar] [CrossRef]
- Zhu, S.; Li, Z.; Yan, L.; Li, X.; Huang, S.; Yan, H.; Zhang, Y.; Xiong, B. Natural aging behavior in pre-aged Al–Mg–Si–Cu alloys with and without Zn addition. J. Alloys Compd. 2018, 773, 496–502. [Google Scholar] [CrossRef]
- Kan, W.H.; Huang, S.; Man, Z.; Yang, L.; Huang, A.; Chang, L.; Nadot, Y.; Cairney, J.M.; Proust, G. Effect of T6 treatment on additively-manufactured AlSi10Mg sliding against ceramic and steel. Wear 2021, 482–483, 203961. [Google Scholar] [CrossRef]
- Ye, K.; Cai, X.; Zhou, L.; Ma, S.; Yue, Y.; Xu, F.; Zheng, D.; Tan, J.; Chen, Y. Influence of Y Content and T6 Heat Treatment on the Organization and Mechanical Properties of Cast A356 Aluminum Alloy. Integr. Ferroelectr. 2024, 240, 477–485. [Google Scholar] [CrossRef]
Disclaimer/Publisher’s Note: The statements, opinions and data contained in all publications are solely those of the individual author(s) and contributor(s) and not of MDPI and/or the editor(s). MDPI and/or the editor(s) disclaim responsibility for any injury to people or property resulting from any ideas, methods, instructions or products referred to in the content. |
© 2025 by the authors. Licensee MDPI, Basel, Switzerland. This article is an open access article distributed under the terms and conditions of the Creative Commons Attribution (CC BY) license (https://creativecommons.org/licenses/by/4.0/).