Abstract
The present research investigated the effect of moderate heat treatment (65 °C for 5 min) and calcium enrichment (10 mM CaCl2) on the quality of gels formed by lemon juice at 30 °C for 180 min. Raw milk, calcium-fortified raw milk, heated milk, and calcium-fortified heated milk were used. Rheological measurements showed that the addition of calcium to milk significantly improved the elastic modulus (G’), which passed from 21.2 Pa to 80.18 Pa. However, the combination of heat treatment and calcium produced weaker gels with G’ = 3.71 Pa. Turbiscan analysis revealed higher instability in calcium-fortified heated milk samples that have high Turbiscan Stability Index (TSI) values. Mid-infrared spectral regions (3000–2800 cm−1, 1700–1500 cm−1, and 1500–900 cm−1) and fluorescence spectroscopy indicated some structural changes in protein–water, protein–protein, and protein–lipid interactions depending on coagulation conditions. Principal component analysis (PCA) applied to the fluorescence and MIR datasets allowed the differentiation of gel samples depending on heat treatment and calcium addition. Scanning electron microscopy (SEB) indicated dense and uniform gels produced with calcium-enriched raw milk and porous structures with heated and calcium-enriched milk. These results reveal new information on how thermal treatment and calcium supplementation affect protein network structure formation and the gel microstructure during lemon juice-induced coagulation.
1. Introduction
The coagulation process is a critical phase in the determination of the quality of dairy products [1]. Milk coagulation is a crucial step in the dairy industry, serving as the basis for the structural development of dairy products. During the acid-induced coagulation process, the decrease in pH levels results in a reduction in net negative charges and a consequent release of colloidal calcium phosphate from the casein micelles, causing a decrease in electrostatic repulsion and steric stabilization [2].
Heat treatment is the most widely used processing method for raw milk, as it reduces/inhibits the growth of pathogenic and spoilage microorganisms [3]. Moreover, it is known that the inclusion of calcium, a vital component for the structural integrity of casein micelles, markedly affects the coagulation process, particularly for acid-induced coagulation.
Several methodologies are widely used to improve the quality and stability of acid milk gels [4]. Among them, heat treatment of milk prior to the acid gelation process is a predominant approach, as it facilitates the denaturation of whey proteins, thereby increasing the water-binding capacity and contributing to the formation of a gel with high elasticity. The reduction in colloidal calcium phosphate contained in the micelles leads to disaggregation and releases casein components into the aqueous phase, where they associate with calcium ions, thus improving the thermal stability of dairy products [5]. In this context, some research studies combined heat treatment strategies (temperatures higher than 75 °C), allowing the denaturation of soluble protein and the incorporation of calcium during acid-induced coagulation using glucono-delta lactone (GDL) [6,7,8].
However, there is growing consumer demand for natural, environmentally friendly, and sustainable dairy products produced with lemon juice [9,10,11]. The citric acid present in lemon juice acts as a natural acidifier, initiating coagulation by lowering the pH of the milk, which then leads to the destabilization of casein micelles and the formation of a gel matrix. Nevertheless, the efficacy of this coagulation mechanism is contingent upon a number of factors, including the intrinsic composition of the milk, the concentration of calcium present in the milk, and the intensity of heat treatments to which the milk has been subjected [12].
Most of the studies related to monitoring acid-induced coagulation are performed with GDL as the coagulant [2,13,14,15]. These studies have been applied mostly on raw milk or heated milk at temperatures higher than 80 °C. These temperatures allowed the denaturation of whey proteins and then induced a decrease in the nutritional values of dairy products.
To the best knowledge of the authors, no study monitoring milk gelation induced by lemon juice has been undertaken. Therefore, the objective of the present study was to monitor lemon-induced gelation of raw and heated milk at 65 °C for 5 min with and without the addition of calcium chloride (CaCl2) at a level of 10 mM by different analytical techniques.
2. Materials and Methods
2.1. Milk Sample and Plant Material
In total, 10 L of milk was collected in the region of Middle Guinea, specifically in the prefecture of Dalaba (10°41′33″ N, 12°14′59″ W). In order to maintain the quality of the milk, the milk was homogenized and then placed in sterile containers with a capacity of 150 mL, which were utilized for milk collection (Figure 1). Furthermore, sodium azide was incorporated into the milk at a concentration of 0.02% (w/w), thereby preventing microbial proliferation during both transportation and storage. The milk was then maintained at −20 °C until it was required for use. Lemon juice was obtained by segmenting the fruit purchased at Dalaba market (Dalaba, Guinea) and exerting pressure to release the liquid into a clean container. The juice was then filtered through a sieve (pore diameter 0.1 mm) and stored in bottles with a capacity of 15 mL at −20 °C until use. In the experimental set-up, milk samples were subjected to a controlled thawing process at a temperature of 4 °C for one night. After this process, no particles or aggregates were observed in the milk samples.
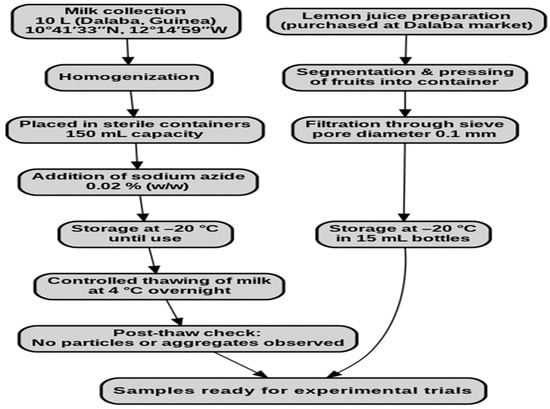
Figure 1.
Flowchart of milk and lemon juice preparation prior to experiments.
2.2. Physicochemical Characterization of Milk and Lemon Juice
Physicochemical parameters of milk and juice were analyzed, including pH, which was determined using a pH meter (WTW pH 330i Taschen-pH-meter, Troitedt, Germany) calibrated with buffer solutions at pH values of 7 and 4. The total nitrogen content of milk and lemon juice was determined by the Kjeldahl method (KjeldahlTM 8100, Nanterre, France). Factors of 6.38 and 6.25 were used to convert total nitrogen to protein in milk and juice, respectively. Total fat and ash contents were determined, respectively, by the Gerber acid–butyrometric method (Funke Gerber, Berlin, Germany) and a muffle furnace (Nabertherm GmbH, Lilienthal, Germany) at 550 °C for 4 h. Finally, moisture content was quantified using an air oven (VWR, Paris, France) previously set at 103 ± 2 °C for 24 h. These analyses were carried out according to standard procedures [16,17,18].
2.3. Preparation of Milk Samples
Calcium-fortified raw or heated milk was prepared by adding10 mM CaCl2 to raw milk, followed by stirring at 150 rpm for 2 min. Milk samples were placed in Pyrex tubes with a capacity of 18 mL (VWR, Paris, France). For heated milk, Pyrex tubes containing milk were placed in a water bath previously maintained at 65 °C for 5 min. The tubes were then removed and cooled rapidly with tap water at room temperature for 5 min.
For raw and heated milk, the samples were kept in a water bath maintained at 30 °C for 1 h. Acidification of the milk was realized by the addition of lemon juice at a concentration of 6.5% w/w. Gentle agitation was performed in order to allow total dissolution. Samples were gently taken and placed in rheology, Turbiscan, fluorescence, and mid-infrared equipment for analyses.
2.4. Monitoring Lemon Juice Induced-Gelation
2.4.1. pH Determination
The pH values of lemon juice-induced gelation at 30 °C were determined every 15 min for 180 min using a pH meter (WTW pH 330i Tascchen-pH-meter, Troitedt, Germany). The measurements were determined in duplicate.
2.4.2. Rheology Analyses
The rheological parameters (storage modulus G’ and loss modulus G”) of lemon juice-induced gelation was determined using a HAAKE® MARS III rheometer (Thermo Fisher Scientific, Karlsruhe, Germany), which was equipped with a Peltier temperature control unit (TM-PE-P). The geometric configuration employed for the measurements comprised a cup and a rotor (with a diameter of 25.959 mm, a length of 34.51 mm, and a spacing of 1.9 mm). Oscillatory experiments were conducted over a 180 min period within the linear viscoelastic region by applying a constant frequency of 0.1 Hz and a strain amplitude of 0.15%. To mitigate the risk of evaporation during lemon juice-induced gelation, a protective cap was placed on the milk sample prior to the commencement of the measurement. At least two replicates were conducted for each experimental test. The procedure was adapted from previously reported methods for monitoring acid-induced milk gelation [4,19], with a slight modification.
2.4.3. Colorimetry Analyses
The color of lemon juice-induced gelation was quantified using a Minolta CR-300 chromameter (Konica Minolta Sensing Europe, Roissy-en-France, France). The color coordinates (luminance (L*), redness/green (a*), blue/yellow (b*), and chromaticity) were determined in triplicate at 15, 60, 120, and 180 min.
2.4.4. Turbiscan Analyses
Lemon juice-induced gelation was analyzed using a Turbiscan machine (Turbiscan LAB, Formulaction Smart Scientific Analysis, Toulouse, France). The instrument comprises a detection head equipped with a near-infrared light source operating at a wavelength of 880 nm. The light source is directed vertically across the sample (approximately 30 mL) contained in an air-free cell, and the percentage of light backscattered or transmitted is quantified over a period of 180 min at 30 °C. The Turbiscan Stability Index (TSI) is derived from the fluctuations in backscatter intensities, which serve as indicators of dynamic migration phenomena, as previously described for milk coagulation monitoring [1,19].
2.4.5. Particle Size Analyses
The particle size of the samples was determined by the dynamic light scattering technique using a laser diffraction particle size analyzer (SALD-2300; Shimadzu, Paris, France). Prior to measurements, samples were pre-diluted in MilliQ water, and the volume-weighted mean diameter (D4,3) of the gels was measured at ambient temperature using a refractive index of 1.45. Measurements were made at 15, 60, 120, and 180 min by maintaining samples at 30 °C using a water bath.
2.4.6. Polyacrylamide Gel Electrophoresis Analyses
Electrophoresis samples were obtained by dissolving 2 g of the obtained gel after 180 min in 15 mL of a Tris-HCl (pH 6.8) solution, 10% SDS, glycerol, and 2-mercaptoethanol. The mixture was homogenized for 2 min and then centrifuged at 2600 RCF for 15 min at 40 °C. The supernatants were mixed with a loading buffer (Tris-HCl pH 6.8, 2-mercaptoethanol, 10% SDS, glycerol, and bromophenol blue; 1:1 v/v). Electrophoresis was conducted by SDS-PAGE using a 12.5% resolving gel as described by [20] in a Mini-Protean Tetra Cell system (Bio-Rad, USA), loading 5 μL of the sample per well and applying a voltage of 200 V/500 mA for 60 min, until complete migration of bromophenol blue. Proteins were revealed by Coomassie brilliant blue staining, and their molecular weight was estimated by comparison with the protein marker “Protein Marker III wide range (10–250 kDa)”. The analyses were performed after only 180 min of lemon-induced gelation.
2.4.7. Scanning Electron Microscopy Analyses
The morphology of the gel samples was observed by scanning electron microscopy (SEM) using a FlexSEM1000 microscope (Hitachi, Tokyo, Japan). Before analysis, gel samples were frozen to preserve their internal structure. They were then sectioned using a freezing microtome (30 µm), a process that facilitated the creation of clear and representative sections while preserving the integrity of the gel network. The accelerating voltage was set at 5.00 kV with a working distance of 4.6 mm. Images were captured at a magnification of ×100. The analyses were performed after only 180 min of lemon-induced gelation.
2.4.8. Fluorescence Analyses
Fluorescence spectra were recorded on a Fluoromax-4 spectrofluorometer (Jobin Yvon, Horiba, NJ, USA) fitted with a Haake A25 AC200 temperature controller and a thermostatically controlled cell. (Thermo Scientific, France). Milk samples were poured in a 3 mL quartz cuvette, and fluorescence spectra were recorded at a temperature of 30 °C. Excitation and emission wavelengths of 290 and 410 nm were used, respectively, to scan the emission spectra of tryptophan residues (305–450 nm) and the excitation spectra of vitamin A (290–390 nm). Every 15 min throughout a 180 min period, spectra were acquired in triplicate for each fluorophore at 15, 30, 45, 60, 75, 90, 105, 120, 135, 150, 165, and 180 min. This procedure was adapted from previous studies of acid-induced milk coagulation [19].
2.4.9. Mid-Infrared Analyses
MIR spectra were recorded at 30 °C throughout a 180 min period during lemon juice-induced coagulation, with a spectral range of 4000 to 900 cm−1 using an IRTracer-100 Fourier transform spectrometer (Shimadzu, Duisburg, Germany). The attenuated total reflection (ATR) cell used as a sampling accessory has a crystal made with zin selenide (ZnSe), with an incidence angle of 45 °C and 10 reflections. Sixty-four (64) scans were accumulated for each spectrum with a resolution of 16 cm−1, and apodization of a square triangle was applied. The background spectrum was scanned at the beginning of the measurement by pouring distilled water onto the ATR cell. The ATR cell is linked to a Julabo temperature controller fixed at 30 °C. Approximately 3 mL of the sample was placed on the crystal, and the spectra were subsequently recorded in triplicate at 15, 30, 45, 60, 75, 90, 105, 120, 135, 150, 165, and 180 min.
2.5. Multidimensional Data Analysis
To compare lemon juice-induced coagulation, ANOVA was applied to colorimetric measurements. Regarding fluorescence (vitamin A and tryptophan) and MIR measurements, principal component analysis (PCA) was applied separately to fluorescence and MIR spectra [21,22,23,24]. ANOVA and PCA were performed, respectively, with the XLSTAT 2014 (Addinsoft SARL USA, New York, NY, USA) software and the MATLAB software (Matlab, version 6.5, Release 12, The Math Works).
3. Results and Discussion
3.1. Physicochemical Characterization of Raw Materials: Milk and Lemon Juice
The physicochemical composition of milk and lemon juice is presented in Table 1. The pH value of raw milk is 6.70 ± 0.02, which is similar to that reported by [19], who observed a value of 6.68 for cow milk, and lower to that depicted by [25], who noted a value of 6.90 for M’bororo cow’s milk collected on a breeding farm in Togo. This difference could be explained by natural variabilities, such as the breed cow, the alimentation given to the herd, the stage of lactation, and the storage conditions. With regard to lemon juice, the pH value is 2.30 ± 0.02, which falls within the range of 2.28 to 3.5, as previously indicated by [26].

Table 1.
Physicochemical composition of N’Dama cow’s milk and lemon juice.
The moisture content of milk is 86.46 ± 0.10, which is comparatively lower than that reported by [27], who noted values of 87.19 ± 0.99. With regard to the composition of lemon juice, the value is 94.82 ± 0.03%, which is lower that observed by [28], who depicted a value of 91.4%.
The fat content of milk was found to be 4.23 ± 0.06%, which is consistent with the values reported by [27,29], who, respectively, observed fat levels of 4.49 and 4.28%. On the other hand, it is lower than that obtained by [30], who observed fat content varying between 2.23% and 3.95%. Indeed, this variability could be explained by factors such as the diet, breed, and environment.
The protein level of the milk was 3.76 ± 0.06%, which is higher than the amount reported by [31], who observed a protein content of 3.29 ± 0.13%, and the findings of [29], which depicted a protein content of 3.91 ± 0.29% in cow’s milk. The protein content of lemon juice is 0.34 ± 0.04, which is slightly lower than the value reported by [28,32], who reported a level of 0.25%.
The total ash content of the milk was 0.89 ± 0.00%, which is higher than that reported by [27], who found a value of 0.69 ± 0.01%. However, it is lower than that reported by [31], who noted a value of 0.96 ± 0.01%. With regard to lemon juice, total ash content is 0.35 ± 0.05%, a level that is in line with the findings of [32], which reported a value of 0.32%. It may be reasonably assumed that this discrepancy can be attributed to factors such as the ripening stage, geographical origin, climatic conditions, and varieties.
3.2. Monitoring Lemon Juice-Induced Coagulation by Different Analytical Techniques
3.2.1. pH Measurements
Figure 2a shows the evolution of pH during lemon juice-induced gelation of raw milk, calcium-fortified raw milk, and heated milk at 65 °C for 5 min. Gels obtained from heated milk show the highest values for pH, and those obtained from calcium-fortified raw milk display the lowest values. At 180 min, the ultimate pH levels reached 4.63 ± 0.014 for gels obtained from raw milk, 4.33 ± 0.067 for those enriched with calcium, and 4.84 ± 0.141 for heated milk. These variations can be due to the addition of calcium, which affects the acidification and stability of casein micelles [33].
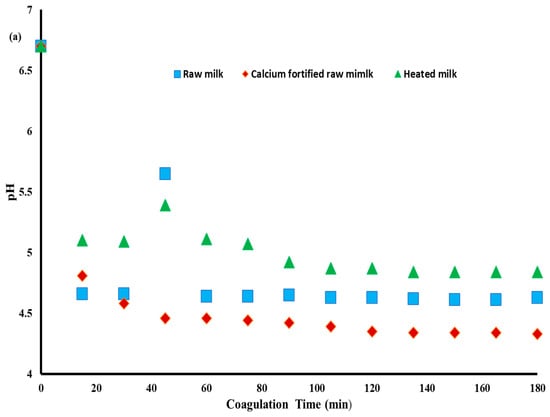
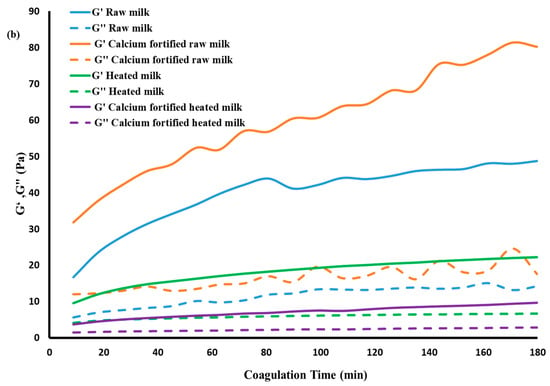
Figure 2.
Evolution of pH (a), storage modulus (G’), and loss modulus (G”) (b) values during lemon juice-induced gelation obtained from different milk samples.
Heated milk at 65 °C for 5 min induced the formation of a gel with the highest final pH value (4.84 ± 0.141), showing slow gelation compared to the others. This phenomenon is mainly due to the modification of the interactions between milk proteins and calcium. In this context, Ref. [34] reported that heating milk to 65 °C for 5 min causes partial denaturation of whey proteins, especially β-lactoglobulin, which associates with κ-casein, forming complexes that alter the structure of the micelles and reduce their reactivity towards H+ ions. This stabilization of the micelles slows down their aggregation under the effect of lemon juice, which explains the higher pH value at the end of the process. Furthermore, Ref. [35] showed that protein–calcium interactions alter the availability of ionized calcium (Ca2+), slowing casein precipitation and thus causing pH to decrease.
The redistribution of calcium between the soluble and colloidal phases also plays a role in pH changes. For instance, Ref. [7] demonstrated that after milk heating, some of the colloidal calcium moves to the soluble phase, decreasing the amount of micellar calcium available for coagulation. This can slow the initiation of acid gelation, but once coagulation started, casein precipitation can occur more markedly. This phenomenon was observed by [36], who reported that moderate heating (68 °C) of milk influences mineral balance, delaying the pH decrease without completely preventing coagulation.
Conversely, gelation of calcium-fortified raw milk has the lowest final pH value (4.33 ± 0.067) after 180 min, indicating faster acidification. This difference is explained by the increased solubilization of colloidal calcium, which leads to an additional release of H+ into the medium, contributing to a rapid drop in pH value [37]. In addition, the same authors indicate that ionized calcium (Ca2+) binds to casein micelles, reducing their electrostatic charge and promoting their aggregation.
3.2.2. Rheology Measurements
The rheological properties of lemon juice-induced gelation are shown in (Figure 2b), where G’ and G” are plotted as a function of the gelation time expressed in seconds. Gels obtained from raw milk exhibited initial G’ and G” values of 16.69 Pa and 5.57 Pa, respectively, with a progressive increase throughout gelation time. The gels obtained from calcium-fortified raw milk showed the highest initial moduli (31.12 Pa for G’ and 12 Pa for G”), attaining values of 80.18 Pa after 180 min of gelation. The observed difference in G’ of gels made from raw milk and those enriched with CaCl2 could be attributed to the increase in the amount of micellar calcium phosphate, which leads to the establishment of calcium bridges between milk proteins. This allows the formation of more elastic gels, in agreement with previous findings of [6,38], which indicated that the addition of CaCl2 at levels of 10 and 20 mM to raw milk improved the firmness of the gels and their mechanical properties. Recently, Ref. [36] stated that the addition of CaCl2 accelerates the gelation of casein micelles by reducing their electrostatic charge, thus allowing the production of a firmer gel.
In contrast, gels obtained from milk heated at 65 °C for 5 min presented lower initial moduli (G’ = 9.57 Pa, G” = 4.16 Pa) compared to those produced with raw milk gels, reaching a G’ value of 22.21 Pa after 180 min of gelation. It is important to note that gels produced from calcium-fortified heated milk display lower G’ and G” values (3.71 Pa and 1.48 Pa initially) than those made with heated milk, reflecting a more fragile and less elastic gel compared to the former gels. These observations corroborate those of [34], which indicated that heating milk to 65 °C does not cause complete denaturation of whey proteins but nevertheless affects micellar interactions by facilitating the weak release of colloidal calcium. The redistribution of calcium disrupts the interactions between micellar under the effect of acidification, thus delaying the structure of the gel and leading to a decrease in its rigidity [36]. According to [39], heating milk at intermediate temperatures (60 to 70 ° C) modifies the micellar structure without causing complete denaturation of whey proteins, reducing the reactivity of the casein network, which can modify the gel’s structuring capacity under the effect of acidification.
3.2.3. Colorimetry Characterization
The colorimetric properties of milk gels, presented in Table 2, reveal the impact of heat treatment and calcium enrichment on the color of gels. These factors modify the colloidal structure of casein micelles, protein distribution, and calcium partitioning between its colloidal and ionic forms [40,41] inducing changes in light scattering and, consequently, the colorimetric parameters of the gel. The brightness (L*) of gels obtained from heated milk is higher (L* ≈ 90) compared to the non-heated ones, with L* values of 86.84 and 88.83, respectively, for raw milk and calcium-fortified raw milk gels. This increase in brightness in the gels could be explained by their less dense structure, as confirmed by the lower G’ and G” values (Figure 2b). On the other hand, the decrease in L* values of raw milk gels could be due to the formation of a denser network that reduces light scattering, as evidenced by the more interconnected microstructures observed with confocal microscopy in GDL-induced acidic gels [42].

Table 2.
Color evolution during milk coagulation induced by lemon juice.
The red-green tint (a*) presents negative values, indicating a greenish dominance, which is particularly pronounced in calcium-fortified heated milk gels (a* reaching −4.52). This intensification of the green tint would be attributed to the combined effect of CaCl2 and heating on the organization of casein micelles [39]. Consequently, casein undergoes unstructured aggregation to form a fragile gel.
For the yellow-blue tint (b*), higher values were observed for the calcium-fortified heated milk gels (b* varying from 13.65 to 14.41 after 0 and 180 min of gelation), while the lowest ones were noted for the raw milk gel (from 9.66 to 10.21). This difference likely results from changes in casein–calcium interactions induced by heat treatment and calcium enrichment of milk prior to heat treatment, causing a reduction in the solubilization of colloidal calcium phosphate [42].
The C* value is higher in calcium-fortified heated milk gels (from 14.27 to 15.10) and lower in raw milk gels. For instance, Refs. [39,43] showed that these changes in C* are related to changes in the organization of the protein network and the redistribution of minerals, thus modifying the optical reflectance.
3.2.4. Turbiscan Analysis Measurements
Gels obtained with raw milk exhibited slightly elevated values in comparison to the other milk samples (Figure 3a). This phenomenon may be attributed to the rapid decline in pH from 6.7 ± 0.02 to 4.66 ± 0.03 over 15 min, in comparison to the other milk samples (Figure 2a). After 30 min of gelation, the results indicated that the calcium-fortified raw milk gel exhibited higher TSI values than the other samples. These findings corroborate the hypothesis that gels obtained from calcium-fortified raw milk are more susceptible to the lemon juice coagulation process than the others. This is evidenced by the final pH and storage modulus G’ values, which depend on the crucial role of calcium ions in the formation of the protein network during the coagulation process after the addition of CaCl2 [44]. These results are in agreement with the phenomena observed from the transmission and backscattering curves (Figure 3b). A drop in light transmission was observed at the beginning of the measurement for the calcium-fortified raw milk sample, and it remained low throughout the 180 min period (Figure 3b). This indicated complete and denser coagulation. On the other hand, a slight increase in transmission was observed towards the top of the tube, suggesting a decrease in backscattering, particularly between 10 mm and 20 mm in height, compared to the raw milk sample. This indicated aggregation of proteins and sedimentation of these aggregates towards the bottom of the tube. Unlike the heated milk sample which showed a low backscattering value in the center of the tube (between 10 mm and 24 mm), the calcium-fortified raw milk sample revealed a separation of phage (Figure 3c). This is probably due to the partial denaturation of whey proteins during heating, which promotes syneresis, modifying the structure of the curd. However, unlike the sample made from heated milk, gels obtained from calcium-fortified heated milk showed progressive sedimentation of aggregates (Figure 3d) but without phase separation. Calcium enrichment seemed to prevent phage separation. According to [45], a large amount of backscattered light indicated aggregation of proteins, while a decrease in backscatter reflected a syneresis phenomenon.
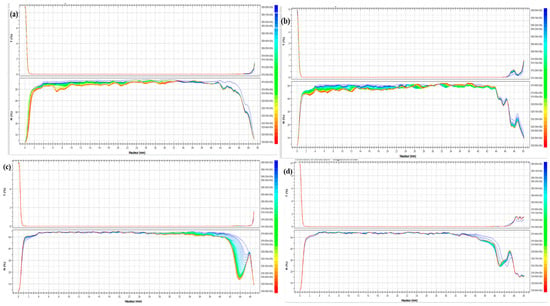
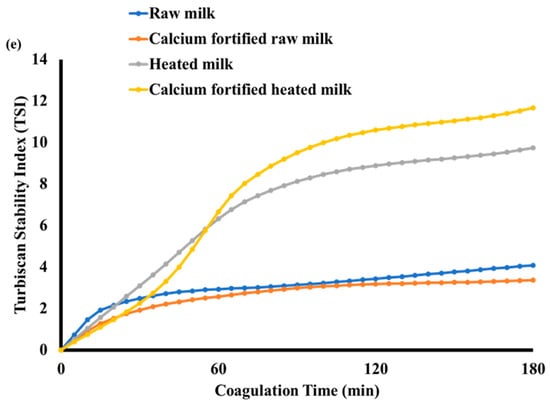
Figure 3.
Evolution of transmission and backscattering during lemon juice-induced gelation obtained from different milk samples: raw milk (a), calcium-fortified raw milk (b), heated milk (c), calcium-fortified heated milk (d), and the Turbiscan Stability Index (TSI) (e).
The TSI of the different gels (Figure 3e) was employed to identify and quantify the various instability mechanisms that can occur during the coagulation process, including emulsification. The TSI is calculated from the transmission and backscatter measurements taken over time across the height of the sample. A higher TSI value indicates a greater degree of particle agglomeration [19]. The calcium-fortified raw milk gel was the most stable sample, followed by raw milk, then heated milk, and finally calcium-fortified heated milk. This could be explained by the fact that the addition of calcium increased the Ca2+ ion concentration, which promotes the formation of bonds between casein micelles while neutralizing their negative charges. This neutralization leads to the formation of a dense and cohesive network, thus limiting syneresis [46].
3.2.5. Particle Size Measurements
The particle size and distribution of different gels during lemon juice-induced coagulation are shown in Figure 4a. The particle size measurement of the raw milk gel demonstrated narrow curves, with a peak around 10–20 µm, indicating a homogeneous distribution of gels at 15 min, and a slight increase in size was observed at 60 and 180 min. This would indicate a progressive interaction of the micelles, which was caused by a reduction in the charges of the casein micelles. However, a limitation of the peak shift was observed, which would explain moderate aggregation. In contrast to raw and heated milk gels, calcium-enriched milk exhibited a broader distribution during gelation. Additionally, an increase in particle size was observed at 60 min with a peak shift to 30–70 µm, suggesting increased interactions between micelles due to the addition of calcium. After 180 min, particles larger than 70 µm dominate, indicating almost complete aggregation of casein micelles. The calcium-fortified heated milk gel had an initial distribution similar to that of the calcium-fortified raw milk gel, showing a slight increase in particle size. However, after 60 min, the largest particle sizes (50–100 µm) are observed for the calcium-fortified raw milk gel, contrasting the heated milk gel, which exhibited a shift in peak size (20–50 µm) (Figure 4a). The particles attain very large sizes (120 µm) after 180 min, indicating heterogeneity in particle size. This is consistent with the Turbiscan results, which show greater stability for the calcium-fortified raw milk gel, while the calcium-fortified heated milk gel exhibits progressive sedimentation and a higher Turbiscan Stability Index (TSI) score, indicating a less homogeneous structure.
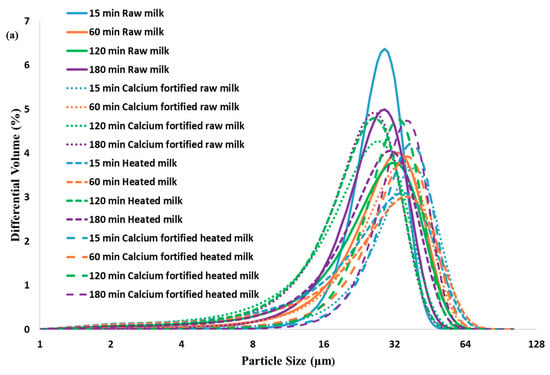
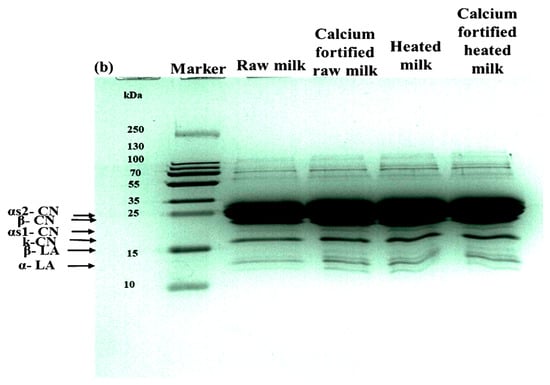
Figure 4.
Particle size distribution (a) and SDS-PAGE (b) of lemon juice-induced gelation obtained from raw milk, calcium-fortified raw milk, heated milk, and calcium-fortified heated milk after 180 min.
3.2.6. Polyacrylamide Gel Electrophoresis Analysis
SDS-PAGE profiles of lemon juice-induced gelation analyzed after 180 min (Figure 4b) revealed notable differences depending on the heat treatment and calcium enrichment. The raw milk gel shows highly resolved electrophoretic bands (αs1, αs2, β, and κ, with β-lactoglobulin: ~18 kDa and α-lactalbumin: ~14 kDa). The milk gel enriched with CaCl2 maintains a similar profile, with a more marked intensity for caseins. The milk gel heated at 65 °C for 5 min shows a reduction in the intensity of β-lactoglobulin and α-lactalbumin bands, indicating partial denaturation of these proteins [46]. In contrast, the profile of calcium-enriched and then heated milk reveals a reduction in the β-lactoglobulin band. These results show that gels appeared to be moderately structured and can be thermodynamically predicted, as reported by [47]. The addition of CaCl2 has been shown to enhance the casein bands, thus inducing micellar interactions through neutralization of charge [48] and forming a stable gel. Alternatively, the addition of 10 mM CaCl2 followed by heating at 65 °C for 5 min caused an increase in the denaturation of whey proteins resulting in the most brittle gel. This disorganization, as suggested by [49,50], has been brought about by premature micelle aggregation and extensive association between the denatured β-lactoglobulin and caseins. This also prevents their subsequent rearrangement upon acidification and breaks the intermicellar bridges caused by calcium and heat. The findings reveal a multiplicative interaction in which heating alone retards the network, while CaCl2 alone enhances its strength, but when combined, their synergy inhibits gelation, indicating a critical point at 10 mM CaCl2 with heat.
3.2.7. Scanning Electron Microscopy Measurements
Scanning electron microscopy images of lemon juice-induced dairy gels show different structures based on the treatment applied to milk. Gels obtained from untreated raw milk show a loosely organized structure (Figure 5). The raw milk gel demonstrates a loosely organized structure, weakly aggregated casein flakes, and moderate porosity, in agreement with the observation of [51], which reported that irregularly shaped particles and a broader size distribution were observed in the skim milk gel. The addition of calcium to raw milk induced the formation of a denser and uniform gel with small pores, in agreement with the findings of [52], which reported that acid coagulation of rasogolla creates a highly reticulated network. Heating milk at 65 °C for 5 min without the addition of calcium yields a softer and slightly porous gel that could be associated with the partial denaturation of β-lactoglobulin, increasing its diameter and homogeneity [53], in agreement with the results observed with particle size and rheology measurements (Figure 4). Indeed, the absence of added calcium for heated milk limits the compactness of the network. Finally, the gel made with calcium-supplemented heated milk is less open and less homogeneous, with larger pores and significant heterogeneity in their distribution. These results highlight the complex interaction between heat treatment and the addition of calcium with the microstructure of the dairy gel, in agreement with Turbiscan, particle size measurements, and electrophoresis results.
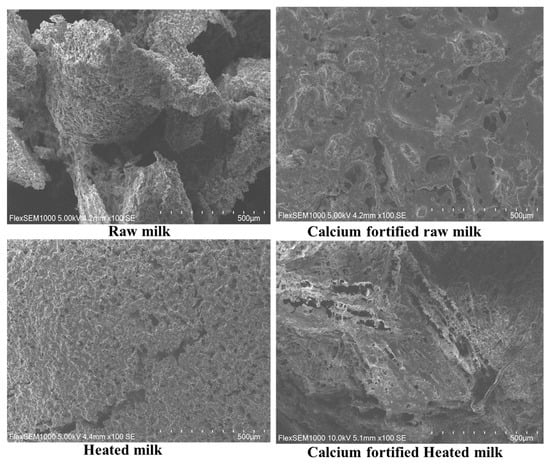
Figure 5.
Scanning electron microscopy of gels of lemon juice-induced gelation obtained from raw milk, calcium-fortified raw milk, heated milk, and calcium-fortified heated milk after 180 min.
3.2.8. Mid-Infrared Measurements
The 3000–2800 cm−1 region is attributed to C-H stretching of fatty acids [54], while the 1700–1500 cm−1 region is linked to protein (Amide I and Amide II) vibrations; and the 1500–900 cm−1 region, commonly referred to as the fingerprint region, is associated with CH, COH, CO, CC bending and P=O stretching [55].
The 3000–2800 cm−1 region was dominated by the presence of two strong bands at 2920 and 2854 cm−1, which were due to the asymmetric and symmetric methylene stretching vibrations [56] (Figure 6ai). For a considered gelation type, the lowest absorbance was observed for gels enriched with calcium-fortified raw milk, regardless of the gelation time.
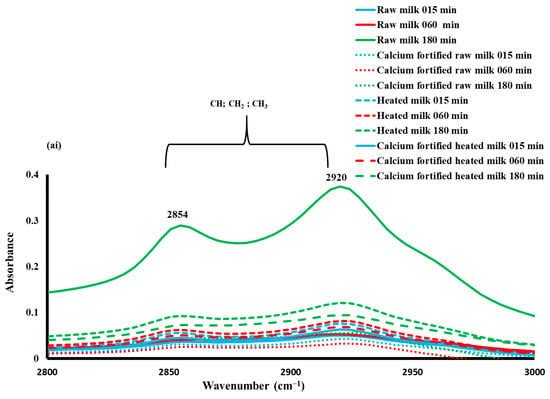
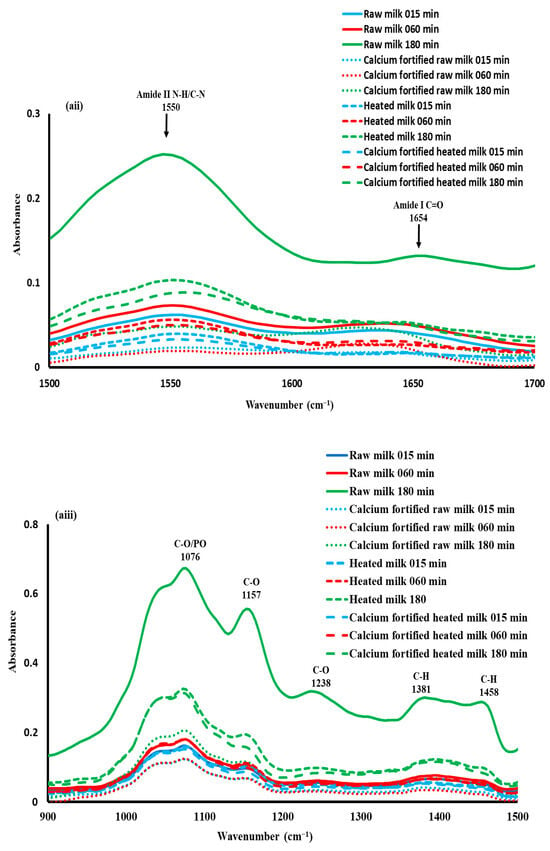
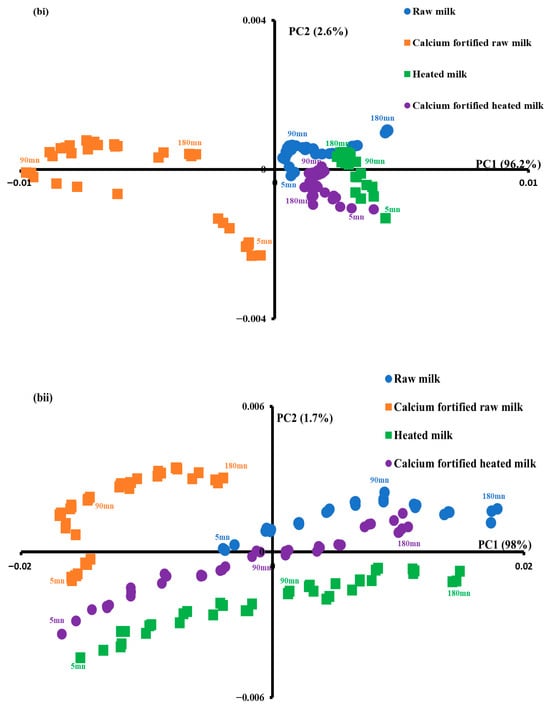
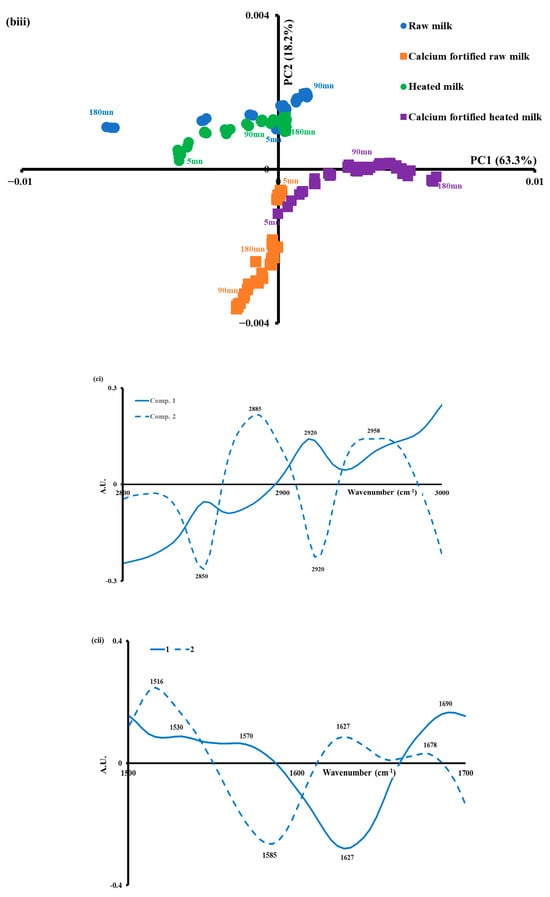
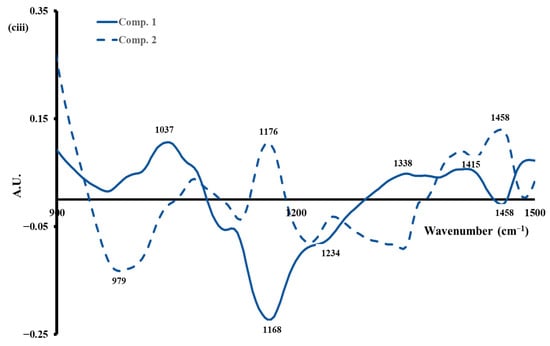
Figure 6.
Mid-infrared spectra (a), similarity map of principal component analysis determined by PC1 and PC2 (b) and spectral profiles corresponding to components 1(—) and 2(—) (c) during lemon juice-induced coagulation of milk for the spectral regions at (i) 3000–2800 cm−1, (ii) 1700–1500 cm−1, and (iii) 1500–900 cm−1.
In order to obtain additional information, PCA was applied to the spectral range from 3000 to 2800 cm−1 (Figure 6bi). The first two principal components accounted for 98.8% of the total variation and showed clear discrimination between the calcium-fortified raw milk gels from the other samples. Indeed, PC1, which accounted for 96.2% of the total variation, separated samples into two distinct groups. The first group comprised the calcium-fortified raw milk coagulum, which exhibited negative scores, while the second group encompassed the remaining samples, presenting positive scores. In addition, clear discrimination of gels as a function of time was observed for each gel type.
The eigenvectors or spectral profiles associated with the principal components provide insight into the distinctive absorption bands, thus clarifying the differentiation [54]. As illustrated in Figure 6ci, spectral pattern 1 is characterized by a positive peak at 2920 cm−1, which could be ascribed to antisymmetric stretching of CH3. Spectral pattern 2 contrasts between two negative bands at 2850 and 2920 cm−1 and two positive ones at 2885 and 2958 cm−1. This indicates that the ratio of CH2/CH3 was modified during the gelation-inducing modification, and the viscosity of triglycerides during lemon juice-induced gelation increased throughout 180 min, in agreement with the findings of [57]. The viscosity changes are essentially observed for heated milk samples and calcium-fortified raw milk along PC2. It can be concluded that heat treatment along with the addition of calcium induced an increase in the viscosity of the coagulum. This result is in agreement with the findings observed with rheology since an increase in viscous elasticity was observed during gelation.
The 1700–1500 cm−1 spectral region was characterized by the presence of two bands at 1654 and 1550 cm−1 (Figure 6aii), which are generally attributed to Amides I and II, respectively [55]. Amide I is characterized by C=0 and C-N stretching vibrations, as well as N-H bending vibrations. Amide II is characterized by the stretching vibrations of the C=N, N-H, and C-N functional groups, as well as the bending vibrations of the N-H group.
For a better understanding of the structural changes in this spectral range (1700–1500), a PCA was performed on the spectral data (Figure 6bii). The first two PCs explained 99.7% of the total variance, with PC1 accounting for 98% of the total variance. The calcium-fortified raw milk coagulum showed negative scores according to PC1, while heated milk and calcium fortified heated milk indicated negative and positive scores. Regarding raw milk gels, they exhibited mostly positive scores according to the PC1. It can be concluded that calcium induced some modification of protein interactions during coagulation [6]. In addition, a clear separation of samples as a function of gelation time was noted.
As shown in Figure 6cii, the spectral patterns of the first two components (1 and 2) indicated distinctive positive and negative peaks, which explained the structural changes in milk proteins during lemon juice-induced coagulation. Spectral pattern 1 is characterized by positive peaks at 1530, 1570, and 1690 cm−1 and a negative one around 1627 cm−1. This seems to indicate the effect of calcium added to raw milk on the evolution of the quality of the gel during gelation. Spectral pattern 2 is characterized by three positive peaks at 1516, 1627, and 1678 cm−1 and negative peak at 1585 cm−1. This component indicated that gels produced with heated milk induced an impact on protein structures [58].
Regarding the 1500–900 cm−1 region (Figure 6aiii), maxima at approximately 1076, 1157, 1238, 1381, and 1458 cm−1 were observed. These bands may be indicative of structural modifications in the different components of milk, which play an essential role in the coagulation process. These alterations are likely to correspond to the conformational changes in proteins that occur during the aggregation of casein micelles in the Amide III region, as well as to the stretching of P=O, which indicates the dissolution of phosphate during acidification [59]. An increase in the absorbance of the bands was observed depending on the coagulation time and the type of milk used (Figure 6aiii).
PCA was performed on the spectral data of this region (Figure 6biii). The first two principal components explained 81.5% of the total variance, and the similarity map (Figure 6biii) showed clear discrimination between gels fortified with calcium (calcium-fortified raw milk and calcium-fortified heated milk) from the others (raw milk and heated milk). Indeed, regarding PC2 accounting for 18.2% of the total variance, the first group with negative values included gels made with calcium-fortified raw milk and calcium-fortified heated milk, whereas the second group presenting positive values is composed of gels made with raw milk and heated milk. As demonstrated in Figure 6ciii, the spectral profile corresponding to PC1 is characterized by an opposition between positive peaks at 1037, 1338, and 1415 cm−1 and negative peaks at 1168, 1234, and 1458 cm−1. This phenomenon could be associated with changes in the structure of lactose and calcium–protein interactions during the process of acid coagulation [60].
3.2.9. Fluorescence Measurements
The emission spectra of tryptophan and the excitation spectra of vitamin A recorded during lemon juice-induced gelation are presented in Figure 7a,b.
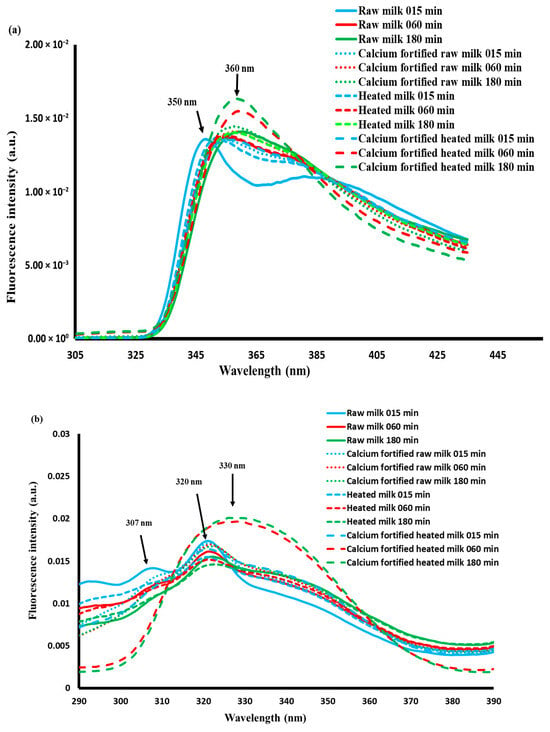
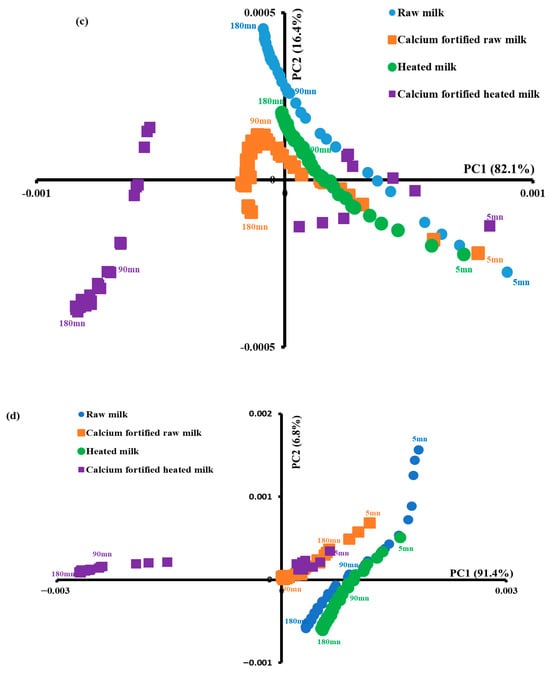
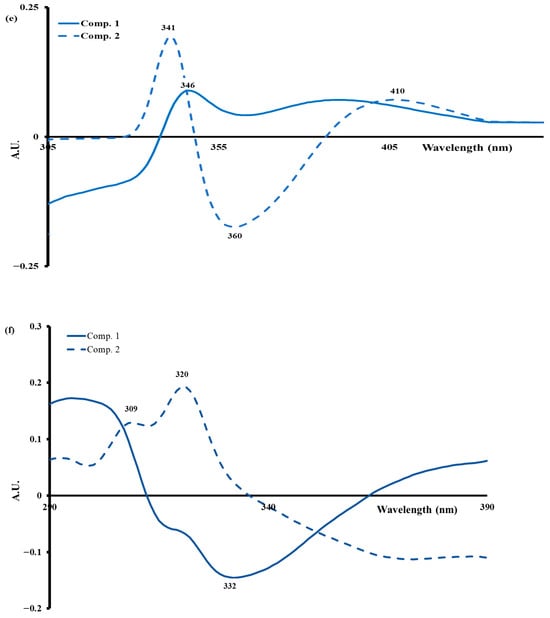
Figure 7.
Normalized tryptophan emission spectra (a) and vitamin A excitation spectra (b) acquired at 15, 60, and 180 min, similarity map of principal component analysis determined by PC1 and PC2 of tryptophan emission spectra (c) and vitamin A excitation spectra (d), and spectral profiles corresponding to principal components 1(—) and 2(—) of tryptophan (e) and vitamin A (f).
The tryptophan spectra showed a different trend depending on the coagulation time, with two maxima located around 350 and 360 nm (Figure 7a). During coagulation the spectra recorded on calcium-fortified heated milk gels show the highest fluorescence intensity at 360 nm compared to the others. A slight shift towards higher wavelengths during the coagulation process was noted for all the gels, indicating (i) changes in the protein–protein, protein–water, and/or protein–lipid interactions; changes in the conformational structure of casein micelles due to the dissociation of colloidal calcium phosphates [59,61]; and/or the disintegration of micelles and the formation of frost induced by acidification [14].
PCA was applied to the tryptophan spectra recorded during lemon juice-induced coagulation. PC1 favored the differentiation of milk samples according to coagulation time induced by lemon juice (Figure 7c) since the spectra acquired during the first 15 min presented positive scores, while those scanned at 180 min exhibited negative values regardless of the coagulation type. In addition the spectra of raw milk gels showed positive scores during the first 90 min of acidification, while negative scores were recorded for the rest of the coagulation duration. For the spectra scanned on gels made with calcium-fortified raw milk gels, the first 45 min showed positive scores values, while the spectra of heated milk and calcium-fortified heated milk gels showed positive scores for the first 165 and 30 min, respectively. The results indicate that acidification of different milk types induced different changes in the fluorescence properties of tryptophan and that calcium causes changes in the tryptophan fluorescence spectra [14,62].
Figure 7b shows the excitation spectra of vitamin A recorded between 290 and 390 nm after emission at 410 nm. The spectra indicated changes in the vitamin A environment due to lipid–protein and/or lipid–lipid interactions, or due to the change in the physical state of triglycerides [63]. Similar results were found by [64] during rennet-induced coagulation of raw and heated camel and cow milk gels. A PCA was performed on vitamin A spectra, and the two principal components account for 98.2% of the total variability (Figure 7d). At this level, the spectra of calcium-fortified heated milk gels recorded between 5 and 60 min of acidification gave positive scores according to the first principal component and negative scores during the rest of the time; on the other hand, the other (raw milk, calcium-fortified raw milk, and heated milk) gels showed positive scores throughout the acidification process. This could be due to the combined effect of heating and calcium addition.
The analysis of the tryptophan spectral profile enabled the monitoring of the structural modifications of milk proteins during the process of acid coagulation induced by lemon juice. A positive peak at 346 nm (component 1) indicates a shift in tryptophan residues towards a more polar environment, suggesting partial unfolding of caseins. The second component displays positive peaks at 341 and 410 nm, in addition to a negative peak at 360 nm. These peaks are indicative of more advanced conformational reorganization, which is associated with the partial denaturation of serum proteins and the formation of complex protein–lipid interactions. The addition of calcium (10 mM) has been demonstrated to stabilize the micellar network, thereby reducing the accessibility of tryptophan to the solvent. In addition, moderate heating (65 °C, 5 min) has been shown to promote transient exposure of fluorophores. These observations, in agreement with the work of [6,24], confirm that tryptophan constitutes a sensitive marker of conformational transitions and structural evolution of proteins during acid gelation of milk.
The spectral profile of vitamin A (Figure 7f), characterized by two positive peaks at 309 and 320 nm (the second principal component) and a negative peak at 332 nm (the first principal component), reflect changes in its environment during milk acidification, which are linked to changes in viscosity and lipid–lipid and lipid–protein interactions [6,7,8,9,10,11,12,13,14,15,16,17,18,19,20,21,22,23,24]. These variations result from a reorganization of fat globules under the effect of the drop in pH, leading to a redistribution of vitamin A in the lipid phase. The addition of calcium (10 mM) stabilizes these interactions, reducing the mobility of vitamin A and inducing a spectral shift towards shorter wavelengths, characteristic of a more hydrophobic environment. In addition, moderate heat treatment (65 °C, 5 min) causes partial denaturation of whey proteins, mainly β-lactoglobulin, altering their interaction with lipids and resulting in an increase in the signal at 320–325 nm. Using fluorescence spectroscopy, the study conducted by [60] confirms that these spectral changes reflect structural adjustments of fat globules and lipid–protein interactions.
4. Conclusions
The present study examined the effects of calcium supplementation and moderate heat treatment (65 °C for 5 min) on the coagulation of N’Dama cow’s milk induced by lemon juice. The results indicated that these conditions play a pivotal role in determining the quality of the formed gel. Rheological, spectroscopic, and microscopic analyses demonstrated that calcium addition (10 mM) to raw milk promoted the formation of firmer and more stable gels with a dense and homogeneous microstructure. Conversely, the combination of heating and calcium enrichment resulted in weaker gels, which is indicative of unfavorable ternary interactions between calcium, caseins, and partially denatured whey proteins. Spectroscopic data (MIR and fluorescence) further confirmed modifications in protein–protein, protein–water, and protein–lipid interactions, which directly influenced the micellar network structure. Furthermore, aside from its citric acid content, lemon juice contains ascorbic acid, a reducing agent that has the potential to interfere with disulfide bond formation, thereby affecting protein aggregation dynamics. The findings demonstrate that lemon juice can be used as a natural and sustainable coagulant in dairy applications.
Author Contributions
Conceptualization, T.A.R.S. and R.K.; methodology, T.A.R.S. and R.K.; validation, R.K.; investigation, T.A.R.S. and R.K.; resources, A.O.S.D. and R.K.; writing—original draft preparation, T.A.R.S.; writing—review and editing, T.A.R.S. and R.K.; visualization, T.A.R.S. and R.K.; supervision, A.O.S.D. and R.K.; project administration, R.K.; funding acquisition, A.O.S.D. and R.K. All authors have read and agreed to the published version of the manuscript.
Funding
This research was supported by the BIHAUTSECO de France project, which is financed by the French State, European Union, and the French Region of Hauts-de-France.
Institutional Review Board Statement
Not applicable.
Informed Consent Statement
Not applicable.
Data Availability Statement
The original contributions presented in the study are included in the article. Further inquiries can be directed to the corresponding author.
Acknowledgments
The authors gratefully acknowledge the financial support from the Major Domain of Interest (DIM) “Eco-Energy Efficiency” of Artois University. Thierno Abdoul Rahim Sow is grateful to the Embassy of France in Guinea, as well as the French government, for the financial support and the Guinean authorities for their assistance during his stay at Artois University. Gaoussou Karamoko and Faiez Hentati are acknowledged for their help in SEM and electrophoresis analyses, respectively.
Conflicts of Interest
The authors declare that they have no conflicts of interest.
References
- Blecker, C.; Habib-Jiwan, J.M.; Karoui, R. Effect of Heat Treatment of Rennet Skim Milk Induced Coagulation on the Rheological Properties and Molecular Structure Determined by Synchronous Fluorescence Spectroscopy and Turbiscan. Food Chem. 2012, 135, 1809–1817. [Google Scholar] [CrossRef]
- Wang, F.; Yu, C.; Liu, H.; Lucey, J.A. Effect of Jujube Pulp on Acid- and Rennet-Induced Coagulation Properties of Milk. J. Dairy Sci. 2024, 107, 4298–4307. [Google Scholar] [CrossRef]
- Zhao, L.; Wu, J.; Liu, H.; Lucey, J.A. Effects of Heat Treatment and Stabilizing Salts Supplementation on the Physicochemical Properties, Protein Structure and Salts Balance of Goat Milk. LWT 2020, 132, 109878. [Google Scholar] [CrossRef]
- Rathod, G.; Boyle, D.L. Acid Gelation Properties of Fibrillated Model Milk Protein Concentrate Dispersions. J. Dairy Sci. 2022, 105, 4925–4937. [Google Scholar] [CrossRef]
- Mejares, C.T.; Chandrapala, J.; Huppertz, T. Influence of Calcium-Sequestering Salts on Heat-Induced Changes in Blends of Skimmed Buffalo and Bovine Milk. Foods 2023, 12, 2260. [Google Scholar] [CrossRef] [PubMed]
- Kamal, M.; Foukani, M.; Karoui, R. Rheological and Physical Properties of Camel and Cow Milk Gels Enriched with Phosphate and Calcium during Acid-Induced Gelation. J. Food Sci. Technol. 2017, 54, 439–446. [Google Scholar] [CrossRef]
- Koutina, G.; Andersen, U.; Risbo, J.; Skibsted, L.H.; Ipsen, R. Calcium-Induced Skim Milk Gelation during Heating as Affected by pH. Dairy Sci. Technol. 2016, 96, 79–93. [Google Scholar] [CrossRef]
- Ahmadi, E.; Vasiljevic, T.; Huppertz, T. Influence of Heating Temperature and pH on Acid Gelation of Micellar Calcium Phosphate-Adjusted Skim Milk. Foods 2024, 13, 11724. [Google Scholar] [CrossRef] [PubMed]
- Cherian, J.; Jacob, J. Green Marketing: A Study of Consumers’ Attitude towards Environment Friendly Products. Asian Soc. Sci. 2012, 8, 117–126. [Google Scholar] [CrossRef]
- Bhagiel, B.T.; Hamid, E.E.; Eltahir, H.A. Effect of Using Lemon Citrus Compared to Rennet Coagulation on Physicochemical Yield and Sensory Properties of Cheese from Cow’s Milk and Goat’s Milk. J. Food Dairy Technol. 2018, 8, 46–51. [Google Scholar]
- Wibowo, M.D.; Riyadi, P.H.; Restitrisnani, V. The Effect of Lemon (Citrus limon) as a Coagulant on Fresh Cheese Chemical Composition and Storage. Int. J. Food Eng. Technol. 2020, 8, 70–80. [Google Scholar] [CrossRef]
- Singh, H.; Waungana, A. Influence of Heat Treatment of Milk on Cheesemaking Properties. Int. Dairy J. 2001, 11, 543–551. [Google Scholar] [CrossRef]
- Liu, X.T.; Li, J.H.; Liang, L.; Lu, Y.; Lucey, J.A. Rheological and Structural Properties of Differently Acidified and Renneted Milk Gels. J. Dairy Sci. 2014, 97, 3292–3299. [Google Scholar] [CrossRef] [PubMed]
- Herbert, S.; Dufour, E.; Devaux, M.F.; Riaublanc, A. Fluorescence Spectroscopy Investigation of Acid- or Rennet-Induced Coagulation of Milk. J. Dairy Sci. 1999, 82, 2056–2062. [Google Scholar] [CrossRef]
- Kamal, M.; Karoui, R. Monitoring of Mild Heat Treatment of Camel Milk by Front-Face Fluorescence Spectroscopy. LWT 2017, 79, 586–593. [Google Scholar] [CrossRef]
- IDF Standard 105; Milk—Determination of Fat Content—Gerber Butyrometric Method. International Dairy Federation (IDF): Brussels, Belgium, 1981.
- IDF Standard 20-1; Milk—Determination of Nitrogen Content—Part 1: Kjeldahl Method. International Dairy Federation (IDF): Brussels, Belgium, 2001.
- AOAC. Official Methods of Analysis of AOAC International, 21st ed.; AOAC International: Gaithersburg, MD, USA, 2019. [Google Scholar]
- Felfoul, I.; Attia, H.; Khorchani, T.; Blecker, C. Monitoring of Acid-Induced Coagulation of Dromedary and Cows’ Milk by Untargeted and Targeted Techniques. Int. Dairy J. 2022, 127, 105300. [Google Scholar] [CrossRef]
- Laemmli, U.K. Cleavage of Structural Proteins during the Assembly of the Head of Bacteriophage T4. Nature 1970, 227, 680–685. [Google Scholar] [CrossRef]
- Karoui, R.; De Baerdemaeker, J. A review of the analytical methods coupled with chemometric tools for the determination of the quality and identity of dairy products. Food Chem. 2007, 102, 621–640. [Google Scholar] [CrossRef]
- Karoui, R.; Mouazen, A.M.; Dufour, E.; Pillonel, L.; Picque, D.; De Baerdemaeker, J.; Bosset, J.-O. Application of the MIR for the determination of some chemical parameters in European Emmental cheeses produced during summer. Eur. Food Res. Technol. 2006, 222, 165–170. [Google Scholar] [CrossRef]
- Karoui, R.; Kemps, B.; Bamelis, F.; De Ketelaere, B.; Merten, K.; Schoonheydt, R.; Decuypere, E.; De Baerdemaeker, J. Development of a rapid method based on front face fluorescence spectroscopy for the monitoring of egg freshness: 1-evolution of thick and thin egg albumens. Eur. Food Res. Technol. 2006, 223, 303–312. [Google Scholar] [CrossRef]
- Karoui, R.; Dufour, E.; De Baerdemaeker, J. Common components and specific weights analysis: A tool for monitoring the molecular structure of semi-hard cheese throughout ripening. Anal. Chim. Acta 2006, 572, 125–133. [Google Scholar] [CrossRef]
- Seme, K.; Pitala, W.; Osseyi, G.E. Qualité Nutritionnelle et Hygiénique de Laits Crus de Vaches Allaitantes dans la Région Maritime au Sud-Togo. Eur. Sci. J. 2015, 11, 359–376. [Google Scholar]
- Rayanatou, I.A.; Kabirou, A.; Kpotor, P. Physico-Chemical Characterization of Dairy Gel Obtained by a Proteolytic Extract from Calotropis procera—A Comparison with Chymosin. Food Chem. 2017, 232, 405–412. [Google Scholar] [CrossRef] [PubMed]
- Hamad, M.; Baiomy, A. Physical Properties and Chemical Composition of Cow’s and Buffalo’s Milk in Qena Governorate. J. Food Dairy Sci. 2010, 1, 397–403. [Google Scholar] [CrossRef]
- Kalandi, M.; Sow, A.; Guigma, W.V.H.; Zabre, M.Z.; Bathily, A.; Sawadogo, G.J. Évaluation de la qualité nutritionnelle du lait cru dans les élevages traditionnels de Kaolack au Sénégal. Int. J. Biol. Chem. Sci. 2015, 9, 901–909. [Google Scholar] [CrossRef]
- Gondimo, É.G.; Abakar, M.; Djamous, N.A. Evaluation of the Physico-Chemical Quality of Raw Milk Produced and Marketed in Moundou (Chad). Int. J. Biol. Chem. Sci. 2024, 18, 430–438. [Google Scholar] [CrossRef]
- Bouazizi, A.; Zouari, A.; Khorchani, T.; Hamed, M.B.; Attia, H. Physicochemical, Sensory and Coagulation Properties of Dromedary and Cows’ Skim Milk White Brined Cheeses. Int. Dairy J. 2021, 117, 105006. [Google Scholar] [CrossRef]
- Hla Soe, D.H. Study on Chemical Composition and Nutritional Values in the Juice of Citrus Limonia Osbeck. Int. J. Sci. Eng. Appl. 2020, 9, 57–63. [Google Scholar] [CrossRef]
- Deshmukh, U.; Singh, M.; Devarajan, A.; Verma, D.K.; Kumar, P. Influence of Variation in Calcium Content on Casein Micelle Stability and Techno-Functional Properties of Buffalo Milk. Int. J. Dairy Technol. 2023, 76, 533–543. [Google Scholar] [CrossRef]
- Britten, M.; Giroux, H.J. Rennet Coagulation of Heated Milk: A Review. Int. Dairy J. 2022, 124, 105179. [Google Scholar] [CrossRef]
- Mejares, C.T.; Huppertz, T.; Chandrapala, J. Effect of Calcium-Sequestering Salts and Heat Treatment on the Rheological and Textural Properties of Acid Gels from Blends of Skimmed Buffalo and Bovine Milk. Int. Dairy J. 2024, 149, 105840. [Google Scholar] [CrossRef]
- Lucey, J.A.; Wilbanks, D.J.; Horne, D.S. Impact of Heat Treatment of Milk on Acid Gelation. Int. Dairy J. 2022, 125, 105222. [Google Scholar] [CrossRef]
- Le Graet, Y.; Brulé, G. Les Équilibres Minéraux du Lait: Influence du pH et de la Force Ionique. Lait 1993, 73, 51–60. [Google Scholar] [CrossRef][Green Version]
- Guillaume, C.; Lemoine, J.; Ducret, P.; Gervais, P. Effect of Salt Addition on the Micellar Composition of Milk Subjected to pH Reversible CO2 Acidification. J. Dairy Sci. 2002, 85, 2098–2105. [Google Scholar] [CrossRef]
- Hinrichs, J. Incorporation of Whey Proteins in Cheese. Int. Dairy J. 2001, 11, 495–503. [Google Scholar] [CrossRef]
- Schreiber, R.; Hinrichs, J. Rennet Coagulation of Heated Milk Concentrates. Lait 2000, 80, 33–42. [Google Scholar] [CrossRef]
- Kethireddipalli, P.; Hill, A.R. Rennet Coagulation and Cheesemaking Properties of Thermally Processed Milk: Overview and Recent Developments. J. Agric. Food Chem. 2015, 63, 9389–9403. [Google Scholar] [CrossRef]
- Lucey, J.A.; Singh, H. Formation and Physical Properties of Acid Milk Gels: A Review. Food Res. Int. 1997, 30, 529–542. [Google Scholar] [CrossRef]
- Fox, P.F.; McSweeney, P.L.H. Milk Proteins: Inter-Species Comparison of Milk Proteins: Quantitative Variability and Molecular Diversity. In Encyclopedia of Dairy Sciences, 2nd ed.; Fuquay, J.W., Ed.; Academic Press: London, UK, 2011. [Google Scholar] [CrossRef]
- Zouari, A.; Khorchani, T.; Attia, H. Acid Gelation of Raw and Reconstituted Spray-Dried Dromedary Milk: A Dynamic Approach of Gel Structuring. Int. Dairy J. 2018, 81, 95–103. [Google Scholar] [CrossRef]
- Zhao, L.; Liu, H.; Wang, H.; Lucey, J.A. Effect of Ultrasound Pretreatment on Rennet-Induced Coagulation Properties of Goat’s Milk. Food Chem. 2014, 165, 167–174. [Google Scholar] [CrossRef] [PubMed]
- Horne, D.S. Casein Interactions: Casting Light on the Black Boxes, the Structure in Dairy Products. Int. Dairy J. 1998, 8, 171–177. [Google Scholar] [CrossRef]
- Walstra, P. On the Stability of Casein Micelles. J. Dairy Sci. 1990, 73, 1965–1979. [Google Scholar] [CrossRef]
- Lucey, J.A.; Fox, P.F. Importance of Calcium and Phosphate in Cheese Manufacture: A Review. J. Dairy Sci. 1993, 76, 1714–1724. [Google Scholar] [CrossRef]
- Dalgleish, D.G.; Law, A.J.R. pH-Induced Dissociation of Bovine Casein Micelles. I. Analysis of Liberated Caseins. J. Dairy Res. 1988, 55, 529–538. [Google Scholar] [CrossRef]
- Anema, S.G.; Klostermeyer, H. Heat-Induced, pH-Dependent Dissociation of Casein Micelles on Heating Reconstituted Skim Milk at Temperatures below 100 °C. J. Agric. Food Chem. 1997, 45, 1108–1115. [Google Scholar] [CrossRef]
- Antuma, L.J.; Delavaud, C.; Gaucheron, F.; Lopez, C.; Henry, G. Engineering Artificial Casein Micelles for Future Food: Preparation Rate and Coagulation Properties. J. Food Eng. 2024, 366, 111868. [Google Scholar] [CrossRef]
- Adhikari, A.K.; Mathur, O.N.; Patil, G.R. Texture and Microstructure of Chhana and Rasogolla Made from Cows’ Milk. J. Dairy Res. 1992, 59, 413–424. [Google Scholar] [CrossRef]
- Tamime, A.Y.; Kalab, M.; Davies, G. Microstructure of Set-Style Yoghurt Manufactured from Cow’s Milk Fortified by Various Methods. Food Microstruct. 1984, 3, 83–92. Available online: https://digitalcommons.usu.edu/foodmicrostructure/vol3/iss1/11 (accessed on 12 March 2025).
- Dufour, E.; Riaublanc, A.; Herbert, S.; Devaux, M.F. Phase Transition of Triglycerides during Semi-Hard Cheese Ripening. Int. Dairy J. 2000, 10, 81–93. [Google Scholar] [CrossRef]
- Karoui, R.; Mazerolles, G.; Bosset, J.O.; De Baerdemaeker, J.; Dufour, E. Utilisation of mid-infrared spectroscopy for determination of the geographic origin of Gruyère PDO and L’Etivaz PDO Swiss cheeses. Food Chem. 2007, 105, 847–854. [Google Scholar] [CrossRef]
- Karoui, R.; Dufour, E.; Bosset, J.O.; De Baerdemaeker, J. Monitoring the Geographic Origin of French Jura and Swiss PDO Cheeses Using Mid-Infrared and Fluorescence Spectroscopies: A Preliminary Study. Int. Dairy J. 2005, 15, 275–286. [Google Scholar] [CrossRef]
- Ayvaz, H.; Gokoglu, N.; Ceylan, Z.; Eren, M.; Senturk, M. Near- and Mid-Infrared Determination of Some Quality Parameters of Cheese Manufactured from the Mixture of Different Milk Species. J. Food Sci. Technol. 2021, 58, 3981–3992. [Google Scholar] [CrossRef]
- Dufour, E.; Riaublanc, A.; Devaux, M.F.; Herbert, S. Phase Transition of Triglycerides in Fat Globules during Semi-Hard Cheese Ripening as Studied by Mid-Infrared and Front-Face Fluorescence Spectroscopy. In Spectroscopy of Biological Molecules: New Directions; Springer: Dordrecht, The Netherlands, 1999; pp. 351–352. [Google Scholar] [CrossRef]
- Khalil, M. Interactions et Stabilité des Protéines Étudiées par Spectroscopies Infrarouge et Raman. Ph.D. Thesis, Université de Strasbourg: Strasbourg, France, 2016. [Google Scholar]
- Dufour, R.I.C.; Boubellouta, T.; Galtier, V. Structural Changes of Milk Components during Acid-Induced Coagulation Kinetics as Studied by Synchronous Fluorescence and Mid-Infrared Spectroscopy. Appl. Spectrosc. 2011, 65, 284–292. [Google Scholar] [CrossRef]
- Sanchez, M.-P.; Wolf, V.; Laithier, C.; El Jabri, M.; Beuvier, É.; Rolet-Répécaud, O.; Gaudillière, N.; Minéry, S.; Ramayo-Caldas, Y.; Tribout, T.; et al. Analyse génétique de la « fromageabilité » du lait de vache prédite par spectrométrie dans le moyen infrarouge en race Montbéliarde. Genet. Sel. Evol. 2019, 51, 1–20. [Google Scholar] [CrossRef]
- Panikuttira, B.; Howard, A.; Deeth, H.; Chen, X.D. Evaluation of a Fluorescence and Infrared Backscatter Sensor to Monitor Acid Induced Coagulation of Skim Milk. Innov. Food Sci. Emerg. Technol. 2019, 54, 219–224. [Google Scholar] [CrossRef]
- Karoui, R.; Dufour, É. Prediction of the rheology parameters of ripened semi-hard cheeses using fluorescence spectra in the UV and visible ranges recorded at a young stage. Int. Dairy J. 2006, 16, 1490–1497. [Google Scholar] [CrossRef]
- Kulmyrzaev, A.; Dufour, É.; Noël, Y.; Hanafi, M.; Karoui, R.; Qannari, E.; Mazerolles, G. Investigation at the Molecular Level of Soft Cheese Quality and Ripening by Infrared and Fluorescence Spectroscopies and Chemometrics—Relationships with Rheology Properties. Int. Dairy J. 2005, 15, 669–678. [Google Scholar] [CrossRef]
- Dufour, E.; Riaublanc, A. Potentiality of Spectroscopic Methods for the Characterisation of Dairy Products. 1. Front-Face Fluorescence Study of Raw, Heated and Homogenised Milks. Lait 1997, 77, 657–670. [Google Scholar] [CrossRef]
Disclaimer/Publisher’s Note: The statements, opinions and data contained in all publications are solely those of the individual author(s) and contributor(s) and not of MDPI and/or the editor(s). MDPI and/or the editor(s) disclaim responsibility for any injury to people or property resulting from any ideas, methods, instructions or products referred to in the content. |
© 2025 by the authors. Licensee MDPI, Basel, Switzerland. This article is an open access article distributed under the terms and conditions of the Creative Commons Attribution (CC BY) license (https://creativecommons.org/licenses/by/4.0/).