Article

Analysis of the Wave Characteristics of the Baltic Sea in Terms of the Use of Wave Energy Converters

by
Karol Jakub Listewnik
and
Janusz Mindykowski
*
Department of Marine Electrical Power Engineering, Faculty of Electrical Engineering, Gdynia Maritime University, 81-225 Gdynia, Poland
*
Author to whom correspondence should be addressed.
Appl. Sci. 2025, 15(18), 10078; https://doi.org/10.3390/app151810078
Submission received: 18 July 2025 / Revised: 2 September 2025 / Accepted: 3 September 2025 / Published: 15 September 2025
(This article belongs to the Special Issue Dynamics and Control with Applications to Ocean Renewables)

Abstract

Obtaining electricity from water wave energy using energy converters has a long history, but there are still relatively few commercial devices in the world compared to other solutions using renewable energy. The probable reasons for this state of affairs are operating costs, the cost of minimizing navigation risk for ships, and the geographical and hydro-meteorological specificity of various sea areas, resulting in the use of different, difficult-to-unify solutions. It can be concluded based on a literature analysis that there are no similar commercial solutions in Poland. This article presents the characteristics of waves in the South Baltic Sea near the Polish coast. Calculations of the output power were carried out for a selected type of wave energy converter (point absorber—PA) with different design parameters stimulated by wave energy with variable amplitude and period. These calculations for three characteristic cases are related to a feasibility study of the placement of power point absorbers in the water area around the port of Łeba in Poland. Finally, a short analysis of the results is presented. The obtained calculation results under Polish EEZ conditions are promising because we obtained above 304 KW of energy for 17% of the wave time per year, which seems to be good for local applications.

1. Introduction

There has been a rapid increase in electricity consumption around the world because of human population growth and technological development, necessitating an increase in electricity generation capacity to meet the global demand [1]. Over the past 20 years, about three-quarters of all anthropogenic carbon dioxide emissions were due to the extraction and combustion of oil, natural gas, and coal, with almost half of these emissions being attributed to terrestrial vegetation and oceans [2]. Most of the remaining carbon dioxide emissions were caused by landscape changes, primarily deforestation [3]. The electricity generation system relies mainly on conventional fossil fuels (natural gas, coal, oil, etc.), which are gradually declining and causing environmental problems such as rising sea levels, floods, storms, and cyclones [1]. The effects of global warming also include desertification, regional changes in rainfall, and more extreme weather events such as heat waves [2]. Fossil fuels are a source of energy whose resources are used up much faster than they are replenished, so we are inevitably threatened with their depletion [4]. In order to reduce carbon dioxide emissions and increase awareness of the limited resources of conventional fuels, scientists have been researching alternative methods of generating electricity for many years [5]. Renewable energy sources (RESs) are based on cyclically repeating natural processes, the resources of which should not be depleted or should be replenished quickly enough so the costs of obtaining energy are practically zero [6,7]. Obtaining energy from RESs, as well as the process of their use, has no or negligible impact on the environment and climate [8]. The use of appropriate technology for obtaining energy from RESs, depending on geographical and climatic conditions, enables equal access for societies and gives them the opportunity to obtain energy even in regions that do not have non-renewable energy sources, i.e., fossil fuels [8]. Table 1 presents the primary renewable energy sources along with the processes of their technical conversion into other forms that are easier to use (the type of discussed energy is marked with a gray background and bold font).
According to the Renewables 2016 Global Status Report [9], fossil fuel consumption accounts for ~78.3% of total global energy consumption, followed by renewable energy sources with 19.2%. Traditional biomass accounts for 8.9%, while modern renewable energy has a share of 10.3%, dominated by solar and wind energy. Globally, the renewable energy sector grew from 85 to ~560 GW between 2004 and 2013 (excluding hydropower). The wind industry led the sector with an increase from 48 to 318 GW, followed by the photovoltaic sector from 2.6 to 139 GW. The growth in the renewable sector was driven by a number of factors, including policy support, financial incentives, and cost reductions in technologies that make renewable energy cost-competitive [10]. Renewable energy is a commodity like other forms of energy that has an important role to play in meeting the world’s energy needs and reducing the danger of global warming [4].
Table 2 and Table 3 present detailed advantages and disadvantages of renewable energy sources and water (wave) energy, respectively.
This article focuses on the use of sea wave energy (Table 1). However, this is only one of the several types of energy related to the marine and ocean environment. It is estimated that the seas and oceans of our planet generate 70–140 PWh of energy annually, and 8–80 PWh is sea wave energy [11].
The limitations observed for commercial water wave energy converters around the world are mainly caused by operating costs, as well as others related to the durability of materials that should remain operable in salty water for many years.
Another cost component is linked to the costs of laying a power cable on the bottom of the sea and the need to minimize navigation risk for ships. The final factor forming the operating costs is the geographical and hydro-meteorological specificity of various sea areas and the related need to use different solutions that are often difficult to unify.
The seas and oceans constitute a significant reserve of energy, which is distributed in various phenomena [12]:
  • Sea currents;
  • Osmotic salinity;
  • OTEC (abbreviation for Ocean Thermal Energy Conversion);
  • Tides (high and low tides);
  • Sea waves.
Each of these ocean energy sources has the appropriate potential for human use; however, as Table 4 shows, sea waves and sea currents have the greatest energy potential [13].
Among renewable energy sources, the exploitation of sea waves is a sector that has emerged recently, although the first device using wave energy was patented in France in 1799 [14]. In 1910, a column was created near Bordeaux in which oscillating sea water powered a generator, and the energy crisis in 1973 influenced the increased interest in the use of sea energy, which resulted in the creation of many projects (mainly on paper or in the form of models) of structures using sea wave energy, of which over a thousand have been patented to date [15,16].
In the remainder of this article, by carefully analyzing the wave conditions and considering the specific characteristics of the Polish Exclusive Economic Zone (EEZ), it is possible to optimize the design and placement of WECs to maximize their electric energy yield and contribute to Poland’s renewable energy goals. This task is discussed in the following sections. Section 2, “Materials and Methods,” presents the Baltic Sea energy potential and the Baltic Sea wave characteristics. Furthermore, Section 3, “Results and Discussion,” presents the results of three characteristic cases, which are discussed and used as a basis for the Conclusions. References are cited at the end of the paper.

2. Materials and Methods

2.1. The Baltic Sea Energy Potential

Various sources indicate that the global wave potential is 10,000–15,000 TWh per year, with the Baltic Sea estimated at 24 TWh [17,18], but many comparisons omit the countries bordering the Baltic Sea. Countries such as Denmark and Germany are included, whose wave energy potential is derived not only from the Baltic Sea but mainly from the North Sea [19] (Table 5). Meanwhile, according to Eurostat [20], there has been rapid development in renewable energy technologies; in European Union countries, an average of 24.5% of energy consumed came from renewable sources in 2023 (2024 is still being developed), which represents an increase of over 6% compared to 2022, when renewable energy consumption accounted for 23% of total energy consumption. It turns out that the countries around the Baltic Sea are leaders in the production and use of renewable energy sources other than wave energy compared to the EU. Norway (together with Iceland) has the highest use of renewable energy (75%) in Europe. This is followed by Sweden (66%), Finland (50%), Denmark (45%), Latvia (43%), Estonia (41%), and Lithuania (32%). Poland ranks a distant 23rd in the EU (16%) in terms of renewable energy use, although, like in other European countries, the development of energy sources based on renewable energy has accelerated in recent years.
The general development of renewable energy sources in countries around the Baltic Sea has also attracted interest in less common energy sources, i.e., wave energy, and many countries have started research and produced prototypes of wave energy converters (WECs) [21,22]. The Baltic Sea is referred to as a low-energy sea [21]; however, testing of various types of small- and medium-sized WECs, such as single buoys, pendulums, linear tubular devices, SEAREV, Seaspoon, and Eagle WECs, can be used in the Baltic Sea [22]. The average power of wave energy Pmean ranges between 1.5 and 5.2 kW/m [22] and averages 4 kW/m [21], which is relatively low compared to ocean wave energy. However, calculations have shown that these solutions can be economically feasible.

2.2. The Baltic Sea Wave Characteristics

The global wave power map presented in [23] clearly shows the areas with the highest wave energy, which are marked in red in Figure 1.
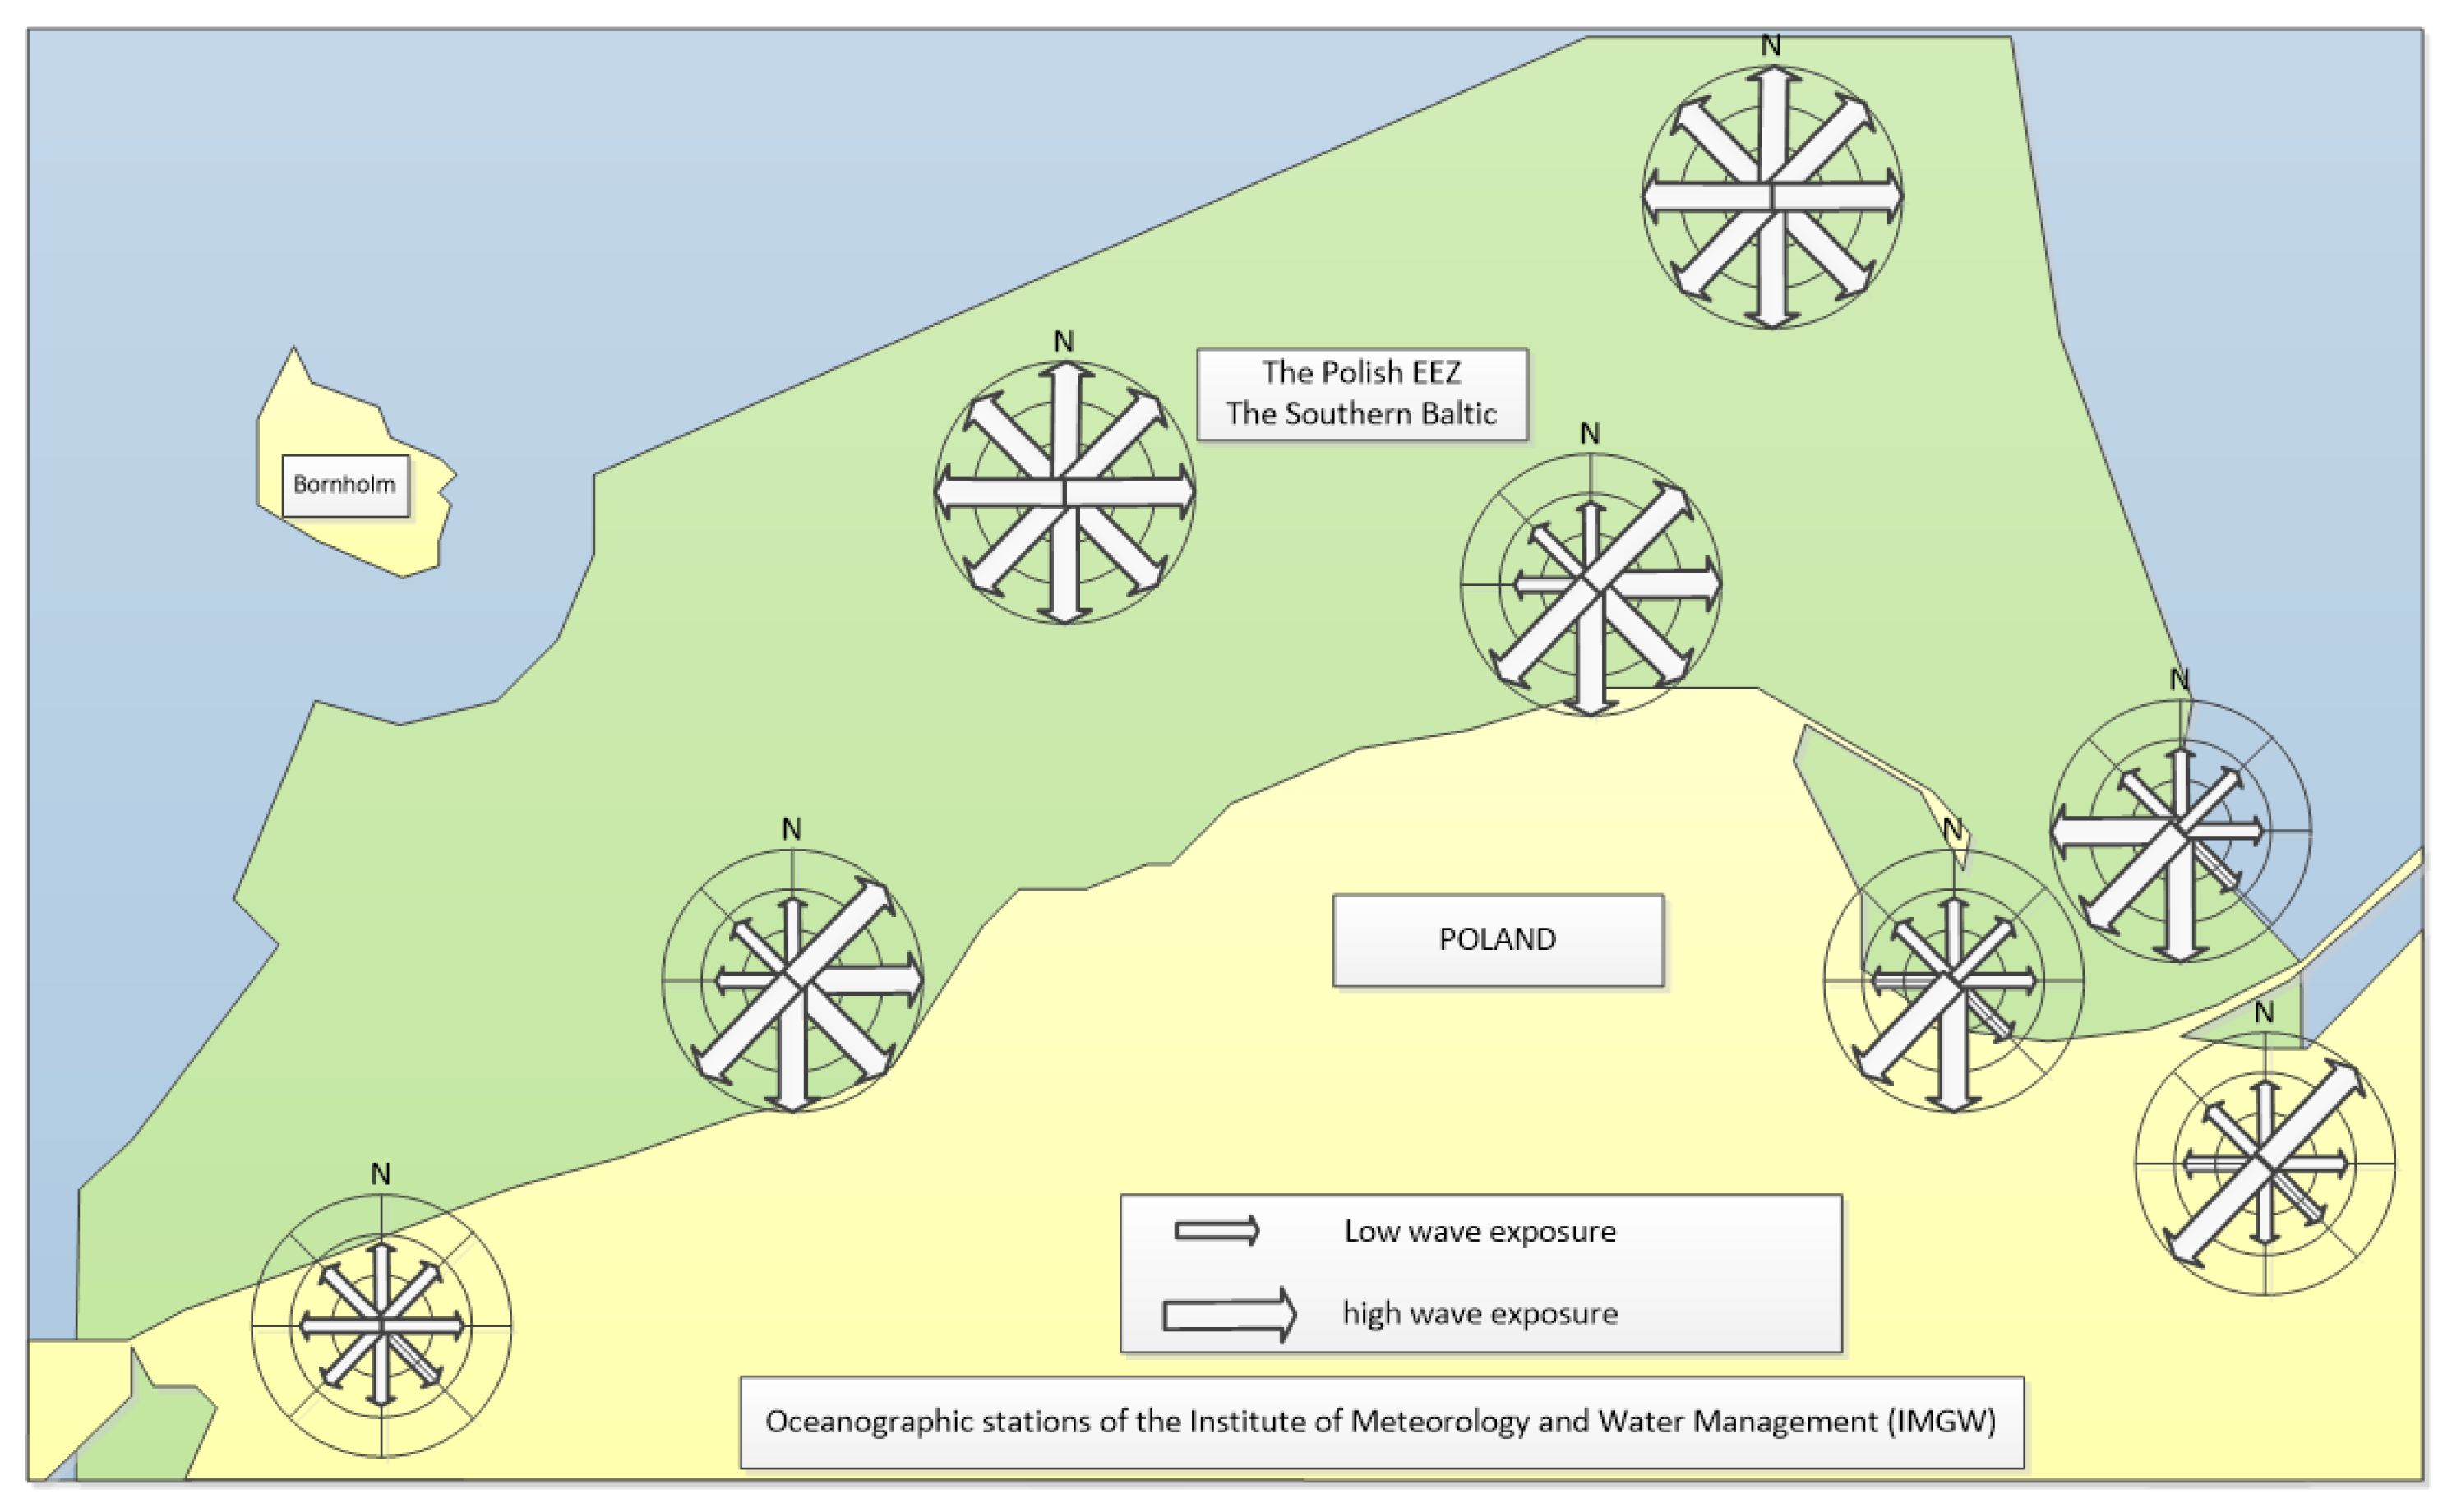
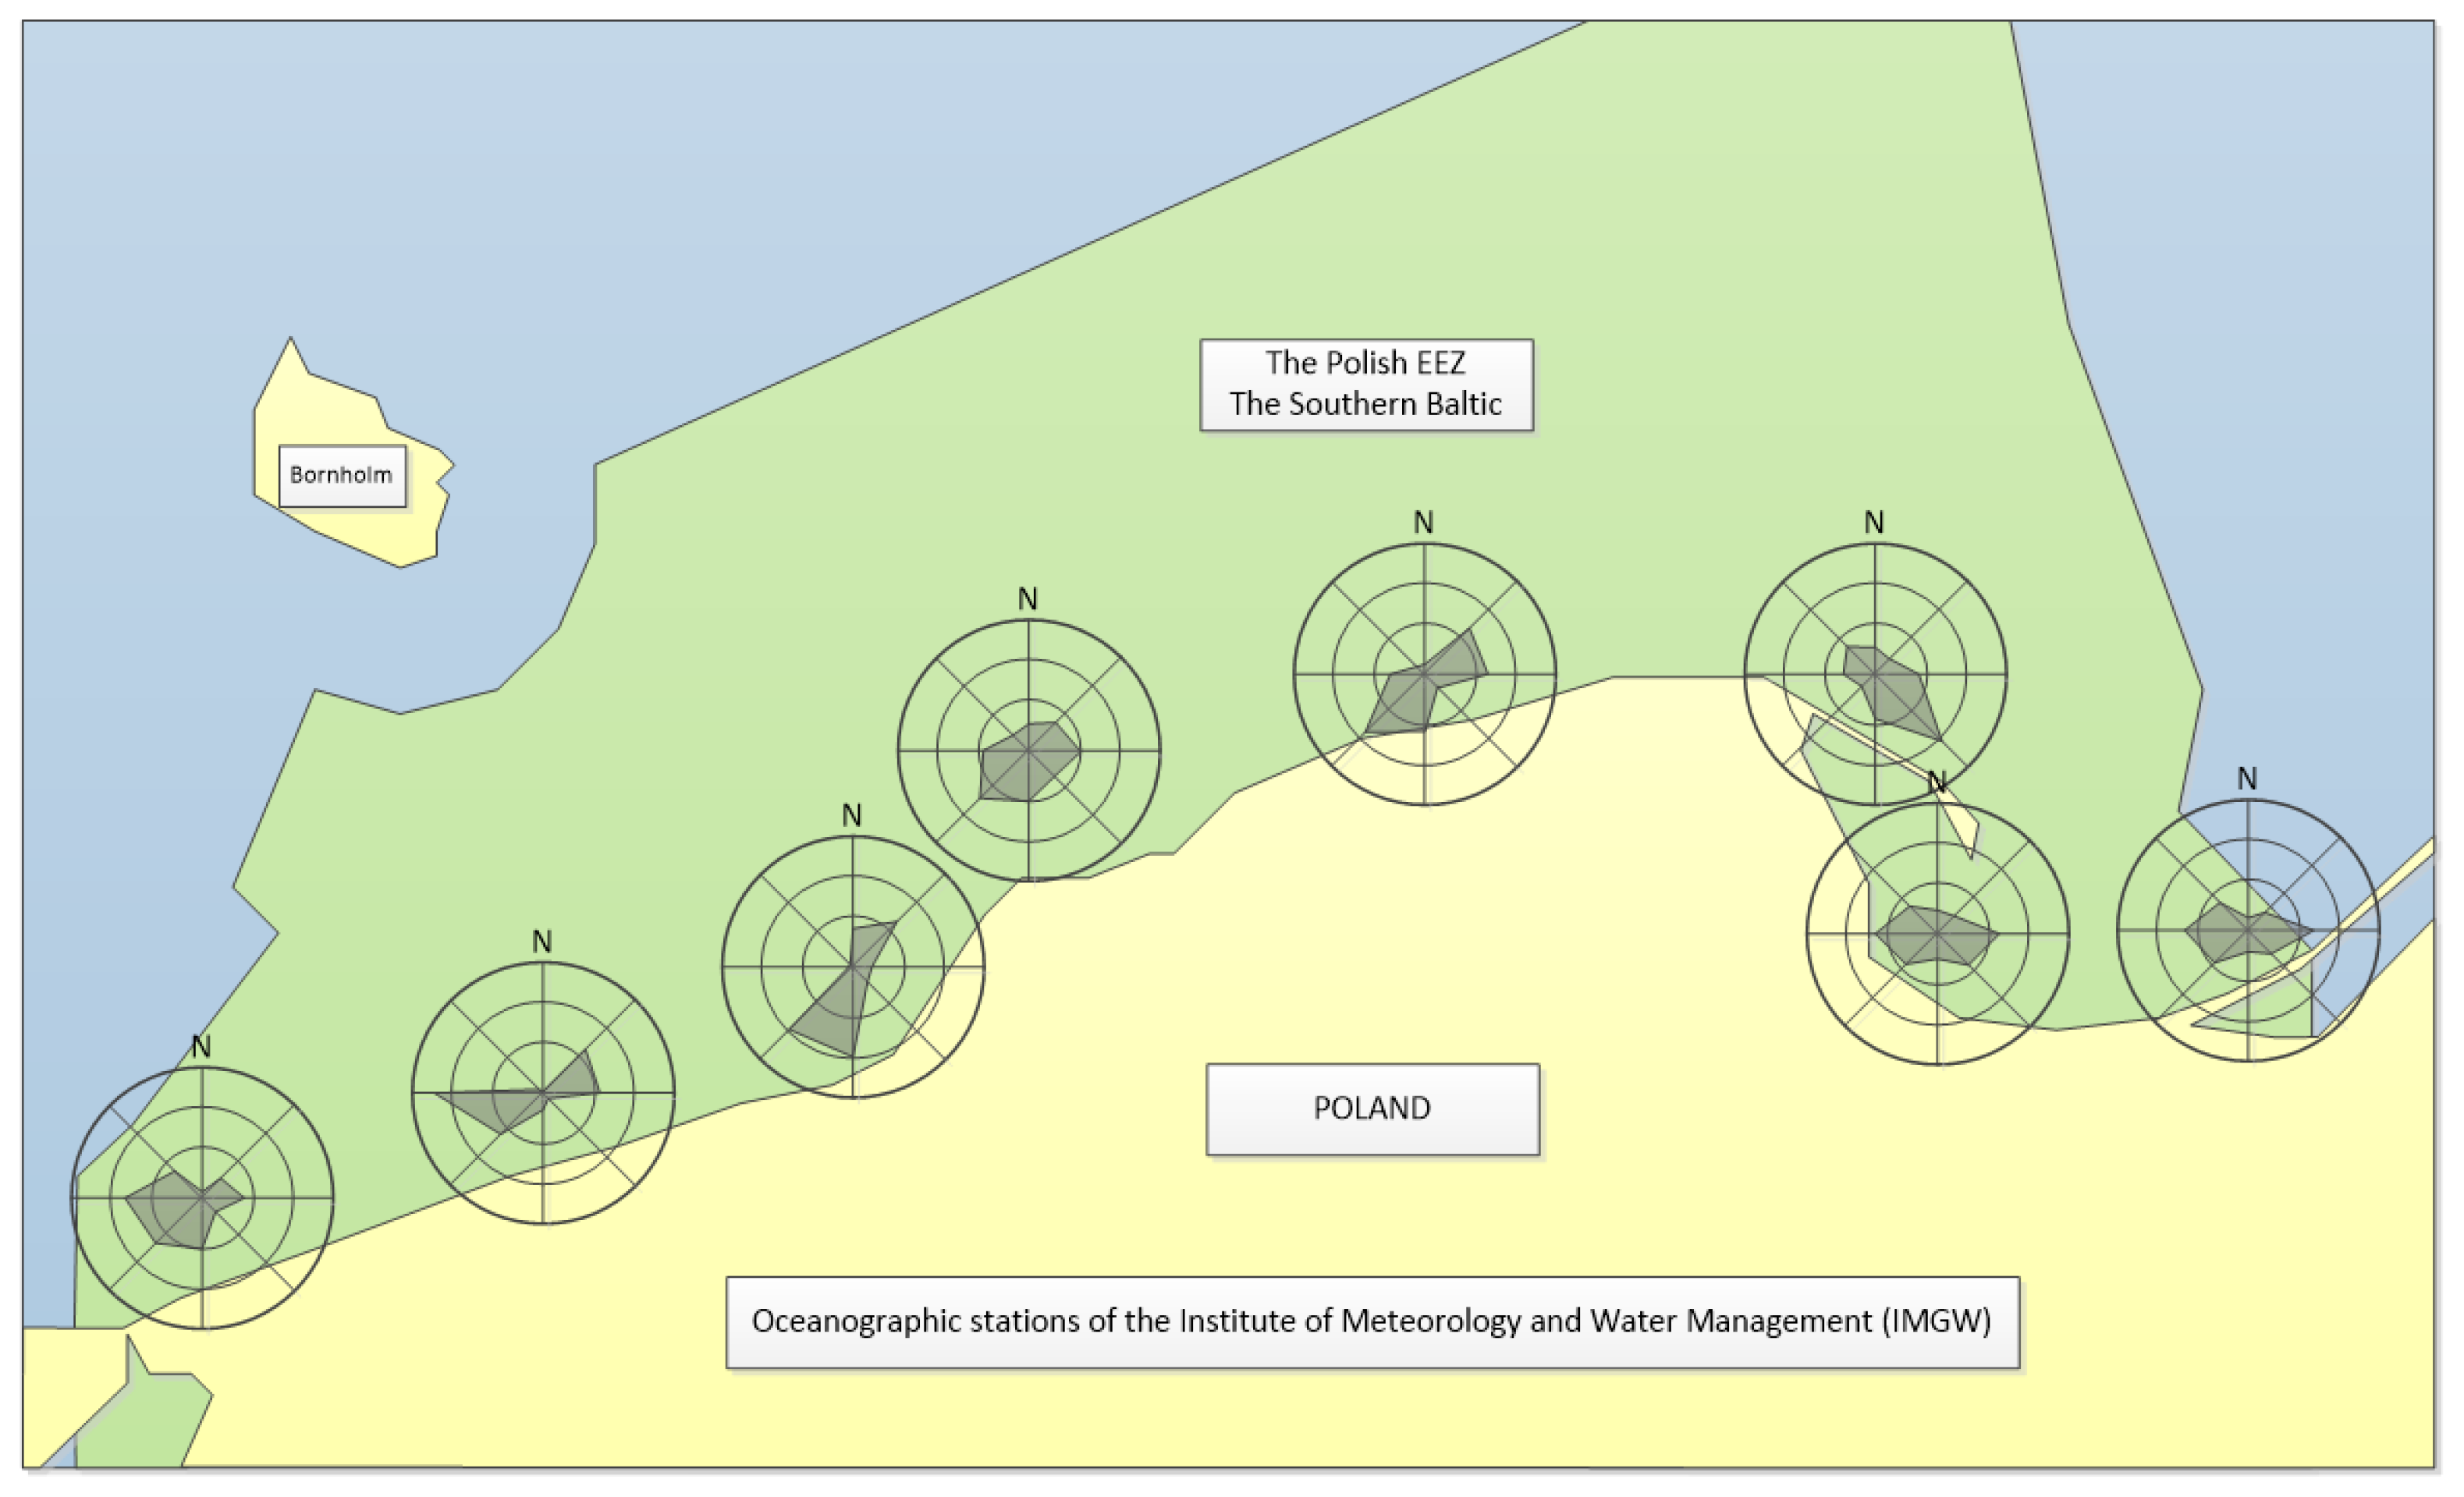
Figure 2 presents the characteristics of waves in the Polish zone of the Baltic Sea. It can be seen wave energy is only available in all wave directions in the high seas, while it depends on the location and direction of the waves in the coastal zone. Figure 3 shows the frequency [%] of strong winds [≥10 m/s] at Polish coastal stations during 1969–1998 and 1999–2008 prepared based on long-term historical data from the Institute of Meteorology and Water Management (IMGW) collected as part of the hydrological and meteorological service [24]. It is noted that in recent years, despite the intensification of violent weather phenomena due to climate change, the average wind force is significantly lower than in the previous 30-year period (1969–1998). Wind strength is strongly correlated with significant wave height and period—the stronger the wind, the higher the wave and the longer the wave period. Furthermore, because climate change affects the wave energy resource, the maximum wave energy flux exceeds the average value more than 100 times [17,25] and, at present, we have a significantly lower average wave energy than in years of slower climate change (1969–1998). Additionally, sea currents (especially surface currents), which tend to align with the wind over long periods, can amplify the change in significant wave height (higher when the current and wind are in opposition and lower when they are in harmony) and shorten the wave period (shorter when the current and wind are in opposition and longer when they are in harmony). Figure 4 shows the exposure to surface currents in the Exclusive Economic Zone of Poland (EEZ).
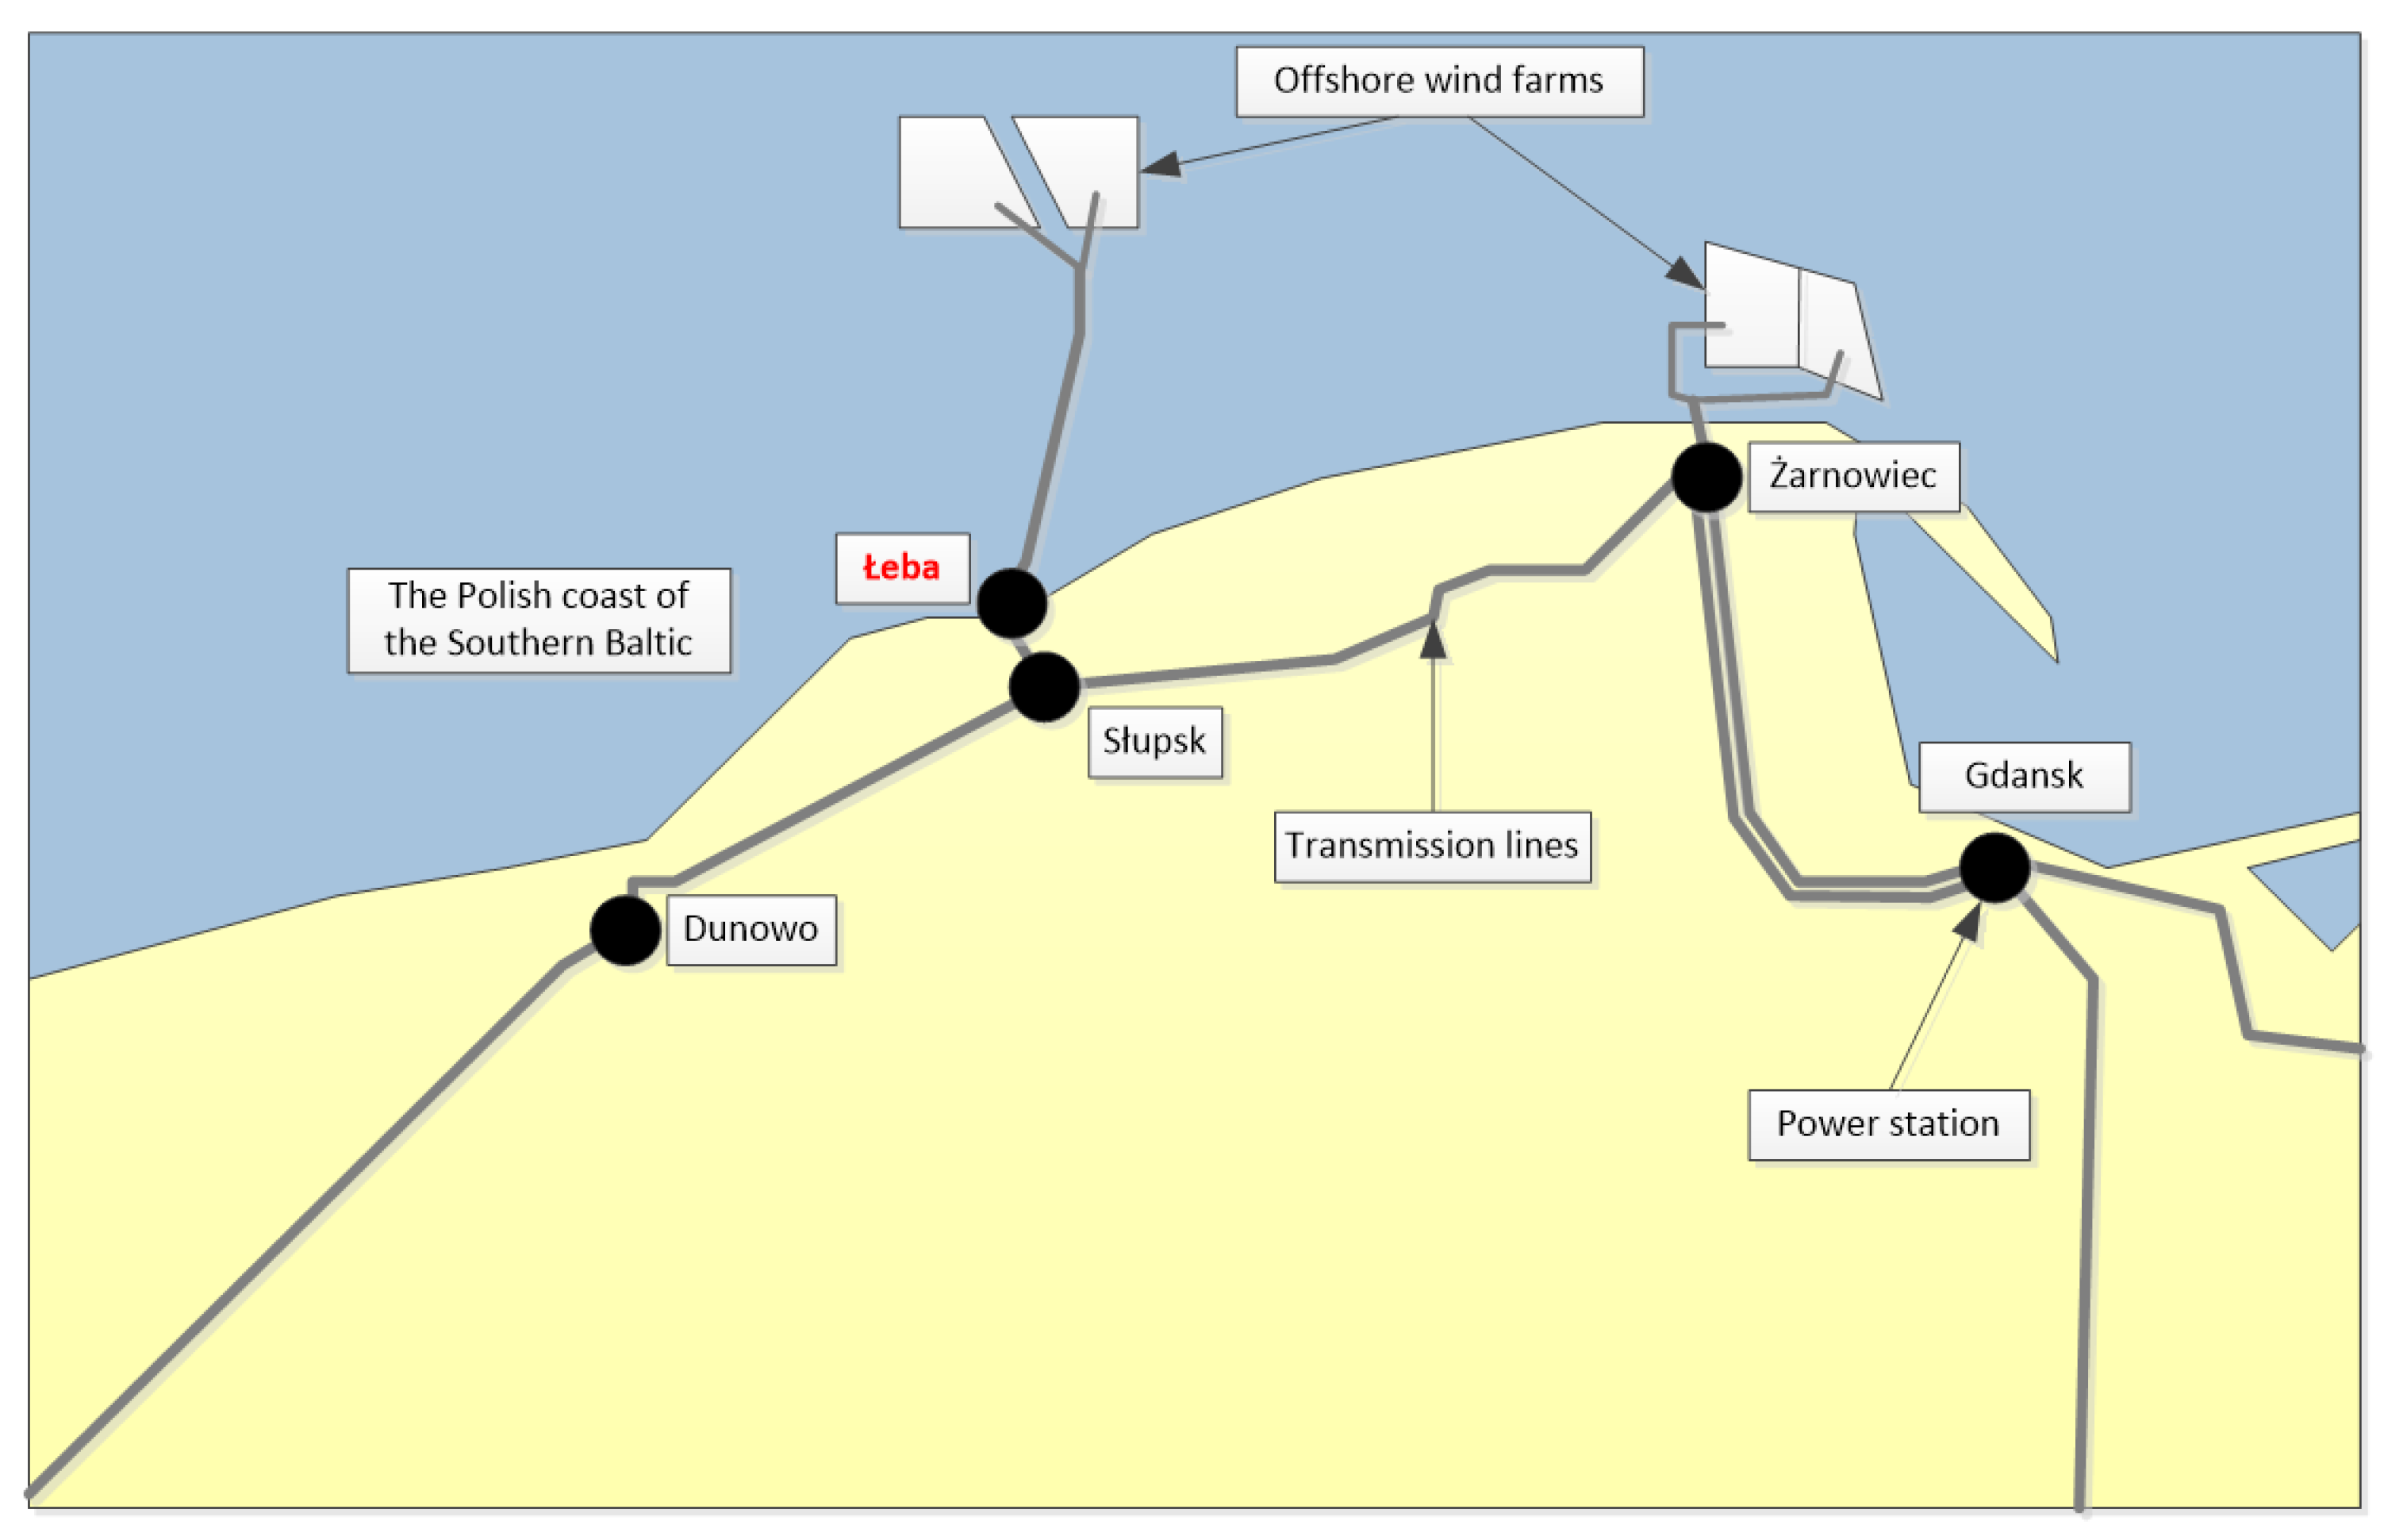
Figure 5 presents the Northern Power Grid in Poland, the potential connection of offshore wind farms, the possibility of connecting wave energy converters in the future, and the conditions of power grid connections in the Polish zone of the Baltic Sea. As expected, the analysis showed that, in principle, the highest wave energy in the Polish coastal zone (Southern Baltic) occurs in locations with the highest air density necessary to power wind generators. Any new medium-power electricity generation installation should be connected to the electricity distribution grid, which significantly expands the scope of the problem. It is not sufficient to focus on building WECs; energy must also be received, so the WEC installation must be connected to the power grid via transmission lines and power stations. Due to the enormous costs of building a new power grid, it is worth considering/planning the use of the newly constructed power grid for the transmission and management of energy obtained from offshore wind farms. The locations of new wind farms in Poland and the distribution of the power grid are also shown in Figure 5.
The wave characteristics of the Baltic Sea in the Polish Exclusive Economic Zone (the Southern Baltic) are relatively well understood thanks to the wind farm construction program. Multi-year studies have been conducted, primarily to assess the impact of wave action on wind farm monopoles, but also to address the need to reconstruct ports to accommodate service and installation ports as part of the wind farm construction program. This data can also be used for other purposes, such as calculating power from wave energy, as exemplified by this article. According to [26], wave data were downloaded from the Copernicus database, with the data derived from a hindcast for the period from 1 January 1993 to 2020. Calculations of wave parameters (significant wave heights Hs and peak periods T) were determined using the WAM 4.6.2 wave model. Historical data were obtained using the expedition method (there was no continuous monitoring); currently, data on sea and ocean wave movements are obtained from satellite measurements, e.g., Jason 3. It can be expected that these data will become much more accurate in the future.

2.3. Selecting a Wave Energy Converter

Not all obtained wave energy needs to be converted into electricity. Wave energy can be directly converted into pneumatic or hydraulic pressure and used to compress air or drive inertial masses, which act as energy stores, or used directly to perform work, or indirectly converted into electricity [14]. Direct and indirect uses of wave energy include desalination, hydrogen production, pumped-storage hydropower, photovoltaic panel integration, and co-location of wind and wave farms. Although wave energy converters can mitigate beach erosion, they can also negatively impact aquatic ecosystems through vibration and sustained low-frequency noise, but their environmental impact has received little attention (no extensive research) [25].
A wave energy converter (WEC) refers to machines, devices, and methods used to harness wave energy and convert it into an energy source, including electrical power. Wave energy is converted into the energy of working fluids (working fluids vary depending on the type of wave energy converter) and then converted into mechanical energy by an engine or turbine, which then generates electricity [27,28]. The final step in converting wave energy into usable energy is called power take-off (PTO) (air turbine, power hydraulics, electrical generator, or other) [14]. Wave energy converters can be divided into different categories depending on their location, energy extraction system, wave orientation, and type of system motion. One of the main decisions regarding the use of wave energy is the selection of a high-efficiency converter that is suitable and adapted to the selected location. In this study, the issue of WECs is limited only to those that directly convert wave energy into electrical energy.
Bearing in mind the work of Falcão [14], the authors expanded the WEC classification, dividing it into three categories based on their mode of operation:
  • An oscillating water column (OWC). With an air turbine, e.g., fixed structures: Pico (Azores, Portugal)—1986–2018; LIMPET (Scotland, GB)—1987–2011; Sakata (Japan)—2011; Mutriku (Spain)—2011. Floating structures: Mighty Whale (Japan)—1998. Lower-scale European applications—OE buoy: 15 m long 1/4-scale (Ireland)—2006; Sperboy: 1/5th scale (UK)—1999–2001; Ocean Energy (Consortium), Oceanlinx (Australia)—1997.
  • Oscillating bodies. Hydraulic motor, hydraulic turbine, and linear electrical generator: Floating: AquaBuOY (Ireland, Canada)—2000; IPS Buoy (Portugal)—1995; FO3 (Norway)—2009; Wavebob (Ireland)—2007; PowerBuoy (USA)—1997; Pelamis (UK)—2007; PS Frog (UK)—1990; SEAREV (France)—2002. Submerged: AWS WaveSwing (UK)—2022; Oyster (UK)—2005; WaveRoller (Portugal)—2012.
  • Overtopping. Low-head hydraulic turbine: Fixed structure: TAPCHAN (Norway)—1985; SSG (Sea Slot-cone Generator) (Norway)—2004.
Many of the WECs mentioned above operate in different areas and at different scales [25]. The above list is not exhaustive of the WECs operating in the sea, but it shows that they have been in operation for many years, and some, like Pico and LIMPET, have already been decommissioned. However, it provides valuable data and experience for the construction of future generations. Increasingly more solutions are emerging, including in the Baltic Sea, e.g., Seabased (Sweden), 2006–2009.
Based on the above selection, a point wave energy absorber that is a part of the oscillating bodies was chosen for further calculations due to its relatively simple design and wide application worldwide. Furthermore, power take-off (PTO) systems used in point wave energy absorbers appear to be easier to implement.
A floating wave absorber utilizes wave motion in a single location and is characterized by a limited horizontal size compared to its vertical dimensions. Most point absorber designs resemble a standard buoy. A point absorber is typically attached to the seabed at one end (with the power take-off (PTO) system), while the other moves vertically, supported by a buoyancy tank (usually a buoy), as wave crests and troughs lift and lower the device.

2.4. Wave Energy Calculation

The overall efficiency of point absorbers (PAs) depends on the wave energy resources, design, and power take-off (PTO) efficiency [29]. Power output can be calculated using
P = 0.5 ϱ A C H S 2 C g
where P is the power output in kW, ρ is the density of seawater given by 1005 kg/m3, the salinity is assumed to be 7 PSU for the Southern Baltic Sea [30], A is the area of the buoy (floating structure) in m2, C is the capture width ratio, HS is the significant wave height in m, and Cg is the group velocity of the ocean waves in m/s from
C g = 0.5 g T π
where T is the sea wave period.
Assumptions for calculating the power obtained from a point energy absorber take into account the specific characteristics of the southern Baltic Sea. The frequency of strong winds at Polish coastal stations during 1969–1998 and 1999–2008 is presented in Figure 3. It indicates that the most favorable conditions for locating a point absorber are found offshore near the port of Darłowo. However, the calculations were made for the Łeba area and not for Darłowo, because more accurate statistical data are available for Łeba, and the highest frequency of strong winds (≥10 m/s) at Polish coastal stations occurs there. The height, period, and speed of wave propagation depend on the wind force and direction, the duration of its interaction with sea waves, and the area of influence. Simplifying, it can be assumed that sustained winds blowing from one direction with significant force in open water with a large area without islands reach the greatest height and length (or period). Waves up to 8 m high have been recorded in the southern Baltic Sea. According to [31], the maximum capture width ratios for conventional bistable WECs are 0.67. A point absorber radius of 5 m was assumed for the calculations. The purpose of this study was to determine whether satisfactory energy yields are possible under realistic, statistical wave conditions (based on a detailed wave research report [26]). This article is not intended to provide a detailed analysis of yields based on detailed technical details; rather, it is a rough estimate to answer the question of whether it is worth designing a point absorber for wave energy for these conditions. A point-absorber radius of 5 m was estimated based on the potential contractor’s capabilities, the ability to transport it from the construction site to the final destination, and the ability to ensure proper operation/selection of an electrical machine capable of driving the mechanical energy generated by the point absorber and receiving electrical energy from its location. An additional argument for choosing a point absorber is the fact that the water in question is heavily trafficked by small passenger, fishing, and recreational vessels. It appears that a point absorber causes the least disruption to navigational routes in this water. Furthermore, the use of this type of absorber as a navigational marker in this water may be a factor in its use.
Three characteristic significant wave heights and corresponding wave periods near the port of Łeba were assumed from [26] and used in the wave energy calculations. Historical data on wave activity on the Polish Coast have been collected for many years, but these are mainly randomized, with estimates made throughout the period under consideration. Wave energy calculations should be based on the most recent and best-documented data possible. Although these data are also not continuous, their structure is clear and thoroughly described in the cited publication [26]; therefore, the authors believe they provide a good basis for further calculations. The first value corresponds to the longest average significant wave height in this water area during the year (92.93 days, blowing wind during 25.4% of the year) and is 0.73 m with an average wave period of 4.99 s, rounded to 5 s. The second value corresponds to the wind force defined as a strong wind >10 m/s, which, according to Figure 3, accounts for 17% of the winds blowing near the port of Łeba. The average significant wave height is 2.22 m with an average wave period of 7.14 s, rounded to 7.1 s. The last value used in the calculations corresponds to the highest recorded significant wave height in this water area, 5.24 m, and a wave period of 9.9 s.

3. Results and Discussion

Based on the above assumptions, three characteristic cases were considered for the water area around the port of Łeba:
Case 1. For the significant wave height most frequently occurring in this area (25%);
Case 2. For strong winds with speeds exceeding 10 m/s occurring 17% of the year;
Case 3. For the highest wave recorded in this area—which corresponds to the upper limit of energy yields from the wave energy converter (point absorber).
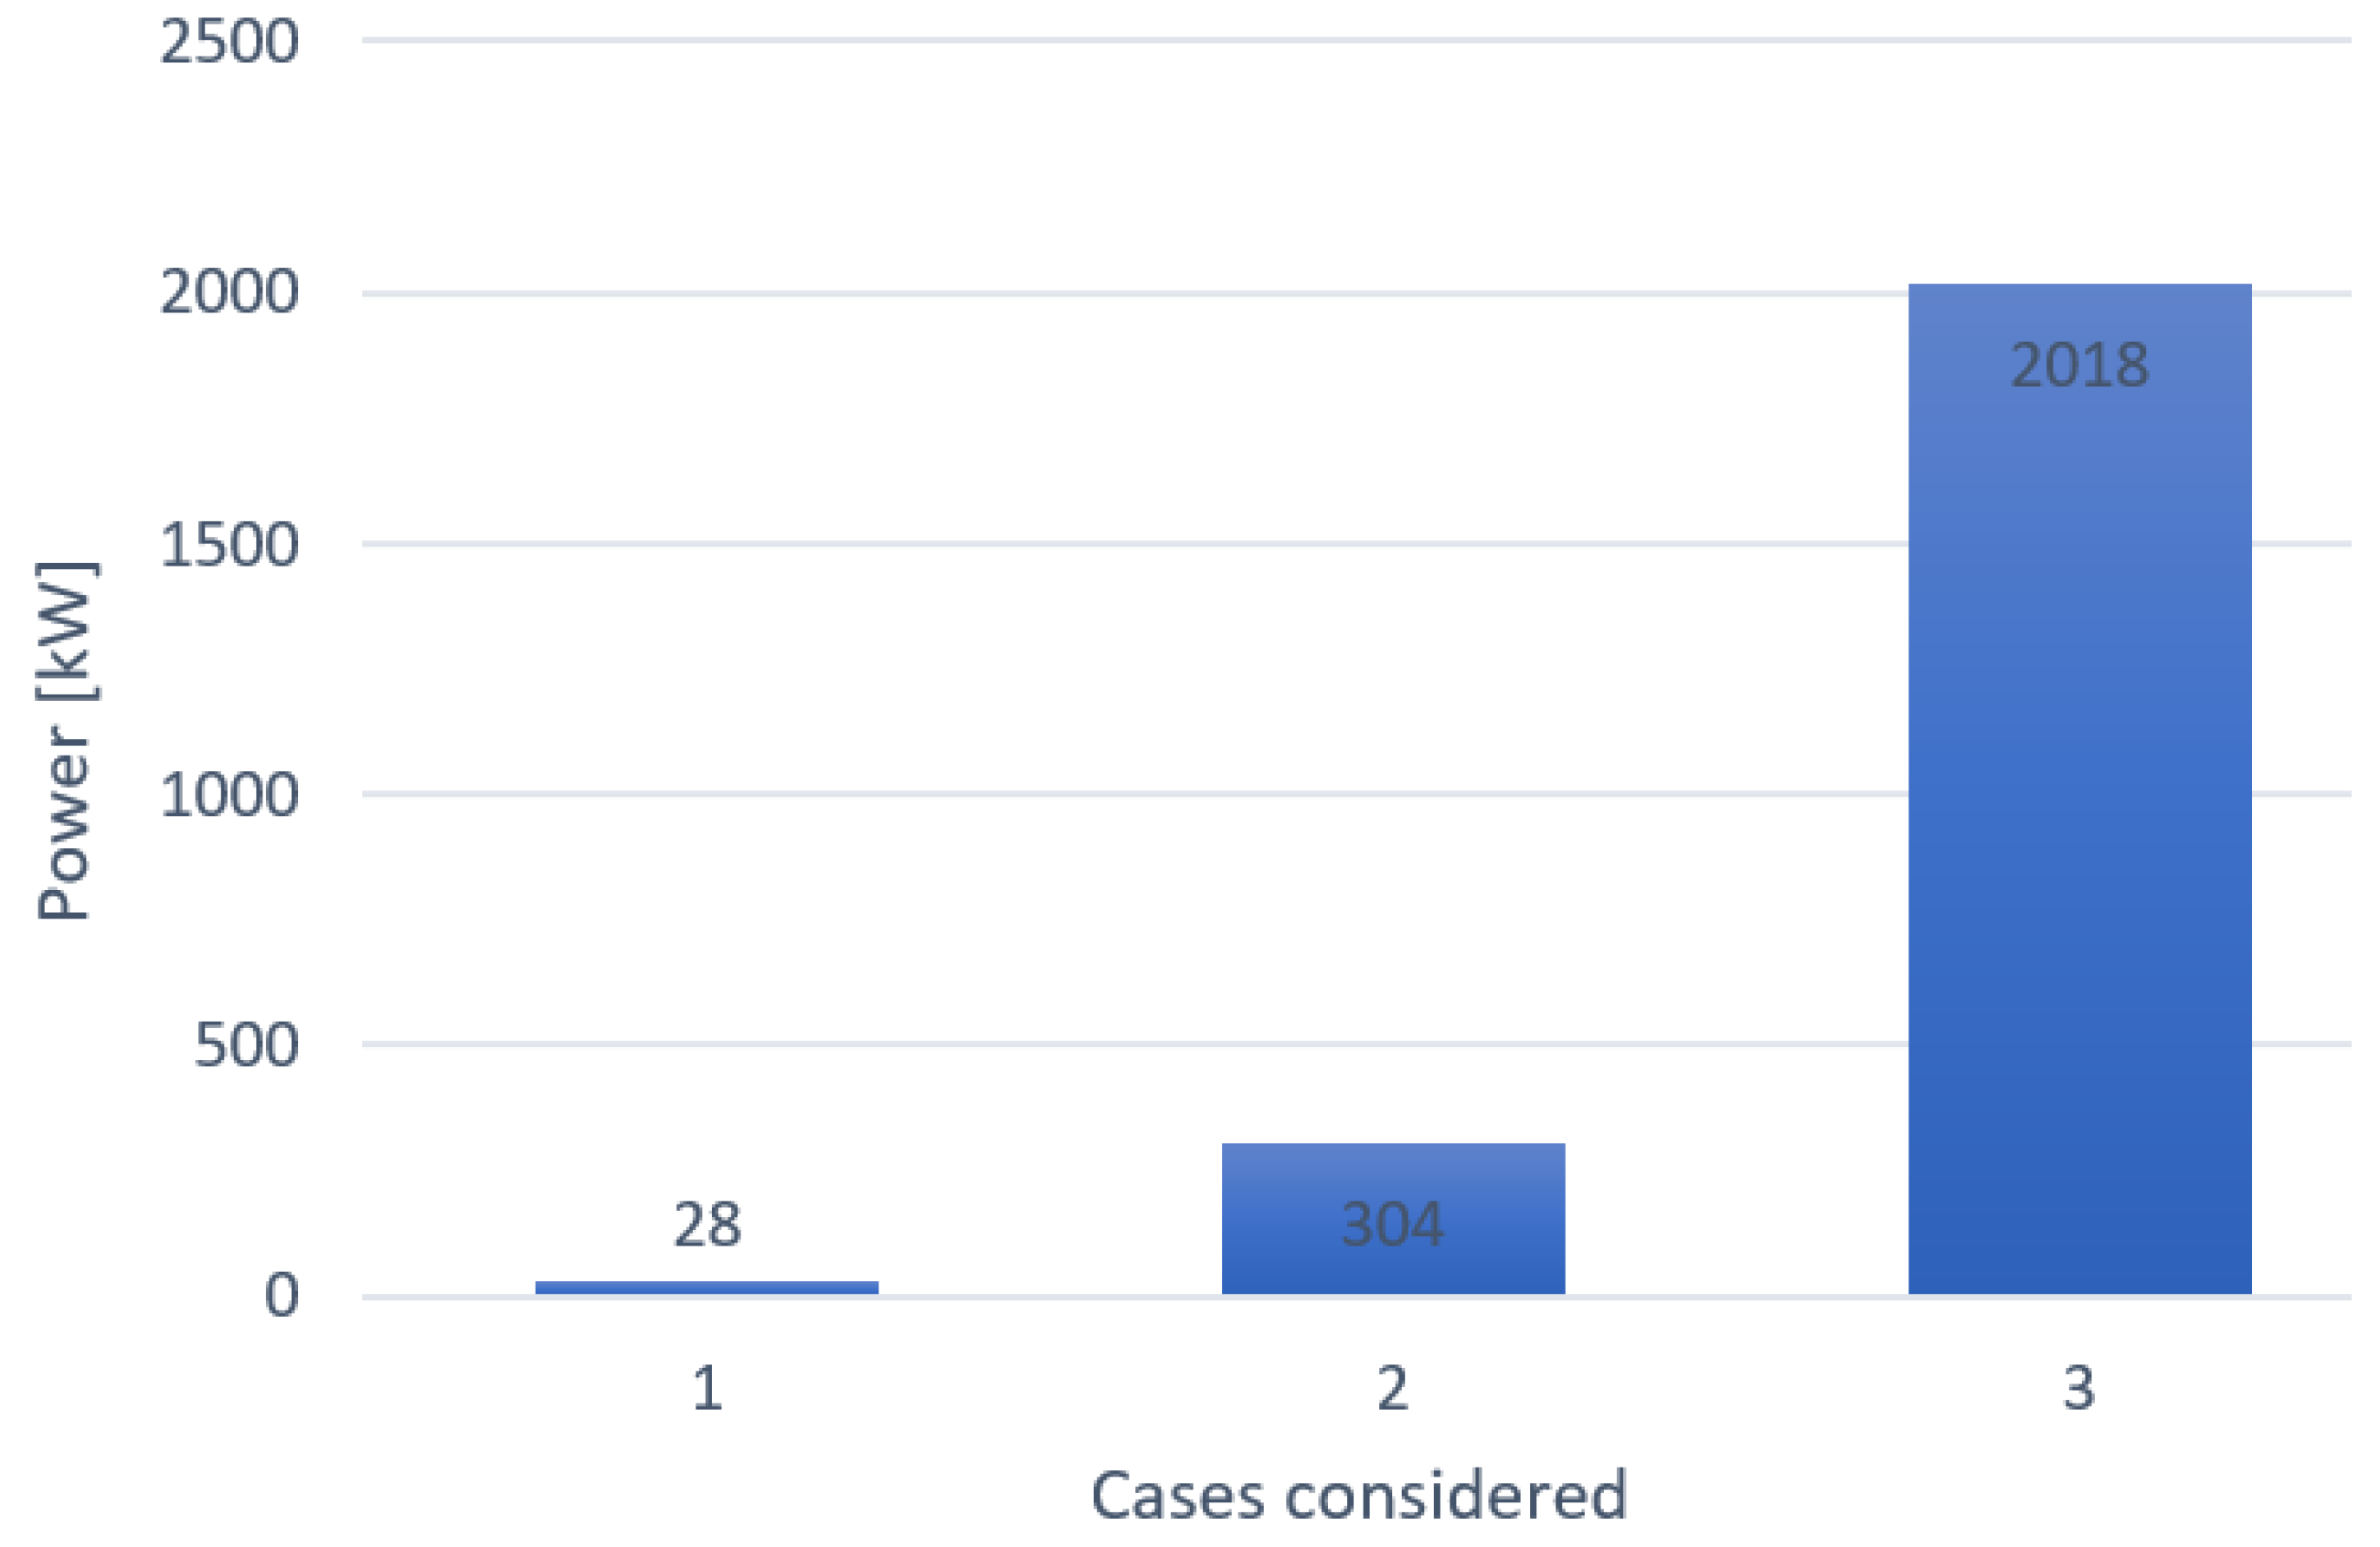
Using Formula (1), the achievable power for the assumed parameters was calculated, as shown in Figure 6.
The above calculations were made for the average statistical wave year, in which the wave parameters occurring in the average statistical year were determined for the forecast point based on a 27.5-year data collection period (1 January 1993–1 July 2020) in the Łeba area, 10 km from the shore, at a depth of 25 m [26].
The results obtained are promising for a single point absorber:
Case 1. For the significant wave height most frequently occurring in this area (25%), the actual power is 23 KW, but in over 47.2% of wave conditions during the year, the actual power range is 23 KW ≤ P < 304 KW.
Case 2. For strong winds with speeds exceeding 10 m/s occurring 17% of the year, the actual power is 304 KW ≤ P ≤ 2018 KW.
Case 3. For the highest wave recorded in this area, which corresponds to the upper limit of energy yields from the wave energy converter (point absorber), the actual power is 2018 kW. The calculations were performed for the previously mentioned statistical average with the detailed data cited earlier. It should be taken into account that the calculations were performed for the highest wave value, which is an average value; in reality, larger waves occurred repeatedly during the period studied. The fact is that their annual occurrence time was less than 1%. This was about 7 times greater than for case 2 and almost 72 times greater than for case 1—this means that the power yield during one heavy storm day (for the conditions described) corresponds to approximately 72 days of energy harvesting considered in case 1.

4. Conclusions

  • The Baltic Sea energy potential has been increasingly discussed in recent years [14,18,25]. The first WEC power plants were designed and developed for water areas with high wave energy, primarily oceans, and therefore may be less economically viable in seas with low wave energy levels. A good indicator for assessing the economic viability of a WEC power plant is the load or capacity factor, which is the ratio of the electricity generated on-site to the rated capacity (rated power) of the WEC power plant [32]. On-site electricity generation is typically estimated using a two-dimensional distribution of Hs and T and then compared to the WEC power plant’s capacity [33]. For comparison, in oceans, CF factors are typically in the range of 30–40% [25], although this is not believed to apply to seas with low energy consumption, e.g., the Baltic Sea. However, several attempts to install WECs have been reported in this area [25]. No WEC has been installed in Poland to date.
  • The wave characteristics of the Baltic Sea in the Polish Exclusive Economic Zone (the Southern Baltic) have been relatively well understood thanks to the wind farm construction program. Multi-year studies have been conducted, primarily to assess the impact of wave action on wind farm monopoles, but also to address the need to reconstruct ports to accommodate service and installation ports as part of the wind farm construction program.
  • A point wave energy absorber was selected for the tests, as it has a number of advantages, including compact dimensions; the removal of the need to permanently install the PA; the relative ease of installation and removal, which involves placing the PA from a ship or simply towing it to a designated location; the vertical dimensions being larger than the horizontal ones; the take-off system being a stationary part placed on the bottom, which facilitates cable routing; the relatively well-known technology for the construction and operation of buoyancy structures in the sea; and finally, the well-described method for calculating power yields from wave energy.
  • The obtained calculation results in the context of Polish EEZ conditions are promising: we obtain an energy above 304 KW for 17% of the wave time per year. If we combine the data obtained from cases 2 and 3 with the upper limit of case 1, we can achieve a power yield exceeding 94 KW in about 39% of the time per year from a significant wave height of 1.23 m, and a yield reaching 186 kW in about 24.5% of the time per year from a significant wave height of 1.73 m.
  • Based on three characteristic cases considered for the water area around the port of Łeba in Poland, the next step should be to design a PA wave energy converter adapted to the maximum use of the presented conditions.

Author Contributions

Conceptualization, K.J.L. and J.M.; methodology, K.J.L. and J.M.; validation, K.J.L. and J.M.; formal analysis, J.M.; investigation, K.J.L.; resources, K.J.L. and J.M.; data curation, K.J.L.; writing—original draft preparation, K.J.L.; writing—review and editing, J.M.; visualization, K.J.L.; supervision, K.J.L. and J.M.; project administration, K.J.L. and J.M.; funding acquisition, J.M. All authors have read and agreed to the published version of the manuscript.

Funding

This research was funded by the Ministry of Science and Higher Education (Poland) within the program Polish Metrology II, grant entitled “Elaboration of metrological infrastructure elements in underwater acoustic area of the Central Office of Measures”, grant number PM-II/SP/0049/2024/02, 2024–2026.

Institutional Review Board Statement

Not applicable.

Informed Consent Statement

Not applicable.

Data Availability Statement

Data available on request due to restrictions resulting from the provided project.

Conflicts of Interest

The authors declare no conflicts of interest.

References

  1. Farrok, O.; Ahmed, K.; Tahlil, A.D.; Farah, M.M.; Kiran, M.R.; Islam, M.R. Electrical Power Generation from the Oceanic Wave for Sustainable Advancement in Renewable Energy Technologies. Sustainability 2020, 12, 2178. [Google Scholar] [CrossRef]
  2. Mandal, S.; Islam, S.; Biswas, A.H.; Akter, S. A mathematical model applied to investigate the potential impact of global warming on marine ecosystems. Appl. Math. Model. 2022, 101, 19–37. [Google Scholar] [CrossRef]
  3. Da Silva, C.M.; Da Silva, L.L.; Souza, T.D.C.; Dantas, T.C.; Correa, S.M.; Arbilla, G. Main Greenhouse Gases levels in the largest secondary urban forest in the world. Atmos. Pollut. Res. 2019, 10, 564–570. [Google Scholar] [CrossRef]
  4. Otawa, A.; Skomudek, W. Innovative solutions in the field of renewable energy sources based on selected examples. In Innowacje w Zarządzaniu i Inżynierii Produkcji; Knosala, R., Ed.; Oficyna Wydawnicza Polskiego Towarzystwa Zarządzania Produkcją: Opole, Poland, 2018. (In Polish) [Google Scholar]
  5. Farrok, O.; Islam, M.R.; Sheikh, M.R.I.; Guo, Y.G.; Zhu, J.G. Design and Analysis of a Novel Lightweight Translator Permanent Magnet Linear Generator for Oceanic Wave Energy Conversion. IEEE Trans. Magn. 2017, 53, 8207304. [Google Scholar] [CrossRef]
  6. Krawiec, F. Renewable Energy Sources in the Light of the Energy Crisis: Selected Problems; Wydawnictwo Difin: Warszawa, Poland, 2010. (In Polish) [Google Scholar]
  7. Lewandowski, W.M. Eco-Friendly Renewable Energy Sources; Wydawnictwo Naukowo-Techniczne: Warszawa, Poland, 2010. (In Polish) [Google Scholar]
  8. Jagusiak, B.; Stochaj, J. Renewable energy to meet energy needs. Przegląd Nauk.-Metodyczny. Eduk. Dla Bezpieczeństwa 2018, 1, 702–716. (In Polish) [Google Scholar]
  9. REN21. Renewables 2016 Global Status Report; REN21 Secretariat: Paris, France, 2016; Available online: https://www.ren21.net/wp-content/uploads/2019/05/REN21_GSR2016_FullReport_en_11.pdf (accessed on 30 August 2025).
  10. REN21. The First Decade: 2004–2014—10 Years of Renewable Energy Progress; REN21 Secretariat: Paris, France, 2014; Available online: https://www.ren21.net/Portals/0/documents/activities/Topical%20Reports/REN21_10yr.pdf (accessed on 30 August 2025).
  11. International Energy Agency. Implementing Agreement on Ocean Energy Systems. Annual Report 2007. Available online: https://www.ocean-energy-systems.org/publications/oes-annual-reports/document/oes-annual-report-2007/ (accessed on 30 August 2025).
  12. Curto, D.; Franzitta, V.; Guercio, A. Sea Wave Energy. A Review of the Current Technologies and Perspectives. Energies 2021, 14, 6604. [Google Scholar] [CrossRef]
  13. Cascajo, R.; García, E.; Quiles, E.; Correcher, A.; Morant, F. Integration of marine wave energy converters into seaports: A case study in the port of Valencia. Energies 2019, 12, 787. [Google Scholar] [CrossRef]
  14. Falcão, A.F.d.O. Wave energy utilization: A review of the technologies. Renew. Sustain. Energy Rev. 2010, 14, 899–918. [Google Scholar] [CrossRef]
  15. Molla, S.; Farrok, O.; Islam, M.R.; Muttaqi, K.M. Analysis and design of a high performance linear generator with high grade magnetic cores and high temperature superconducting coils for oceanic wave energy conversion. IEEE Trans. Appl. Supercond. 2019, 29, 5201105. [Google Scholar] [CrossRef]
  16. Krzemień, Z. Using the Energy of Sea Waves to Produce Electricity; Prace Instytutu Elektrotechniki: Warszawa, Poland, 2013; Volume 262. [Google Scholar]
  17. Heino, H. Possibilities of wave energy in the Baltic Sea. In Utilisation of Wave Power in the Baltic Sea Region; Finland Futures Research Centre: Turku, Finland, 2013; pp. 33–39. [Google Scholar]
  18. Soomere, T.; Eelsalu, M. On the wave energy potential along the eastern Baltic Sea coast. Renew. Energy 2014, 71, 221–233. [Google Scholar] [CrossRef]
  19. Ocean Energy Systems. Oceans of Energy—European Ocean Energy Roadmap 2010–2050. Available online: https://www.ocean-energy-systems.org/publications/icoe/icoe-2010/document/oceans-of-energy-european-ocean-energy-roadmap-2010-2050/ (accessed on 10 July 2025).
  20. Eurostat. Renewable Energy Statistics. Available online: https://ec.europa.eu/eurostat/statistics-explained/index.php?title=Renewable_energy_statistics (accessed on 10 July 2025).
  21. Kasiulis, E.; Punys, P.; Kofoed, J.P. Assessment of theoretical near-shore wave power potential along the Lithuanian coast of the Baltic Sea. Renew. Sustain. Energy Rev. 2015, 41, 134–142. [Google Scholar] [CrossRef]
  22. Kovaleva, O.; Eelsalu, M.; Soomere, T. Hot-spots of large wave energy resources in relatively sheltered sections of the Baltic Sea coast. Renew. Sustain. Energy Rev. 2017, 74, 424–437. [Google Scholar] [CrossRef]
  23. Gunn, K.; Stock-Williams, C. Quantifying the global wave power resource. Renew. Energy 2012, 44, 296–304. [Google Scholar] [CrossRef]
  24. IMGW. Climate of Poland 2023. Available online: https://www.imgw.pl/sites/default/files/inline-files/climate-of-poland-2023_report.pdf (accessed on 10 July 2025).
  25. Foteinis, S. Wave energy converters in low energy seas: Current state and opportunities. Renew. Sustain. Energy Rev. 2022, 162, 112448. [Google Scholar] [CrossRef]
  26. Analysis of Wave and Debris Flow Along the Ports and in the Ports of Rowy and Łeba, Volume I, Łeba. Available online: https://www.umgdy.gov.pl/wp-content/uploads/2022/06/Raport-analiza-falowania.pdf (accessed on 16 July 2025).
  27. Falnes, J.; Kurniawan, A. Ocean Waves and Oscillating Systems: Linear Interactions Including Wave-Energy Extraction; Cambridge University Press: Cambridge, UK, 2020; Volume 8. [Google Scholar]
  28. Falnes, J. Optimum control of oscillation of wave-energy converters. In Proceedings of the ISOPE International Ocean and Polar Engineering Conference, Stavanger, Norway, 17–22 June 2001; p. ISOPE-02-12-2-147. [Google Scholar]
  29. WECs: Calculating Power Output Using Wave Characteristics. Available online: https://eepower.com/technical-articles/wecs-calculating-power-output-using-wave-characteristics/# (accessed on 16 July 2025).
  30. Other Physical Characteristics of Ocean Water: Density. Available online: https://zpe.gov.pl/a/przeczytaj/DGQNhapow (accessed on 16 July 2025).
  31. Zhang, X.; Tian, X.; Xiao, L.; Li, X.; Chen, L. Application of an adaptive bistable power capture mechanism to a point absorber wave energy converter. Appl. Energy 2018, 228, 450–467. [Google Scholar] [CrossRef]
  32. Rusu, E. Evaluation of the Wave Energy Conversion Efficiency in Various Coastal Environments. Energies 2014, 7, 4002–4018. [Google Scholar] [CrossRef]
  33. Onea, F.; Rusu, E. Sensitivity analysis of the wave energy converters operating in the French coastal waters. Int. J. Smart Grid Clean Energy 2019, 8, 239–244. [Google Scholar] [CrossRef]
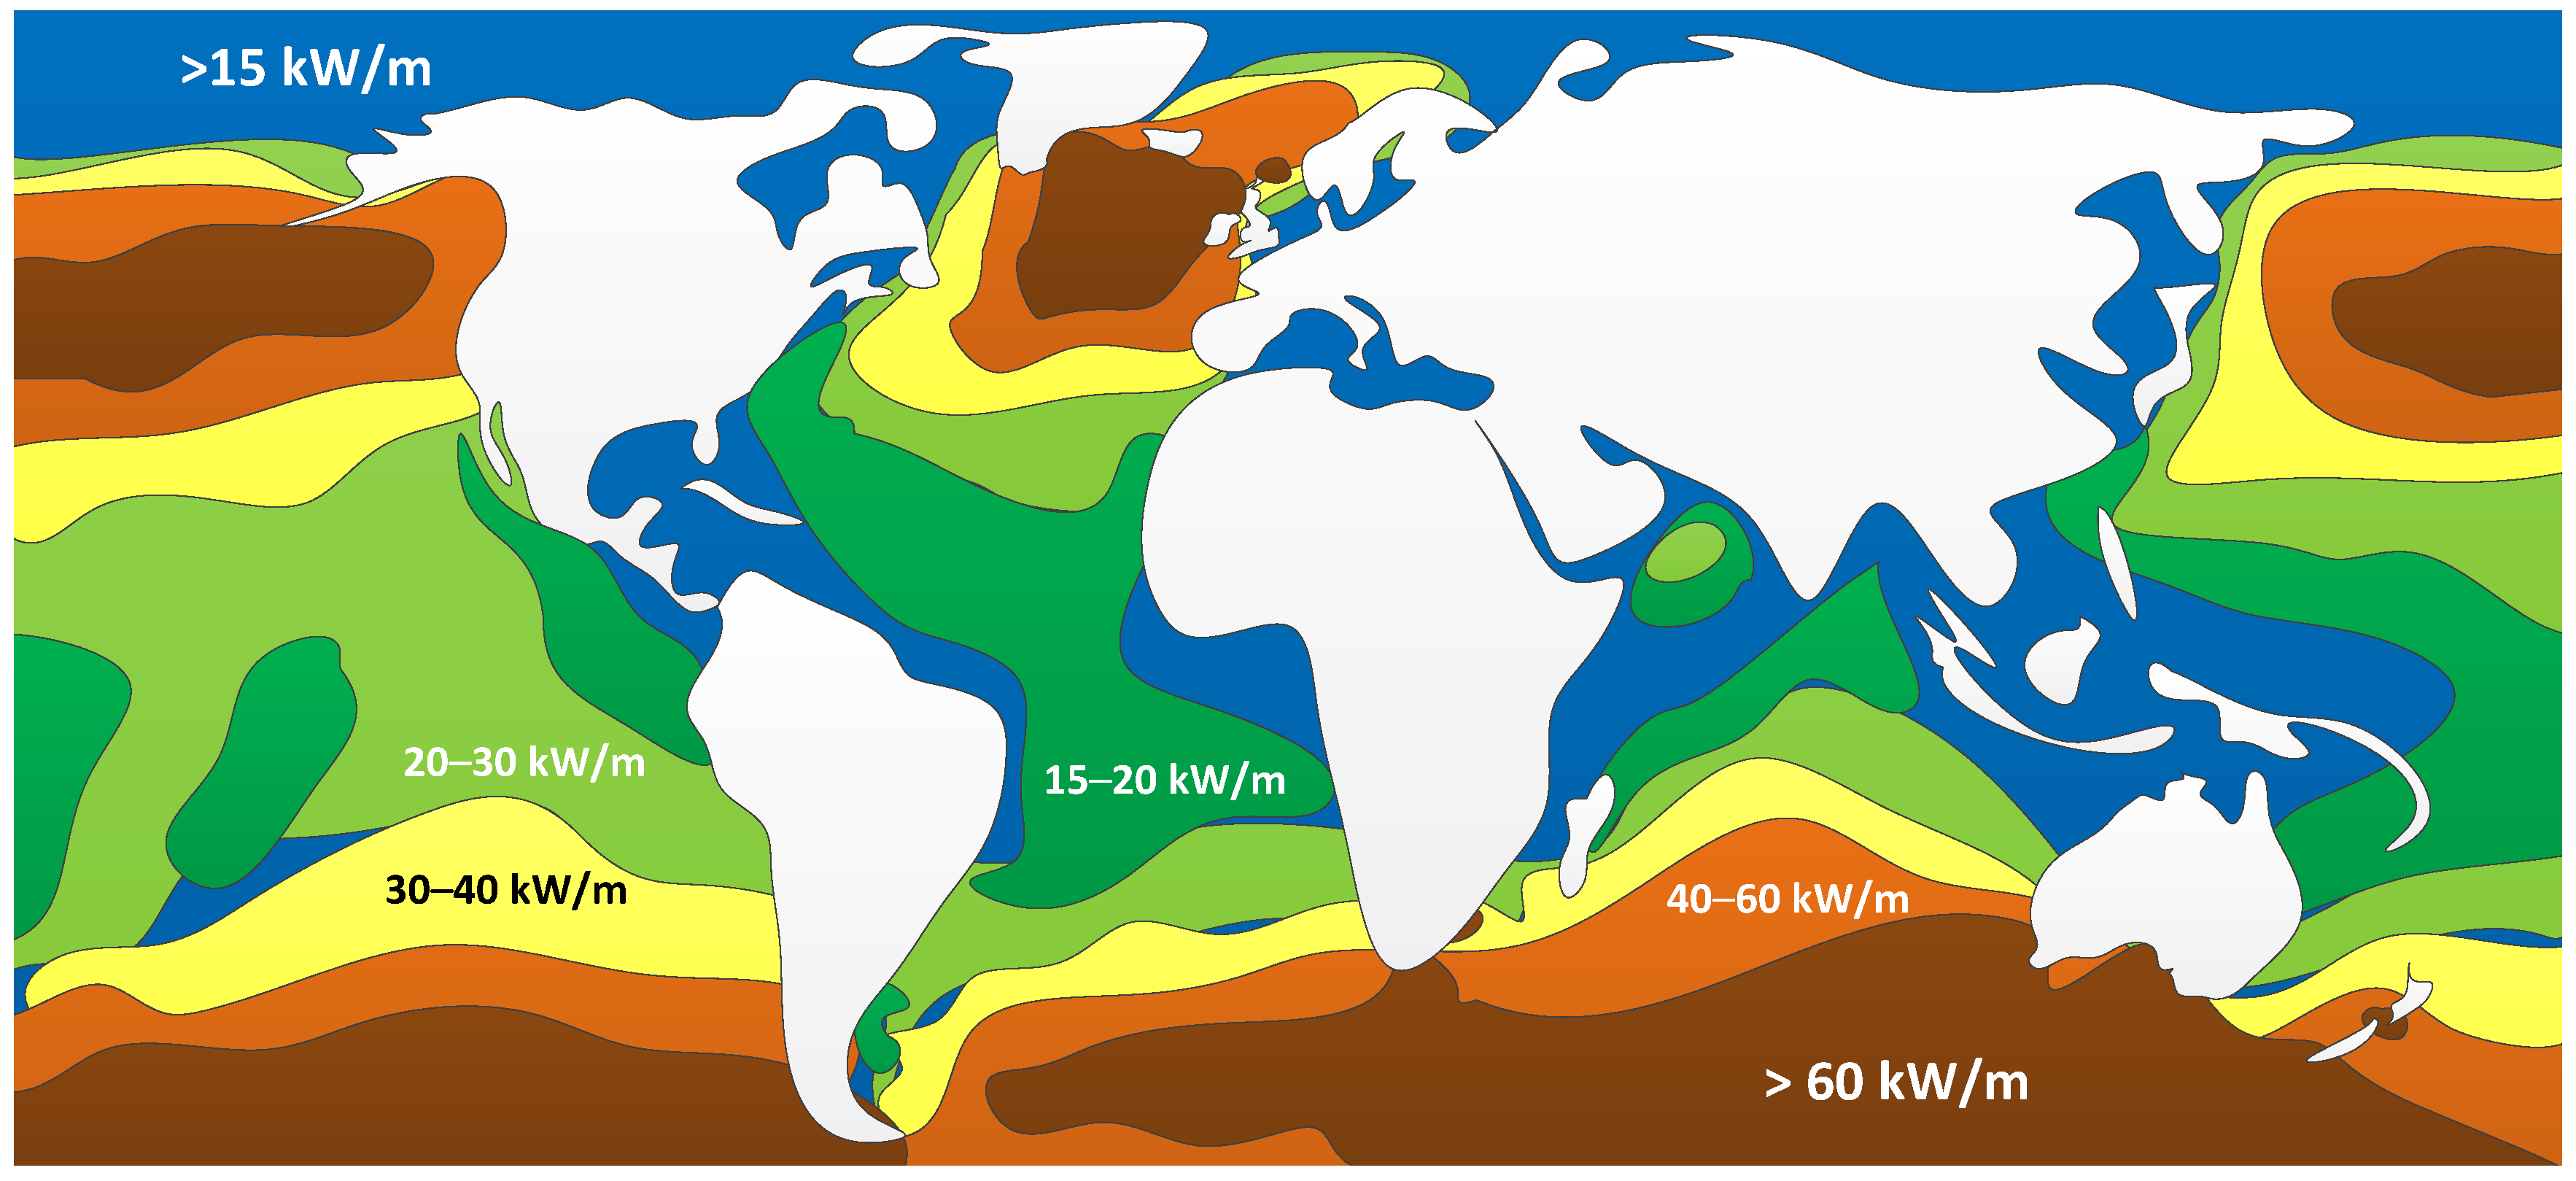
Figure 1. The diagram of the global wave power map, presented in Annual Mean Power Density [kW/m].
Applsci 15 10078 g001
Figure 2. Exposure to waves in the Polish zone of the Baltic Sea.
Applsci 15 10078 g002
Figure 3. Frequency of strong winds at Polish coastal stations during 1969–1998 and 1999–2008.
Applsci 15 10078 g003
Figure 4. Exposure to surface currents in the Exclusive Economic Zone of Poland (EEZ).
Applsci 15 10078 g004
Figure 5. Conditions of power connections in the Polish zone of the Baltic Sea. The city marked with red color indicates the location for which wave energy yields were simulated.
Applsci 15 10078 g005
Figure 6. The results of the wave energy power calculation based on three assumed cases.
Applsci 15 10078 g006
Table 1. Division of renewable energy sources based on [7].
Primary Energy SourcesNatural Energy Conversion ProcessesTechnical Energy Conversion ProcessesForm of Energy
SunWaterEvaporation, melting of ice and snow, precipitationHydroelectric power plantsElectricity
WindMovement of the atmosphereWind power plantsThermal and electrical energy
Wave EnergyWave power plants
Solar radiationOcean currentsOcean current power plantsElectricity
Heating of the Earth’s surface and atmosphereOcean heat power plantsElectricity
Heat pumpsThermal energy
Solar radiationCollectors and thermal solar power plantsThermal energy
Photovoltaic cells and solar power plantsElectricity
PhotolysisFuels
BiomassBiomass productionHeating and thermal power plantsThermal and electrical energy
Conversion devicesFuels
GravityTides of waterTidal power plantsElectricity
EarthIsotope decayGeothermal sourcesGeothermal heating and power plantsThermal and electrical energy
Nuclear energyNuclear power plantsElectricity
MoonGravityTides of waterTidal power plantsElectricity
Table 2. Detailed advantages and disadvantages of renewable energy sources based on [8].
Types of EnergyAdvantagesDisadvantages
HydropowerNo emissions of substances that would accompany energy conversionInterference with the natural environment
It has greater potential than nuclear energy. A source dependent on water supplies, which may cause problems with obtaining energy during droughts and low water levels.
Population displacement
Wind energyWind farms can be located on land and at seaRequires appropriate wind conditions, which are very uneven around the world
High availability of the sourceWind turbines emit noise
No costs associated with obtaining the raw materialTurbines can cause radio interference
Relatively low processing costsTurbines pose a threat to birds moving around their edges
Low adverse impact on the environmentWind turbines can negatively affect the landscape and thus reduce the attractiveness of the places where they are built
Power plants can be built on unused landInstability of the energy obtained due to changing wind intensity
Solar powerAvailable in all regions of the worldUneven solar exposure across the world
Environmentally friendly (no emissions or noise)High cost of photovoltaic installations
Dependence on atmospheric conditions
BiomassOne of the cleanest sources of energyBiomass requires a lot of space
Affects biodiversity
Requires a lot of water
Produced from waste and residues
Geothermal EnergyIndependent of atmospheric conditionsNecessity to create very deep holes
Low operating costs of energy extraction installationsTo produce electricity, it is necessary to reach water at a temperature of at least 100 °C
Risk of water pollution
Table 3. Advantages and disadvantages of water (wave) energy.
NoWEC AdvantagesWEC Disadvantages
1.Renewable Energy—Changes in gravitation and wind generate waves. These sources will never end.Location-dependent solutions—always close to the water.
2.Protecting the natural world, less carbon footprint, and no soil damage.Influence on marine ecosystem—e.g., underwater noise is treated as environmental pollution.
3.Plenty and easily accessible—oceans cover approximately 71% of the Earth’s surface.High initial cost and maintenance cost that is currently difficult to estimate because there is a limited number of solutions and a relatively short operational period.
4.Cut back on the reliance on overseas energy giants.Cruising disturbance for recreational and commercial ships.
5.Extensive methods for harnessing—a lot of different types of WEC.Currently, prototype solutions dominate—problems with connection to the power grid (mostly microgeneration).
6.Reliable—constant source of energy.Advances in technology are moving very slowly.
7.Extremely high levels of energy can be generated.Forecasting fully accurate wave power is highly unpredictable.
8.Adaptation to the environment—specific place and dedicated technical solution.-
Table 4. Potential power and energy production from marine energy sources based on [13].
Energy of the Seas and OceansPower (GW)Potential Production (TWh/Year)
Tides (high and low tides)90800
Sea currents500050,000
Osmotic salinity202000
Ocean thermal energy conversion (otec)100010,000
Ocean and sea waves1000–90008000–80,000
Table 5. Wave energy potential in different European countries based on [19].
CountryWave Energy Potential (TWh/Year)
CoastalOffshore
UK43–6414–21
Ireland21–327–11
Portugal12–184–6
France12–183–5
Spain10–163–5
Italy9–163–5
Denmark5–82–3
Greece4–71–2
Germany0.9–1.40.3–0.5
Disclaimer/Publisher’s Note: The statements, opinions and data contained in all publications are solely those of the individual author(s) and contributor(s) and not of MDPI and/or the editor(s). MDPI and/or the editor(s) disclaim responsibility for any injury to people or property resulting from any ideas, methods, instructions or products referred to in the content.