Article

Modeling and Finite-Element Performance Analysis of Selenol-Functionalized Carbon Nanotube/Natural Rubber Composites for Aircraft Tire Applications

1
Civil Aviation College, Shenyang Aerospace University, Shenyang 110136, China
2
Suqian Green Gold Giant Rubber Plastic & Machinery Co., Ltd., Suqian 223800, China
*
Author to whom correspondence should be addressed.
Appl. Sci. 2025, 15(18), 10053; https://doi.org/10.3390/app151810053
Submission received: 14 August 2025 / Revised: 8 September 2025 / Accepted: 9 September 2025 / Published: 15 September 2025
(This article belongs to the Section Aerospace Science and Engineering)

Abstract

This study developed a natural rubber composite reinforced with selenol-functionalized carbon nanotubes, demonstrating significant mechanical enhancement. The composite exhibited remarkable improvements in elastic modulus, with 300% and 500% modulus increasing by 2.23 MPa and 2.68 MPa, respectively, along with a 1.22 MPa boost in tensile strength compared to conventional counterparts. Material characterization was successfully performed using a polynomial hyperelastic constitutive model. The optimized composite was applied to the tread of a Bridgestone 1270 × 455 R aircraft tire for performance evaluation. Finite element analysis in ABAQUS revealed that under 2.5 MPa inflation pressure, the tire achieved specified dimensional requirements with a cross-sectional width of 459.55 mm and a diameter of 1270.50 mm. Three-dimensional static load simulations showed characteristic elliptical contact patches that expanded with increasing load, while maintaining rectangular normal contact stress distribution. Critical performance evaluation demonstrated excellent radial stiffness stability of 22.9 kN/mm within the operational pressure range of 1.5–2.0 MPa under rated load conditions. These findings validate the composite’s potential for enhancing aircraft tire performance.

1. Introduction

Aircraft tires are critical components of the landing system, directly influencing flight safety, environmental sustainability, operational efficiency, and maintenance costs [1,2,3,4]. During operation, aircraft tires endure extreme and complex working conditions, with a significantly harsher service environment compared to automotive tires, involving high loads, high speeds, high-impact forces, extreme temperatures [5,6,7,8], and varying runway conditions [9]. The static ground contact state of aircraft tires represents a common scenario when the aircraft is stationary on the ground [10]. The tread, as the core component in direct contact with the runway, plays a pivotal role in determining grip, water drainage [11], wear resistance [12], impact resistance, and thermal dissipation. Therefore, enhancing the physical properties of the tread and reinforcing the tire structure are essential to withstand more demanding operational environments. A thorough investigation into the static load performance under different working conditions—including deformation, stress distribution, deflection under varying inflation pressures, and radial stiffness—is crucial to ensuring tire reliability and improving aircraft safety.

1.1. Tread Rubber Composition

Aircraft tire treads are typically constructed from multi-layer composite rubber materials, primarily composed of natural rubber, synthetic rubber, reinforcing fillers, vulcanizing agents, and anti-aging agents. Conventional methods for enhancing natural rubber include the incorporation of carbon black [13], carbon nanotubes (CNTs) [14,15], functionalized CNTs (such as those modified with carboxyl or hydroxyl groups) [16,17,18], graphene [19], and basalt fibers [20]. However, these approaches exhibit significant limitations: insufficient dispersion of the fillers within the rubber matrix [21] results in suboptimal reinforcement effectiveness of the composite materials. This study proposes the introduction of selenol-functionalized CNTs into the rubber matrix. The anisotropic nature of carbon nanotubes is a key factor responsible for their remarkable ability to enhance the elastic modulus and tensile strength of composites. Carbon nanotubes exhibit notable chirality-dependent anisotropy, manifested in variations in Young’s modulus, shear modulus, buckling strain, and other properties with changes in chirality. The use of isotropic models can lead to significant errors. Chavanloo and Fazelzadeh [22] made an important contribution by being the first to integrate Flügge’s precise shell theory with an anisotropic constitutive model derived within the Chang molecular mechanics framework, establishing a comprehensive anisotropic elastic shell model for investigating the influence of chirality on the vibrational characteristics of carbon nanotubes. Strozzi, Elishakoff, Manevitch, and Gendelman [23] systematically evaluated the applicability and limitations of various shell theories in describing the vibrations of anisotropic carbon nanotubes. Building upon this foundation, selenol-functionalized CNTs were obtained through surface modification of carbon nanotubes. Experimental analysis confirmed their uniform dispersion within the natural rubber matrix, thereby enhancing the mechanical properties of the composite. The prepared composite material was applied to the tread rubber of an aircraft tire model to study its static ground contact performance.

1.2. Aircraft Tire Modeling

Aircraft tire modeling is a key technology in the aviation industry, encompassing materials science, computer-aided design (SolidWorks 2023), finite element analysis (FEA) [24,25], and multiphysics simulations. Recent advancements in aircraft tire modeling [26] have focused on parametric geometric modeling, material constitutive models, digital simulation software development, and experimental validation [27]. Jin Jinxin of Jilin University [28] proposed a parametric modeling method for radial aircraft tires, utilizing 16 key geometric parameters (e.g., maximum tire diameter, tread thickness, bead wire diameter) to rapidly construct a 3D tire model, significantly improving design efficiency. In terms of material constitutive modeling, research has emphasized hyperelastic behavior and dynamic mechanical responses [29,30,31,32]. Although finite element techniques have been widely applied in tire contact mechanics [33], most studies are limited to basic stress-strain analyses to verify mechanical performance, with insufficient attention to landing impact, steady-state rolling, and traction/braking under varying inflation pressures [34].

2. Materials and Methods

2.1. Preparation of Selenol-Functionalized Carbon Nanotube/Natural Rubber Composites

The selenol-functionalized carbon nanotubes employed in this study were derived from modified multi-walled carbon nanotubes (MWCNTs). These MWCNTs exhibit a tube diameter ranging from 10 to 20 nm, lengths between 0.5 and 2 μm, and possess five to 30 concentric layers. The outer layers feature a high-curvature structural configuration. A mixture was prepared by adding 0.06 g of selenol-functionalized carbon nanotubes (Se-CNTs) into 100 g of natural rubber (NR) latex (60 wt% solid content), followed by 0.12 g of 10 wt% hydrogen peroxide (H2O2) solution. The dispersion was stirred under nitrogen (N2) atmosphere for 0.6 h and then dried at 60 °C to obtain Se-CNT/NR masterbatch.
Subsequently, 100 g of the Se-CNT/NR masterbatch was processed on in open mill, where 5 g of zinc oxide (ZnO), 3 g of sulfur (S), 1 g of accelerator N-cyclohexyl-2-benzothiazole sulfenamide (CZ), and 50 g of carbon black (CB) were incorporated. The mixture was compounded at 140 °C for 0.5 h, followed by compression molding in a plate vulcanizer at 150 °C for 30 min, yielding the final Se-CNT/NR composite material. The formulation is presented in Table 1. The group with added selenolated carbon nanotubes was designated as experimental Group A, the group with added conventional multi-walled carbon nanotubes served as control Group B, and the group without any carbon nanotube addition was designated as control Group C. The resulting samples obtained after processing and mixing were labeled as Sample A, Sample B, and Sample C, respectively.

2.2. Experimental Instrumentation

The experimental characterization was performed using the following instrumentation: a Quattro S scanning electron microscope (SEM, Thermo Fisher Scientific, Hillsboro, OR, USA) for morphological analysis, a GL6175AL two-roll mill (Baolun Precision Testing Instruments Co., Dongguan, China) for composite preparation, and a YL-LH22A1 plate vulcanization machine (Yitong Testing Equipment Co., Shenzhen, China) for sample curing. Material properties were evaluated using a FA-1204 electronic balance (Shanghai Shangping Instruments Co., Shanghai, China) for mass measurement, an LX-A Shore hardness tester (Beijing Wowei Technology Co., Beijing, China) for hardness assessment, and a UTM5305H universal testing machine (Sansi Zongheng Technology Co., Shenzhen, China) for mechanical property testing.

2.3. Scanning Electron Microscopy (SEM) Characterization

Figure 1 and Figure 2, respectfully, demonstrate the dispersion states of selenol-functionalized carbon nanotubes (SC-CNTs) and pristine carbon nanotubes (P-CNTs) within natural rubber matrices as observed by scanning electron microscopy at 50,000× and 1000× magnification, revealing significantly improved dispersion homogeneity of SC-CNTs compared to the apparent agglomeration of P-CNTs. This observation is further corroborated by the visual comparison of corresponding masterbatches in Figure 1 and Figure 2, where the SC-CNT-incorporated sample exhibits a darker and more uniform coloration, confirming the superior dispersibility achieved through selenol functionalization.

2.4. Experimental Data Fitting for Rubber Constitutive Models

The material constants in the strain energy density function determine the mechanical response of the hyperelastic model. To obtain accurate results in hyperelastic analysis, it is essential to evaluate the model constants for the tested material. These constants are typically derived through curve fitting based on experimental strain–stress data. The test data usually cover several deformation modes across a wide range. To ensure the fitted material constants accurately represent the material’s mechanical behavior, the experimental dataset should include at least as many deformation states as those anticipated in the finite element analysis.
Uniaxial tensile testing serves as a fundamental and efficient method for characterizing hyperelastic materials, particularly suitable for parameter calibration, rapid evaluation, and large-deformation behavior studies. When combined with other testing methods (such as compression and shear), a more comprehensive material model can be established. Common hyperelastic constitutive models include the linear constitutive model, Ogden constitutive model, Yeoh constitutive model, Neo-Hookean constitutive model, and Mooney-Rivlin model.
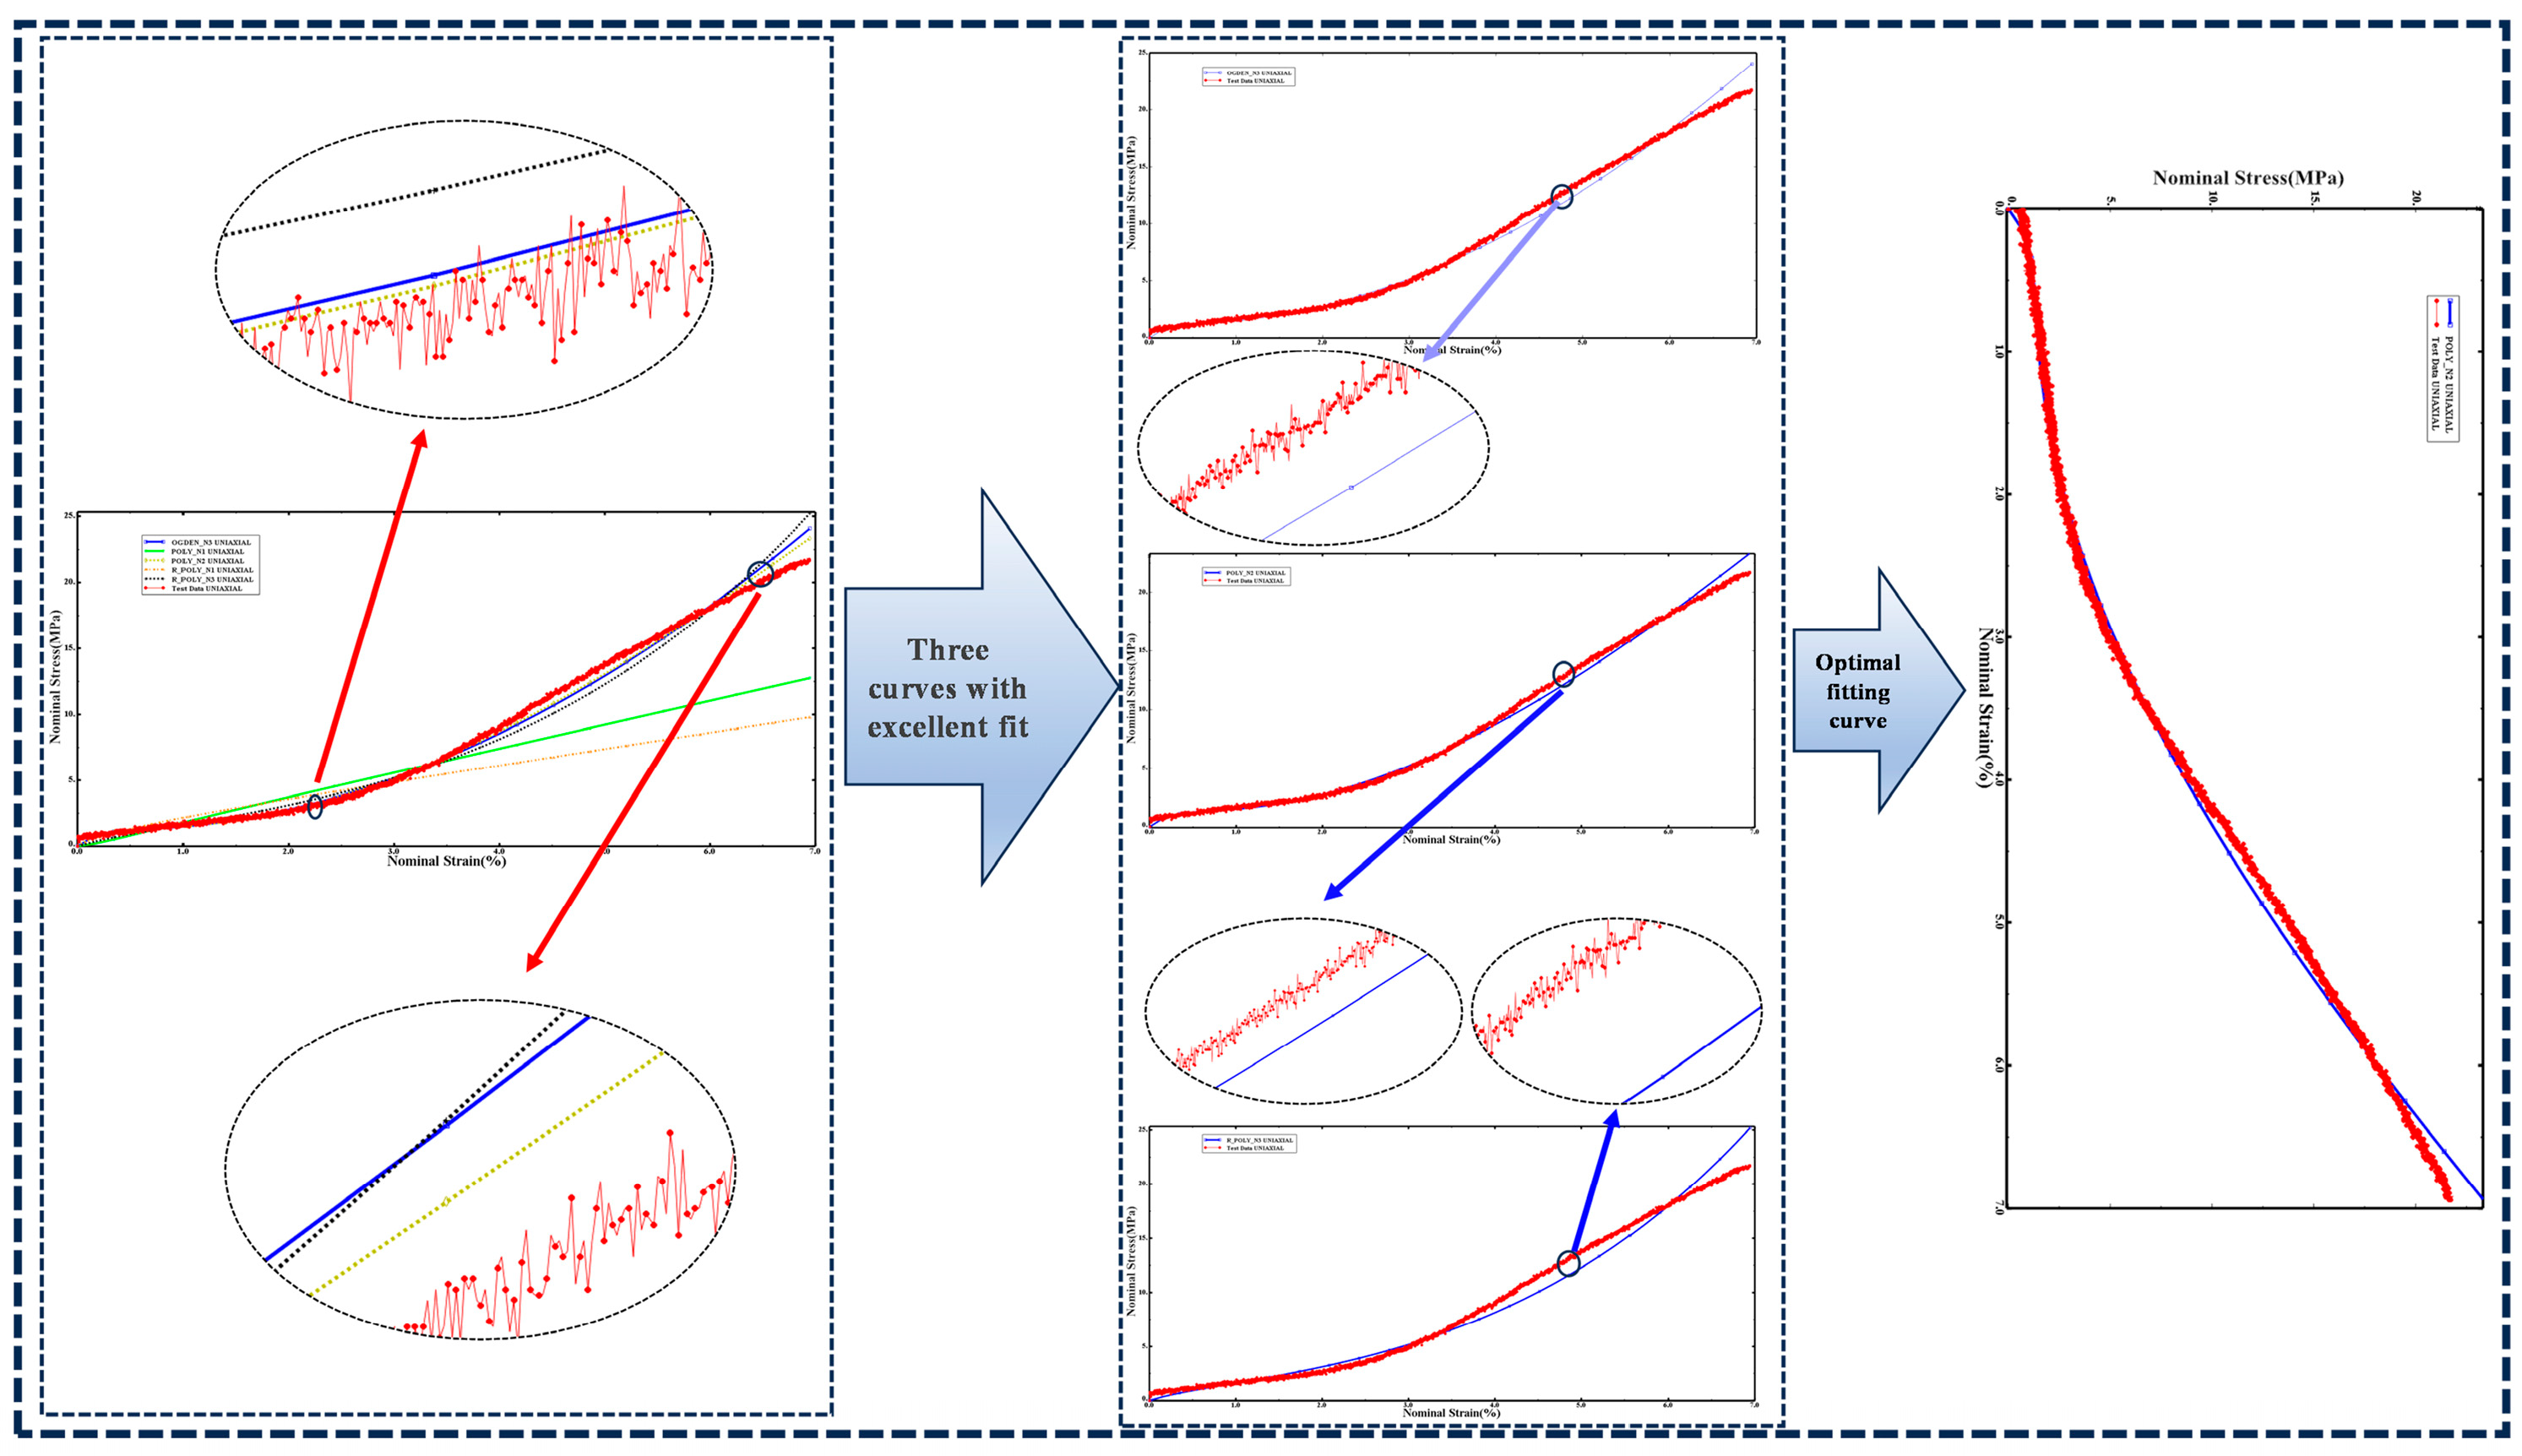
The experimental data fitting demonstrates that Groups A, B, and C exhibit optimal correlation with the second-order polynomial constitutive model (N = 2), warranting the adoption of these fitting coefficients as material parameters. The strain energy density function of the polynomial (N = 2) hyperelastic model [35,36] is expressed as follows:
U = C 10 I 1 3 + C 01 I 2 3 + C 20 I 1 3 2 + C 11 I 1 3 I 2 3 + C 02 I 2 3 2 + 1 D 1 J 1 2
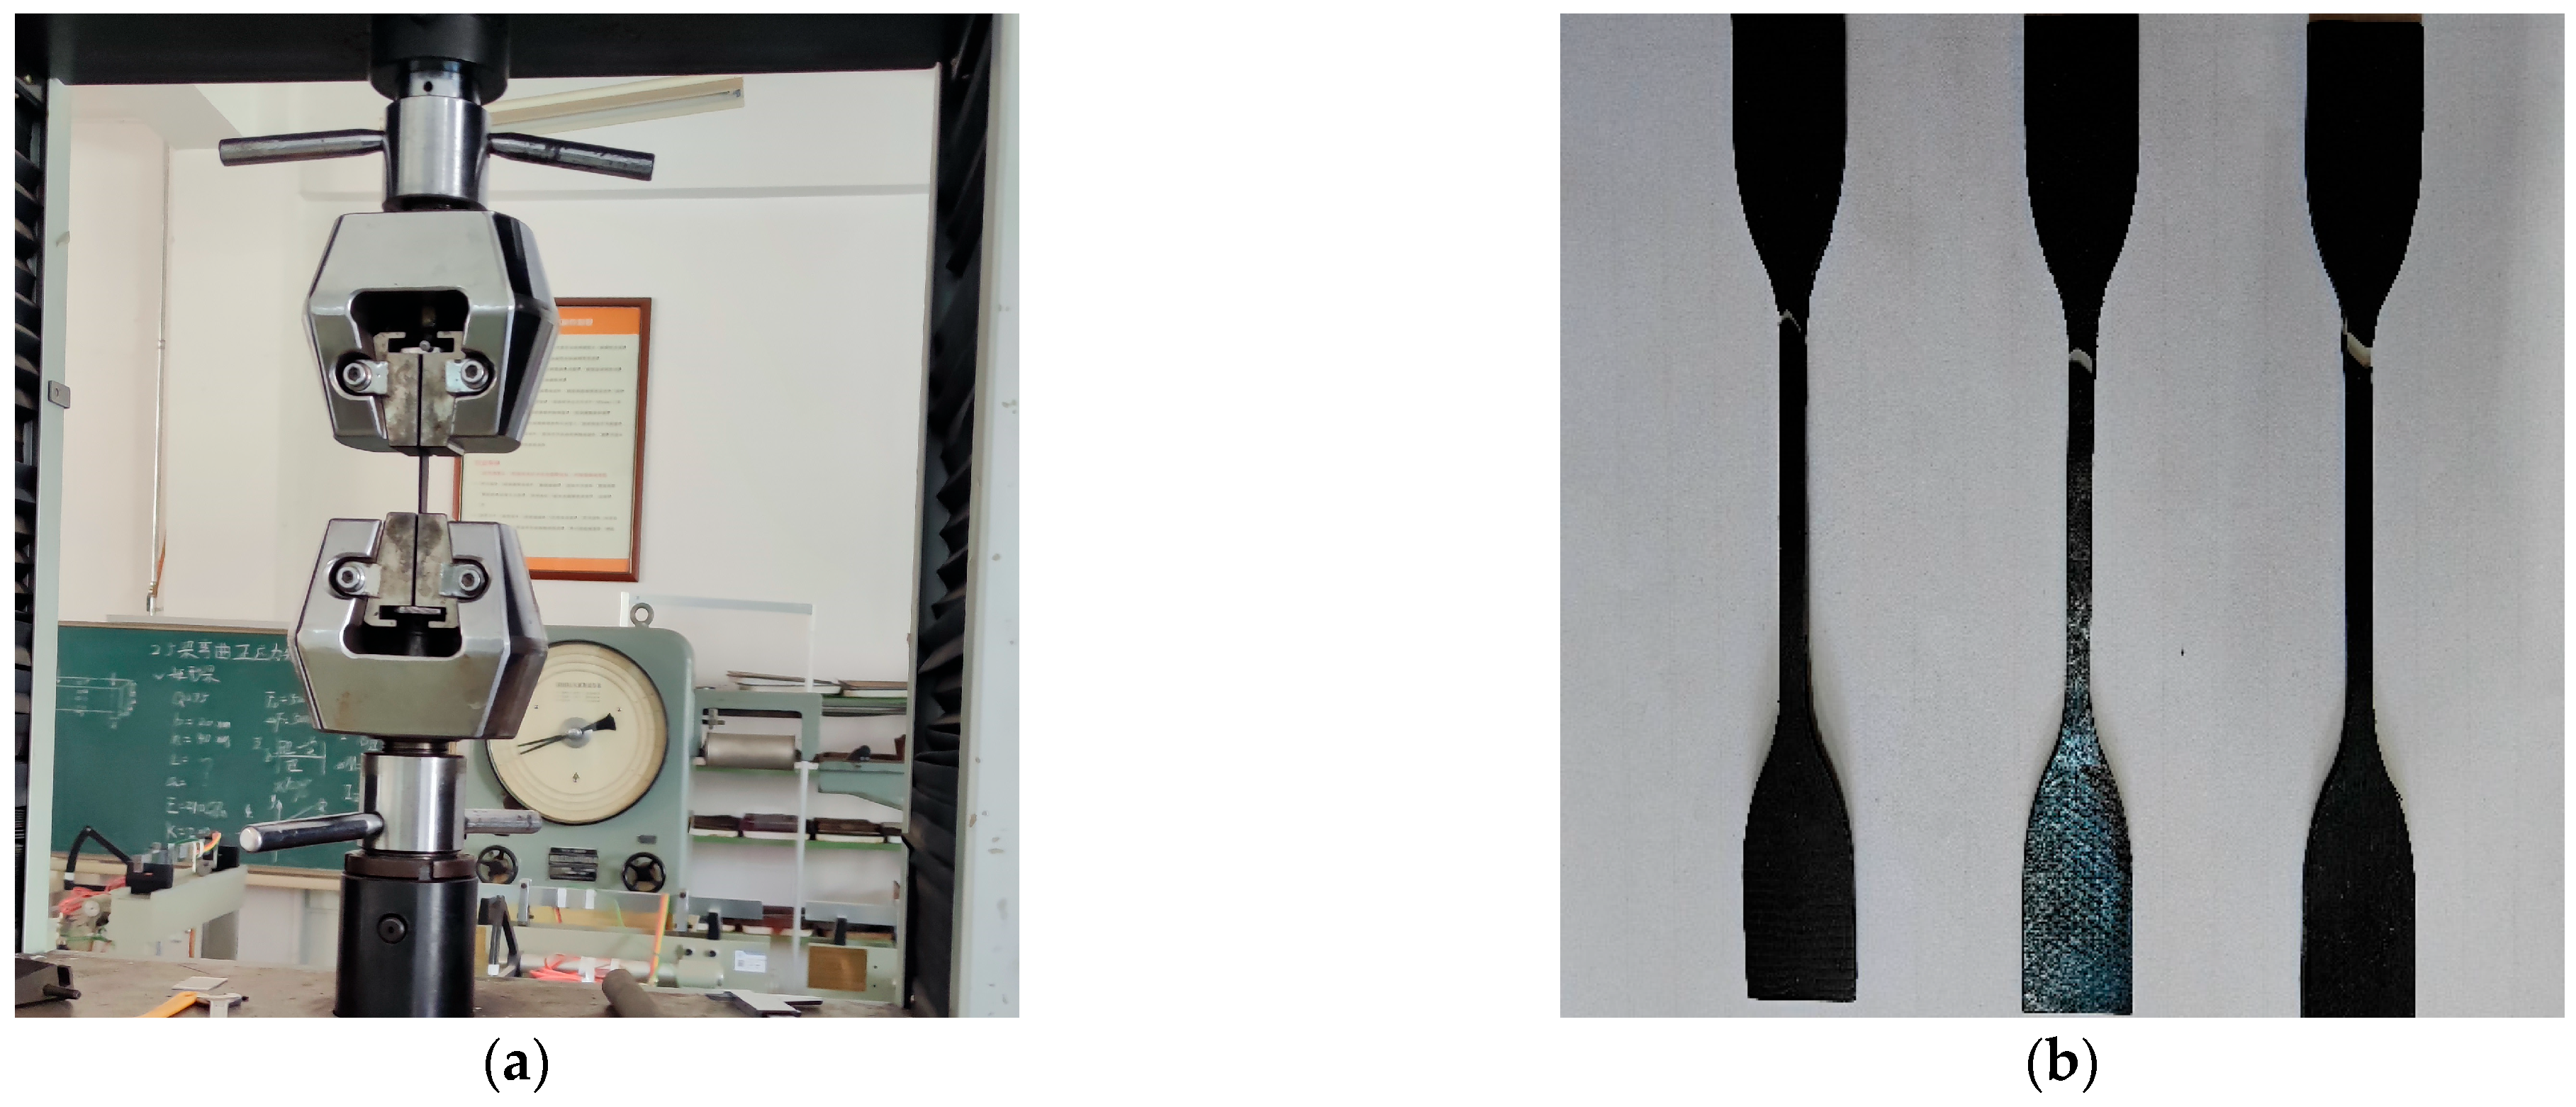
The hyperelastic Poly-N2 model employs a set of material parameters to characterize the nonlinear mechanical behavior of elastomers and soft tissues. The parameter C10 governs the linear shear stiffness, primarily dictating the material’s response under small deformations. C01 influences the stiffness at moderate strains, contributing to the Mooney–Rivlin effect in intermediate deformation regimes. For large deformations, C20 controls strain hardening by modulating the nonlinear stress response, while C11 describes the coupling effects between the first (I1) and second (I2) strain invariants, capturing complex deformation interactions. The parameter C02 further refines the high-strain nonlinear behavior, enhancing the model’s accuracy in predicting material response under extreme stretching. Additionally, D1 serves as the volumetric compressibility parameter, where D1 → 0 enforces near-incompressibility, a critical feature for accurately modeling rubber-like materials. Together, these parameters enable the Poly-N2 model to accurately represent a wide range of hyperelastic behaviors across different deformation states. Figure 3 illustrates the actual conditions of the tensile experiment.

2.5. Abaqus Simulation of Uniaxial Tensile Testing

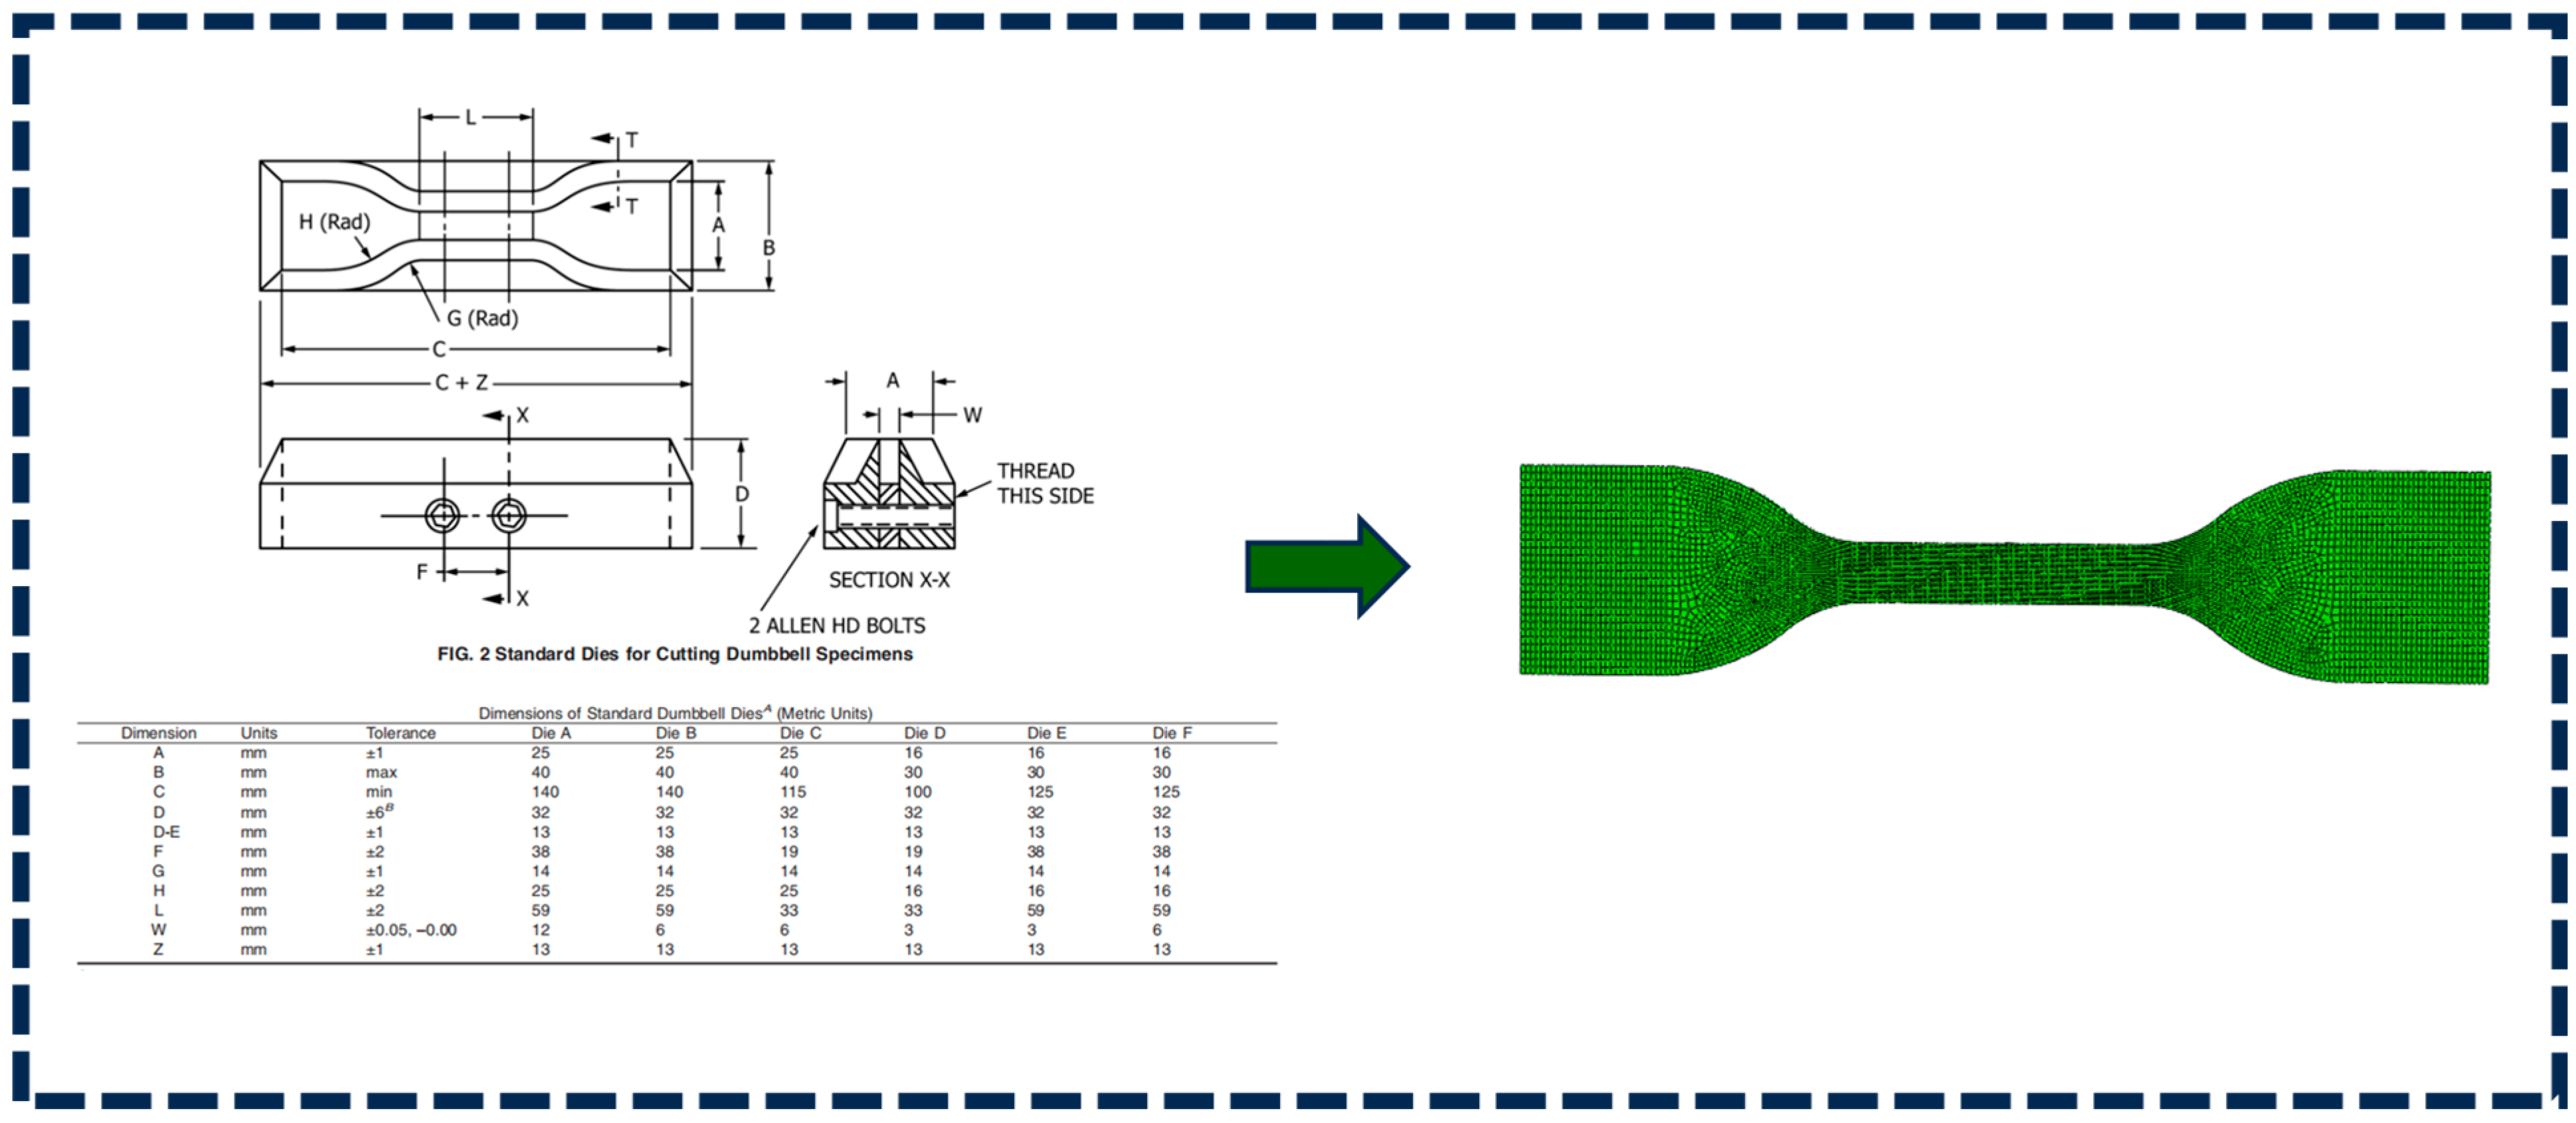
The test material comprised a dumbbell-shaped rubber specimen prepared using an ASTM D-412-C standard die cutter. The specimen geometry was modeled in SolidWorks2023 (Figure 4 for model configuration) and subsequently imported into ABAQUS/Standard for finite element analysis. The imported model was discretized using an optimized meshing scheme, and the calibrated material properties obtained from constitutive model fitting were assigned to the component.
The boundary conditions and loading configuration were implemented as follows: one end was fully fixed (ENCASTRE boundary condition), while a prescribed displacement (U2) was applied to the opposite end, with the magnitude set to the experimental displacement value corresponding to the maximum tensile stress. This setup enabled the simulation of uniaxial tensile testing under experimentally validated deformation conditions.

2.6. Material Properties

This study employs the Mooney–Rivlin hyperelastic model to characterize the mechanical behavior of the apex filler and sidewall compounds, with calibrated parameters detailed in Table 2 [28]. The Yeoh model is adopted for the carcass plies, steel belts, and reinforcement layers, as specified in Table 3 [28]. A second-order polynomial constitutive model (N = 2) governs the material response of the tread and bead heel region, with corresponding coefficients provided in Table 4. The Rebar reinforcement elements in Abaqus/Standard effectively simulate the cord reinforcements, with geometric arrangement parameters enumerated in Table 5 [34]. The material properties of the steel bead wires and reinforcement cords are comprehensively defined in Table 6 [37].

2.7. 2D Tire Model Construction

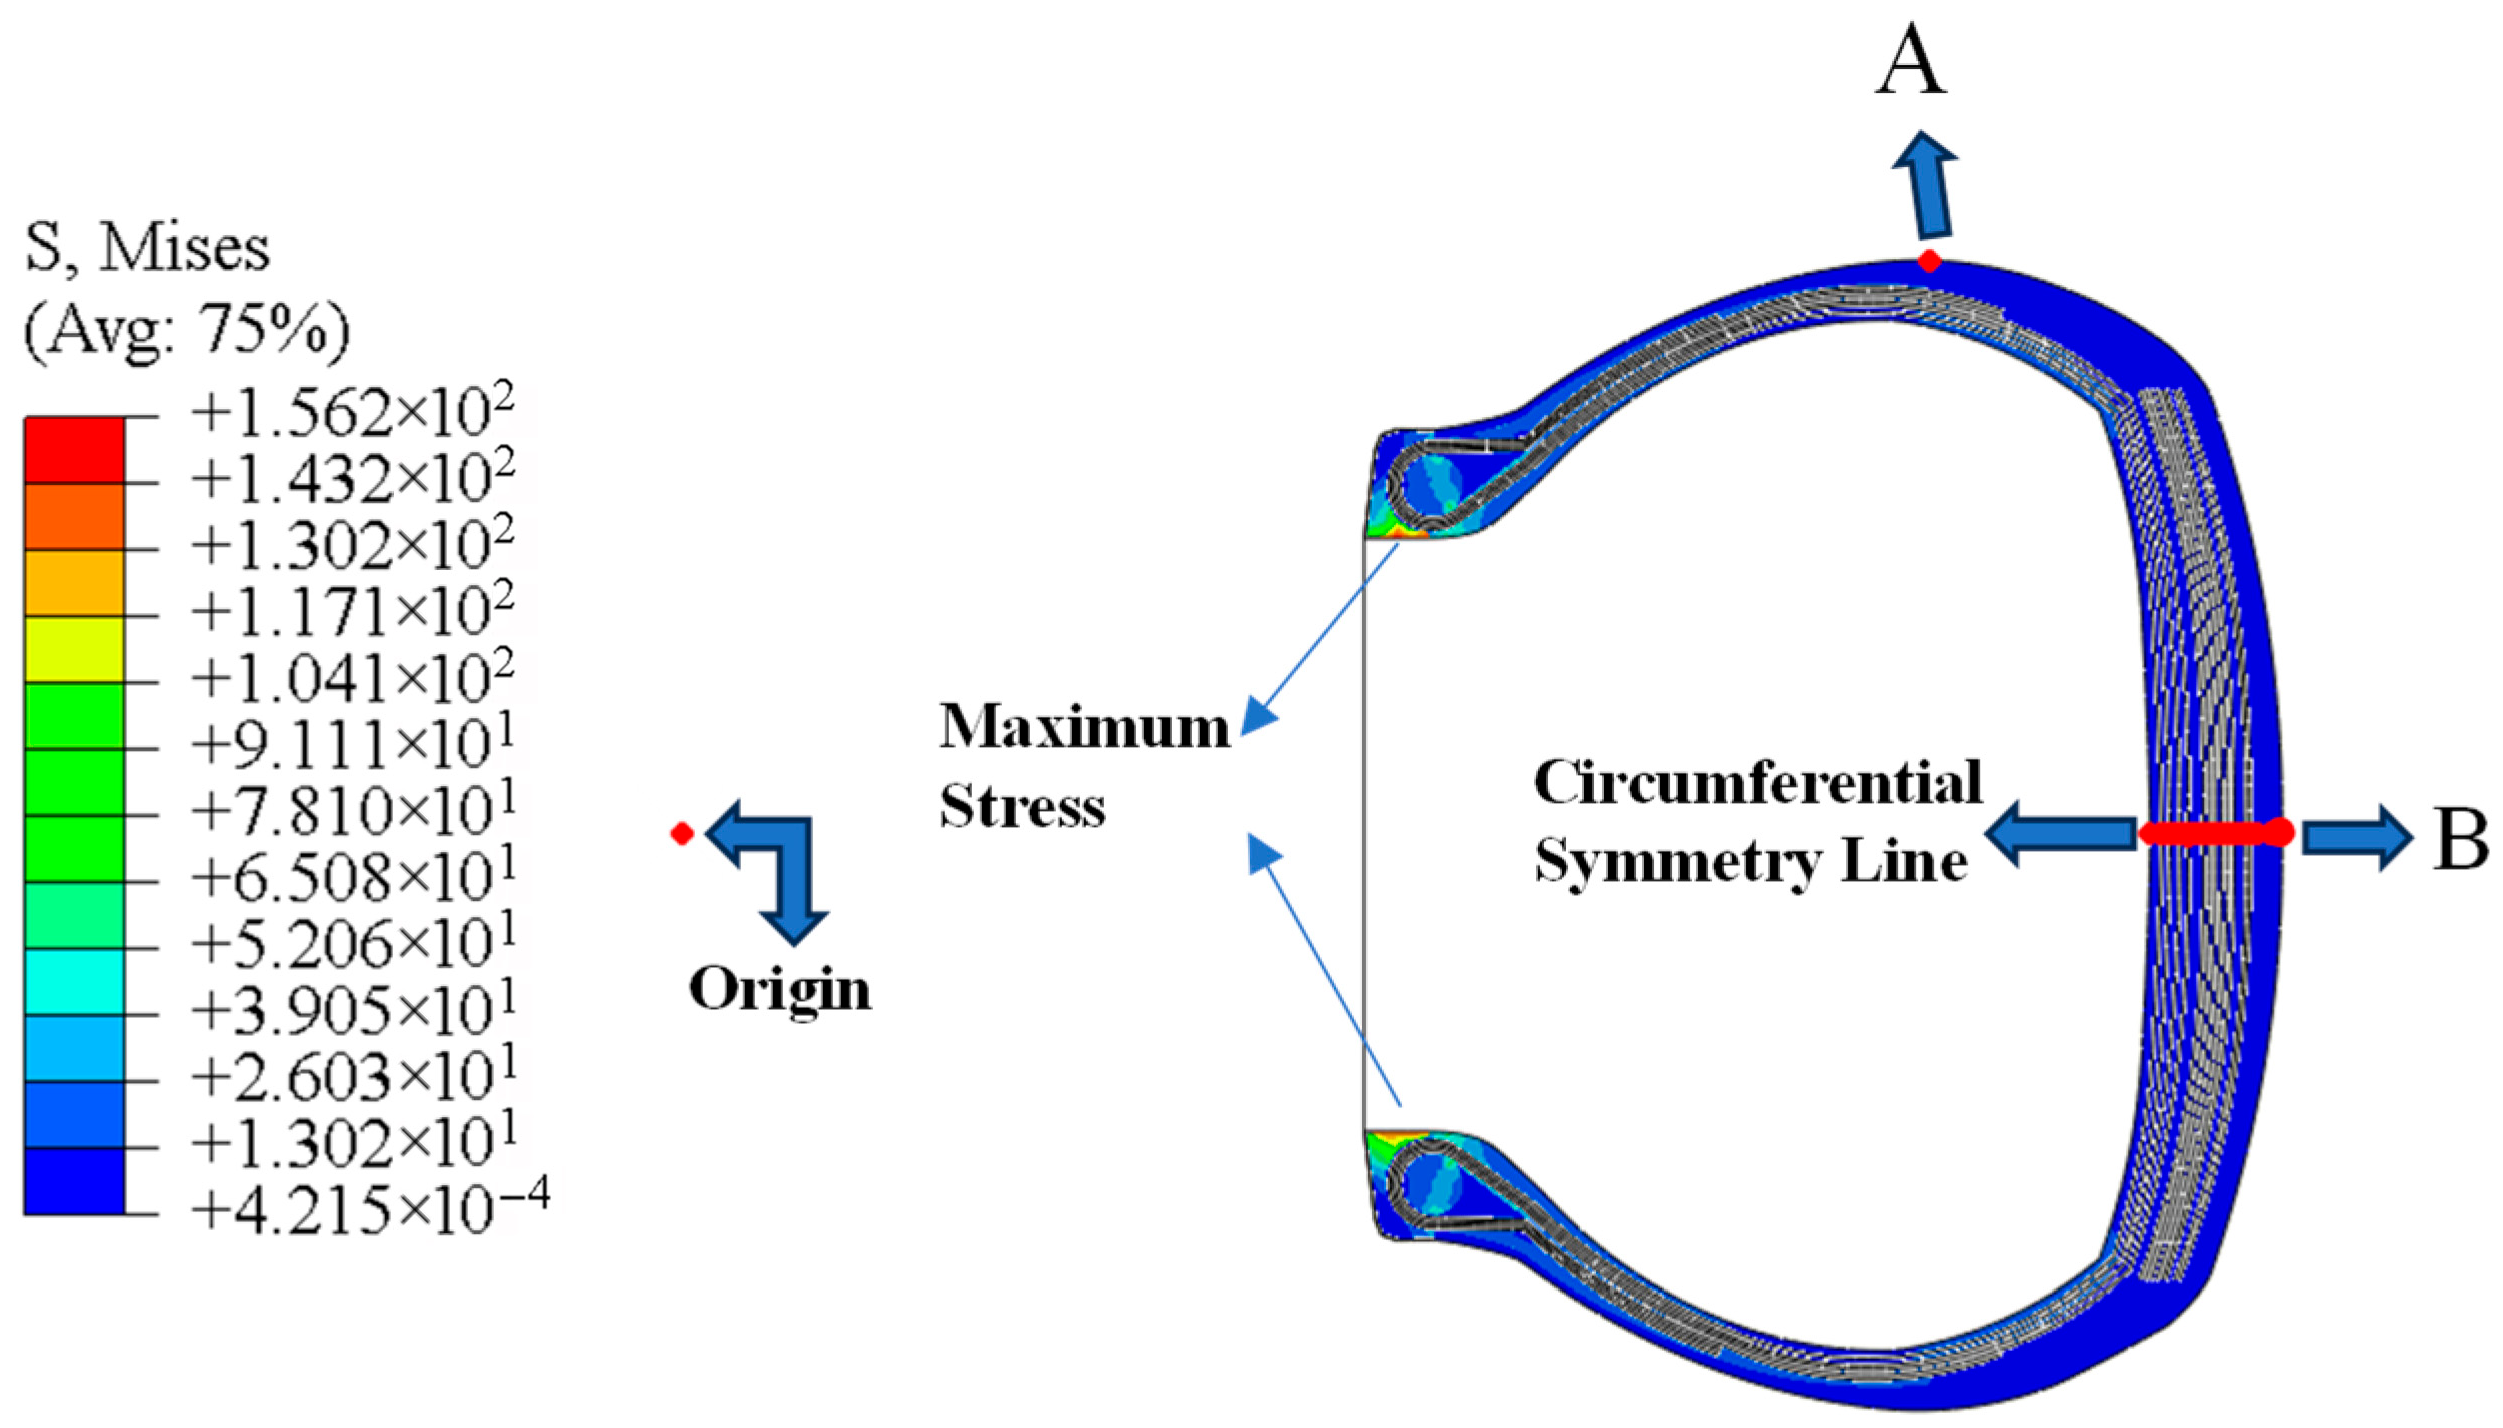
Aircraft tires are critical components for aircraft landing and taxiing operations, requiring exceptional capabilities to withstand extreme loads, impacts, and friction while maintaining lightweight properties, high-temperature resistance, and fatigue durability. Their composition and design are significantly more complex than conventional tires, prompting the proposal to utilize experimental rubber composite materials for the tread and bead heel regions, as static mechanical simulations revealed the bead heel rubber undergoes substantial pressure and deformation, as illustrated. This study employs a Bridgestone-produced 1270 × 455 R radial aircraft tire, simplified into the following components: tread, carcass ply, sidewall, bead wire bundle, steel belts, reinforcement layer, and bead heel. Given that the manufactured tire integrates cords and rubber through compression, the model simplifies this composite into a single homogeneous layer. Aramid fibers serve as the reinforcing cords to enhance overall structural strength. After establishing the geometric profiles of each component, the model was imported into HyperMesh for meshing to generate a two-dimensional finite element cross-sectional model of the radial aircraft tire. To ensure optimal mesh quality, the model contours were initially partitioned. The meshed model was then imported into ABAQUS in INP file format, utilizing the software’s rebar elements to simulate the carcass cords within the tire structure as shown in Figure 5.

2.8. Mesh Properties and Boundary Conditions of the 2D Finite Element Model

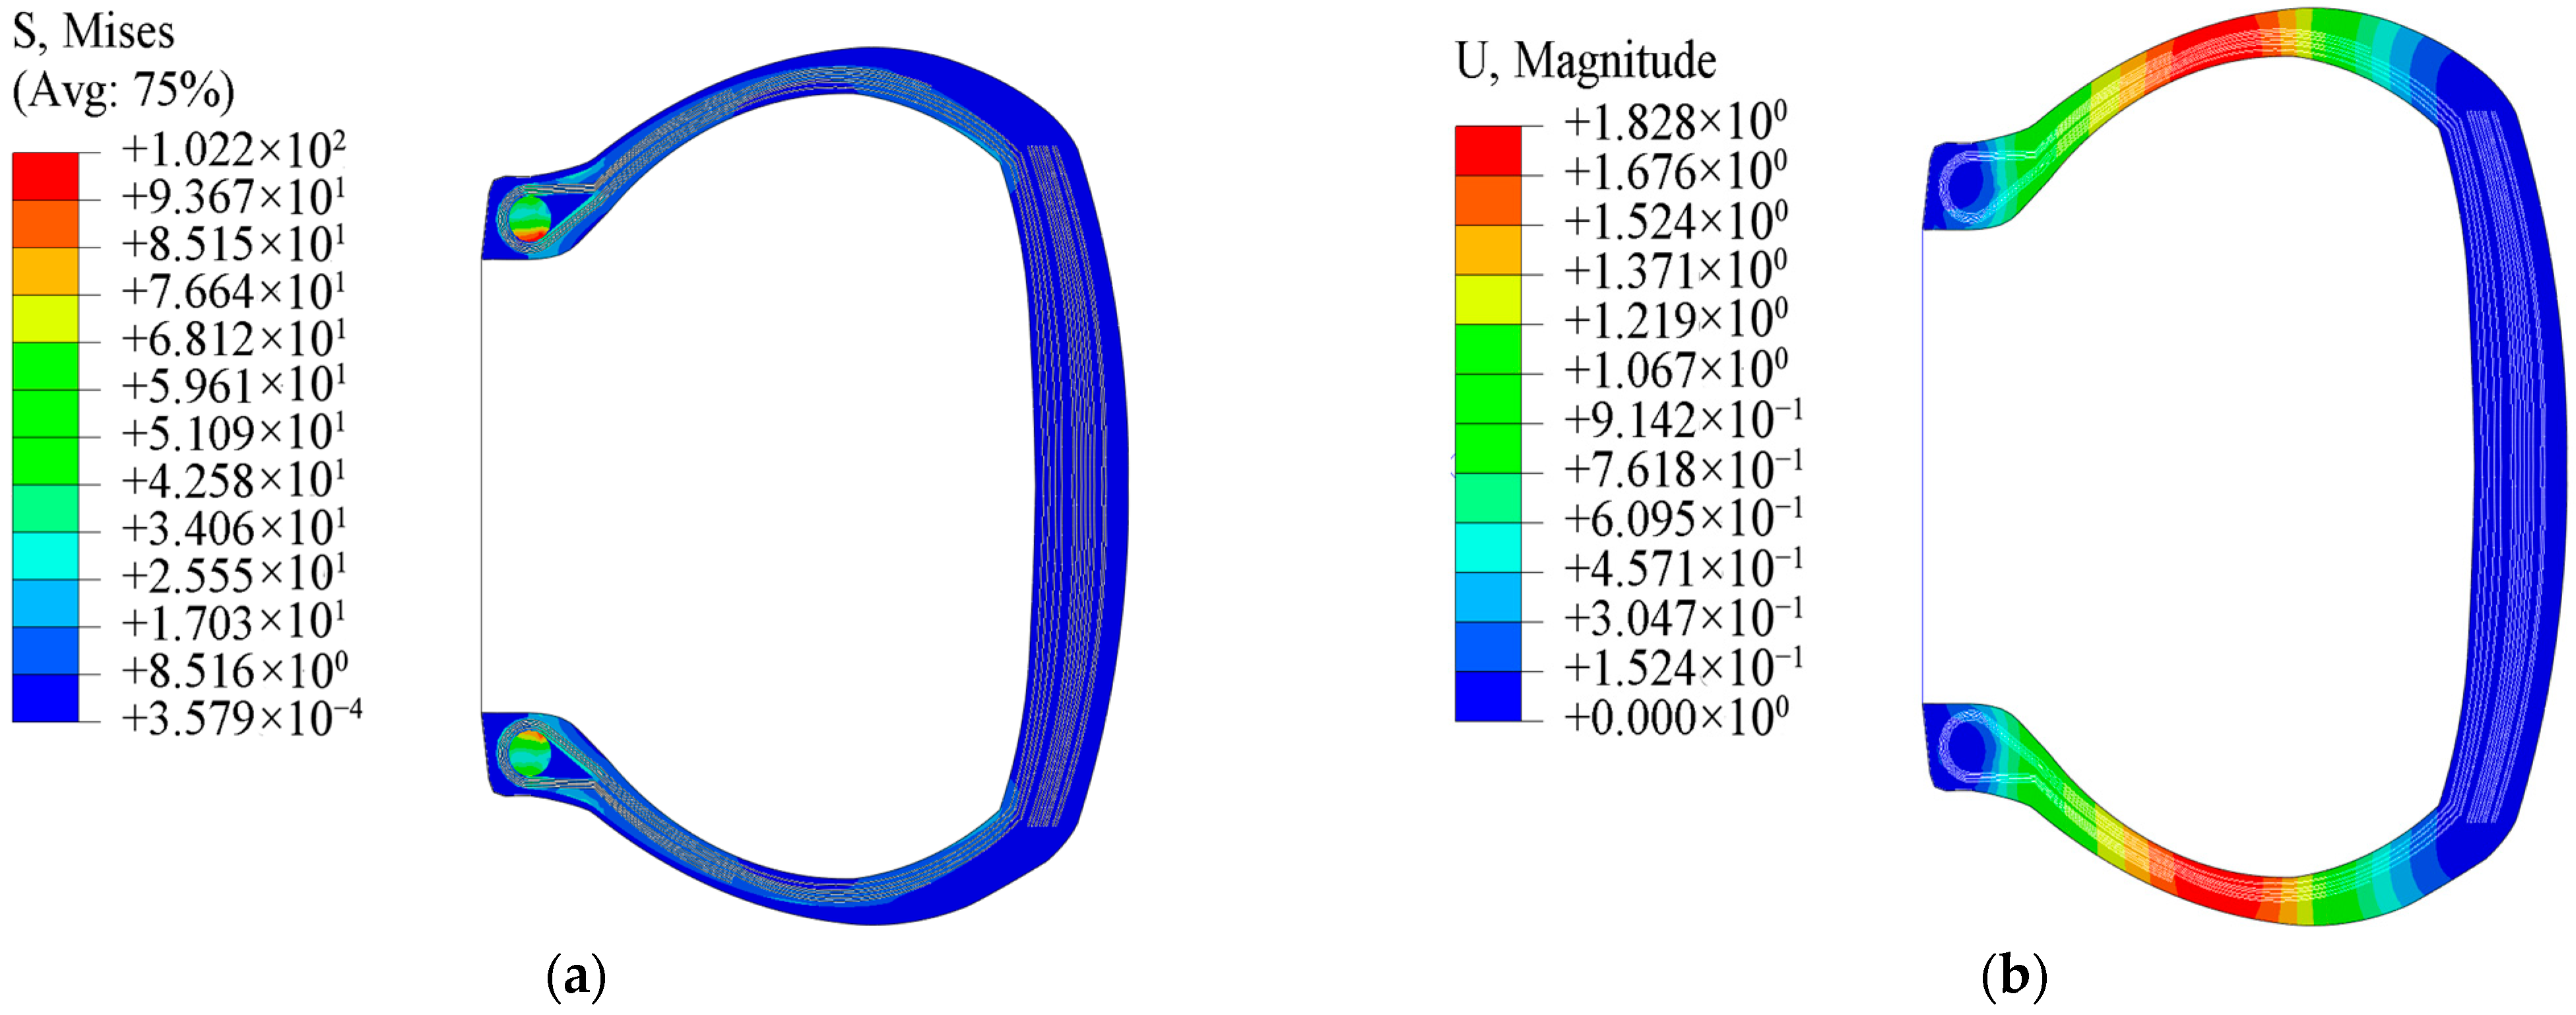
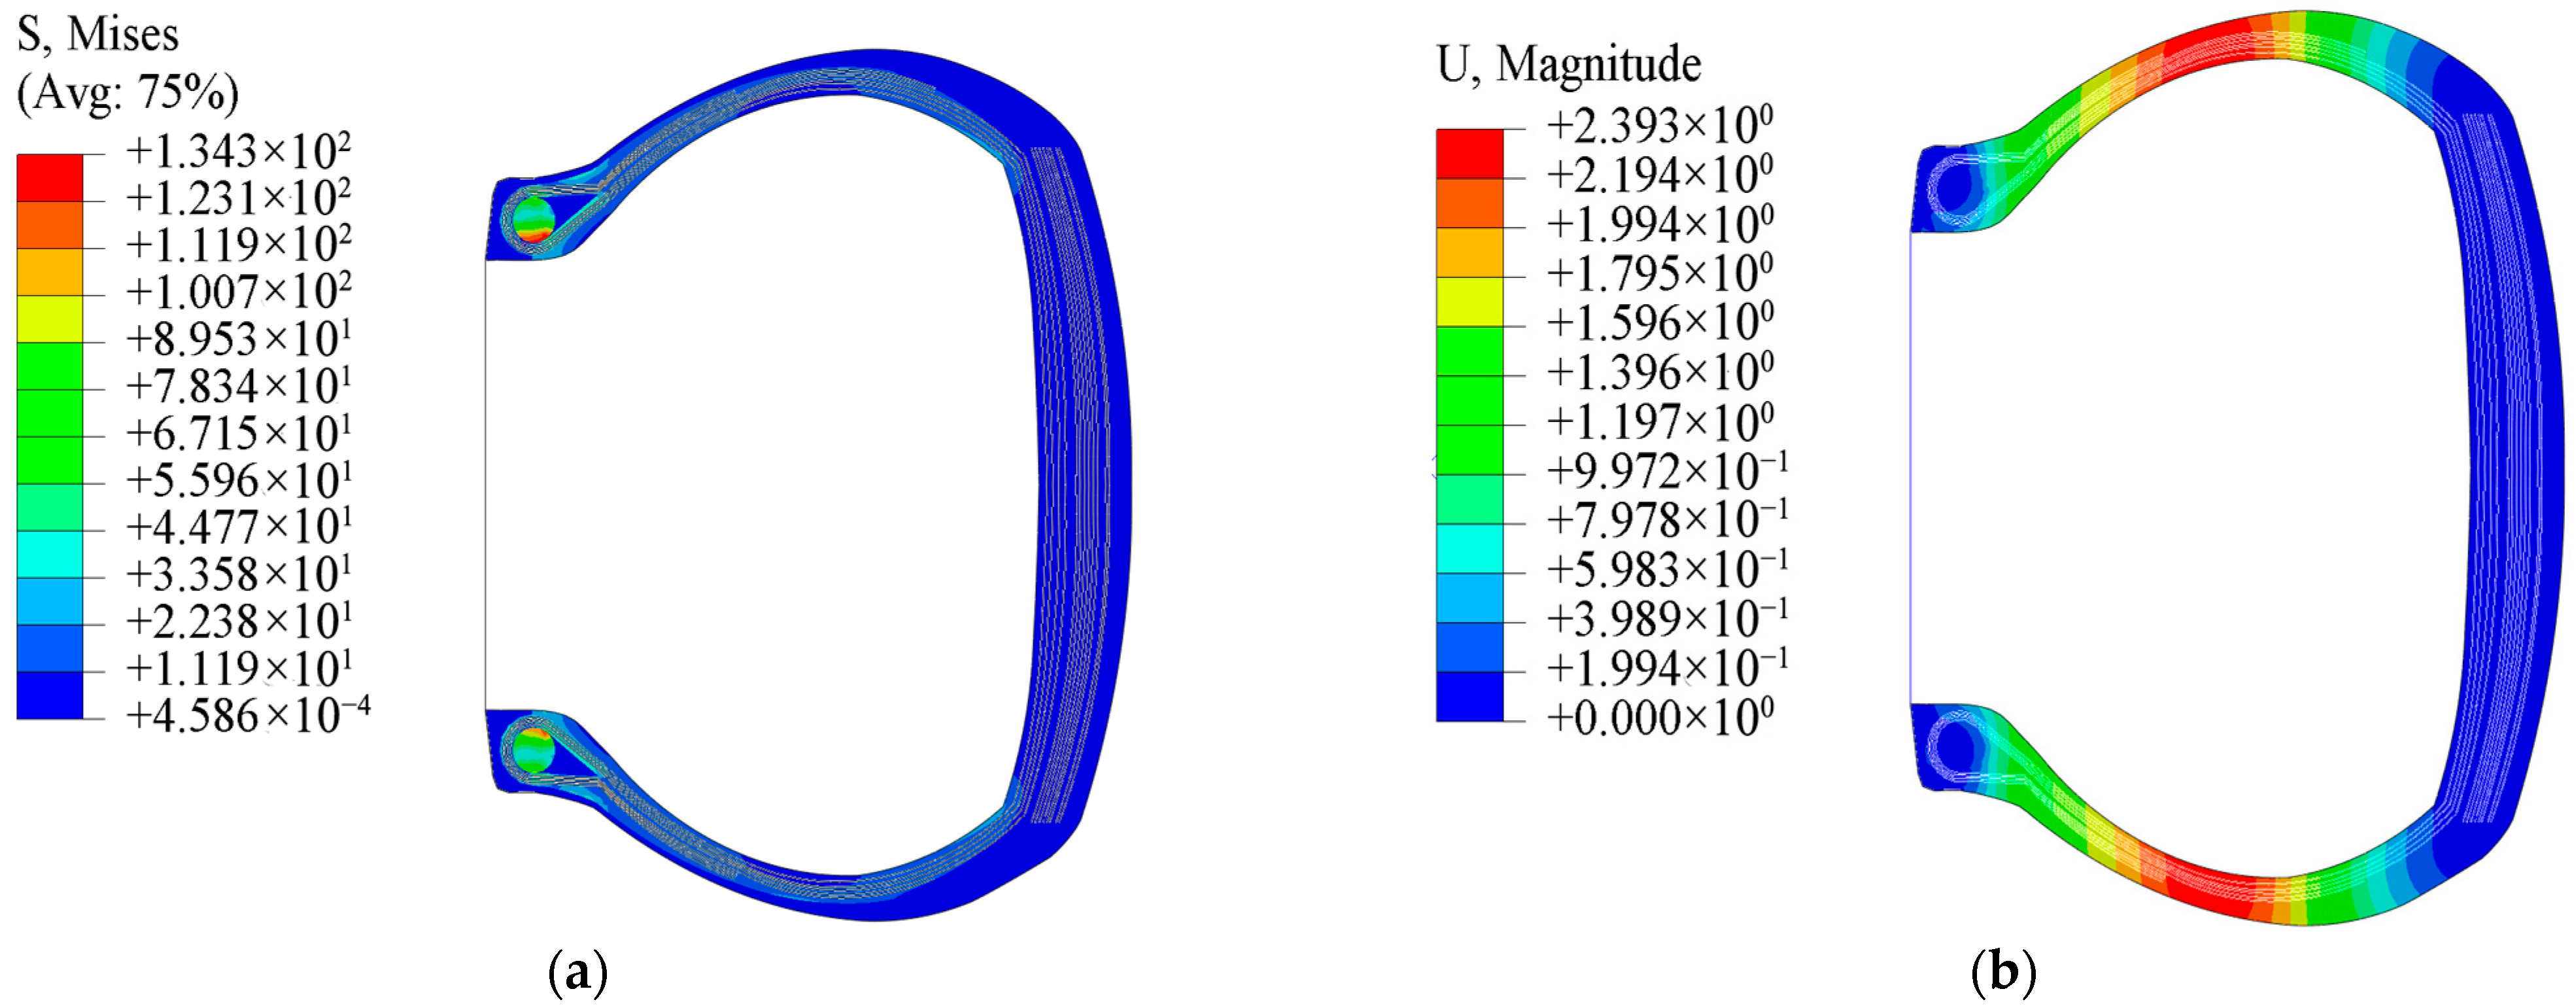
The 2D finite element model comprises 3361 elements and 3582 nodes, utilizing CGAX4H and CGAX3H element types for rubber components. The CGAX4H quadrilateral elements with linear interpolation provide optimal accuracy-efficiency balance for hyperelastic materials undergoing large deformations and geometric nonlinearity when sufficiently refined, while CGAX3H triangular elements are implemented in complex curvature transition zones (e.g., sidewall-to-bead heel interface) to mitigate distorted element effects. The reinforcement carcass is modeled using SFMGAX1 elements, simplifying the complex cord-rubber composite into a computationally efficient 1D representation without compromising accuracy. Boundary conditions are applied as shown in Figure 5. The origin point is fully constrained (U1 = U2 = UR3 = 0), with 1.5–2.5 MPa inflation pressure applied to the tire’s inner surface. The analysis follows GBT [38] standards for 1270 × 455 R radial aircraft tires specifying 1.51 MPa nominal inflation pressure under no-load conditions, with experimental validation requiring 1.5× standard pressure—hence the 1.5–2.5 MPa simulation range for comprehensive inflation analysis. Figure 6, Figure 7 and Figure 8 present the simulated stress and strain contour plots of the aircraft tire under inflation pressures of 1.5 MPa, 2.0 MPa, and 2.5 MPa, respectively.
The model’s dimensional expansion characteristics within the 1.5–2.5 MPa pressure range were evaluated against GBT specifications for 1270 × 455 R radial aircraft tires, which mandate maximum allowable expanded dimensions of 1311 mm in diameter and 476 mm in width. As illustrated in Figure 5, Point A marks the width measurement location (maximum section width) while Point B indicates the diameter measurement location (maximum outer diameter). Leveraging the tire’s circumferential symmetry, the simulation quantified diameter and width values at various inflation pressures, with results documented in Table 7.

2.9. 3D Static Load Footprint Simulation of Aircraft Tire

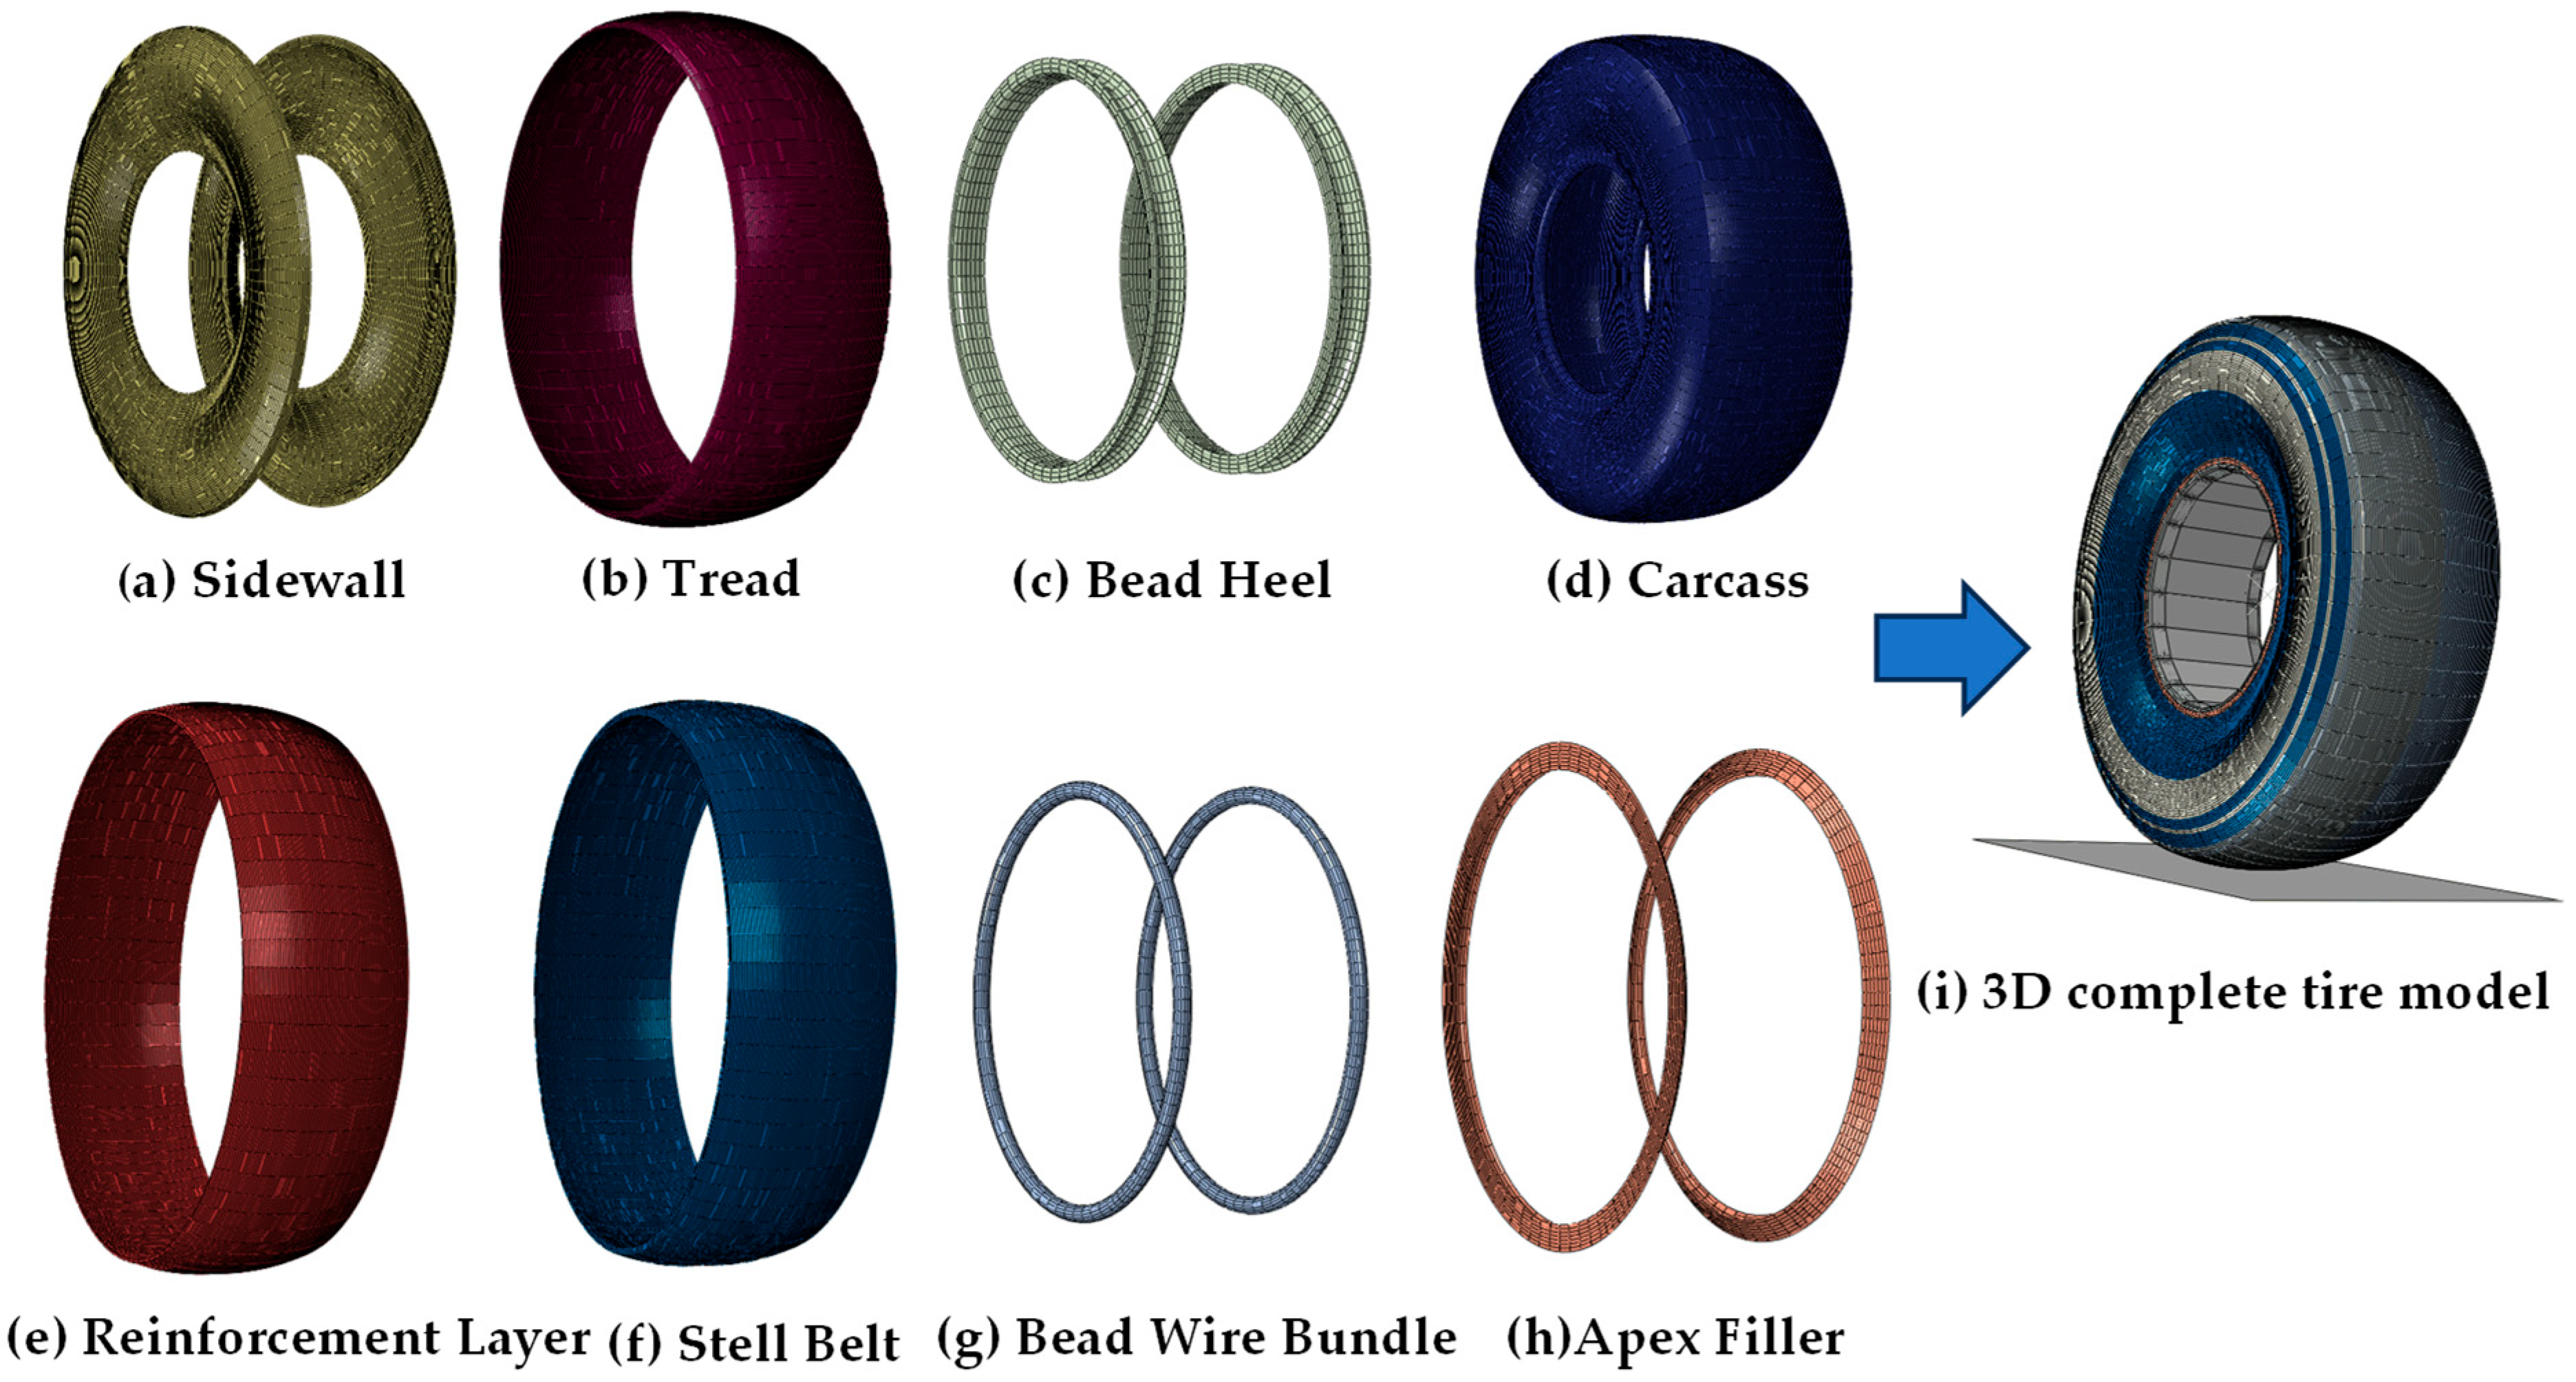
The 3D static contact simulation was developed by modifying the INP file to revolve the 2D cross-sectional model into a three-dimensional configuration using * SYMMETRIC MODEL GENERATION, with a cylindrical analytical surface created via * SURFACE, TYPE = CYLINDER and assigned as a rigid road surface through * RIGID BODY, REF NODE = ROAD, ANALYTICAL SURFACE = SROAD. Building upon the preceding inflation analysis where the tire was pressurized to 1.5 MPa, the static load simulation was subsequently performed, with Figure 9 illustrating all individual components and the complete tire assembly.
The load and boundary conditions were established by fully constraining both the origin point and road surface based on the 2D inflation simulation results before initiating the 3D inflation analysis. For the 3D static contact simulation, additional road surface constraints were applied by restricting U2, UR2, U1, and UR1 degrees of freedom, followed by application of vertical load on the road surface to simulate tire-ground interaction under static loading conditions.

2.10. Effective Contact Area in Normal Direction

In Abaqus simulations, the CNAREA distribution directly characterizes the tire-ground contact footprint, where aircraft tires require uniform contact pressure distribution to prevent localized high-pressure zones that may cause tire wear or surface damage. The CNAREA profile evaluates contact zone rationality, with static loading ideally producing uniform rectangular or elliptical footprints. The rationality of the tire model design can be validated by analyzing the normal effective contact area during tire-ground interaction.

2.11. Deflection and Radial Stiffness Characteristics

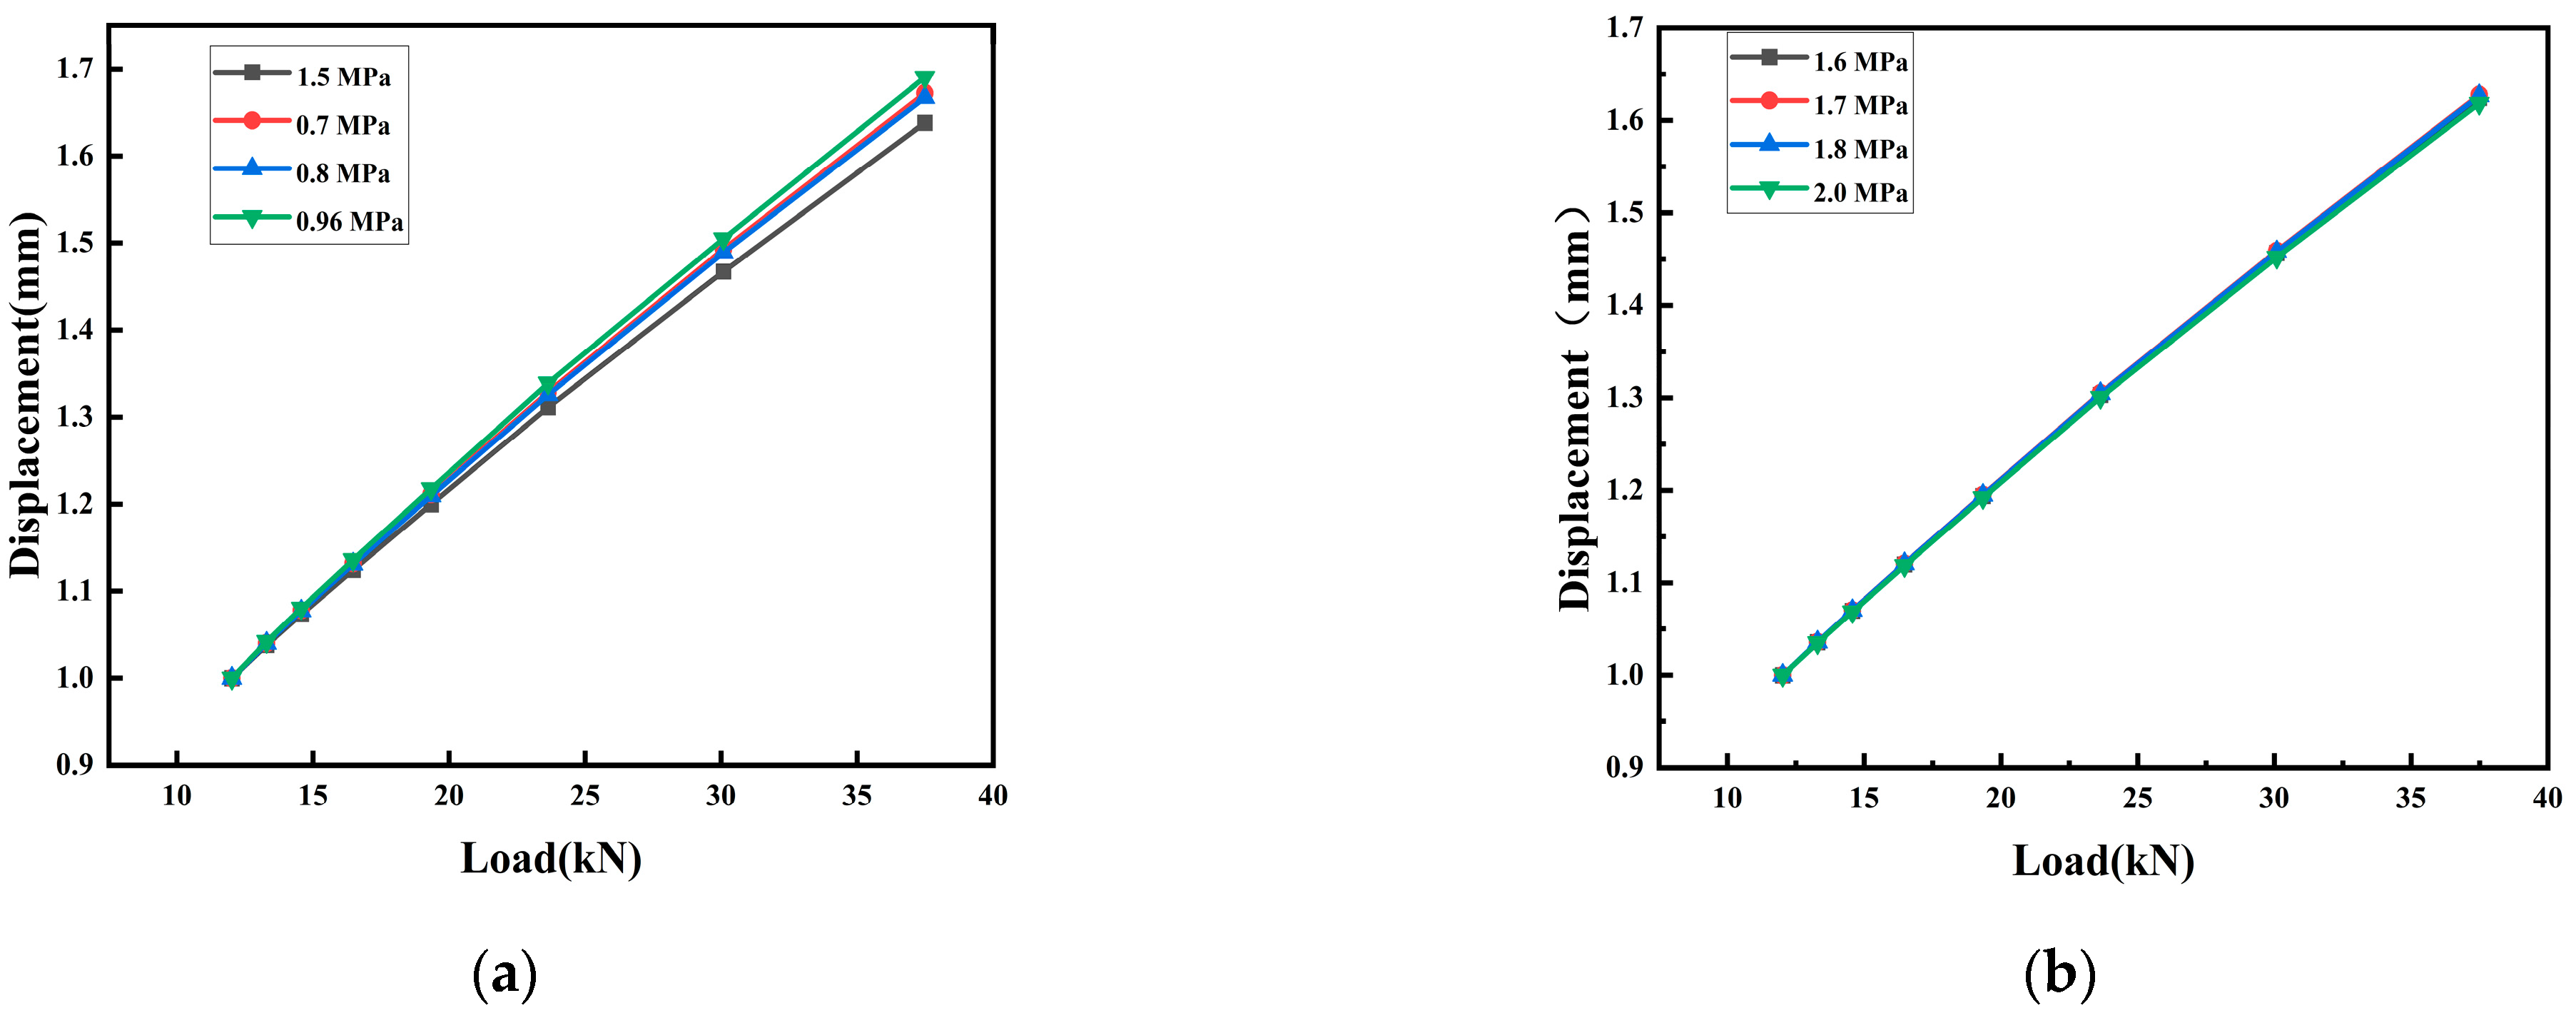
The specialized application of aircraft tires in aviation necessitates unique design considerations, with this study employing simplified modeling approaches where the carcass layer is represented by carcass cord material and the belt/reinforcement layers by belt cord material. Aramid fiber reinforcements are embedded throughout the carcass, reinforcement, and cord layers to significantly enhance structural integrity. Finite element simulations were performed in ABAQUS to analyze tire deflection under static vertical loading (0 kN–37.5 kN) at eight inflation pressures (0.7 MPa, 0.8 MPa, 0.96 MPa, 1.5 MPa, 1.6 MPa, 1.7 MPa, 1.8 MPa, and 2.0 MPa), with results presented in Figure 10. Radial stiffness is calculated per Equation (2), where W denotes static load and ΔH represents tire deflection (displacement), defining C as the tire’s radial stiffness coefficient.
C = W Δ H

3. Result and Discussion

3.1. Comparative Performance Testing of Carbon Nanotube Composites

Mechanical characterization of die-cut dumbbell specimens revealed significant enhancements in material properties for the modified composites (Table 8). Sample A exhibited significant mechanical enhancements compared to Samples B and C, with increases of 2.25 MPa and 4.75 MPa in 300% modulus, 2.68 MPa and 5.11 MPa in 500% modulus, 1.22 MPa and 2.12 MPa in tensile strength, and 0.50 MPa and 0.66 MPa in Young’s modulus, respectively. These uniaxial tensile test results demonstrate that the selenol-functionalized carbon nanotubes achieved superior dispersion uniformity within the rubber matrix.

3.2. Constitutive Model Calibration via Experimental Data Fitting

The fitting results are presented with Group A shown in Figure 11 and Table 9, Group B in Figure 12 and Table 10, and Group C in Figure 13 and Table 11. The experimental data fitting demonstrates that Groups A, B, and C exhibit optimal correlation with the second-order polynomial constitutive model (N = 2), warranting the adoption of these fitting coefficients as material parameters.

3.3. Constitutive Model Validation Through Simulated Tensile Testing

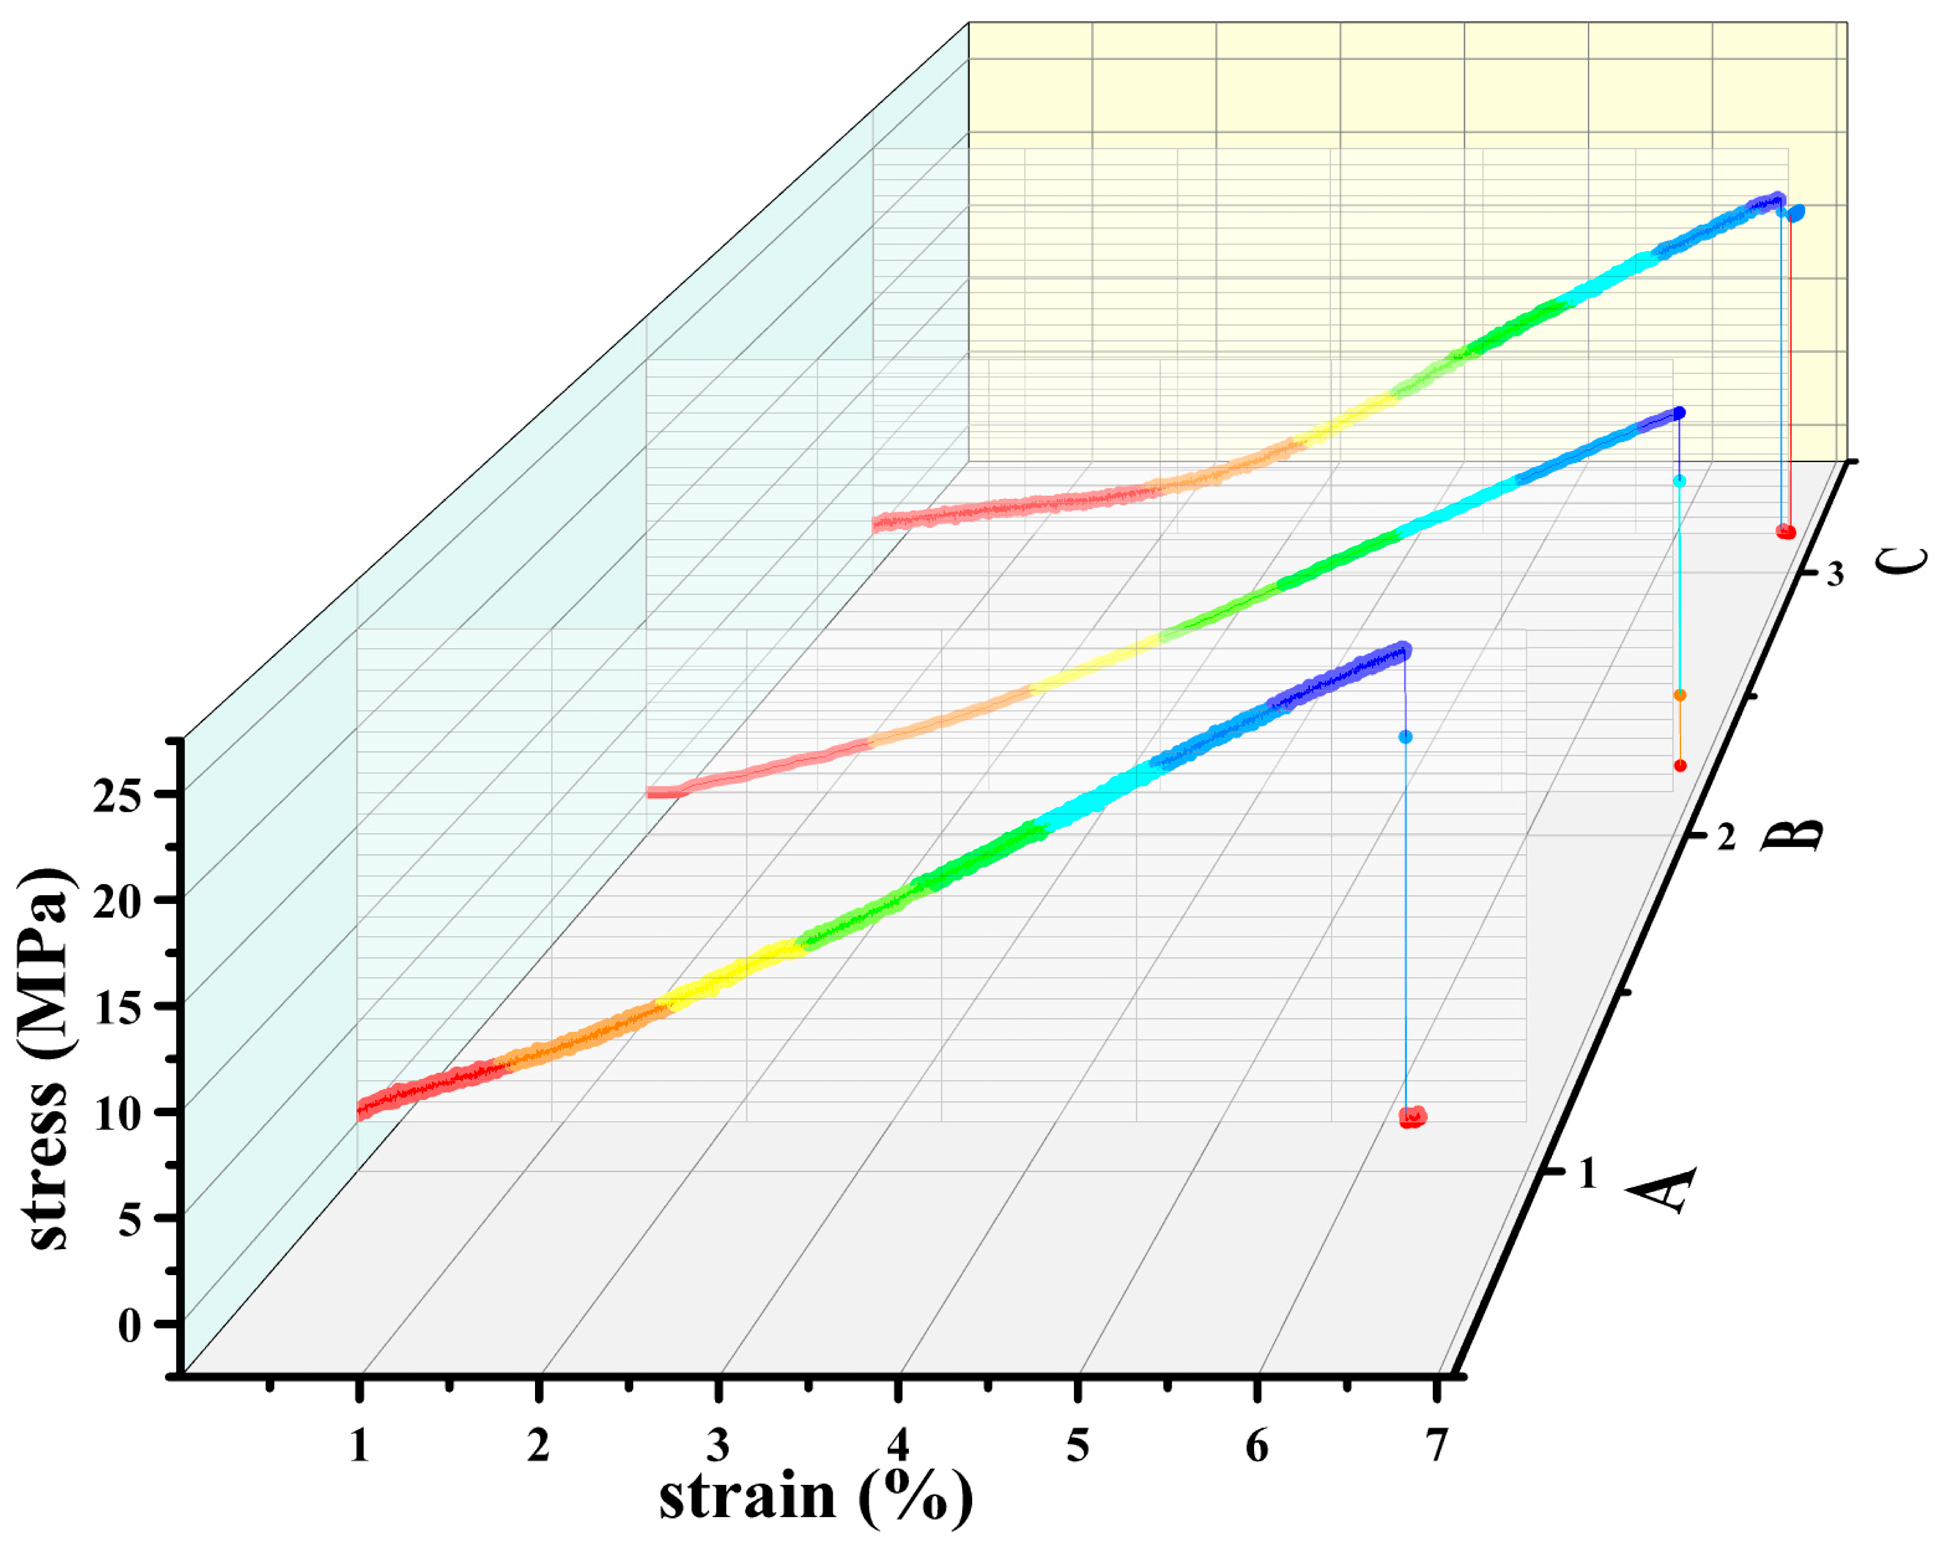
The simulation results are presented in Figure 14 and Table 12, demonstrating the numerical-experimental correlation of the tensile test behavior. Figure 15 presents the experimental stress–strain curves of the three tested samples. Group A exhibited a tensile strength of 23.22 MPa (experimental) versus 23.19 MPa (simulated). Group C measured 21.40 MPa (experimental) compared to 21.12 MPa (simulated), while Group B recorded 22.00 MPa (experimental) against 21.58 MPa (simulated). Finite element analysis identified the radius transition zone as the region of peak stress concentration (Figure 14). This computational prediction correlated precisely with the fracture initiation site observed in physical tensile tests of dumbbell specimens, confirming stress localization at the curved section. The close agreement between experimental and simulated results (<2% deviation) validates that the calibrated constitutive model effectively replicates the material’s static mechanical response.

3.4. Inflation Simulation Analysis

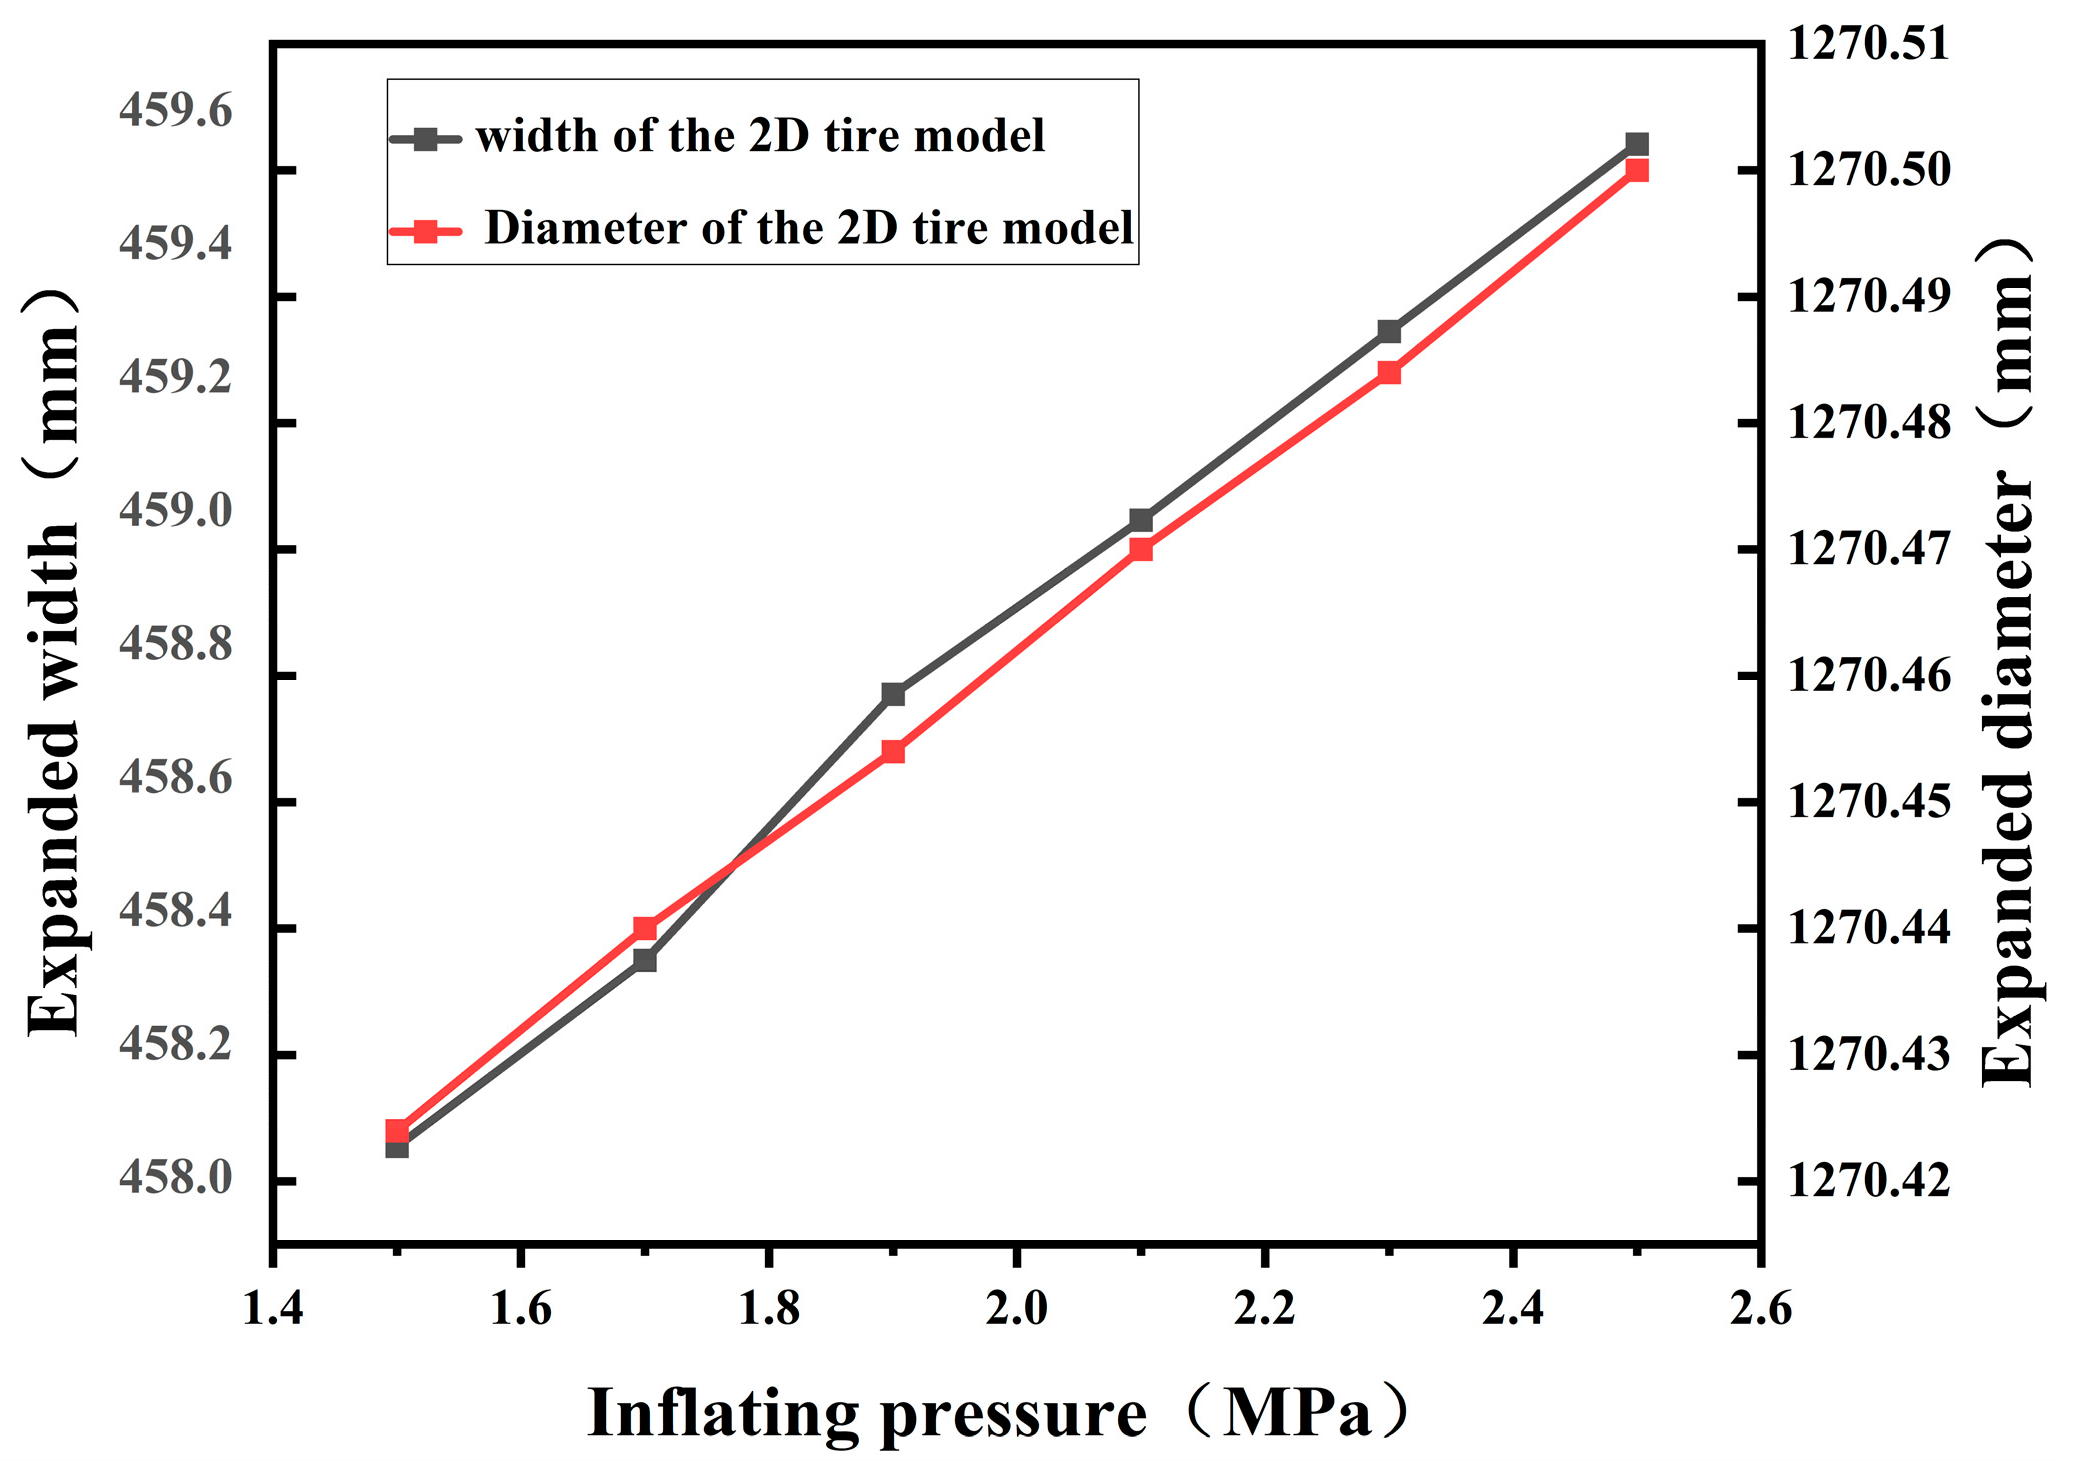
Simulation results indicate that both the expanded diameter and width remain within permissible limits under progressively increasing pressure (0.2 MPa increments from 1.5 to 2.5 MPa), with the expansion curve demonstrating near-linear characteristics (Figure 16), confirming effective pressure distribution and inflation performance. Notably, reinforcement cords exhibit maximum stress concentration at the bead heel-to-carcass transition zone (Figure 17), where simulated stresses reach 127.5 MPa at 2.5 MPa inflation pressure—yielding a 1.5× safety factor (191.25 MPa) that remains substantially below the experimental tensile failure threshold of 3000 MPa for carcass cords.

3.5. Tire Footprint Analysis

The contact patches maintain elliptical profiles throughout this loading range, with decreasing eccentricity (flattening at lower loads transitioning toward circularity under higher loads) accompanied by progressive central pressure intensification. Maximum stresses consistently localize at the center with smooth peripheral attenuation, validating the model’s compliance with GBT standards for 1270 × 455 R radial aircraft tires which specify 230.9 kN static load capacity at 1.5 MPa inflation pressure, where the elliptical footprint geometry confirms proper structural design.
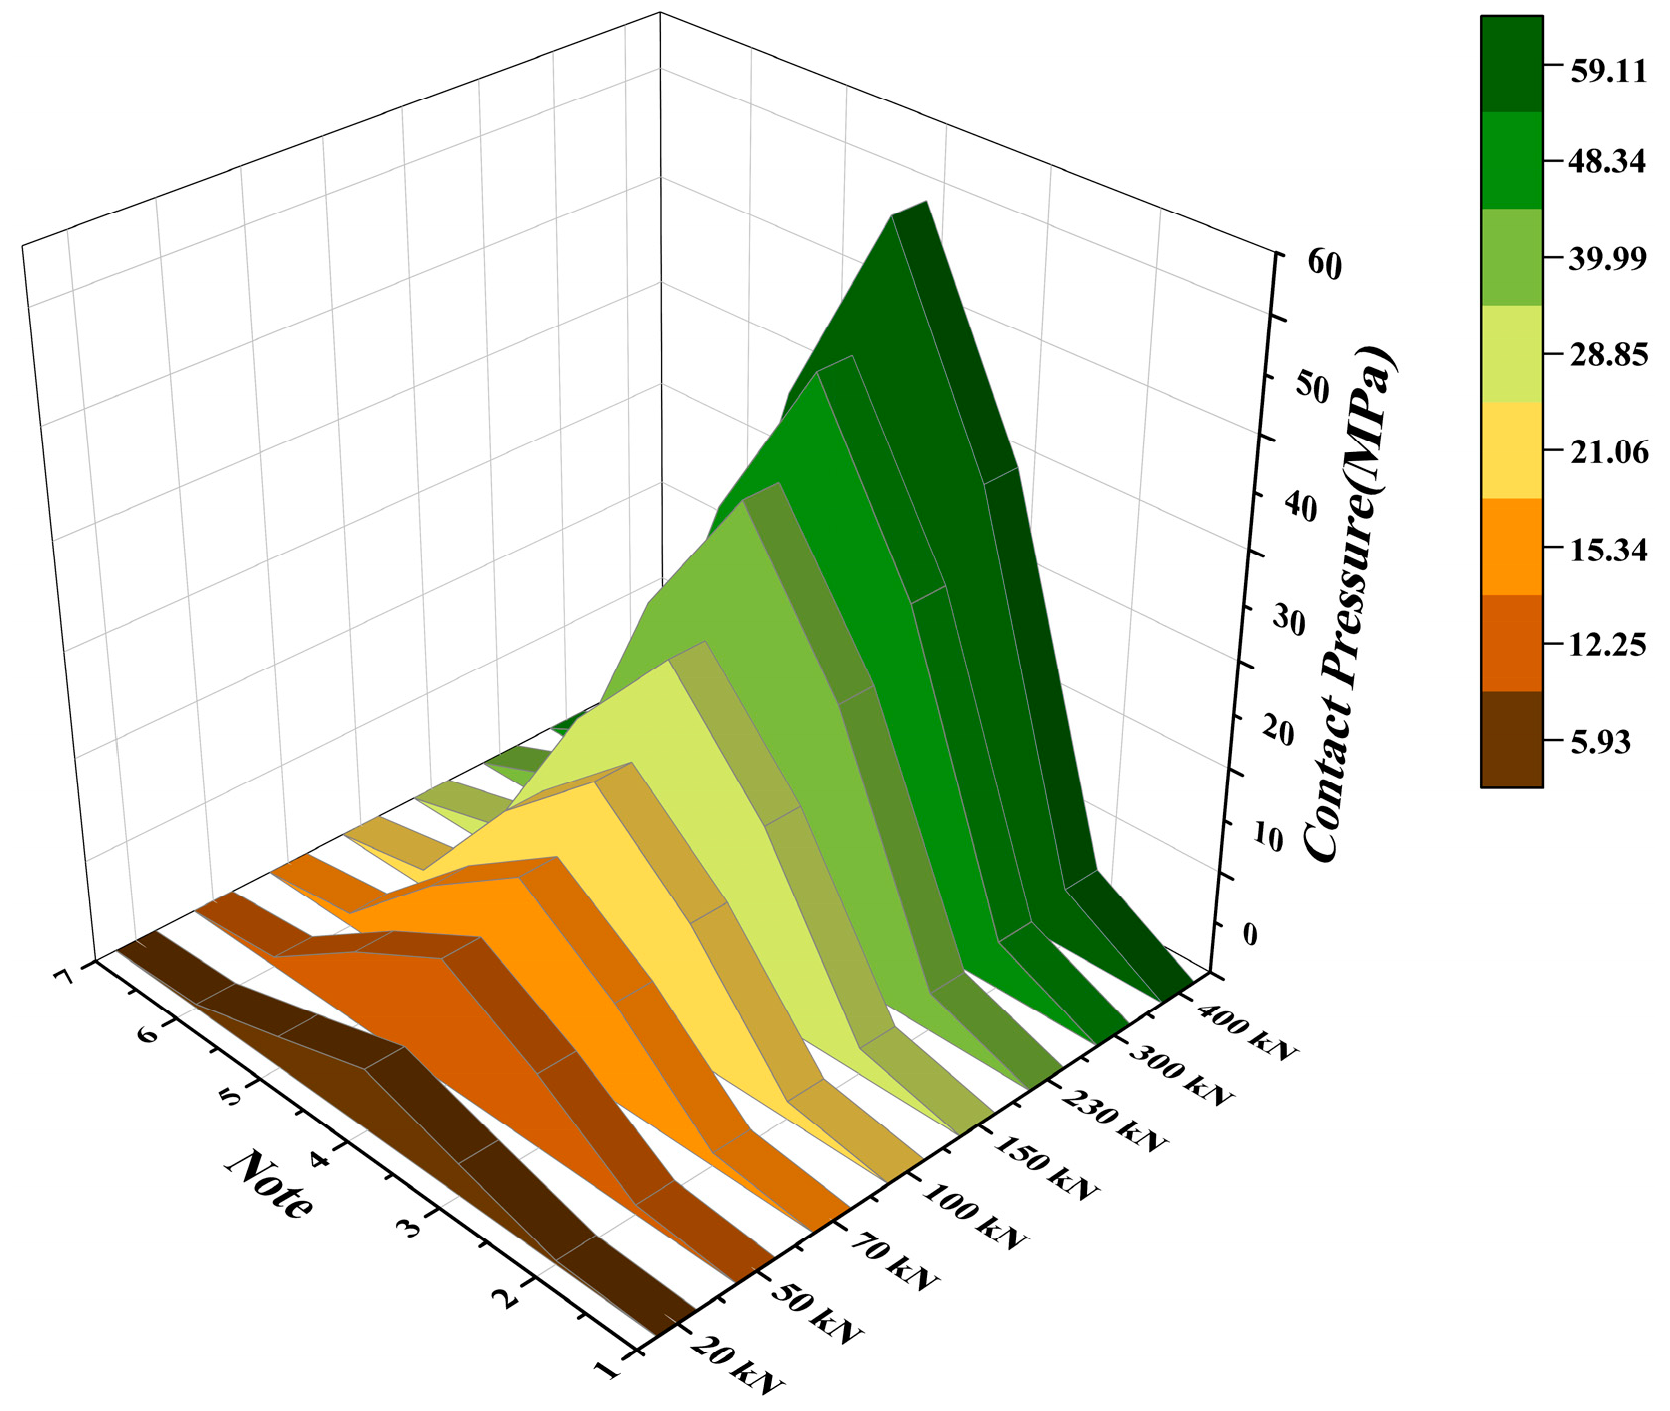
The contact pressure distribution conforms to Equation 3, demonstrating proportional correlation between contact stress and applied load when assuming constant contact area, as represented by the red fitted linear function in Figure 18. However, under actual operating conditions, the effective contact area progressively expands with increasing load magnitude, resulting in the nonlinear trend observed in the aforementioned figure while still maintaining fundamental consistency with the theoretical relationship.
C P R E S S = C N A R E A C N F
CPRESS represents contact pressure, CANREA denotes effective contact area, and CNF indicates contact normal force. The models under 20 kN, 50 kN, 70 kN, 150 kN, 230 kN, 300 kN, and 400 kN loading conditions were analyzed by extracting contact pressure variations along a circumferential reference path through the contact patch, as illustrated in Figure 18. The contact pressure distributions along the circumferential direction exhibit symmetrical patterns about the reference line, with Node 4 located precisely on the circumferential centerline consistently demonstrating peak pressure values at all load levels while maintaining symmetrical stress distribution across adjacent nodes, thereby validating the model’s geometric and material integrity.
In Abaqus simulations, CPRESS (contact pressure) serves as the primary parameter characterizing tire-ground mechanical interaction, where under ideal static loading conditions aircraft tires should exhibit elliptical pressure distributions with peak pressures at the central region and gradual edge pressure decay. Figure 19 demonstrates the contact pressure distributions at rated 1.5 MPa inflation pressure across varying loads (10–400 kN), revealing two distinct zones—external and internal regions.

3.6. Analysis of Effective Normal Contact Area

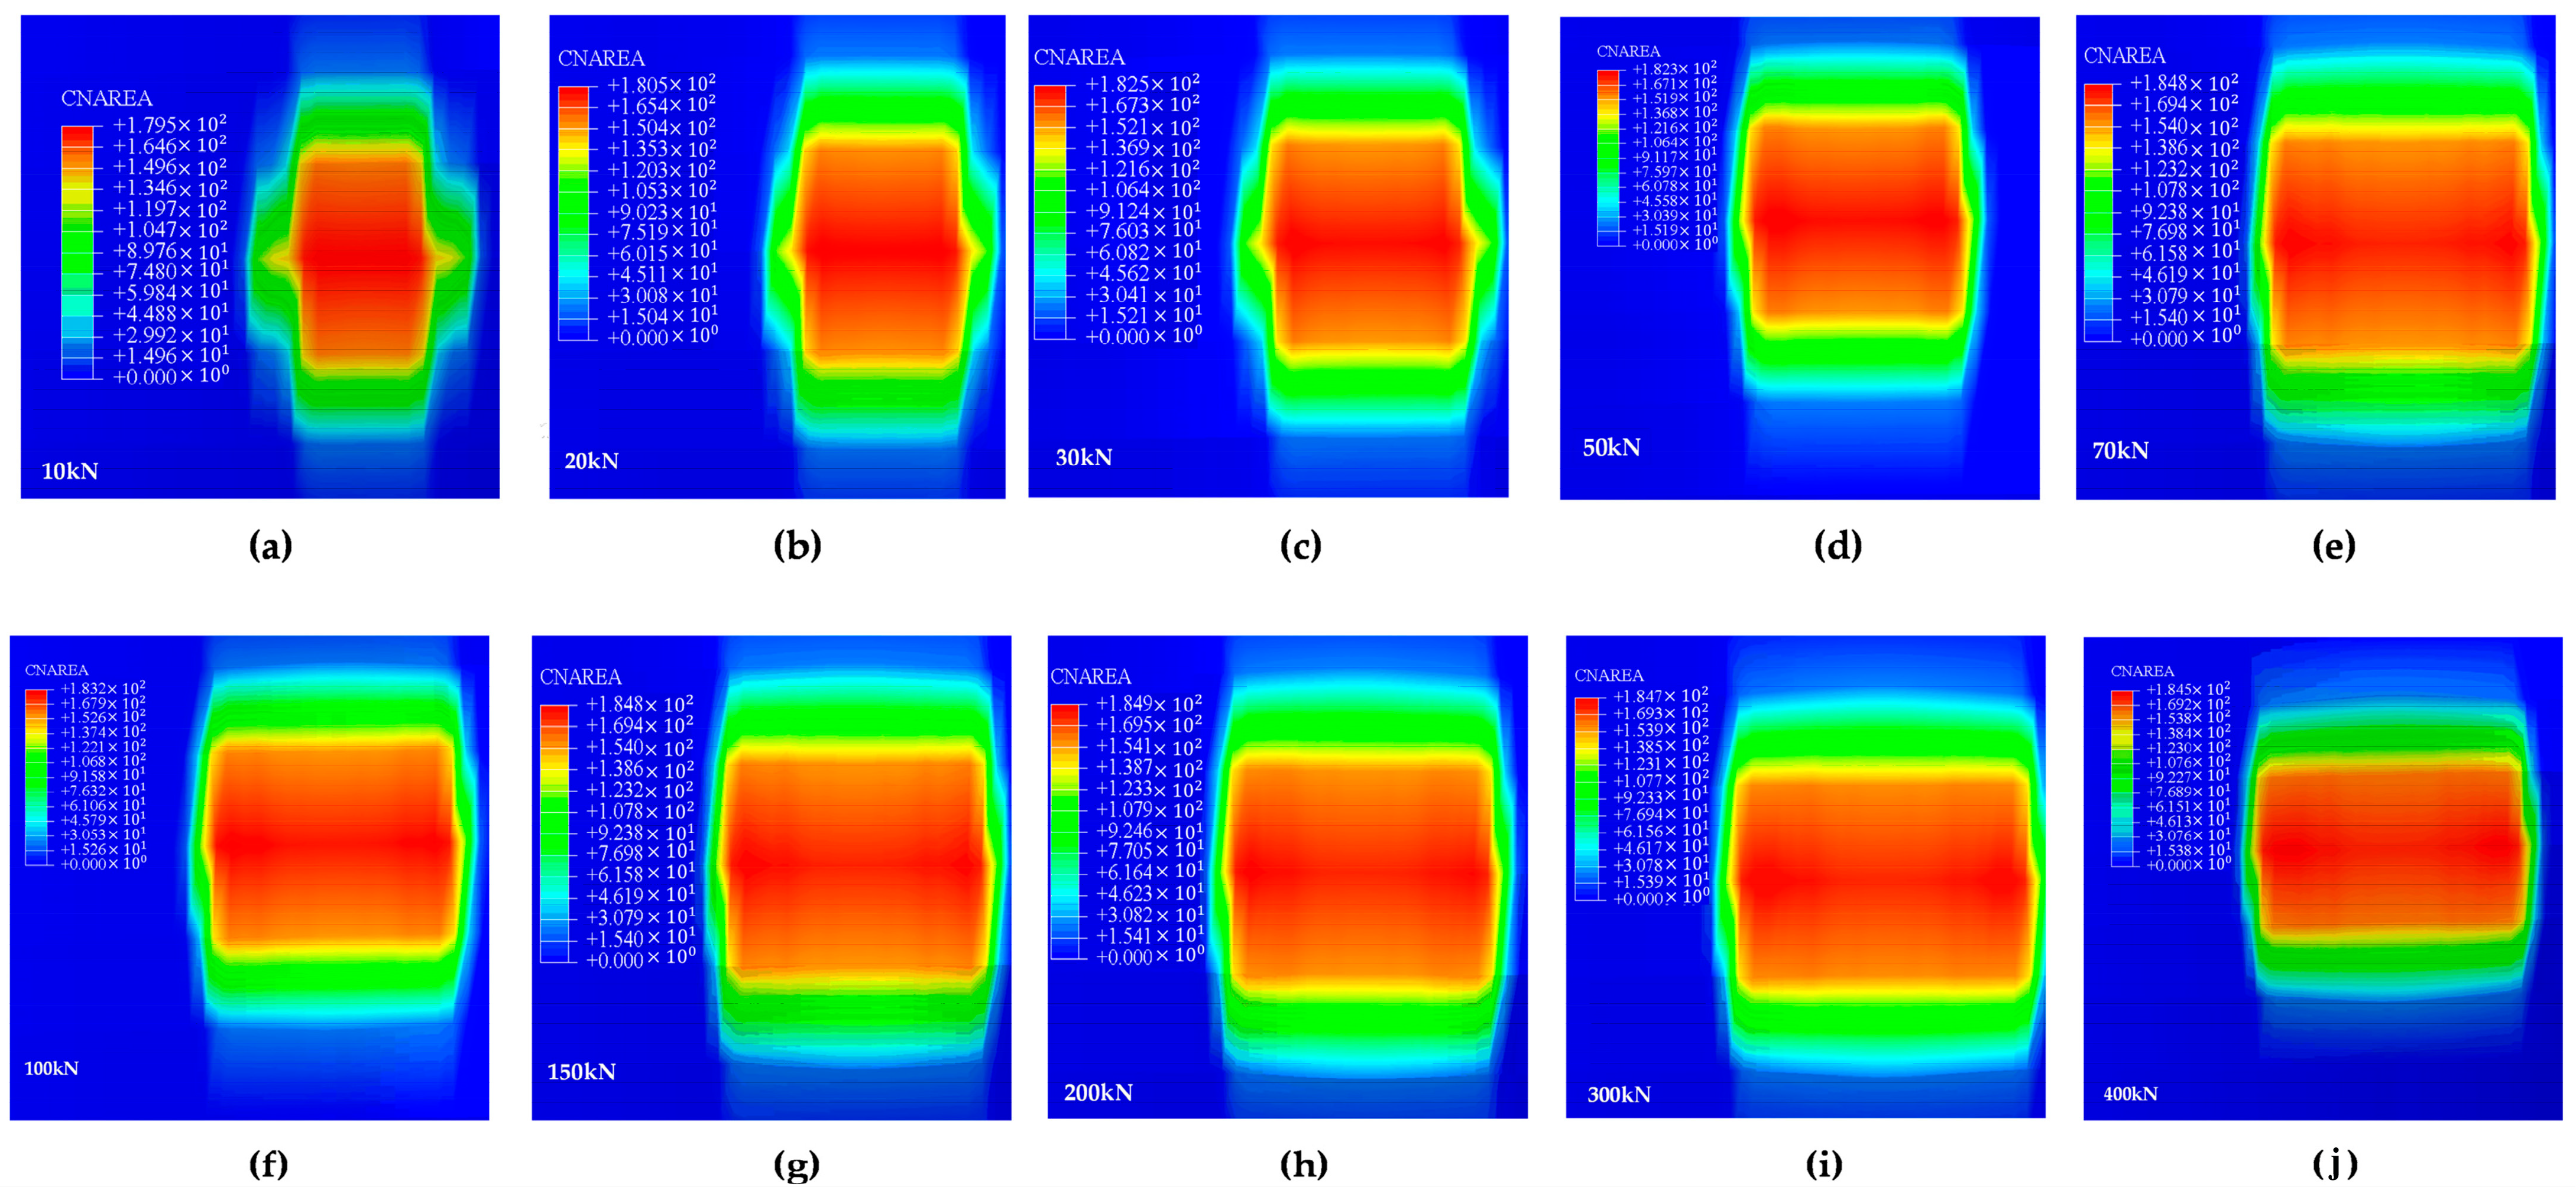
Figure 20 displays the effective contact area at rated 1.5 MPa inflation pressure across varying loads, revealing two distinct zones differentiated by stress levels—an inner region (orange-red) and outer region (light green). As pressure increases, the contact area transitions from irregular to regular rectangular geometry, with the inner high-stress zone maintaining consistent rectangularity throughout. During 10–70 kN loading, the outer low-stress region evolves from irregular to rectangular, while both zones exhibit rectangular profiles at 100–400 kN loads. The stress magnitude within the normal-direction effective contact area remains essentially constant across the 10–400 kN range, demonstrating uniform load distribution in the tire-ground interface. At specified 1.5 MPa inflation and 230.9 kN static load, the model exhibits a homogeneous rectangular contact area, confirming pressure distribution compliance with design requirements.

3.7. Deflection and Radial Stiffness Characteristics Analysis

The radial stiffness values corresponding to various inflation pressures were calculated using the specified formula and are presented in Table 13. Under the rated load of 37.5 kN, simulation results demonstrate that the tire’s radial stiffness initially increases with rising inflation pressure before decreasing, reaching its minimum value at 1.5 MPa before gradually recovering and stabilizing at higher pressures. Beyond 1.6 MPa, the stiffness remains essentially constant within the range of 22.9–23.0 kN/mm, exhibiting variation amplitudes below 0.5%. The selected operational pressure range of 1.6–1.8 MPa represents a stiffness-insensitive zone with merely 3.6% deviation from the 1.5 MPa minimum while providing significantly enhanced safety margins due to higher absolute stiffness values.

4. Conclusions

This study successfully developed a high-performance natural rubber composite reinforced with selenol-functionalized carbon nanotubes (Se-CNTs) and comprehensively evaluated its mechanical properties and application potential in aircraft tires through experimental characterization and finite element analysis. The main conclusions are summarized as follows:

4.1. Superiority of the Proposed Material and Mechanism Analysis

The Se-CNT/NR composite demonstrates comprehensive superiority over composites incorporating conventional fillers (e.g., carbon black) or unmodified CNTs. The most significant improvement lies in its remarkably balanced enhancement of stiffness (e.g., 28.2% increase in 300% modulus), strength (10.0% increase), and toughness (maintained elongation at break above 630%). This balance is often a challenge for nanocomposites, as strengthening typically comes at the expense of ductility. We attribute this superior performance to the unique selenol functionalization, which effectively mitigates the agglomeration issue common to nanofillers. The enhanced dispersion uniformity and stronger interfacial bonding, as confirmed by the mechanical data, ensure efficient stress transfer from the soft rubber matrix to the high-strength CNTs, thereby optimizing the reinforcement efficiency without compromising the material’s resilience.

4.2. Validation of a Robust Predictive Model

The second-order polynomial (N = 2) hyperelastic model was identified as the most accurate constitutive model for describing the material’s behavior. The close agreement between the FE simulations and experimental results, especially the accurate prediction of failure locations, validates the reliability of our established numerical model. This model is not merely a fitting tool but serves as a robust predictive framework. It provides a valuable foundation for future virtual design and performance optimization of aircraft tires using this novel composite, reducing the reliance on costly and time-consuming trial-and-error experimental approaches.

4.3. Performance Advantages in Application Scenarios

The implementation of the Se-CNT/NR composite in the tread and bead heel areas—identified as critical stress concentration zones—proves highly effective. The material’s enhanced properties directly address the extreme operational demands of aircraft tires, including high load, high impact, and stress concentration. The stability of radial stiffness above 1.6 MPa inflation pressure is a crucial finding for operational safety. It suggests that the tire can maintain consistent performance even with minor pressure fluctuations, enhancing reliability during real-world operations. The constant unit contact stress under increasing load and the uniform, center-peaked contact pressure profile demonstrate the composite’s exceptional ability to distribute stress evenly. This translates into reduced wear, lower rolling resistance, and potentially longer service life.

4.4. Limitations and Competitive Analysis

While this study highlights the great potential of Se-CNTs, we acknowledge that the cost of functionalization and the scalability of the production process are current limitations compared to established fillers like carbon black. Future work will focus on optimizing the functionalization process for cost-effectiveness and exploring large-scale production techniques. Nevertheless, for high-value, safety-critical applications such as aerospace and premium automotive tires, where performance outweighs cost, the Se-CNT/NR composite presents a compelling competitive advantage over other nano-reinforcements due to its superior dispersion and balanced property enhancement.

4.5. Prospective Applications

Beyond aircraft tires, the proposed Se-CNT/NR composite is an ideal candidate for a wide range of high-performance elastomeric applications where durability and reliability are paramount. These include but are not limited to: heavy-duty vehicle tires, anti-vibration systems for precision machinery, high-pressure seals and hoses, and other industrial products operating under extreme conditions.

Author Contributions

Conceptualization, M.X. and T.D.; methodology, T.D. and J.S.; software, T.D. and C.H.; validation, T.D.; formal analysis, C.X. and T.D.; investigation, Z.W.; resources, M.X.; datacuration, C.X.; writing-original draft preparation, T.D.; writing-review and editing, M.X.; visualization, M.X.; supervision. M.X.; project administration, M.X.; funding acquisition, M.X. All authors have read and agreed to the published version of the manuscript.

Funding

This research was funded by Liaoning Provincial Department of Education General Project (grant number JYTMS20230283) and Jiangsu Province Industry-University Research Collaborative Project (grant number FZ20241983).

Conflicts of Interest

The authors declare that they have no known competing financial interests or personal relationships that could have appeared to influence the work reported in this paper. Jinwei Shi is an employee of Suqian Green Gold Giant Rubber Plastic & Machinery Co., Ltd., which provided funding and technical support for the work. The funder had no role in the study design; data collection, analysis, or interpretation; manuscript writing; or decision to publish the results.

References

  1. Rohacs, J.; Kale, U.; Rohacs, D. Radically new solutions for reducing the energy use by future aircraft and their operations. Energy 2022, 239, 122420. [Google Scholar] [CrossRef]
  2. Le Clainche, S.; Ferrer, E.; Gibson, S.; Cross, E.; Parente, A.; Vinuesa, R. Improving aircraft performance using machine learning: A review. Aerosp. Sci. Technol. 2023, 138, 108354. [Google Scholar] [CrossRef]
  3. Qu, J.; Wang, R.; Huang, F.; Huang, H.; Ren, R.; Wang, Y.; Ding, Y.; Wang, Y. Wear particle matter emission of rubber reinforced by graphene and carbon nanotube hybrid fillers against a rolling-contact concrete surface. Wear 2024, 544–545, 205318. [Google Scholar] [CrossRef]
  4. Lian, C.; Yi, Y.; Wang, P.; Zhao, S.; Zhou, C.; Zhang, T.; Xue, Z.; Zhang, K.; Yue, Z. Experimental and numerical research of aircraft tire debris impact on landing gear brake pipe. Aerosp. Sci. Technol. 2024, 155, 109546. [Google Scholar] [CrossRef]
  5. Chen, D.; Wu, J.; Wang, Y.; Su, B.; Liu, Y. High-speed tribology behaviors of aircraft tire tread rubber in contact with pavement. Wear 2021, 486–487, 204071. [Google Scholar] [CrossRef]
  6. Wu, J.; Chen, L.; Wang, Y.; Su, B.; Cui, Z.; Wang, D. Effect of temperature on wear performance of aircraft tire tread rubber. Polym. Test. 2019, 79, 106037. [Google Scholar] [CrossRef]
  7. Alroqi, A.A.; Wang, W.; Zhao, Y. Aircraft Tire Temperature at Touchdown with Wheel Prerotation. J. Aircr. 2017, 54, 926–938. [Google Scholar] [CrossRef]
  8. Ma, Z.; Lu, H.; Liu, C.; Rui, X. Study on the camber angle of an aircraft radial tire: Stress, contact, damage, and modal behaviors. Int. J. Non-Linear Mech. 2025, 175, 105118. [Google Scholar] [CrossRef]
  9. Teng, F.; Wu, J.; Su, B.; Wang, Y. A cross-scale analysis of the high sliding friction mechanism of the tread rubber under severe working conditions. Wear 2025, 578–579, 206144. [Google Scholar] [CrossRef]
  10. Lei, K.; Wu, J.; Ren, Z.; Deng, W.; Wang, C. Static Mechanical Characteristics Analysis of Aircraft Tire Under Extreme Weather Conditions. Int. J. Aeronaut. Space Sci. 2024, 25, 979–989. [Google Scholar] [CrossRef]
  11. Ge, C.; Liu, P.; Qu, Q.; Hu, T.; Zhang, J. Effect of aircraft tire wear on water spray and water displacement drag. Aerosp. Sci. Technol. 2024, 147, 109006. [Google Scholar] [CrossRef]
  12. Shen, Z.; Wang, Q.; Li, P.; Li, X.; Li, F. Heat build-up and thermo-mechanical fatigue life optimization of aircraft tire using deformation index concept. Int. J. Fatigue 2025, 193, 108815. [Google Scholar] [CrossRef]
  13. Sattayanurak, S.; Sahakaro, K.; Kaewsakul, W.; Dierkes, W.K.; Reuvekamp, L.A.E.M.; Blume, A.; Noordermeer, J.W.M. Synergistic effect by high specific surface area carbon black as secondary filler in silica reinforced natural rubber tire tread compounds. Polym. Test. 2020, 81, 106173. [Google Scholar] [CrossRef]
  14. Manikkavel, A.; Kumar, V.; Park, S.-S. MWCNT-reinforced silicone’s dual response to human and mechanical motion: Exploring strain sensing behavior and practical applications. Colloids Surf. A Physicochem. Eng. Asp. 2024, 688, 133536. [Google Scholar] [CrossRef]
  15. Gao, X.; Yang, J.; Shao, J.; Zhu, H.; Xu, J.; Haruna, S.I. Regulation of carbon nanotubes on internal humidity of concrete with recycled tire rubber: Mechanism analysis and modeling. J. Build. Eng. 2024, 82, 108253. [Google Scholar] [CrossRef]
  16. Wang, M.; Li, Y.; Qian, C.; Wang, S.; Liu, D. Relationship between the aging thermal oxygen and mechanical properties of nitrile butadiene rubber reinforced by RD-loaded carboxylated carbon nanotubes. Appl. Surf. Sci. 2024, 655, 159569. [Google Scholar] [CrossRef]
  17. Sari, H.C.; Mubarok, F.A.; Firdaus, M.; Zulfa, I.L.; Fauzi, A.; Rajaelo, W.O.N.F.; Sulistyowati, A.; Ivansyah, A.L.; Muttaqien, F. Computational molecular design to assist modification of single—Walled carbon nanotubes with B, N, Al, Si, P, and S dopant atoms for Cl2 gas sensor application. Surf. Sci. 2023, 731, 122264. [Google Scholar] [CrossRef]
  18. He, Z.; Xu, J.; Huang, J.; Song, Y.; Li, H.; Man, J.; Liu, T.; Guo, D. Study on the lateral constitutive model for aged laminated rubber bearings considering frictional sliding. Eng. Struct. 2025, 340, 120724. [Google Scholar] [CrossRef]
  19. Qian, C.; Wang, S.; Li, Y.; Nie, R.; Song, S. Comparative study on thermal-oxygen aging and tribological properties of carbon nanotubes and graphene sheet reinforced hydrogenated nitrile rubber composite materials. J. Mater. Res. Technol. 2024, 29, 2608–2619. [Google Scholar] [CrossRef]
  20. Lawal, S.A.; Medupin, R.O.; Yoro, K.O.; Ukoba, K.O.; Okoro, U.G.; Adedipe, O.; Abutu, J.; Tijani, J.O.; Abdulkareem, A.S.; Ndaliman, M.B.; et al. Nano-titania and carbon nanotube-filled rubber seed oil as machining fluids. Mater. Chem. Phys. 2024, 316, 129126. [Google Scholar] [CrossRef]
  21. Yang, C.; Li, W.; Li, Q.; Ma, K.; Zhang, L.; Zhu, M.; Lu, S. Use of non-covalently modified SWCNTs for enhancing the properties of BMI composites with a low loading. Diam. Relat. Mater. 2023, 137, 110089. [Google Scholar] [CrossRef]
  22. Strozzi, M.; Elishakoff, I.E.; Manevitch, L.I.; Gendelman, O.V. Applicability and limitations of Donnell shell theory for vibration modelling of double-walled carbon nanotubes. Thin Walled Struct. 2022, 178, 109532. [Google Scholar] [CrossRef]
  23. Ghavanloo, E.; Fazelzadeh, S.A. Vibration characteristics of single-walled carbon nanotubes based on an anisotropic elastic shell model including chirality effect. Appl. Math. Model. 2012, 36, 4988–5000. [Google Scholar] [CrossRef]
  24. Guo, H.; Bastien, C.; Blundell, M.; Wood, G. Development of a detailed aircraft tyre finite element model for safety assessment. Mater. Des. 2014, 53, 902–909. [Google Scholar] [CrossRef]
  25. Behroozi, M.; Olatunbosun, O.A.; Ding, W. Finite element analysis of aircraft tyre—Effect of model complexity on tyre performance characteristics. Mater. Des. 2012, 35, 810–819. [Google Scholar] [CrossRef]
  26. Jiang, B.; Wang, H. An integrated analytical model for friction characteristics of aircraft tire on wet runway pavement. Tribol. Int. 2023, 185, 108501. [Google Scholar] [CrossRef]
  27. Wood, G.; Blundell, M.; Sharma, S. A low parameter tyre model for aircraft ground dynamic simulation. Mater. Des. 2012, 35, 820–832. [Google Scholar] [CrossRef]
  28. Jin, J.X. Finite Element Modeling and Static Performance Analysis of Aircraft Tire. Master’s Thesis, Jilin University, Changchun, China, 2022. [Google Scholar]
  29. Yang, P.; Lei, P.; Liu, B.; Gao, H. Construction of Isotropic Compressible Hyperelastic Constitutive Models Based Solely on Uniaxial Tests. J. Mech. Phys. Solid 2025, 200, 106150. [Google Scholar] [CrossRef]
  30. Zhang, Q.; Liu, L.; Zhang, L.; Li, F. How to effectively perform equibiaxial tension for rubber materials? Polymer 2025, 324, 128256. [Google Scholar] [CrossRef]
  31. Thorat, R.V.; Anas, M.; Nayek, R.; Chatterjee, S. System identification and reliability assessment of hyperelastic materials via an efficient sparsity-promoting variational Bayesian approach. Probabilistic Eng. Mech. 2025, 80, 103763. [Google Scholar] [CrossRef]
  32. Liu, H.-Y.; Qiu, L.-C. Three dimensional large deformation and fracture simulation of soft materials using non-ordinary state-based peridynamics with Mooney–Rivlin model. Constr. Build. Mater. 2025, 490, 142574. [Google Scholar] [CrossRef]
  33. Jing, C.; Jing, W.; Huang, Y.; Qi, L.; Fan, Y. Analysis of interaction between aircraft tire and slush-contaminated pavement. Cold Reg. Sci. Technol. 2025, 240, 104607. [Google Scholar] [CrossRef]
  34. Hu, Y.; Sun, B.; Wang, X.; Tan, Q.; He, Q.; Wang, J. Simulation Analysis for Mechanical Properties of Radial Aircraft Tires Under Static Load Conditions. J. Nav. Aviat. Univ. 2025, 40, 1–9. [Google Scholar]
  35. Han, D.; Zhu, G.; Hu, H.; Li, L. Dynamic simulation analysis of the tire-pavement system considering temperature fields. Constr. Build. Mater. 2018, 171, 261–272. [Google Scholar] [CrossRef]
  36. Park, S.; Yoo, W.; Cho, J.; Kang, B. Pressure-sensing pad test and computer simulation for the pressure distribution on the contact patch of a tyre. Proc. Inst. Mech. Eng. Part D J. Automob. Eng. 2007, 221, 25–31. [Google Scholar] [CrossRef]
  37. George, S.; Brady, H.R.C.; Vaccari, J.A. Materials Handbook: A Concise Desktop Reference; Springer: New York, NY, USA, 2002. [Google Scholar]
  38. GB/T 9746-2013; Series of Aircraft Tyres. General Administration of Quality Supervision, Inspection and Quarantine. Standards Press of China: Beijing, China, 2013.
Figure 1. Selenol-functionalized carbon nanotube (SC-CNT) samples. (a) natural rubber sample incorporated with selenol-functionalized carbon nanotubes; (b) scanning electron microscopy (SEM) image of the sample at 1000× magnification; (c) the high-magnification SEM micrograph at 50,000×.
Applsci 15 10053 g001
Figure 2. Pristine carbon nanotube (CNT) samples. (a) natural rubber sample incorporated with Pristine carbon nanotube; (b) scanning electron microscopy (SEM) image of the sample at 1000× magnification; (c) high-magnification SEM micrograph at 50,000×.
Applsci 15 10053 g002
Figure 3. Actual conditions of tensile testing. (a) the state of the test specimen before stretching; (b) its condition after stretching.
Applsci 15 10053 g003
Figure 4. The meshed model of the dumbbell-shaped rubber specimen. In the table, superscript A denotes the width dimension of the narrow section (i.e., the parallel portion) of the dumbbell-shaped specimen in the mold. Superscript B represents the overall width dimension of the mold, which includes both the wider ends and the narrow section of the dumbbell specimen.
Applsci 15 10053 g004
Figure 5. 2D Inflation simulation model of aircraft tire.
Applsci 15 10053 g005
Figure 6. Inflation simulation of a 2D tire at 1.5 MPa internal pressure. (a) stress distribution; (b) strain distribution.
Applsci 15 10053 g006
Figure 7. Inflation simulation of a 2D tire at 2 MPa internal pressure. (a) stress distribution; (b) strain distribution.
Applsci 15 10053 g007
Figure 8. Inflation simulation of a 2D tire at 2.5 MPa internal pressure. (a) stress distribution; (b) strain distribution.
Applsci 15 10053 g008
Figure 9. 3D partial and complete tire model using Abaqus 2024. (ah) the individual components of the tire model; (i) 3D complete tire model.
Applsci 15 10053 g009
Figure 10. Load-Deflection Behavior Across Inflation Pressures. (a) tire load-deflection behavior under inflation pressures of 0.7 MPa, 0.8 MPa, 0.96 MPa, and 1.5 MPa; (b) tire load-deflection behavior under inflation pressures of 1.6 MPa, 1.7 MPa, 1.8 MPa, and 2.0 MPa.
Applsci 15 10053 g010
Figure 11. The fitting results between the experimental data and the polynomial constitutive model (N = 2).
Applsci 15 10053 g011
Figure 12. The fitting results between the experimental data and the polynomial constitutive model (N = 2).
Applsci 15 10053 g012
Figure 13. The fitting results between the experimental data and the polynomial constitutive model (N = 2).
Applsci 15 10053 g013
Figure 14. Simulated tensile test. (a) selenol-functionalized carbon nanotube (SC-CNT) composite; (b) pristine carbon nanotube (CNT) composite; (c) neat polymer matrix without CNTs.
Applsci 15 10053 g014
Figure 15. Experimental stress–strain curves of the three sample types.
Applsci 15 10053 g015
Figure 16. Post-Inflation width and diameter under varied pressure conditions.
Applsci 15 10053 g016
Figure 17. Simulated stress distribution in reinforcement cords. (a) stress contour distribution of tire cords under 1.5 MPa inflation pressure; (b) stress contour distribution of tire cords under 1.7 MPa inflation pressure; (c) stress contour distribution of tire cords under 2.0 MPa inflation pressure; (d) stress contour distribution of tire cords under 2.5 MPa inflation pressure.
Applsci 15 10053 g017
Figure 18. Stress distribution analysis.
Applsci 15 10053 g018
Figure 19. Contact pressure distribution at rated 1.5 MPa inflation pressure under varied loading conditions. (aj) contact pressure contours and their corresponding pressure value distributions under varying loading conditions.
Applsci 15 10053 g019
Figure 20. Effective contact area under varied loading conditions. (aj) the evolution of the normal effective contact area for aircraft tires under progressively increasing vertical loads (10 kN to 400 kN).
Applsci 15 10053 g020
Table 1. The formulation is presented.
Raw MaterialsABC
NR100100100
ZnO555
SA222
Sulfur333
Accelerator CZ111
Carbon black505050
Carbon nanotubes00.060
Selenol-functionalized carbon nanotubes0.0600
Table 2. Nonlinear model parameters of rubber material.
Material DesignationsMooney–Rivlin Model Parameters
C10C01D1
Apex Filler−12.657817.52120.000
Sidewall Compound0.39320.27980.000
Table 3. Nonlinear model parameters of rubber material.
Material DesignationsYeoh Model Parameters
C10C20C30D1
Carcass583.8432671.68−5107.43.67 × 10−4
Belt601.2881928.0918,956.83.56 × 10−4
Table 4. Nonlinear model parameters of rubber material.
Material
Designations
Parameters for Polynomial Hyperelastic Model (N = 2)
C10C01C20C11C02D1D2
Tread−2.051063.38092−0.007145
34
0.1201320.4085460.0000.000
Bead Heel−2.051063.38092−0.007145
34
0.1201320.4085460.0000.000
Table 5. Cord arrangement parameters.
ComponentSingle-Cord Cross-Sectional Area (mm2)Cord Spacing (mm)Orientation
Angle (°)
Bead Reinforcement Cords 110.20
Bead Reinforcement Cords 210.20
Belt Reinforcement Cords 11.50.2−75
Belt Reinforcement Cords 21.50.275
Belt Reinforcement Cords 31.50.2−75
Belt Reinforcement Cords 41.50.275
Belt Reinforcement Cords 51.50.2−75
Belt Reinforcement Cords 61.50.275
Carcass Cords 11.50.290
Carcass Cords 21.50.290
Carcass Cords 31.50.290
Carcass Cords 41.50.290
Table 6. Parameters for linear elastic material model.
MaterialYoung’s Modulus (MPa)Poisson’s RatioDensity (g/cm3)
Reinforcement Cord90,0000.31.25
Bead Wire Bundle209,0000.37.8
Table 7. Aircraft tire inflation simulation data.
Maximum Expanded Dimensions (mm)/
Inflation Pressure (MPa)
Nominal
Diameter
Nominal WidthExpanded
Diameter
Expanded Width
1.512704551270.424458.047
1.712704551270.440458.326
1.912704551270.454458.725
2.112704551270.470458.986
2.312704551270.484459.269
2.512704551270.500459.550
Table 8. Comparative analysis of material physical properties.
Sample ID/Physical PropertiesABC
300% Modulus10.24 MPa7.99 MPa5.49 MPa
500% Modulus18.31 MPa15.63 MPa13.20 MPa
Tensile Strength23.22 MPa22.00 MPa21.10 MPa
Elongation at Break630%690%700%
Tear Strength58.73 kN/m50.32 kN/m70.35 kN/m
Poisson’s Ratio0.500.440.35
Young’s Modulus3.82 MPa3.32 MPa3.16 MPa
Shore Hardness74.870.975.00
Table 9. Derived fitting coefficients.
Material/
Coefficient
C10C01C20C11C02D1
A−2.0553.3809−0.0070.120130.408540.00
10,579151914,534,42522386221000
Table 12. Numerical simulation data and experimental data.
Material/
Property
Experimental Peak Stress (MPa)Experimental Elongation (mm)Simulated Peak Stress (MPa)Simulated
Elongation (mm)
A23.22207.9023.19207.90
B22.00227.7021.58227.70
C21.10231.0021.12231.00
Table 13. Radial stiffness versus inflation pressure.
Tire pressure (MPa)0.70.80.961.51.61.71.82.0
Radial stiffness (kN/mm)22.822.422.422.122.922.922.923.0
Table 10. Derived fitting coefficients.
Material/
Coefficient
C10C01C20C11C02D1
B−4.15666.249150.002259−0.00111.493155480.00
3236683189,50444,195,275000
Table 11. Derived fitting coefficients.
Material/
Coefficient
C10C01C20C11C02D1
C−1.23982.483−0.00730.14400.10380.00
278283,25787,508,92069,99631,821000
Disclaimer/Publisher’s Note: The statements, opinions and data contained in all publications are solely those of the individual author(s) and contributor(s) and not of MDPI and/or the editor(s). MDPI and/or the editor(s) disclaim responsibility for any injury to people or property resulting from any ideas, methods, instructions or products referred to in the content.