1. Introduction
Various species of natural wood have been used in finished outdoor products and exterior design, with or without the use of chemical, finishing, or thermal treatments to improve their resistance to external factors. It is known that under the influence of external factors, especially moisture, wood has two major disadvantages: dimensional instability due to changes in moisture content and biodegradability (or natural durability). Regarding the influence of the transmission medium, it is clear that in an inert environment, chemical modification of natural wood is slower. For example, the mass loss of beech wood after treatment in atmospheric air at 200 °C for 3 h is 6.9% [
1]; after vacuum treatment, it is 2.7% [
2].
In [
3], the authors analyzed and tested a hardwood species (
Querscus canariensis) and three pine species (
Pinus halepensis,
Pinus radiate,
Pinus pinaster). All analyzed wood species were tested under vacuum (200 mbar) at a temperature of 200 °C. It was found that the differences in thermal susceptibility were pronounced, with mass losses greater than 8%. Wood with finishes of considerable thicknesses made to withstand outdoor conditions is not environmentally friendly, is polluting and the finish is very laborious to apply; in addition, it exhibits wear or cracking under the prolonged action of environmental factors. Therefore, ecological heat treatment processes such as boiling wood in oils or heating wood in superheated steam at temperatures of 180–220 °C have been explored. The wood torrefaction process is also used to improve the dimensional stability and durability of wood [
1,
2,
3,
4,
5,
6], which involves hot air in a reduced oxygen environment.
Worldwide, wood species are classified in two large groups: softwood species (fir, spruce, pin, larch, Douglas fir) and hardwood species (sycamore, ash, acacia, poplar, cherry). Their main difference is the density of the wood, but they also differ in other areas. Consequently, researchers [
6,
7] have comparatively analyzed one softwood species and one hardwood species in tandem. The light color of spruce wood means that its use is preferred in applications where superior aesthetics are desired; its fine texture is also an important asset for the manufacture of furniture (beds, tables, chairs, cabinets) [
8,
9]. In addition to furniture manufacturing, spruce wood, due to its resonance, is suitable for producing musical instruments (e.g., soundboards for pianos, violins, guitars). This resonance contributes to the modulation of the sounds produced by the musical instruments into which it is incorporated through its sound transmission qualities.
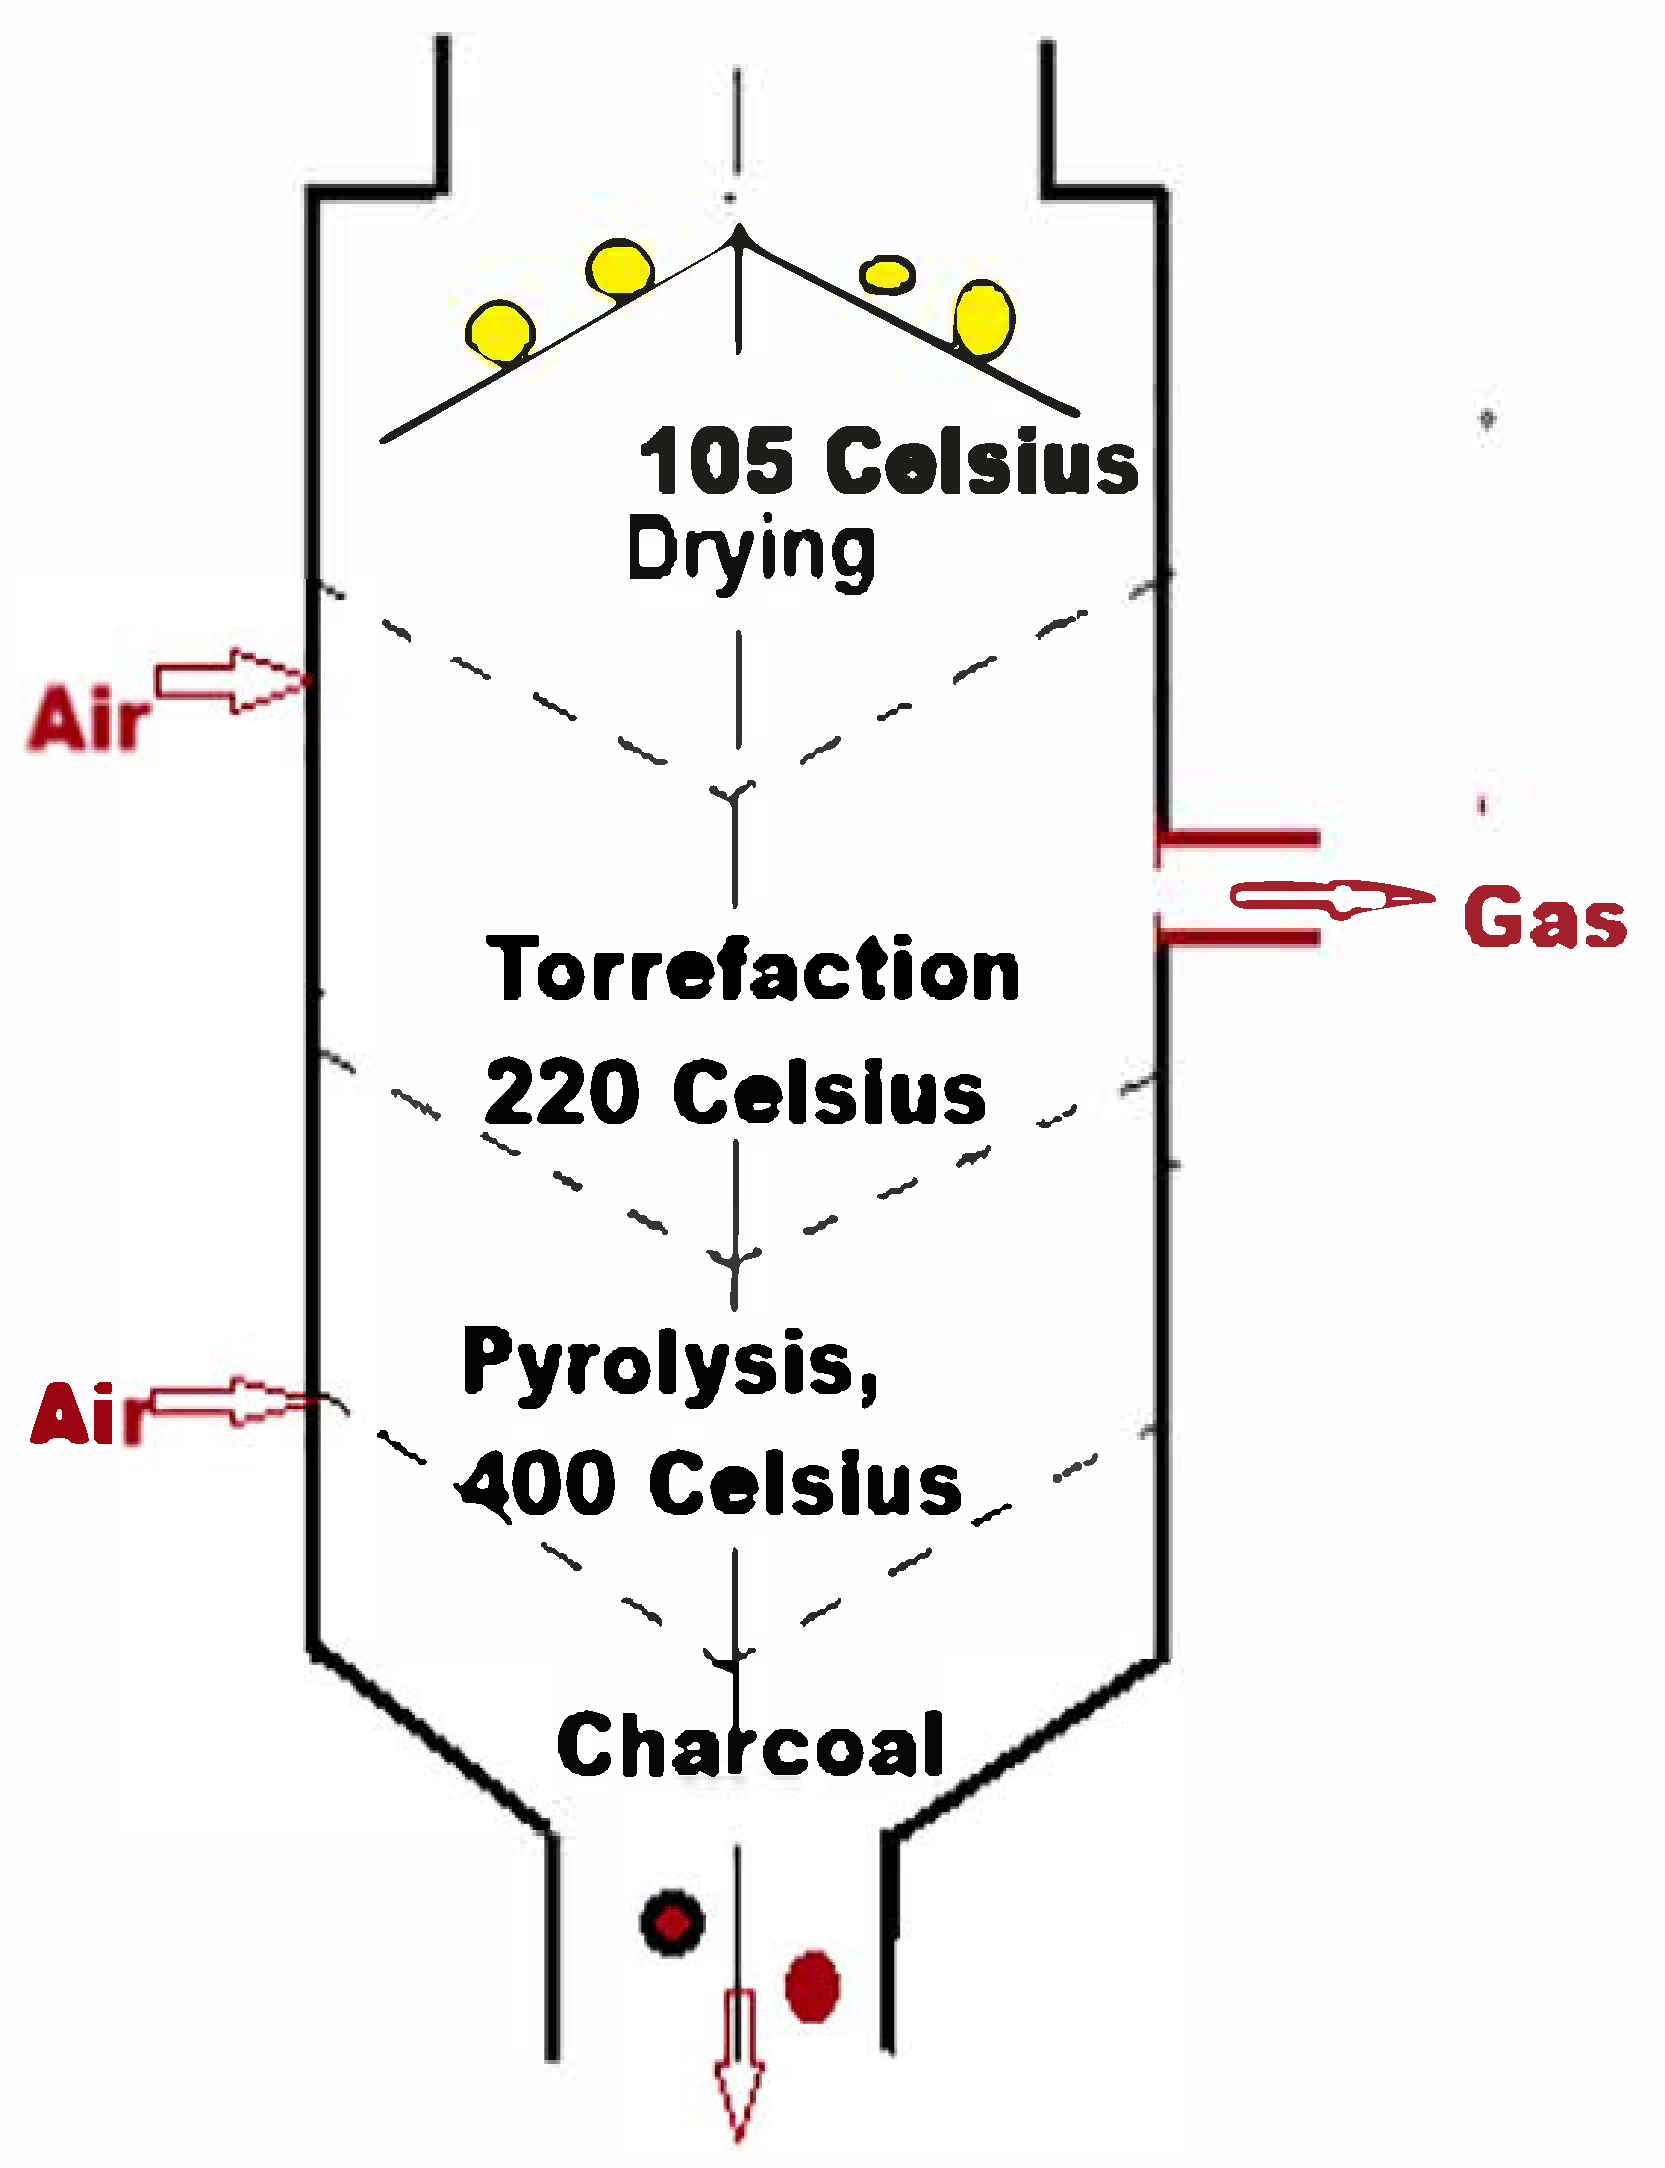
Figure 1 shows the stages of thermal wood treatment, starting naturally from wood drying, which usually is carried out at 70–90 °C but can also reach temperatures of 105 °C. In this first stage, only the water in the wood evaporates; the chemical compounds do not degrade at all. The next stage is that of wood torrefaction, usually at temperatures of 190–240 °C; in this range, the wood begins to thermally decompose. In this stage, mainly the hemicelluloses in the wood are degraded, obtaining wood with a low affinity for moisture and water in the external environment and a weaker bio-degradability. In addition, this treatment is only performed in the absence of oxygen or with a reduced supply of oxygen [
10,
11]. During the torrefaction process, the properties of the wood are modified due to the chemical reactions that take place in the structure of the wood at high temperatures, particularly the degradation of the hemicelluloses. This degradation leads, up to temperatures of 195 °C, to dimensional stability and a decrease in the avidity towards water and moisture, since hemicelluloses are the most moisture-loving component in wood [
10,
11].
In the second stage, above 200 °C, the wood is sterilized and acquires properties to better resist the action of external factors such as insects and xylophagous fungi. It has been demonstrated that the heat treatment temperature has a greater influence on the wood’s properties than the torrefaction time [
5,
6]. The torrefaction process has been studied for a long time, especially in the European Union, which has led to the intensification of the industrial development of this process in so-called torrefaction guns. The third and last stage of heat treatment is wood pyrolysis at temperatures of about 400 °C, which is also performed under a reduced oxygen supply. Charcoal is obtained as the main product of this heat treatment after a long treatment period (used in steelmaking to obtain high-quality steels). A light combustible gas with a normal content of carbon monoxide and hydrogen is also obtained when heat treatment is carried out over a short period of time. This gas can be transformed into a combustible liquid by refrigeration. Due to its fine texture and very light color, sycamore wood is used for the manufacture of furniture and musical instruments, and is also used for decorative applications. It is used in the bodies and tops of furniture items due to its rigidity, contributing to maintaining stability. Due to its high density, sycamore wood is also used for floors, steps and furniture tops. Sycamore wood is very easily processed, and due to its smooth processed surfaces, thin and aesthetically pleasing paint and varnish films can be created [
10,
11], resulting in high-quality finishes. This wood, due to its good machinability properties, is also used to create decorative details in furniture (inlays and fine sculptures).
Dimensional changes occur due to contraction and expansion in water below the fiber saturation point, and biological degradation results from fungi damage. Wood materials used in fields such as construction and household products are generally susceptible to fungal decay (under conditions of 27% to 60% moisture content and a temperature of 3 to 38 °C) [
12,
13]. Heat treatment is a physical process that results in permanent changes in the chemical composition of cell wood compounds. The application temperature for heat treatment ranges between 160 and 240 °C.
The main objective of the paper is to observe the effects of the thermal torrefaction process on the density, dimensional stability and strength of spruce and sycamore wood. Two wood species grown in Southeastern Europe were chosen due to the significant differences between them. They belong to different species groups, namely softwood and hardwood, but also exhibit similarities regarding their light color.
2. Materials and Methods
The main physical (moisture content, density, water absorption and swelling in the radial/tangential direction) and mechanical (static bending strength, compressive strength, tensile strength parallel to the fibers) properties of the two types of heat-treated/untreated wood species were determined. To cut the samples, several clean, knot-free boards were chosen, which were planed to a thickness of 20 mm and cut into samples with the dimensions specific to each test [
14,
15]. The samples were from the same natural wood.
Density. Before determining the density, the samples were kept in a conditioning chamber with a 65% air moisture content and a 20 °C air temperature to obtain a sample moisture content of 12%, corresponding to their test value. The samples for which their density was determined had dimensions of 100 × 20 × 20 mm [
16]. The procedure consisted of determining the mass of each conditioned sample with a Kern-type analytical balance, as well as their dimensions using an electronic caliper with an accuracy of one decimal place.
Considering the rectangular shape of the samples, the determination ratio was calculated as follows:
where m—mass of the sample in g; l—length of the sample in mm; b—width of the sample in mm; g—thickness of the sample in mm.
The wood torrefaction stage of heat treatment was carried out in a laboratory oven at temperatures of 160, 180 and 200 °C for 1, 2 and 3 h. To determine the degree of torrefaction, the mass loss of the samples was determined using the ratio of the following form:
where m
i—initial mass of the samples in g; m
f—final mass of the samples after torrefaction in g.
A total of 1710 valid samples were subjected to this test for each wood species and for each temperature and duration of heat treatment.
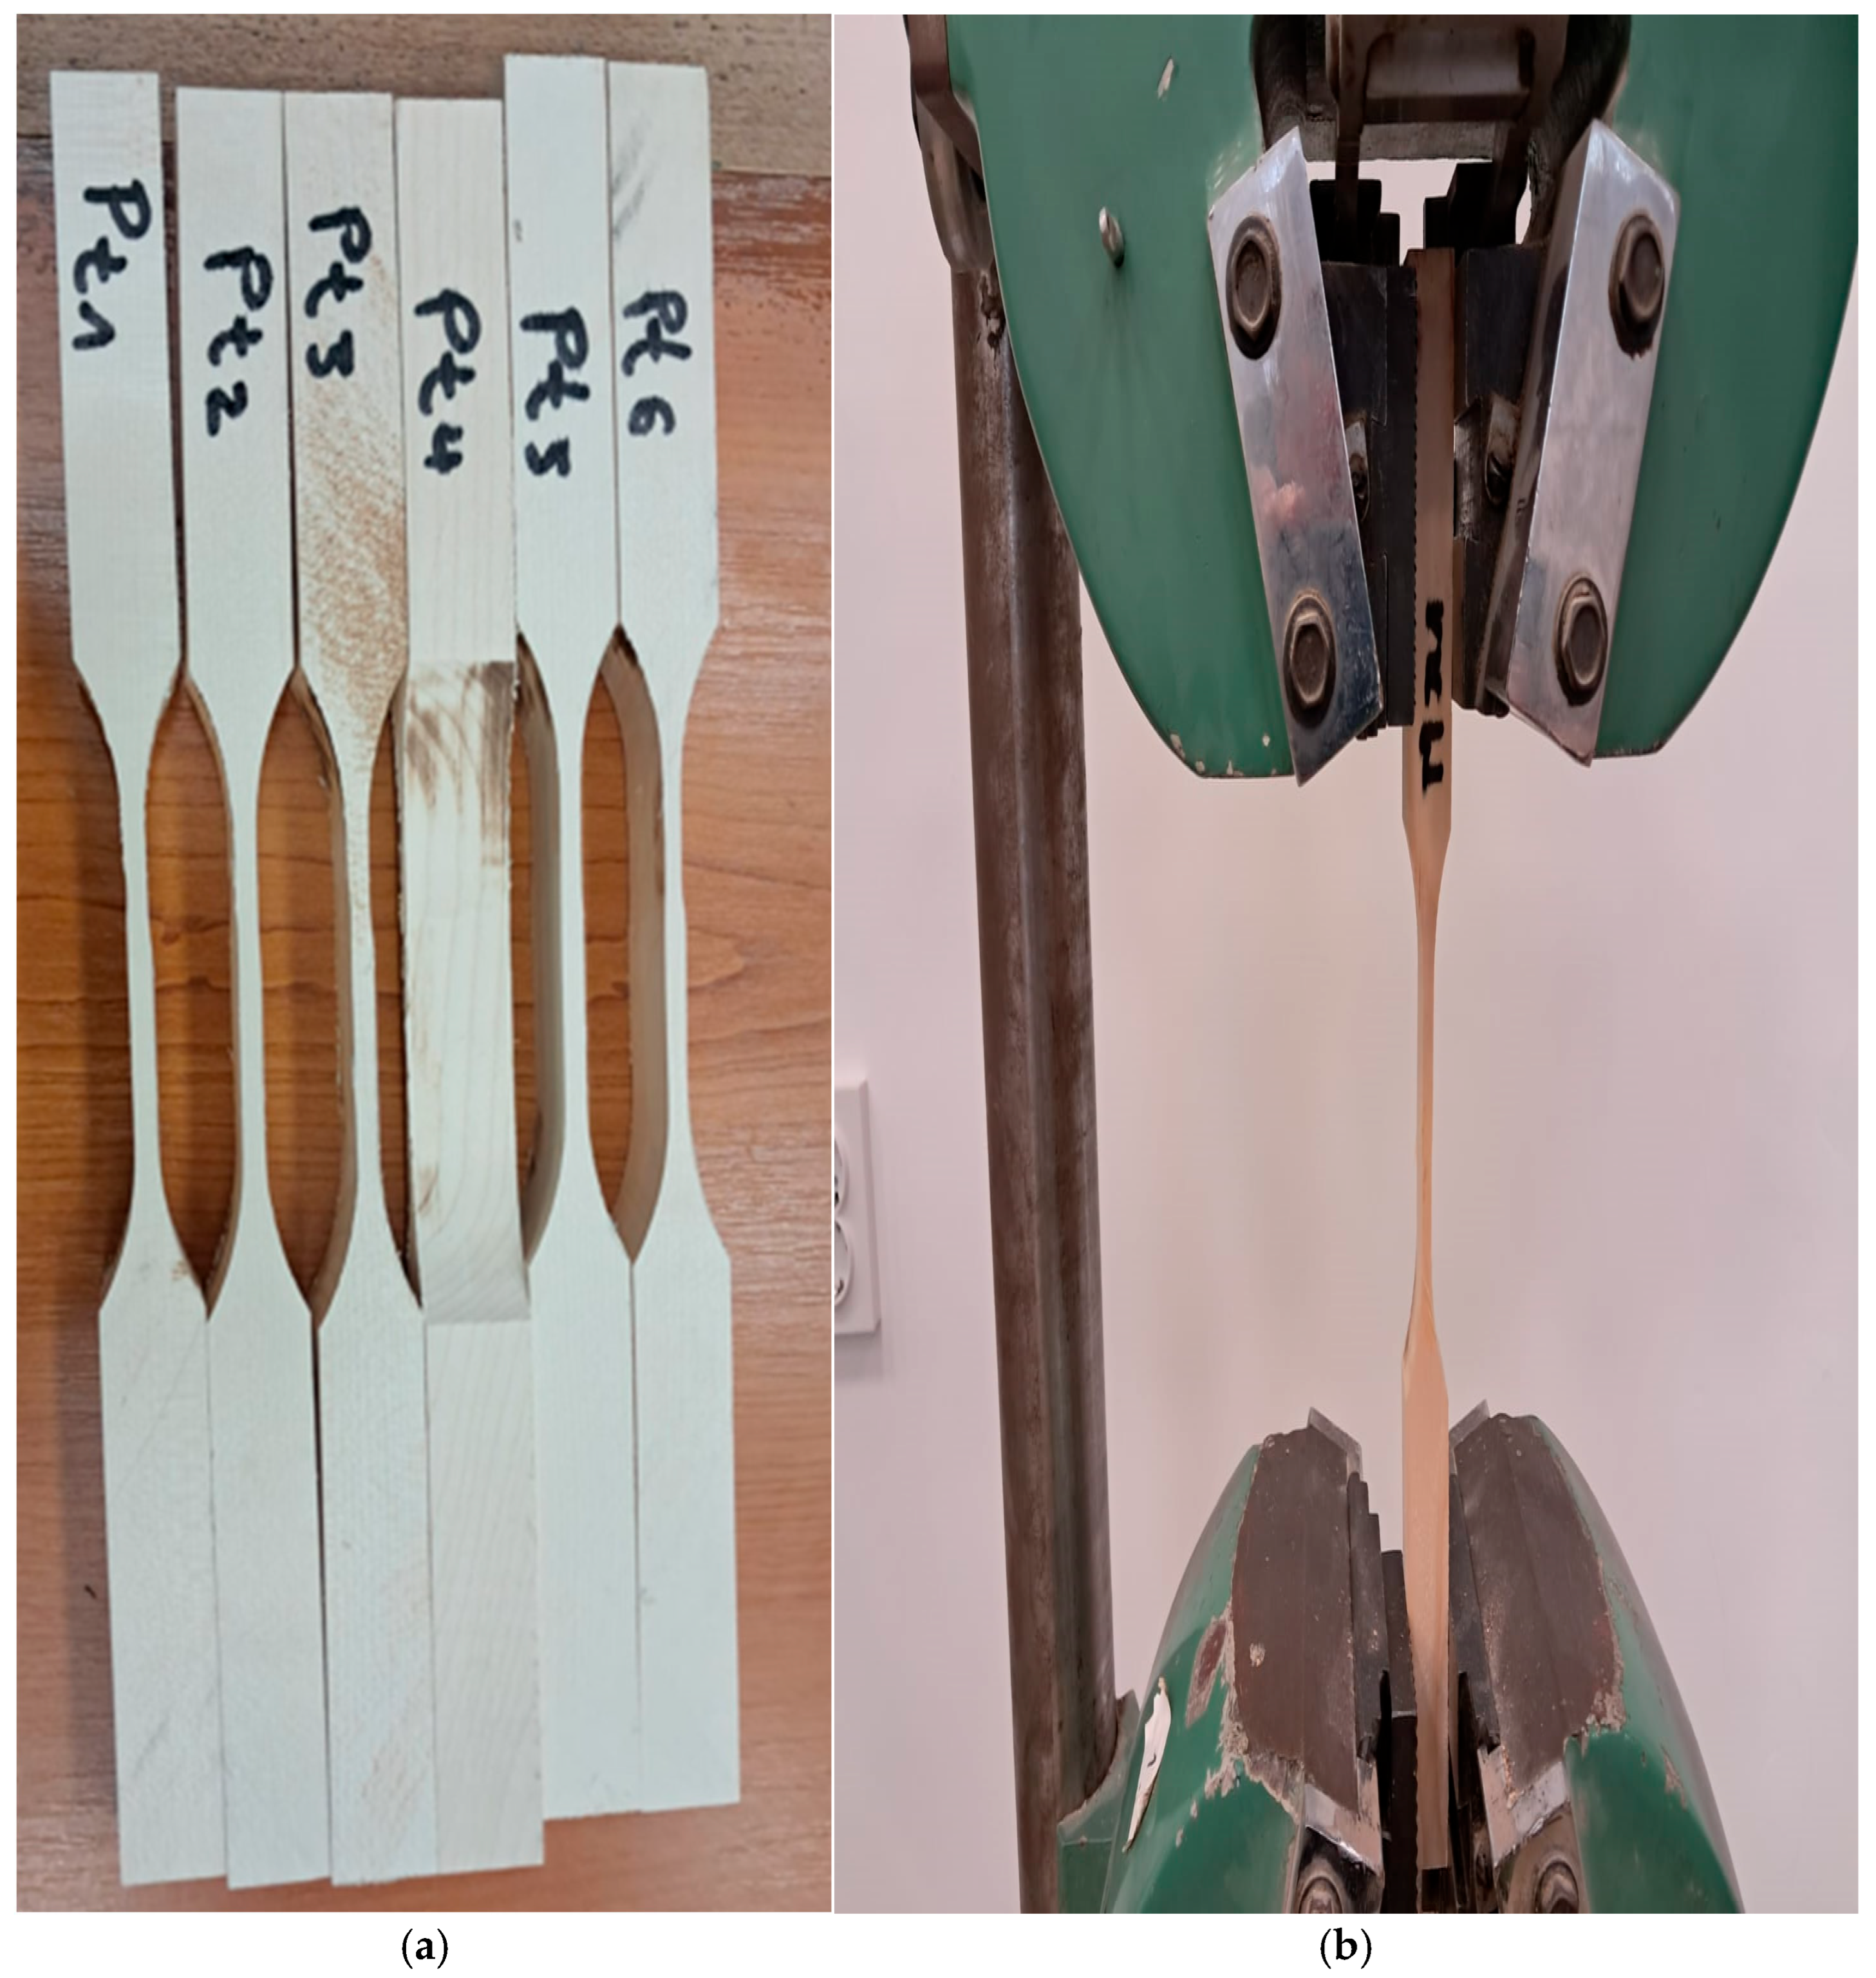
The tensile strength parallel to the fibers was determined on samples with dimensions of 300 × 20 × 20 mm with a milling in the central area, as in
Figure 2, to break the thinned central area exclusively.
Before determining the tensile test parallel to the fibers, the widths of the samples were measured in the central area. The tensile strength parallel to the wood fibers was determined as the ratio between the breaking force and the breaking area [
17]:
where F
max—maximum breaking force in N; b
1—width of the sample in the narrowed area in mm; b—width of the sample in mm.
Water absorption tests of the wood from the two species were carried out on dry samples with dimensions of 100 × 20 × 20 mm, and the mass of the samples was determined using an electronic scale with a precision of one decimal place.
Samples were immersed for 2 and 24 h to observe the dynamics of water absorption. The mass of the samples was determined before and after immersion in water. Considering the duration of immersion in water, the ratios for determining the water absorption after immersion were as follows:
where A
2h—absorption for 2 h; m
f2h—mass of the samples after immersion for 2 h;
mi2h—mass of the samples before immersion for 2 h; A
24h—absorption for 24 h; m
f2h—mass of the samples after immersion for 24 h; m
f24h—mass of the samples before immersion for 24 h.
The increase in thickness of samples of the two wood species was measured after immersion for 2 and 24 h in the radial and tangential directions for the same type of samples as used in the water absorption tests by means of the following calculation ratios [
18]:
Ten samples of each type were used, including the torrefied and non-torrefied samples.
The compressive strength of conditioned specimens with dimensions of 100 × 20 × 20 mm was determined. Compression parallel to the fibers was chosen because this determination is simpler and the value is easily quantifiable and can be compared to those of other wood species [
19]. This resistance represents the ratio between the force and the breaking area of the specimens, with the calculation ratio taking the following form:
where ϭ
c—compressive strength; F
r—force; b
1—width [mm]; b
2—thickness [mm].
The Brinell hardness was determined on the same specimens used in wood density tests, and the radial/tangential surface and the type of specimen (torrefied/non-torrefied) on which the determination was made were specified [
20]. Two determinations were carried out on each surface for a total of 10 specimens. The ratio was dependent on the diameter of the mark left by a punch with a ball diameter of 10 mm on the wooden surface, considering that the lateral surface of the mark left on the wooden specimen is similar to a spherical cap:
where P—pressing force of the punch in N (taking into account the densities of the two wood species; a force of 500 N was used); D—diameter of the ball at the tip of the punch in mm (equal to 10 mm); D—diameter of the ball at the tip of the punch in mm (equal to 10 mm); d—diameter of the mark left by the ball on the specimen in mm (to highlight this, a copy paper was used).
Determination of static bending resistance. Static bending resistance tests were performed on parallelepiped specimens featuring a square section with sides of 20 mm [
21]. The distance between the supports was considered to be 240 mm. The bending method with a single punch was used to apply a force in the radial direction of the wooden specimen. The ratio was calculated considering the distance between the supports and the dimensions of the specimen:
where: F
max—maximum breaking force of the specimen in N; l—distance between the supports, in mm; b—width of the specimen in mm; g—thickness of the specimen in mm.
Statistical analysis of the results. To evaluate the research results, statistical parameters such as the arithmetic mean (survey median) and the standard deviation with an error of 0.05 were first determined [
21]. The standard deviation of the values can also be observed on results graphs. Following, the coefficient of determination R
2 was determined to analyze the distribution of the values and to find the best approximation ratio of the trend in values.
3. Results
The results obtained were collected in tables; after this, they were presented in the form of graphs for visibility and to facilitate comparison between different species and treatments.
3.1. Wood Density Results
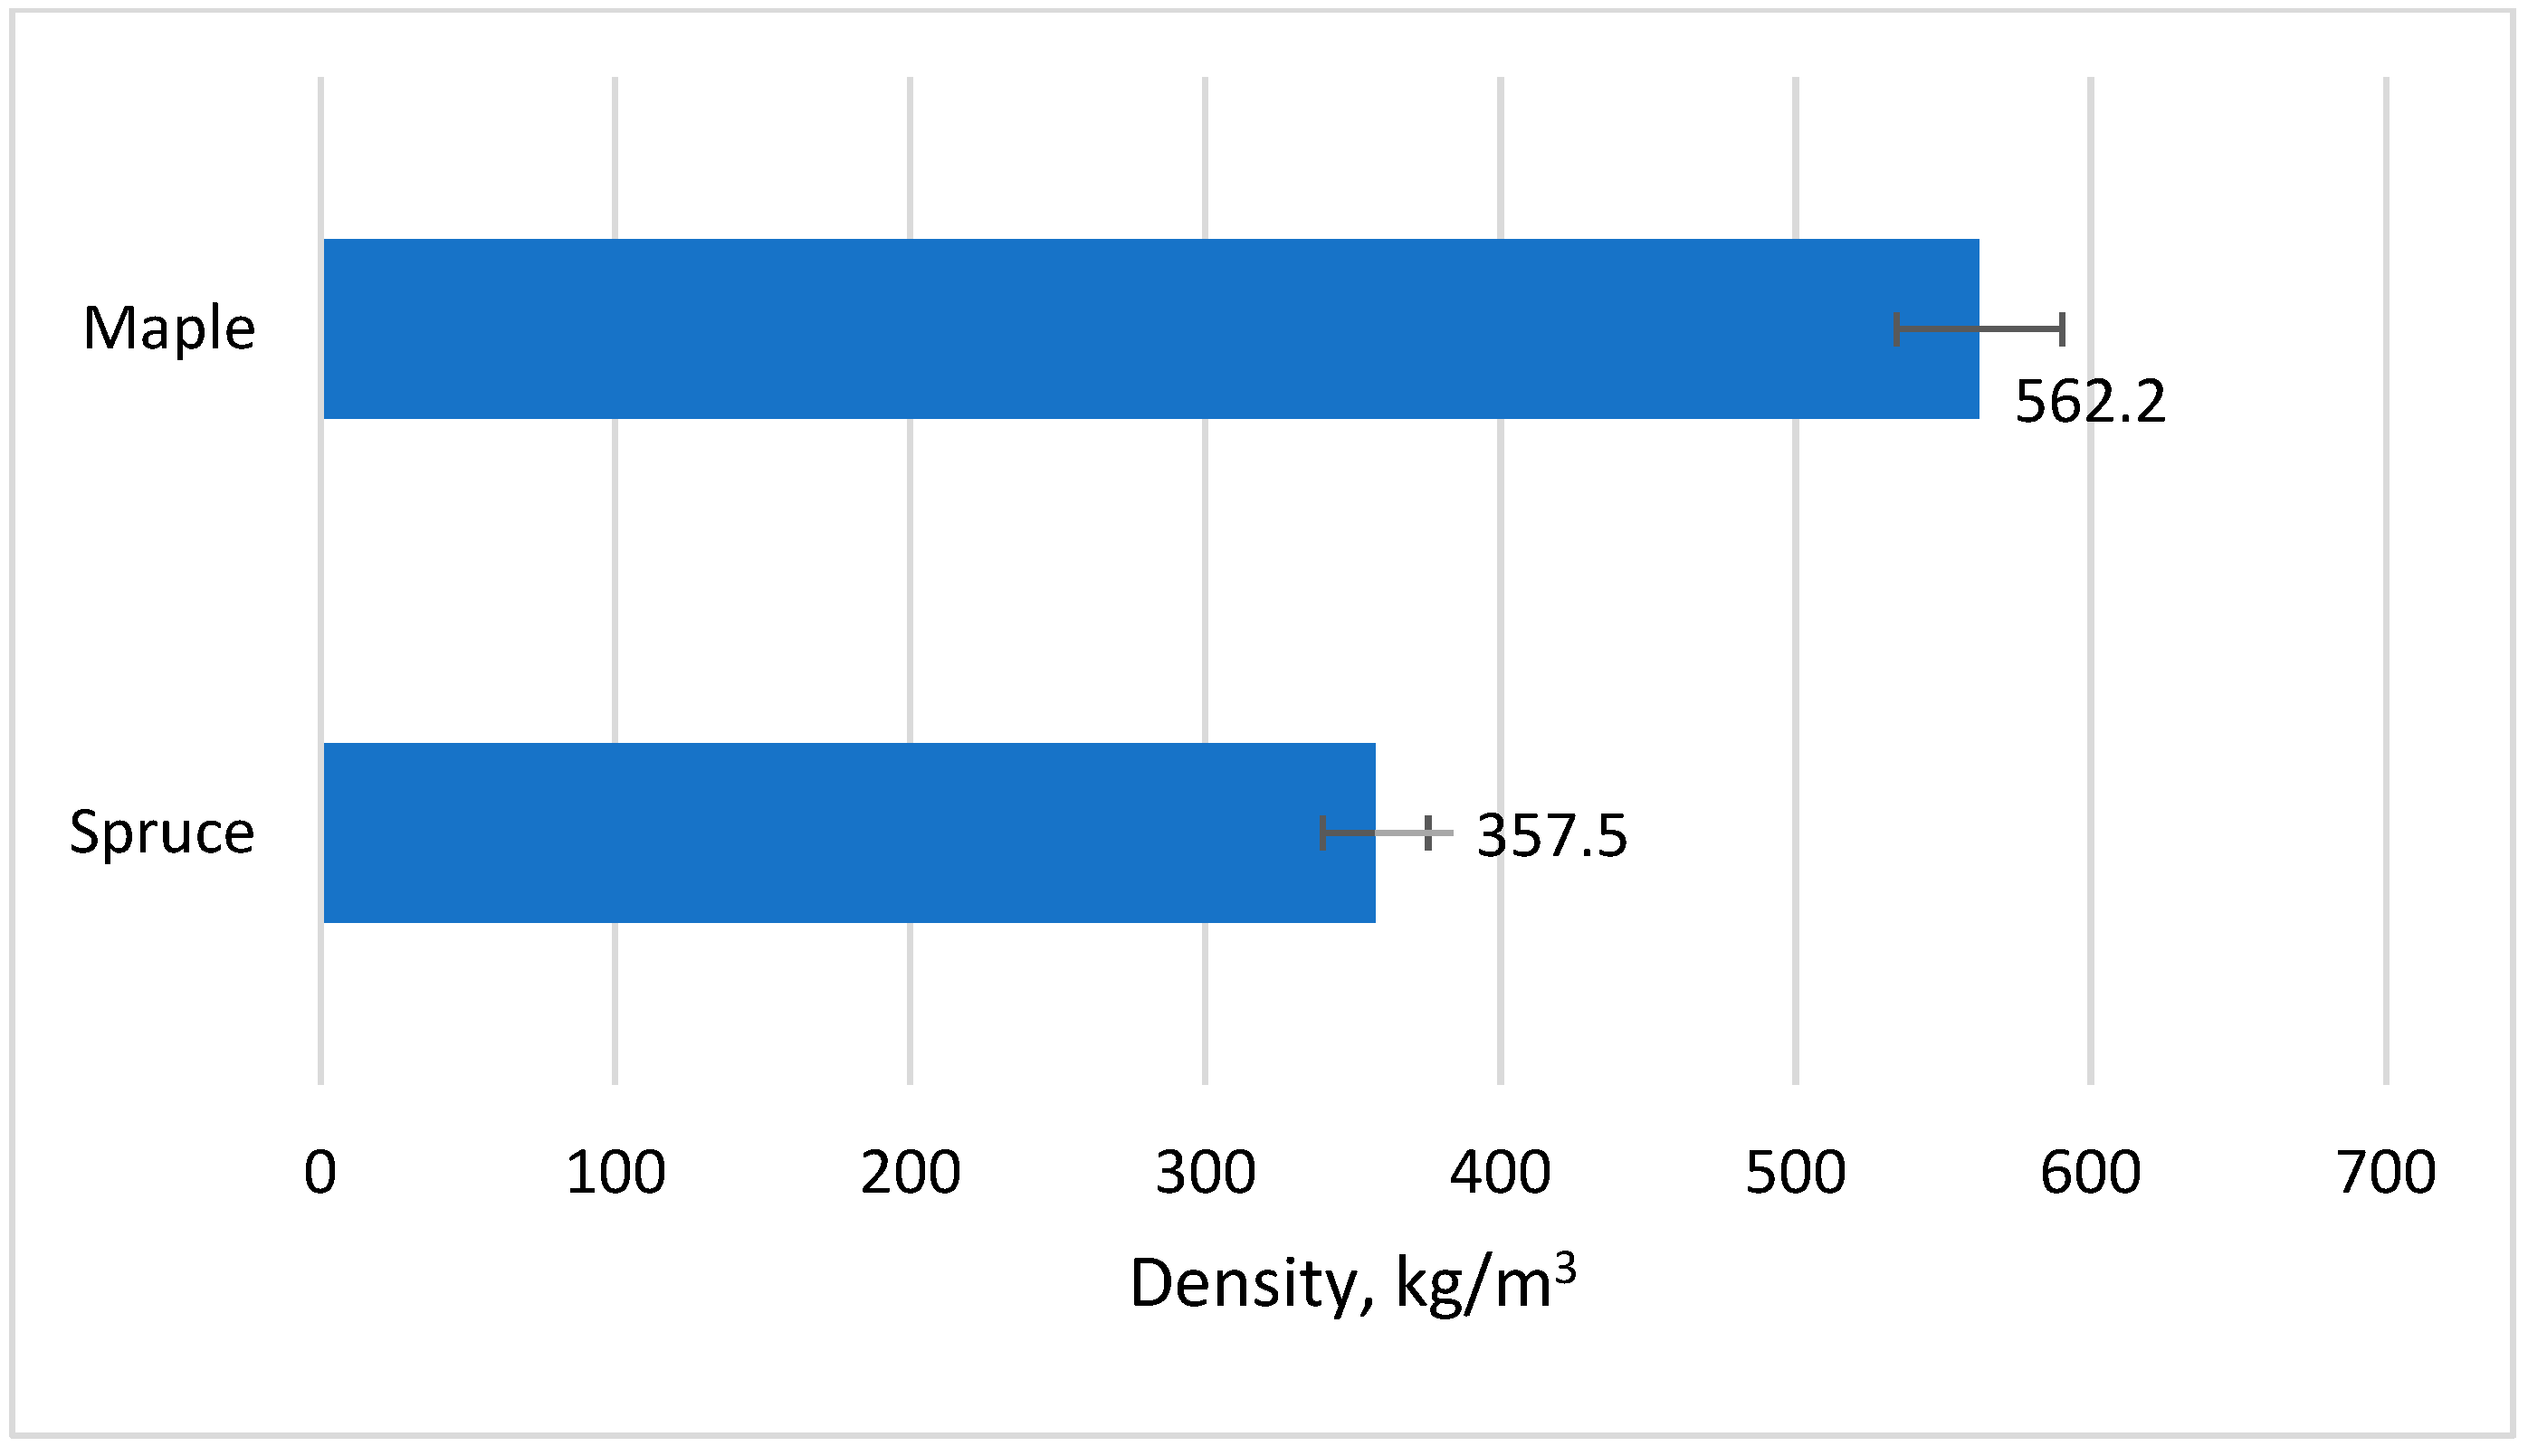
The densities of the two analyzed wood species were different (
Figure 3), since spruce is a softwood species and maple is a hardwood species with different properties. Even though both species are part of the light-colored species category, maple’s density was 57.3% higher than that of spruce, suggesting its higher resistance.
The density of thermowood maple (T = 200 °C, t = 3 h) is 318.1 kg/m3, while that of thermowood spruce (T = 200 °C, t = 3 h) is 204.2 kg/m3.
Hardwoods are denser and harder, while softwoods have softer wood. However, even though Yew is a softwood, the wood is hard, and while Balsa is a hardwood, it is soft.
3.2. Wood Absorption Results
Water absorption varied depending on whether the wood was heat-treated, the wood species, and the torrefaction temperature. In
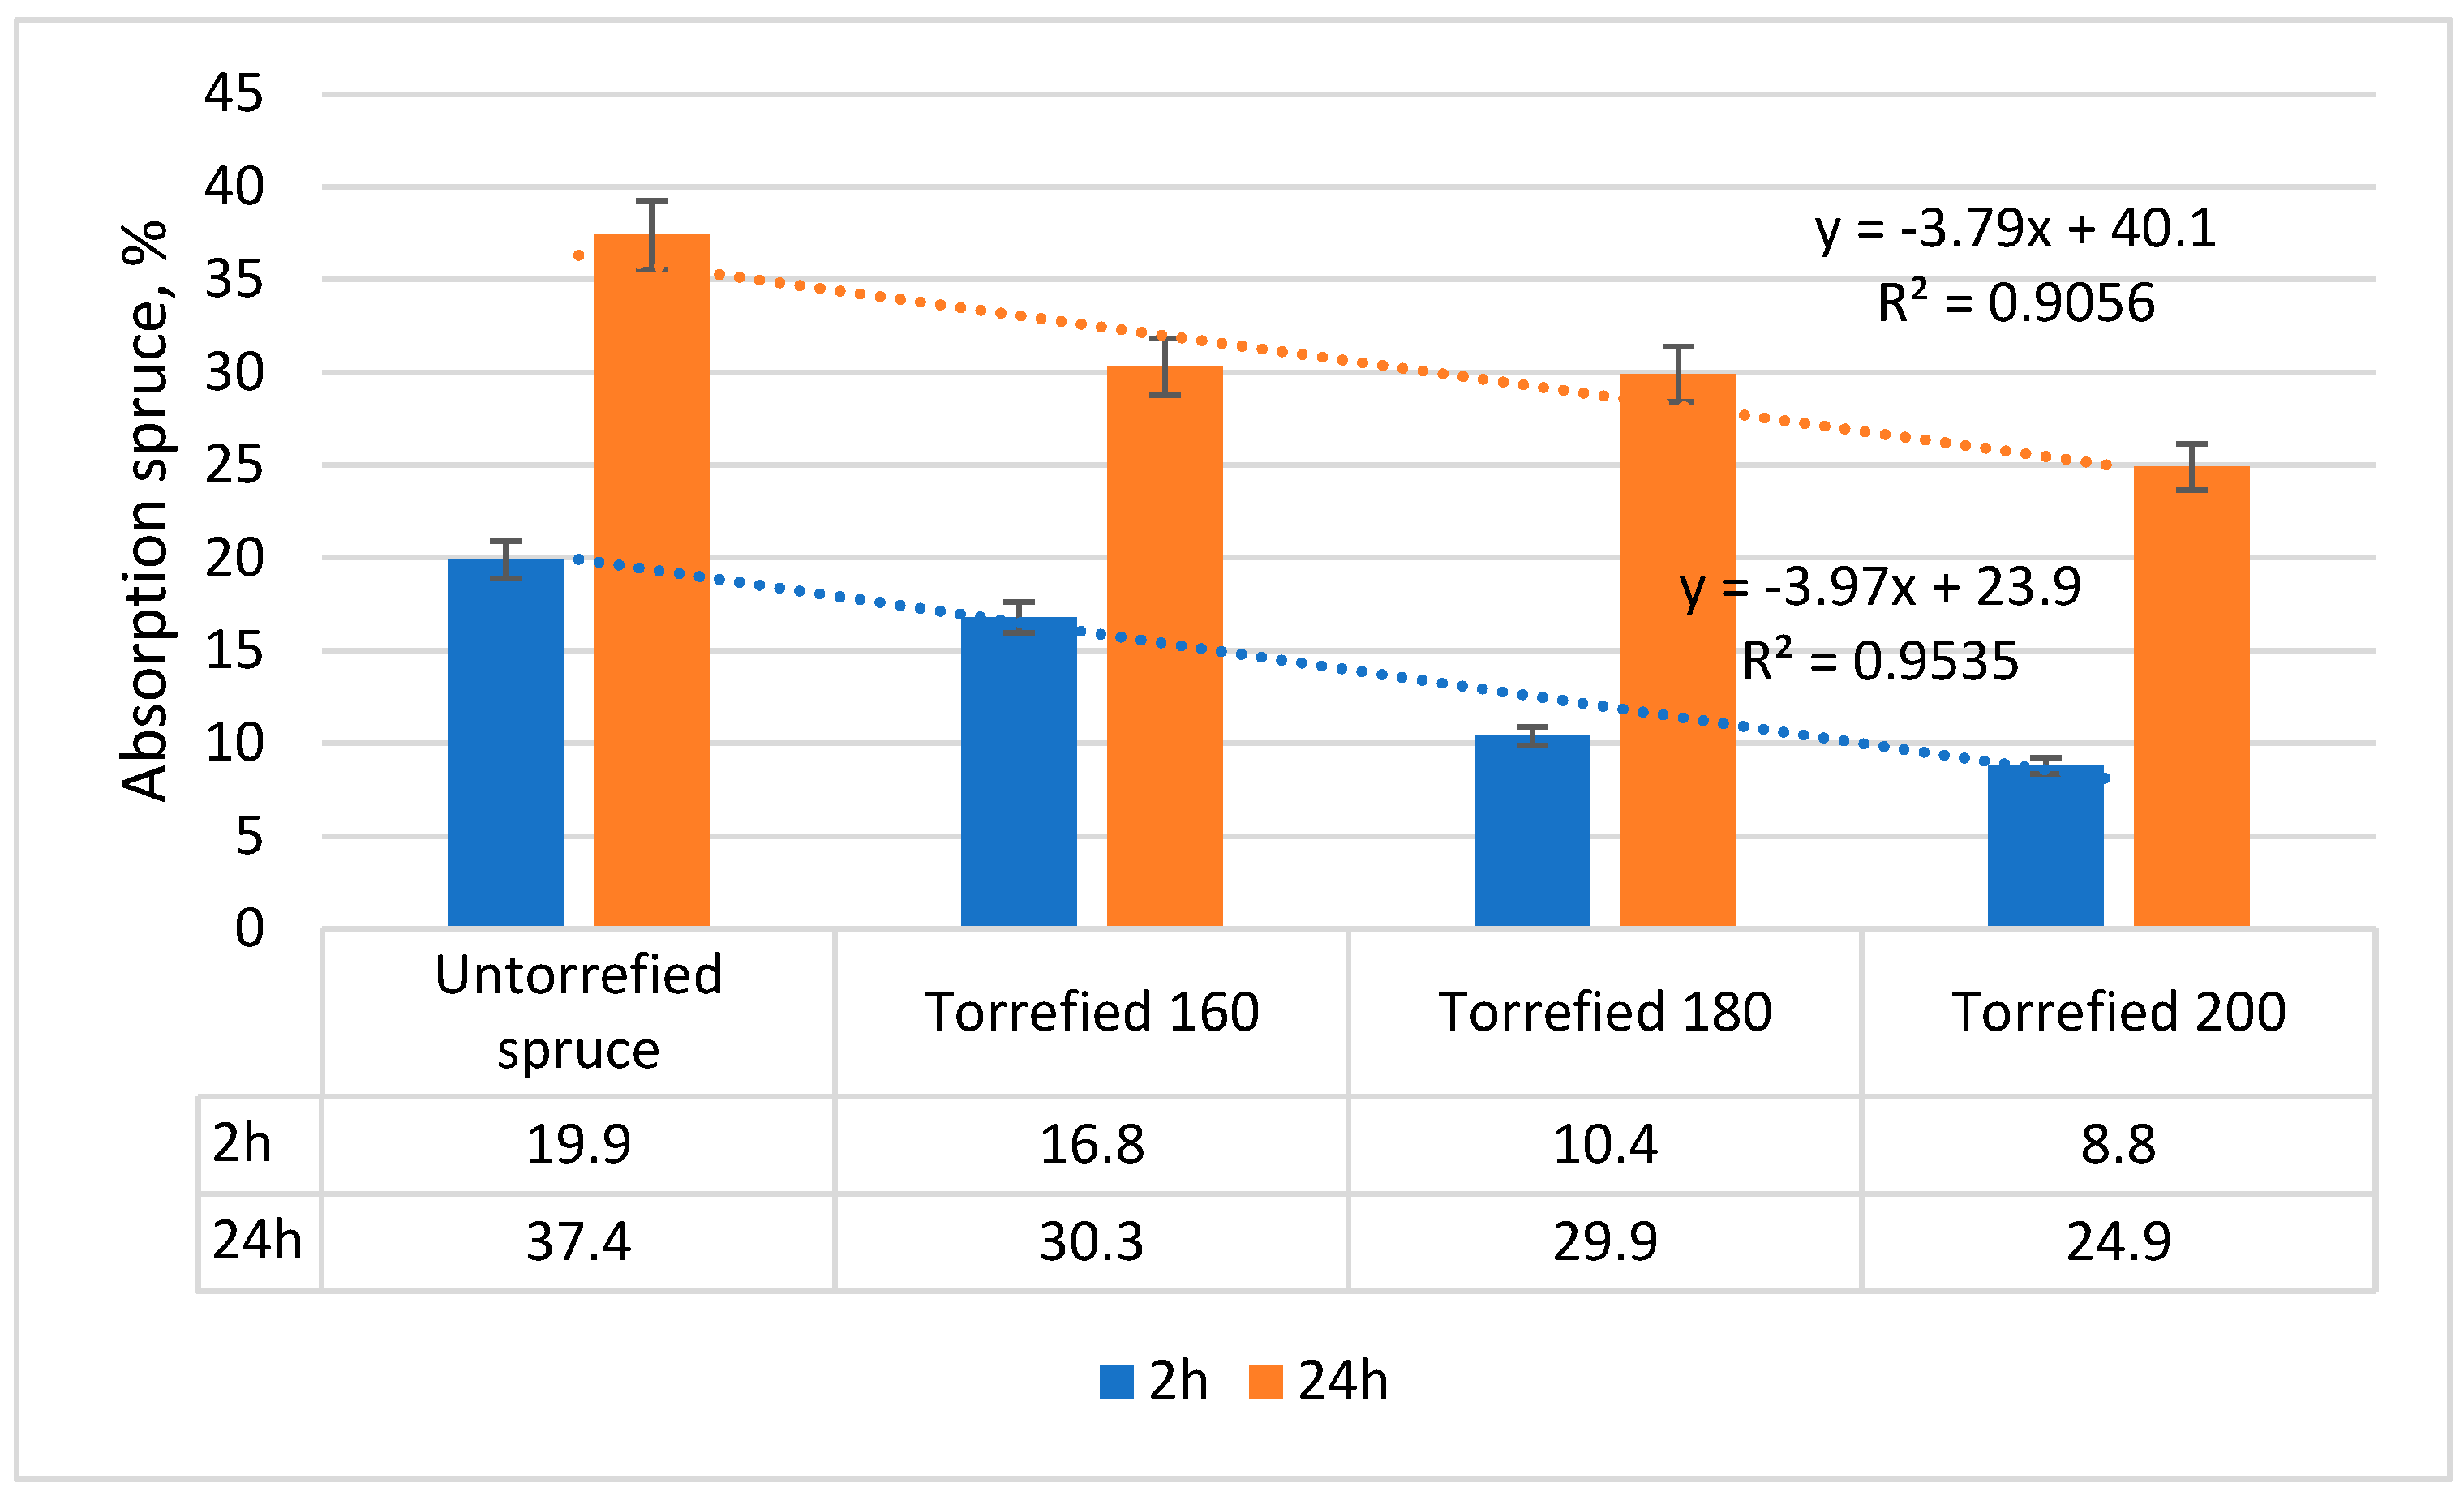
Figure 4, the variation in water absorption for spruce wood is shown.
In
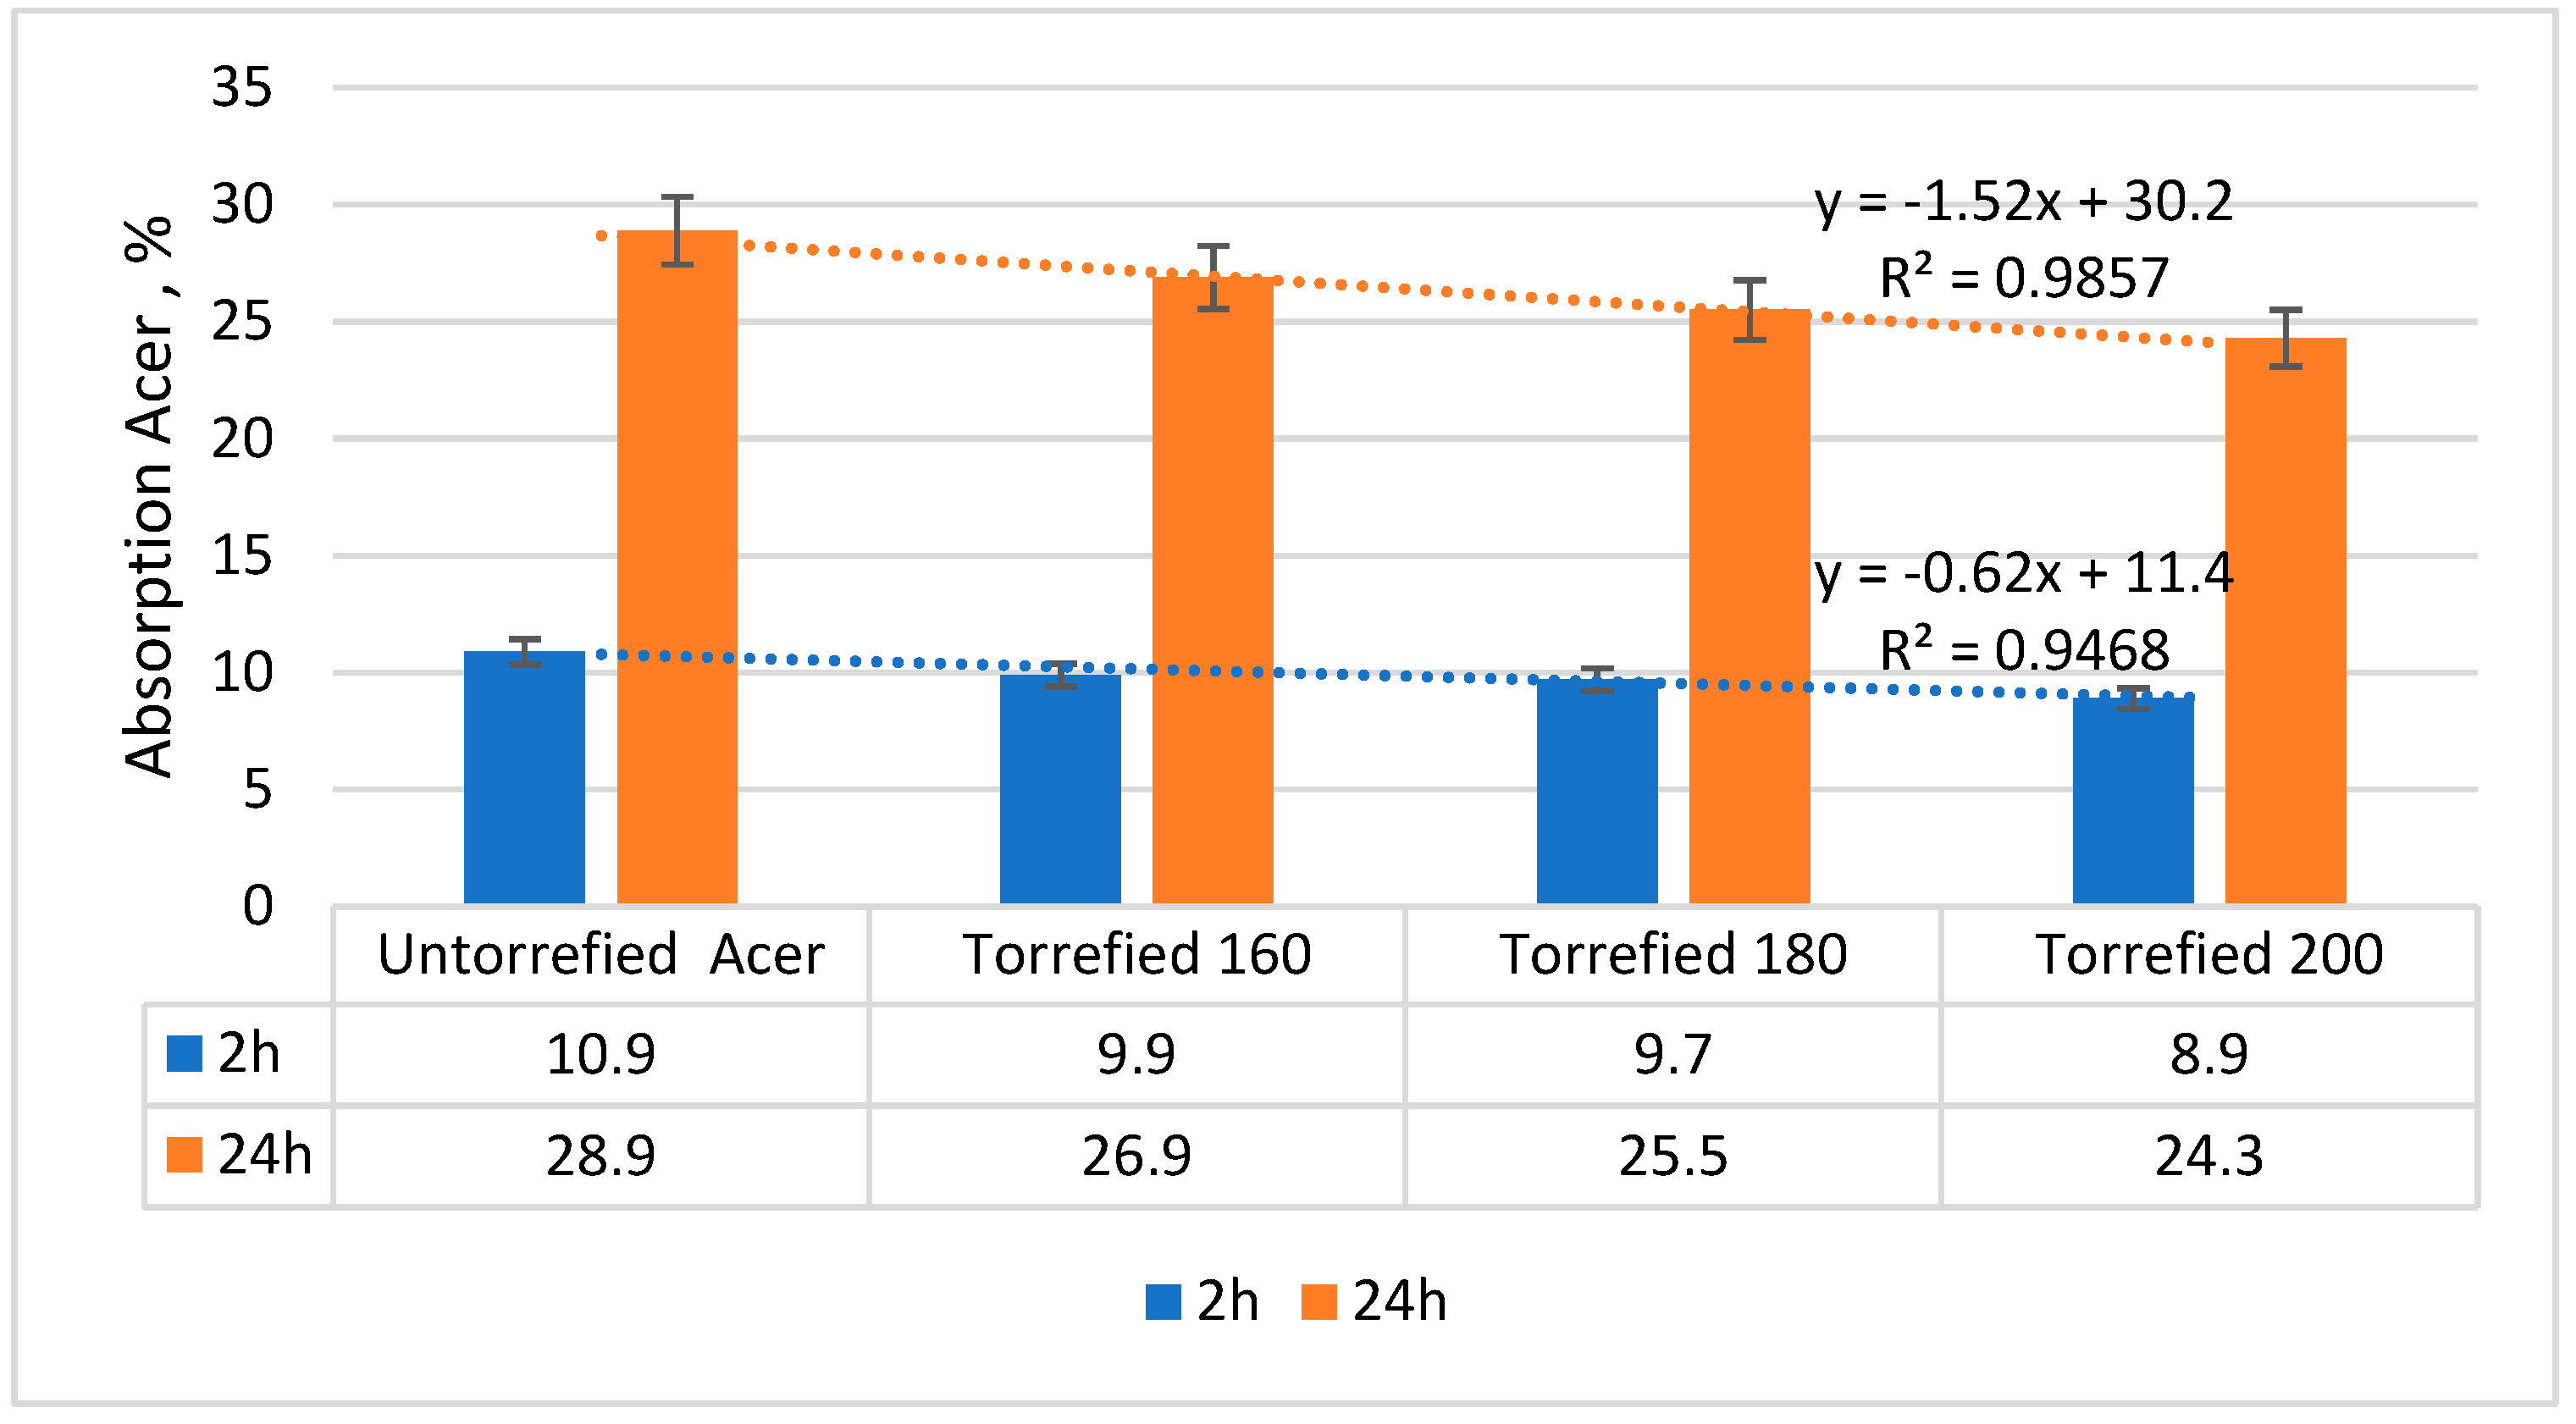
Figure 5, a decreasing trend in water absorption is observed with an increasing torrefaction degree. In this figure, the other torrefaction parameter, namely the duration of the heat treatment, was not considered because its influence is not significant [
22]. It can be observed that there is a constant decrease for both immersion durations (5–6%/20 °C). The existence of R
2 determination coefficients of greater than 0.9 shows that the linear variation that approximated the decreasing trend of the values was correctly chosen. It is also observed that the difference between the absorption at 2 h and that at 24 h is around a half, which implies that in the first stage of water absorption, half of the absorption occurs after 2 h, and the other half occurs in the following 22 h.
In the case maple water absorption, the same trend of improvement in this property was observed with the increase in the degree of torrefaction, but with different values. The difference between the absorption at 2 h and that at 24 h increased, with absorption at 2 h being about 30–40% of that at 24 h. This implies that for maple, the absorption is slightly more uniform over the 24 h. This difference is due to the increased density and the more compact structure of maple compared to spruce. The values of the coefficient of determination R
2 are higher, which means maple exhibits better homogeneity. Considering the above, it is observed that the differences in absorption between different degrees of torrefaction are smaller, with overall average values of 0.6%/20 °C [
22].
The authors of [
23] studied the effects of heat treatment at 200 °C for 2–10 h on the hygroscopicity of beech wood. After immersion in water for 3 days, the water absorption in thermowood after 10 h was 42.73%, while in wood that was heat treated for 4 h, it was 44.11%, and in natural wood, it was 52.16%.
3.3. Wood Swelling Results
Wood swelling tests measure another important parameter of water affinity, namely the tangential or radial direction of the wood with respect to the fibers.
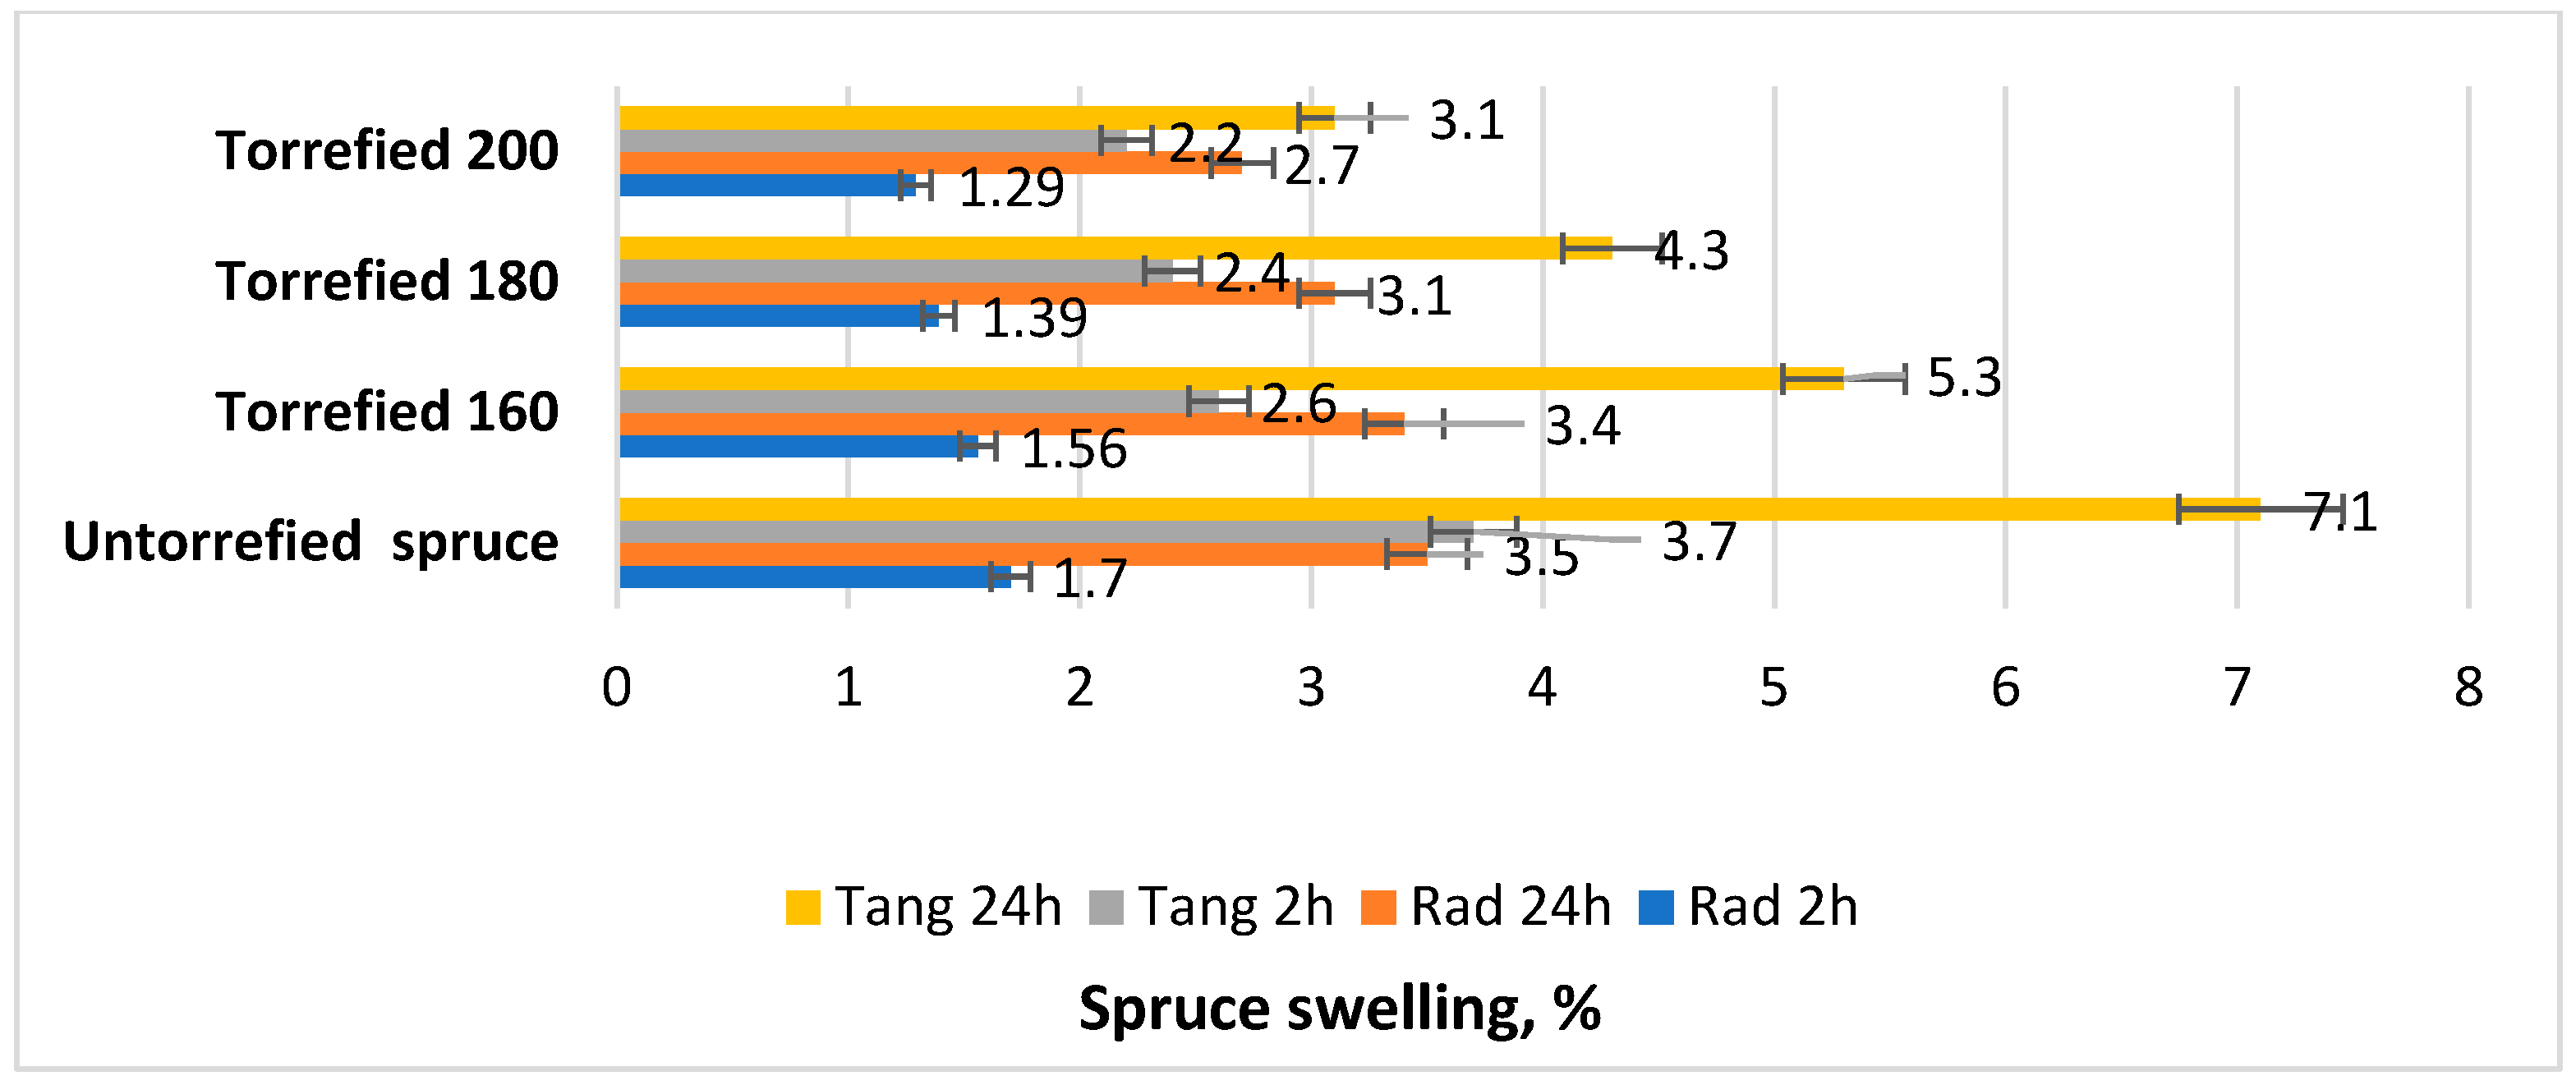
In general, the swelling in the tangential direction was much higher than the swelling in the radial direction; this is the general trend in all wood species (
Figure 6). For spruce wood torrefied at 200 °C, the swelling in the tangential direction was 70.5% higher than that in the radial direction following 2 h of immersion and 14.8% higher after 24 h of immersion; for torrefaction at 180 °C, the swelling in the tangential direction was 72.6% higher than that in the radial direction following 2 h of immersion and 38.7% higher for 24 h of immersion. For wood torrefied at 160 °C, the swelling in the tangential direction was 66.6% higher than that in the radial direction following 2 h of immersion and 103.8% higher following 24 h of immersion. For the non-torrefied reference wood, all values were higher, including the swelling in the tangential direction after 2 h of immersion and 24 h of immersion (102.8% higher) P [
24].
Regarding the torrefaction temperature, the swelling in thickness was lower for torrefied wood than for torrefied wood. Radial spruce wood torrefied at 160 °C exhibited 11.7% lower linear swelling at 2 h and 2.8% lower linear swelling at 24 h compared to the non-torrefied wood, while radial spruce wood torrefied at 180 °C exhibited 18.2% lower linear swelling at 2 h and 11.4% lower linear swelling at 24 h compared to the non-torrefied wood. Radial spruce wood torrefied at 200 °C exhibited 24.1% lower linear swelling at 2 h and 22.8% lower linear swelling at 24 h compared to the non-torrefied wood.
Analyzing the swelling in spruce wood thickness considering the duration of water immersion, then a slight increase in swelling is observed after 24 h of immersion compared to 2 h of immersion. It was found that there is no relationship between swelling and the duration of immersion; in the first 2 h, about half of the total linear swelling occurring over 24 h was observed.
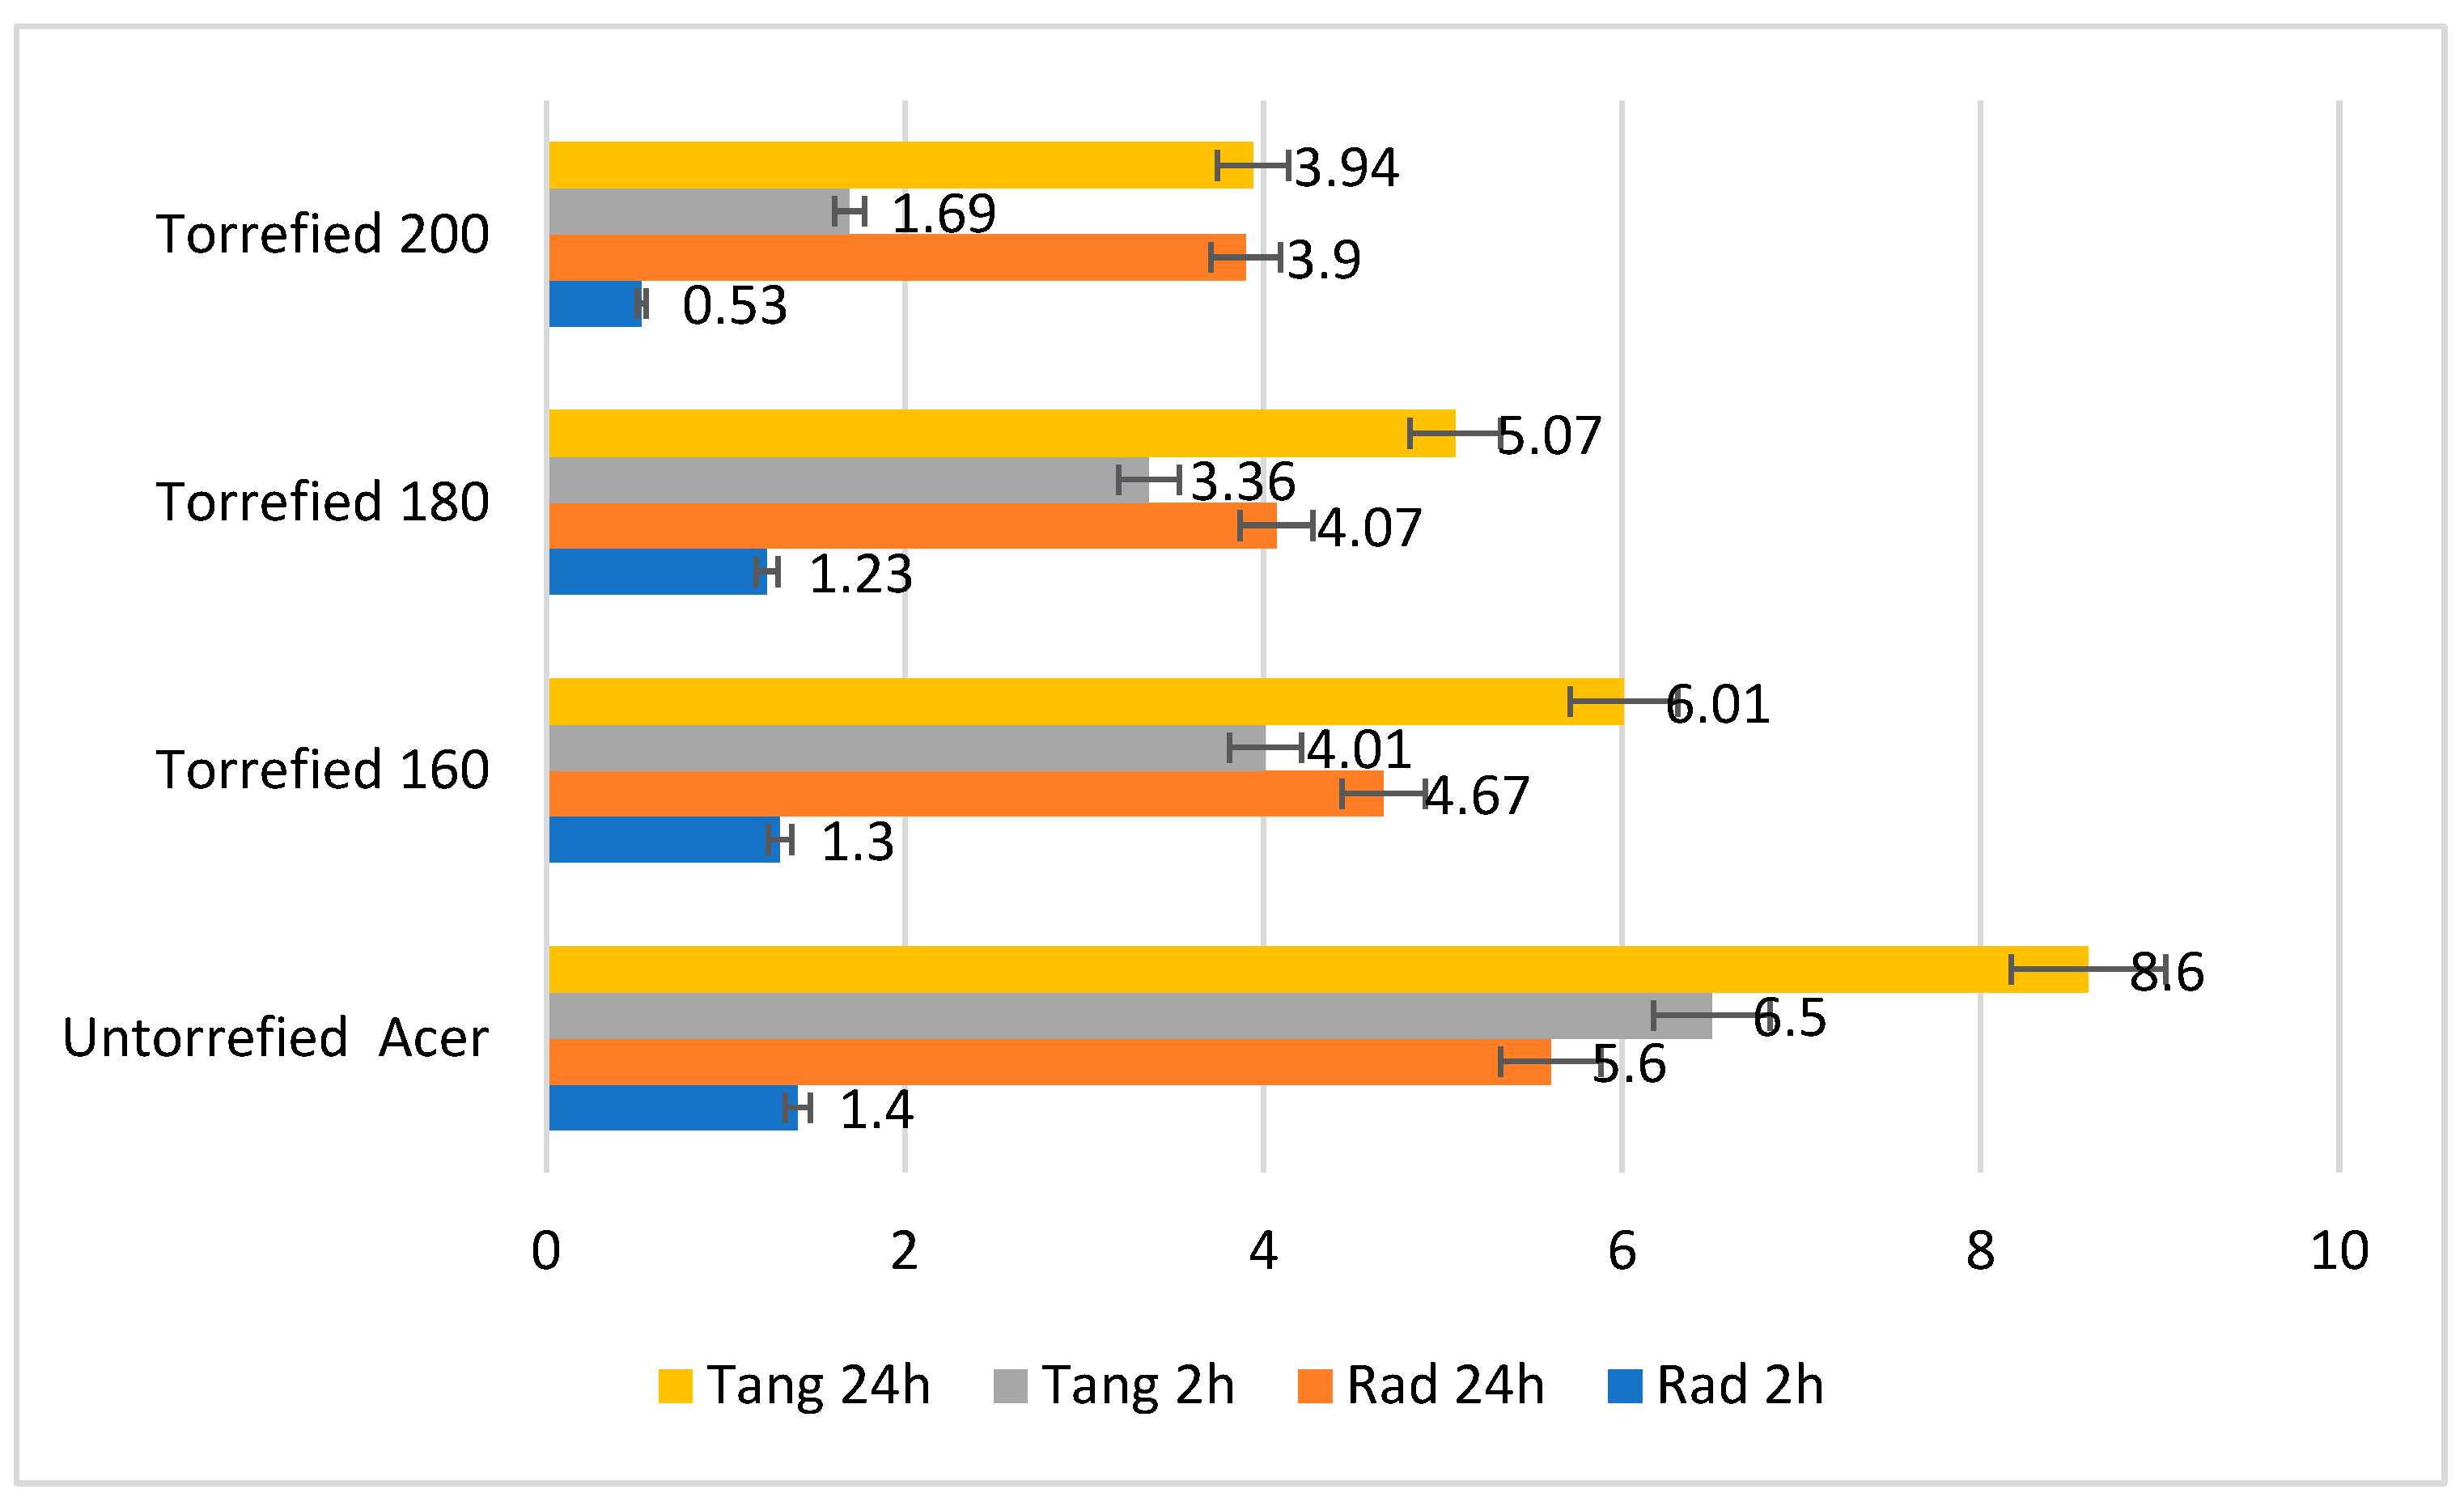
It was observed (
Figure 7) that the swelling of maple wood follows the same general rules as that of spruce, but the values were slightly different. In general, the swelling in the tangential direction was much higher than that in the radial direction—sometimes even double in value. For example, for maple wood torrefied at 200 °C, the swelling in the tangential direction was 218.8% higher than that in the radial direction after 2 h of immersion and 635.8% higher after 24 h of immersion.
Regarding the torrefaction temperature, the swelling in thickness was lower for torrefied wood than for torrefied woof. The maple wood radially torrefied at 200 °C exhibited 62.1% lower linear swelling at 2 h than the natural wood.
3.4. Compressive Strength Parallel to the Fibers
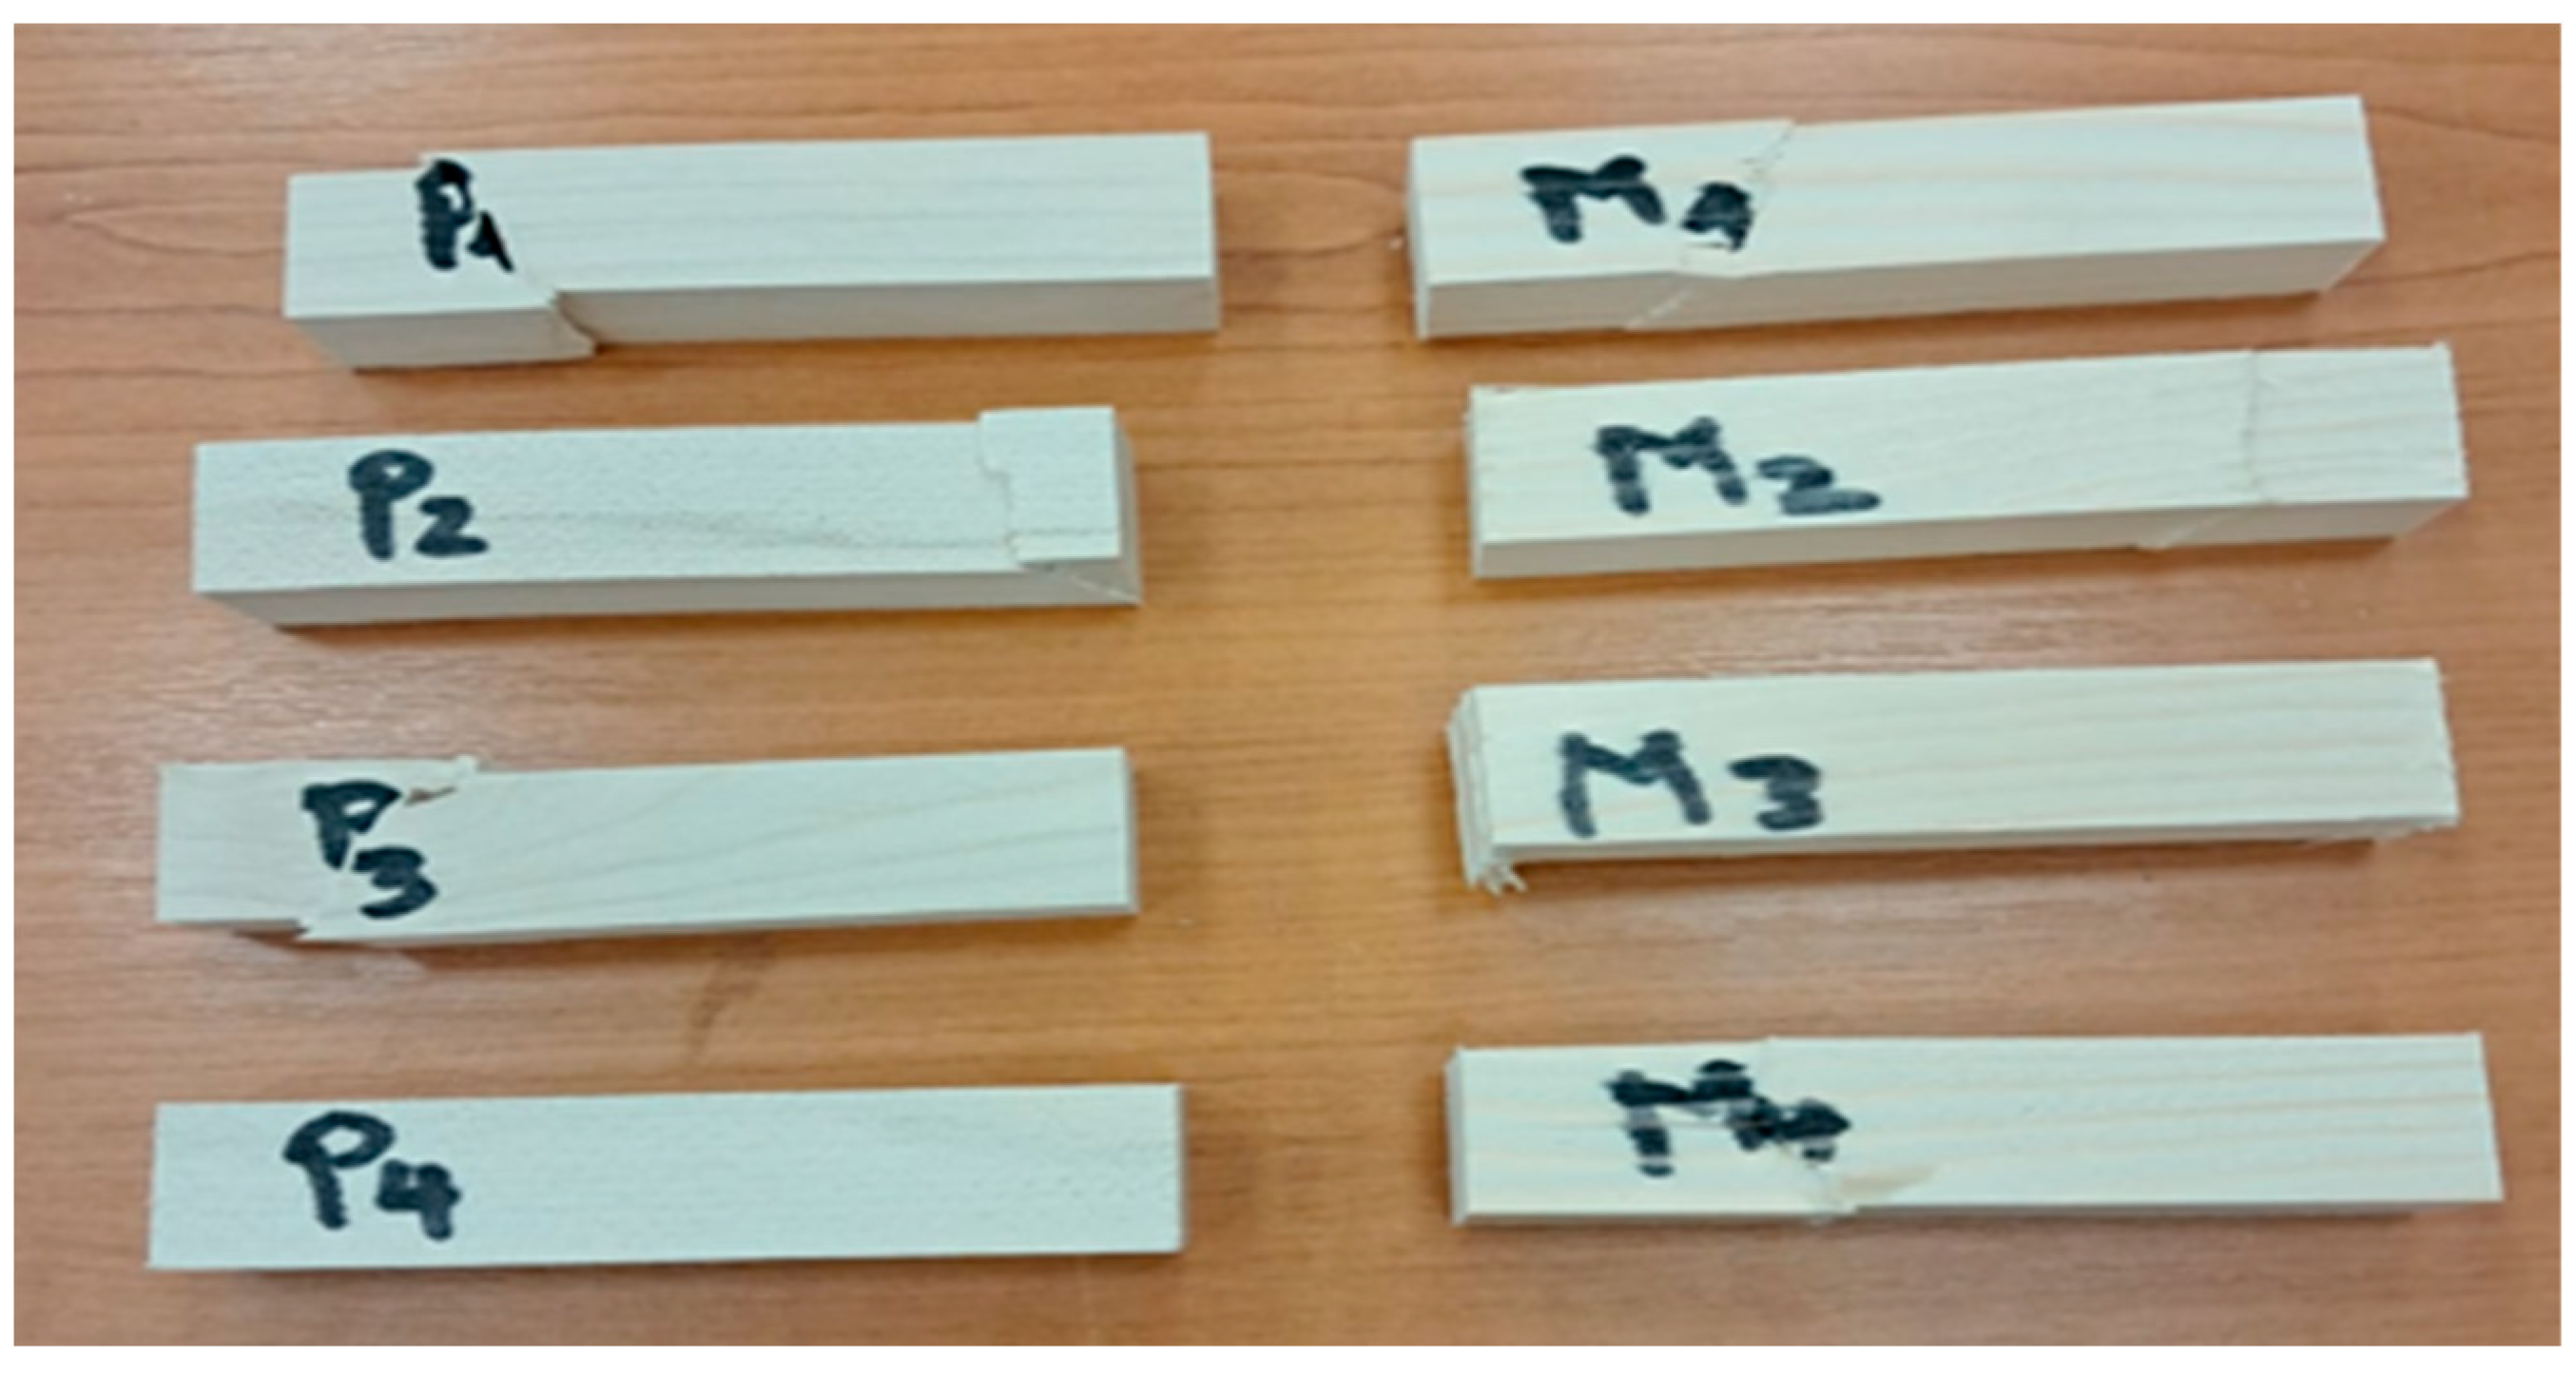
In the compressive test, rupture mostly occurred via sliding of the wood layers due to shear stress. A few cases of breakage occurred when the specimens were crushed at the ends, but some torrefied specimens also broke in two in the median longitudinal area. In
Figure 8, the most common fracture patterns in compression parallel to the fibers are shown.
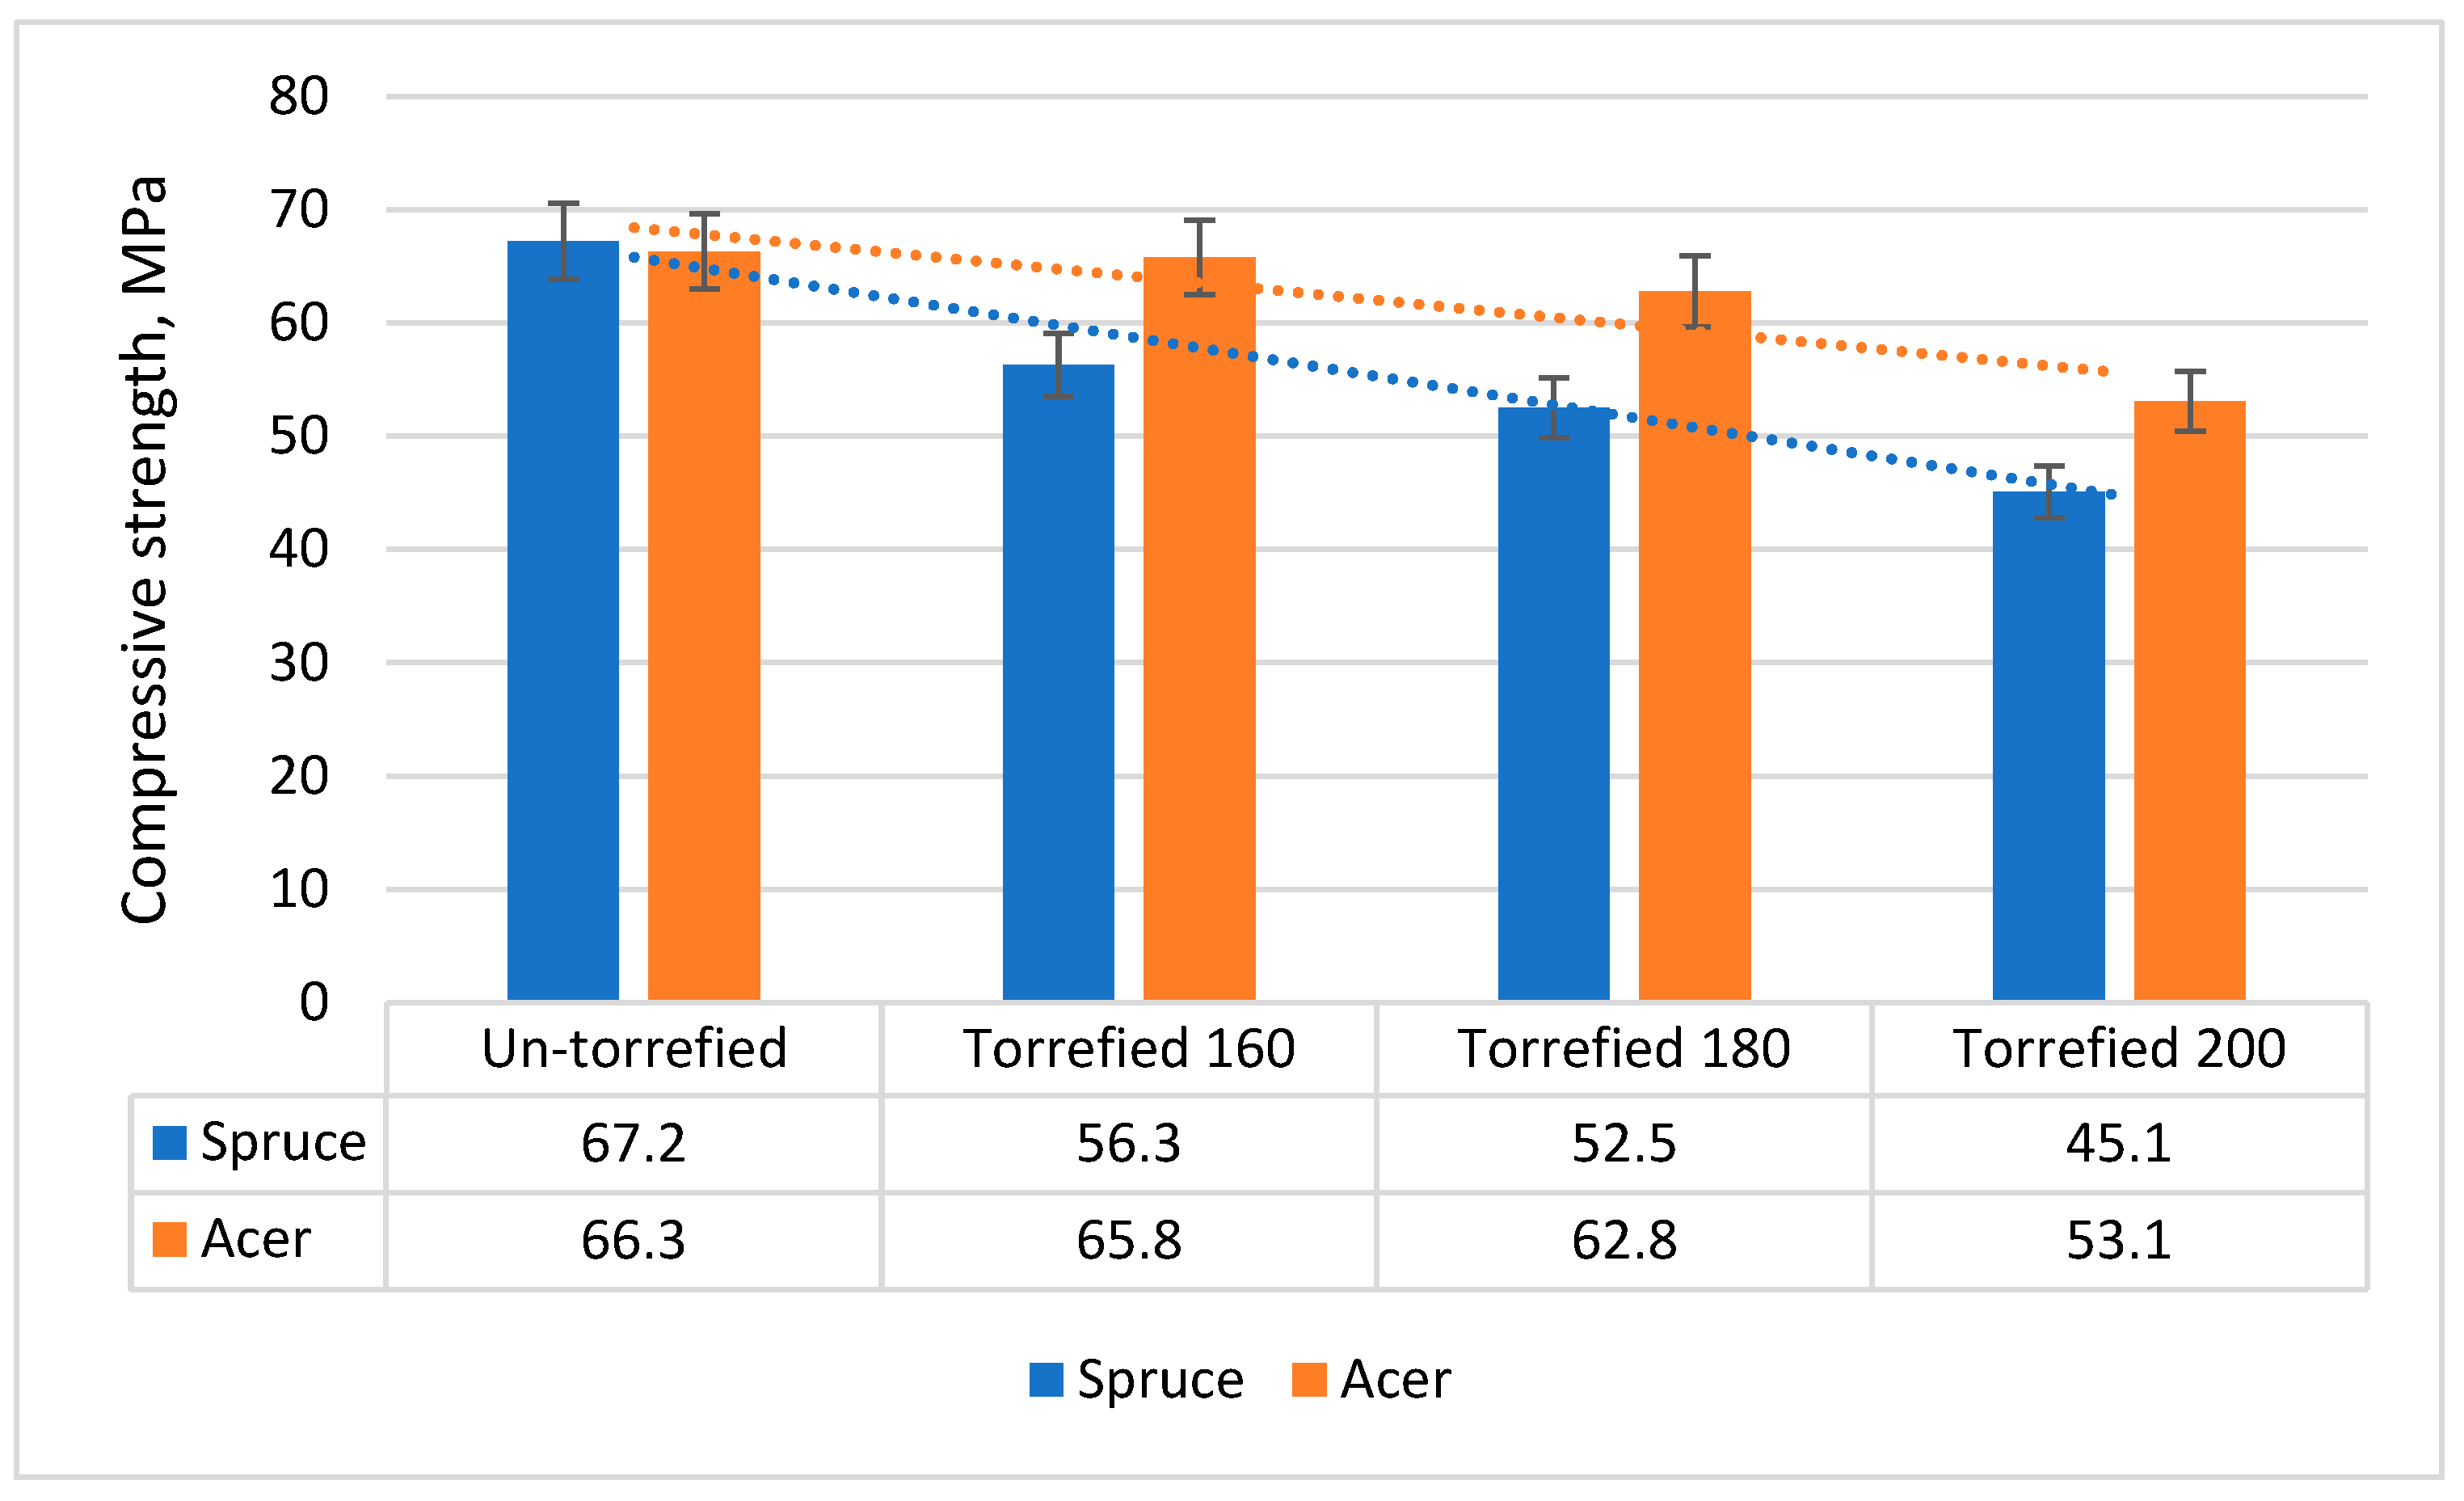
Unlike the other properties of torrefied wood, the compressive strength parallel to the fibers was slightly increased for torrefied wood compared to non-torrefied wood, the curves of this trend of the values being second-degree polynomials with a Pearson coefficient of over 0.87% (
Figure 9).
The decrease in compressive strength parallel to the fibers of torrefied wood was slightly greater at temperatures of 160 and 180 °C that that at 200 °C, as follows:
- -
At the torrefaction temperature of 160 °C, the compressive strength decreased by 16.2% for spruce wood and by 0.7% for maple wood;
- -
At the torrefaction temperature of 180 °C, the compressive strength decreased by 41.5% for spruce wood and by 5.2% for maple wood;
- -
At the torrefaction temperature of 200 °C, the compressive strength decreased by 32.8% for spruce wood and by 19.9% for maple wood.
3.5. Parallel to the Fibers
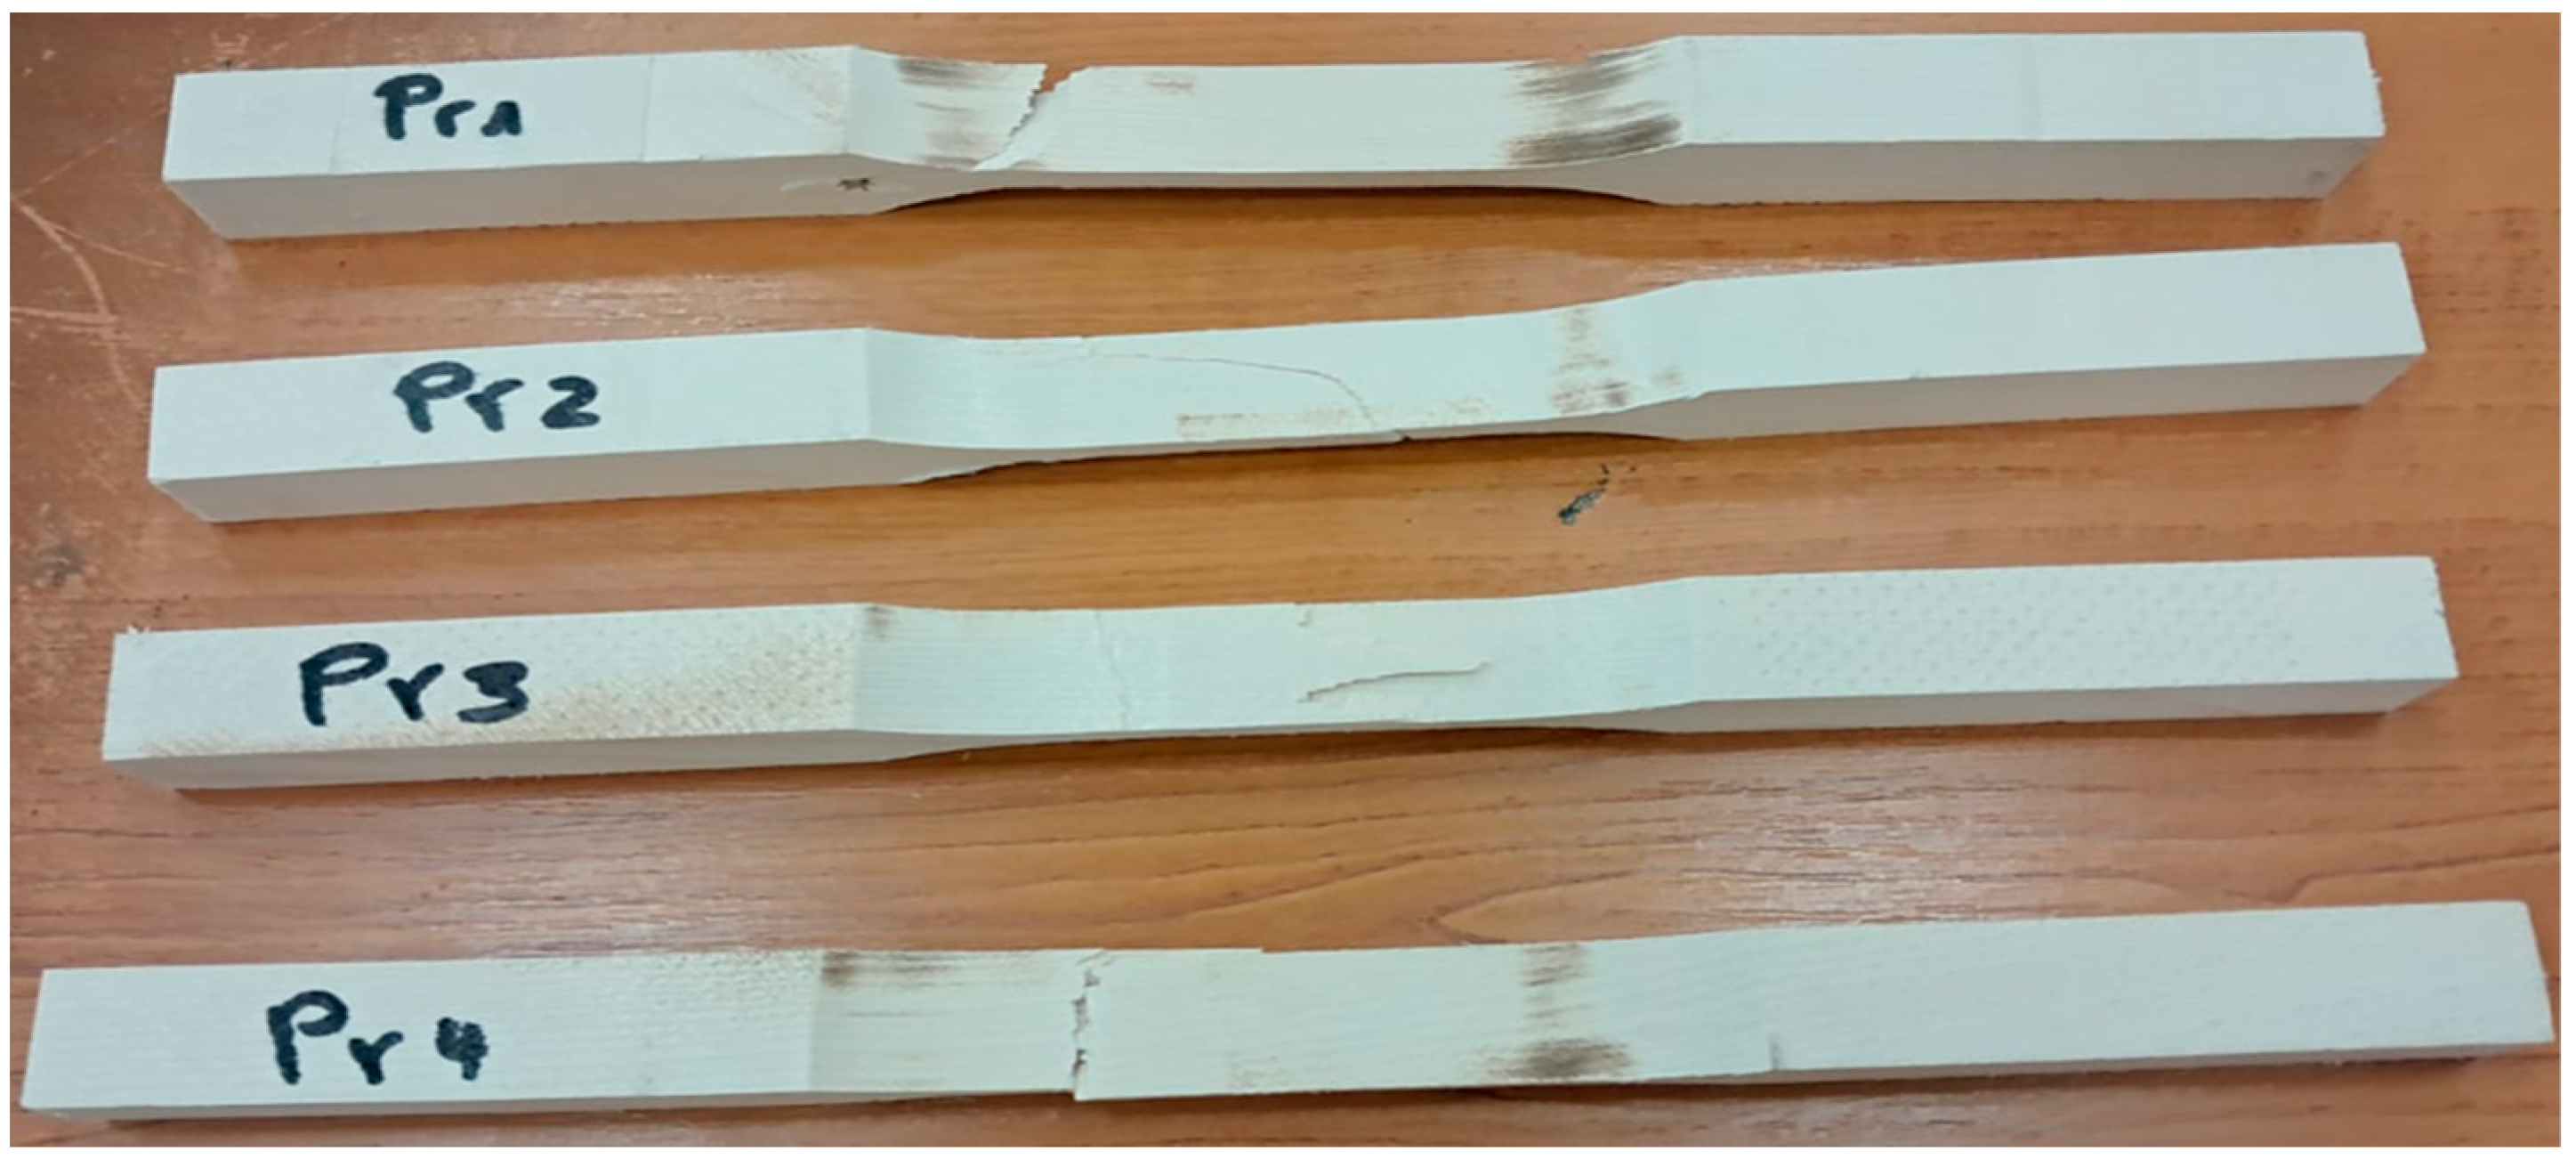
In this test, all the breaks occurred in the middle, thinned area of the specimens (4.5 mm size), as seen in
Figure 10.
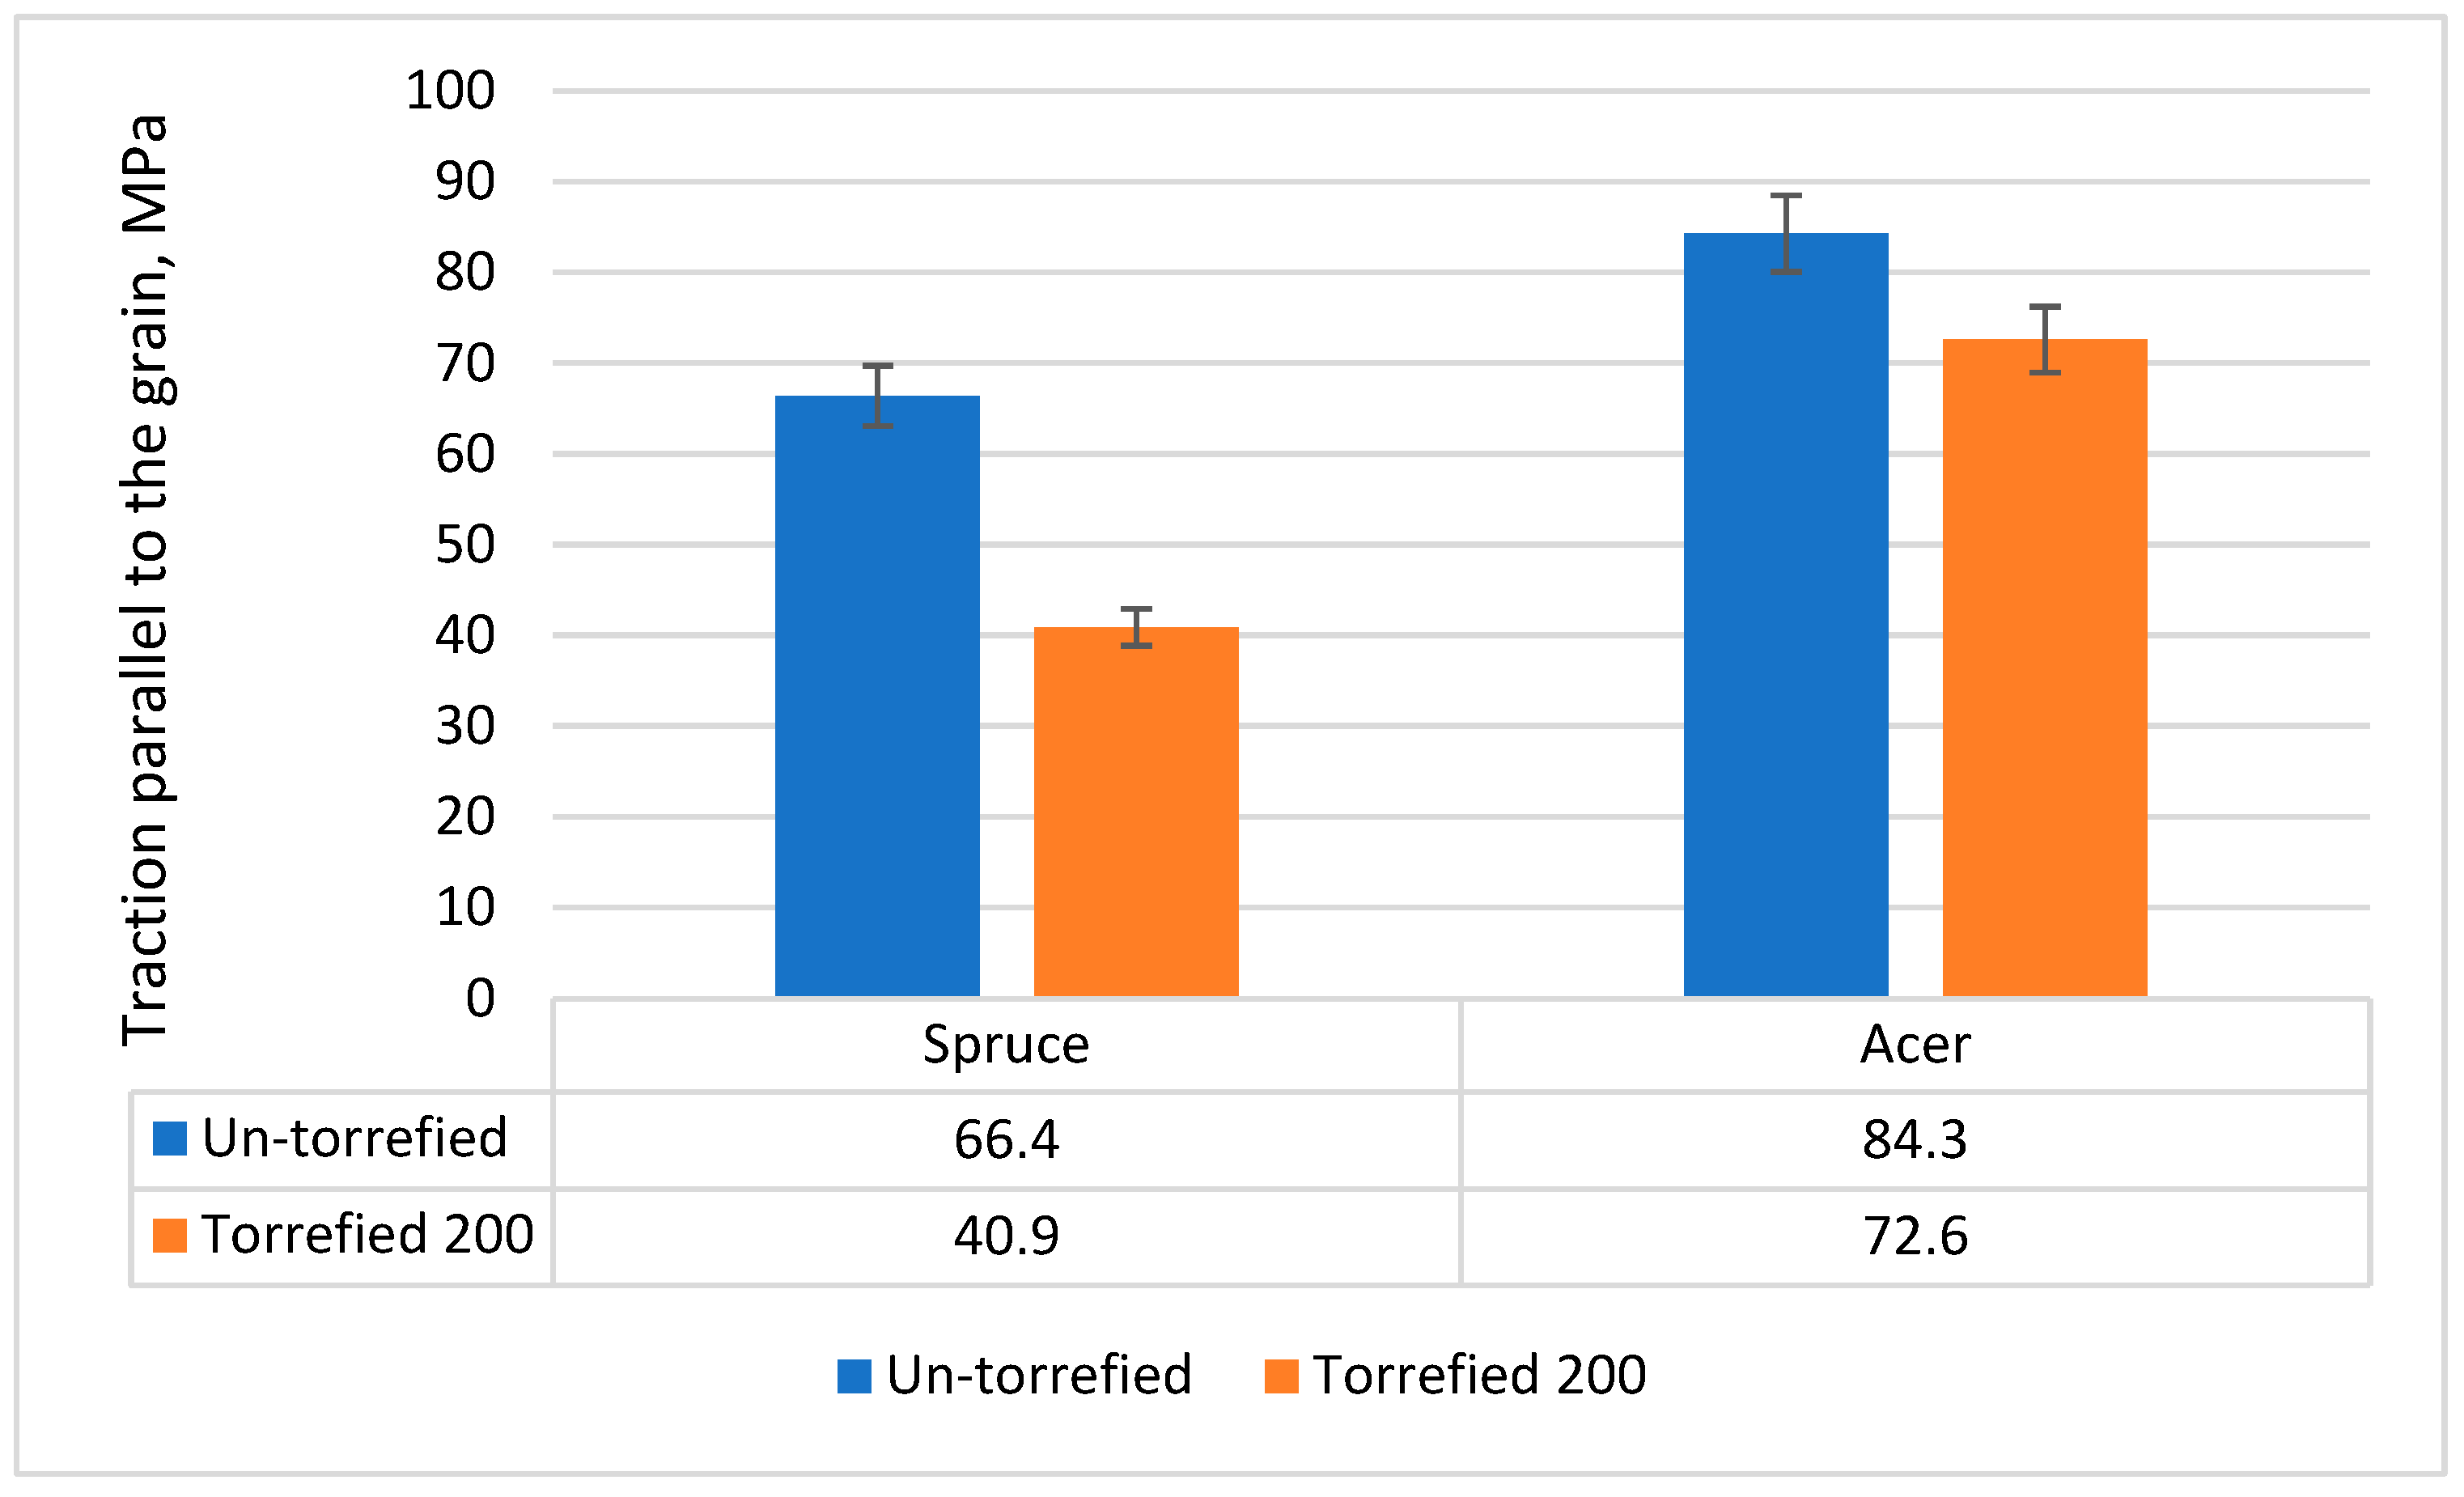
It was found that the side on which milling was performed on the specimen (radial or tangential) did not influence the tensile strength parallel to the fibers (
Figure 11).
3.6. Brinell Hardness
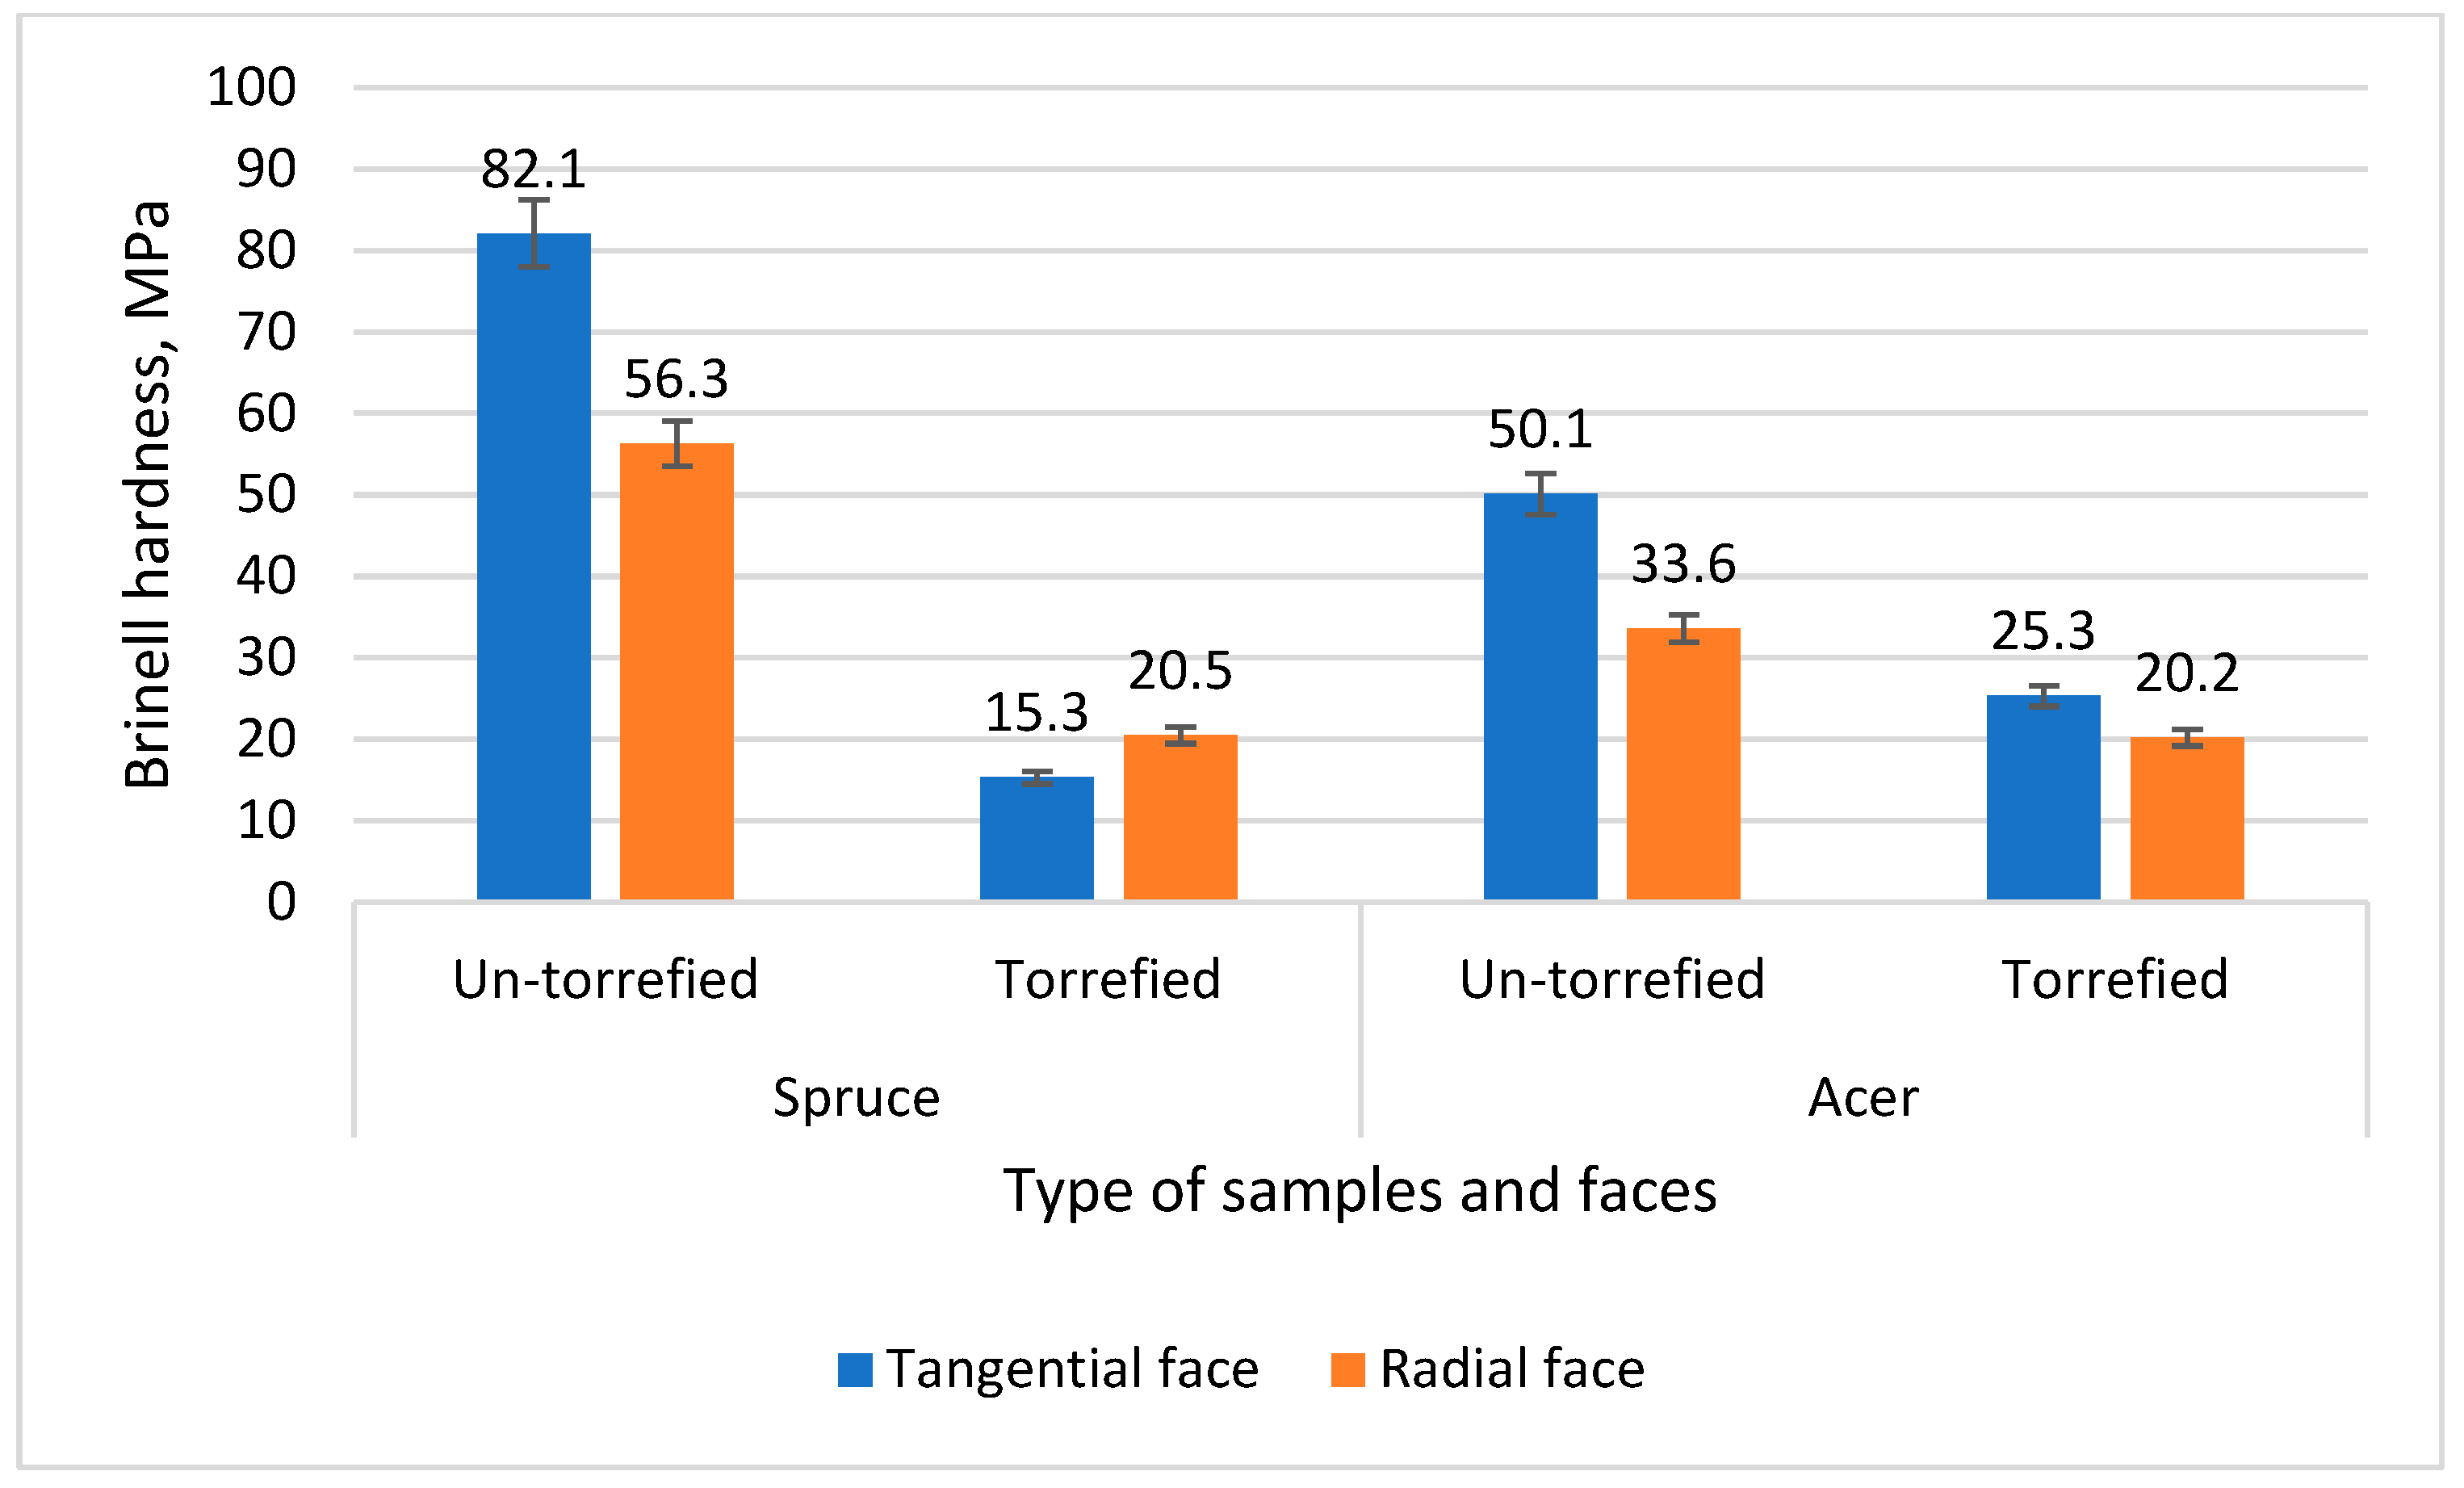
Brinell hardness was the property most influenced by the torrefaction treatment, with differences of over 100% in the case of spruce wood and over 50% in the case of maple wood (
Figure 12). These large differences show that thermal torrefaction treatment of wood had a great influence on the outer surface of the wood, slightly degrading it.
Wood degradation via torrefaction created the largest differences in Brinell hardness for spruce wood, with decreases of 81.3% and 63.8% on the tangential and radial sides, respectively. For sycamore wood, the decrease was more moderate, at 49.5% on the tangential side and 39.8% on the radial side.
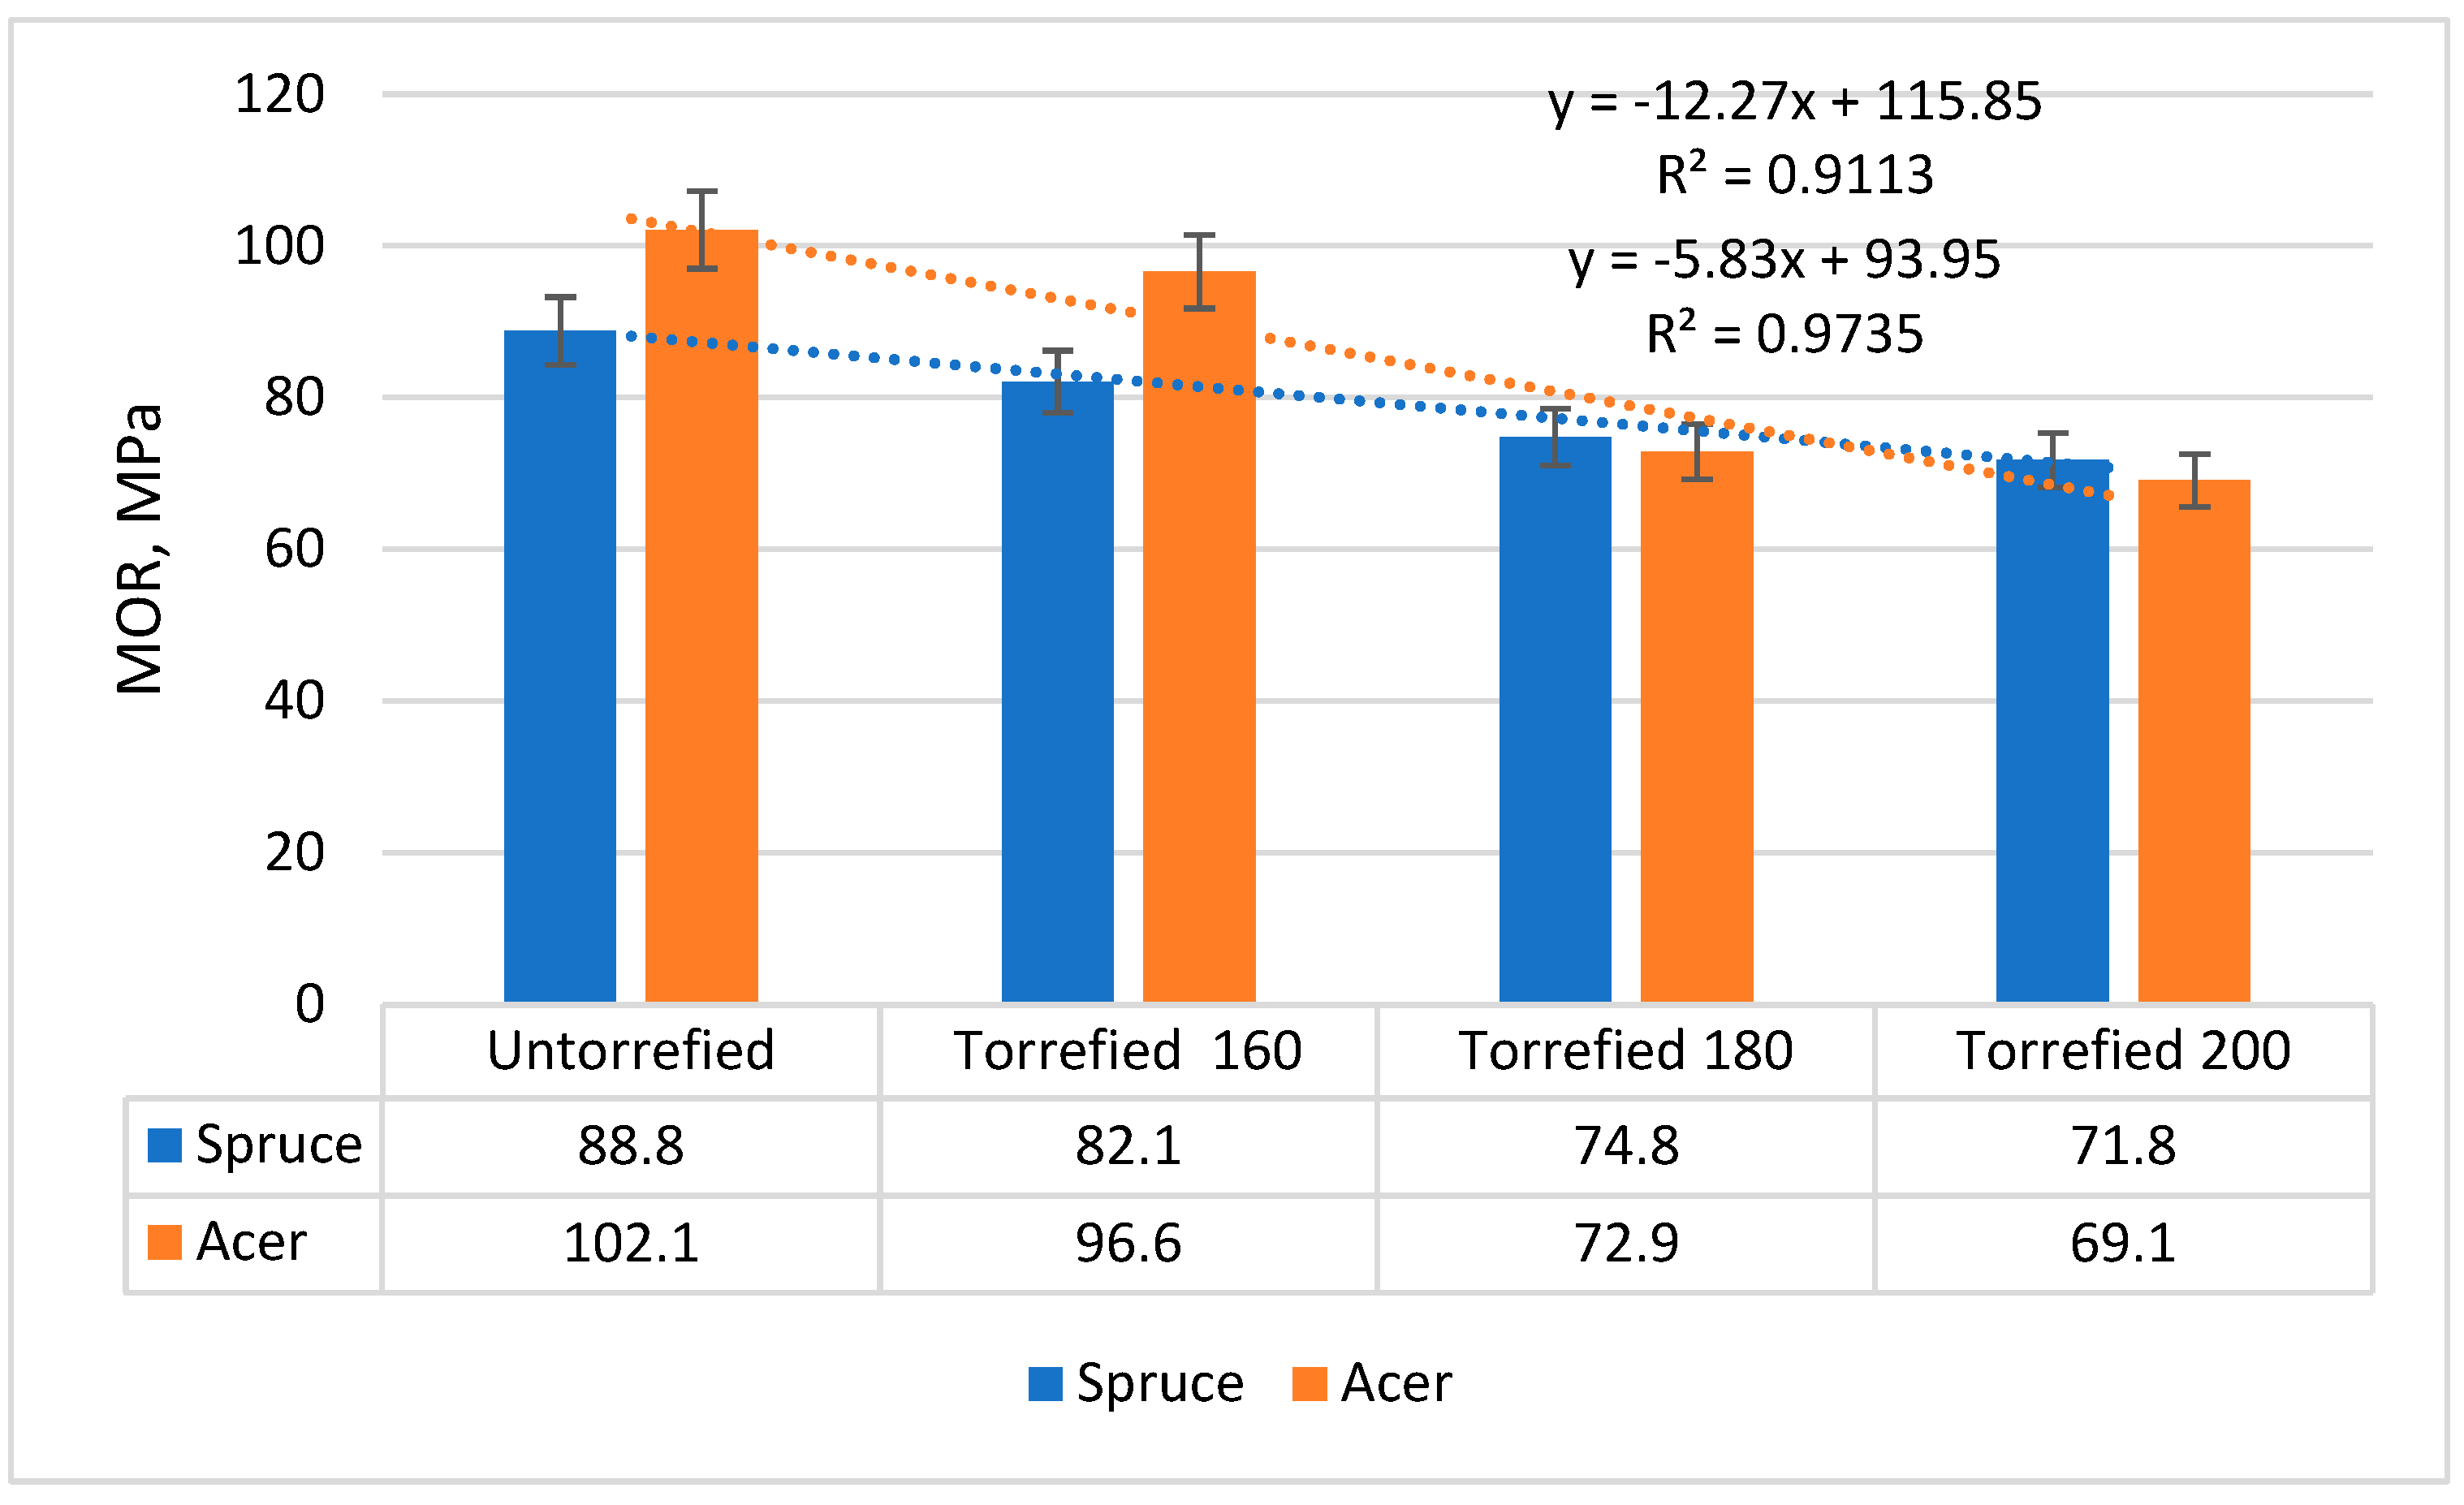
3.7. Static Bending Strength
Static bending strengths followed the general trend of decreasing during torrefaction, with decreases of 7.5%, 15.7% and 19.1% for spruce after torrefaction at 160 °C, 180 °C and 200 °C, respectively (
Figure 13).
In the case of sycamore wood, the decrease in strength was more pronounced, with the increase in the coefficient of determination R2 to over 0.97 showing that torrefied sycamore wood is more uniform and weaker. We observed a decrease of 5.3% when torrefaction was performed at 160 °C, 28.9% when torrefaction was performed at 180 °C and 32.3% when torrefaction took place at 200 °C.
The authors also examined the effects of hydrolytic aging and freeze–thaw cycling on spruce wood. The XRD results showed a clear increase in crystallinity after the first aging interval, likely due to drying at 103 °C [
25].
4. Discussion
The temperature and roasting time have a great influence on many properties of wood and composite materials.
The light color of spruce wood gives it an advantage in applications where high quality aesthetics are desired.
Compared to maple wood, the density of thermowood maple is 56.58% lower, while compared to spruce wood, the density of thermowood spruce is 57.11% lower.
Sycamore wood has a denser cellular structure and therefore a higher weight per unit volume, while spruce wood is classified as a softwood species with a less dense cellular structure.
The standard deviations for the densities of maple wood, spruce wood, thermowood maple, and thermowood spruce are 3.44, 3.01. 3.22, and 2.95, respectively.
Regarding the compressive strength, the standard deviation for un-torrefied spruce is 2.72, while that for spruce torrefied at 160 °C, 180 °C, and 200 °C is 2.28, 2.19 and 1.82, respectively. The standard deviation for un-torrefied maple is 2.68, while that for maple torrefied at 160 °C, 180 °C, and 200 °C is 2.66, 2.54, and 2.15, respectively.
Regarding the traction parallel to the grain, the standard deviation for un-torrefied spruce is 2.69 and that for spruce torrefied at 200 °C is 1.65, while the standard deviation for un-torrefied maple is 3.41 and that for maple torrefied at 200 °C is 2.94.
Regarding the Brinell hardness, the standard deviations for un-torrefied spruce are 0.88 and 2.28 for the tangential and radial faces, respectively, while the standard deviations for torrefied spruce are 0.61 and 0.83 for the tangential and radial faces, respectively. For un-torrefied maple, the standard deviations are 2.03 and 1.36 for the tangential and radial faces, respectively, while they are 1.02 and 0.81 for torrefied maple for the tangential and radial faces, respectively.
Regarding the static bending strength, the standard deviations for un-torrefied spruce, spruce torrefied at 160 °C, spruce torrefied at 180 °C, and spruce torrefied at 200 °C are 3.60, 3.32, 3.03, and 2.91, respectively. The standard deviations for un-torrefied maple, maple torrefied at 160 °C, maple torrefied at 180 °C, and maple torrefied at 200 °C are 4.14, 3.91, 2.95, and 2.80.
The moisture contents of spruce and sycamore species were 7.0 ± 0.2% and 5.8 ± 0.2%, respectively, following thermal modification at 135 °C and 185 °C. After modification at 160 °C, the moisture contents of the spruce and sycamore specimens were different [
17,
18], at 6.4 ± 0.2% for spruce wood and 5.8 ± 0.2% for sycamore.
The results show that the mass loss increased with temperature for both wood species, which is in agreement with earlier studies on spruce [
19] and sycamore [
20]. The mass loss was similar to that found in other studies of thermally modified softwoods and hardwoods [
21,
22]. The extent of mass loss depends upon the temperature and treatment time [
21,
22,
23,
24,
26,
27].
Mass loss following heat treatment of wood is one of the most important considerations, as it is considered a qualitative indicator of heat treatment efficiency. The greater the mass loss, the greater the changes in the chemical composition of the wood (both positive changes, i.e., increasing dimensional stability, and negative ones, i.e., decreasing chemical resistance) [
23].
The chemical changes due to heat treatment depend on the duration and temperature of the treatment, with the latter temperature being the main factor [
24].
At low temperatures of between 20 and 150 °C, wood dries, starting with the loss of free water and ending with the elimination of bound water [
26].
At temperatures of between 180 and 250 °C, wood undergoes important chemical transformations, and at temperatures higher than 250 °C, carbonization begins through the formation of carbon dioxide and other pyrolysis products [
26].
Hemicelluloses are structural components that are thermally affected even at low temperatures. Degradation begins with deacetylation, and the acetic acid released acts as depolymerization catalyst that increases polysaccharide decomposition [
26].
The carbohydrate contents decrease with the severity of the treatment and this decrease depends on the wood species. At a high temperature (230 °C), the xylose and mannose contents decrease and arabinose and galactose are removed [
27].
Above 150 °C, the strength of the wood begins to decrease; the wood becomes more brittle and bending and tensile strengths decrease by 10–30% [
23].
Esteves et al. [
23] performed heat treatments on beech wood with and without oxygen and concluded that the modulus of elasticity decreases significantly for mass loses of 8–10%.
Havreljuk et al. [
4] tested beech wood at temperatures between 200 and 260 °C and measured maximum decreases of 20% and 40% for the modulus of elasticity and bending strength, respectively.
Thermal modification at lower temperatures led to a lower mass reduction, associated mainly with the loss of volatiles and bound water. A higher mass loss was observed when samples were treated at temperatures above 150 °C due to the partial decomposition of hemicellulose and cellulose and also other changes in the chemical structure of the thermally modified wood [
4,
6]. The intensity of thermic degradation (mass loss) in sycamore was greater than that for spruce wood. This can be explained through the differences in the chemical composition of hardwoods and softwoods; hardwoods contain slightly more hemicelluloses (25%) compared to softwoods (20%), which are the least resistant to thermal degradation [
26,
27].
5. Conclusions
This topic is relevant because interest in heat treatment processes is growing due to decreases in sawn timber production and an increase in demand for sustainable construction materials.
With an increase in the degree of torrefaction, particularly the torrefaction temperature, the water affinity characteristics (water absorption and swelling in thickness after 2 and 24 h) of the two wood species studied improved significantly.
The strength of all torrefied wood samples decreased slightly, with maximum values of 32.3% in static bending, 41.5% in compression and 19% in traction parallel to the fibers.
The greatest decrease was observed for the Brinell hardness of spruce wood (81.3% on the tangential side and 63.8% on the radial side) compared to that of maple wood (49.5% on the tangential side and 39.8% on the radial side).
In compressive strength tests parallel to the fibers, failure of the specimens was predominantly caused by sliding of the layers due to shear force for natural wood and by longitudinal detachment of the layers for torrefied wood.
Given that the standard deviation values are small, the data points are naturally tightly clustered around the mean.
