Article

Integration of ANN and RSM to Optimize the Sawing Process of Wood by Circular Saw Blades

Faculty of Furniture Design and Wood Engineering, Transilvania University of Brasov, B-dul Eroilor nr. 29, 500036 Brasov, Romania
*
Author to whom correspondence should be addressed.
Appl. Sci. 2025, 15(18), 10206; https://doi.org/10.3390/app151810206 (registering DOI)
Submission received: 4 August 2025 / Revised: 16 September 2025 / Accepted: 17 September 2025 / Published: 19 September 2025

Abstract

Various parameters, like blade design, rotational speed, feed speed, tooth geometry, wood moisture content, and wood species, influence the efficiency and quality of sawing processes. Knowing the optimal combination of these factors could lead to lower power consumption and high surface quality during wood processing. Therefore, in this study, we applied a novel method that could be used to optimize the cutting of wood with circular saw blades. The analyzed factors included rotational speed, feed speed, blade type (the number of cutting teeth and blade geometries), and two wood species, such as beech and spruce. The samples were cut longitudinally using two circular saw blades. The power consumption and the roughness of the processed surfaces were experimentally measured using an active/reactive electrical power transducer and a DAQ connected to a computer and a diamond stylus roughness meter, respectively. Once the data were gathered and processed, an artificial neural network modeling technique was involved in designing two models: one model for the cutting power and the other for surface roughness. Both models are characterized by high values of performance indicators. Therefore, the models could be considered a reliable tool that could be used to predict the cutting power and the surface roughness for the cutting of wood with circular saw blades. Next, response surface methodology was used to identify how each factor affects the cutting power and the surface quality, and to find the optimal values for both. The results showed that the most important factor that influences the roughness of the processed surfaces is the feed speed; the second factor is the blade rotation speed; the third factor is the tool type (the number of cutting teeth combined with their geometry). The optimal machining conditions recommended by the optimization algorithm (low power consumption and low roughness) imply minimum feed speed values (3.5 m/min) and medium (4500 rpm for 54-tooth blade) or high (6000 rpm for 24-tooth blade) blade rotation speeds. A further study will be conducted to consider the behavior of wood species during the circular sawing of wood and to clarify the influence of the different constructive parameters of the blades (number of teeth, tooth geometry) on their performance.

1. Introduction

Research on circular saw blade cutting conditions reveals significant impacts on wood surface quality, power or energy consumption, tool wear, and temperature distribution of the saw blade surface, and its influence on dynamic stability of the saw blades. Various parameters, including blade design, cutting speed, feed speed, tooth geometry, wood moisture content, and wood species, influence the efficiency and quality of the sawing processes.
Pahlitzsch and Friebe [1] studied how cutting conditions affect the sawn wood surface quality using circular saw blades. According to their study, it turned out that surface quality depends on saw blade vibrations, cutting parameters (cutting speed, cutting feed, cutting height), and wood texture, while roughness slightly increases with higher axial vibration amplitudes of the saw blade and grows with increasing feed per tooth. Greater blade protrusion lowers the vibrations but increases the roughness due to near-perpendicular wood fiber cuts. Beech and pine show a similar surface quality, but higher cutting speeds improve the results.
The study of Hutton et al. [2] examined how the bevel angle of circular saw blade teeth affects cutting accuracy, surface finish, and sawdust quality. Cutting tests showed that bevel angle significantly influenced blade displacement, machined surface quality, and sawdust fiber characteristics. A 15° bevel angle produced accurate cuts, smooth surfaces, and longer sawdust fibers—more suitable for pulping—compared to conventional teeth designs.
Moraes de Souza et al. [3] examined the influence of machining parameters on the specific cutting energy consumption by circular sawing of Eucalyptus sp. from two stands. Higher cutting speeds, lower feed rates, and a higher number of teeth of the circular saw blade consumed more specific energy. The combination of a cutting speed of 46 m/s, a feed speed of 17 m/min, and 20 or 24 teeth of the circular saw blade produced lower specific energy consumption results.
In their paper, Wasielewski et al. [4] studied how to achieve a decrease of both raw material and energy losses when ripping wood with circular saws. Their detailed analysis looked at the chip transportation in the gullet, the saw blade stiffness, the saw blade movement, and the workpiece feeding accuracy. Thanks to the application of pro-ecological technology with circular saw blades of a new design (“Ekomultiks”), in the examined industrial case, the following results were achieved: an increase of about 18% in the amount of side lumber, roughly 16% less sawdust (as an effect of kerf reduction), and about 16% lower values of the cutting power consumption. Unfortunately, the constructive details of the new “Ekomultiks” circular saw blades were only revealed to a small extent.
Cristóvão et al. [5] examined power consumption when sawing Pinus sylvestris L. with a double arbor circular saw, comparing climb- and counter-sawing under typical conditions in two Swedish sawmills. Power use rose by 11–35% over an 8-h shift, mainly due to increased tooth wear. The study also showed that climb-sawing consumed more power than counter-sawing.
Kminiak [6] investigated the effect of tooth number and chip thickness-limiting design on surface quality during the cross-cutting of spruce using carbide-tipped circular saw blades. Four blades with the same diameter and identical geometry were tested—three with different tooth numbers and one with a chip thickness-limiting design. The results showed that increasing the number of teeth improved surface quality, with roughness (Ra) values ranging from 18 μm to 4 μm. The chip thickness-limiting blade produced the smoothest surfaces, highlighting its effectiveness in enhancing cut quality.
In another study, Kminiak et al. [7] examined how tool wear in circular saw blades with varying tooth counts (24, 40, and 60) affects the surface quality of beech wood during transversal sawing. Surface quality was assessed using the Ra roughness parameter. A constant feed force of 15N simulated manual sawing. Among the blades, the 40-tooth saw provided the best performance, combining the longest cutting distance with moderate wear and good surface quality. Roughness values ranged from 3.9 to 14.5 µm and increased with the cutting distance. However, greater tool wear did not clearly degrade the surface quality.
Li et al. [8] investigated how sawtooth side edge geometry affects surface roughness in rip-sawing Fraxinus spp. wood. Using nine sawtooth types with varying radial clearance angles and feed speeds, the research showed that roughness increases with feed speed, and smaller radial clearance angles yield smoother surfaces. Saw teeth with mic-zero-degree radial clearance angles produced notably lower roughness, especially when the straight length of the zero-degree radial clearance is about 1 mm. Additionally, if all other cutting conditions stay the same, increasing the feed speed can reduce friction between the tooth side edges and the wood, leading to improved surface smoothness.
Andrade et al. [9] evaluated machined surface quality and specific cutting energy consumption in Khaya ivorensis and Khaya senegalensis circular sawing under various machining conditions, for both longitudinal- and cross-cutting. Lower cutting speeds led to reduced energy consumption in both species, with K. ivorensis requiring less energy overall. Improved surface quality was achieved using reduced feed rates and increased rotation speeds. While lower feed speeds enhanced the surface quality for both species, higher cutting speeds yielded the best finish. Surface roughness differences between the two African mahoganies were not statistically significant.
Based on a significant number of bibliographic references, Fragassa et al. [10] proposed a series of optimal parameters, both constructive and for working regimes, for circular saw blades used in the processing of wood and some wood-based materials. The following were considered: blade speed, cutting speed, feed per tooth, number of teeth in simultaneous contact with the cut material, length of the tooth trajectory through the cut material, cutting edge geometry, and thickness of the blade body.
Nasir and Cool [11] investigated how feed speed, rotation speed, depth of cut, and chip thickness affect power consumption and waviness when sawing green Douglas fir. The cutting power and waviness increased with the feed speed. A higher rotation speed raised the power use but reduced waviness. Waviness was greater at the board top due to higher saw blade deflection near the rim. For the same chip thickness, low-speed cutting was more energy-efficient, while high-speed cutting improved the surface quality by reducing waviness.
Krilek et al. [12] examined how irregular tooth pitch affects energy consumption during the cross-cutting of spruce (Picea abies), pine (Pinus sylvestris), and beech (Fagus sylvatica) using circular saw blades with a diameter of 350 mm, with sintered carbide tips. Two blade types—one with an irregular tooth pitch—were tested at feed speeds of 4, 8, and 12 m/min and 3000 rpm. The results showed that the blades with an irregular tooth pitch consumed more energy, with beech requiring the highest cutting power. The cutting power increased linearly with the feed speed across all wood types.
In their work, Kováč et al. [13] examined how cutting conditions affect wood cross-cutting using circular saws. Two blade types—sintered carbide (with 54 teeth) and high-speed steel (with 56 teeth)—were tested on spruce (Picea abies) and beech (Fagus sylvatica). Both blades had 600 mm diameter and 20° rake angle teeth. The cutting speeds used were 60, 70, and 80 m/s, and the feed speeds were 6 and 12 m/min. The blades had three physical vapor deposition (PVD) coatings: AlTiN, AlTiCrN, and AlTiCrSiN. The research showed that the least energy-intensive setup used an AlTiN-coated blade at 60 m/s and 12 m/min, consuming approximately 1300 W. The blade type significantly influenced torque, with each parameter uniquely affecting the sawing process.
Nasir and Cool [14] studied the cutting power and waviness during the circular sawing of kiln-dried, green, and frozen western hemlock (Tsuga heterophylla Raf.) and amabilis fir (Abies amabilis Dougl.) under varying feed and rotation speeds. An analysis of variance (ANOVA) showed that feed speed most affected cutting power, followed by wood condition. A decision tree model (R2 = 0.89) confirmed this, but poorly predicted waviness. The moisture content effects in the cutting power and waviness was nonlinear. Frozen wood required the most cutting power; dry and green wood showed no major difference. Dry wood had the highest waviness. Higher rotation speeds increased cutting power but improved surface quality by reducing waviness.
Pałubicki et al. [15] investigated the relationship between feed rate, feed force, and sawdust particle size during the circular sawing of particleboard at feed rates of 12, 18, and 24 m/min. A positive correlation was found between the feed rate and the feed force. Additionally, increased feed forces due to blunting of the tools were noticed, with faster tool dulling at higher rates. Contrary to the existing literature, finer sawdust increased with higher feed rates, likely due to greater tool wear. For minimal tool wear and reduced fine dust, lower feed rates—particularly 12 m/min—are recommended for the safer and more efficient sawing of particleboards.
The paper by Kvietková and Gašparík [16] dealt with the effect of the number of teeth of the circular saw blade and the sawn length on the surface roughness of European oak (Quercus robur L.) after transversal circular cutting. An additional goal was to determine the maximum sawn length for each type of saw blade up to the point where the saw blade overheated, causing blackening of the wood surface. Their research showed that the highest surface roughness was obtained with the blade with the fewest teeth, and the lowest roughness with the blade with the most teeth. As the sawn length increased, the roughness values gradually increased, most probably due to the gradual blunting of the tool.
The paper by Đukić et al. [17] analyzed machined surface roughness after circular saw cutting and explored fast Fourier transform (FFT) as a simple method to isolate the influence of the saw blade and teeth. It modeled surface roughness as a combination of periodic signals and Gaussian noise. FFT filtering effectively extracts tool-related frequency components, with inverse FFT used to return to the time domain. Tests on oak wood (Quercus robur L.) and medium density fiberboard (MDF) confirmed the theory. The results show that combining FFT with standard roughness parameters offers a clearer understanding of tool impact on surface roughness across different materials and cutting conditions.
Svoren et al. [18] studied how feed speed, cutting speed, and chip thickness affect energy use and blade temperature when cutting the spruce wood (Picea excelsa). They tested three circular saw blades—one standard and two with improved design, including a powder-coated version. Higher feed speeds increased the cutting power and the blade’s temperature, with peak heat at the blade’s outer edge. The powder-coated blade used the least energy and heated the least.
Fekiač et al. [19] studied the effects of feed speed, average chip thickness, and blade surface treatment on the energy consumption and surface temperature of a circular saw blade during the cutting process of plywood. The results showed that the cutting power and the surface temperature of the circular saw blade increased when the feed speed and average chip thickness increased. In addition, it was found that the circular saw blade with powder coating surface treatment recorded lower energy consumption and lower temperature during cutting.
Hao et al. [20] explored how sawing parameters affect specific cutting energy (in J/m3) and surface roughness, using saw blade speed as a control variable. Their study aimed to optimize these parameters for minimal energy consumption and improved surface quality. The results indicated that increasing rake angle and spindle speed reduce both specific energy consumption and roughness, while a higher feed rate lowers specific cutting energy but increases roughness. An ANOVA analysis highlights sawing speed as the most influential factor in specific cutting energy for oak processing.
An interesting approach was carried out by Garrido et al. [21] in their study on the circular saw cutting quality of three distinct types of particleboards (PBs). Response surface methodology (RSM) was used to optimize the sawn PB edge quality, specific cutting energy, and feed per tooth as response variables when influenced by such factors as feed speed and circular saw blade rotation speed. The experimental results showed that the specific cutting energy decreases with increasing feed rate (and feed per tooth) and increases with increasing cutting speed, while the quality of the machined edge decreases with increasing cutting speed and feed per tooth.
The optimization of machining processes has long been a subject of research in manufacturing science, where the dual objectives of efficiency and quality must be achieved under conditions of increasing material and energy constraints. Classical statistical approaches, such as the Taguchi method and response surface methodology (RSM), have provided systematic frameworks for experimental design and process modeling, enabling researchers to identify influential factors and approximate optimal operating conditions with relatively few experimental trials. More recently, computational intelligence techniques, particularly artificial neural networks (ANNs), have been introduced to address the nonlinear and multivariate nature of machining systems, offering superior predictive capabilities where traditional models fall short. The sawing of wood by circular blades presents a particularly complex optimization problem, given the variability of the material, the dynamic interactions of cutting parameters, and the trade-offs between productivity, surface quality, and energy consumption. In this context, the integration of an ANN with RSM represents a promising methodological advancement: RSM ensures structured experimentation and interpretable response modeling, while an ANN enhances predictive accuracy in highly nonlinear domains. Together, these methods provide a comprehensive and robust framework for optimizing the sawing process, advancing both theoretical understanding and practical application in wood machining.
Previous studies have demonstrated the effectiveness of both RSM and ANNs when applied individually to machining optimization problems. RSM has been widely used in metal cutting research to establish empirical models linking cutting parameters—such as feed rate, cutting speed, and depth of cut—to key responses including surface roughness, cutting forces, and energy consumption. Its structured experimental design and polynomial regression models have enabled researchers to approximate optimal process windows with reasonable accuracy. Conversely, ANNs have been increasingly adopted for their capacity to model highly nonlinear behaviors inherent in machining operations, particularly where material heterogeneity and dynamic cutting interactions challenge conventional regression approaches. More recently, hybrid frameworks combining RSM with ANNs or with metaheuristic optimization algorithms have been proposed in metal and other materials processing (Buldum et al. [22], Varatharajulu et al. [23], Kulisz et al. [24], Marakini et al. [25], Ren et al. [26], Song et al. [27], Naresh et al. [28], and Meddour et al. [29]), demonstrating that such integrations enhance predictive accuracy, reduce experimental costs, and provide more reliable optimization outcomes. Despite these advances, limited attention has been directed toward the integration of ANNs and RSM in the context of wood sawing with circular blades, where the inherent anisotropy of wood and the complexity of blade–material interactions present unique challenges. Therefore, the novelty of this work consists in the integration of artificial neural networks together with response surface methodology to modeling and optimizing solid wood cutting with circular saw blades.
This methodology was successfully applied in the drilling of wood and wood-based materials [30,31]. The proposed method (ANN + RSM) can be applied in principle to any mechanical process by modifying the input and output parameters, which differ depending on the specific characteristics of each process. For example, for drilling [30], the type of drill bit, the drill tip angle, the feed speed, and the feed per tooth were chosen as input parameters, with the output parameters being the drilling torque and the delamination factors at the entrance and exit of the drill in and out of the material. In the present case, the input factors will be the wood species, tool rotation speed, feed rate, and blade type (number of teeth combined with other geometric characteristics), while the output parameters are the power consumed during processing and the roughness of the processed surfaces. To sum up, this methodology seeks to develop one or more models using artificial neural network (ANN) modeling techniques. Once the models are validated, they are used to optimize the analyzed process through RSM. Based on the obtained results, it could be stated that the proposed methodology represents a valuable tool to study and to optimize the cutting of wood with circular saw blades.

2. Materials and Methods

2.1. Experimental Part

Two wood species were selected for the experimental study: beech (Fagus sylvatica) and spruce (Picea abies).
Samples with dimensions 600 × 100 × 18 mm were used. The dimensions of the specimens were chosen so that they could be handled and processed appropriately, and the desired measurements could be made (power consumed during processing and surface roughness). The average moisture content of the wood specimens, measured with a resistive moisture meter type FMD6 from Brookhuis (Enschede, The Netherlands), was 8.56% for the beech and 8.11% for the spruce. The average densities of the wood samples were 604.3 kg/m3 for the beech and 456.3 kg/m3 for the spruce. The samples were cut longitudinally using two circular saw blades (190 mm in diameter) with different characteristics. One with 24 cutting teeth, the teeth wedge angle β = 60°, the clearance angle α = 10°, and the hook angle γ = 20°. This saw blade had alternate top bevel teeth with the inclination angle λ = 15° (as shown in Figure 1a). The second saw blade had 54 cutting teeth, with wedge angle β = 65°, clearance angle α = 10°, and the hook angle γ = 15° (as shown in Figure 1b). This saw blade had flat top teeth. Both saw blades had the kerf b = 2.3 mm.
To ensure a wider field of applicability of this study, the choice of circular saw blades took into account the manufacturers’ indications regarding the intended use of these tools. It is known that manufacturing companies recommend saw blades with few teeth (large pitch) for coarse cuts, and saw blades with many teeth (small pitch) for fine cuts.
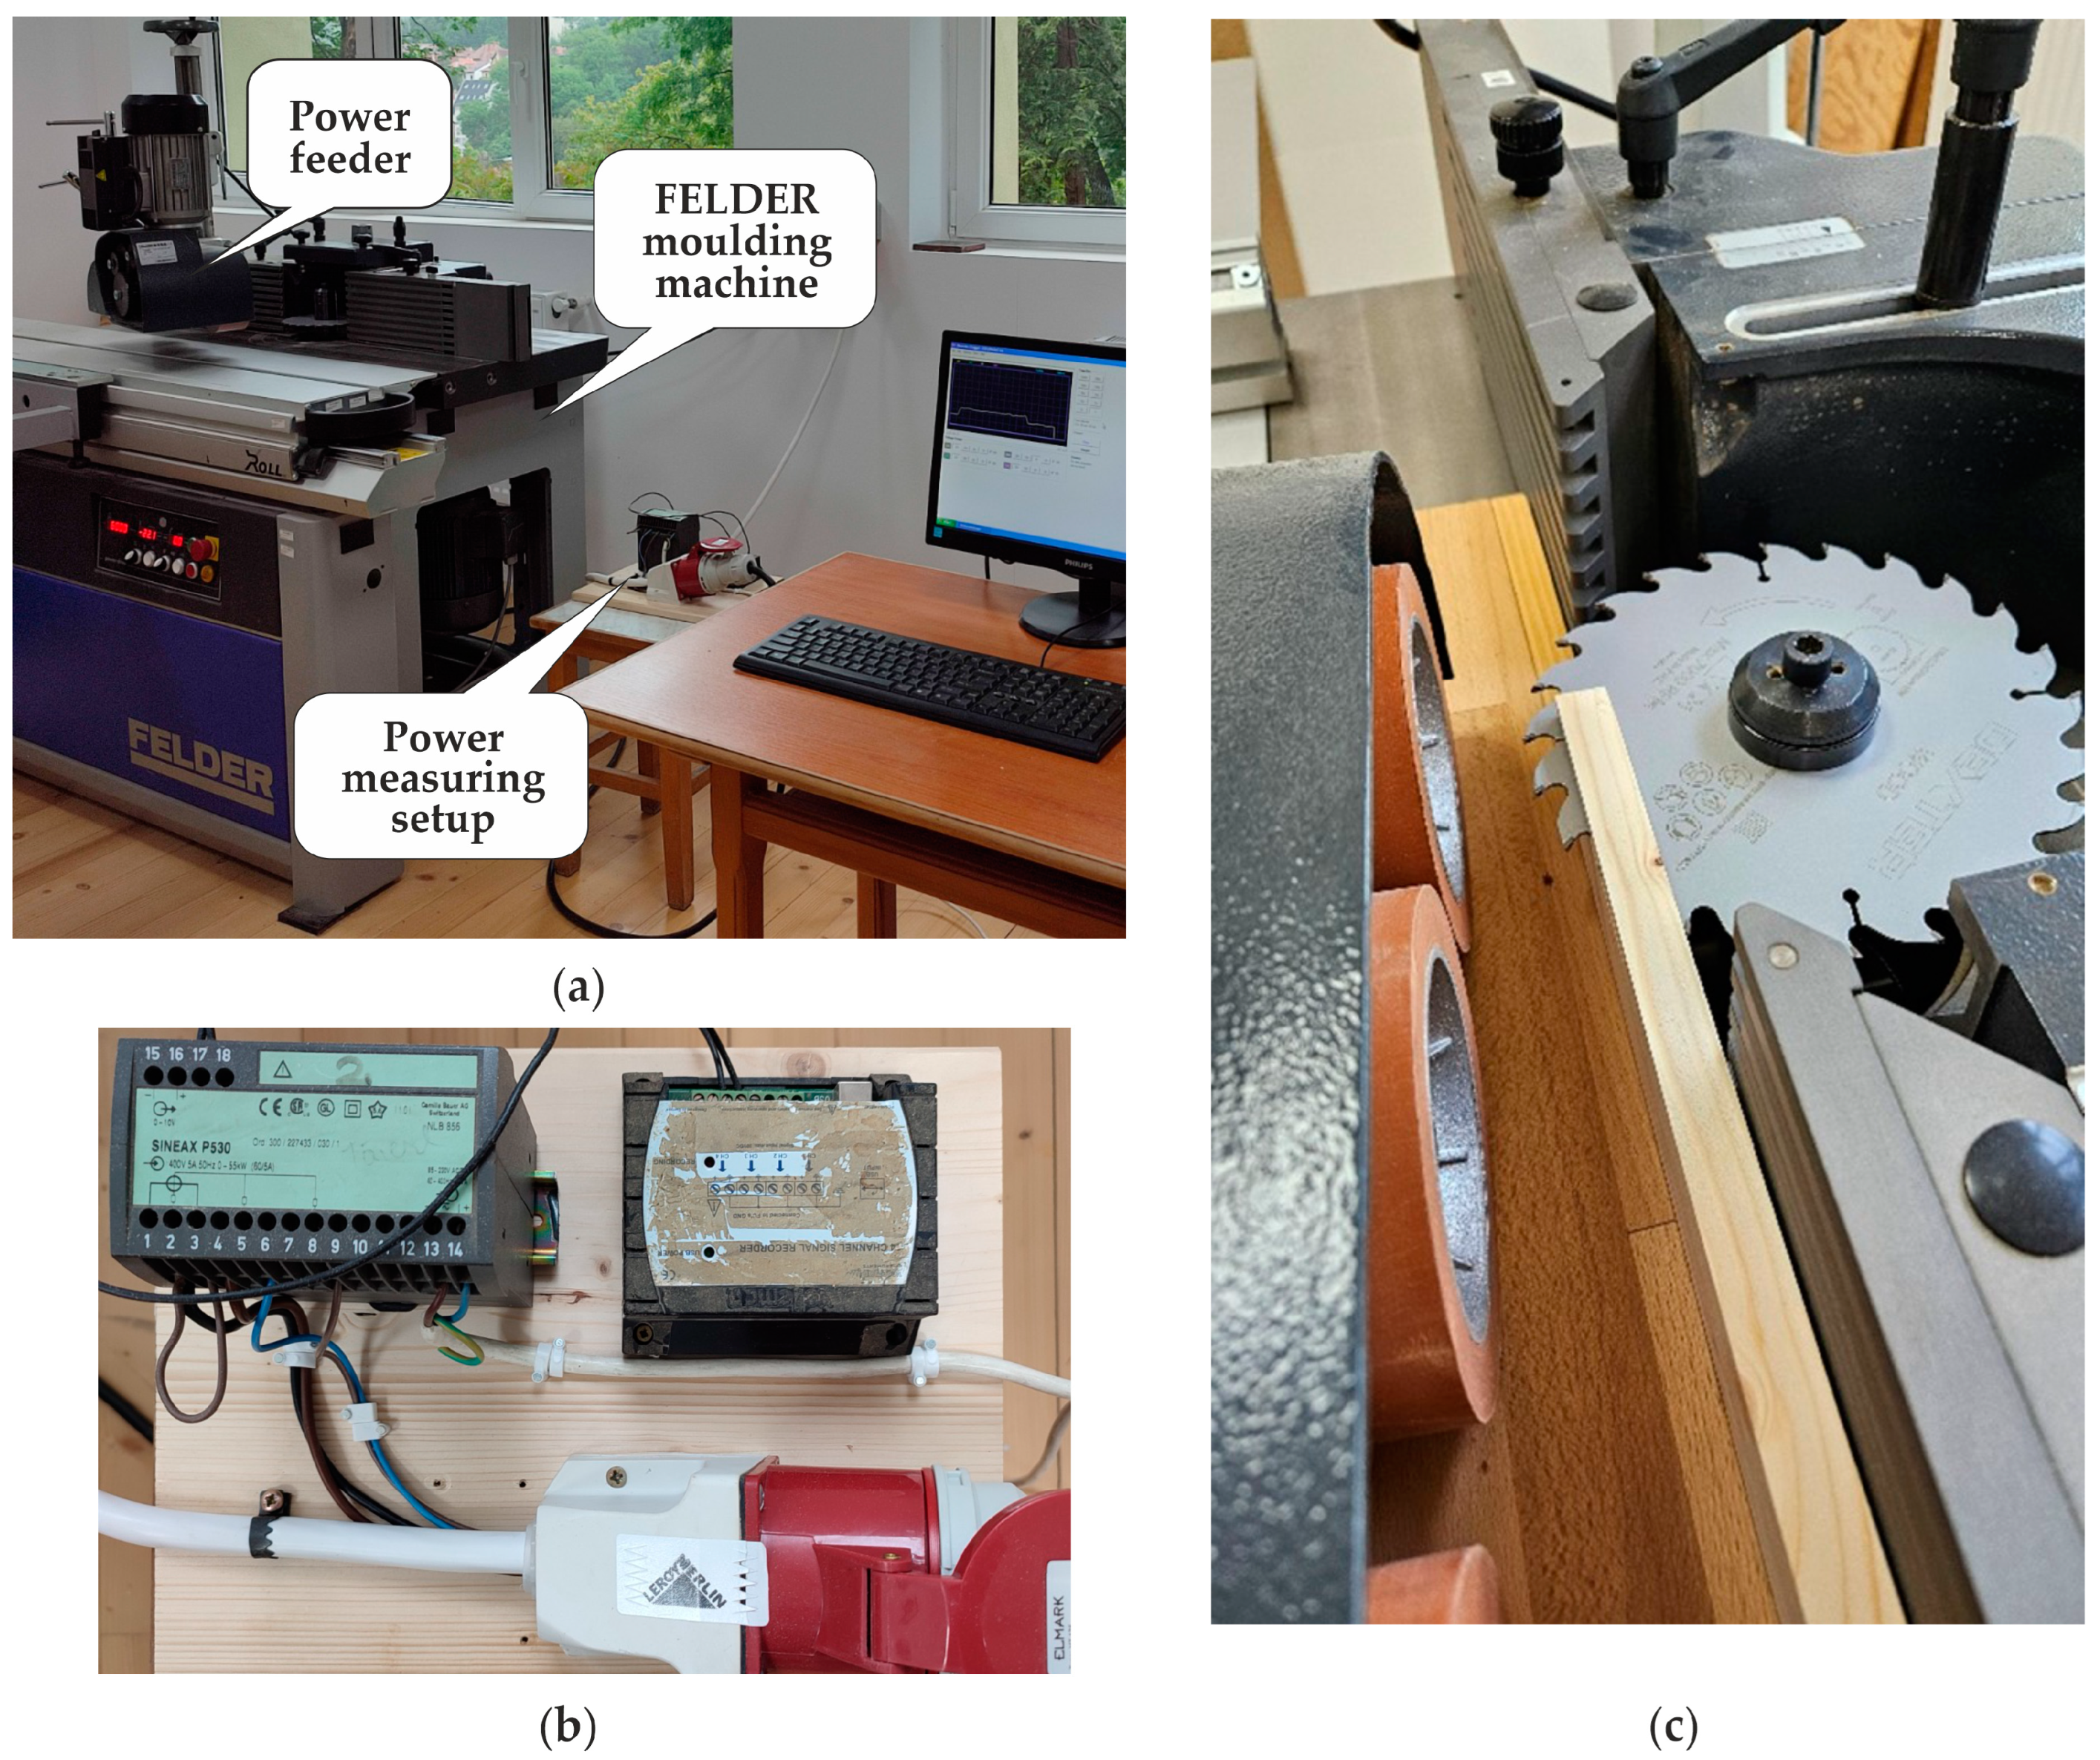
Because circular saws usually have a single spindle rotation speed, the machining was performed using a spindle moulder machine type, FELDER F 900 M, from FELDER KG (Hall in Tirol, Austria) (with 5 selectable rotation speeds (3500, 4500, 6000, 8000, and 10,000 rpm) and a moulder spindle of 30 mm in diameter (Figure 2). An industrial power feeder (FELDER KG) was used to ensure a uniform feed speed. The values of the feed speed were (vf) = 3.5, 7, 13.5, and 27 m/min, and the blade rotation speeds were n = 3500, 4500, and 6000 rpm.
Using the FELDER spindle moulder machine introduced two constraints regarding the dimensions of the circular blades. Due to the machine’s protective and exhaust hood, the blades diameter was limited to 190 mm (see Figure 2c), and the blades bore diameter had to respect the diameter of the machine’s tool holder mandrel (30 mm).
The samples were cut into lamellae with dimensions of 8 mm thickness, 18 mm width, and 600 mm length (Figure 2c). The cutting operations were performed using various cutting regimes, determined by the combination of two circular saw blades, three rotational speeds, and four feed rates. In total, 24 cutting regimes were applied for each wood species (2 blades × 3 rotational speeds × 4 feed rates). During each cut, the active power consumption of the spindle motor was recorded.
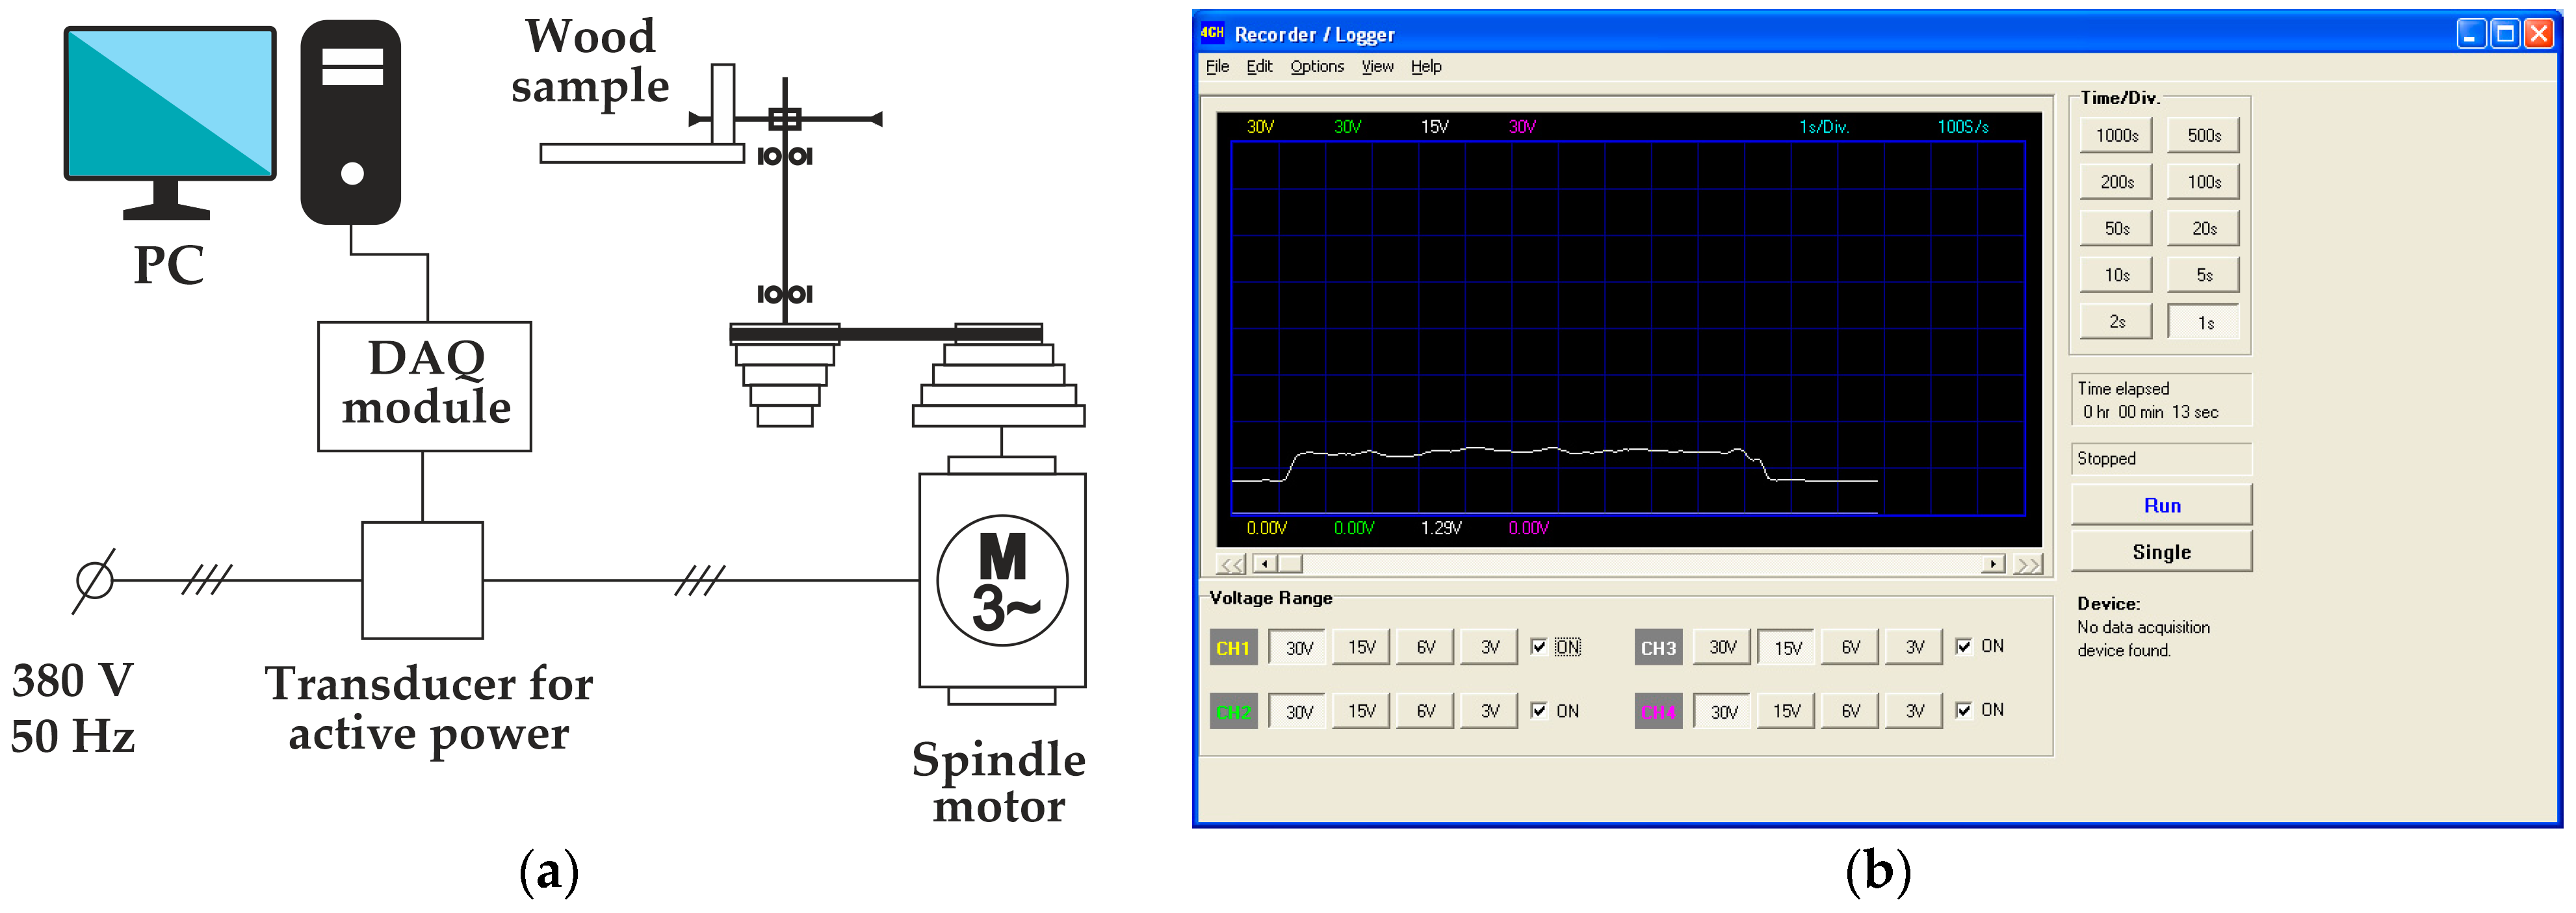
To accurately measure the power consumption of the spindle motor, a Camille Bauer Sineax P530/Q531 Camille Bauer AG (Wohlen, Switzerland) transducer was used (Figure 3). This device is designed for the measurement of both active and reactive power in electrical systems, within Class 0.5 basic accuracy class, as defined by the international standard IEC 60688 [32] (maximum error of ±0.5% of the full-scale output value).
The data recording process was conducted using a Velleman data acquisition board (Velleman K8047, Velleman Instruments, Gavere, Belgium) and the PC-2000 software (v.1.01).
The active power associated with the spindle rotation (PT) comprises two components: the idle power consumption of the spindle (P0) and the power consumed for cutting the samples only (PC), which is measured in watts (W). The actual power consumed only for cutting the samples (PC) was calculated using Equation (1):
P C = P T P 0         [ W ]
Each 8 mm thick lamella was subsequently sectioned into 3 pieces of equal length (app. 200 mm) for surface quality measurement (Figure 4).
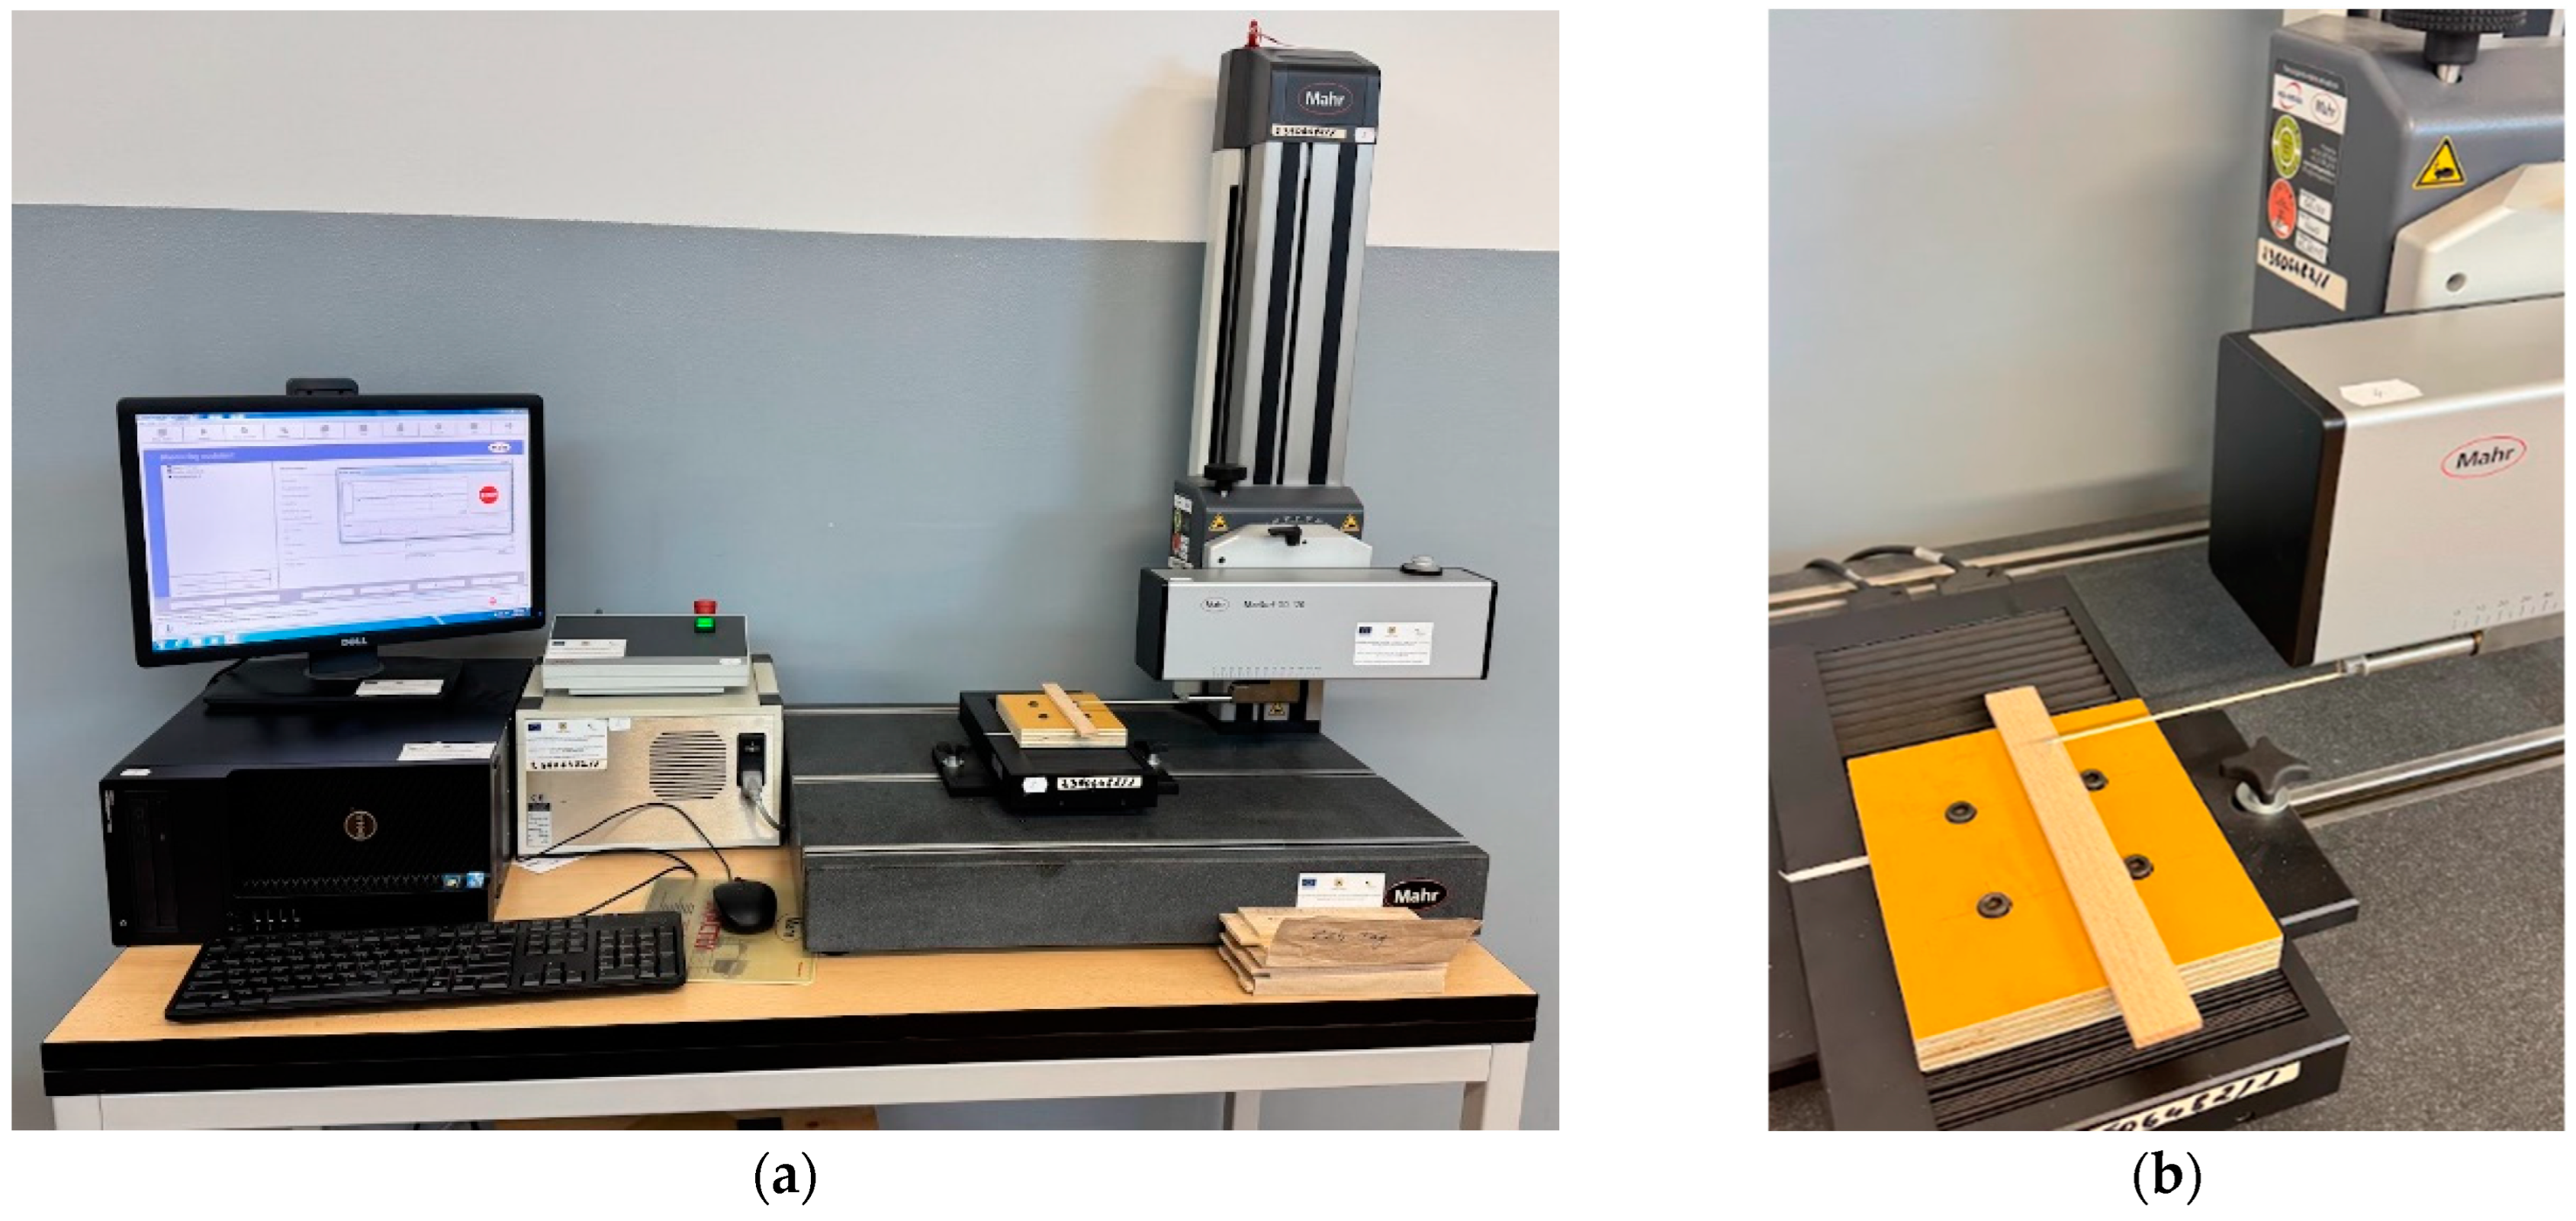
A surface analysis was performed using the MarSurf XT20 system from Mahr Göttingen GmbH (Göttingen, Germany), fitted with an MFW 250 scanning head (Figure 5a).
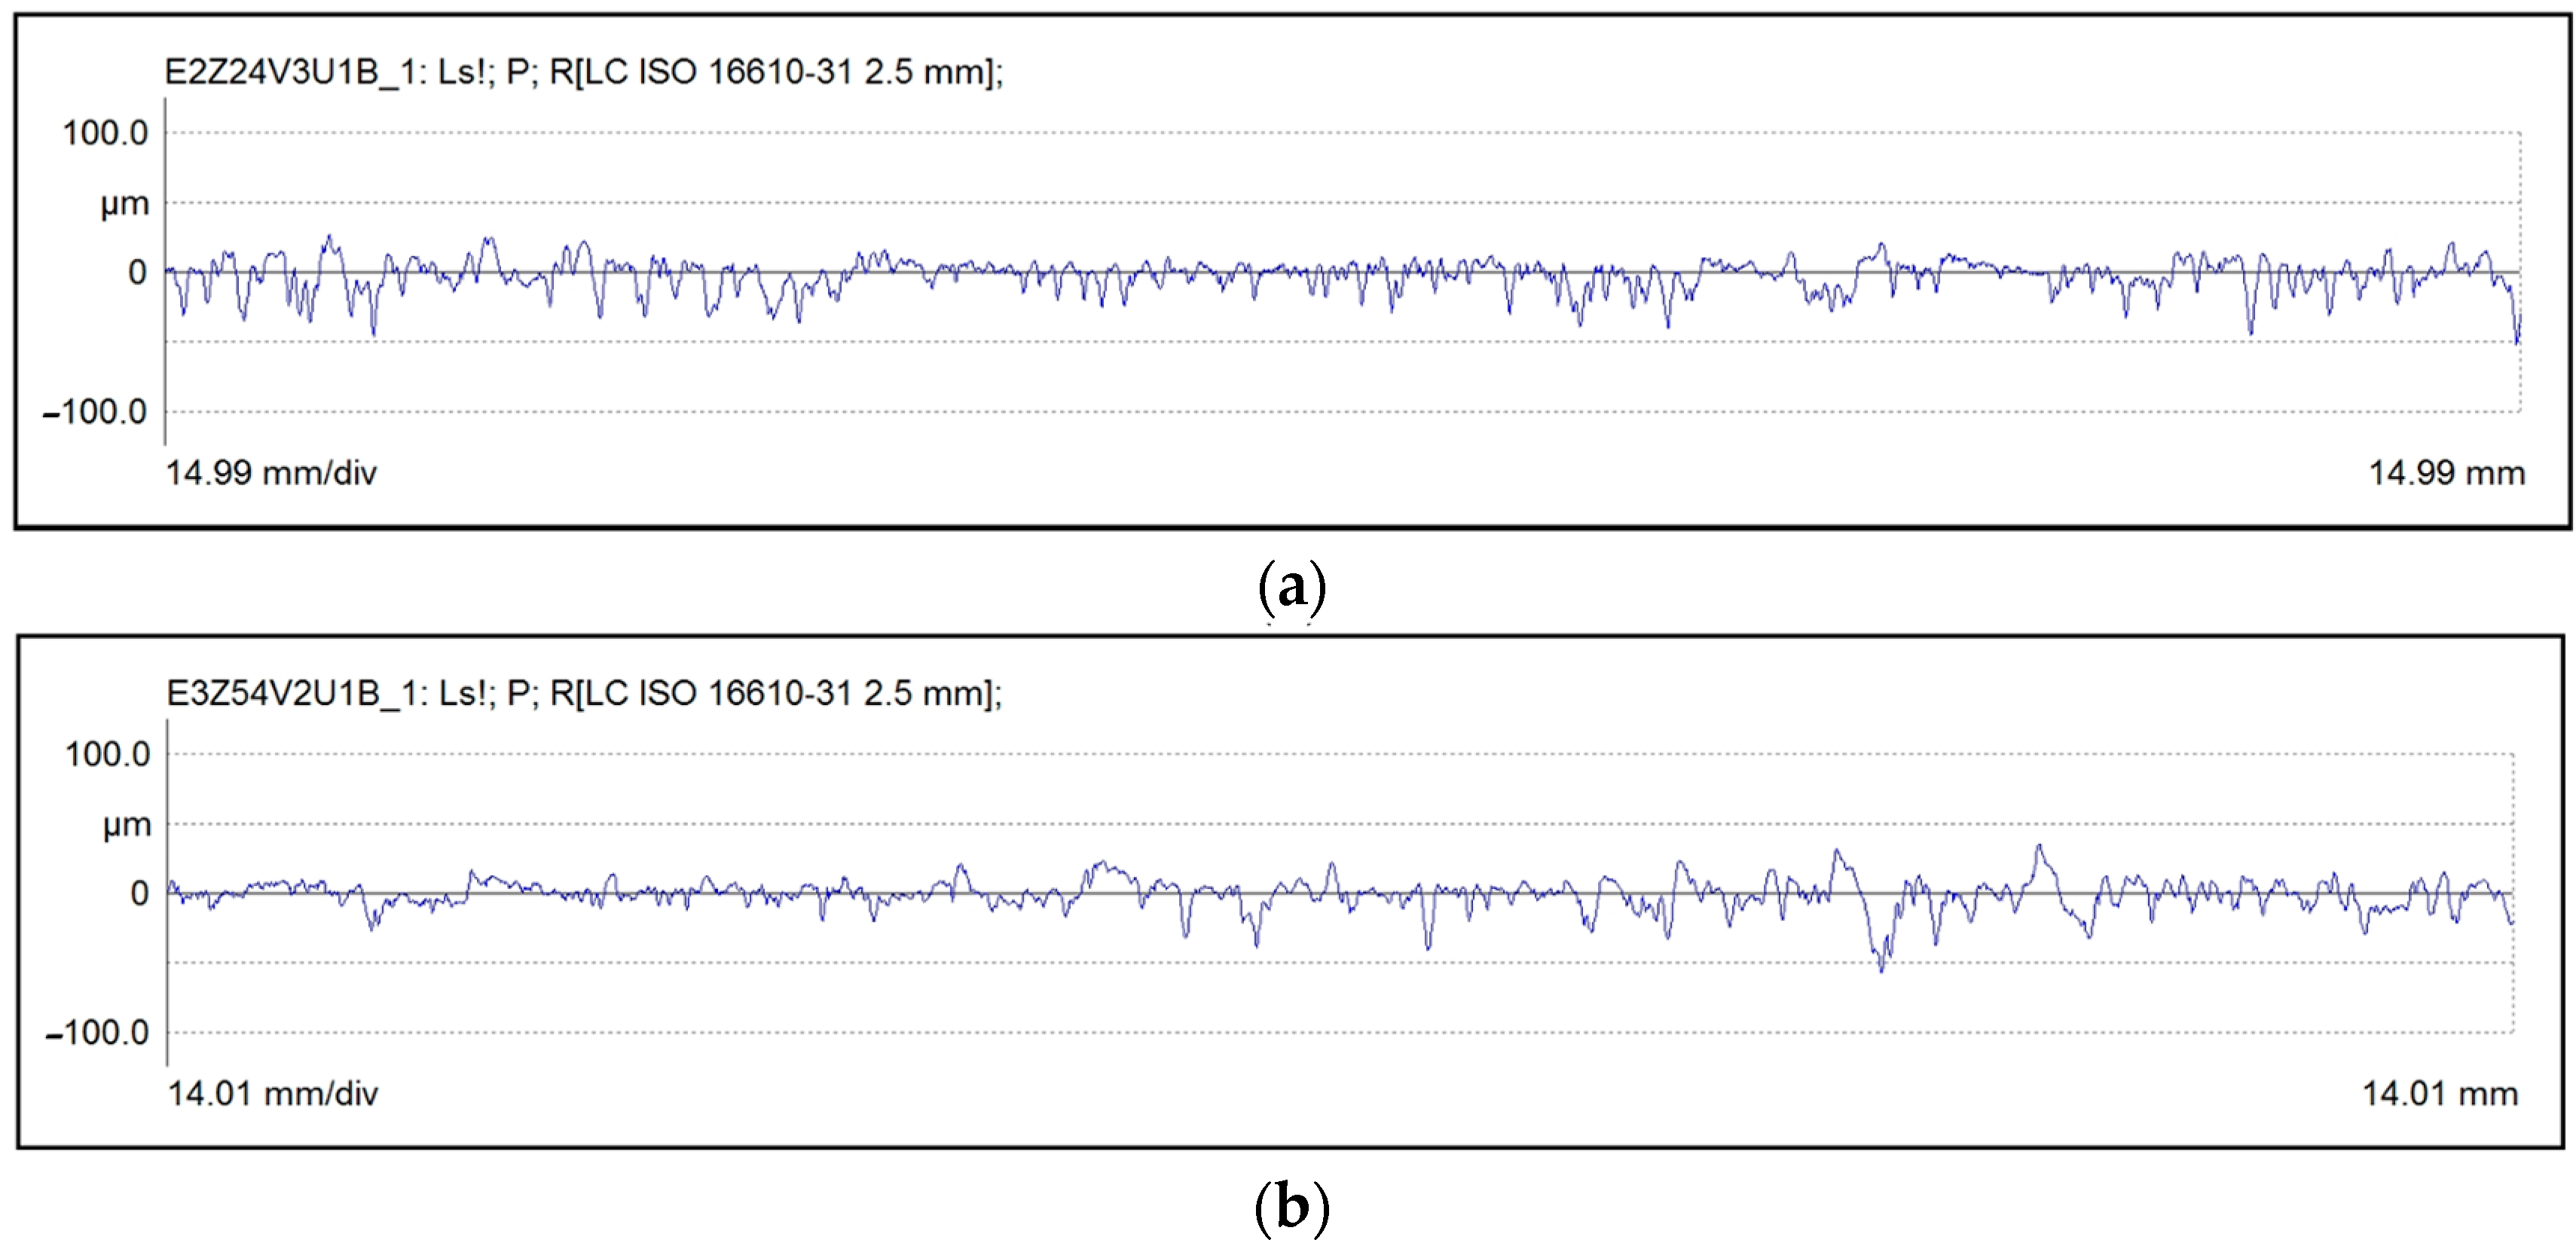
A sample of the roughness profile for the spruce wood, cut with a 24-teeth blade, 6000 rpm blade rotation speed, and 3.5 m/min feed speed is presented in Figure 6a. One more sample of the roughness profile for the beech wood, cut with a 54-teeth blade, 4500 rpm blade rotation speed, and 3.5 m/min feed speed is shown in Figure 6b.
The device is equipped with a tracing arm capable of a ±750 µm range and a stylus featuring a 2 µm tip radius and a 90° tip angle. The device has a vertical resolution of 7 nm and a lateral resolution of 0.5 μm. Scans were carried out at a speed of 0.5 mm/s, applying a contact force of 0.7 mN and a lateral resolution of 5 µm. For each sample and cutting parameter set, two 14 mm surface profiles were acquired (Figure 5b), with all measurements taken perpendicular to the grain direction.
The measured surface profiles were analyzed using MarWin XR 20 software (v. 9-23.) provided by the instrument manufacturer. The analysis began with the correction of form errors through polynomial curve fitting, which eliminated large-scale geometric deviations. This step allowed the primary profile to be obtained by subtracting the fitted curve from the original measurements, in accordance with ISO 21920-2:2021. The resulting profile included both waviness and roughness components, distinguished by their wavelength, the longer wavelengths corresponding to waviness and the shorter ones to surface roughness.
To isolate the roughness component from longer wavelength features, a robust Gaussian regression filter was applied following ISO 16610-31:2016 [33], using a 2.5 mm cut-off length, as recommended for wood surface evaluation [34,35]. From the filtered roughness profile, the arithmetical mean deviation (Ra) was calculated in accordance with ISO 21920-2:2021 [36].

2.2. Data Modeling

2.2.1. Artificial Neural Network Modeling

The experimental data set, which consists of 68 values, was divided into two subsets. One subset (48 values) was used to design the ANN models. The other subset (20 values) was used to validate the developed models. The performance indicators used to evaluate the designed models included the following [30]: coefficient of correlation (R) (Equation (2)), coefficient of determination (R2) (Equation (3)), root mean square error (RMSE) (Equation (4)), and the mean absolute percentage error (MAPE) (Equation (5)).
R = i = 1 n ( p i p ¯ ) ( a i a ¯ ) i = 1 n ( p i p ¯ ) 2     i = 1 n ( a i a ¯ ) 2
R 2 = 1 i = 1 n ( a i p i ) 2 i = 1 n ( a i p ¯ i ) 2
RMSE = 1 n i = 1 n ( a i p i ) 2
MAPE = 1 n ( i = 1 n [ a i p i a i ] ) × 100
The designed ANN models were obtained using NeuralWare’s Predict Software (v.3.24.1) (Predict), NeuralWare Inc., Carnegie, 239, PA, USA. Predict uses a cascade-correlation learning algorithm to reveal the number of neurons in the hidden layer. This algorithm starts with a minimum network and automatically adds new hidden units till the optimum configuration is achieved. More information about this software can be found in the literature [31,37,38].

2.2.2. Response Surface Methodology

The face central composite design (FCCD), which contains two numerical factors (blade rotation speed and feed speed) and two categorical factors (wood species and tool type), was generated using Design-Expert® Software (Version 9, Stat-Ease Inc., Minneapolis, MN, USA). Since, in this work, a face central composite design was used, the two-level factorial points (±1) and the axial points (±α) were equal to the minimum and maximum value of the analyzed numerical factors (Table 1). The center points (0) represent the midpoint (midrange) of the analyzed range of the numerical factor. The categorical factors were analyzed at two levels (Table 1). The resulting combinations of analyzed factors are presented in Table 2. The analyzed responses (dependent variables) were the cutting power and the surface roughness, which was quantified through the Ra parameter (Table 2). More information about the FCCD can be found in the literature [30].
The selected experimental design allows us to reveal the polynomial equations that best describes the relation between the analyzed factors and the dependent variables (responses). The coefficients of these equations are statically checked through ANOVA analysis. The Design-Expert® Software uses regression equations to find the optimal solutions of the analyzed process [37].

3. Results and Discussion

3.1. Experimental Data

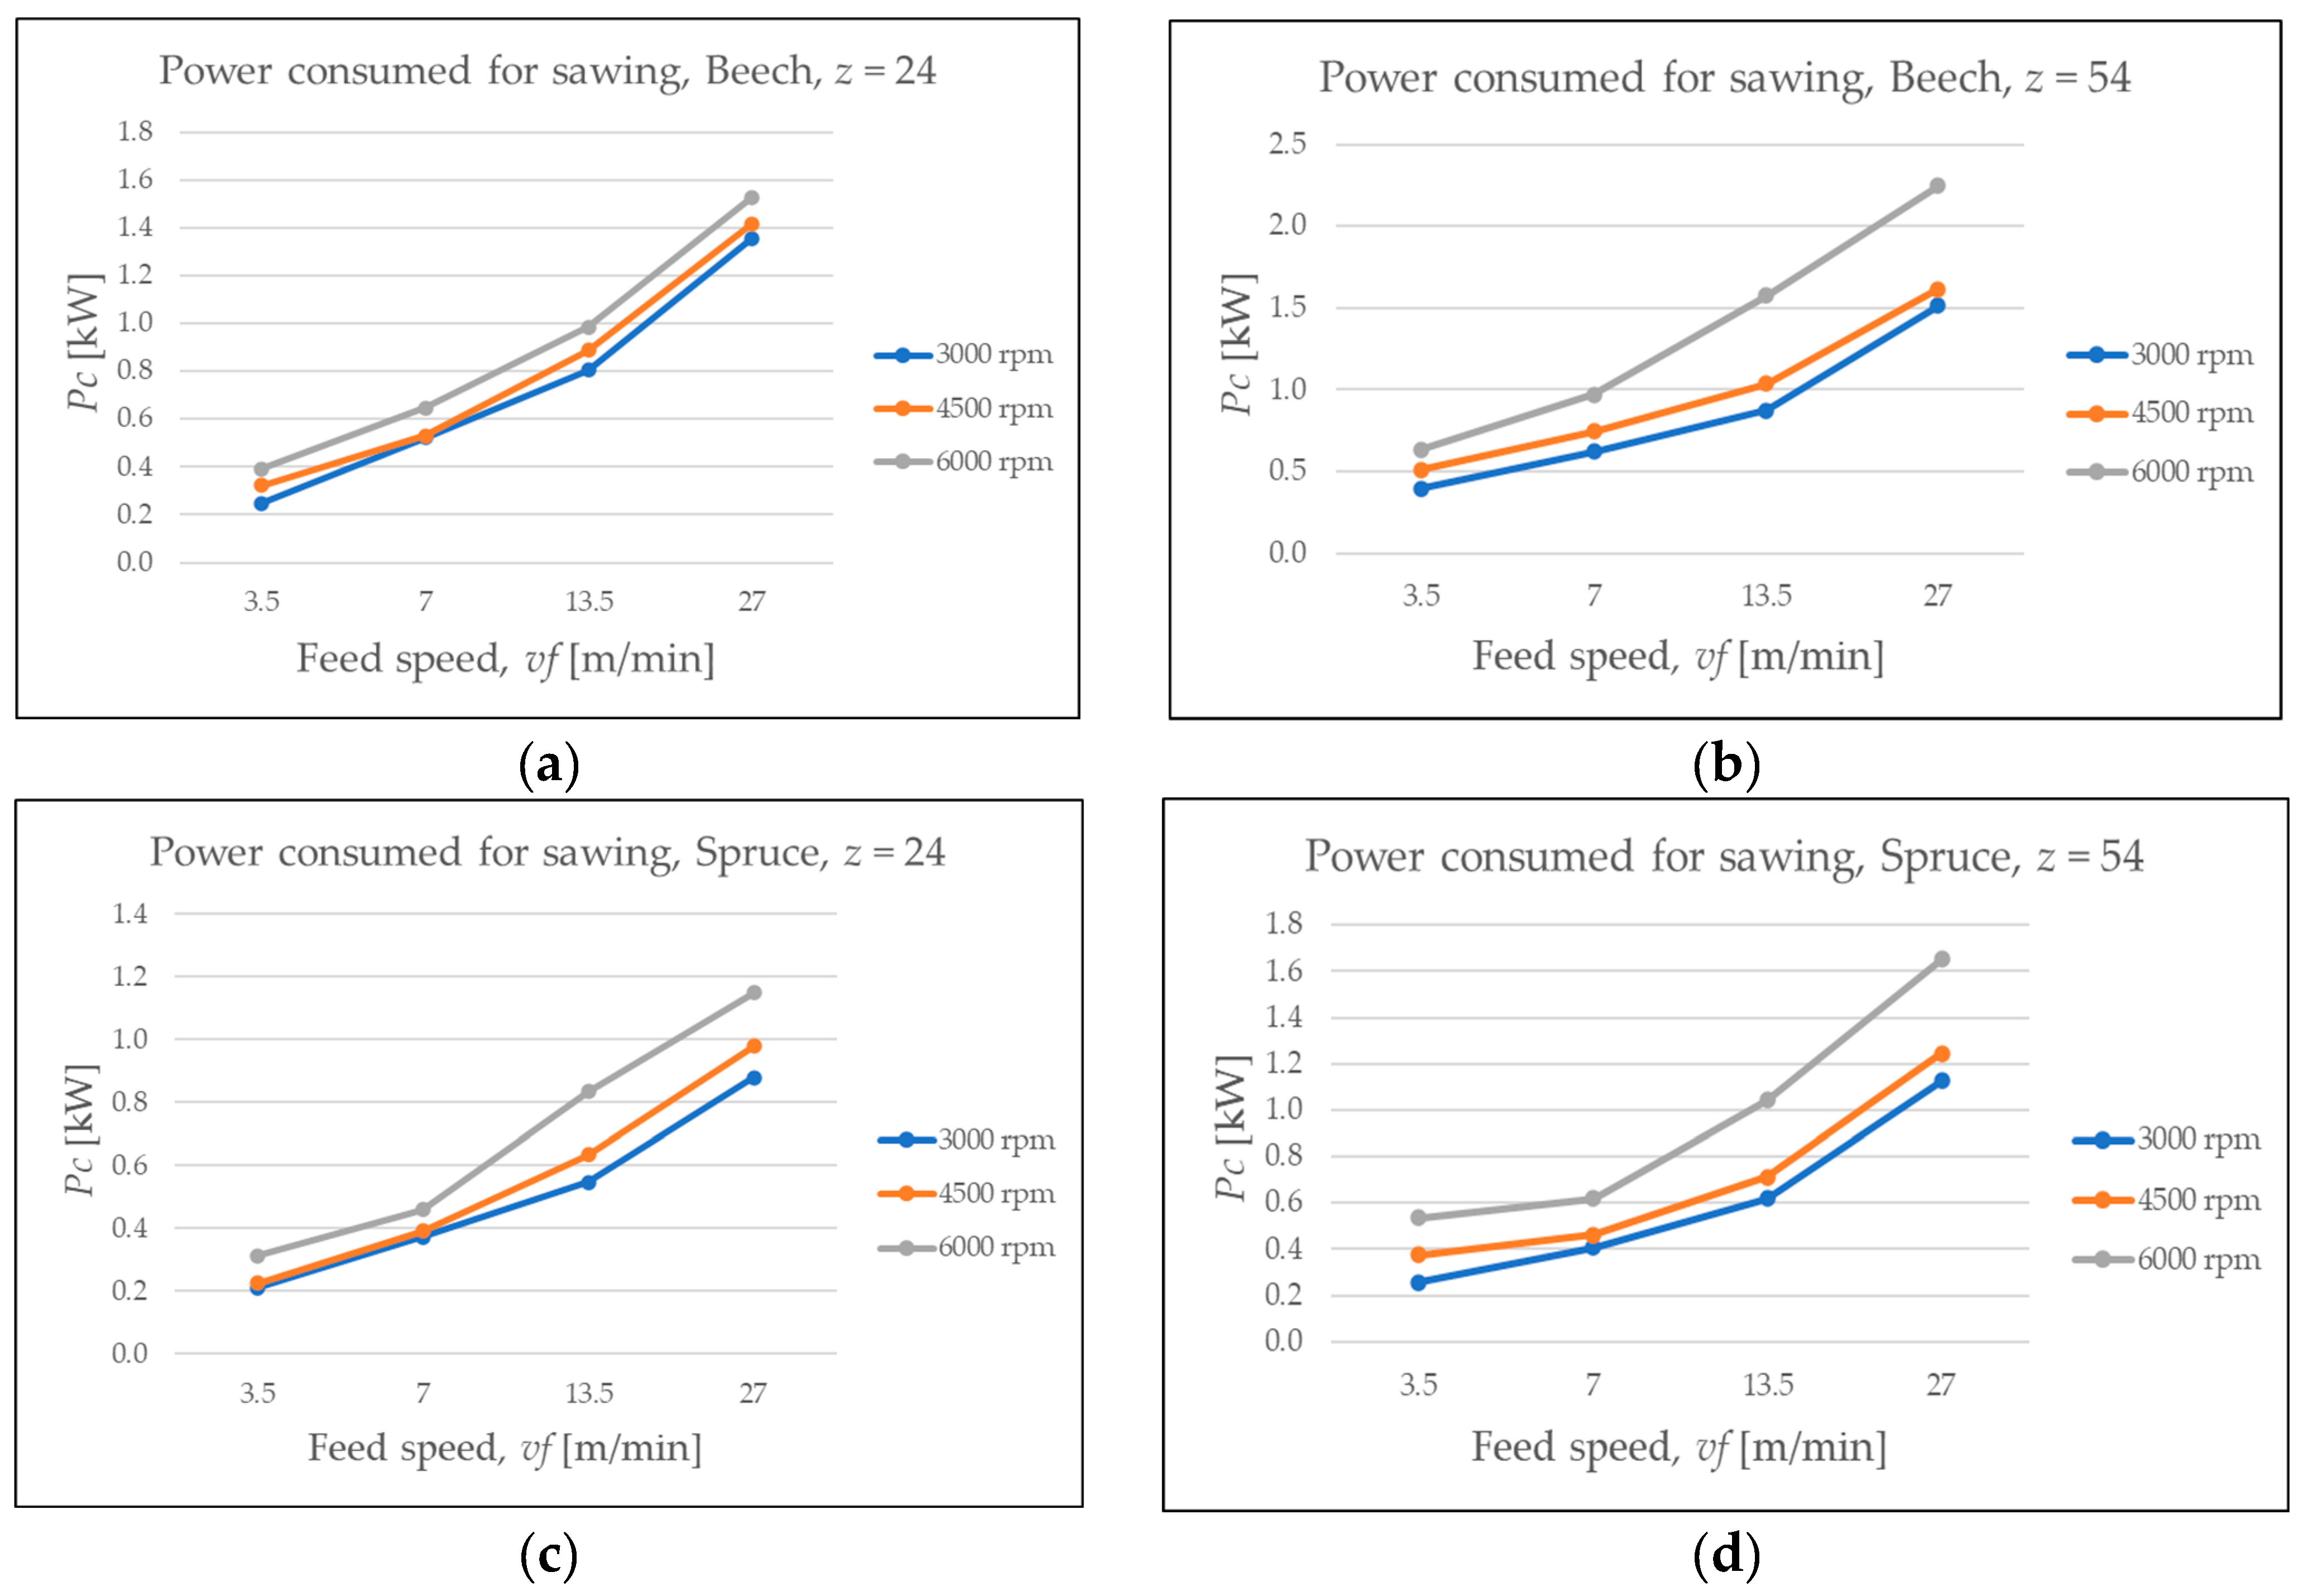
The collected data indicated that power consumption during the cutting of the samples (Pc) increased with higher feed speeds (Figure 7). Additionally, a slight rise in power consumption was observed with an increasing spindle rotation speed. With respect to the wood species, cutting the beech samples required more power than cutting the spruce samples. Moreover, the analyzed tool type, which is characterized by a different number of teeth and other blade geometries, influenced the power consumption; specifically, the blade with 54 cutting edges resulted in higher power consumption than the blade with 24 cutting edges. The maximum recorded power consumption occurred during the cutting of the beech wood using the 54-edge saw blade at a feed speed of 27 m/min.
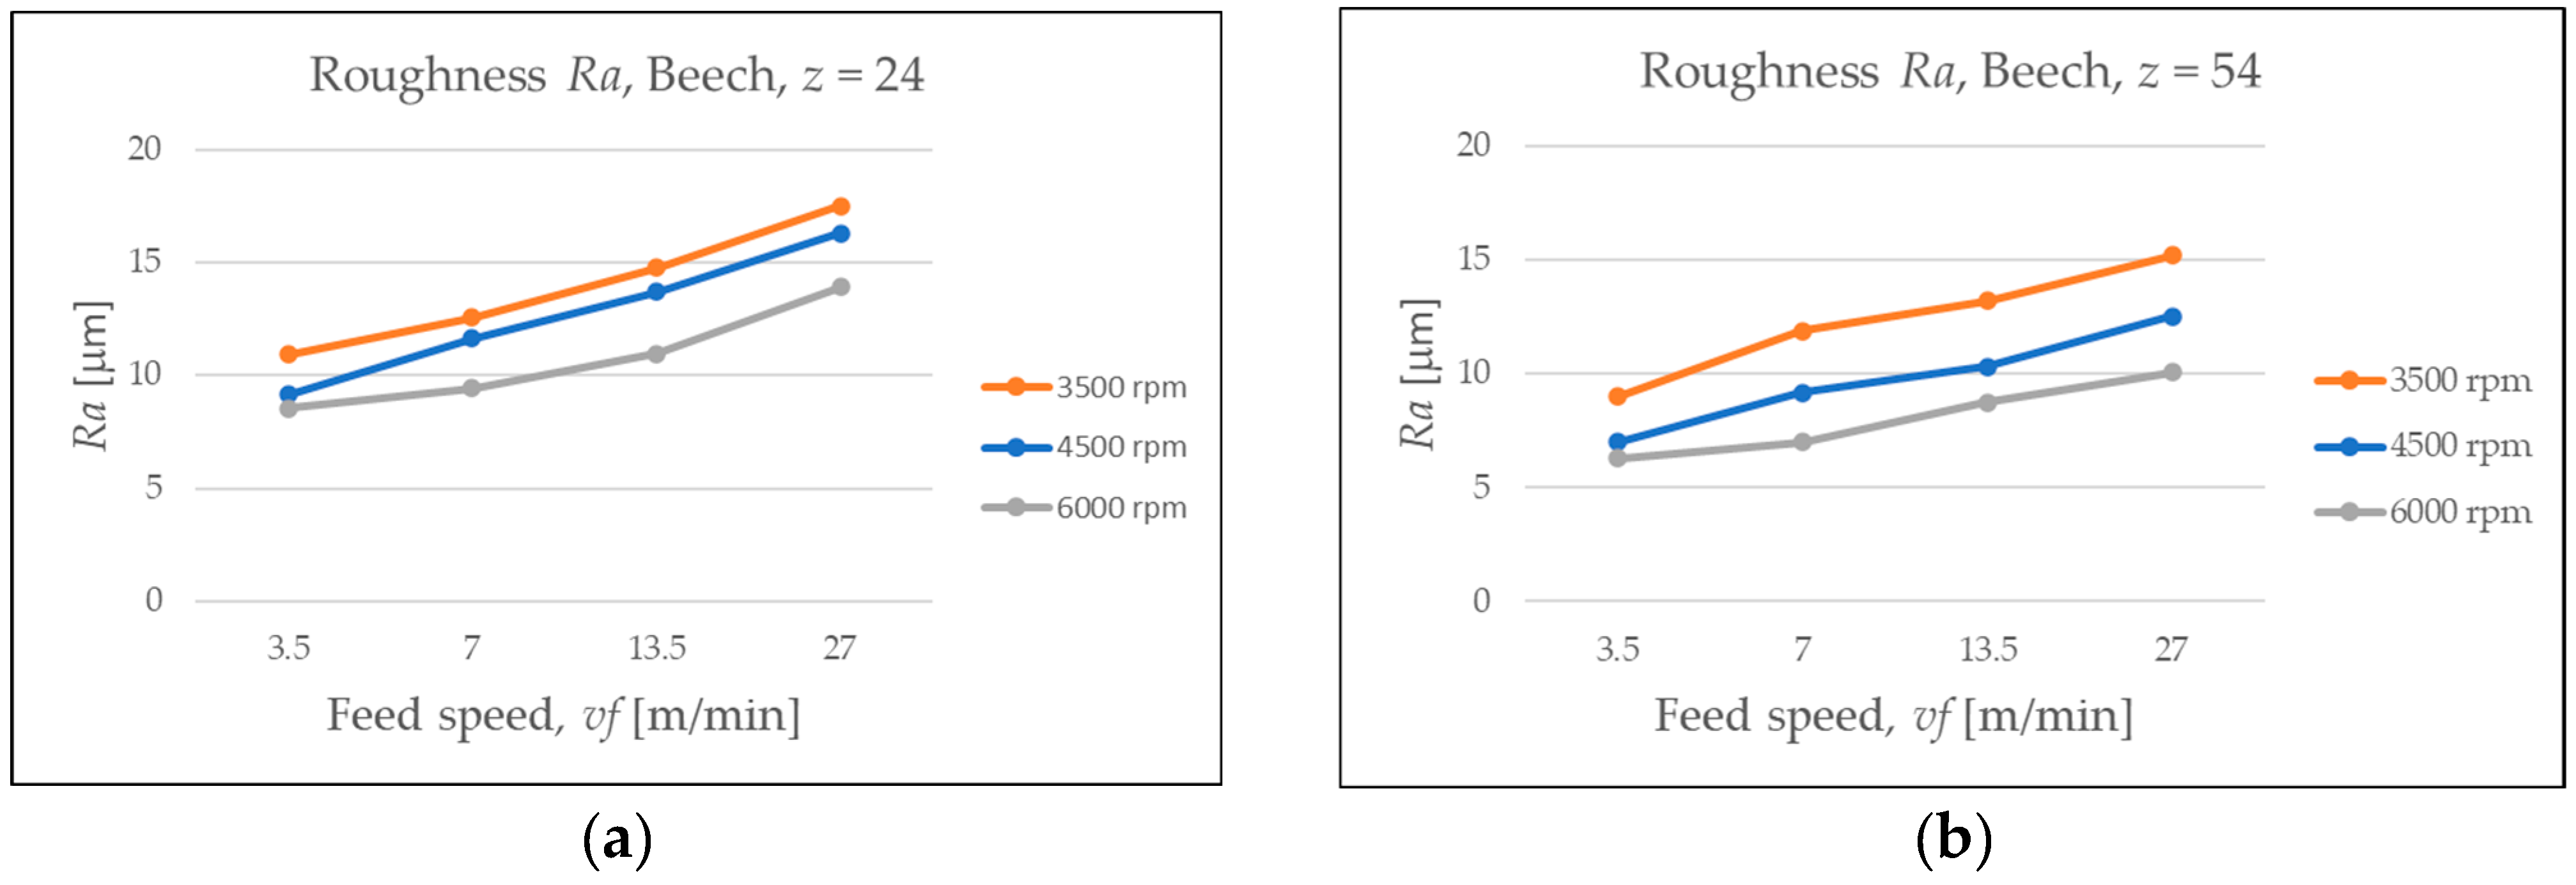
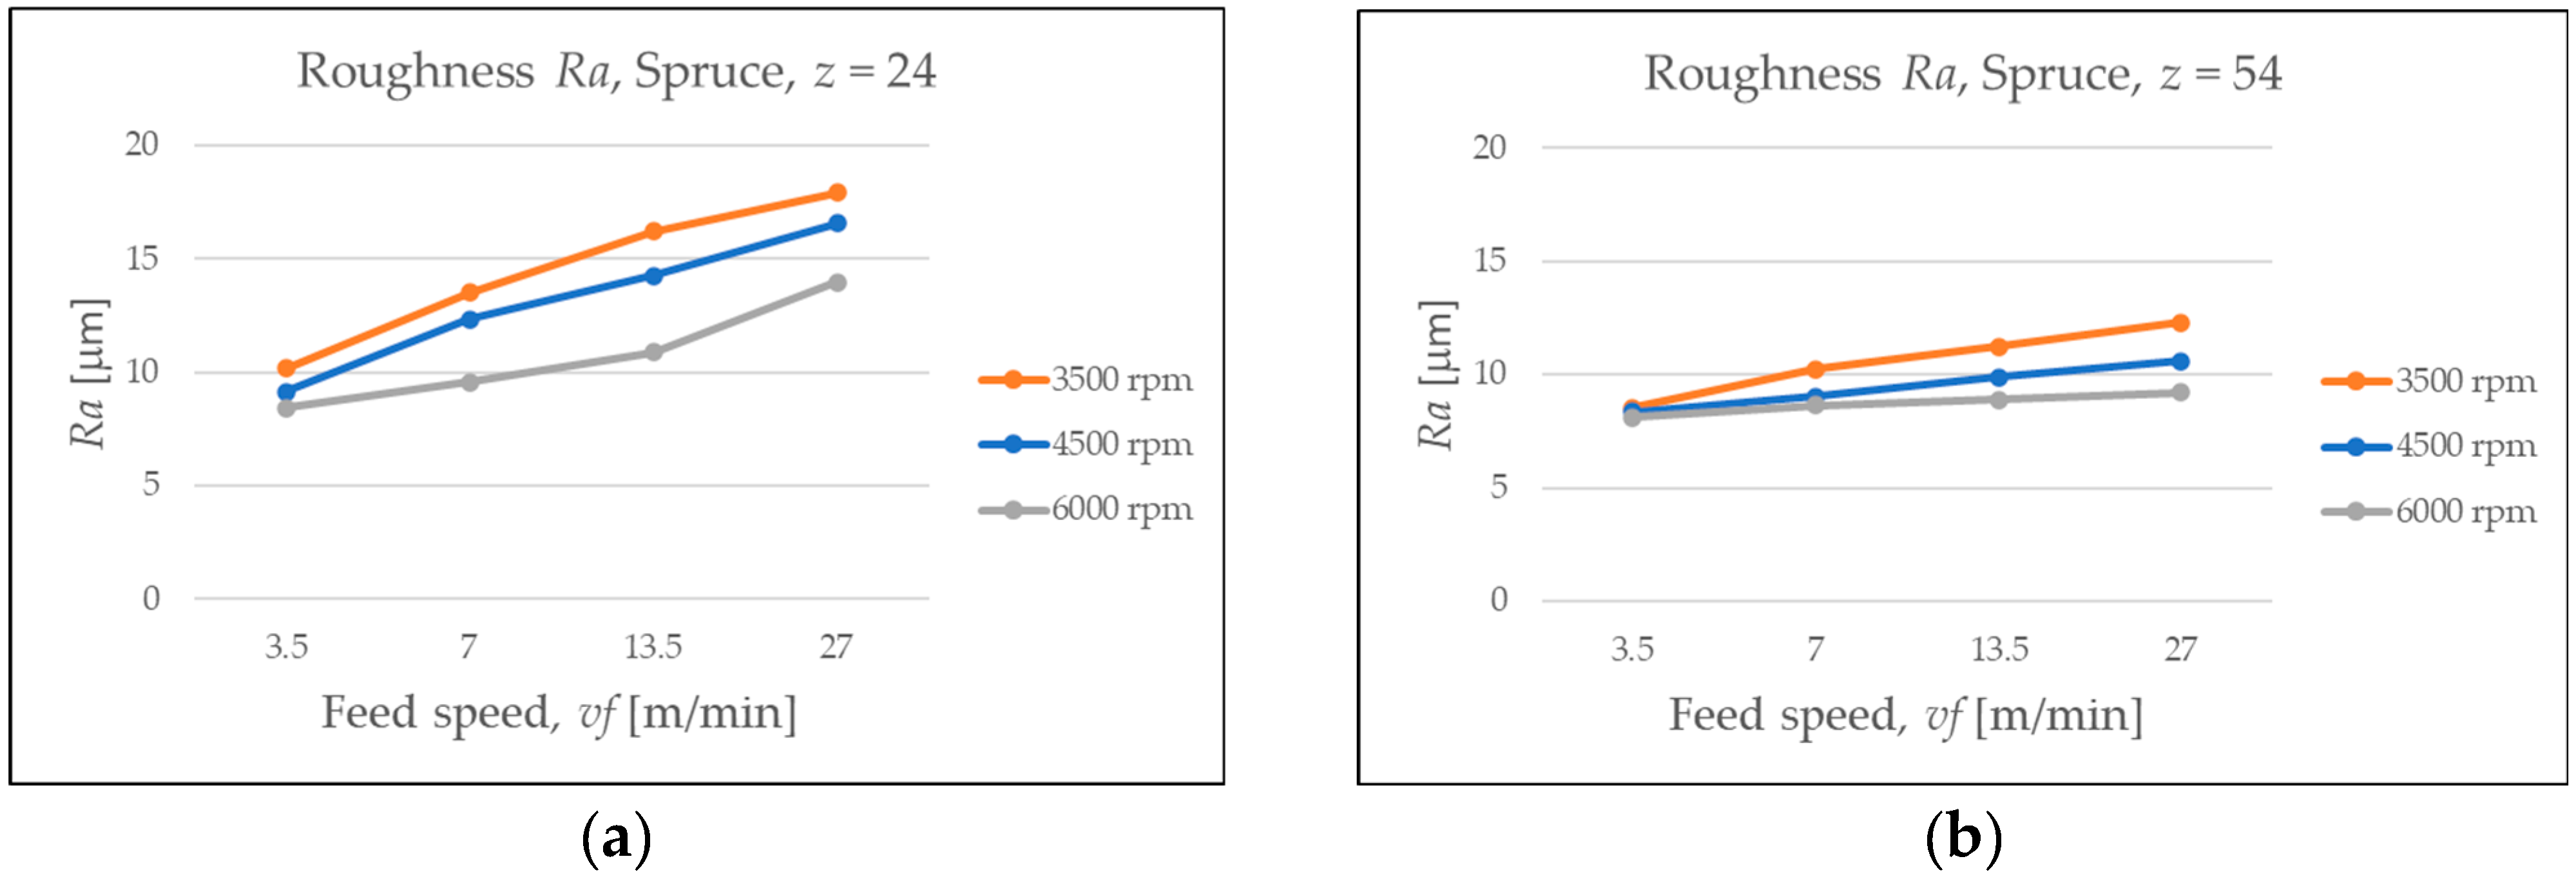
The results concerning surface roughness showed that roughness values increased with feed speed, albeit to a lesser extent than power consumption (Figure 8 and Figure 9). A slight decrease in roughness was generally observed with an increasing spindle rotation speed.
Additionally, for a given wood species, a lower surface roughness was recorded when sawing with the blade with more cutting teeth (z = 54). This seems logical if we consider that, at equal blade rotation speeds and equal feed rates, the feed per tooth decreases with the increasing number of cutting teeth. However, since the used saw blades not only have different numbers of teeth but have differences in tooth geometry, it is not clear to what extent the effect on surface roughness is due to the number of teeth or to the differences in tooth geometry. Further research is needed to clarify this uncertainty.

3.2. Models Based on the Artificial Neural Network Modeling Technique

Table 3 presents the characteristics of the ANN developed models. Both models are characterized by high coefficients of correlation. Moreover, the line and scatter plots presented in Figure 10 and Figure 11 describe good accuracy for both models.

3.3. Influence of Factors and Optimization Study

3.3.1. Cutting Power

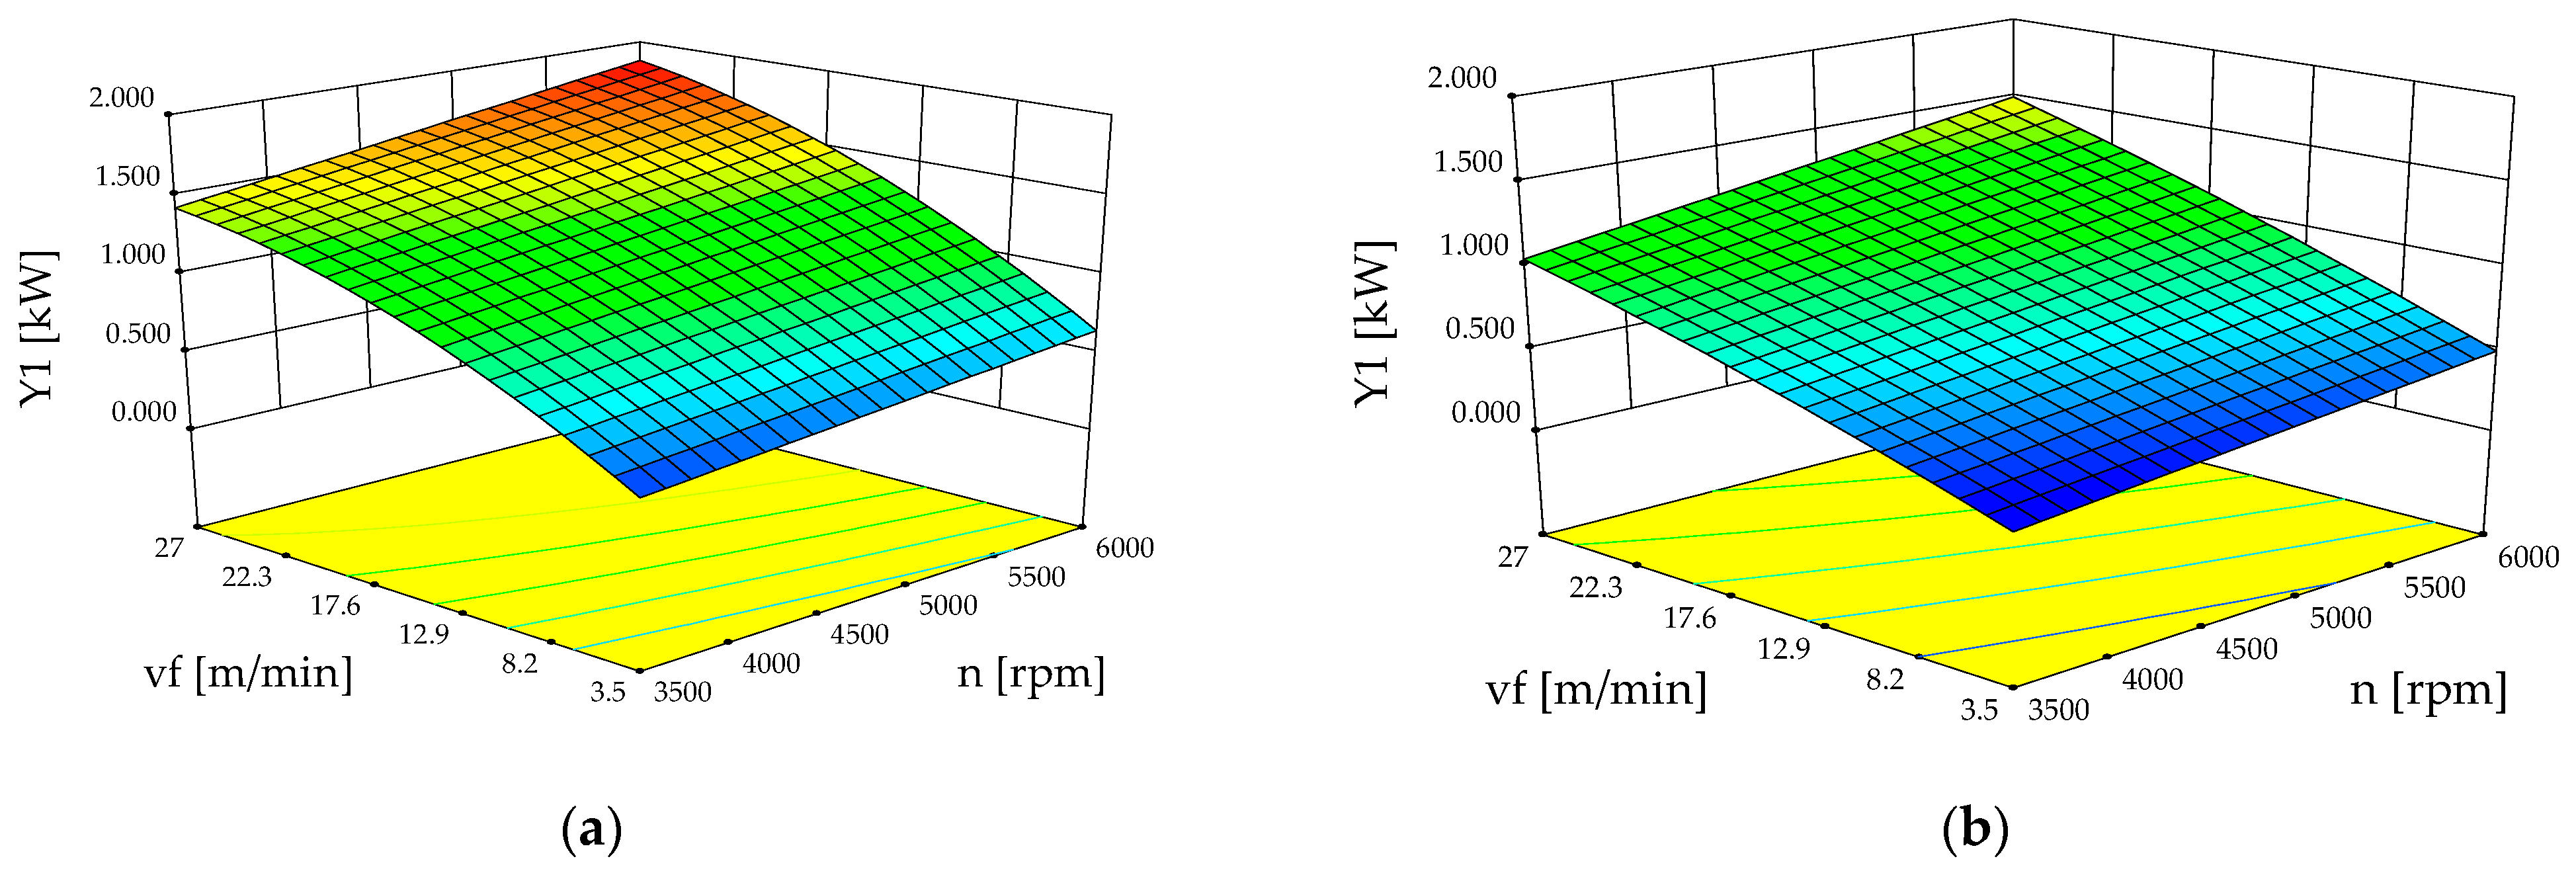
A quadratic model was suggested by Design-Expert® Software to predict the cutting power during (Y1) the circular sawing of solid wood strips based on species (X1), tool type (X2), rotation speed (n), and feed speed (vf). The model and its terms are significant at 1% and 5%, respectively (Table 4). The influence of feed speed and cutting speed on power is pictured in Figure 12 and Figure 13.
Y 1 ^ = 0.97 + 0.13 X 1 + 0.50 X 2 0.17 X 3 + 0.086 X 4 + 0.046 X 1 X 2 + 0.049 X 1 X 4             0.055 X 2 X 3 + 0.018 X 2 X 4 0.024 X 3 X 4 0.11 X 2 2             + 0.064 X 2 2 X 3
Y 1 ^ z 24 ( b e e c h ) = 0.028719 + 0.00001735 X 1 + 0.06825 X 2 + 0.000003104 X 1 X 2 0.001232 X 2 2
Y 1 ^ z 54 ( b e e c h ) = 0.22832 + 0.00009593 X 1 + 0.071256 X 2 + 0.000003104 X 1 X 2         0.001232 X 2 2
Y 1 ^ z 24 ( s p r u c e ) = 0.0329 + 0.0000173 X 1 + 0.0300595 X 2 + 0.000003104 X 1 X 2       0.0003066 X 2 2
Y 1 ^ z 54 ( s p r u c e ) = 0.26321 + 0.00009593 X 1 + 0.0300595 X 2       + 0.000003104 X 1 X 2 0.0003066 X 2 2
Based on the equations presented in the coded form (Equation (6)), it could be stated that the factor that most affects the cutting power during sawing of the analyzed samples is feed speed (X2). The second factor is the wood species (X3), and it is followed by the blade rotation speed (X1) and tool type (X4). The obtained results are consistent with the data reported in the literature [11,16,20]; namely, that the cutting power is influenced by the feed speed, rotation speed, and blade type. The most important interaction is between the feed speed and the wood species (X2X3). The feed speed (X2) also has a nonlinear effect on the cutting power.

3.3.2. Roughness

The relation between the factors and the roughness of the wood strips during circular sawing is best described by a quadratic model (Equation (11)). Table 5 presents the ANOVA results regarding the significance of the selected model and its coefficients.
Y 2 ^ = 11.77 1.64 X 1 + 2.50 X 2 1.58 X 4 0.30 X 1 X 2 0.62 X 2 X 4 + 0.25 X 1 2             0.73 X 2 2
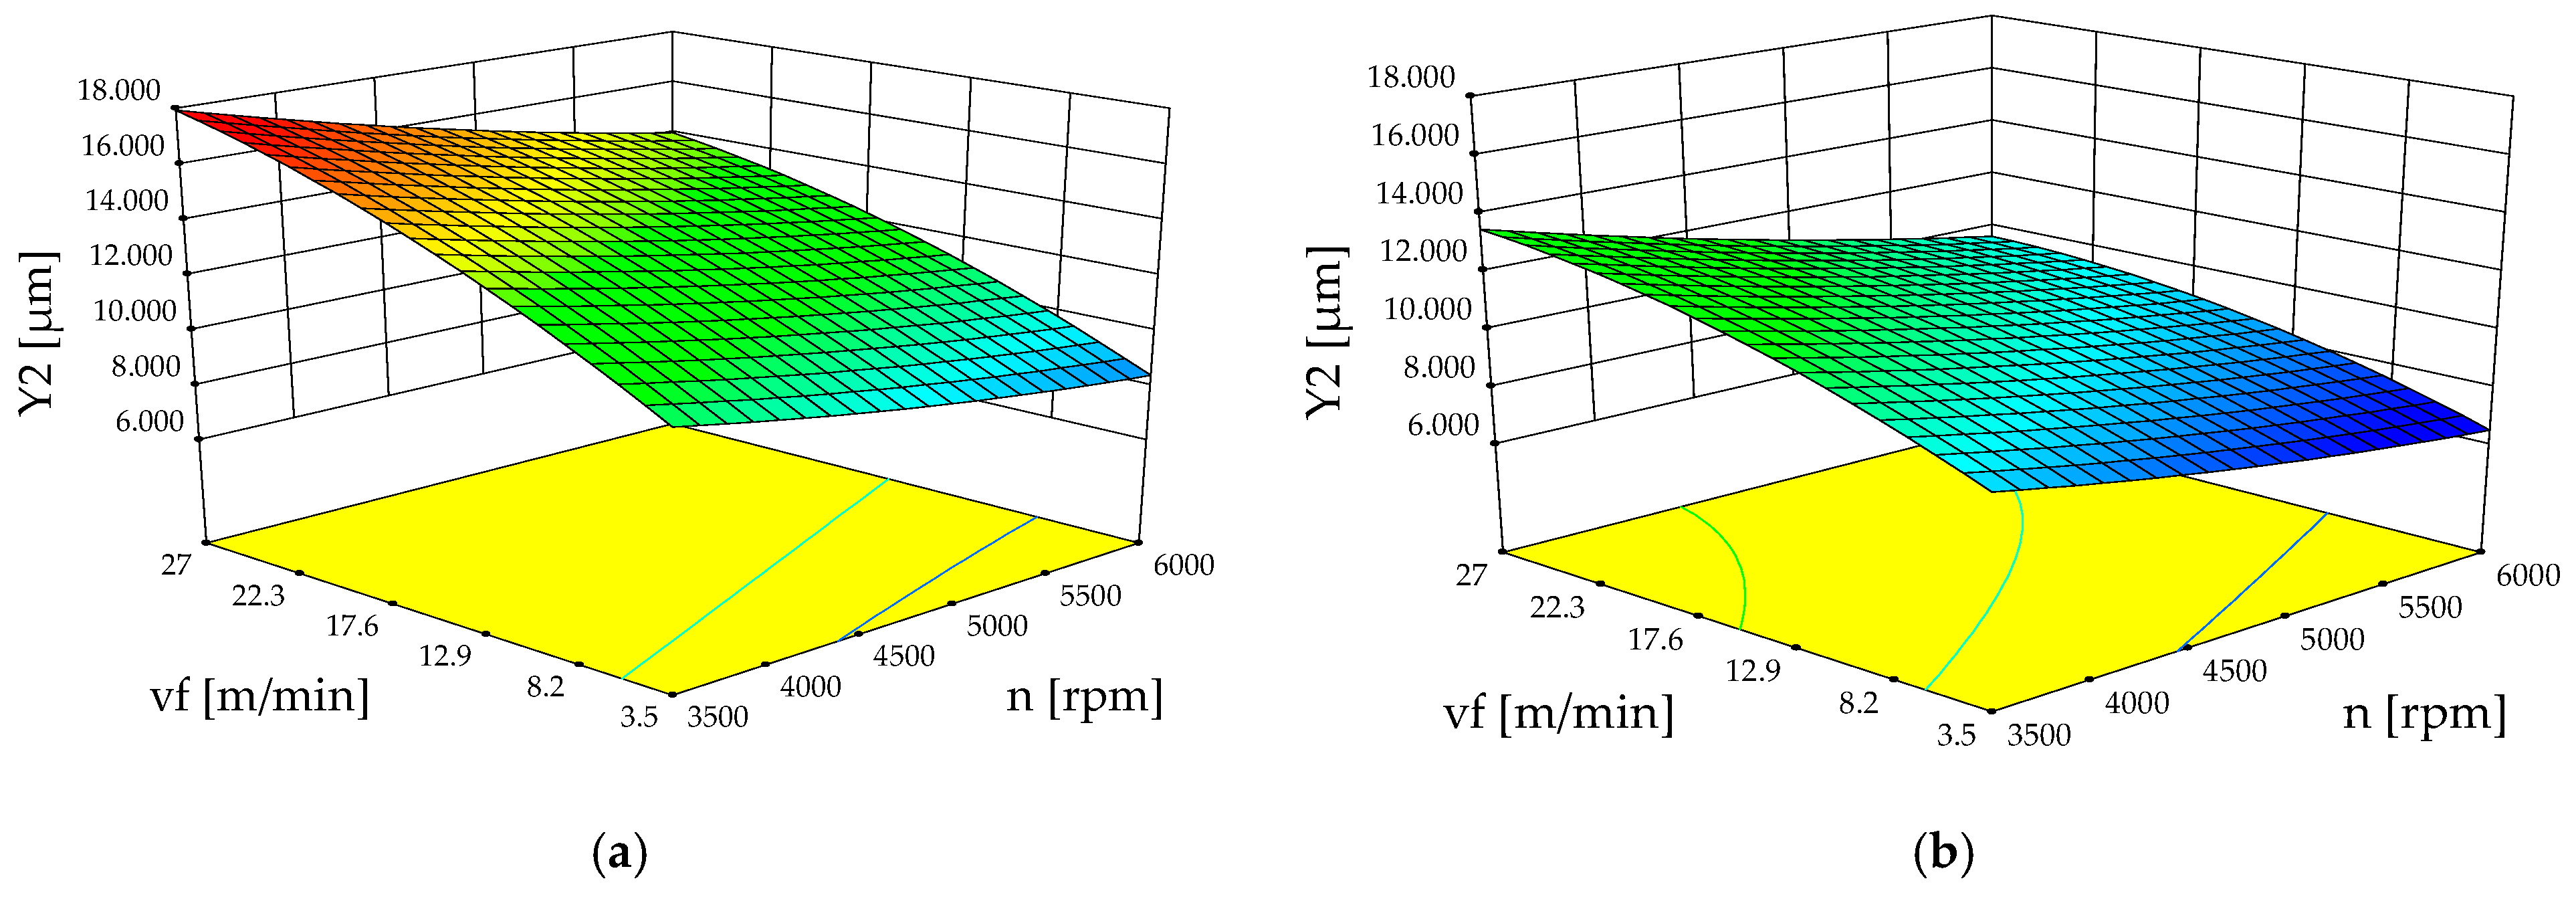
Based on the coefficients in Equation (11), which is in coded terms, the most important factor that influences the roughness of the analyzed wood strips is the feed speed; the second factor is the blade rotation speed; the third factor is the tool type (number of cutting teeth and other blade geometries). These results are supported by the findings of previous studies [16,20], which state that the surface quality is affected by the analyzed factors in this work. It can be observe that there is an interaction effect between the revolution speed (X1) and the feed speed (X2) (Figure 14). A synergetic effect between the feed speed (X2) and the tool type (X4) can also be observed. Moreover, both the rotational speed (X1) and the feed speed (X2) have a non-linear effect on the roughness of the analyzed surface.
Although minor variations in surface roughness were observed during the experimental part, the regression analysis indicated that these differences were not significant (p > 0.05). This could be due to the fact that the analyzed species are somewhat similar anatomically. However, further investigation is needed to clarify this finding.
Y 2 ^ z 24 = 16.38 0.00250287 X 1 + 0.52433 X 2 0.0000207543 X 1 X 2 + 0.0000001585 X 1 2 0.00525974 X 2 2
Y 2 ^ z 54 = 14.82 0.00250287 X 1 + 0.41937 X 2 0.0000207523 X 1 X 2 + 0.000000158543 X 1 2 0.0052597 X 2 2
The optimization study, which was performed by means of Design-Expert® Software [30], showed that a high rotational speed (6000 rpm) and a low feed speed (3.5 m/min) is needed to obtain a low cutting power (0.364 kW for beech and 0.306 kW for spruce) and a good quality surface; namely, a lower (Ra = 8.41 µm both for beech and spruce) when a circular saw blade with z = 24 teeth is used during wood processing (Table 6).
On the other hand, when a circular saw blade with z = 54 teeth is used, the optimal cutting conditions are obtained when the rotational speed of the blade is equal to 4500 rpm, with a feed speed of 3.5 mm/min for the spruce and 7 m/min for the beech. For these configurations, the expected value of the cutting power is 0.74 kW for the beech and 0.331 kW for the spruce. The roughness coefficient (Ra) is 8.80 for the beech samples and 7.85 for the spruce samples.
It can be seen that the optimal speeds of the circular saw blades differ. For the blade with 24 teeth, the optimal speed is 6000 rpm; for the blade with 54 teeth, it is 4500 rpm. The explanation could be that the chosen optimization criterion was minimum for cutting power and for minimum roughness. Such an optimal situation may involve a compromise. Thus, the roughness obtained when cutting with a 54-tooth blade, a feed speed of 3.5 m/min, and speeds of 4500 rpm and 6000 rpm, respectively, differ only very slightly, both for the beech and especially for the spruce, as can be seen in Figure 8b and Figure 9b. At the same time, as shown in in Figure 7, the power consumed when cutting with the same blade (z = 54 teeth) is significantly higher at blade speeds of 6000 rpm compared to using a speed of 4500 rpm, for all feed speeds.
By comparing the predicted values by the optimization algorithm of Design-Expert® Software, reasonable accuracy can be observed. Compared with other studies where this modeling method was applied [30,31], it can be observed that the relative error is within the reasonable range of 2.31–35.71%. Therefore, the proposed methodology could be used to study and to optimize the wood cutting process by circular saw blades.

4. Conclusions

Revealing the optimal combination of factors among the circular sawing of wood is a mandatory requirement when a low cutting power and a high quality surface is desired. Therefore, this study proposes a modeling tool that could be used to study and to optimize the wood cutting process with circular saw blades. The main conclusions of this study are as follows:
  • The feed speed is the most important factor that affects both the cutting power and surface roughness.
  • The wood species affects only the cutting power. The surface roughness was not significantly influenced by the analyzed wood species.
  • The blade rotational speed affects both the cutting power and the surface roughness.
  • The tool type (number of cutting teeth and other blade geometries) affects both the cutting power and surface roughness. However, it is not clear if this is due to the difference between the numbers of teeth or to the geometric differences of the teeth. Further research is needed to clarify this uncertainty.
  • Optimal cutting conditions (for both analyzed species) require a high rotational speed (6000 rpm) and a low feed speed (3.5 m/min) for a circular blade with z = 24 teeth. On the other hand, when a circular saw blade with z = 54 teeth is used, a rotational speed of 4500 rpm and a low feed speed (3.5 m/min) for the spruce and a moderate feed speed (7 m/min) is recommended by the optimization algorithm.
  • The designed ANN models were developed and validated based on the experimental data. Both models are characterized by the high values of the performance indicators. Therefore, the models could be considered a reliable tool that could be used to predict the cutting power (Pc) and the surface roughness based on the Ra parameter either for practical or for research purposes. Moreover, both models could be integrated with other statistical techniques, like the Taguchi method, genetic algorithms, and the Monte Carlo method, to optimize the wood machining process in terms of energy consumption, surface quality, and raw material yield. As a limitation of ANN models, it could be stated that the number of cutting teeth and tooth geometry were not studied as individual independent variable. However, this issue could be studied in a further study. Moreover, in a further study, more wood species with different anatomical structures will be analyzed, and other parameters that better describe the surface roughness will be considered.
  • As a general limitation of this study, it can be mentioned that circular blades with different numbers of teeth, but with identical geometry, were not considered during the experiments due to the fact that they were not available from the seller.
  • From an industrial practice point of view, this study offers the possibility of choosing optimal processing regimes, including the type of saw blade to use. Thus, the computational model is able to “calculate” machining regimes that generate a certain surface quality at maximum productivity, under the conditions of using a certain tool, with a certain power consumption. These regimes may be more oriented towards superior surface quality and/or low energy consumption, or may be more oriented towards high productivity. In industrial conditions, minimum feed is not always justified due to loss of productivity. However, depending on the goal pursued, the management can take the appropriate decision. Models that take into account other factors, such as productivity and tool wear, among other factors, can be developed based on this study.
  • Also, certain information can be useful to circular saw manufacturers, such as those related to spindle speeds. Further technical and economic studies are needed.

Author Contributions

Conceptualization, M.I.; methodology, M.I., B.B. and S.R.; software, B.B., S.R., A.-M.A. and M.I.; validation, M.I., S.R. and B.B.; resources, M.I.; writing—original draft preparation, B.B., M.I., S.R. and A.-M.A.; writing—review and editing, M.I., B.B. and S.R.; visualization, M.I., S.R. and B.B. All authors have read and agreed to the published version of the manuscript.

Funding

This research received no external funding.

Institutional Review Board Statement

Not applicable.

Informed Consent Statement

Not applicable.

Data Availability Statement

The original contributions presented in this study are included in the article. Further inquiries can be directed to the corresponding author.

Conflicts of Interest

The authors declare no conflicts of interest.

References

  1. Pahlitzsch, V.G.; Friebe, E. On the Behaviour of Circular Sawblades during Cutting—Part II: Effect of the Cutting Conditions on the Quality of Sawn Wood Surfaces. Holz Als Roh-Und Werkst. 1971, 29, 265–269. (In German) [Google Scholar] [CrossRef]
  2. Hutton, S.G.; Lee, V.; Kirbach, E. Effect of tooth front bevel angle on cutting accuracy and chip formation for circular rip saws. Holz Als Roh Und Werkst. 1992, 50, 313–316. [Google Scholar] [CrossRef]
  3. Moraes de Souza, E.; Moreira da Silva, J.R.; Lima, J.T.; Napoli, A.; Raad, T.J.; Gontijo, T. Specific cutting energy consumption in a circular saw for Eucalyptus stands VM01 and MN463. Cerne Lavras 2011, 17, 109–115. [Google Scholar] [CrossRef]
  4. Wasielewski, R.; Orlowski, K.A.; Szyszkowski, S. Economical Wood Sawing with Circular Saw Blades of a New Design. Drv. Ind. 2012, 63, 27–32. [Google Scholar] [CrossRef]
  5. Cristóvão, L.; Ekevad, M.; Grönlund, A. Industrial Sawing of Pinus sylvestris L. Power Consumption. BioResources 2013, 8, 6044–6053. [Google Scholar] [CrossRef]
  6. Kminiak, R. Effect of the saw blade construction on the surface quality when transverse sawing spruce lumber on crosscut miter saw. Acta Fac. Xylologiae Zvolen. 2014, 56, 87–96. [Google Scholar]
  7. Kminiak, R.; Gašparík, M.; Kvietková, M. The Dependence of Surface Quality on Tool Wear of Circular Saw Blades during Transversal Sawing of Beech Wood. BioResources 2015, 10, 7123–7135. [Google Scholar] [CrossRef]
  8. Li, W.; Zhang, Z.; Peng, X.; Li, B. The influences of circular saws with sawteeth of mic-zero-degree radial clearance angles on surface roughness in wood rip sawing. Ann. For. Sci. 2017, 74, 37. [Google Scholar] [CrossRef]
  9. Andrade, A.C.A.; Silva, J.R.M.; Moulin, J.C.; Oliveira, M.B.; Souza, M.T.; Lima, L.C. Quality of machined surfaces and specific cutting energy in wood of two African mahogany species. Sci. For. 2018, 46, 532–539. [Google Scholar] [CrossRef]
  10. Fragassa, C.; Lucisano, G.; Marinkovic, D.; Campana, G.A. Practical Guideline in the Design and use of Woodworking Tools. FME Trans. 2019, 47, 487–495. [Google Scholar] [CrossRef]
  11. Nasir, V.; Cool, J. Optimal power consumption and surface quality in the circular sawing process of Douglas-fir wood. Eur. J. Wood Wood Prod. 2019, 77, 609–617. [Google Scholar] [CrossRef]
  12. Krilek, J.; Ťavodová, M.; Kováč, J.; Tichý, B. Impact of Irregular Tooth Pitch of Circular Saw Blades on Power for Wood Cross-Cutting. Drv. Ind. 2020, 71, 3–11. [Google Scholar] [CrossRef]
  13. Kováč, J.; Harvánek, P.; Krilek, J.; Kuvik, T.; Melicherčík, J. Analysis of Cutting Conditions in the Process of Cross-cutting Wood by Circular Saws. BioResources 2021, 16, 1029–1041. [Google Scholar] [CrossRef]
  14. Nasir, V.; Cool, J. Cutting power and surface quality in sawing kiln-dried, green, and frozen hem-fir wood. Wood Sci. Technol. 2021, 55, 505–519. [Google Scholar] [CrossRef]
  15. Pałubicki, B.; Hlásková, L.; Frömel-Frybort, S.; Rogozinski, T. Feed Force and Sawdust Geometry in Particleboard Sawing. Materials 2021, 14, 945. [Google Scholar] [CrossRef]
  16. Kvietková, M.S.; Gašparík, M. Surface irregularities of oak wood after transversal cutting with a circular saw. Wood Res. 2021, 66, 1032–1045. [Google Scholar] [CrossRef]
  17. Đukić, I.; Merhar, M.; Jovanović, J.; Herceg, D. Analysis of Circular Saw Tooth Marks Profile on Material Machined Surface After Filtering with Fast Fourier Transform (FFT). Drv. Ind. 2022, 73, 151–162. [Google Scholar] [CrossRef]
  18. Svoren, J.; Našcák, L.; Barcík, Š.; Koleda, P.; Stehlík, Š. Influence of Circular Saw Blade Design on Reducing Energy Consumption of a Circular Saw in the Cutting Process. Appl. Sci. 2022, 12, 1276. [Google Scholar] [CrossRef]
  19. Fekiac, J.; Svoren, J.; Gáborík, J.; Nemec, M. Reducing the Energy Consumption of Circular Saws in the Cutting Process of Plywood. Coatings 2022, 12, 55. [Google Scholar] [CrossRef]
  20. Hao, Z.; Zhang, F.; Li, X.; Wang, Y.; Zhang, T.; Guo, X. Optimization of oak sawing parameters based on energy consumption and surface roughness. Mater. Und Werkst. 2024, 55, 1346–1356. [Google Scholar] [CrossRef]
  21. Garrido, N.; Martins, J.; Davim, J.P.; Carvalho, L. Influence of machining parameters on edge quality of particleboards: Modeling and optimization. Int. J. Adv. Manuf. Technol. 2024, 133, 5463–5482. [Google Scholar] [CrossRef]
  22. Buldum, B.B.; Şik, A.; Akdağli, A.; Biçer, M.B.; Aldaş, K.; Özkul, I. ANN surface roughness prediction of AZ91D magnesium alloys in the turning process. Mater. Test. 2017, 59, 916–920. [Google Scholar] [CrossRef]
  23. Varatharajulu, M.; Jayaprakash, G.; Baskar, N.; Saravanan, A. Genetic algorithm assisted artificial neural network for the estimation of drilling parameters of magnesium AZ91 in vertical milling machine. Surf. Rev. Lett. 2020, 27, 1950221. [Google Scholar] [CrossRef]
  24. Kulisz, M.; Zagorski, I.; Jozwik, J.; Korpysa, J. Research, modelling and prediction of the influence of technological parameters on the selected 3D roughness parameters, as well as temperature, shape and geometry of chips in milling AZ91D alloy. Materials 2022, 15, 4277. [Google Scholar] [CrossRef]
  25. Pai, V.M.S.; Udaya, G.D.; Bhat, K.; Thakur, D.; Bhaskara, A. Meta-heuristic algorithm-based optimization studies in cryogenic and conventional milling of magnesium alloy AZ91. Results Eng. 2025, 27, 106256. [Google Scholar] [CrossRef]
  26. Ren, X.; Fan, J.; Pan, R.; Sun, K. Modeling and process parameter optimization of laser cutting based on artificial neural network and intelligent optimization algorithm. Int. J. Adv. Manuf. Technol. 2023, 127, 1177–1188. [Google Scholar] [CrossRef]
  27. Song, H.; Ren, G.; Dan, J.; Li, J.; Xiao, J.; Xu, J. Experimental Study of the Cutting Force During Laser-Assisted Machining of Fused Silica Based on Artificial Neural Network and Response Surface Methodology. Silicon 2019, 11, 1903–1916. [Google Scholar] [CrossRef]
  28. Naresh, C.; Sameer, M.D.; Bose, P.S.C. Comparative Analysis of RSM, ANN and ANFIS Techniques in Optimization of Process Parameters in Laser Assisted Turning of NITINOL Shape Memory Alloy. Lasers Manuf. Mater. Process. 2024, 11, 371–401. [Google Scholar] [CrossRef]
  29. Meddour, I.; Yallese, M.A.; Bensouilah, H.; Khellaf, A.; Elbah, M. Prediction of surface roughness and cutting forces using RSM, ANN, and NSGA-II in finish turning of AISI 4140 hardened steel with mixed ceramic tool. Int. J. Adv. Manuf. Technol. 2018, 97, 1931–1949. [Google Scholar] [CrossRef]
  30. Bedelean, B.; Ispas, M.; Răcășan, S. Optimizing Wood Composite Drilling with Artificial Neural Network and Response Surface Methodology. Forests 2024, 15, 1600. [Google Scholar] [CrossRef]
  31. Bedelean, B.; Ispas, M.; Răcășan, S. Combining Artificial Neural Network and Response Surface Methodology to Optimize the Drilling Operating Parameters of MDF Panels. Forests 2023, 14, 2254. [Google Scholar] [CrossRef]
  32. EN IEC 60688:2024; Electrical Measuring Transducers for Converting AC and DC Electrical Quantities to Analogue or Digital Signals. International Electrotechnical Commission (IEC): Geneva, Switzerland, 2021.
  33. ISO 16610-31:2016; Geometrical Product Specifications (GPS)—Filtration Part 31: Robust Profile Filters: Gaussian Regression Filters. ISO: Geneva, Switzerland, 2016.
  34. Gurău, L. The Roughness of Sanded Wood Surfaces. Ph.D. Thesis, Forest Products Research Centre, Buckinghamshire Chilterns University College, Buckinghamshire, UK, 2004. [Google Scholar]
  35. Tan, P.L.; Sharif, S.; Sudin, I. Roughness Models for Sanded Wood Surfaces. Wood Sci. Technol. 2012, 46, 129–142. [Google Scholar] [CrossRef]
  36. ISO 21920-2:2021; Geometrical Product Specifications (GPS)—Surface Texture: Profile Part 2: Terms, Definitions and Surface Texture Parameters. ISO: Geneva, Switzerland, 2021.
  37. NeuralWare. NeuralWorks Predict. The Complete Solution for Neural Data Modeling. User Guide; NeuralWare Inc.: Carnagie, PA, USA, 2009; pp. 10–22. [Google Scholar]
  38. Watanabe, K.; Korai, H.; Matsushita, Y.; Hayashi, T. Predicting internal bond strength of particleboard under outdoor exposure based on climate data: Comparison of multiple linear regression and artificial neural network. J. Wood Sci. 2015, 61, 151–158. [Google Scholar] [CrossRef]
Figure 1. The saw blades used for cutting: (a) 24-cutting teeth saw blade; (b) 54-cutting teeth saw blade.
Applsci 15 10206 g001
Figure 2. The machine tool (a), the setup used for measuring (b), and samples cutting (c).
Applsci 15 10206 g002
Figure 3. Power measurement: (a) the connection diagram; (b) the software used to record data.
Applsci 15 10206 g003
Figure 4. Wood pieces obtained by sectioning the 8 mm thick lamellas used for surface quality measurement.
Applsci 15 10206 g004
Figure 5. Experimental setup for surface roughness measurement: (a) MarSurf XT20 system; (b) measuring the sample surface across the grain.
Applsci 15 10206 g005
Figure 6. Surface roughness measurement: (a) roughness profile for the spruce wood, cut with a 24-teeth blade, 6000 rpm blade rotation speed, and 3.5 m/min feed speed; (b) roughness profile for the beech wood, cut with a 54-teeth blade, 4500 rpm blade rotation speed, and 3.5 m/min feed speed.
Applsci 15 10206 g006
Figure 7. The influence of feed speed on cutting power: (a,b) the results obtained for the beech pieces; (c,d) the data obtained for the spruce pieces.
Applsci 15 10206 g007
Figure 8. The influence of feed speed on surface roughness—the results obtained for the beech pieces: (a) for z = 24-teeth saw blade; (b) for z = 54-teeth saw blade.
Applsci 15 10206 g008
Figure 9. The influence of feed speed on surface roughness—the data obtained for the spruce pieces: (a) for z = 24-teeth saw blade; (b) for z = 54-teeth saw blade.
Applsci 15 10206 g009
Figure 10. The comparation between the predicted and experimental value of cutting power: line chart (a) and scatter plot (b).
Applsci 15 10206 g010
Figure 11. The comparation between the predicted and experimental value of roughness: line chart (a) and scatter plot (b).
Applsci 15 10206 g011
Figure 12. The influence of the tool type on the cutting power for a circular saw blade with z = 24 teeth: (a) for beech; (b) for spruce.
Applsci 15 10206 g012
Figure 13. The influence of the tool type on the cutting power for a circular saw blade with z = 54 teeth: (a) for beech; (b) for spruce.
Applsci 15 10206 g013
Figure 14. The influence of the tool type on the surface roughness (Ra) for a circular saw blade with z = 24 teeth (a) and z = 54 teeth (b).
Applsci 15 10206 g014
Table 1. The numerical and categorial factors that were analyzed in this study.
Numeric FactorLevel
−α *−10+1+α *
Blade rotation speed (X1), rpm35003500475060006000
Feed speed (X2), m/min3.53.515.252727
Categoric FactorLevel 1Level 2
Wood species (X3)Beech (−1)Spruce (+1)
Tool type (different number of teeth and blade geometries) (X4)z24 (−1)z54 (+1)
* Axial points.
Table 2. The face central composite design in actual and coded values.
CombinationFactorsResponses
Blade Rotation Speed (X1), rpmFeed Speed (X2), m/minWood Species (X3)Tool Type (Number of Cutting Teeth and Blade Geometries) (X4)Cutting Power, kW, (Y1)Arithmetical Mean Deviation (Ra), (Y2) μm
1.6000 (+1)3.5 (−1)Spruce (+1)z24 (−1)0.298.41
2.3500 (−1)27 (+1)Spruce (+1)z24 (−1)1.0217.32
3.4750 (0)27 (+1)Beech (−1)z54 (+1)1.6511.27
4.3500 (−1)3.5 (−1)Spruce (+1)z24 (−1)0.2611.04
5.3500 (−1)15.25 (0)Beech (−1)z24 (−1)0.9116.00
6.4750 (0)15.25 (0)Beech (−1)z54 (+1)1.259.94
7.3500 (−1)27 (+1)Beech (−1)z54 (+1)1.4513.65
8.6000 (+1)27 (+1)Spruce (−1)z24 (−1)1.2214.10
9.4750 (0)3.5 (−1)Beech (−1)z54 (+1)0.517.62
10.4750 (0)15.25 (0)Spruce (+1)z54 (+1)0.819.94
11.6000 (+1)27 (+1)Spruce (+1)z54 (+1)1.509.80
12.6000 (+1)15.25 (0)Spruce (+1)z54 (+1)1.098.61
13.6000 (+1)3.5 (−1)Beech (−1)z24 (−1)0.388.41
14.6000 (+1)27 (+1)Beech (−1)z24 (−1)1.5014.10
15.6000 (+1)15.25 (0)Beech (−1)z54 (+1)1.518.61
16.4750 (0) 3.5 (−1) Spruce (+1)z54 (+1)0.347.62
17.3500 (−1)15.25 (0)Spruce (+1)z24 (−1)0.6416.00
18.4750 (0)15.25 (0)Beech (−1)z24 (−1)1.0113.40
19.3500 (−1)3.5 (−1)Beech (−1)z24 (−1)0.2911.04
20.4750 (0)27 (+1)Spruce (+1)z24 (−1)1.1216.10
21.3500 (−1)15.25 (0)Spruce (+1)z54 (+1)0.6712.13
22.4750 (0)15.25 (0)Spruce (+1)z24 (−1)0.7313.40
23.6000 (+1)15.25 (0)Beech (−1)z24 (−1)1.1711.50
24.4750 (0)27 (+1)Spruce (+1)z54 (+1)1.2411.27
25.6000 (+1)27 (+1)Beech (−1)z54 (+1)1.869.80
26.4750 (0)3.5 (−1)Spruce (+1)z24 (−1)0.279.37
27.4750 (0)3.5 (−1)Beech (−1)z24 (−1)0.329.37
28.3500 (−1)3.5 (−1)Beech (−1)z54 (+1)0.398.89
29.4750 (0)27 (+1)Beech (−1)z24 (−1)1.3816.10
30.6000 (+1)3.5 (−1)Beech (−1)z54 (+1)0.636.90
31.3500 (−1)27 (+1)Spruce (+1)z54 (+1)1.0813.65
32.6000 (+1)15.25 (0)Spruce (+1)z24 (−1)0.8411.50
33.6000 (+1)3.5 (−1)Spruce (+1)z54 (+1)0.44 6.90
34.3500 (−1)27 (+1)Beech (−)z24 (−1)1.3017.32
35.3500 (−1)15.25 (0)Beech (−)z54 (+1)1.0012.13
36.3500 (−1)3.5 (−1)Spruce (+1)z54 (+1)0.308.89
Table 3. The performance indicators of the developed ANN models.
Dependent VariableNumber of Neurons in the Layers of ANN ModelsCoefficient of
Correlation
(R)
Validation Phase
InputHiddenOutletTraining PhaseTesting
Phase
RMSEMAPE
Cutting power, kW4610.9870.9860.1319.78
Roughness (Ra), μm4510.9850.9331.008.59
Table 4. ANOVA results of the model selected to predict the cutting power.
“Source”“Sum of Squares”df“Mean Square”F-Value”p-Value
Prob > F”
Observation
Model7.50110.68433.46<0.0001Significant
Rotation speed (X1)0.4110.41257.93<0.0001Significant
Feed speed (X2)5.9015.903753.17<0.0001Significant
Species (X3)0.3610.36227.97<0.0001Significant
Tool type (X4)0.2610.26167.65<0.0001Significant
X1X20.03310.03321.160.0001Significant
X1X40.05610.05836.82<0.0001Significant
X2X30.07410.07446.78<0.0001Significant
X2X40.007410.00744.740.0396Significant
X3X40.02110.02113.330.0013Significant
X 2 2 0.09010.09057.44<0.0001Significant
X 2 2 X 3 0.03810.03320.780.0001Significant
R20.98
Table 5. ANOVA results of the model selected to predict the roughness.
“Source”“Sum of Squares”df“Mean Square”F-Value”p-Value
Prob > F”
Observation
Model320.00745.71373.61<0.0001Significant
Rotation speed (X1)64.67164.67528.51<0.0001Significant
Feed speed (X2)150.121150.121226.91<0.0001Significant
Species (X3)-----Not significant
Tool type (X4)89.89189.89734.65<0.0001Significant
X1X21.4911.4912.150.0016Significant
X2X49.1319.1374.58<0.0001Not significant
X 1 2 0.4910.494.010.0549Not significant
X 2 2 4.2214.2234.48<0.0001Significant
R20.98
Table 6. Optimization criteria and optimal solutions obtained for the circular sawing of wood strips made from beech or spruce.
Independent VariablesGoal
Settings
Minimum
Value
Maximum ValueLevel of Factor
Importance
Rotation speed (X1), [rpm]In range350060003
Feed speed (X2), [m/min]3.5273
Species (X3)BeechSpruce3
Tool type (X4)z24z543
Dependent variables
Cutting power (Y1), [kW]Minimize0.251.853
Roughness (Y2), [μm]6.8917.313
Optimal solutions
%X2X3X4Cutting power [kW]Roughness, [μm]D
Y 1 ^ Y1ER1,% Y 2 ^ Y2ER2, %
60003.5Beechz240.3640.56 35.718.419.137.880.893
45007Beechz540.7400.785.128.809.184.130.883
60003.5Sprucez240.3060.337.278.418.222.310.910
45003.5Sprucez540.3310.4221.197.858.659.240.930
Disclaimer/Publisher’s Note: The statements, opinions and data contained in all publications are solely those of the individual author(s) and contributor(s) and not of MDPI and/or the editor(s). MDPI and/or the editor(s) disclaim responsibility for any injury to people or property resulting from any ideas, methods, instructions or products referred to in the content.