Article

Preliminary Design and Parametric Study of Minimum-Weight Steel Tied-Arch Bridges Obtained According to a Maximum Allowable Deflection Criterion

by
Juan José Jorquera-Lucerga
* and
Juan Manuel García-Guerrero
Mining and Civil Engineering Department, Universidad Politécnica de Cartagena (UPCT), Paseo Alfonso XIII, 50, 30203 Cartagena, Spain
*
Author to whom correspondence should be addressed.
Appl. Sci. 2025, 15(18), 10022; https://doi.org/10.3390/app151810022
Submission received: 17 August 2025 / Revised: 9 September 2025 / Accepted: 11 September 2025 / Published: 13 September 2025

Abstract

Featured Application

The methods, formulations, and parametric studies described in this paper, as well as their conclusions and design recommendations, were developed to assist designers in the conceptual design of all-steel arch bridges, particularly in cases where minimizing the bridge weight is a priority.

Abstract

In this paper, we present a novel iterative method that minimizes the weight of an all-steel arch bridge during the in-plane preliminary design stage. The behavior of the bridge is assumed to be contained within the plane of the arch. The preliminary design is assumed to be governed by the maximum allowable static deflection at a given checkpoint at the deck under a simplified load combination selected by the designer. The designer can select variables commonly used in preliminary design, such as the web slenderness of the cross-sections of both the arch and the deck and their relative flexural stiffness levels. Moreover, the general method is particularized for tied-arch bridges with vertical hangers: its iterative flowchart is adapted, an approximate analytical formulation that allows manual calculations is provided, and a parametric study that illustrates the effect of the main variables on the weight of the bridge is carried out. The main design recommendations drawn from this research for minimizing the weight of a bridge are as follows: a rise/span ratio between 1/5 and 1/7; cross-sections with significantly different stiffnesses in the arch and deck, ideally with highly flexible arches; and cross-sections with the thinnest possible webs.

1. Introduction

1.1. Preliminary In-Plane Design of Arch Bridges

Arch bridges are usually large and economically important structures, and they require very careful construction processes. Moreover, for arch bridges, there is a very close relationship between geometry, proportions, and structural behavior. Thus, the distribution of material between the arch and the deck or the shape of the arch are crucial for ensuring the quality of the design, perhaps more so than in other typologies. Thus, the conceptual design process of an arch bridge, which includes its preliminary design, is particularly important, and many research studies have been devoted to it. For example, Stavridis [1] has studied the structural behavior of arch bridges and Granata et al. describe (in [2]) the conceptual design of steel and composite concrete–steel tied-arch bridges, highlighting the influence of the geometry of the arch shape, the design of the arch–deck joint, and the construction sequence on its global behavior.
During the preliminary design stage of an arch bridge, it is usually assumed that its structural response can be divided into two partial behaviors: in-plane and out-of-plane arch behaviors; it is assumed that these can be analyzed separately, since, frequently, they are uncoupled structural systems. The preliminary in-plane design stage (i.e., under actions contained within the plane of the arch) is generally the most time-consuming step in this process, and it is usually carried out by experienced designers, because simplified yet accurate preliminary dimensioning can significantly speed up the entire design process. Preliminary dimensioning is usually based on the designer’s experience and studying examples of similar bridge typologies.
An example that illustrates how new arch bridges can be inspired by existing ones is provided by Mermigas and Wang [3], who collected the geometric information of 20 steel arch bridges to investigate the correlation between proportions and behavior. This information, presented in graphs, was used by the Ministry of Transportation in Ontario to evaluate a proposed design for a 75 m steel half-through arch bridge. Similarly, Manterola-Armisén [4] compiles the geometries, proportions, and construction processes (a very relevant aspect in bridge design) of several sets of real arch bridges.
The main dimensions of a bridge are often defined by rules of thumb. For example, Lebet and Hirt [5] recommend a range for the slenderness of steel arch bridges (given by the ratio f/L, where f is the rise of the arch and L is its span) and for the ratio (zA + zD)/L, where zA + zD are, respectively, the depths of the cross-sections of the arch and the deck. The geometry and proportions of concrete arch bridges have been studied, for example, by Leonhardt [6], Menn [7] or Salonga and Gavreau [8].
Parametric or sensitivity studies are also often carried out, mainly for long-span bridges. Modern studies make the most of the possibilities of computer-aided parametric design and optimization algorithms, as shown in Korus et al. [9], who combine FEM and genetic algorithms. In addition, they include studies on the span and span–rise ratios of a set of arch bridges constructed in Poland in the past 20 years.
An important aspect of arch bridge design is the geometry of the arch shape, especially in long-span bridges. Ideally, the arch should have an anti-funicular geometry, i.e., the geometric axis of the arch should be located as close as possible to the pressure line (thus being free of bending moments) for a given load case, usually permanent loads. However, due to the variability in traffic loads, it will not always be possible to completely avoid bending moments. Due to the structural and economic advantages of reducing bending in the arch and deck cross-sections, form-finding methods have received considerable attention from researchers. Recent examples include the studies of Jorquera-Lucerga [10] and Zhao [11].
The distribution of material within the arch and deck cross-sections is also very relevant. In general, cross-sections will have a high radius of gyration, √(I/Ω), where I is the second moment of area and Ω is the cross-section area. This means that the material is distributed in such a way that it is separated from the section centroid. This is true for hollow-box or symmetrical H sections, which are widely used in arch bridges. Doubly symmetric cross-sections are used in arches since live loads induce both positive and negative bending moments. In general, these types of sections maximize their second moments of area (which provide flexural stiffness and reduce deflections) and section modulus (which increases bending resistance) and reduce the arch’s buckling sensitivity. The problem of finding the most appropriate area distribution (i.e., minimizing the amount of material) has also been the subject of intensive research. As shown later in this paper, the process for the minimization of cross-section weight will follow Haaijer’s work [12] due to the simplicity of its formulation and the use of variables commonly employed in preliminary design.
For preliminary dimensioning purposes, it is common practice to consider that a solution is valid if certain simplified criteria regarding the serviceability limit state and ultimate limit state (SLS and ULS), such as deflections of stress limits, are fulfilled under simplified load combinations (SLCs). SLCs, which are defined by the designer, consist of simplified versions of the load combinations defined in codes and regulations (such as the Eurocodes [13,14]), in which only the most relevant actions are considered. Figure 1 shows an example of this approach, where SLCs only include the self-weight (ΩA and ΩD are the areas of the arch and deck cross-sections and γ is the density of steel), the most relevant superimposed dead loads gDL (which consider other permanent loads such as road surfacing, parapets, services, etc.), and the live load q due to traffic. Deflections and stresses under SLCs are evaluated at checkpoints (i.e., at specific locations chosen by the designer) and compared with allowable limits, i.e., δlim and σlim.
The preliminary design stage is an intrinsically iterative process: according to the results of the simplified calculations, the dimensions of the arch and deck cross-sections are refined until the criteria are met. This is by no means straightforward, since relatively simple steel cross-sections, such as hollow-box or symmetrical H-sections, are defined by four magnitudes (depth, width and thickness of web(s), and flanges, Figure 1). This process becomes even more complicated in arch bridges due to arch–deck interaction, since a change in the arch stiffness can significantly modify the internal forces of the deck, and vice versa.

1.2. Research Objectives

Therefore, in this context, there is a need for a method that helps designers simplify this step of the preliminary design process. The research presented in this paper aims to achieve the following research objectives:
  • Developing a method for the preliminary design of an arch bridge that verifies that, at a selected checkpoint at the deck, the maximum deflection δD is smaller than the maximum allowable deflection at the same point, δlim, under a given SLC.
  • Simplifying the design process by reducing the number of geometrical variables used to define the cross-sections.
  • Minimizing the weight of the bridge since, in general, the cost will be lower for a smaller amount of material.
  • Ensuring the usefulness of the method for designers. To achieve this goal, the input data must consist of variables commonly used in preliminary design. In particular, it should enable designers to select the relative flexural stiffness of the arch and deck, since this has a significant impact on arch bridge design (see Stavridis [1], Manterola-Armisén [4], or Menn [7]).
  • Realizing parametric studies to illustrate the effect of the main variables on preliminary design.
  • Developing an approximate analytical formulation to allow manual calculations of tied-arch bridges with vertical hangers, aiming to speed up the conceptual design step.

1.3. The δ-Method

The δ-method, which is presented in this paper, assumes that the preliminary design is governed by deflection limitations under a given SLC. The method has the same iterative structure as the preliminary design process. Firstly, a Finite Element Model (FEM) analysis (or, alternatively, accurate manual calculations) is carried out. Secondly, depending on the results, the method guides the designer on how to modify the cross-sections of the structure until the preliminary design goal is achieved. As a result, the cross-sections of both the deck and the arch are dimensioned to verify δD = δlim. The above-mentioned research objectives 2 to 4 are fulfilled as follows:
Research objective 2: It is assumed that the cross-sections of both the arch and the deck are doubly symmetric, a configuration often used for arch bridges. Additionally, it is assumed that the thicknesses of the flanges of both the arch and deck cross-sections are small compared to their depths. Thus, Section 2.5 will demonstrate how a cross-section and its mechanical properties can be fully defined by its area Ω, its depth z, and the slenderness of its web β.
Research objective 3: Section 4 shows that the vertical deflection δD depends not only on the area of the arch and the deck, ΩA and ΩD, respectively, but also on their second moments of area, IA and ID. Based on Argüelles [15] and Haaijer [12], Section 2.5 demonstrates how, for a given β, the material of the cross-section can be distributed to achieve a target value of I with a minimum Ω, i.e., a minimum weight.
Research objective 4: As intended, Ω and β are variables widely used for preliminary design. Moreover, Section 2.3 shows how arch–deck interaction is defined by a single parameter, CA, which varies between 0 and 1, and represents the contribution of the arch to the total flexural stiffness of the structure.
This method intends to help designers, since deflection limitations are often the governing criteria for dimensioning some types of arch bridges, such as tied-arch bridges with vertical hangers (Manterola-Armisén [4]). Therefore, other verifications related to the ULS, buckling, etc., are outside the scope of this method and should be carried out separately. Ongoing research conducted by the authors should provide a method for preliminary design that also considers cross-section failure.

1.4. Structure of the Paper

Section 2 describes the general in-plane preliminary design strategy, detailing the assumptions of the method, as well as its scope. Section 3 describes the general δ-method, which can be used for many different types of arch bridge typologies. Section 4 adapts the δ-method specifically to tied-arch bridges with vertical hangers, based on an approximate theoretical formulation, which is also described in detail. Section 5 shows three case studies, with examples of applications of the δ-method. In the second example, the method results are compared to the dimensions of real bridges, while in the third example, the effect of an alternative SLC is shown. In Section 6, a set of preliminary parametric studies are carried out. Thanks to these studies, the number of case studies needed in the parametric studies (Research objective 5) of Section 7 is reduced. In Section 8, the theoretical formulation developed in Section 4 is adjusted thanks to the results of the parametric studies carried out in Section 7 (Research objective 6). Finally, Section 9 provides the conclusions drawn from this research and some design recommendations.

2. Preliminary In-Plane Design Approach

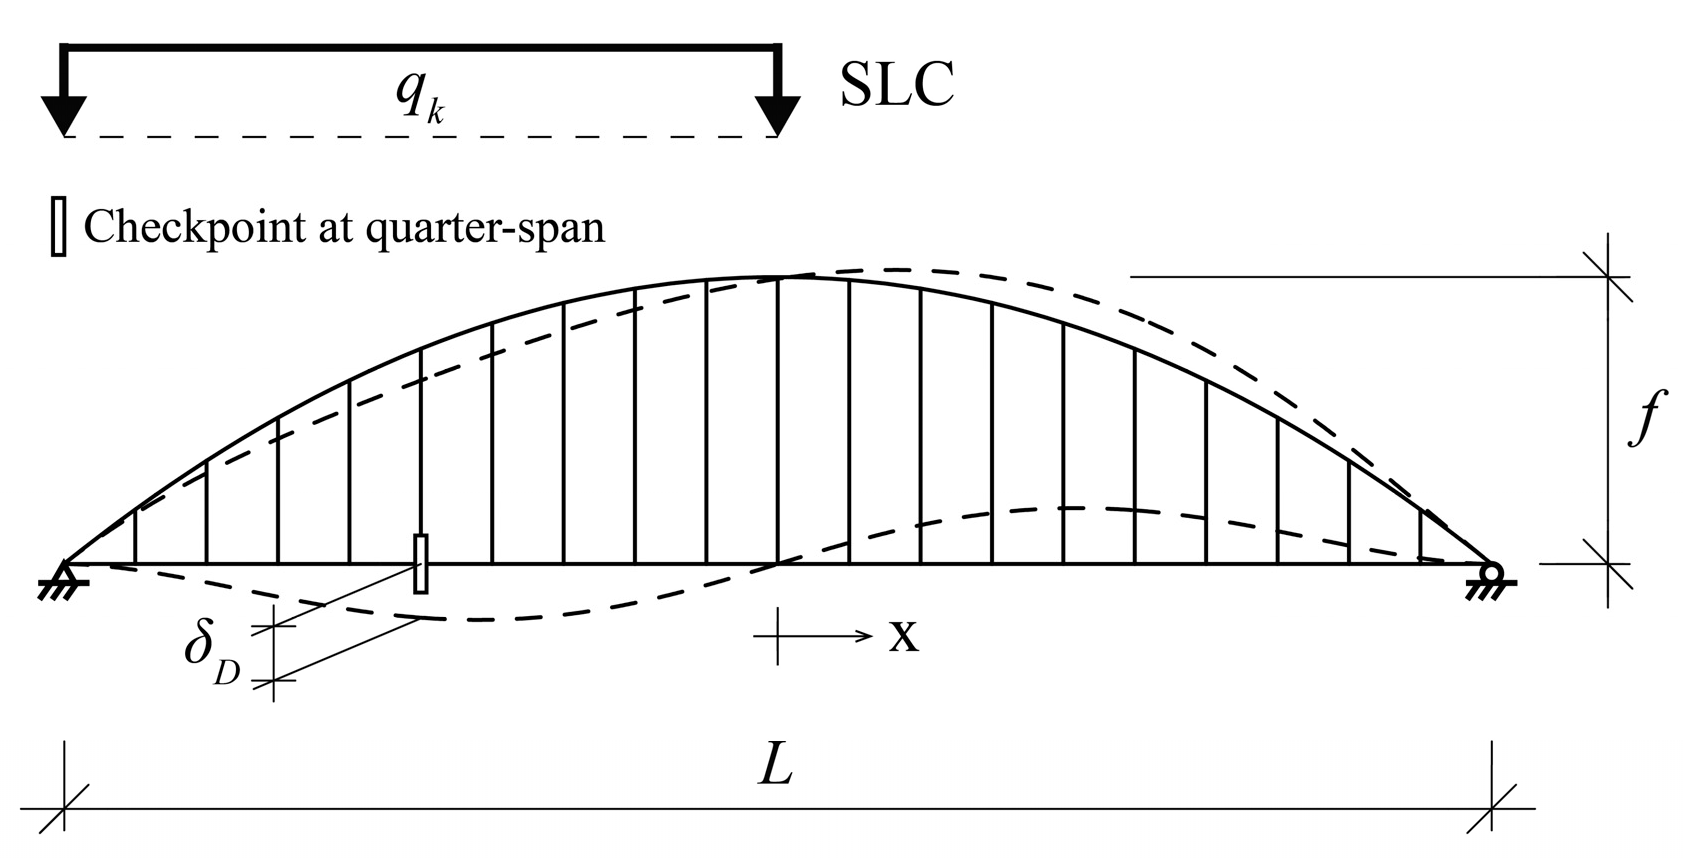
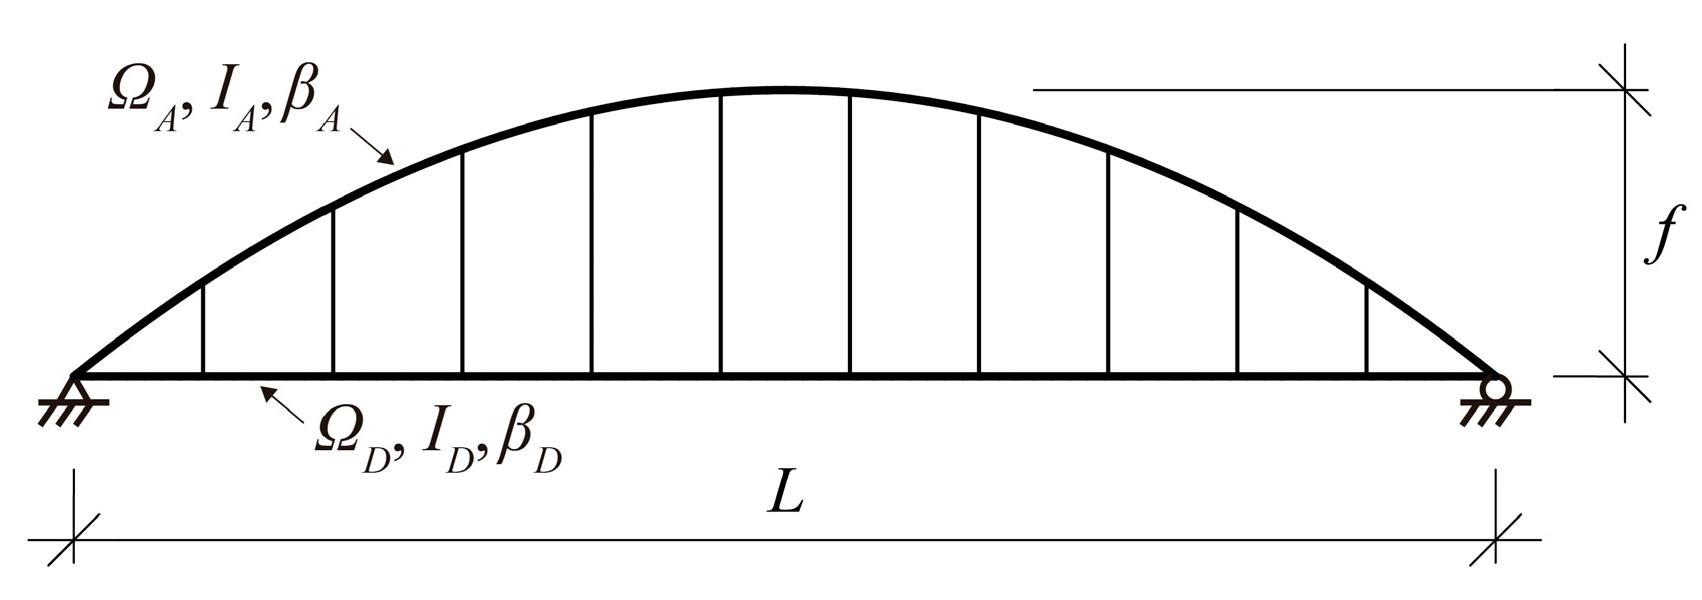
This paper considers a typical bridge composed of a vertical planar arch and a straight deck of span L, supported by a second-degree parabolic arch with rise f (Figure 2). It is assumed that its behavior is contained within the vertical plane. The method can be easily applied to twin-arch bridges simply by considering the tributary load acting on each arch and deck.

2.1. Maximum Deflection Criterion

The method described in this paper, namely, the δ-method, provides the in-plane dimensions of the cross-sections of both the arch and the deck, which correspond to a minimum-weight bridge that strictly verifies the SLS criterion, i.e., that, at a selected checkpoint, the difference between the deflection of the deck under an SLC, δD, and the maximum allowable deflection, δlim, is smaller than a previously defined tolerance: |δD(SLC) − δlim| < tol.
Although it optimizes the weight of the structure, the method does not make use of any optimization methodologies, such as genetic (e.g., Prendes Gero et al. [16] and Liu et al. [17]) or metaheuristic algorithms (e.g., Saka et al. [18]). Instead, the method uses a classical structural approach, allowing for an intuitive interaction with the designer and making the process extremely adaptable.

2.2. Definition of SLC and Checkpoints

The deflections under the SLC are obtained through a FEM linear elastic analysis of the structure. Non-linearity can also be considered when needed. As in every preliminary design process, the designer’s judgement plays a crucial role, since they define the locations of the checkpoints, δlim, and the factored load cases included in the SLCs. The selected SLC and checkpoint location depend on the bridge typology. This paper, which focuses on tied-arch bridges with vertical hangers, considers an SLC that corresponds to a partial live load arrangement over the left half of the span, as described in Stavridis [1], Lebet [5], or Menn [7]. The checkpoint is located at the quarter-span of the deck.

2.3. Arch–Deck Interaction

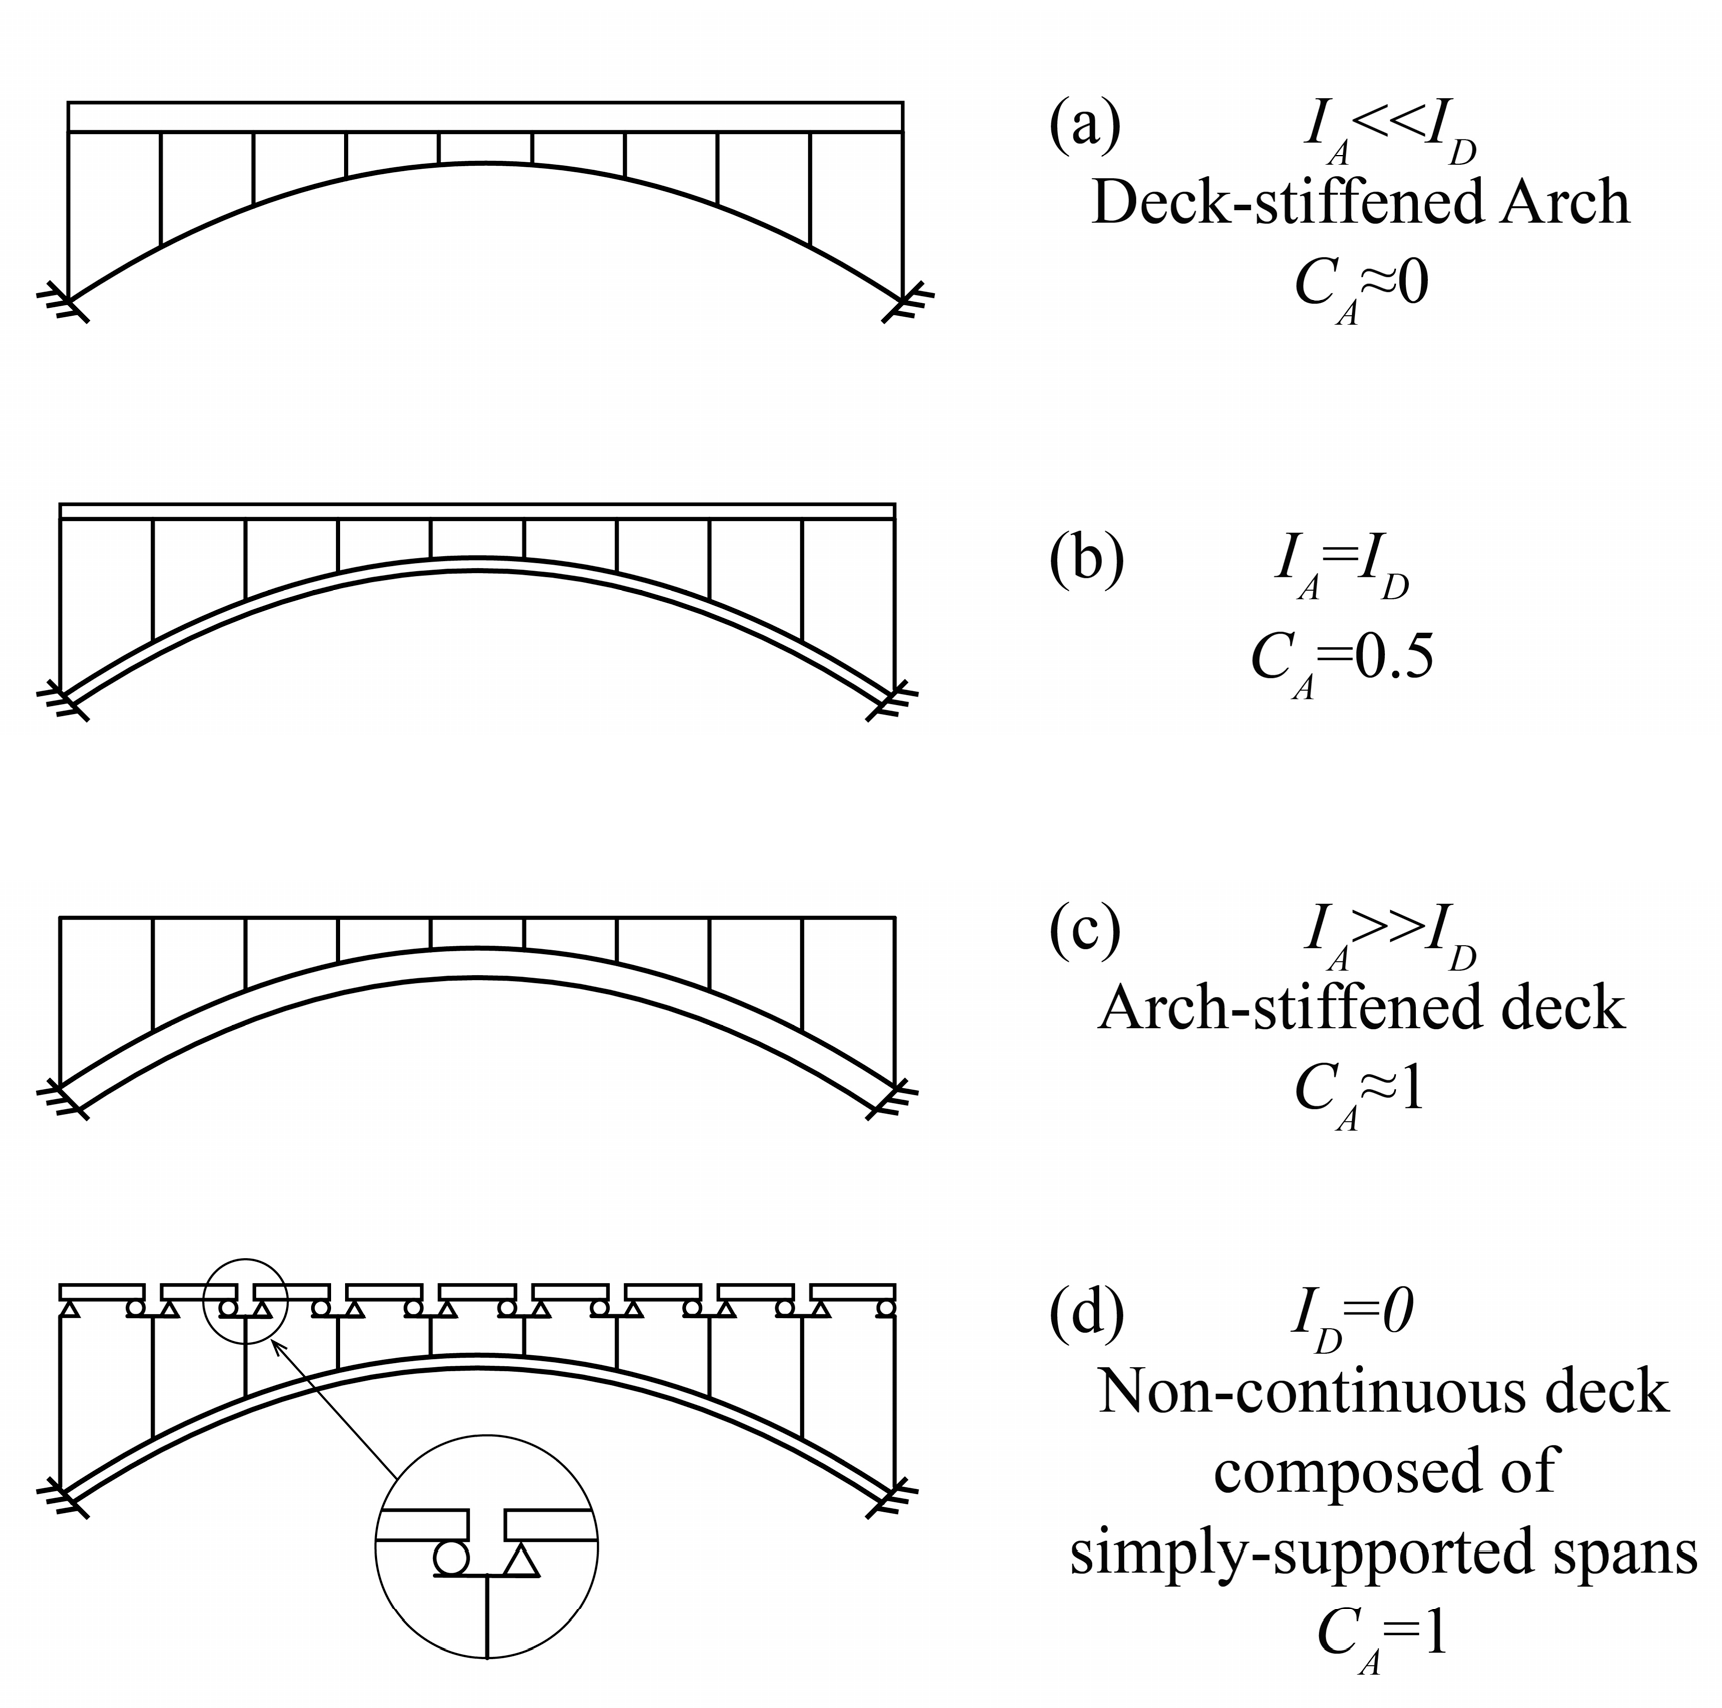
The arch–deck interaction is crucial in determining the structural response of an arch bridge. In the δ-method, it is implemented by defining a single parameter, CA, which represents the contribution of the arch to the global bending stiffness of the bridge:
C A E A · I A E A · I A + E D · I D
where EA and ED are the Young moduli for the materials of the arch and the deck, respectively. Since both the arch and the deck are made of steel, EA = ED, and Equation (1) can be written as
C A I A I A + I D
Figure 3 illustrates how CA ranges from very low values, close to 0, for deck-stiffened arches, such as those pioneered by Maillart (see Billington [19]), to values close to 1 when the flexural stiffness of the deck is very small with respect to that of the arch. CA can be exactly 1 when the contribution of the deck is negligible, as occurs when the deck is composed of simply supported (i.e., non-continuous) spans.

2.4. Doubly Symmetric Cross-Sections

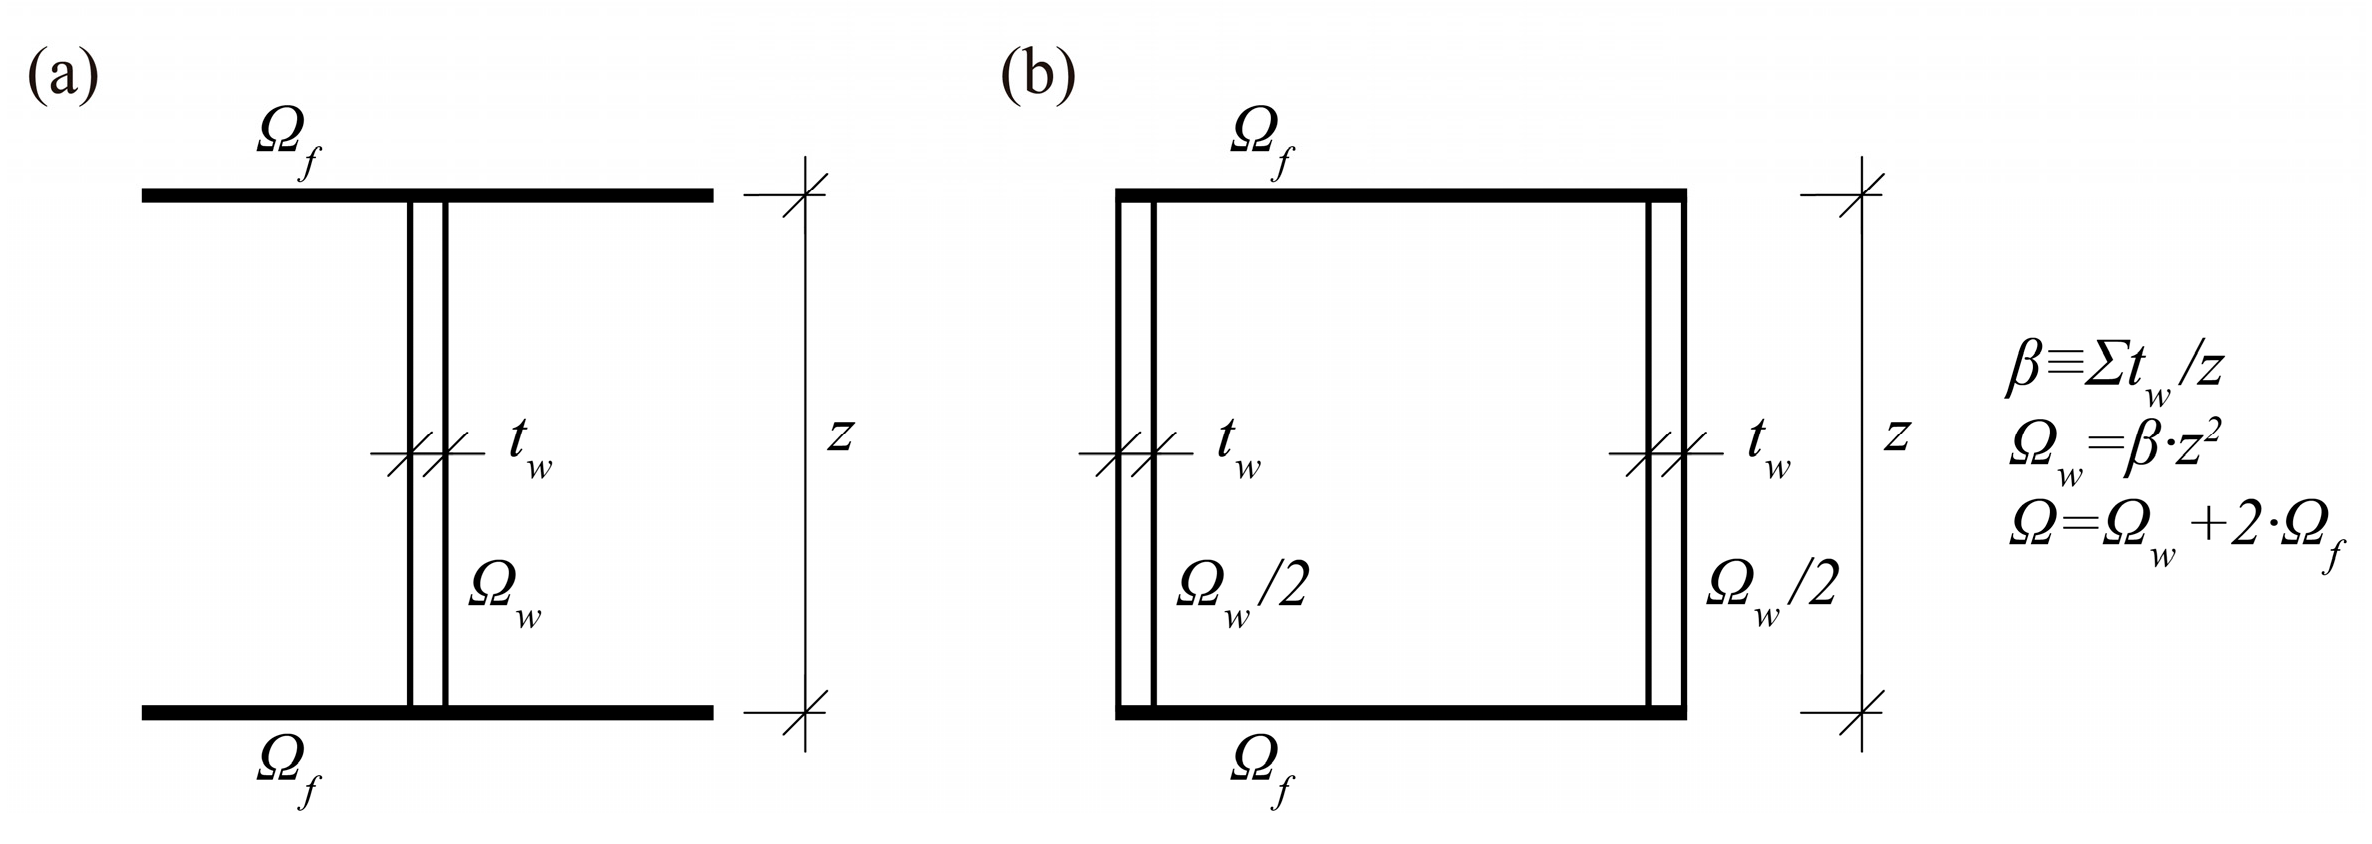
This paper considers doubly symmetrical (i.e., symmetrical with respect to the horizontal neutral axis) all-steel hollow boxes and H-sections (Figure 4). This approach was chosen because, usually, arches have a doubly symmetrical cross-section and the deck cross-section can often be approximated as a doubly symmetrical section for preliminary sizing purposes. When this assumption is inaccurate for a preliminary design, as is the case for composite steel–concrete decks, the formulation shown in this paper should be adapted accordingly. Using symmetric cross-sections also has the advantage that the coordinates of the centroidal axes of the arch and the deck remain unchanged when refining the FEM model at each iteration.

2.5. Mechanical Properties of Cross-Sections

Since the structural behavior of the bridge is assumed to be contained within the vertical plane, only the in-plane mechanical properties of the cross-sections (such as the area Ω, its second moment of area I, and its elastic section modulus W) are relevant for its in-plane preliminary design. These properties can be accurately estimated (Argüelles [15], Haaijer [12]) by using only three intuitive and commonly used variables (Figure 4):
  • The cross-section area, Ω.
  • The distance between the center lines of the flanges, z. The flange thickness is assumed to be small compared to z, which means that, in practical terms, z coincides with the cross-section depth, and, thus, the area of each flange Ωf, is concentrated at each end of the web.
  • The geometrical slenderness of the web (or webs) of the cross-section, β, which is very relevant in the classification and behavior of steel cross-sections (see Eurocode 1 [14]). Equation (3) defines β for both the box and H-section cross-sections shown in Figure 4, regardless of the number of webs:
β i t w , i z
For both sections shown in Figure 4, and for the given values of Ω and β, I and W can be expressed as follows (Jorquera-Lucerga and García-Guerrero [20]):
I 1 12 · β · z 4 + 2 · Ω f · ( z 2 ) 2 = z 2 2 · ( β · z 2 6 + Ω f ) = Ω · z 2 4 β z 4 6
W = I z 2 = z · ( β · z 2 6 + Ω β · z 2 2 ) = Ω · z 2 β z 3 3
The maximum possible value of z corresponds to Ωf = 0 (i.e., when the whole area is in the web and the cross-section becomes rectangular), which leads to
0 < z     Ω β
The areas of the cross-sections shown in Figure 4 can be distributed in such a way that, for the given Ω and β, their second moment of area, or inertia, is the maximum, Imax. The depth of this section is zI. These values are obtained as follows:
d ( I ( z ) ) d z = 0
z I = 3 · Ω 4 · β
I m a x = I ( Ω , β , z I ) = 3 · Ω 2 32 · β
which is the maximum possible value of I for a given area Ω and web slenderness β. Since the web area Ωw = β·z2, a very practical consequence of Equation (8) is that I = Imax for a given β when Ωw = 0.75·Ω.
The reader should bear in mind that Equation (9) cannot be applied to Class 4 sections (classified according to Section 5.5 of Eurocode 3.1 [14]), since the cross-section is assumed to be doubly symmetric and its whole area is considered in the estimation of I (i.e., it is effective). Therefore, the δ-method, as presented in this paper, is limited to Class 1, 2, and 3 sections.
As Equation (9) shows, a low β value (i.e., a thin web) means that a smaller area is needed to achieve a target value of I. In practical terms, β = 1/100, which corresponds to the web slenderness for pure bending of a Class 3 section for S355 steel (according to Table 5.2 of Eurocode 3.1 [14], c/t ≤ 124·0.81 =100.44), can be considered, approximately, to be a lower bound for web slenderness, especially in arch cross-sections.

2.6. Scope of the Method

The authors have previously studied different typologies of arch bridges (see, for example, García-Guerrero [21]) prior to this study. Since the authors were already familiar with these typologies, the method was tested and successfully applied to some of them, as shown in Figure 5, such as arches with or without hinges, tied-arch bridges, open spandrel arch bridges, Nielsen–Löhse bridges (see Manterola-Armisén [4], Menn [7], and Park and Hewson [22]), or network-type arches (see Tveit [23]). The SLC and checkpoint location depend on the bridge typology. The results of these studies are expected to be published soon.
The δ-method can be also applied, with no modification, to arches or decks with variable cross-sections, provided the whole arch or the deck are fully defined by knowing the size of one given cross-section. Figure 6 shows examples of area distributions to which the method can be applied.
One feature of the method with great potential is that the designer can update the typology of the bridge at will during any step of the process. This is as simple as updating the FEM model according to any desired design criteria at any iteration. For example, the arch can be forked if it is wider than a given threshold value. Although the effects of non-linearity under SLS combinations are rarely significant for these types of bridges, both geometric and material non-linearity can be considered just by including them in the FEM analysis at each iteration.
This paper assumes that design is governed exclusively by deflection limitations under a given SLC. Therefore, readers should bear in mind that this method does not consider all possible in-plane failure modes, such as section failure or in-plane buckling. Although these bridges rarely fail due to in-plane buckling (see, for example, Lebet and Hirt [5], Romeijn and Bouras [24], Chengyi et al. [25], and Tang et al. [26]), this issue must be checked at a later stage of the design process if necessary.

3. The δ-Method: General Case

As will be demonstrated, the essence of the δ-method is that although δD, under the SLC, depends on ΩA, ΩD, IA, and ID, the assumptions in Section 2 allow us to express δD as a function of ΩA exclusively, which becomes the only unknown variable. The auxiliary coefficient μ makes this easier:
μ E D · I D E A · I A = 1 C A 1
As is well known, the greater the second moment of area, the smaller the deflections. Therefore, ΩA and ΩD must be distributed in such a way that their inertias, IA and ID, are maximized. The maximum inertia for the cross-section of the arch and the deck, Imax,A and Imax,D, respectively, are given by Equations (11) and (12), where Equation (9) has been particularized for the arch and deck cross-sections, as follows:
I A = I m a x , A = 3 Ω A 2 32 · β A
I D = I m a x , D = 3 Ω D 2 32 · β D
If Equations (11) and (12) are substituted into Equation (10), then
μ = E D 3 Ω D 2 32 · β D E A 3 Ω A 2 32 · β A
Ω D = Ω A μ E A E D   β D β A
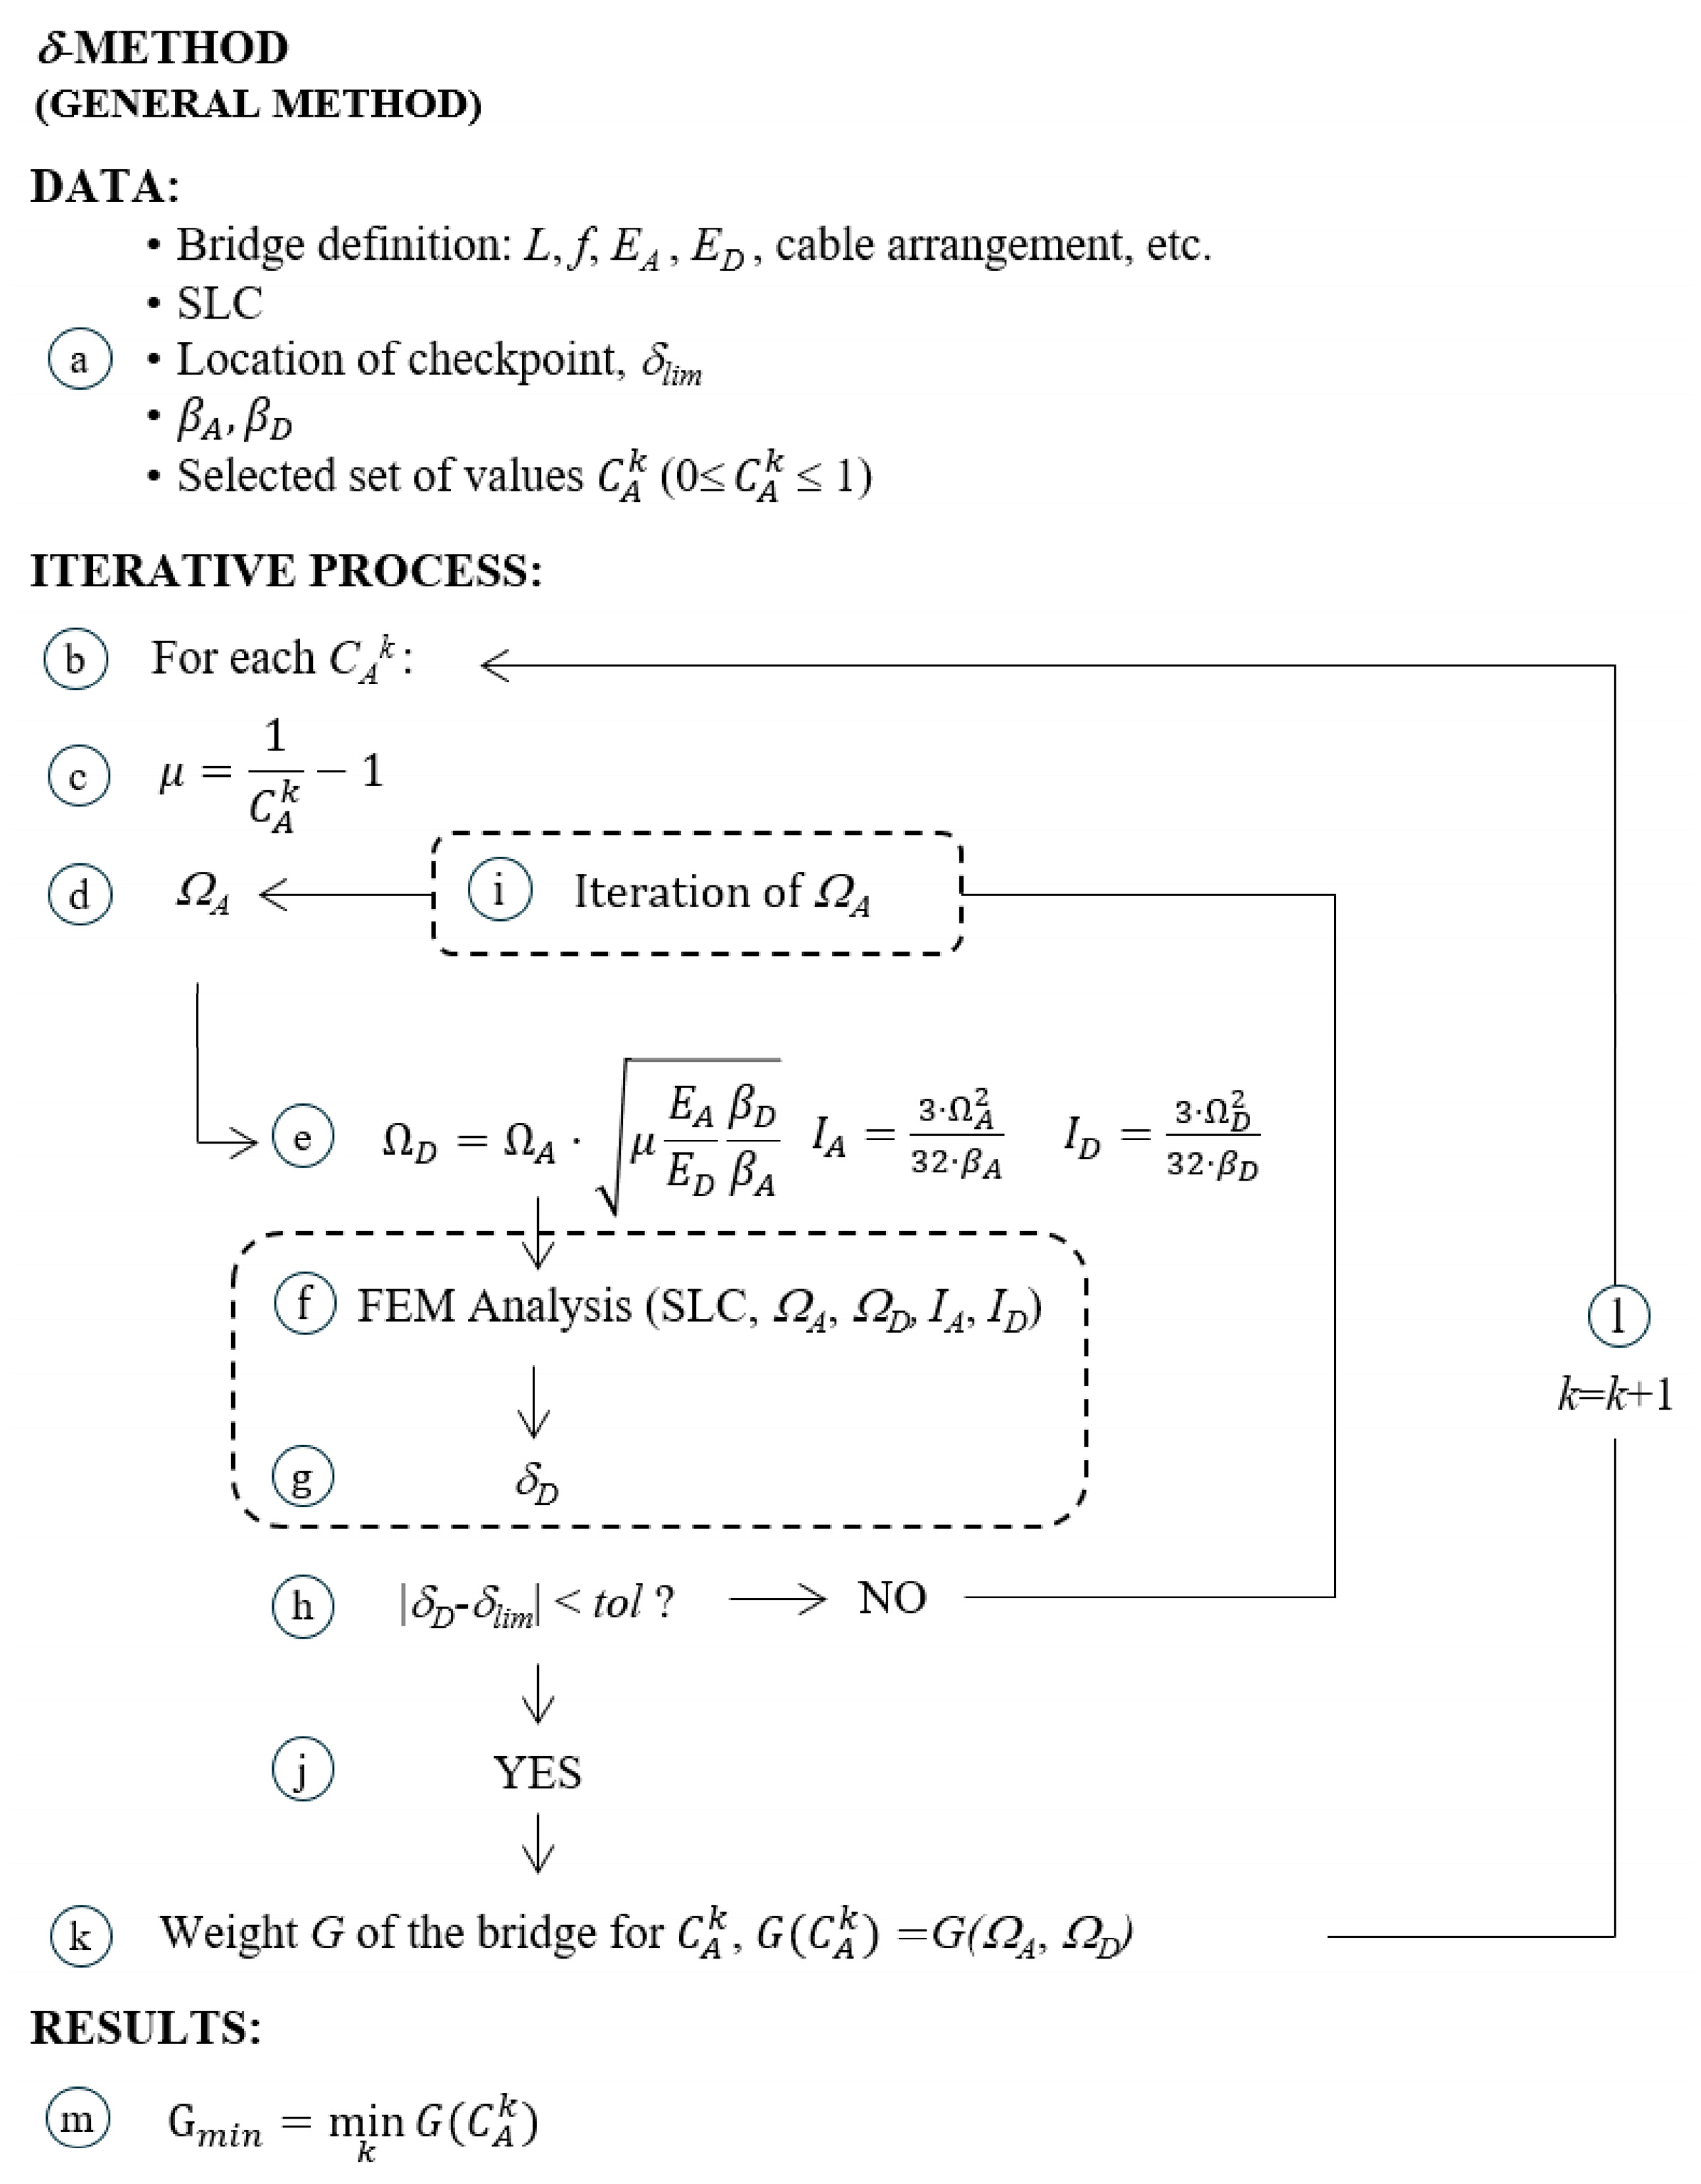
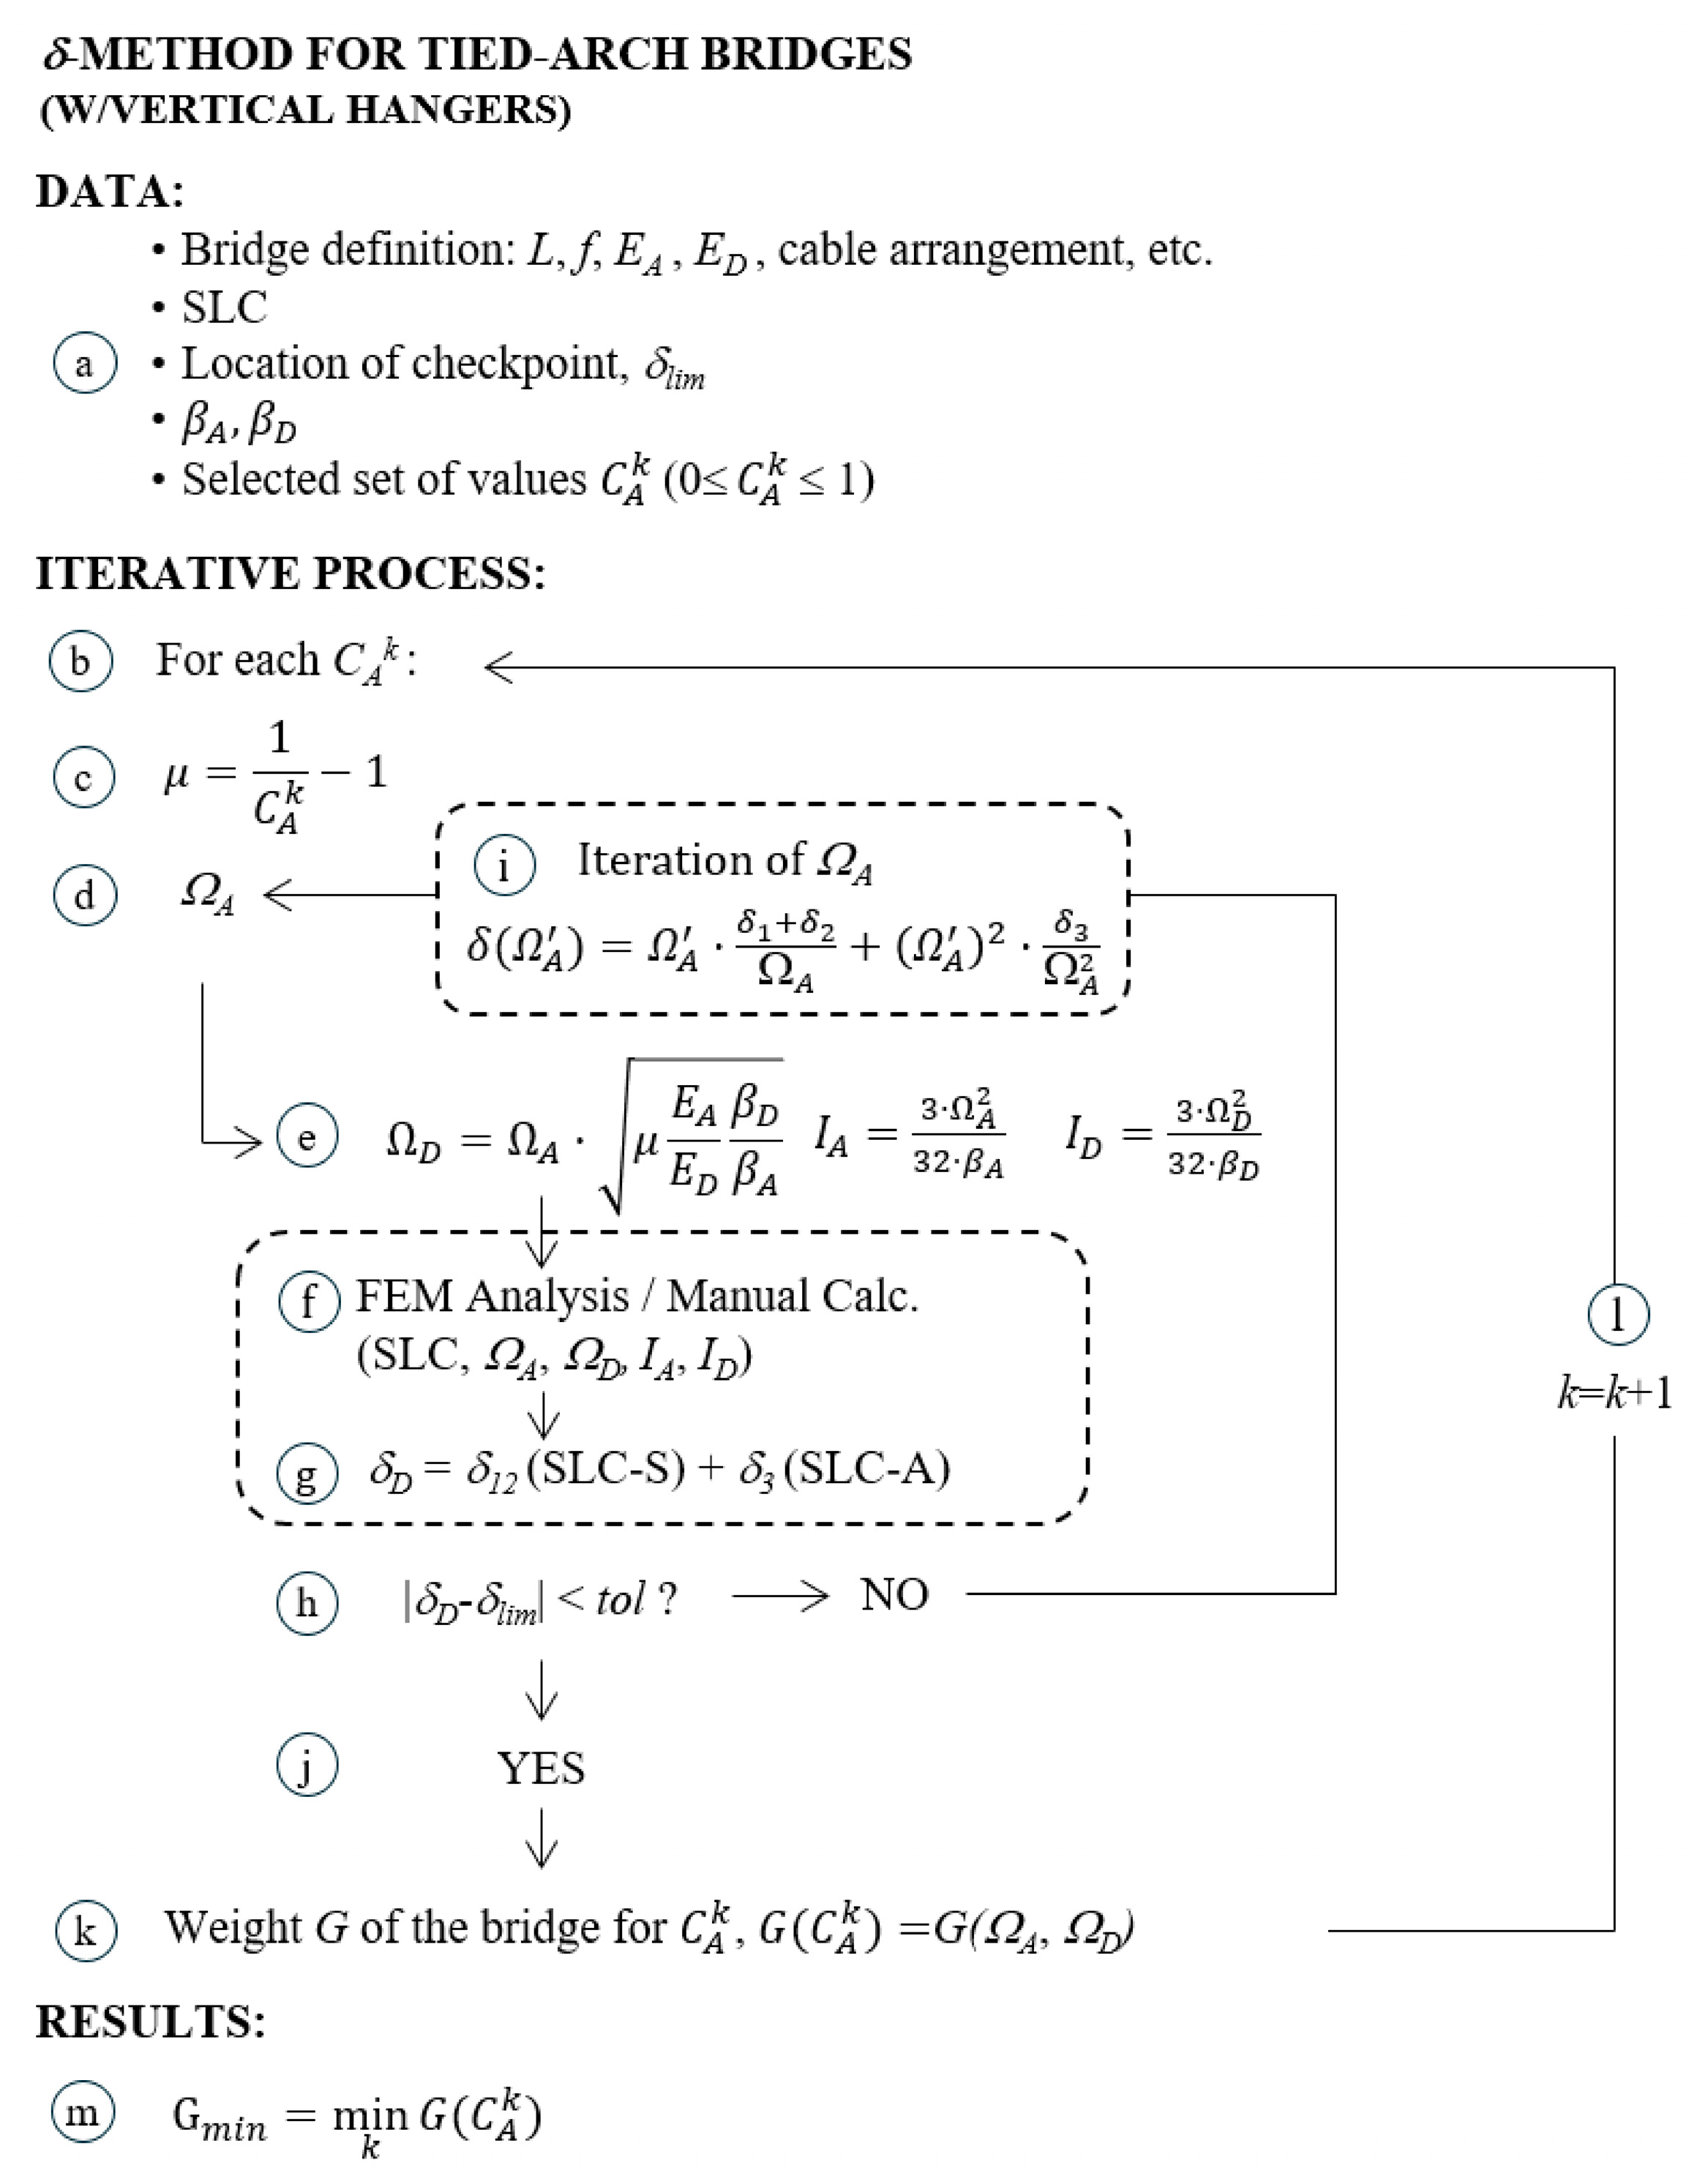
So, Equations (11), (12), and (14) demonstrate that ΩD, IA, and ID, respectively, can be expressed as a function of ΩA. Figure 7 shows the flowchart for the δ-method. The process begins with defining the data (step a): the geometry, topology, and cable arrangement of the bridge; the SLC; the maximum allowable deflection δlim; and the location of the checkpoint at which the vertical deck deflection under the SLC, δD, will be evaluated and compared to δlim. Then, the designer selects the slenderness of the cross-sections of the arch and the deck, βA and βD, as well as the range of CA values (0≤ CA ≤ 1) for which the method will be applied. One advantage of this method is that the designer can restrict the range of CA values for which the method is applied, although it is always possible to conduct a systematic search, i.e., without a predefined range of CA. This is the reason why CA has been defined in a way that varies between 0 and 1.
The method is applied, sequentially, for all the chosen values of CA (step b). For each one, the auxiliary coefficient μ is evaluated (step c). The designer (step d) only needs to provide ΩA, since ΩD, IA, and ID are determined by Equations (14), (11), and (12), respectively (step e). With these mechanical properties, a FEM analysis of the bridge is carried out (step g), and the deflection δD (SLC) is obtained. The FEM analysis can either be linear or non-linear. The process is repeated until the difference between δD and δlim is smaller than the predefined tolerance tol (step h). Bisection or Newton methods usually provide a reduced number of iterations for ΩA. As an alternative, although Equation (29) was obtained for tied-arch bridges, it often achieves very fast convergence for other types of bridge. The designer should bear in mind that preliminary designs are carried out for one or several SLCs and that refining the solution is likely to be necessary. Therefore, setting tol too low does not lead to better designs, but rather an excessive calculation time.
The weight of the bridge (G, step k) can then be obtained directly from the output of the FEM model as the sum of the vertical reactions for the self-weight of the arch or the deck. Alternatively, for constant cross-sections, it can be estimated using
G = G A + G D = γ · ( L A · Ω A + L · Ω D )
where γ corresponds to the density of steel (78.5 kN/m3). The length of the 2nd-degree parabolic arch, LA, can be estimated as the sum of the lengths of the arch segments or, alternatively, according to Equation (16) (from Strasky [27]):
L A   L + 8 f 2 3 L
The process is repeated for the next value of CA (step l). The minimum-weight bridge can be easily found simply by comparing the weights of a set of bridges obtained for all the values of CA (step m). In the following section, the steps inside the dashed rectangles in the flowchart will be tailored for tied-arch bridges.

4. Method for Tied-Arch Bridges with Vertical Hangers

4.1. SLC and Location of Checkpoints

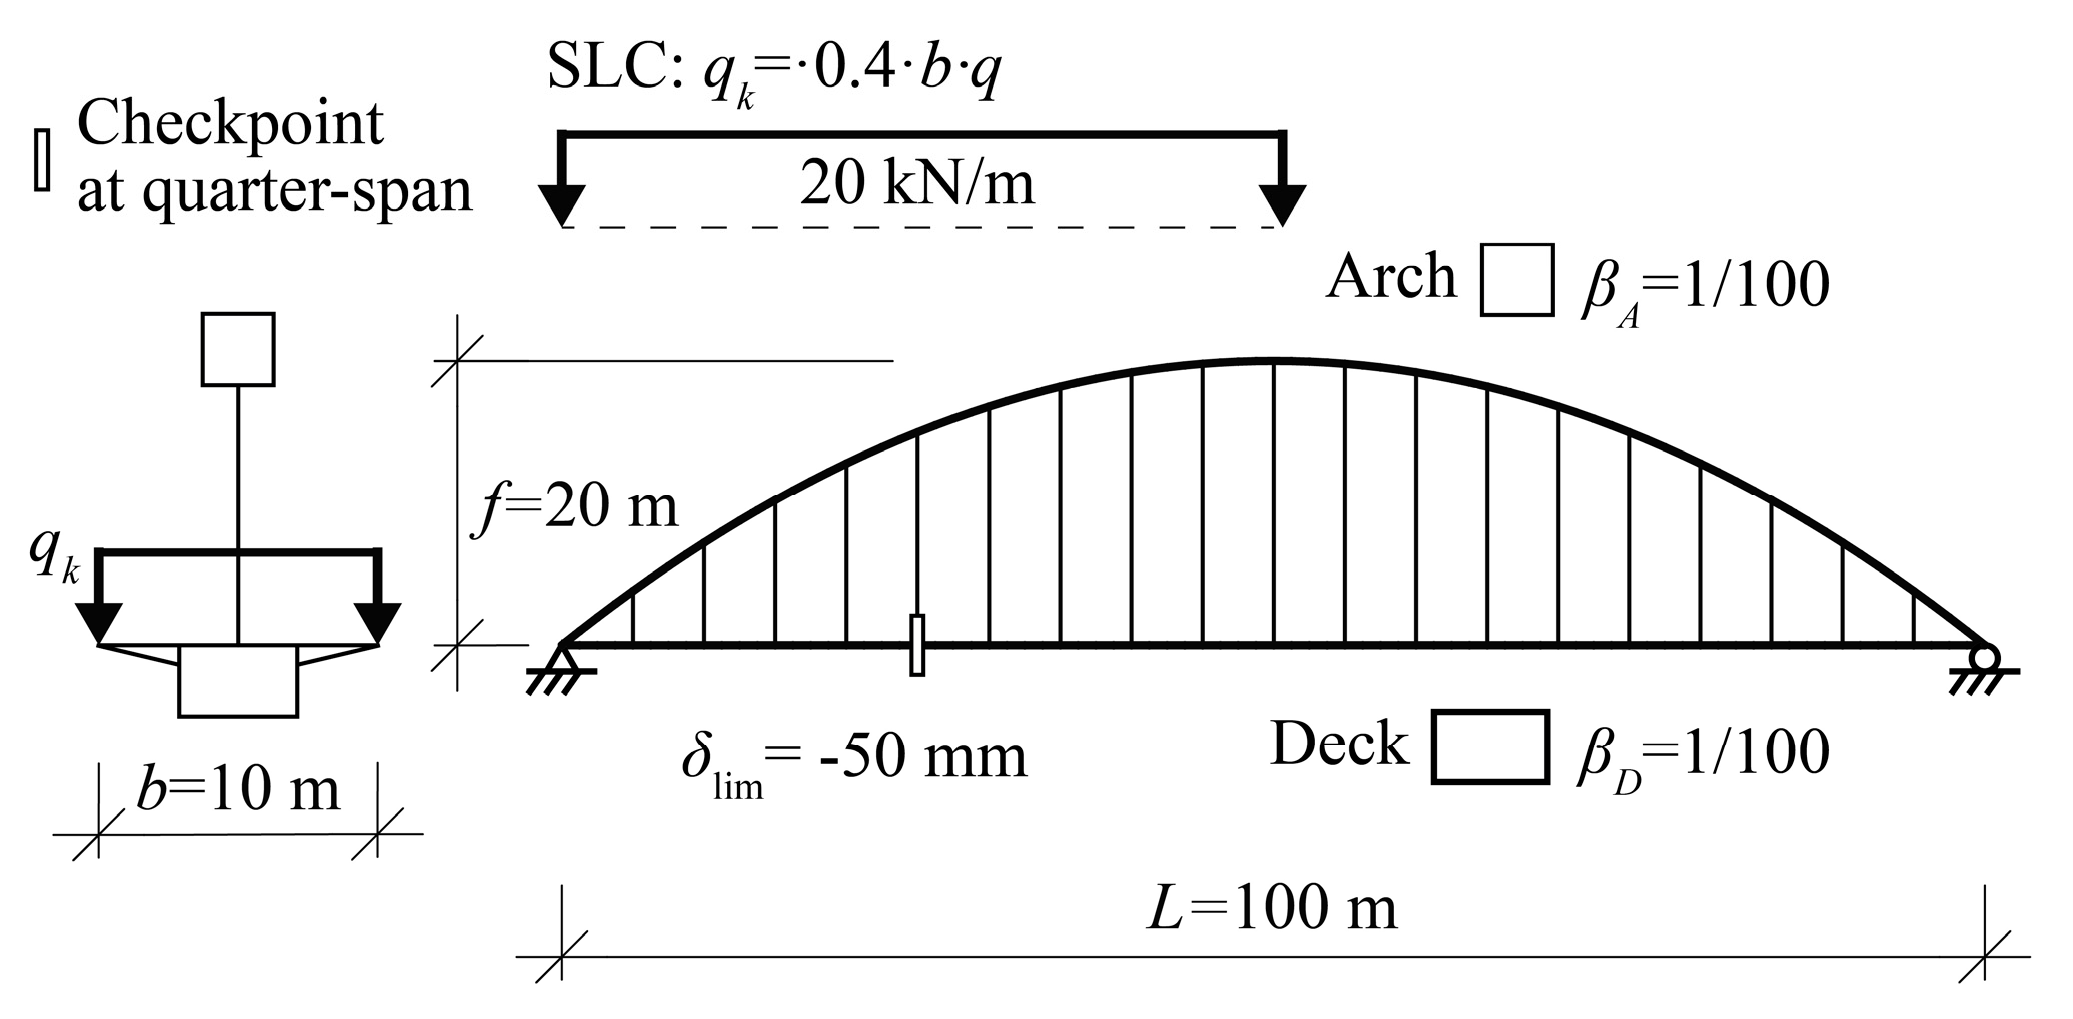
According to Manterola-Armisén [4] and Menn [7], the maximum deflections for tied-arch bridges with vertical hangers are supposedly due to an SLC corresponding to a uniformly distributed load (UDL) qk acting on half the deck (Figure 8). This SLC can be decomposed into two other load combinations: SLC-S (symmetric), with a UDL load of qk/2 acting downwards on the whole deck, and SLC-A (antisymmetric), where two opposing UDLs, upwards and downwards, equal to −qk/2 and qk/2, respectively, act on each half of the deck. The checkpoint is located at the quarter-span (x = −L/4), where the deflections are expected to be maximum under SLC-A. Obviously, depending on the designer’s experience, alternative SLCs can be defined.
The designer also defines the maximum allowable deflection, δlim, which usually depends on how close the SLCs are to the exact combination defined by regulations. As an example, the Spanish IAP [28], inspired by Eurocode 1 [13], and the Spanish National Annex to Eurocode 0 [29] consider δlim = L/1000 for bridges and δlim = L/1200 for footbridges under the frequent part (i.e., factored by Ψ = 0.4) of the vertical live load. For arch bridges, L should be the distance between the inflection points of the deformed shape. Therefore, since most of the deflection is due to SLC-A, a value of δlim = L/2000 can be considered.
A value of 5 kN/m2 has been considered for the SLC. This coincides with the UDL defined for Load Model 4 of Eurocode 1 [13] and is an intermediate value of the UDLs defined in Load Model 1 for the different notional lanes. Therefore, qk = 0.4·5 = 2.0 kN/m2.

4.2. Theoretical Formulation of Deflections for Tied-Arch Bridges with Vertical Hangers

For preliminary design purposes, a theoretical formulation is presented for estimating the deflections of tied-arch bridges under symmetrical and non-symmetrical UDLs. Although it can be used in other contexts, the most relevant consequence is that it provides the basis for adapting the δ-method for tied-arch bridges composed of an arch and a deck, linked by a set of vertical hangers pinned at both ends. Moreover, the arch–deck joint is supposed to be hinged for the sake of simplicity. The proposed formulae decompose the total deflection δ into three addends: δT1, δT2, and δT3. The sub-index T indicates that these deflection values correspond to theoretical formulae rather than to the “actual” values (without the sub-index) that can be obtained, for example, from a FEM analysis. As shown in Figure 9, they correspond, respectively, to the vertical deflections at the deck checkpoint (i.e., at x = −L/4) due to the axial shortening of the arch, the elongation of the deck acting as a tie between the springings, and, finally, the effect of the bending moments at both the arch and the deck.
δ T , x = L / 4 = δ T 1 , x = L / 4 + δ T 2 , x = L / 4 + δ T 3 , x = L / 4
According to Nettleton [30], the following expression can be used to estimate δT1 at the crown (x = 0), where NA is the axial force at the arch under SLC-S and f is its rise:
δ T 1 , x = 0 = N A ,   x = 0 E A · Ω A · ( L 2 5 · f + f )
For estimating δT2, Equation (18), where ND is the axial force at the deck under SLC-S, adapted from Buchholdt [31], originally developed at x = 0 for a funicular cable with flexible supports, provides good results:
δ T 2 , x = 0 = 120 · L 4 320 · f 2 · L 2 + 2304 · f 4 640 · f · L 3 3072 · f 3 · L · N D · L E D · Ω D
The values of NA at x = 0 (which is a compressive axial force) and ND (which is a constant tension axial force, since the deck is only horizontally loaded at the springings) can be obtained from
N A , x = 0 = N D = q k L 2 16 f
The deflection δT3 at the quarter-span under SLS-A can be estimated using the classical explicit expression
δ T 3 , x = L / 4 = q k 2 · ( L 2 ) 4 384 · ( E A I A + E D I D ) = q k · L 4 12 , 288 · ( E A I A + E D I D )
In the studied bridges, δT1 + δT2 is usually several times smaller than δT3, which means that the deflections are mainly due to the bending moment of the structure, which are due to SLC-A, and not to its axial forces, which are due to SLC-S.
To apply the method, the values of δT1 and δT2 must be calculated at the location of the checkpoint (x = −L/4, Figure 9), where δD is compared to δlim. To obtain the deflection at x = −L/4, the values of δT1,x=0 and δT2,x=0 must be factored by two coefficients, k1δT1,x=−L/4T1,x=0 and k2δT2,x=−L/4T2,x=0, as follows:
δ T x = L / 4 = k 1 · δ T 1 , x = 0 + k 2 · δ T 2 , x = 0 + δ T 3 , x = L / 4
As a first approximation, k1 and k2 can be considered 0.75, which corresponds to the assumption that the deformed shape of the deck under SLC-S is a 2nd-degree-parabola:
δ T x = L / 4 0.75   ( δ T 1 , x = 0 + δ T 2 , x = 0 ) + δ T 3 , x = L / 4
More precise values of k1 and k2 will be obtained in Section 6.

4.3. Correction of Area Between Iterations

As just shown in Equations (18) and (19), δ1 + δ2, due to SLC-S, depend on ΩA and ΩD, and δ3, due to SLC-A, depends on IA + ID according to Equation (21). Therefore, the three deflections can be rewritten in the following way, in which the coefficients ai gather in one constant the remaining terms of each equation:
δ D = δ T 1 + δ T 2 + δ T 3 = a 1 Ω A + a 2 Ω D + a 3 E A I A + E D I D
As shown in Equation (14), ΩD can be expressed as a function of ΩA, and it is determined to be the same for EA·IA + ED·ID using the auxiliary coefficient μ:
E A I A + E D I D = E A I A   ( 1 + μ ) = E A · 3 Ω A 2 32 · β A   ( 1 + μ )
Thus, Equation (24) can be rewritten in such a way that ΩA is the only unknown variable and ai is just new auxiliary coefficients (i.e., different from those shown in the Equation (24)) that gather the remaining terms of the expression:
δ D = δ T 1 + δ T 2 + δ T 3 = a 1 Ω A + a 2 Ω A + a 3 Ω A 2
Gathering δT1 and δT2 in the same term, Equation (26) can be rewritten as
δ D = δ T 1 + δ T 2 + δ T 3 = a 12 Ω A + a 3 Ω A 2
Therefore, for tied-arch bridges with vertical hangers, once δD is calculated for a given area ΩA (for example, as a result of a FEM calculation), the value of δD for a different value of the area of the arch, ΩA’, can be expressed as
δ D ( Ω A ) = Ω A · δ 1 + δ 2 Ω A + ( Ω A ) 2 · δ 3 Ω A 2
This equation can be used (step i) to iteratively refine the value of ΩA in the δ-method.

4.4. Flowchart

Figure 10 shows the flowchart of the δ-method adapted to tied-arch bridges with vertical hangers, where steps i, f, and g, inside the dashed rectangles, have been rewritten, according to Equations (23) and (28), as detailed in this Section.

5. Example of Application

5.1. Tied Arch with Vertical Hangers

To illustrate the capabilities of the adapted δ-method detailed in Section 4, the weight minimization of the arch and the deck of the tied-arch bridge defined in Figure 11 is now fully developed. The main data are ψ = 0.4, b = 10 m, q = 5 kN/m2 (therefore, qk = b·ψ·q = 20 kN/m), L = 100 m, f/L = 0.2, δlim = L/2000 = 50 mm, and βA = βD = 1/100. The results for a set of 25 values for CA between 0.02 and 0.98 are shown in Figure 11, Figure 12 and Figure 13.
The initial value of ΩA when first implementing the method is obtained by assuming that δ3/(δ1 + δ2) = 1.2, which is a frequent value in the bridges studied, and leads to
δ l i m = L 2000   1.2 · δ T 3 = 1.2 · 5 · q k · ( L 2 ) 4 384 · E A · I A · ( 1 + μ )
Once IA is obtained, the initial value of ΩA can be obtained from Equation (11).
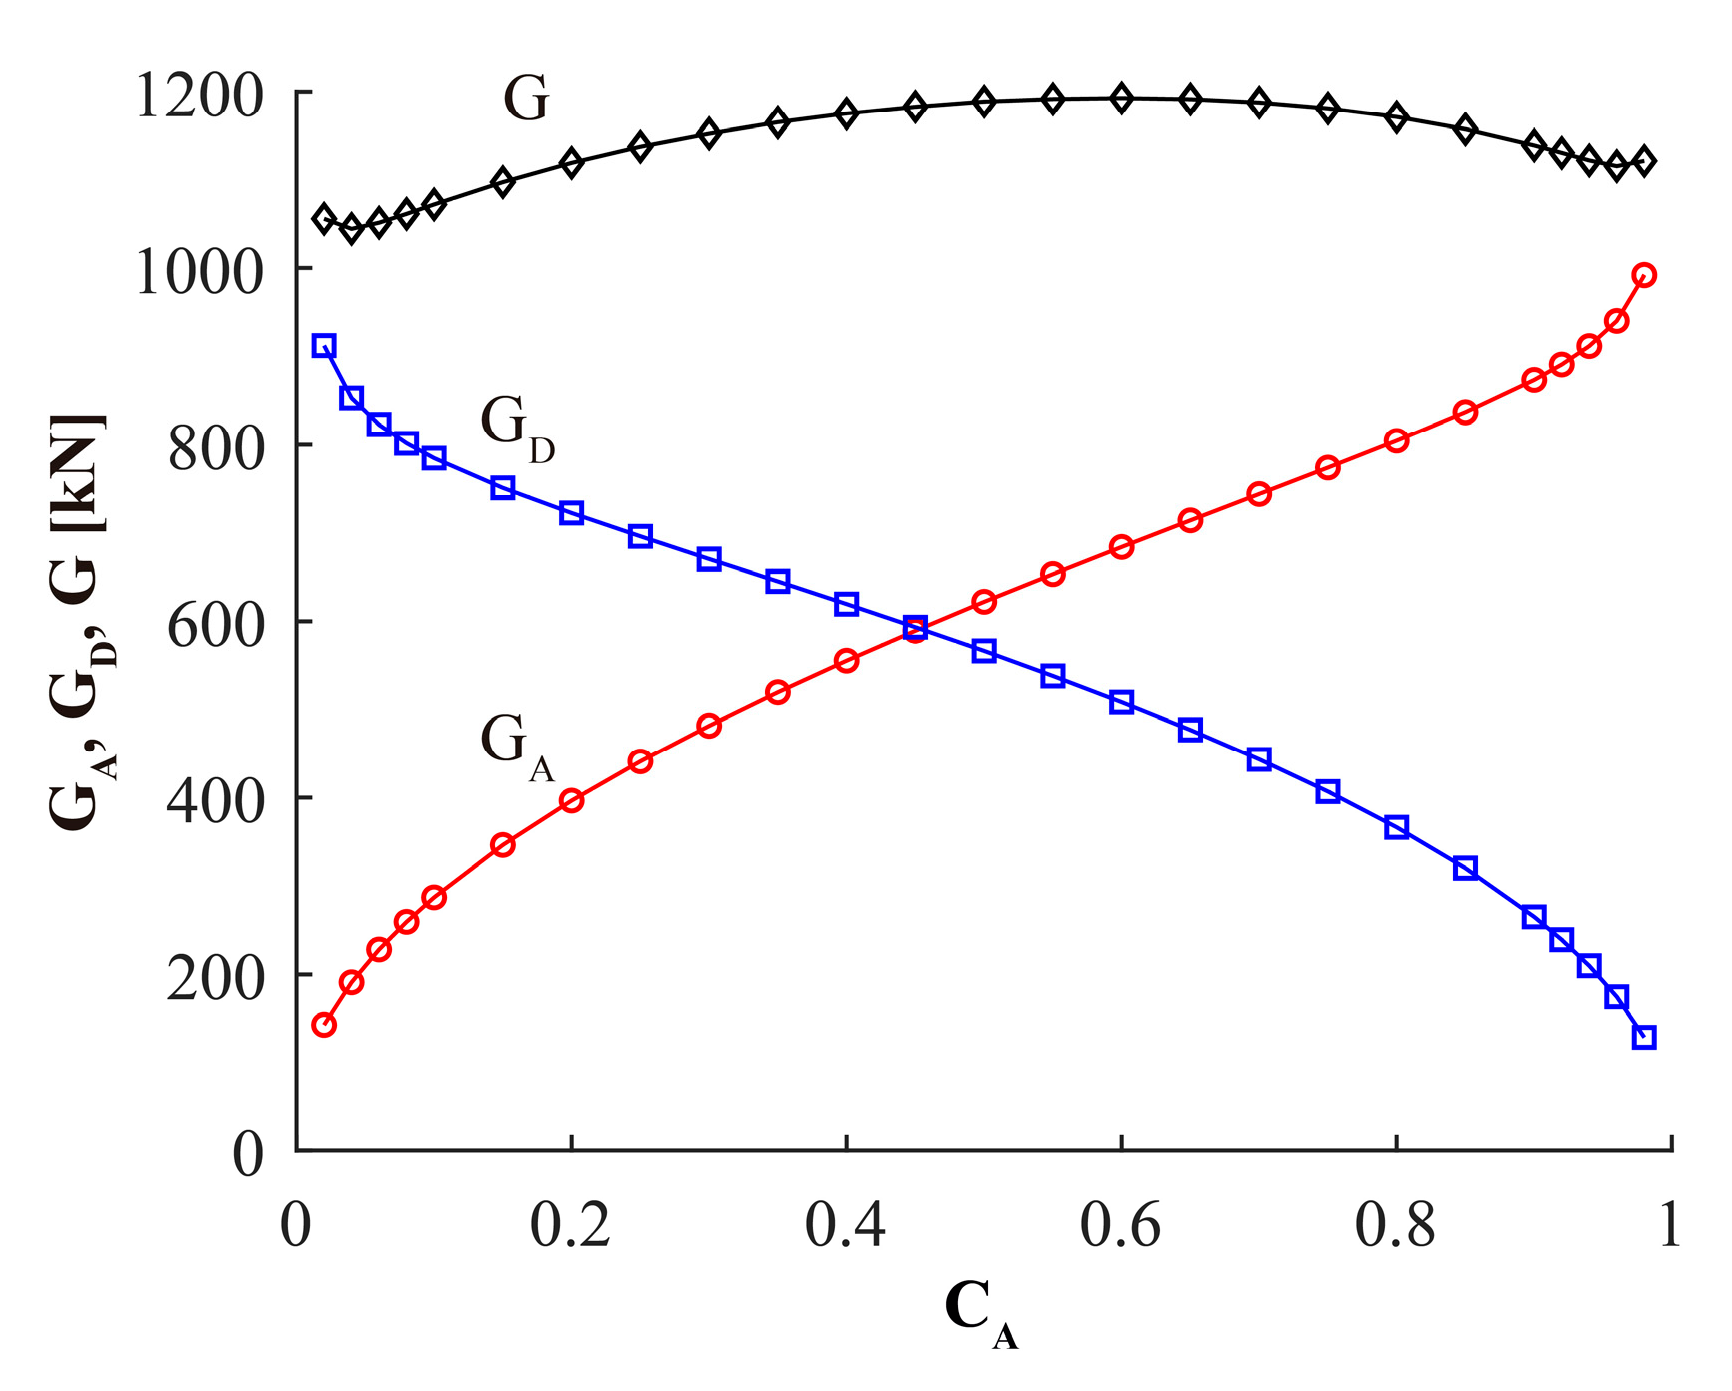
As observed in Figure 12, the combined weight of the arch and the deck, G = GA + GD, is maximum in the central zone. The minimum weight is obtained for very low values of CA, i.e., for arches with very low bending capacity, practically deck-stiffened arches. Slightly heavier bridges with CA values close to 1 (i.e., with very stiff arches and very flexible decks) are also lighter than those in the central zone. The lightest bridges are obtained for the lowest values of CA as, since G depends both on the length of the arch LA and the span of the deck L (Equation (15)), and the algorithm tends to penalize heavy arch cross-sections rather than heavy deck cross-sections, because LA is always greater than L.
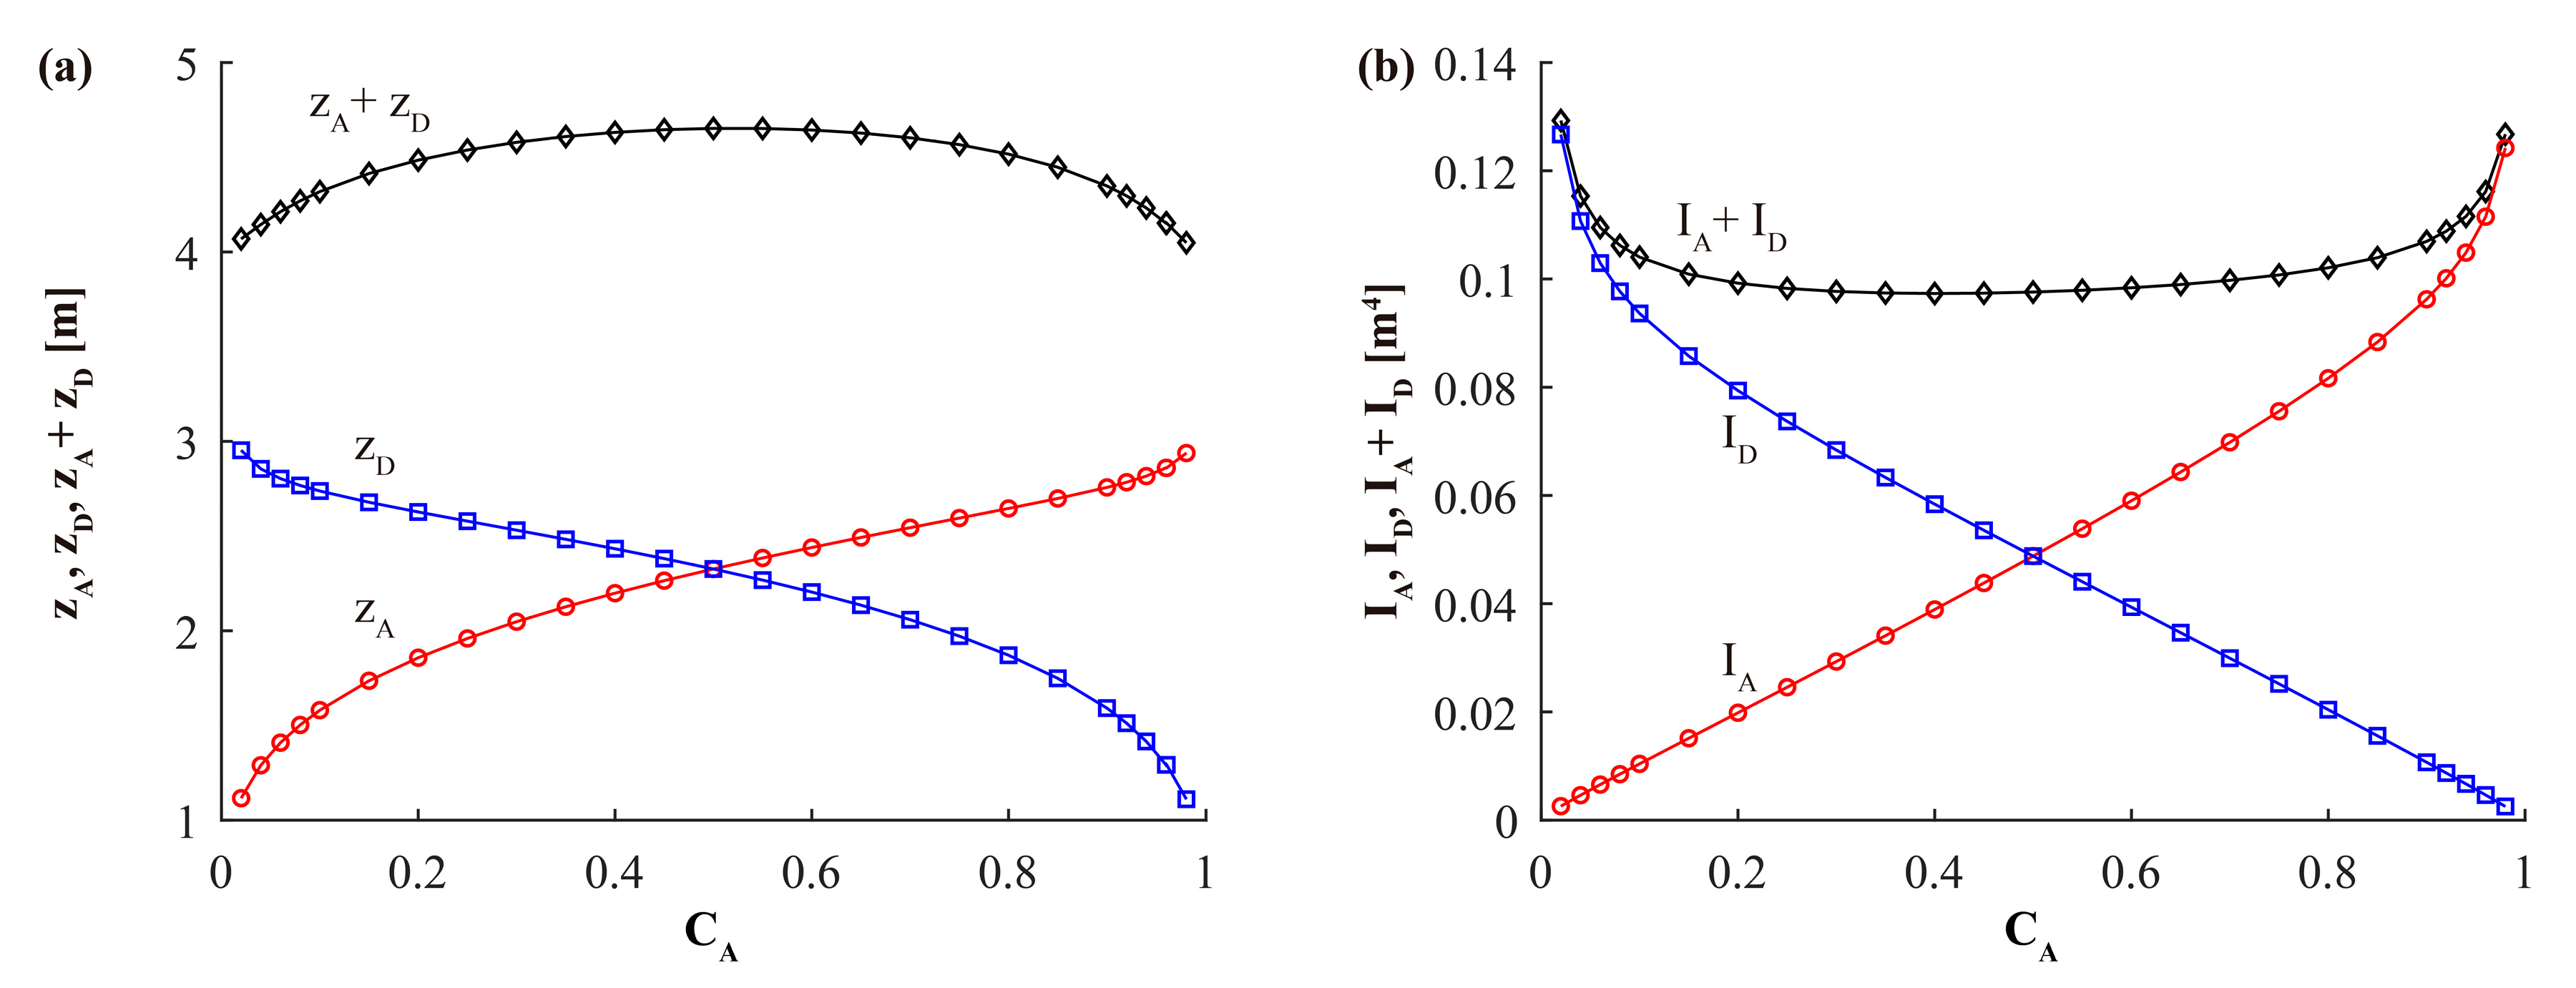
Figure 13a represents the depth of the arch cross-section, zA; the deck cross-section, zD; and zA + zD vs. CA for the bridge defined in Figure 11. Figure 13b shows the second moment of area both of the arch and deck cross-sections, IA and ID, and IA + ID vs. CA.

5.2. Comparison with Real Bridges

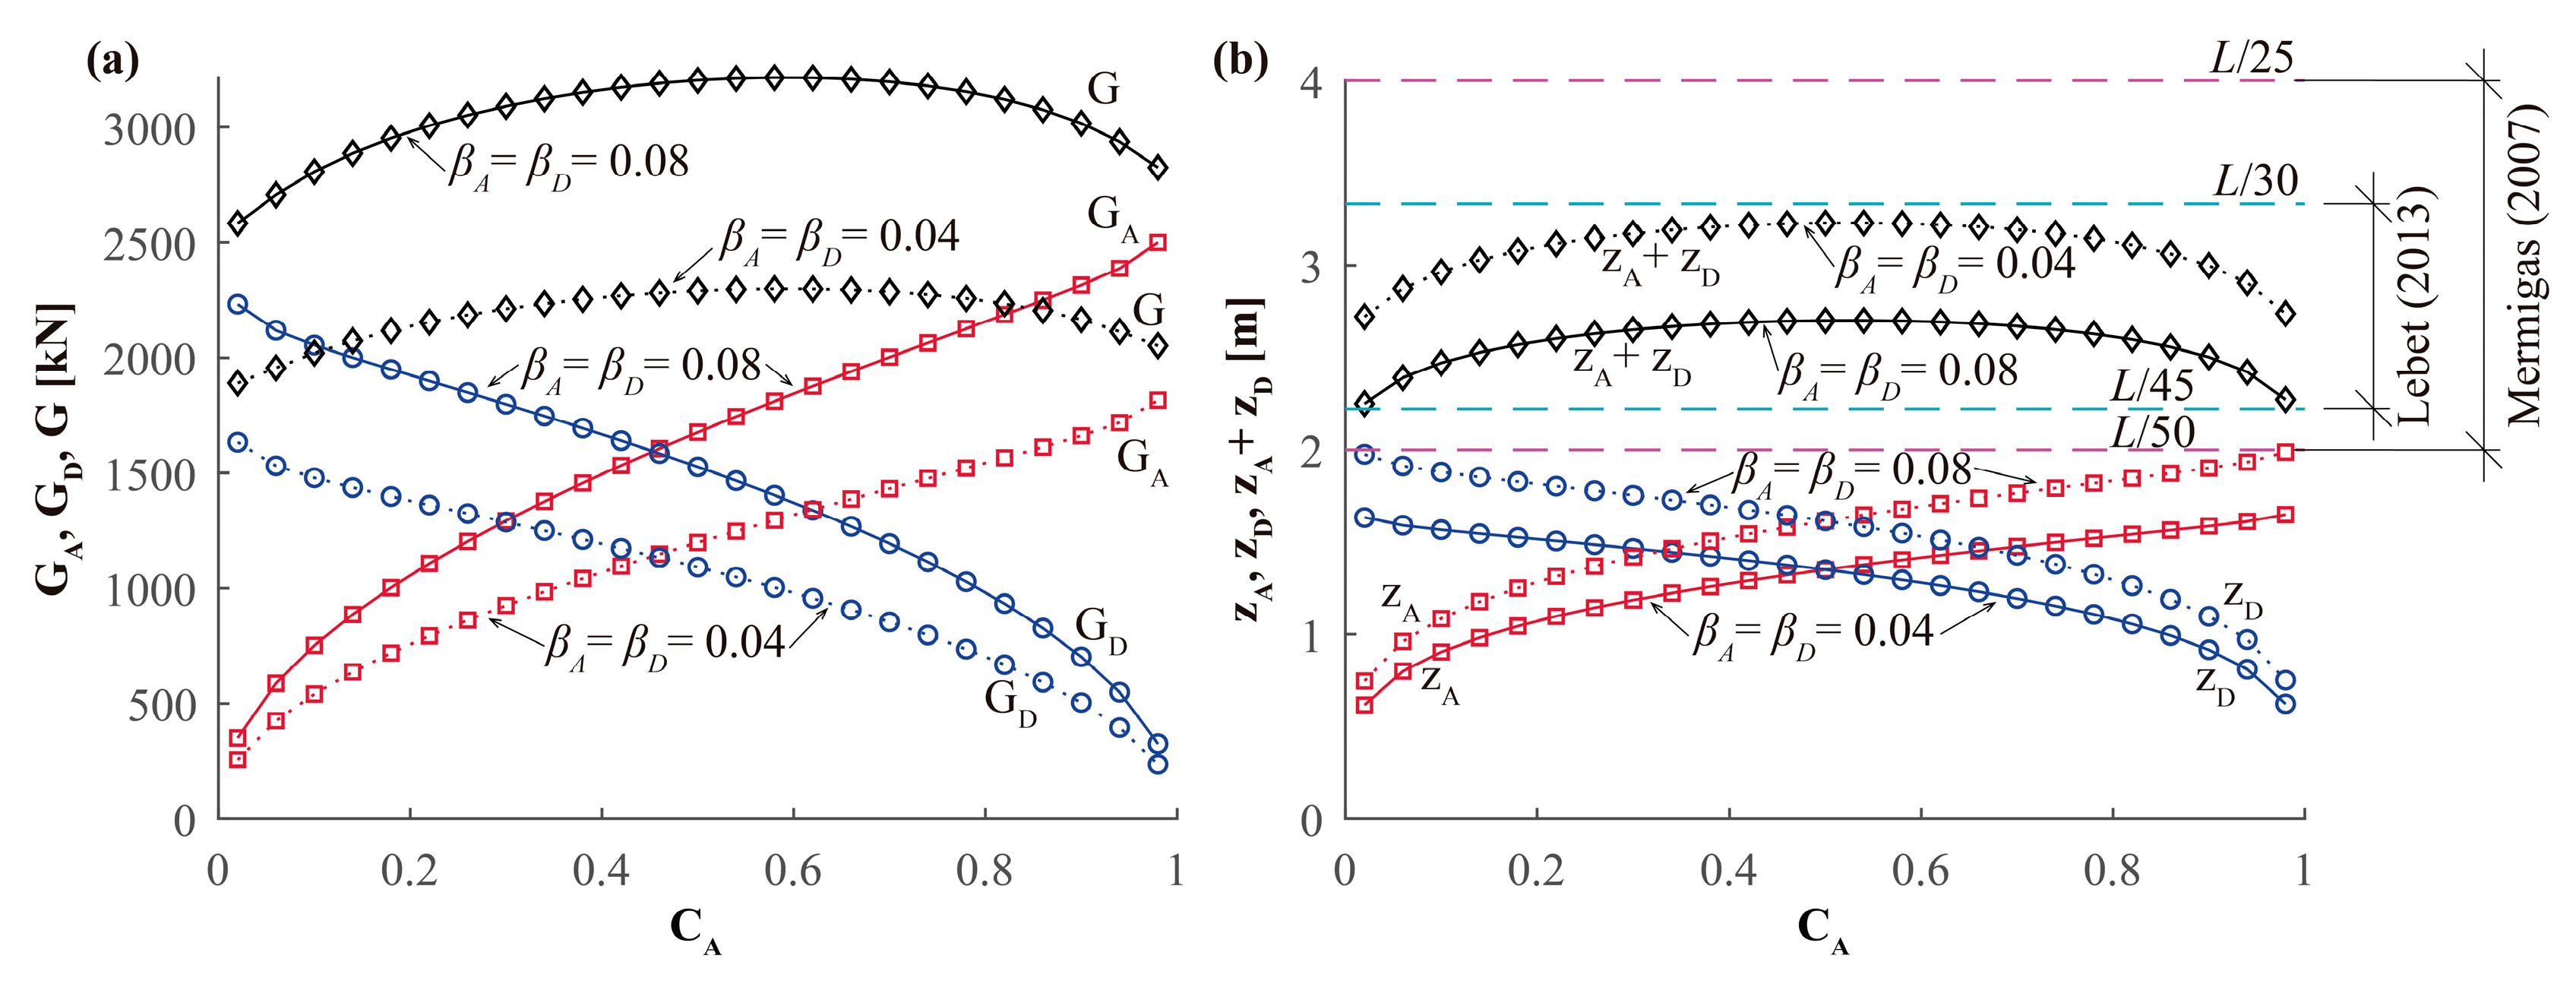
To compare the results of the δ-method with the sizes of cross-sections of real bridges, the δ-method was applied a second time to the bridge defined in Figure 11, where all the data, except βA and βD, are repeated. The method has been applied to two bridges: the first bridge, where βA = βD = 0.04, and the second bridge, where βA = βD = 0.08. The weights of the arch, GA; the deck, GD; and GA + GD are shown in Figure 14a for both values of β. In Figure 14b, the depths of the cross-sections of both the arch and the deck, zA and zD, as well as the total depth of the arch and deck, zA + zD, are plotted for the two values of β. As shown, the values of zA + zD lie within the range recommended by Lebet and Hirt [5], i.e., between L/30 and L/45, and the range defined by the set of values compiled from real bridges by Mermigas and Wang [3], i.e., between L/25 and L/50.
Both case studies illustrate the effect of β on cross-section weight and depth. Lower values of β (i.e., thin webs) result in deeper and lighter cross-sections, and vice versa. Thus, if the designer decides to reduce the cross-section depth by increasing β (for example, for esthetic reasons), the cross-section weight will be increased, as can be deduced from Equation (9).

5.3. Influence of the SLC

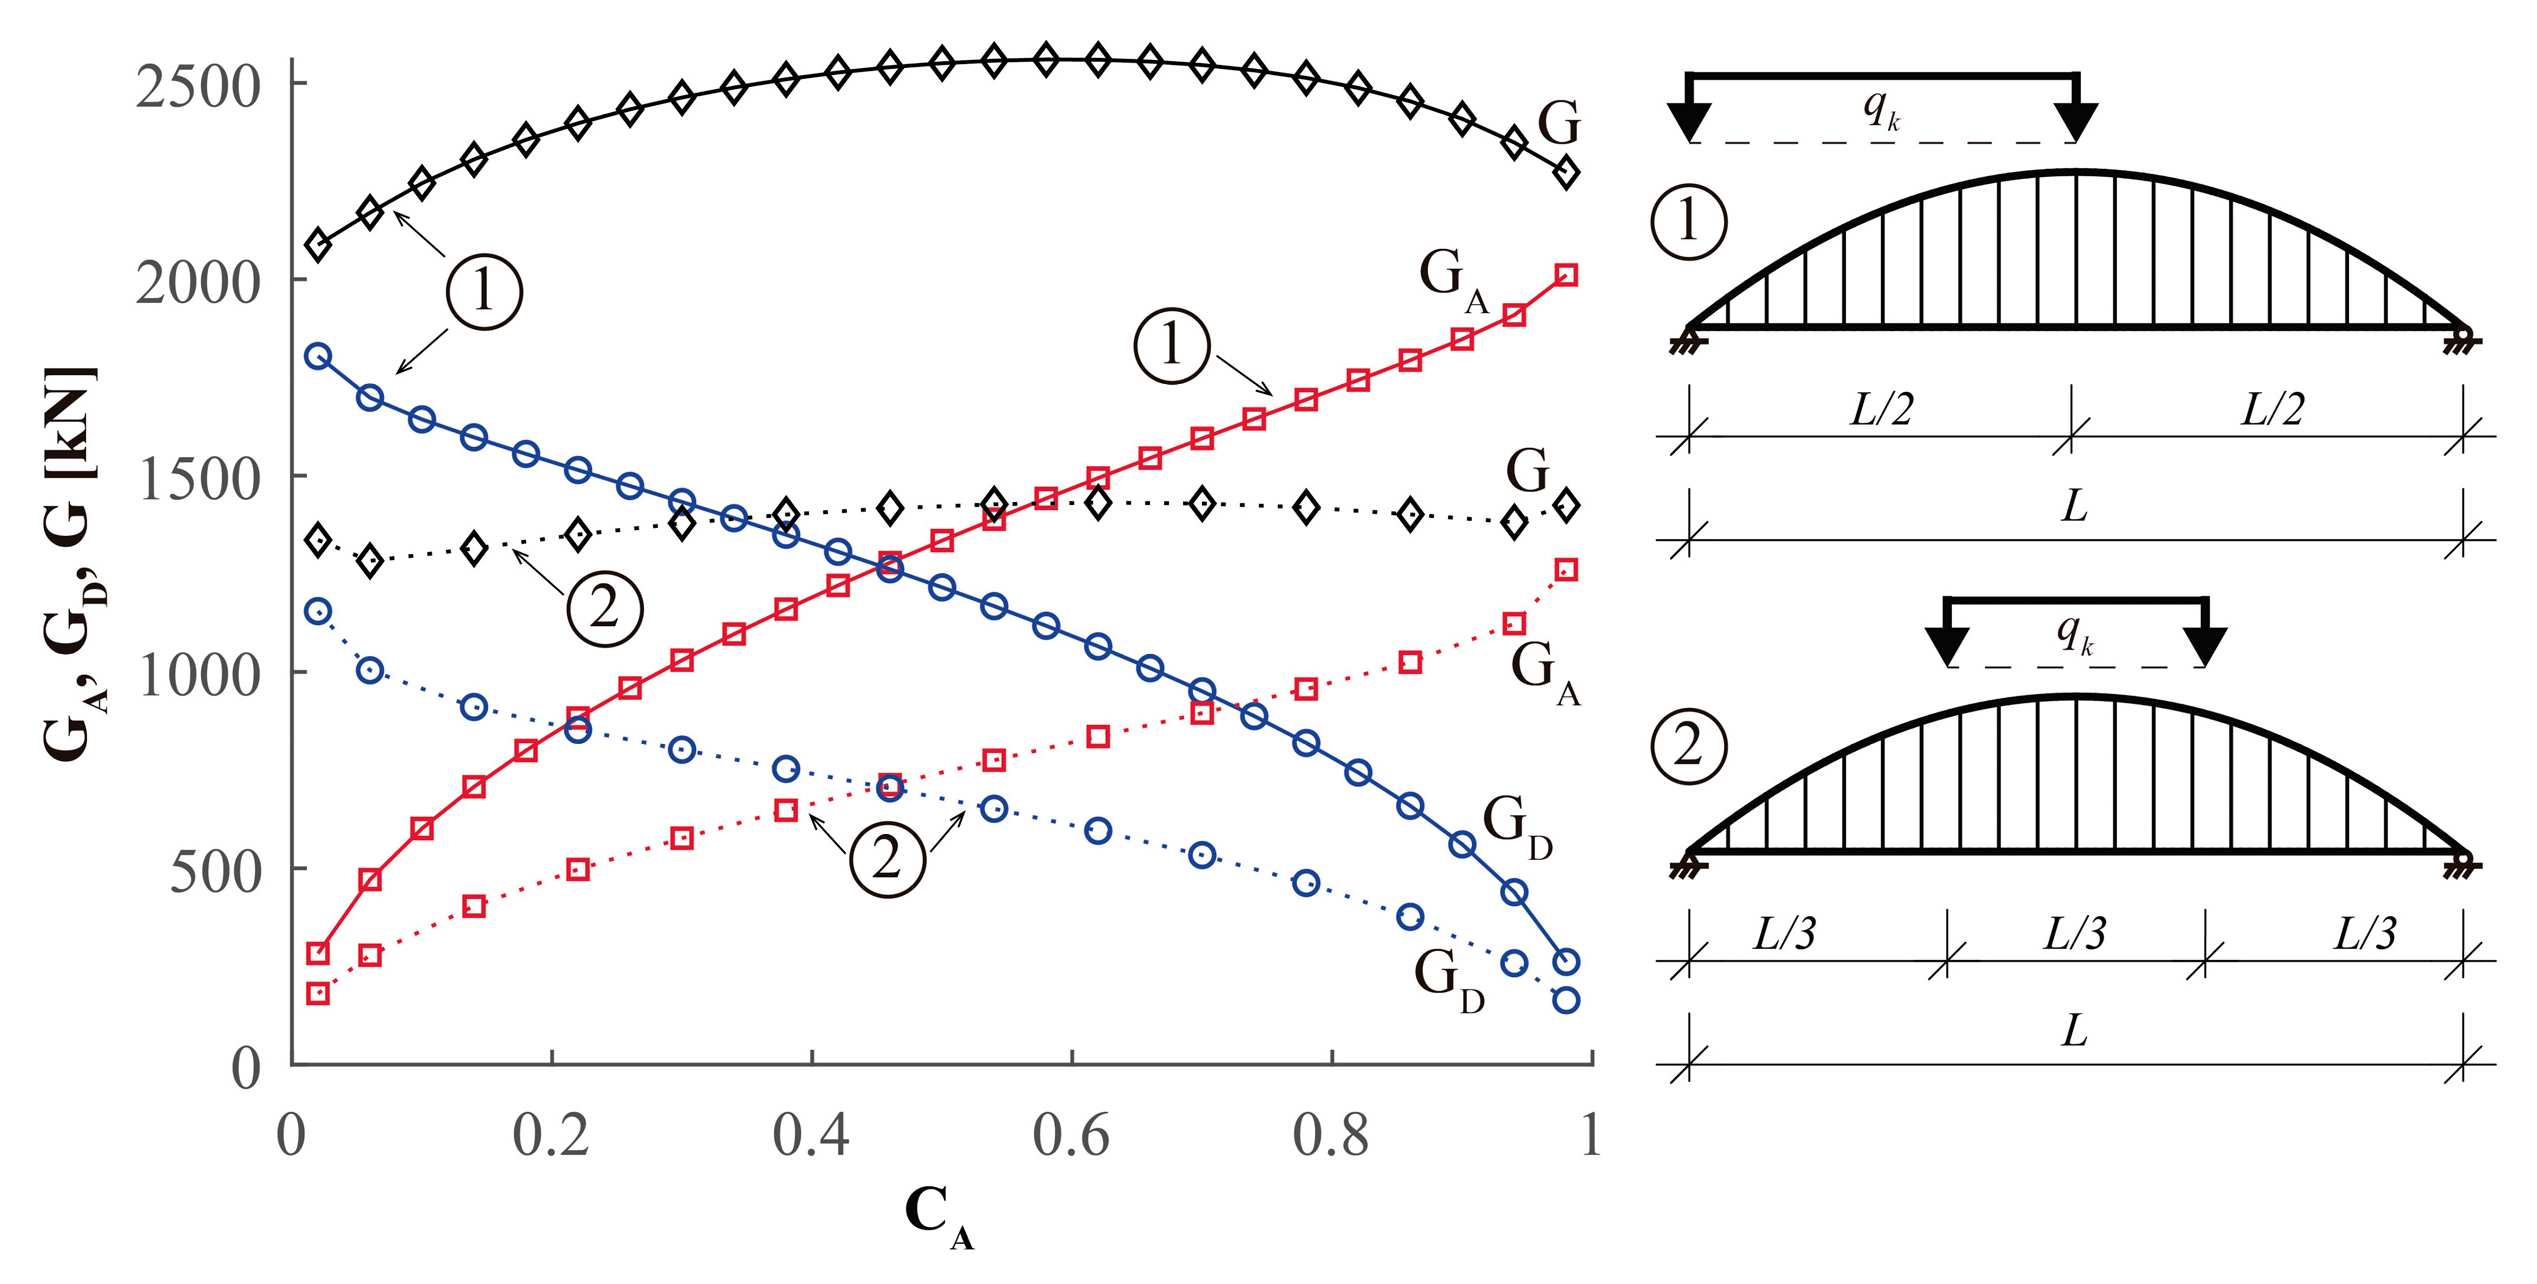
As explained in Section 4.1, the SLC used in this paper corresponds to a UDL acting in the left half of the span. Other SLCs correspond, for example, to a UDL over the middle third of the span, as described by Menn in [7]. Figure 15 compares the weights obtained for both SLCs for the bridge defined in Figure 11 for βA = βD = 0.05. The same value of δlim = L/2000 = 50 mm is considered for both SLCs, although it is on the safe side for the SLC over the middle third. As shown in the figure, the UDL acting in the left half of the span is the most adverse SLC.

6. Preliminary Parametric Studies

To understand the influence of the parameters that govern the design of the bridges shown in this paper, a parametric study is carried out in Section 7. To reduce the number of models in that section, two preliminary minor studies, corresponding to the load qk and the allowable deflection, δlim, are shown in this section. As a result, the number of bridges studied in Section 7 has been reduced to 5544.

6.1. Effect of the Load qk

One of the most relevant factors for preliminary sizing is the load qk. Figure 16a shows, for CA = 0.3, the results of ΩA, ΩD, and ΩA + ΩD for values of bridge width b varying between 2.5 and 20 m (and qk between 5 and 40 kN/m).
For each value of b, a value of βA = βD = b/500 has been considered, i.e., for example, for b = 5 m, βA = βD = 0.01. As shown, all curves are linear. The same is true for the second moments of area, shown in Figure 16b, and the weights, shown in Figure 16c.
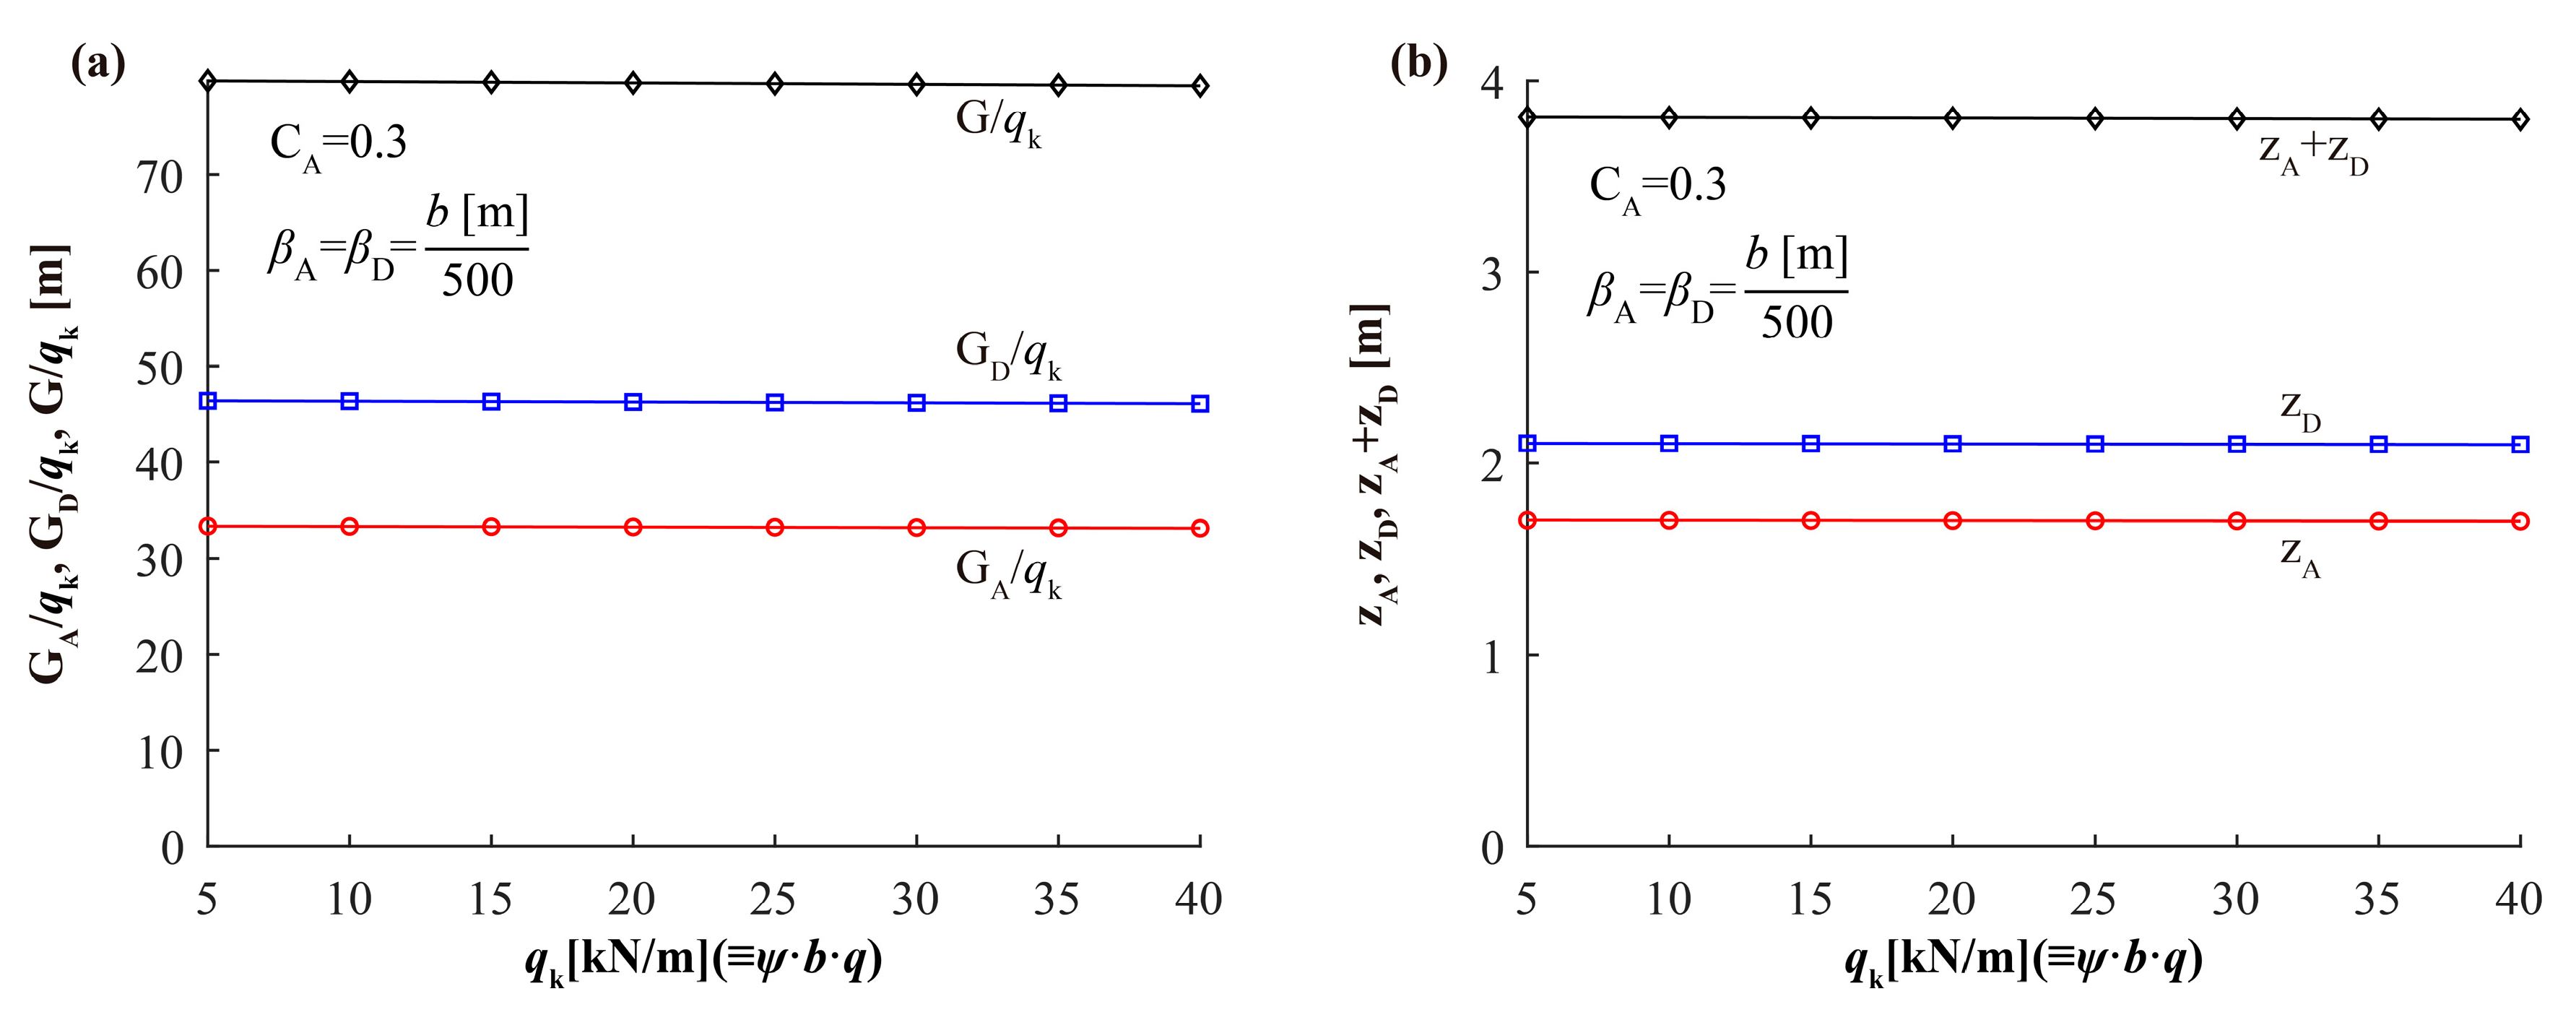
If the weight per unit load, G/qk, is plotted (Figure 17a), the lines are horizontal. The same is true in Figure 17b, which shows the depths of the cross-sections. Therefore, the main conclusion here is that the results per unit width of the bridge coincide when the web thickness (tw = β·z) is proportional to the value of b (i.e., of qk).

6.2. Effect of δlim

Figure 18a shows, for CA = 0.3, the results of IA, ID, and IA + ID for values of L/δlim varying between 500 and 2500. As shown, all curves can be assumed to be linear with sufficient accuracy. The same applies to Figure 18b, which represents ΩA2 and ΩD2, and Figure 18c, where the weights GA2 and GD2 are drawn. The main conclusion here is that the relationship between L/δlim and IA and ID can be considered linear. The same is true for ΩA2 and ΩD2 or GA2 and GD2.

7. Parametric Studies

To estimate the effect of the main parameters on the weight of the bridge, G, the models detailed in Table 1 are generated using nested loops. The δ-method is applied for ni variations in the i most relevant parameters, resulting in n = Π(ni) = 5544 FEM models. Data and results are available on request. In every model, the δ-method follows the flowchart detailed in Figure 10. Computational flow control is performed using MatlabR2017b [32], and the FEM analyses are carried out using SAP2000 v26 [33]. The typical elevation of the models is shown in Figure 19.

7.1. Relationship Between Inertia, Area, and Weight and Span

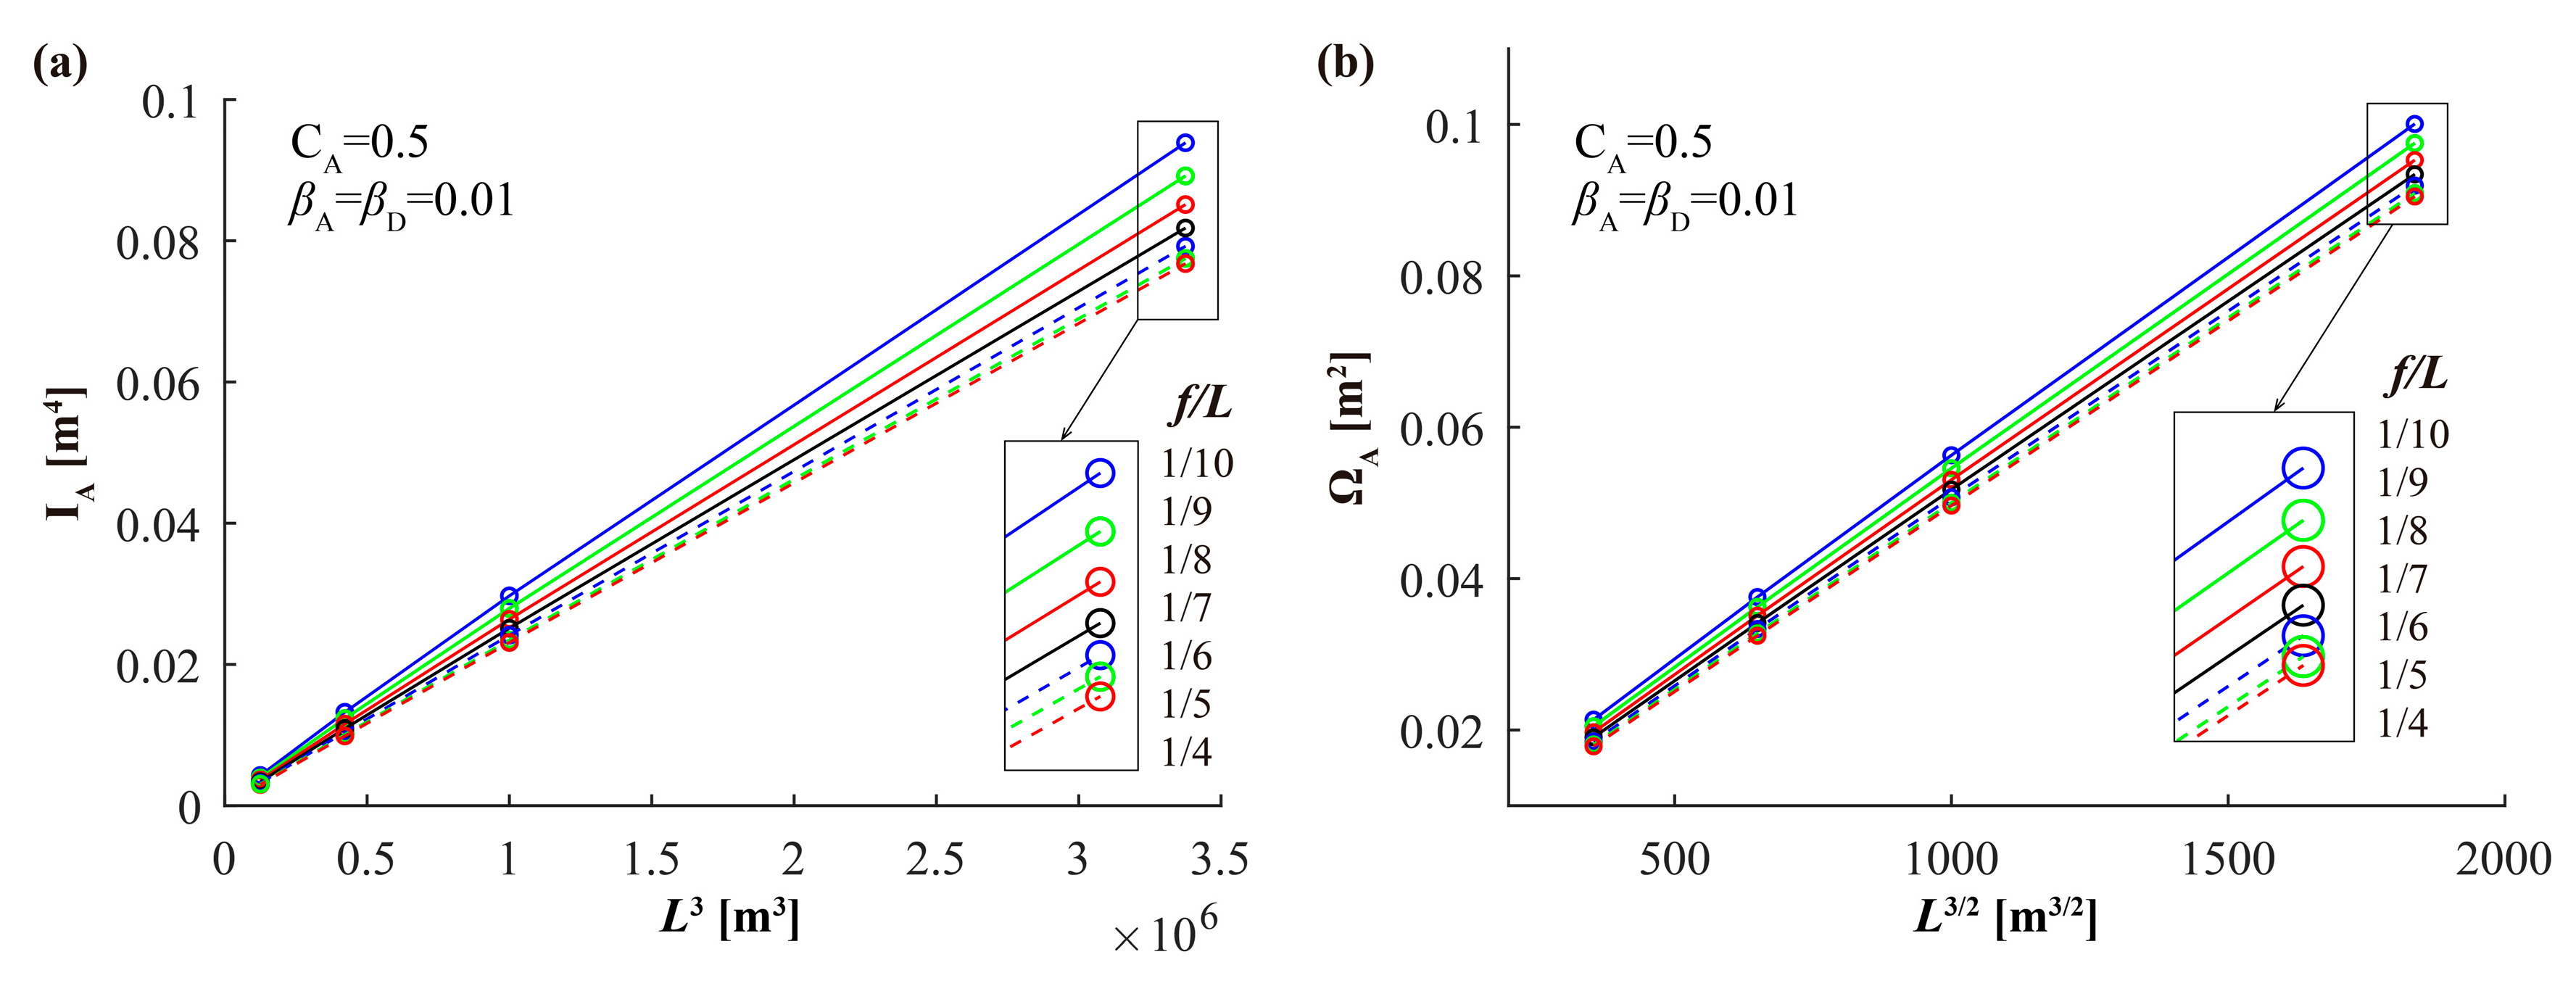
Since δlim is defined as a factor of 1/L, it follows, from Equation (29), that the inertia IA (or ID) is proportional to L3, as shown in Figure 20a for different values of the ratio f/L. As, based on Equation (11), the cross-sectional area of the arch is proportional to IA1/2, ΩA is also proportional to L3/2, as shown in Figure 20b.
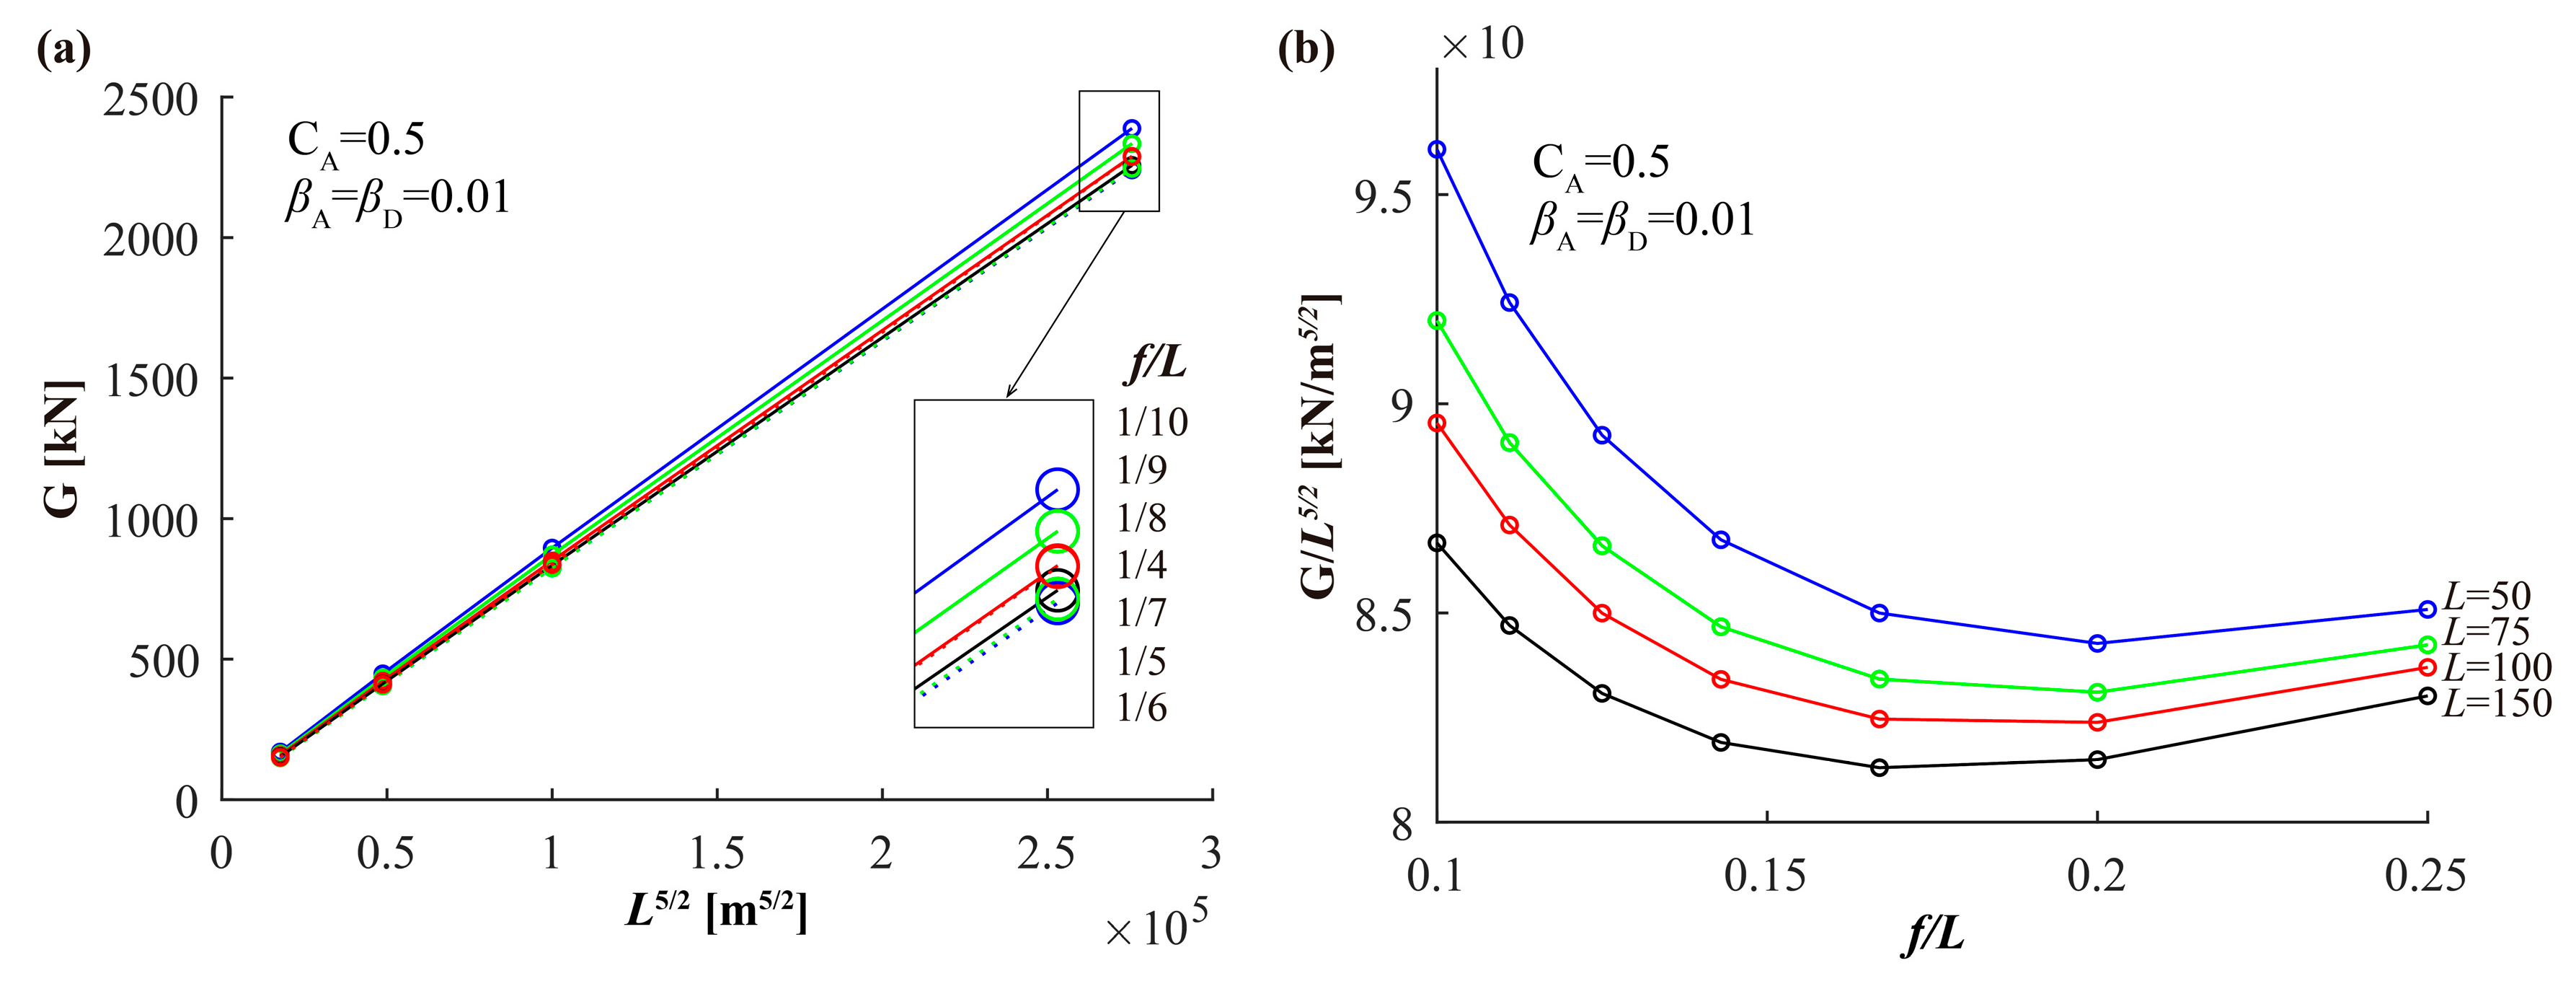
According to the results, since the weight of the bridge (see Equation (15)) is obtained by multiplying the area by the span of the bridge, it is proportional to L5/2, as shown in Figure 21a. It is also interesting to observe the influence of the f/L ratio on G. Figure 21b shows that, in these examples, the value of G/L5/2 is lower for f/L values between 0.15 and 0.2 and the weight of the bridge increases for both shallower and deeper arches. In the same example, the smaller the L value, the higher the ratio G/L5/2.
To illustrate the variability in the values of CA for which minimum-weight bridges are obtained, Figure 22 shows the results for various values of L (L = 50, 75, 100, and 150 m) and f/L (f/L = 1/10, 1/6, and 1/4). In all cases, minimum-weight bridges show a clear tendency to appear at points with low CA values.

7.2. Effect of the Web Slenderness

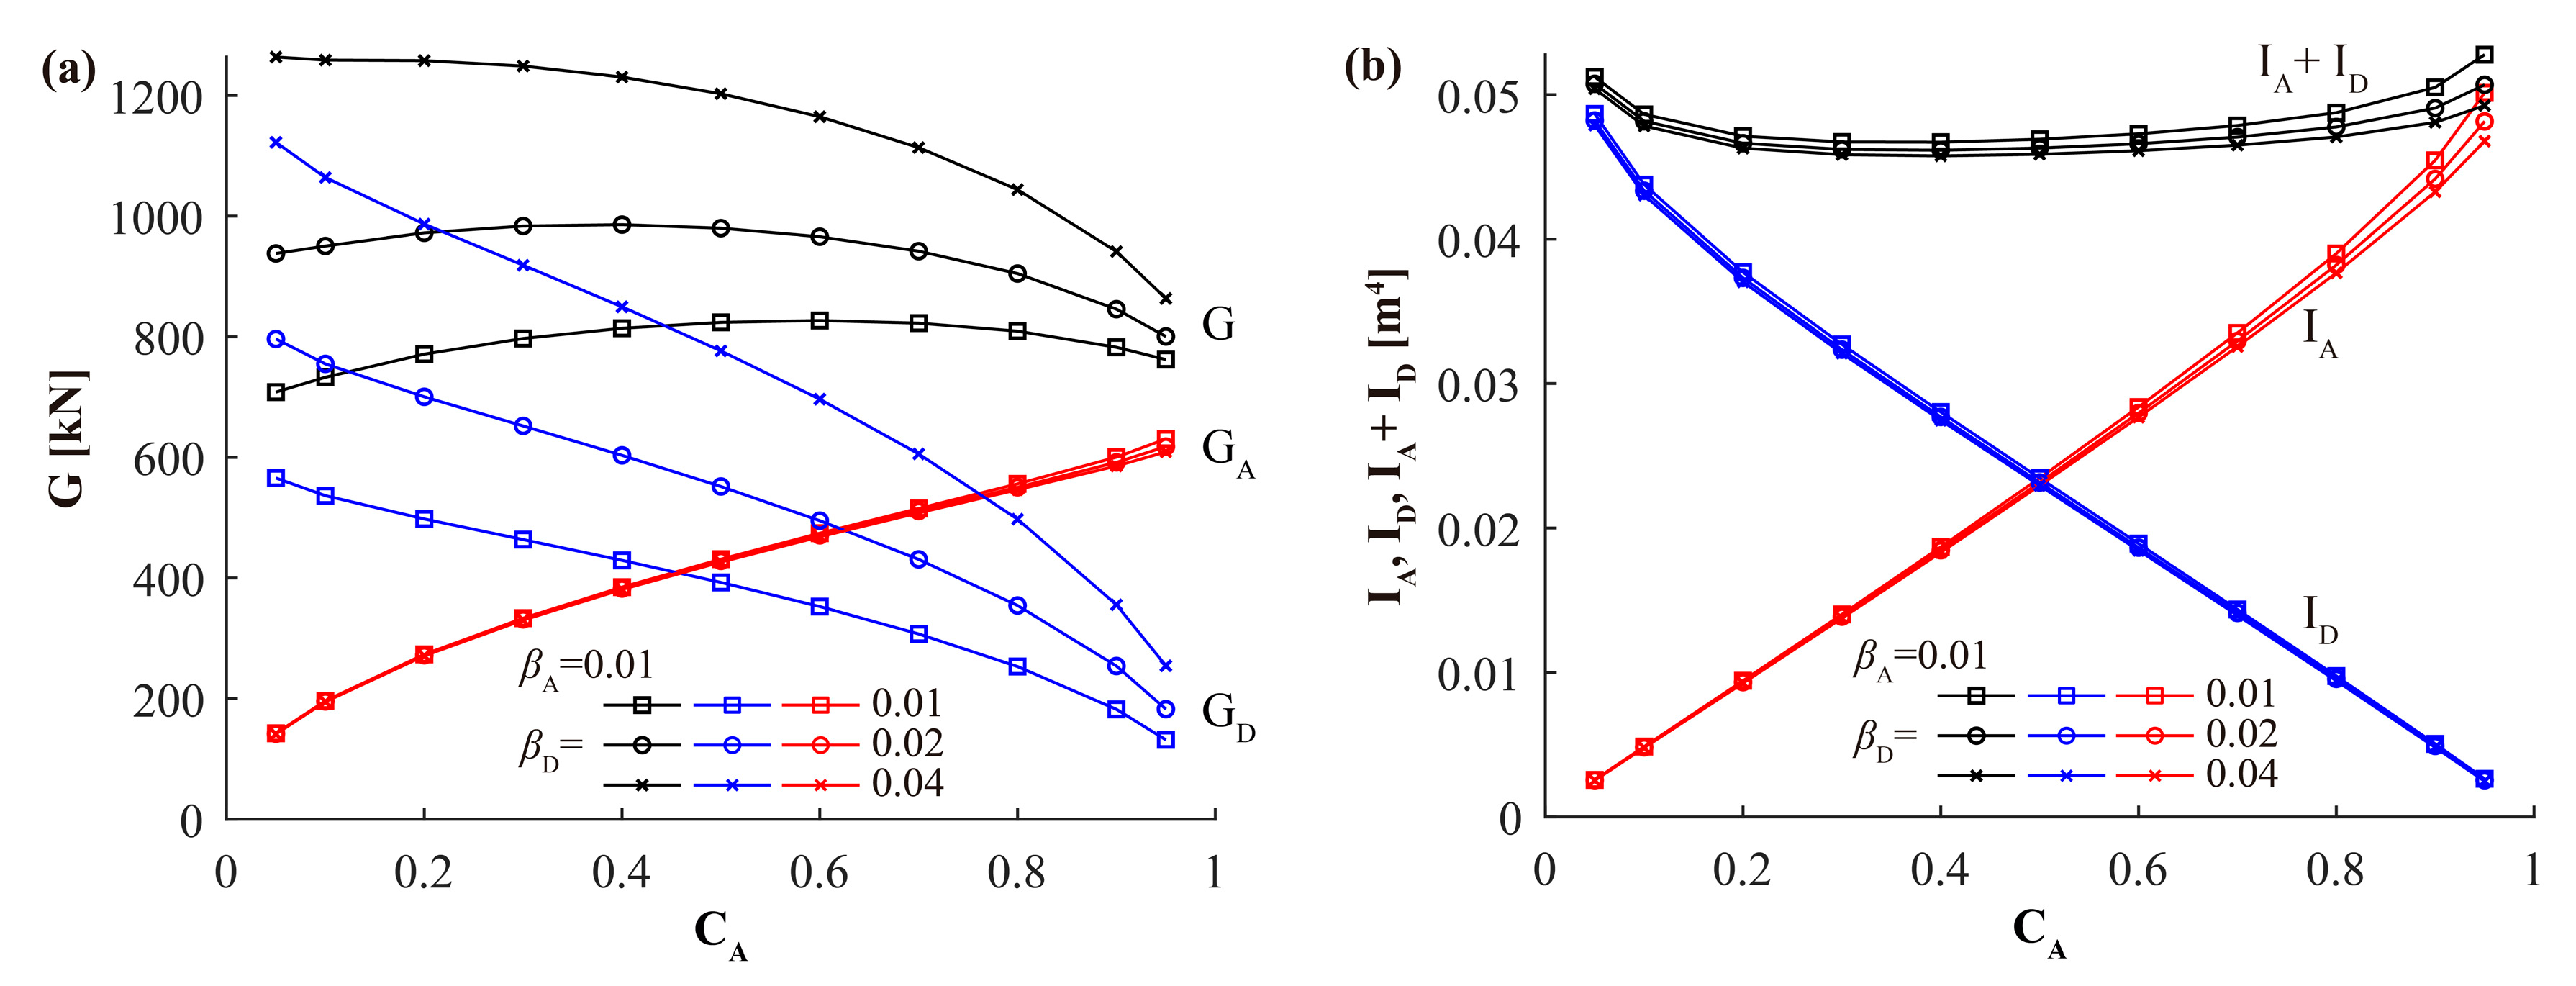
As shown in Figure 23a, the effects of βA and βD on the weight of the bridge are quite significant. βA remains constant, being equal to 0.01, while βD varies between 0.01 and 0.04. As shown, the more slender the web, the lighter the cross-section, because the required inertia can be achieved with less material. In the results, GA remains virtually unchanged for different values of βD. However, GD increases considerably, since, for higher values of βD (i.e., thicker webs), the deck needs a larger area to achieve the target value.
Nevertheless, the increase in GD with βD shown in Figure 23a is not echoed in the variation in ID shown in Figure 23b, which is almost independent of βD. This represents the fact that IA and ID are the main parameters governing deflections. Therefore, using sections with very slender webs reduces the area required to achieve the required level of stiffness. In conclusion, cross-sections with the thinnest possible webs (with low βA and βD values) should be used to minimize the bridge weight.

8. Manual Calculation of Tied-Arch Bridges

The FEM analyses required for the applications of the δ-method presented in this paper are not especially complex: once the bridge has been modeled with its cross-sections, only two load combinations are needed: the SLC-S and SLC-A. Depending on the results, the cross-sections are corrected at each iteration until convergence is achieved. This process, which is already very fast, can be accelerated even further through automation. Using a very simple code to implement the flowchart shown in Figure 10, each case study, including all necessary iterations, takes approximately 2 s, with most of the time spent on the FEM analyses in SAP2000 [33]. However, even with the availability of automated tools for pre- and post-processing, the iterative process can be very time-consuming, particularly when performing a parametric study that requires many different parameters. Therefore, it would be very helpful to the designer if the calculations could be performed using an explicit manual yet accurate formulation able to distinguish the effects of each parameter and inform design decisions.
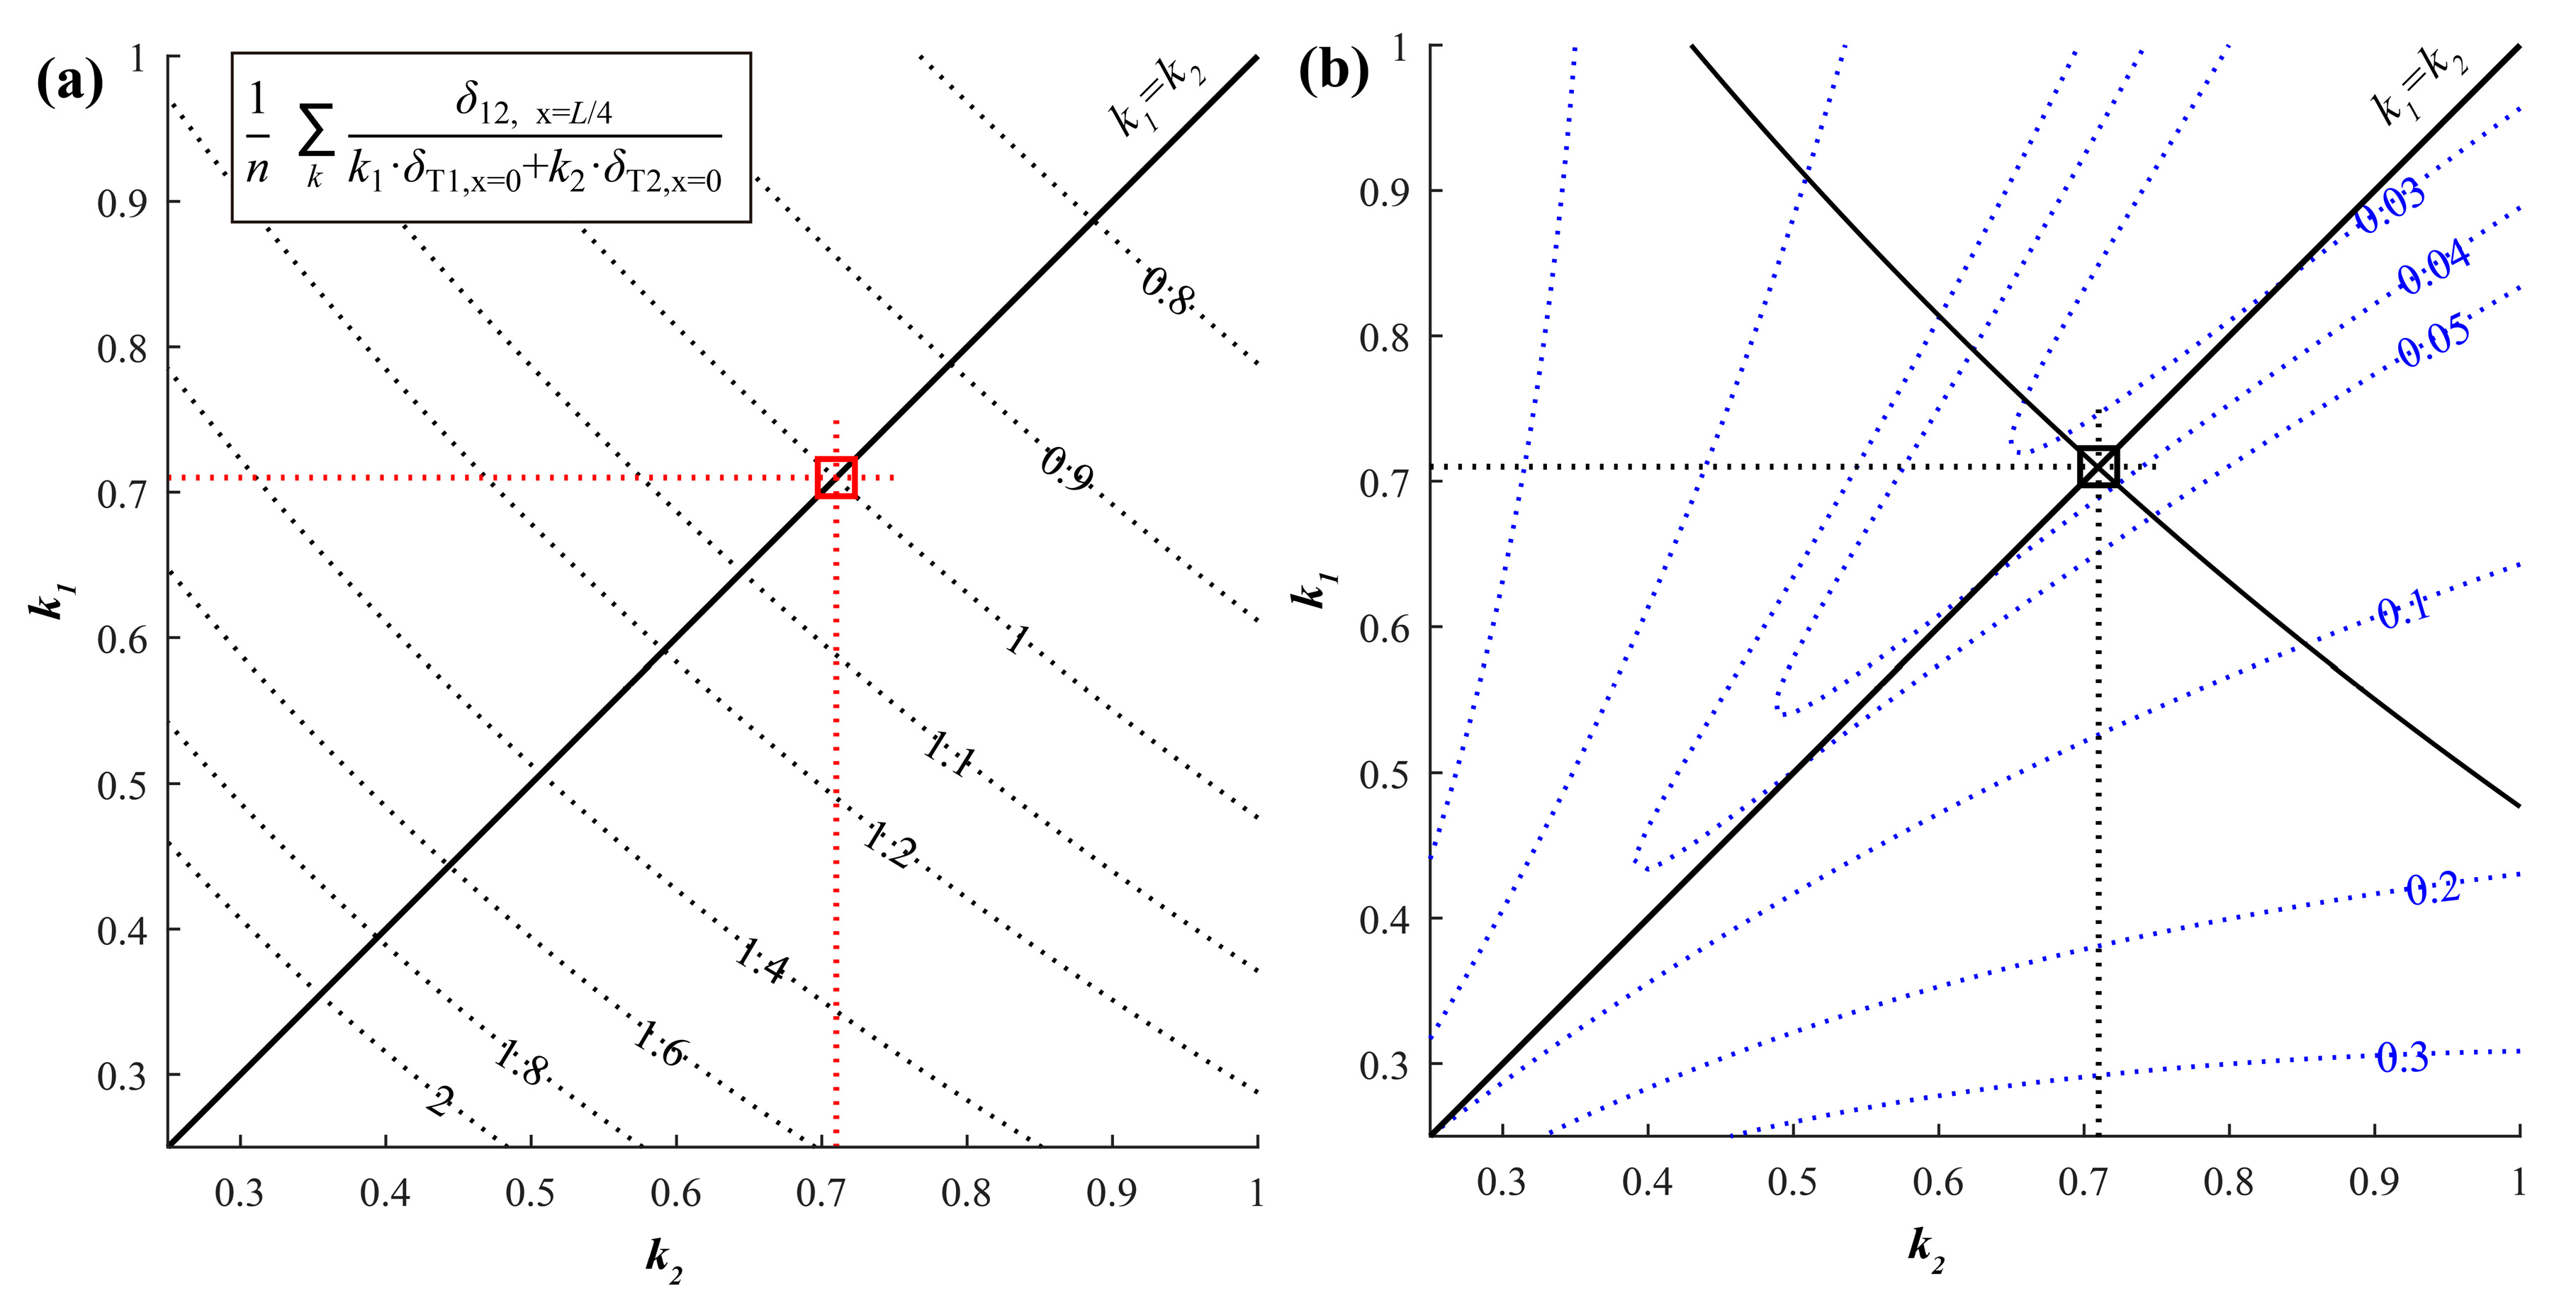
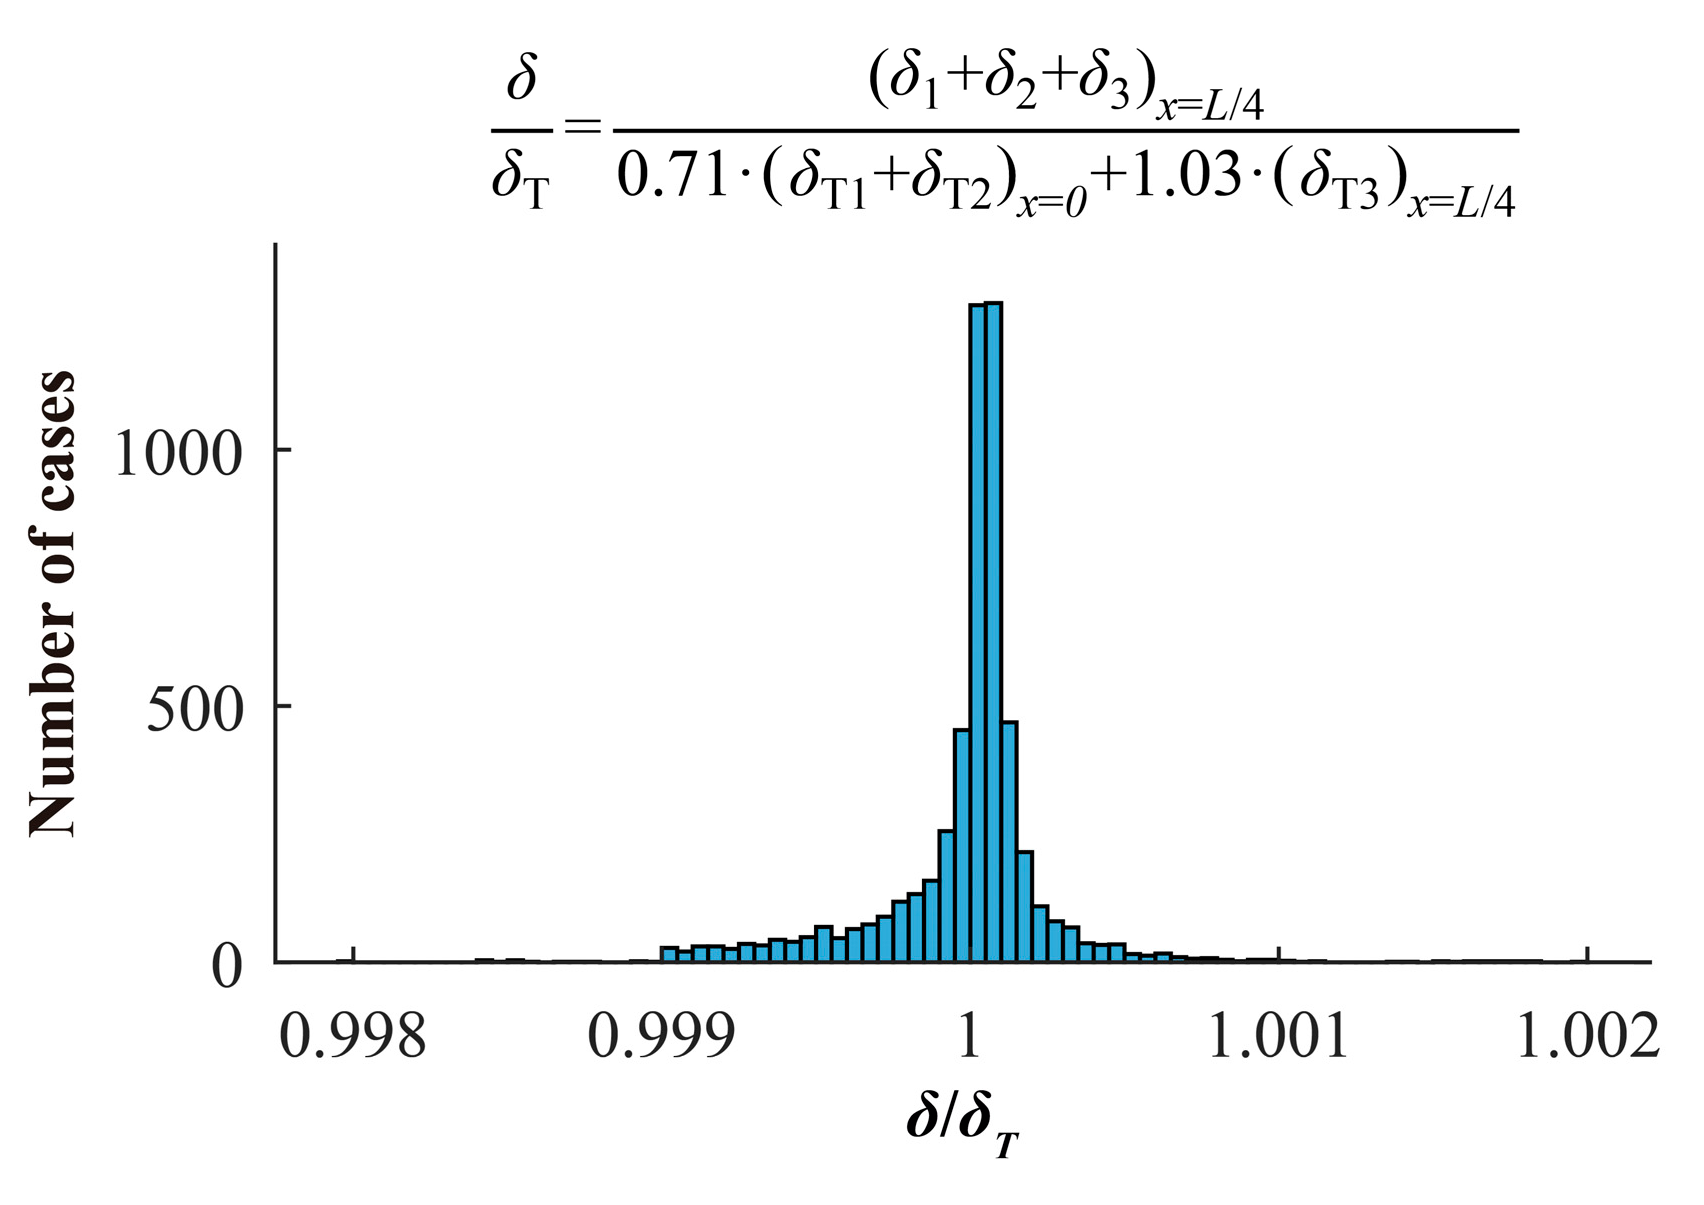
For this purpose, the coefficients k1 and k2 that multiply the “theoretical” approximate values δT1,x=0 and δT2,x=0 in Equation (22) have been adjusted to ensure sufficient accuracy for manual calculations, and a new third coefficient k3 that multiplies δT3,x=−L/4 has been introduced with the same purpose. The three coefficients have been obtained with the help of the “exact” values of δ12= δ1 + δ2 (under SLC-S) and δ3 (under SLC-A) obtained from the 5544 FEM analyses carried out in Section 7. In our case, since δ12 was calculated all at once in the FEM analysis, it was impossible to distinguish which fraction of δ12 corresponds to δ1 and which one corresponds to δ2. Therefore, we took k1 = k2 = k12, a condition represented in Figure 24 with the diagonal k1= k2. The coefficient k12 was obtained so that the mean of δ12 for the n FEM models coincided with the mean of k1·δT1 + k2·δT2. The solution was k1= k2≈0.71. The process is shown in Figure 24, where each point of the Figure 24a belongs to an isoline of Equation (30). For these values, a mean of 0.9993 and a standard deviation (Figure 24b) of 0.0354 were obtained. Equation (30) is defined as follows:
1 n 1 n ( δ 12 , x = L / 4 k 1 · δ T 1 , x = 0 + k 2 · δ T 2 , x = 0 ) i
The value of the coefficient of k3 for the n bridges has been obtained as follows by simply comparing “theoretical” and “real” deflections:
k 3 = 1 n 1 n ( δ 3 , x = L / 4 δ T 3 , x = L / 4 ) i
resulting in k3 = 1.03. For this value, a mean of 0.9994 and a standard deviation of 0.0254 are obtained.
Therefore, following these analyses, the δ-method can be carried out in the same way as shown in Section 4, where the values of δ12 and δ3 obtained from the FEM output can be substituted by the following theoretical formulas (δT1,x=0, δT2,x=0, and δT3,x=L/4; Equations (18), (19) and (21)) factored by the just obtained coefficients:
δ 12 , x = L / 4 0.71 · ( δ T 1 , x = 0 + δ T 2 , x = 0 )
δ 3 , x = L / 4 1.03 · δ T 3 , x = L / 4
which leads to the following approximate formulation:
δ D , x = L 4 0.71 · [ N A ,   x = 0 E A · Ω A · ( L 2 5 · f + f ) + 120 · L 4 320 · f 2 · L 2 + 2304 · f 4 640 · f · L 3 3072 · f 3 · L · N D · L E D · Ω D ]   + 1.03 · q k · L 4 12 , 288 · ( E A I A + E D I D )
To assess the validity of Equation (34), the histogram in Figure 25 shows the ratio between the “real” results obtained via FEM analysis and the “theoretical” results for the n bridges obtained via manual calculations.
Similarly, to verify the validity of the above expressions in evaluating the bridge weight, the n results of the ratio (G/GT)i are shown (Figure 26a), where G has been calculated with FEM models and GT has been calculated with the approximated theoretical formulation.
The mean of (G/GT)i is 0.9953, and its standard deviation is 0.0093. Regarding the error, 227 models out of 5544 contain an error that is greater than ±2%, while only 24 contain an error greater than ±3%. These results are considered sufficiently accurate for a manual analysis, especially as the advantage in time consumption is immense: while SAP2000 calculations take about 2 s per case study (about 11,000 s in total), the same 5544 calculations with the theoretical formulation take between 2.5 and 2.8 s for all case studies. In other words, the approximate calculations are about 4000 times faster. The process, therefore, seems clear: if many models are to be developed, the first studies of the solution should be carried out using the manual approximate formulas (Equations (20) and (32)–(34)), whereas computer calculations should be used in the final stages of the process, when more accurate results are required.

9. Conclusions

The methods, formulations, and parametric studies described in this paper, as well as their conclusions, are designed to assist designers in the conceptual design of all-steel arch bridges, particularly when minimizing the bridge weight is a priority.
This paper presents a novel iterative method, the δ-method, that minimizes the weight of an all-steel arch bridge during the in-plane preliminary design stage. This method reproduces the iterative structure of the preliminary design process. Its input data are variables commonly used in preliminary design, such as the slenderness of the webs of the cross-sections and their relative flexural stiffness. It can be successfully applied to different typologies, such as deck-stiffened, tied-arch, Nielsen–Löhse, or network-type arch bridges. This paper emphasizes how relevant good engineering judgement may become in the early stages of conceptual design.
The δ-method, as presented in this paper, is limited to Class 1, 2, and 3 (classified according to Section 5.5 of Eurocode 3 [14]) sections, since the cross-sections are assumed to be doubly symmetric and their whole areas are considered when estimating IA and ID. In practical terms, β = 1/100, which corresponds to the web slenderness for pure bending of a Class 3 section for S355 steel (according to Table 5.2. of Eurocode 3 [14]) can be considered, approximately, to be a lower bound for web slenderness.
The method can be applied without restricting the span, L, or stiffness ratio, CA. However, as is usually mentioned regarding arch bridge design (as it happens in references [1,2] or [3]), very low rise–span ratio values should be avoided, as internal forces and sensitivity to geometrical non-linearity increase significantly, especially for f/L < 1/10.
Moreover, in this paper, the general method has been particularized for tied-arch bridges with vertical hangers: Firstly, its flowchart has been adapted to this type of bridge. Secondly, an approximate analytical formulation that allows manual calculations is provided. This formulation can be considered sufficiently accurate for a manual analysis. Finally, a parametric study with 5544 FEM models, which illustrates the effect of the main variables on the weight of the bridge, is carried out.

9.1. Conclusions from Parametric Studies

The main conclusions of the parametric studies can be summarized as follows:
  • Minimum-weight bridges usually are obtained for very low CA values, i.e., for arches with very low bending stiffness, which are practically deck-stiffened arches. The reason for this is that G depends both on the length of the arch, LA, and the span of the deck, L, and, consequently, the algorithm tends to penalize heavy arch cross-sections rather than heavy deck cross-sections, as LA > L. This trend is confirmed in the remaining parametric studies carried out.
  • When the web thickness (tw = β·z) is proportional to the value of qk (which is the value of the UDL used for the SLC), the area of the cross-sections, Ω; their inertias, I; and the weight of the bridge, G, are directly proportional to qk. In this case, the ratios G/qk and z/qk for the arch and the deck are constant for any value of qk.
  • Regarding δlim, the relationship between L/δlim and IA and ID can be considered linear. The same thing happens for ΩA2 and ΩD2 or GA2 and GD2.
  • The parametric study has shown that IA or ID, ΩA or ΩD, and G are directly proportional to L3, L3/2, and L5/2, respectively, for all the studied values of f/L.
  • Regarding the influence of the f/L ratio on G, in the studied bridges, the value of G/L5/2 is lower for f/L values between 0.15 and 0.2, and G increases for both shallower and deeper arches.
  • In the same example, the smaller the L value, the higher the ratio G/L5/2.
  • Cross-sections with the thinnest possible web (with low values of βA and βD) should be used to minimize the bridge weight.
  • Thicker webs (with higher values of βA and βD) should be used to reduce the depths of the cross-sections.

9.2. Design Recommendations

According to the developed formulations and the results of the parametric studies, the following design recommendations should be adopted to minimize the weight of the bridge:
  • Use rise–span ratios f/L between 1/5 and 1/7, with f/L being more than 1/10;
  • Use sections with very different stiffness levels in the arch and deck, preferably with very flexible arches;
  • Use the thinnest possible web thickness, β, to achieve higher stiffness with less material, with β being more than 1/100.
Readers should bear in mind that these conclusions and design recommendations are valid for tied-arch bridges with vertical hangers, where the connection between the arch and the deck is hinged. The design is assumed to be governed by the maximum allowable in-plane deflection. Therefore, different design recommendations could be obtained for other criteria, such as in-plane and out-of-plane buckling, fatigue, ultimate strength, and constructability issues, or for different arch bridge typologies.

Author Contributions

Conceptualization, J.J.J.-L. and J.M.G.-G.; methodology, J.J.J.-L.; software, J.J.J.-L. and J.M.G.-G.; investigation, J.J.J.-L. and J.M.G.-G.; writing—original draft preparation, J.J.J.-L.; writing—review and editing, J.M.G.-G.; visualization, J.M.G.-G.; supervision, J.J.J.-L. All authors have read and agreed to the published version of the manuscript. Both authors have contributed substantially to the research reported.

Funding

The authors wish to express gratitude for the Grant PID2021-126405OB-C33 funded by MCIN/AEI/10.13039/501100011033 and “ERDF A way of making Europe”.

Institutional Review Board Statement

Not applicable.

Informed Consent Statement

Not applicable.

Data Availability Statement

The original contributions presented in this study are included in this article. Further inquiries can be directed to the corresponding author.

Conflicts of Interest

The authors declare that they have no known competing financial interests or personal relationships that could have appeared to influence the research reported in this paper.

Abbreviations

The following symbols and abbreviations are used in this paper:
bLoaded deck width (Figure 1)
CAContribution of the arch to the global flexural stiffness of the bridge (Section 2.3, Equation (1))
EA, EDYoung’s modulus for the materials of the arch and the deck
fRise of the arch (Figure 1)
FEMFinite elements method
gDLSuperimposed dead load (Figure 1)
GA, GD, GArch, deck, and bridge weight.
IInertia (second moment of area) of a cross-section (Section 2.5, Equation (4))
IA, IDSecond moment of area (inertia) of the arch and deck cross-sections (Section 3, Equations (11) and (12))
ImaxMaximum second moment for a given area and web slenderness (Section 2.5, Equation (9))
k1, k2, k3Correction coefficients of theoretical formulation (Section 8).
LBridge span (Figure 1)
LALength of the arch
NA, NDAxial force at crown of the arch and at the deck (Section 4.2, Equation (20))
qLive load
qkLive load used for the SLC in the δ-method
SLCSimplified load combination used for the preliminary design stage (Section 1.1 and Section 2.2)
SLC-A, SLC-SSymmetric and antisymmetric load combinations in which the SLC is decomposed (Section 4, Figure 8)
twWeb thickness (Figure 4)
tolTolerance of iterative process (Section 2.1, Figure 7)
UDLUniformly distributed load
zWeb depth, approximately equal to cross-section depth (Figure 4)
zA, zDArch and deck web depth
zIFor a given area, web depth that maximizes the second moment of area (Section 2.5, Equation (8))
βGeometrical slenderness of the web(s) (Section 2.5, Equation (3))
βA, βDGeometrical slenderness of the web of the arch and deck
γDensity of the arch and deck materials
δVertical deflection at the arch
δ1, δ2, δ3Deflections, calculated with FEM, due to axial shortening of the arch, axial elongation of the deck, and a UDL q acting upon half of the deck
δDTotal deflection (δ1 + δ2 + δ3) at the deck checkpoint
δlimMaximum allowable deflection at the deck checkpoint
δT1, δT2, δT3 Values of δ1, δ2, δ3, calculated with theoretical formulae (Figure 9, Equations (18), (19), and (21)
μAuxiliary coefficient (Equation (10))
ΩArea of a cross-section (Figure 4)
ΩA, ΩDArea of the arch and deck cross-sections
Ωf, ΩwAreas of one flange and the web of the cross-section (Figure 4)

References

  1. Stavridis, L. Structural Systems: Behaviour and Design; Thomas Telford: London, UK, 2010. [Google Scholar]
  2. Granata, M.F.; Arici, M.; Longo, G.; Recupero, A. Steel and composite tied-arch bridges: A conceptual approach to structural design. Proc. Inst. Civ. Eng.-Bridge Eng. 2021, 174, 281–298. [Google Scholar] [CrossRef]
  3. Mermigas, K.K.; Wang, H. Comparative Study of the Proportions and Efficiency of Steel Arch Bridges. In Proceedings of the 5th International Conference on Arch Bridges, Funchal, Portugal, 12–14 September 2007. [Google Scholar]
  4. Manterola-Armisén, J. Puentes (Bridge Engineering); Colegio de Ingenieros de Caminos, Canales y Puertos: Madrid, Spain, 2006; pp. 897–988. (In Spanish) [Google Scholar]
  5. Lebet, J.P.; Hirt, M.A. Steel Bridges; EPFL Press: Lausanne, Switzerland, 2013; pp. 461–488. [Google Scholar]
  6. Leonhardt, F. Bridges/Brücken; The Architectural Press: London, UK, 1982; pp. 38–43. [Google Scholar]
  7. Menn, C. Prestressed Concrete Bridges; Birkhäuser Verlag: Vienna, Austria, 1989; pp. 382–394. [Google Scholar]
  8. Salonga, J.; Gauvreau, P. Comparative Study of the Proportions, Form, and Efficiency of Concrete Arch Bridges. J. Bridge Eng. 2014, 19, 04013010. [Google Scholar] [CrossRef]
  9. Korus, K.; Salamak, M.; Jasiński, M. Optimization of geometric parameters of arch bridges using visual programming FEM components and genetic algorithm. Eng. Struct. 2021, 241, 112465. [Google Scholar] [CrossRef]
  10. Jorquera-Lucerga, J.J. Form-Finding of Funicular Geometries in Spatial Arch Bridges through Simplified Force Density Method. Appl. Sci. 2018, 8, 2553. [Google Scholar] [CrossRef]
  11. Zhao, Z.; Zhang, T.; Wang, W. A form-finding method for spatial arch bridges based on inverse hanging method. Structures 2022, 46, 64–72. [Google Scholar] [CrossRef]
  12. Haaijer, G. Economy of High Strength Steel Structural Members. Trans. Am. Soc. Civ. Eng. 1963, 128, 820–842. [Google Scholar] [CrossRef]
  13. Eurocode 1: Actions on Structures-Part 2: Traffic Loads on Bridges; CEN: Brussels, Belgium, 2003.
  14. Eurocode 3: Design of Steel Structures; CEN: Brussels, Belgium, 2005.
  15. Argüelles Álvarez, R. Estructuras de Acero: Cálculo (Steel Structures: Analysis), 2nd ed.; Bellisco, Ediciones Técnicas y Científicas: Madrid, Spain, 2005. (In Spanish) [Google Scholar]
  16. Prendes Gero, M.B.; Bello García, A.; del Coz Díaz, J.J. Design optimization of 3D steel structures: Genetic algorithms vs. classical techniques. J. Constr. Steel Res. 2006, 62, 1303–1309. [Google Scholar] [CrossRef]
  17. Liu, X.; Yi, W.J.; Li, Q.S.; Shen, P.S. Genetic evolutionary structural optimization. J. Constr. Steel Res. 2008, 64, 305–311. [Google Scholar] [CrossRef]
  18. Saka, M.P.; Geem, Z.W.; Shen, P.S. Mathematical and Metaheuristic Applications in Design Optimization of Steel Frame Structures: An Extensive Review. Math. Probl. Eng. 2013, 271031. [Google Scholar] [CrossRef]
  19. Billington, D.P. Robert Maillart’s Bridges: The Art of Engineering; Princeton University Press: Princeton, NJ, USA, 1979. [Google Scholar]
  20. Jorquera-Lucerga, J.J.; García-Guerrero, J.M. Predimensionamiento gráfico multicriterio en el plano de secciones metálicas bisimétricas (Graphical Multi-Criteria in-Plane Preliminary Sizing of Bisymmetrical All-Metal Cross-Sections). Inf. Constr. 2021, 73, e418. (In Spanish) [Google Scholar] [CrossRef]
  21. García-Guerrero, J.M. El Puente Arco Espacial Como una Evolución Tipológica (The Spatial Arch Bridge as a Typological Evolution). Ph.D. Thesis, Technical University of Cartagena, Cartagena, Spain, 2018. (In Spanish). [Google Scholar]
  22. Park, G.; Hewson, N. ICE Manual of Bridge Engineering, 2nd ed.; Thomas Telford: London, UK, 2008. [Google Scholar]
  23. Tveit, P. Considerations for Design of Network Arches. J. Struct. Eng. 1987, 113, 2189–2207. [Google Scholar] [CrossRef]
  24. Romeijn, A.; Bouras, C. Investigation of the arch in-plane buckling behaviour in arch bridges. J. Constr. Steel Res. 2008, 64, 1349–1356. [Google Scholar] [CrossRef]
  25. Chengyi, C.; Genshu, T.; Lei, Z. In-plane nonlinear buckling analysis of circular arches considering shear deformation. J. Constr. Steel Res. 2020, 164, 105762. [Google Scholar] [CrossRef]
  26. Tang, Z.; Zhang, W.; Yu, J.; Pospíšil, S. Prediction of the elastoplastic in-plane buckling of parabolic steel arch bridges. J. Constr. Steel Res. 2020, 168, 105988. [Google Scholar] [CrossRef]
  27. Strasky, J. Stress Ribbon and Cable Supported Pedestrian Bridges, 2nd ed.; ICE Publishing: London, UK, 2011. [Google Scholar]
  28. Ministerio de Fomento de España. Instrucción Sobre las Acciones a Considerar en el Proyecto de Puentes de Carretera, (IAP-11); Ministerio de Fomento: Madrid, Spain, 2011. [Google Scholar]
  29. AN/UNE-EN 1990; Anejo Nacional Para el Eurocódigo 0: Bases de Cálculo de Estructuras y Anejo A2: Aplicación a Puentes. Ministerio de Transportes y Movilidad Sostenible: Madrid, Spain. (In Spanish)
  30. Nettleton, D.A. Arch Bridges; U.S. Department of Transportation: Washington, DC, USA, 1977. [Google Scholar]
  31. Buchholdt, H.A. An Introduction to Cable Roof Structures, 2nd ed.; Thomas Telford: London, UK, 1999. [Google Scholar]
  32. The MathWorks Inc. Matlab; R2017; The MathWorks Inc.: Madrid, Spain, 2017. [Google Scholar]
  33. Computers and Structures, Inc. Analysis Reference Manual for SAP2000® v 26; CSI: Berkeley, CA, USA, 2024. [Google Scholar]
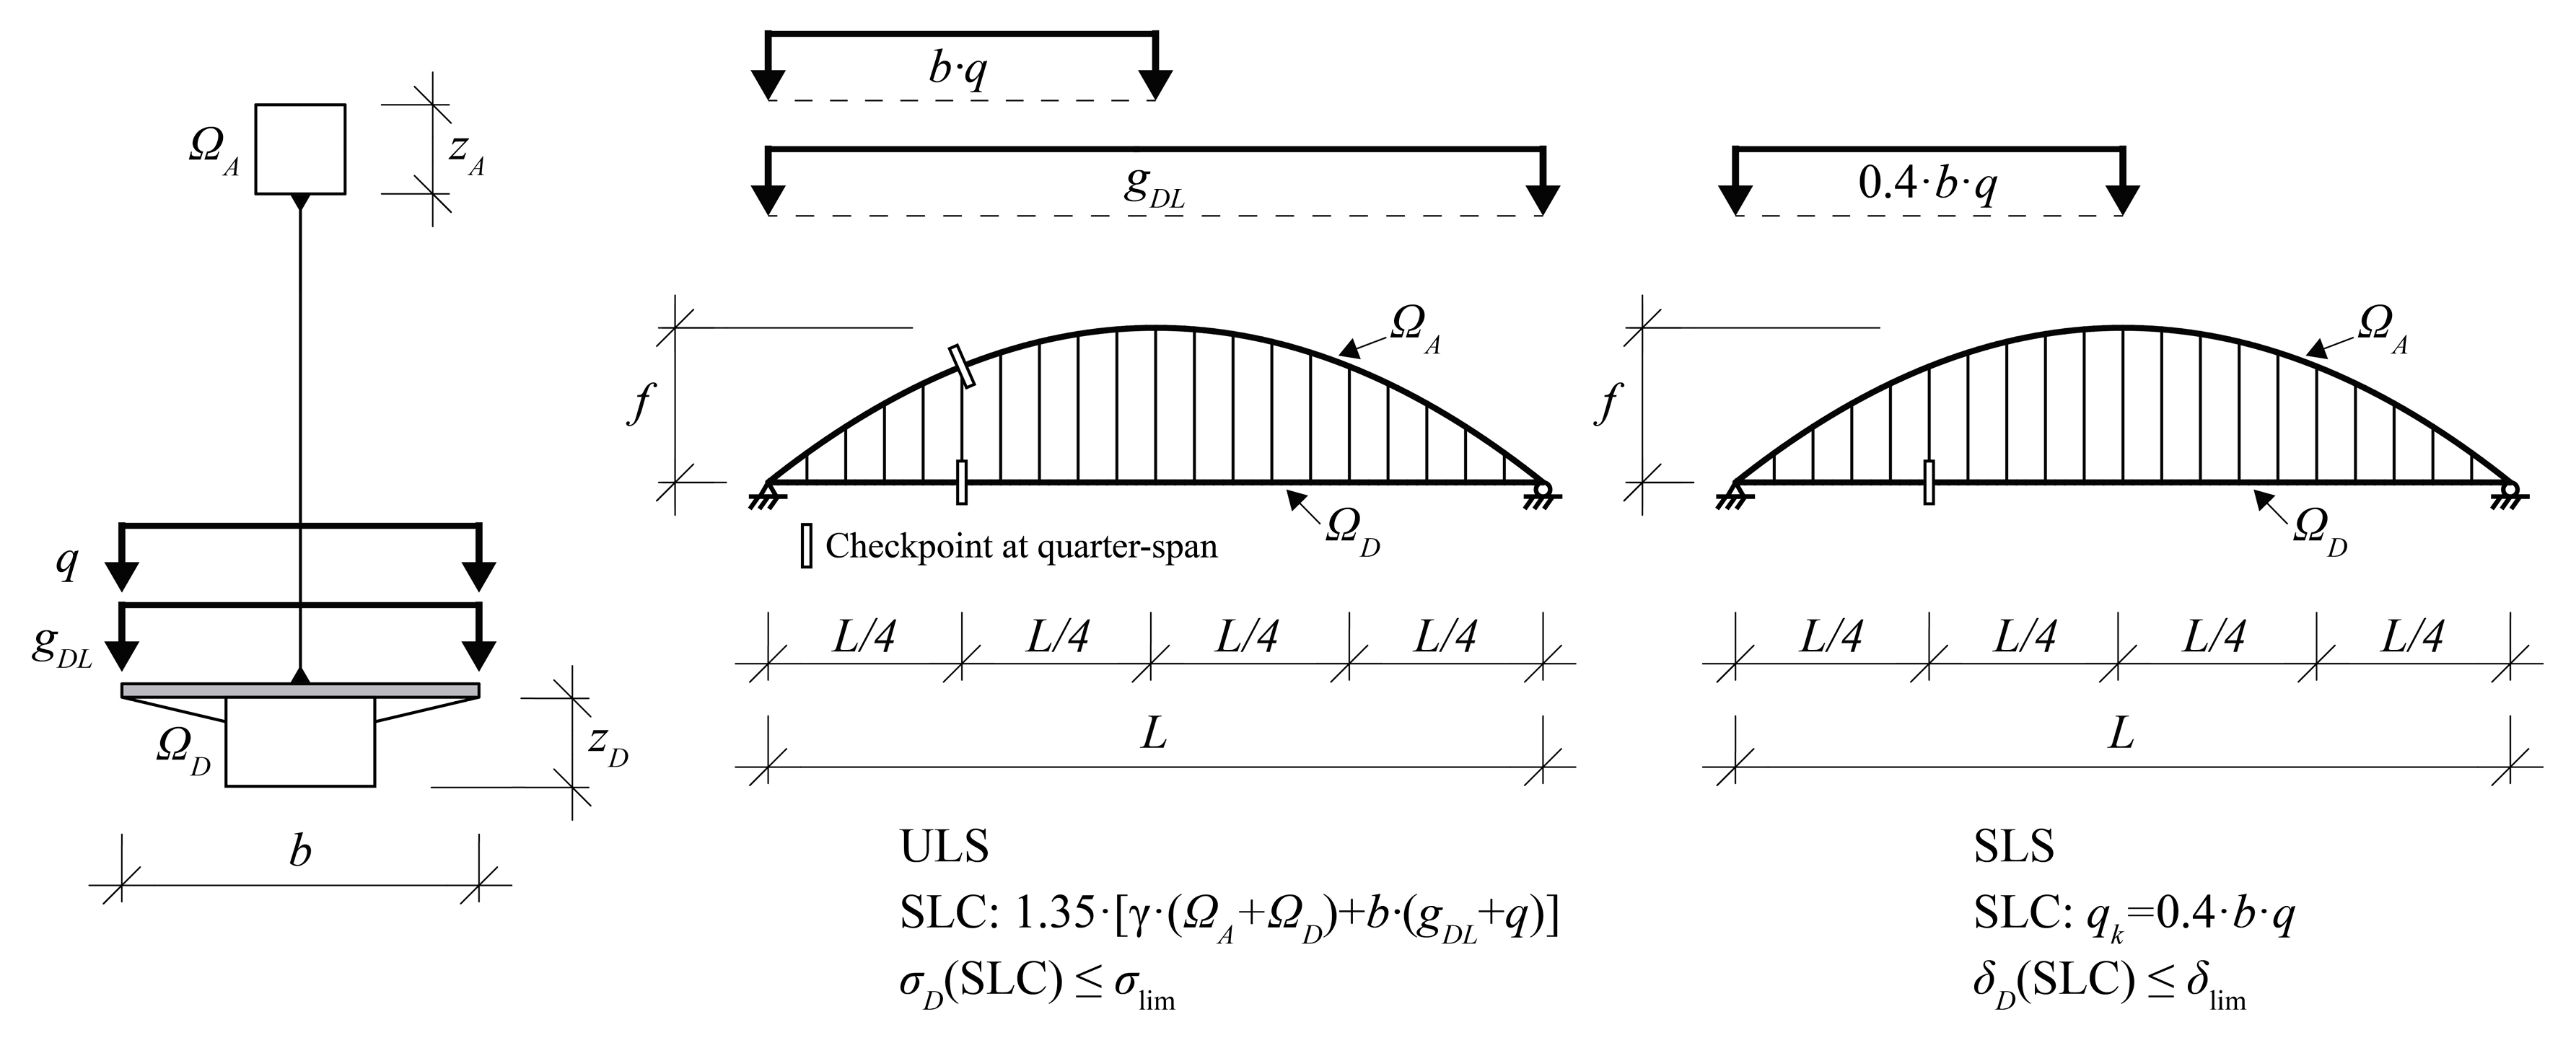
Figure 1. An example of preliminary design based on stress and deflection limits at checkpoints under SLCs defined by the designer.
Applsci 15 10022 g001
Figure 2. Bridge definition, SLC, and checkpoint location.
Applsci 15 10022 g002
Figure 3. Values of CA for different arch–deck relative stiffness levels.
Applsci 15 10022 g003
Figure 4. Definitions of cross-sections: (a) H-sections; (b) hollow-box sections.
Applsci 15 10022 g004
Figure 5. Examples of bridge typologies where the δ-method has been successfully applied by the authors.
Applsci 15 10022 g005
Figure 6. Examples of the distributions of arch area within the scope of the method: (a) constant width; (b) variable width.
Applsci 15 10022 g006
Figure 7. A flowchart of the general δ-method.
Applsci 15 10022 g007
Figure 8. SLC decomposed into symmetric (SLC-S) and antisymmetric (SLC-A) load cases.
Applsci 15 10022 g008
Figure 9. Deflections due to (a) axial shortening, (b) tie elongation, and (c) flexural deformation.
Applsci 15 10022 g009
Figure 10. A flowchart of the δ-method adapted to tied-ach bridges with vertical hangers.
Applsci 15 10022 g010
Figure 11. Bridge definition.
Applsci 15 10022 g011
Figure 12. Arch weight, GA; deck weight, GD; and combined weight, G = GA+GD vs. CA, for the bridge defined in Figure 11.
Applsci 15 10022 g012
Figure 13. The results for the bridge defined in Figure 11: (a) zA, zD, and zA + zD vs. CA; (b) IA, ID, and IA + ID vs. CA.
Applsci 15 10022 g013
Figure 14. The results for the bridge defined in Figure 11 for βA = βD = 0.04 and βA = βD = 0.08: (a) GA, GD, and G = GA + GD vs. CA; (b) zA, zD, and zA + zD vs. CA and comparison with the ranges defined in references [3,5].
Applsci 15 10022 g014
Figure 15. A comparison of results for the bridge defined in Figure 11 for βA = βD = 0.05 for different SLCs.
Applsci 15 10022 g015
Figure 16. (a) qk vs. ΩA, ΩD, and ΩA +ΩD; (b) qk vs. IA, ID, and IA + ID; (c) qk vs. GA, GD, and G = GA + GD.
Applsci 15 10022 g016
Figure 17. (a) qk vs. GA/qk, GD/qk, and GA/qk + GD/qk; (b) qk vs. zA, zD, and zA + zD.
Applsci 15 10022 g017
Figure 18. (a) IA, ID, and IA + ID vs. L/δlim; (b) ΩA2, ΩD2, and ΩA2 + ΩD2 vs. L/δlim; (c) GA2, GD2, and GA2 + GD2 vs. L/δlim.
Applsci 15 10022 g018
Figure 19. The elevation of one of the analyzed models.
Applsci 15 10022 g019
Figure 20. CA = 0.5 and βA = βD = 0.01 for different values of f/L: (a) IA vs. L3; (b) ΩA vs. L3/2.
Applsci 15 10022 g020
Figure 21. CA = 0.5 and βA = βD = 0.01: (a) G vs. L5/2 for different values of f/L; (b) G/L5/2 vs. f/L for different values of L.
Applsci 15 10022 g021
Figure 22. βA = βD = 0.01: G vs. CA for different values of L and f/L.
Applsci 15 10022 g022
Figure 23. L = 100, f/L = 0.20, βA = 0.01: (a) G vs. CA; (b) IA, ID, and IA + ID vs. CA for different βD.
Applsci 15 10022 g023
Figure 24. The numerical determination of the coefficients k1 and k2: (a) mean Equation (30) and (b) standard deviation.
Applsci 15 10022 g024
Figure 25. (δ/δT)i histogram.
Applsci 15 10022 g025
Figure 26. (G/GT)i: (a) graph; (b) histogram.
Applsci 15 10022 g026
Table 1. Parametric analysis: case studies.
SymbolUnitsValuesni
Lm50 75 100 1504
f/L-0.25 0.2 0.167 0.143 0.125 0.111 0.107
CA-0.05 0.10 0.20 0.30 0.40 0.45 0.50 0.55 0.60 0.65 0.70 0.75 0.80 0.85 0.90 0.9511
βA-1/25 1/50 1/1003
βD-1/25 1/50 1/1003
qkkN/m101
δlimmL/500 L/20002
Total n models = P(ni)5544
Other data values used for all the models are b = 5 m, ψ =0.4, q =5 kN/m2, EA = ED = 200 GPa, and γ = 78.5 kN/m3.
Disclaimer/Publisher’s Note: The statements, opinions and data contained in all publications are solely those of the individual author(s) and contributor(s) and not of MDPI and/or the editor(s). MDPI and/or the editor(s) disclaim responsibility for any injury to people or property resulting from any ideas, methods, instructions or products referred to in the content.