Abstract
Non-contact measurement technology based on computer vision has been recognized as a critical approach in bridge lightweight monitoring due to its low cost and strong environmental adaptability. To address the sub-millimeter accuracy and real-time requirements of bridge displacement monitoring, this study proposes a visual monitoring method that integrates a connected-domain segmentation matching algorithm with an automatic binarization threshold adjustment mechanism. This combination significantly improves adaptability and robustness under complex lighting conditions. Moreover, the method introduces the SRCNN (Super-Resolution Convolutional Neural Network) as a lightweight super-resolution module, the method achieves a better balance between computational efficiency and measurement precision. The proposed method was validated through model testing and successfully applied to real-bridge displacement monitoring and structural damping ratio identification. These findings demonstrate the practical potential of the method as a reliable reference for static and dynamic performance evaluation and condition assessment of bridges.
1. Introduction
Displacement, as a key indicator for static and dynamic performance evaluation of bridges, is widely used in bridge condition monitoring [1,2], damage identification [3], performance evaluation [2,4,5], and vehicle weighing [6,7]. Traditional bridge displacement monitoring primarily relies on contact-based measurement methods, whereby displacement transducers are installed at critical locations (e.g., mid-span) to record structural deformation under load. Although contact-based methods offer high accuracy and stability, they involve complex installation procedures and high costs and are often impractical in challenging environments such as mountainous regions or deep gorges with tall piers, thus severely limiting their applicability. Therefore, the development of efficient and reliable non-contact measurement technology has gradually become an emerging research direction in the field of bridge health monitoring [8,9].
In recent years, computer vision has advanced rapidly [10], and vision-based image recognition techniques have been widely applied in the field of bridge condition monitoring [11,12], damage identification [13,14], performance evaluation [15], and displacement estimation [16]. Considering its excellent performance, several researchers have begun to explore the use of computer vision for bridge displacement monitoring. In the domain of real-time high-precision displacement monitoring methods, Lee et al. [17] developed a real-time bridge displacement measurement method using digital image processing, which achieved high-resolution dynamic monitoring by analyzing the geometric features of target panels and pixel motion. Tan et al. [18] proposed a non-contact method for structural displacement measurement based on the RAFT optical flow network. Zeng et al. [19] developed a real-time algorithm based on accelerometer-strain gauge data fusion, implemented via SmartRock wireless smart sensors, which effectively solves the industry challenge of error accumulation from double integration of acceleration in reference-free conditions. Dong et al. [20] successfully applied computer vision-based displacement monitoring to world-class long-span suspension bridges, achieving non-contact measurement at ultra-long distances (up to 1350 m) with results showing strong agreement with conventional monitoring methods and finite element analysis. Peng et al. [21] proposed a Transverse Influence Ratio (DTIR) indicator based on computer vision-based displacement measurements, detecting bridge damage by extracting the quasi-static displacement ratio between adjacent girders.
Regarding long-term bridge displacement monitoring, Soyoz et al. [22] successfully tracked the long-term time-dependent variations in modal frequencies and structural stiffness (with an approximate 2% annualized stiffness reduction) of a concrete bridge through a five-year wireless acceleration monitoring campaign and neural network-based inverse analysis. Zhan et al. [23] developed a vision-based monitoring system for long-term pier settlement during construction, utilizing deep learning to handle complex environmental interference and a dual-camera system to eliminate camera displacement errors. The solution provided an automated approach for long-term displacement monitoring during bridge construction. Kim et al. [24] developed a vision-based monitoring system utilizing image processing technology, which enables long-term monitoring of tensile forces in multiple stay cables through a remotely controllable pan-tilt mechanism and a 20× electric zoom lens.
In terms of enhancing the accuracy of image processing techniques, Jo et al. [25] proposed a multiple-image processing-based method for bridge displacement measurement, which enhanced robustness to image rotation by integrating template matching and homography matrix techniques. This approach effectively addresses measurement errors caused by varying shooting angles of non-fixed cameras like smartphones. Yu et al. [26] proposed a view and illumination invariant image matching method that significantly improves matching accuracy through iterative estimation and transformation of view/illumination relationships, with innovative “valid angle” and “valid illumination” evaluation metrics.
However, in practical applications, bridge displacement monitoring under operational conditions often requires millimeter to sub-millimeter accuracy (0.1–1 mm), especially for small and medium span bridges, which poses a significant challenge to traditional computer vision methods. To overcome these challenges, recent studies have proposed advanced vision-based approaches with enhanced precision and robustness. Aliansyah et al. [27] integrated front-view tandem marker motion capture with side-view traffic counting to achieve multi-point (8 points), long-distance (40.8–64.2 m), and sub-millimeter-resolution bridge displacement measurement. The system successfully captured millimeter-level dynamic displacement distributions under traffic loads. Yoon et al. [28] extract a framework for measuring absolute structural displacement from UAS videos, which extracts relative displacement through a target-free algorithm and compensates for six-degree-of-freedom camera motion by tracking background feature points, effectively solving critical errors in mobile platform measurements. Laboratory validation demonstrated that this method achieves high-precision displacement estimation (RMS error 2.14 mm) under simulated railway bridge monitoring scenarios. Antoš et al. [29] developed an open-source displacement measurement tool using an up sampled Fourier transform-based image registration algorithm, achieving high-frequency sub-pixel accuracy at predefined points through virtual extensometers, thereby addressing systematic errors caused by frame compliance in laboratory testing. Zhao et al. [30] developed a semi-dense sub-pixel displacement measurement framework based on LoFTR, which achieves sub-pixel accuracy displacement tracking on low-texture surfaces through integrated adaptive preprocessing and error compensation mechanisms.
Nevertheless, these approaches still face limitations in terms of adaptability to complex lighting conditions, robustness under varying operational environments, and balancing computational efficiency with measurement accuracy. In particular, there is a lack of vision-based bridge displacement monitoring methods that integrate connected-domain segmentation matching with automatic binarization threshold adjustment, and no prior study has combined such preprocessing strategies with a lightweight super-resolution model to enhance precision. To address this gap, this study proposes a visual monitoring method that integrates a connected-domain segmentation matching algorithm with an automatic binarization threshold adjustment mechanism, significantly improving adaptability and robustness under complex lighting conditions. Furthermore, by incorporating the SRCNN (Super-Resolution Convolutional Neural Network) as a lightweight super-resolution module, the method achieves a better balance between computational efficiency and measurement precision.
Based on the aforementioned considerations, this study proposes a vision-based bridge displacement monitoring method leveraging connected domain segmentation and matching algorithms. The main contribution of the current study is two-fold:
- An adaptive binarization threshold adjustment mechanism is introduced, which significantly improves the algorithm’s adaptability and robustness under complex lighting conditions. In addition, by integrating the Super Resolution Convolutional Neural Network (SRCNN) model, the method achieves sub-pixel identification accuracy, thereby enabling sub-millimeter precision in displacement measurement.
- A complete validation framework is established, where the proposed method is first verified through scaled model testing and subsequently applied to real bridge displacement monitoring and structural damping ratio identification. This not only demonstrates the method’s reliability under practical conditions but also highlights its potential for broader applications in structural health monitoring.
2. Bridge Displacement Monitoring Based on Computer Vision
2.1. Characteristics and Principles of the Bridge Displacement Visual Monitoring Method
The bridge displacement monitoring method based on computer vision is characterized by relatively fixed markers, small vibration amplitudes, and stringent requirements on recognition accuracy (necessitating sub-millimeter-level precision). Moreover, the monitoring process must support online, real-time data processing.
Figure 1 presents a schematic diagram of the computer vision-based bridge displacement monitoring method technical principle. First, markers are installed at the bridge displacement measurement points, and the camera is calibrated to establish the coordinate transformation between spatial points and image points. In vision-based structural displacement monitoring, two primary types of feature points are commonly employed: artificial target markers and natural structural targets. Artificial target markers, such as high-contrast circular markers or checkerboard patterns, are explicitly designed and installed on the target structure. They offer high reproducibility, distinct edges, and stable optical characteristics, which facilitate sub-pixel-accurate extraction and reliable matching under varying environmental conditions. In contrast, natural feature-based methods utilize existing textures or patterns on structural surfaces, eliminating the need for physical markers and reducing installation effort. However, their performance heavily depends on surface texture richness and lighting conditions, often leading to reduced accuracy and robustness in low-texture regions or under significant illumination variations. Given the requirement of sub-millimeter-level accuracy and the need for real-time processing in short-term monitoring scenarios, this study employs artificial target markers.
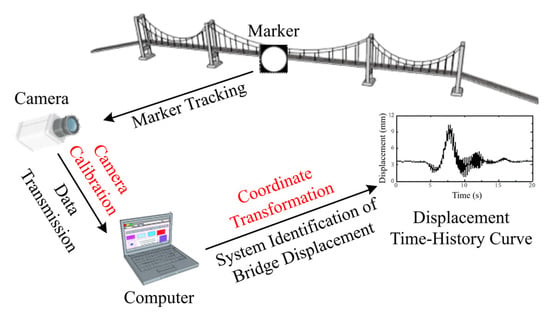
Figure 1.
Schematic diagram of the technical principle for the visual monitoring method of bridge displacement.
Subsequently, displacement data of markers are derived from the identification algorithm based on their image coordinates. Finally, the coordinate transformation is applied to convert the measured image displacement into displacement in the spatial coordinate system.
2.2. High Precision Vision Based Bridge Displacement Identification Using Connected Domain Segmentation and Matching Algorithm
2.2.1. Principles of Connected Region Segmentation and Matching Method
To address the stringent requirements for displacement identification accuracy and real-time data processing, this study employs the connected region segmentation and matching method for bridge displacement monitoring. The method demonstrates advantages in algorithmic simplicity and robustness, which are conclusively validated through subsequent scaled model experiments and field testing on actual bridges.
A connected region in an image is defined as an area of spatially adjacent pixels sharing the same intensity value. The core of the connected region segmentation and matching method is to identify and segment all connected regions in a binary image, then determine the position and size of each region’s minimum bounding rectangle. Next, each connected region in the current frame is matched against the target object’s connected region from the previous frame; if their similarity exceeds a predefined threshold, the region is recognized as the target.
During image binarization, the binarization threshold parameter directly influences the resulting binary image. Taking a circular marker as an example, Figure 2 illustrates the binarization outcomes obtained with different threshold parameter settings.
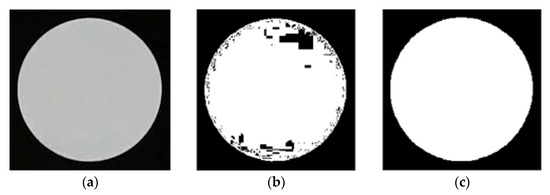
Figure 2.
Binary images corresponding to different binarization thresholds: (a) Original image; (b) Binarization threshold = 0.73; (c) Binarization threshold = 0.70.
As shown in Figure 2, although the minimum bounding rectangles of the connected region corresponding to the marker are identical, their centroid positions differ markedly. Illumination intensity is the primary factor influencing the choice of the binarization threshold parameter. To ensure that the algorithm maintains strong robustness under varying lighting conditions, an automatic adjustment mechanism for the binarization threshold parameter is incorporated into the algorithm.
The main idea of the automatic adjustment mechanism for the binarization threshold parameter is as follows: first, the marker image is binarized using the threshold value from Figure 2c as the initial parameter. A variable f is defined as the ratio between the number of white pixel blocks and the total number of pixel blocks within the marker’s minimum bounding rectangle in Figure 2c, and the range from 0.95 f to 1.05 f is designated as the desired threshold range. For the i-th frame, the ratio is calculated as the number of white pixel blocks after binarization divided by the total number of pixel blocks within its minimum bounding rectangle. If exceeds 1.05 f, the binarization threshold is iteratively reduced until falls within the adaptive range.
Conversely, if is less than 0.95 f, the threshold parameter is iteratively increased until falls within the adaptive range. Throughout the process, the binarization threshold parameter is continuously updated to ensure adaptability. In addition, after updating the threshold parameter, morphological operations such as erosion and dilation are applied to the binarized image to ensure the accuracy of the result.
Most bridge structures exhibit minuscule displacement responses under vehicular loads. Constrained by image resolution limitations, conventional vision-based techniques struggle to accurately measure such structural micro-displacements. To overcome this, this study integrates the SRCNN image enhancement algorithm, elevating identification accuracy to sub-pixel level and enabling precise detection of structural micro-displacements.
The SRCNN algorithm [31] is a deep learning based super resolution method characterized by its simple architecture and low reconstruction distortion, enabling effective image super resolution processing. As shown in Figure 3, the SRCNN model consists of three fundamental layers: feature extraction layer, nonlinear mapping layer, and image reconstruction layer.
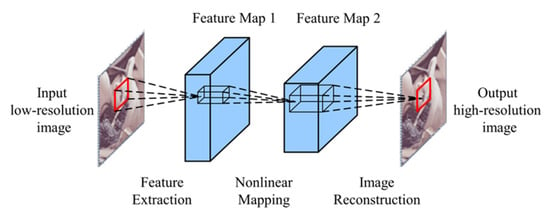
Figure 3.
Framework of SRCNN.
Before feeding the image into the model, it is preprocessed using bicubic interpolation to produce an upscaled low-resolution image Y. The image feature extraction layer can be expressed as:
where denotes the ReLU activation function; represents the convolution weights with dimensions ; denotes the number of filters; the convolution window size is ; c represents the number of channels, consistent with the input image’s channel count; denotes the bias parameter, an n1-dimensional vector; and * denotes the convolution operation.
After the input image is processed by the feature extraction layer, an n1-dimensional feature vector (i.e., a feature map) is generated and passed to the nonlinear mapping layer; this process is described by Equation (2). The structure of this layer mirrors that of the first layer, but by applying nonlinear mapping to the feature maps extracted previously, it deepens the network and thus strengthens the model’s ability to learn complex features.
where denotes a set of convolution kernels with dimensions ; denotes the bias parameter, an c-dimensional vector.
The image reconstruction layer adopts the interpolation concept from traditional super-resolution algorithms to aggregate the high-resolution image patches generated by the second layer. For overlapping regions across multiple patches, pixel values are averaged to reconstruct the final high-resolution image. This process functions as a linear operation, formally expressed by the linear function in Equation (3):
where denotes the reconstructed high-resolution image; denotes a set of convolution kernels with dimensions ; denotes the bias parameter, an c-dimensional vector.
To validate the effectiveness of the SRCNN algorithm, circular marker points were subjected to image super-resolution processing. As illustrated in Figure 4, the binarized image of an untreated circular marker exhibits distinctly jagged edges, whereas the marker processed with super-resolution demonstrates significantly smoother edges in its binarized form. This result demonstrates that the SRCNN algorithm effectively enhances image resolution.
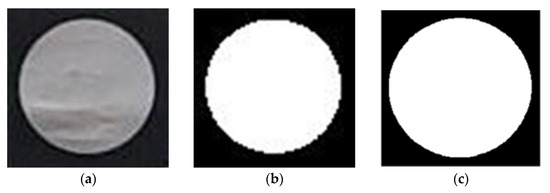
Figure 4.
Comparison of the effect before and after super-resolution processing of the marker: (a) Segmented marker image; (b) Binary image before processing; (c) Binary image after processing.
The displacement identification procedure based on the connected domain segmentation and matching method comprises the following steps:
- Extract the first frame image and acquire the minimum bounding rectangle information of the target object’s connected region;
- Perform binarization processing on the current frame image and construct minimum bounding rectangles for all connected regions;
- Conduct similarity matching between each rectangle and the target object’s minimum bounding rectangle from the previous frame to determine the target’s position in the current frame;
- Segment the region containing the target object, apply SRCNN-based super-resolution processing to the segmented image, and obtain the target’s pixel coordinates within the segmented sub-image;
- Map the target coordinates to the global image coordinate system and derive the physical coordinates of the marker in 3D space through coordinate transformation.
2.2.2. Camera Calibration
Camera calibration is carried out to establish the projection transformation between a three-dimensional point in space and its corresponding two-dimensional point in the image. As shown in Figure 5, the projection relationship between a spatial point Q and its corresponding image coordinate q can be expressed by Equation (4) [32]:
where s is the scale factor; are the pixel coordinates of the image center (principal point); and are the camera focal lengths in the horizontal and vertical directions, respectively; γ is the skew factor; and R and T denote the rotation matrix and translation vector that transform coordinates from the world frame to the camera frame.
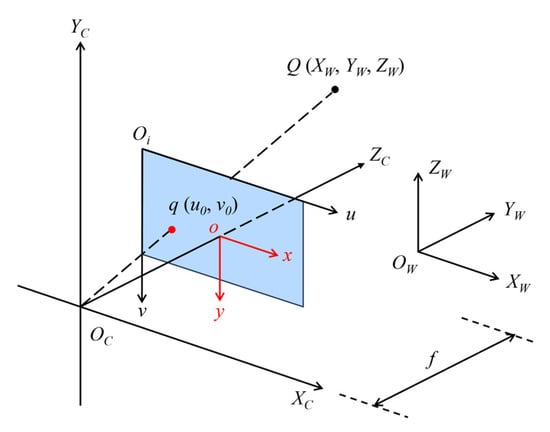
Figure 5.
Coordinate transformation diagram.
Current widely used camera calibration methods, such as the scaling factor method [32] and direct linear calibration [33], exhibit certain limitations in identifying structural displacement. This study employs Zhang’s calibration method [34] for calibration, which offers high precision and computational efficiency. During experimentation, multiple checkerboard images were captured from various angles. Using the physical coordinates of corner points on the checkerboard and their corresponding image coordinates, the camera’s intrinsic and extrinsic parameters were calculated.
To eliminate the influence of optical lens distortion on measurement accuracy, this study adopted Zhang’s calibration method with a checkerboard calibration target. A set of no fewer than 15 images of the calibration target from different poses was captured, from which the camera’s intrinsic matrix and distortion coefficients were estimated. All subsequently recorded images were then rectified using these calibration parameters prior to displacement processing.
3. Experimental Validation
To validate the accuracy of the proposed algorithm in structural displacement identification, a laboratory-scale model test was conducted. The free-decay vibration response of a simply supported aluminum bridge was simultaneously measured using a laser displacement sensor and the visual method, with the laser measurements serving as the reference ground truth to evaluate the accuracy of the visual method in structural displacement identification.
The experimental structure was a simply supported aluminum bridge with a total length of 3 m and a span of 2.9 m. The bridge cross-section was rectangular, measuring 0.12 m in width and 0.02 m in thickness. Key experimental equipment included a camera, a laser displacement sensor, a tripod, a checkerboard calibration target, and a circular marker. The camera employed was a Canon EOS 5D Mark IV equipped with a 55 mm fixed-focus lens (aperture f/1.7) (Canon Inc., Wuhan, China). The video resolution was set to 1920 × 1080 p with a frame rate of 50 fps, and the distance between the camera and the marker was maintained at 30 cm. The laser displacement sensor sampling frequency was 128 Hz. A printed 6 × 8 checkerboard pattern with cell dimensions of 7 mm × 7 mm was used for calibration, alongside white circular markers of 14 mm radius. The checkerboard and markers were affixed to the side surface at the mid-span of the aluminum bridge. The laser displacement sensor was positioned beneath the bridge at the marker location, as illustrated in Figure 6. An initial displacement was induced using the suspended weight method. After sudden release by cutting the suspending thread, both the laser displacement sensor and camera recorded the free-decay vibration response.
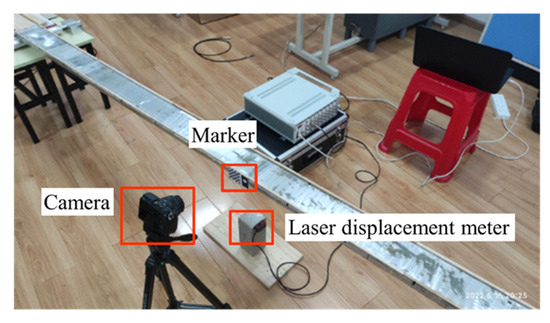
Figure 6.
Photo of the test setup.
Figure 7 presents a comparison of mid-span displacements of the aluminum bridge obtained from the laser displacement sensor and the camera-based recognition method.
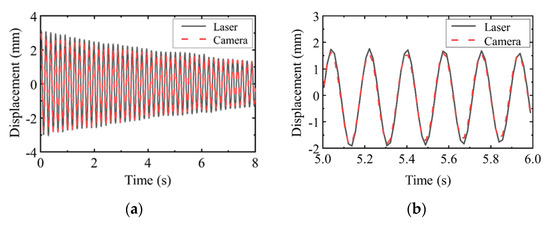
Figure 7.
Comparison between experimental and reference measurements on the laboratory test bridge: (a) Overall view of displacement time history obtained by the camera (vision−based method) and the laser displacement meter (reference experiment); (b) Zoomed-in comparison at 5–6 s.
Figure 7 indicates strong agreement between the displacement measurements from both methods. Quantitative accuracy assessment was conducted via correlation analysis of the two datasets, with the correlation coefficient ρ given by Equation (5):
where the correlation coefficient ρ ranges from 0 to 1. A higher value indicates stronger data correlation, signifying closer agreement between the two datasets; and denote the measurement data from the laser displacement sensor and vision-based method, respectively; and represent the arithmetic means of their corresponding datasets.
The calculated correlation coefficient validates that the vision-based method employed in this study achieves high-precision identification and enables accurate measurement of structural displacements with sub-millimeter accuracy.
4. Application Case Study
4.1. Monitoring of Actual Bridge Displacement
To validate the displacement identification performance of the proposed algorithm in real-world bridge applications, a displacement monitoring experiment was conducted on a three-span continuous girder bridge (45 m × 3 spans) in Wuhan, China. Key experimental equipment included a camera, a laser displacement sensor, a tripod, a checkerboard calibration target, and a circular marker. Specifically, a Canon EOS 5D Mark IV with a 200 mm fixed-focus lens (aperture f/3.5) was used. The recording resolution was configured at 1920 × 1080 p with a frame rate of 50 fps, and the distance between the camera and the marker was approximately 10 m. Based on the imaging principle of the pinhole camera model, the displacement to be analyzed can be converted into the corresponding pixel displacement, which is determined by the camera resolution, focal length, and the distance between the camera and the marker. Under the same equipment configuration, considering variations in testing environments with camera-to-marker distances ranging from 10 m to 20 m, we recommend that the vision system should have a resolution of at least 1920 × 1080 p and a frame rate no lower than 30 fps to ensure reliable sub-millimeter displacement identification.
As depicted in Figure 8, displacement markers were affixed to the mid-span of the second bridge span, while a camera was positioned at a stable location beneath the bridge to record displacement responses during vehicle passages. Simultaneously, traffic flow conditions on the bridge deck were documented via synchronized video recording.

Figure 8.
Test bridge and target markers.
Figure 9 presents the identified mid-span displacements of the bridge during passages of three vehicles. It is evident that the displacements in the pixel coordinate system operate at the sub-pixel level (<1 pixel) when vehicles traverse the bridge. After coordinate transformation, the measured maximum displacement values did not exceed 0.2 mm. These results demonstrate that the proposed algorithm achieves high-precision identification of minute structural displacements.
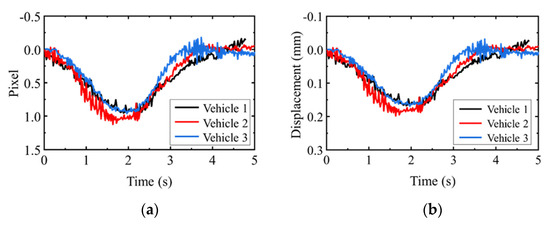
Figure 9.
Field test results of identified bridge displacement: (a) Pixel−scale displacement; (b) Physical−scale displacement.
4.2. Structural Damping Ratio Identification
The vision-based method offers distinct advantages for structural displacement identification, including high precision, non-contact measurement, and zero additional damping imposition. These characteristics make it particularly suitable for identifying damping ratios in lightweight structures with low inherent damping.
To demonstrate its application, consider bridge installations with passive viscous dampers. A simplified experimental setup (Figure 10a) was designed and fabricated to validate the damping enhancement effect of passive viscous dampers on bridges. The test structure remained the simply supported aluminum bridge shown in Figure 6, with a total length of 3.0 m and a rectangular cross-section of 0.12 m width × 0.02 m thickness. The right end featured a fixed hinge support (Figure 10c), while the left end incorporated a movable support (Figure 10b) to enable adjustable span length. Operating on the working principle of passive viscous dampers, the experimental device dissipates energy through viscous interaction between a plastic tube and damping fluid during bridge vibrations. The plastic pipe has outer and inner diameters of 20 mm and 18 mm, respectively.
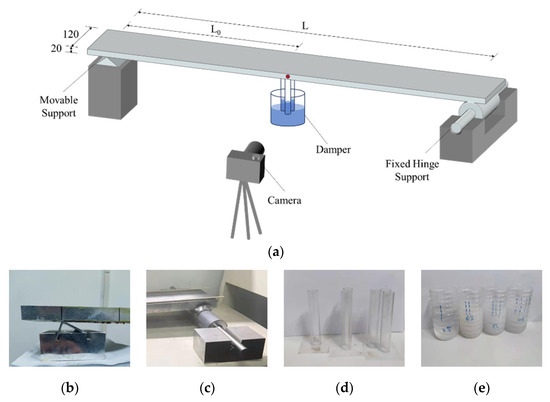
Figure 10.
Schematic illustration of the test protocol (mm). (a) Schematic diagram of the experimental setup; (b) Moveable support; (c) Fixed hinge support; (d) Plastic tube; (e) Damping fluid.
To investigate the influence of structural frequency, damper parameters, and vibration amplitude on system damping performance, experimental cases comprising five structural spans, three shear areas (single-, double-, and triple-pipe configurations, see Figure 10d), four liquid viscosities, and four suspended masses were designed. Furthermore, under the configuration with a 2.9 m span and 4 kg suspended mass, the effect of damper installation location on system damping performance was analyzed. Detailed experimental cases are provided in Table 1. The viscosity coefficient of the damping fluid was measured using the falling-sphere viscometer method [34]. For comparative purposes, dynamic characteristics of the damping-free structure were tested under varying spans and suspended masses.

Table 1.
Parameters for all cases.
An initial displacement was imposed on the structure by suspending a mass at the mid-span. After cutting the suspending thread, the free-decay vibration response was recorded. Each test case was repeated twice, with the average value serving as the identified damping ratio for that configuration. The structural damping ratio was determined using the logarithmic decrement method [34].
Taking the damping-free structure with span length and suspended mass of 4 kg as an example, Figure 11 presents the measured mid-span displacement time history and corresponding frequency spectrum. Following the release of initial displacement, the bridge exhibits characteristic free-decay vibration behavior. After 15 s, the vibration amplitude shows only minimal attenuation, indicating inherently low damping characteristics of the structure.
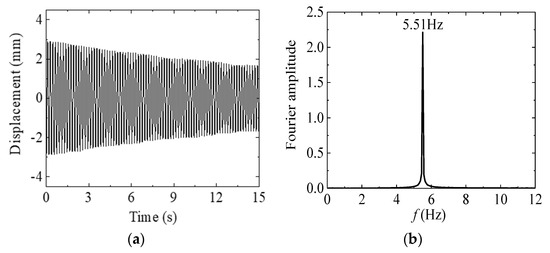
Figure 11.
Mid−span displacement of the test bridge: (a) Time domain; (b) Frequency domain.
Table 2 summarizes the natural frequencies and damping ratios of the damping-free structure under varying suspended masses (initial displacements) and span lengths. The measured damping ratios of the damping-free structure were consistently low, ranging between 0.10% and 0.14%. As the span length increased, the natural frequency decreased progressively from 7.22 Hz at L = 2.5 m to 5.49 Hz at L = 2.9 m, while the damping ratio remained virtually constant. This indicates that the damping ratio is insensitive to variations in natural frequency. The underlying mechanism is that structural damping primarily originates from material damping, which is frequency-independent and governed solely by material properties. For this homogeneous aluminum bridge, structures with different spans (natural frequencies) exhibit identical material damping mechanisms, resulting in comparable damping ratios. Furthermore, for a given structure, the damping ratio increases slightly with larger initial displacements (i.e., increased mass), demonstrating a positive correlation between vibration amplitude and damping ratio. The close agreement between duplicate test results confirms measurement reliability and high repeatability of the experimental methodology.

Table 2.
Dynamic properties of empty structure.
Figure 12 illustrates the system damping characteristics under varying damping fluid viscosities. The results indicate that the system adheres to a linear viscous damping mechanism across all tested viscosities. Both increased fluid viscosity and larger shear areas (i.e., number of tubes) contribute to a linear growth trend in system damping. It should be noted that although the shear area between the tubes and damping fluid experiences minor variations during vibration, the amplitude of these changes is negligible. This is attributed to the tube displacement amplitude (approximately 6 mm with a 7 kg suspended mass) being orders of magnitude smaller than the immersion depth in the fluid (10 cm), thereby minimally affecting the shear area. For any given shear area (tube count), the system damping ratio increases proportionally with fluid viscosity. This consistent trend is observed for single-, double-, and triple-tube configurations. At a viscosity of 3.05 Pa·s, the system damping ratio reaches 1.50%, representing an order-of-magnitude increase compared to the damping-free structure.
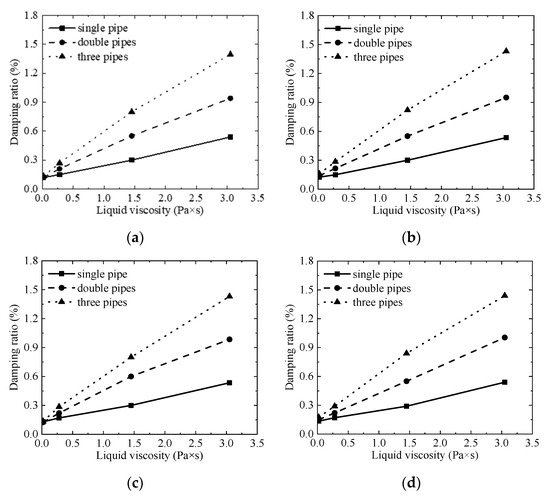
Figure 12.
System damping with different liquid viscosity: (a) Mass = 4 kg; (b) Mass = 5 kg; (c) Mass = 6 kg; (d) Mass = 7 kg.
Figure 13 further illustrates the influence of damper installation location on system damping performance. The results demonstrate that damping ratios increase progressively when dampers are installed closer to the bridge mid-span. This experimentally validated trend indicates that effective energy dissipation is achieved by positioning dampers at locations of maximum modal displacement. Furthermore, the effect of installation location on damping performance becomes more pronounced with increasing damping fluid viscosity.
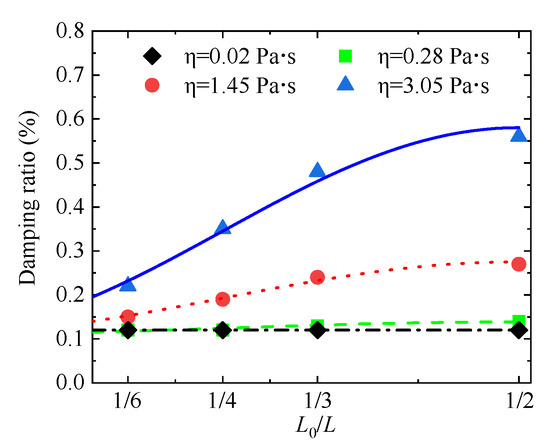
Figure 13.
Influence of damper installation position on the structural damping ratio.
5. Discussion
5.1. Limitations Under Operational Dynamic Loading
The primary aim of this study was to develop and validate a vision-based displacement monitoring method; accordingly, the experimental design focused on measurement accuracy and feasibility rather than a comprehensive parameterization of dynamic loading conditions. We acknowledge that bridge operational loads are more complex than the controlled scenarios considered here—variations in vehicle types, speeds, traffic intensity, and transient events (e.g., braking, lane changes, wind gusts) can significantly affect structural responses. The current work only illustrated applicability under representative traffic passages and did not systematically investigate how such diverse operational loads influence displacement identifiability. In future research, we will address this gap by (i) synchronizing vision measurements with auxiliary sensors (e.g., axle counters, weigh-in-motion or vehicle classification systems, high-rate accelerometers) to obtain detailed load records; (ii) conducting controlled loading tests to isolate specific effects (vehicle speed, axle configuration, multi-vehicle interactions); and (iii) developing a taxonomy of operational scenarios to evaluate algorithm performance across representative conditions. Such efforts will clarify the operational envelope of the proposed approach and support its deployment in routine bridge monitoring.
5.2. Validation and Method Comparison
In the present manuscript, the proposed method was quantitatively validated in laboratory tests where vision-based measurements were compared against a laser displacement meter under controlled excitation; results showed close agreement and established baseline accuracy under reference conditions. For field tests, however, parallel reference instrumentation was not deployed due to site constraints, so direct instrument-to-instrument comparisons are not available for the on-site data. Nonetheless, the identified field displacements are consistent with expected structural responses under traffic and exhibited stable behavior during long-term observation, indicating practical applicability. We also note that the present study integrates SRCNN as a lightweight super-resolution module to improve sub-pixel detection, but a systematic algorithmic comparison (e.g., optical-flow–based trackers, image-registration methods, feature-matching frameworks, or alternative super-resolution models) has not yet been performed. Future work should therefore include (i) field tests instrumented with reference sensors to enable direct quantitative comparisons (RMSE, correlation, bias, frequency–domain agreement), and (ii) head-to-head benchmarking of competing image-processing pipelines in both laboratory and field environments to quantify trade-offs in precision, robustness to lighting/texture variations, and real-time performance. These comparative studies will more comprehensively delineate the strengths and limitations of the proposed pipeline for engineering practice.
6. Conclusions
This study proposes a vision-based bridge displacement monitoring method utilizing a connected domain segmentation and matching algorithm. By incorporating an automatic adjustment mechanism for the binarization threshold parameter, the algorithm’s adaptability and robustness under complex lighting conditions are significantly enhanced. Moreover, integration with the image super-resolution processing model SRCNN elevates the recognition accuracy to the sub-pixel level, enabling sub-millimeter precise measurement of bridge displacements. The method’s efficacy was validated through model testing and successfully applied to real-bridge displacement monitoring and structural damping ratio identification. Key conclusions are as follows:
- The proposed vision-based displacement monitoring method, grounded in the connected domain segmentation and matching algorithm, achieves high precision and robust performance, delivering sub-millimeter accuracy in bridge displacement measurement.
- Damping identification experiments based on the vision-based method reveal that system damping adheres to a linear viscous damping mechanism across varying fluid viscosities. At a viscosity of 3.05 Pa·s, the system damping ratio attains 1.50%, significantly exceeding the 0.10–0.14% range observed in the damping-free structure. Damper installation location critically influences damping performance, with higher damping ratios achieved at positions of greater modal displacement. Additionally, system damping exhibits insensitivity to structural natural frequencies but increases slightly with vibration amplitude.
Author Contributions
Conceptualization, C.S. and W.H.; methodology, C.S. and W.H.; formal analysis, C.S.; data curation, C.S.; writing—original draft preparation, C.S. and W.H.; supervision, W.H.; funding acquisition, W.H.; writing—review and editing, C.Z. All authors have read and agreed to the published version of the manuscript.
Funding
This research was funded by Zhejiang Engineering Center of Road and Bridge Intelligent Operation and Maintenance Technology, full grant number: 202404G.
Institutional Review Board Statement
Not applicable.
Informed Consent Statement
Not applicable.
Data Availability Statement
Data is unavailable due to privacy.
Acknowledgments
The authors would like to express their sincere gratitude to Cunxu Yao and Peng Liu for their invaluable assistance during the experimental work.
Conflicts of Interest
The authors declare no conflicts of interest.
References
- Milan, L.; Ivana, H.; Matus, B.; Joaquim, J.S.; Daniele, P.; Gloria, P. Bridge Displacements Monitoring Using Space-Borne X-Band SAR Interferometry. IEEE J. Sel. Top. Appl. Earth Observ. Remote Sens. 2017, 10, 205–210. [Google Scholar]
- Huang, Q.; Crosetto, M.; Monserrat, O.; Crippa, B. Displacement monitoring and modelling of a high-speed railway bridge using C-band Sentinel-1 data. ISPRS-J. Photogramm. Remote Sens. 2017, 128, 204–211. [Google Scholar] [CrossRef]
- Sun, Z.; Nagayama, T.; Su, D.; Fujino, Y. A Damage Detection Algorithm Utilizing Dynamic Displacement of Bridge under Moving Vehicle. Shock Vib. 2016, 2016, 8454567. [Google Scholar] [CrossRef]
- Zheng, X.; Yang, D.; Yi, T.; Li, H. Bridge influence line identification from structural dynamic responses induced by a high-speed vehicle. Struct. Control. Health Monit. 2020, 27, e2544. [Google Scholar] [CrossRef]
- Qiu, Y.; Zheng, B.; Jiang, B.; Jiang, S.; Zou, C. Effect of non-structural components on over-track building vibrations induced by train operations on concrete floor. Int. J. Struct. Stab. Dyn. 2025, 2650180. [Google Scholar] [CrossRef]
- Xia, Y.; Jian, X.; Yan, B.; Su, D. Infrastructure Safety Oriented Traffic Load Monitoring Using Multi-Sensor and Single Camera for Short and Medium Span Bridges. Remote Sens. 2019, 11, 2651. [Google Scholar] [CrossRef]
- Zhao, Z.; Uddin, N.; Brien, E.J.O. Bridge Weigh-in-Motion Algorithms Based on the Field Calibrated Simulation Model. J. Infrastruct. Syst. 2017, 23, 4016021. [Google Scholar] [CrossRef]
- Ribeiro, D.; Calçada, R.; Ferreira, J.; Martins, T. Non-contact measurement of the dynamic displacement of railway bridges using an advanced video-based system. Eng. Struct. 2014, 75, 164–180. [Google Scholar] [CrossRef]
- Attanayake, U.; Tang, P.; Servi, A.; Aktan, H. Non-contact bridge deflection measurement: Application of laser technology. In Proceedings of the International Conference Structural Engineering Construction and Management, ICSEM 2011, Peradeniya, Sri Lanka, 16–18 December 2011. [Google Scholar]
- Lydon, D.; Taylor, S.; Del-Rincon, J.M.; Robinson, D.; Lydon, M.; Hester, D. Monitoring of bridges using computer vision methods. In Proceedings of the Civil Engineering Research in Ireland Conference, Galway, Ireland, 29–30 August 2016. [Google Scholar]
- Chou, J.; Liu, C.; Shih, H.; Lin, Z. Automated annotation of steel corrosion in UAV-captured images from beneath bridge decks using metaheuristic-optimized computer vision. Structures 2025, 75, 108696. [Google Scholar] [CrossRef]
- Han, Y.; Feng, D.; Liao, Y. Computer vision-assisted lateral cooperative performance assessment of assembled box girder bridges under normal traffic conditions. Eng. Struct. 2025, 327, 119683. [Google Scholar] [CrossRef]
- Garbowski, T.; Gajewski, T. Semi-automatic Inspection Tool of Pavement Condition from Three-dimensional Profile Scans. Procedia Eng. 2017, 172, 310–318. [Google Scholar]
- Rinaldi, C.; Ciambella, J.; Gattulli, V. Image-based operational modal analysis and damage detection validated in an instrumented small-scale steel frame structure. Mech. Syst. Signal Proc. 2022, 168, 108640. [Google Scholar]
- Bao, Y.; Tang, Z.; Li, H.; Zhang, Y. Computer vision and deep learning–based data anomaly detection method for structural health monitoring. Struct. Health Monit. 2019, 18, 401–421. [Google Scholar]
- Ma, Z.; Choi, J.; Sohn, H. Real-time structural displacement estimation by fusing asynchronous acceleration and computer vision measurements. Comput.-Aided Civil Infrastruct. Eng. 2022, 37, 688–703. [Google Scholar] [CrossRef]
- Lee, J.J.; Shinozuka, M. Real-Time Displacement Measurement of a Flexible Bridge Using Digital Image Processing Techniques. Exp. Mech. 2006, 46, 105–114. [Google Scholar] [CrossRef]
- Tan, S.; Zhu, L.; Li, J.; Cui, Z.; Zhao, G.; Tu, J. Non-contact vibration displacement measurement method for railway bridges based on computer vision. Structures 2025, 80, 109803. [Google Scholar] [CrossRef]
- Zeng, K.; Zeng, S.; Huang, H.; Qiu, T.; Shen, S.; Wang, H.; Feng, S.; Zhang, C. Sensing Mechanism and Real-Time Bridge Displacement Monitoring for a Laboratory Truss Bridge Using Hybrid Data Fusion. Remote Sens. 2023, 15, 3444. [Google Scholar] [CrossRef]
- Dong, C.; Bas, S.; Catbas, F.N. Applications of Computer Vision-Based Structural Monitoring on Long-Span Bridges in Turkey. Sensors 2023, 23, 8161. [Google Scholar]
- Peng, Z.; Li, J.; Hao, H. Computer vision-based displacement identification and its application to bridge condition assessment under operational conditions. Smart Constr 2024, 1, 0003. [Google Scholar] [CrossRef]
- Soyoz, S.; Feng, M.Q. Long-Term Monitoring and Identification of Bridge Structural Parameters. Comput.-Aided Civil Infrastruct. Eng. 2009, 24, 82–92. [Google Scholar] [CrossRef]
- Zhan, Y.; Huang, Y.; Fan, Z.; Li, B.; An, J.; Shao, J.; Tian, Y. Computer Vision-Based Pier Settlement Displacement Measurement of a Multispan Continuous Concrete Highway Bridge under Complex Construction Environments. Struct. Control. Health Monit. 2024, 2024, 1866665. [Google Scholar] [CrossRef]
- Kim, S.; Jeon, B.; Kim, N.; Park, J. Vision-based monitoring system for evaluating cable tensile forces on a cable-stayed bridge. Struct. Health Monit. 2013, 12, 440–456. [Google Scholar] [CrossRef]
- Jo, B.; Lee, Y.; Jo, J.H.; Khan, R.M.A. Computer Vision-Based Bridge Displacement Measurements Using Rotation-Invariant Image Processing Technique. Sustainability 2018, 10, 1785. [Google Scholar] [CrossRef]
- Yu, Y.; Huang, K.; Chen, W.; Tan, T. A Novel Algorithm for View and Illumination Invariant Image Matching. IEEE Trans. Image Process. 2012, 21, 229–240. [Google Scholar]
- Aliansyah, Z.; Shimasaki, K.; Senoo, T.; Ishii, I.; Umemoto, S. Single-Camera-Based Bridge Structural Displacement Measurement with Traffic Counting. Sensors 2021, 21, 4517. [Google Scholar] [CrossRef]
- Yoon, H.; Shin, J.; Spencer, B.F., Jr. Structural Displacement Measurement Using an Unmanned Aerial System. Comput.-Aided Civil Infrastruct. Eng. 2018, 33, 183–192. [Google Scholar] [CrossRef]
- Antoš, J.; Nežerka, V.; Somr, M. Real-Time Optical Measurement of Displacements Using Subpixel Image Registration. Exp. Tech. 2019, 43, 315–323. [Google Scholar] [CrossRef]
- Zhao, W.; Shi, X.; Ni, F.; Tian, Y. Semi-dense sub-pixel displacement measurement for structural health monitoring: A framework of deep learning-based detector-free feature matching. Measurement 2025, 254, 117899. [Google Scholar] [CrossRef]
- Dong, C.; Loy, C.C.; He, K.; Tang, X. Image super-resolution using deep convolutional networks. IEEE Trans. Pattern Anal. Mach. Intell. 2015, 38, 295–307. [Google Scholar] [CrossRef]
- Abdel-Aziz, Y.I.; Karara, H.M.; Hauck, M. Direct linear transformation from comparator coordinates into object space coordinates in close-range photogrammetry. Photogramm. Eng. Remote Sens. 2015, 81, 103–107. [Google Scholar] [CrossRef]
- Zhang, Z. Flexible camera calibration by viewing a plane from unknown orientations. In Proceedings of the Seventh IEEE International Conference on Computer Vision, Kerkyra, Greece, 20–27 September 1999; IEEE: Piscataway, NJ, USA, 1999. [Google Scholar]
- Viswanath, D.S.; Ghosh, T.K.; Prasad, D.H.; Dutt, N.V.; Rani, K.Y. Viscosity of Liquids: Theory, Estimation, Experiment, and Data; Springer Science & Business Media: Berlin/Heidelberg, Germany, 2007. [Google Scholar]
Disclaimer/Publisher’s Note: The statements, opinions and data contained in all publications are solely those of the individual author(s) and contributor(s) and not of MDPI and/or the editor(s). MDPI and/or the editor(s) disclaim responsibility for any injury to people or property resulting from any ideas, methods, instructions or products referred to in the content. |
© 2025 by the authors. Licensee MDPI, Basel, Switzerland. This article is an open access article distributed under the terms and conditions of the Creative Commons Attribution (CC BY) license (https://creativecommons.org/licenses/by/4.0/).