Article

Study on Damage and Fracture Mechanism and Ontological Relationship of Rock Body in Deep Open Pit in Cold Area

1
State Key Laboratory of intelligent Construction and Healthy Operation and Maintenance of Deep Underground Engineering, China University of Mining and Technology, Xuzhou 221116, China
2
School of Mechanics and Civil Engineering, China University of Mining and Technology, Xuzhou 221116, China
3
School of Mines, China University of Mining and Technology, Xuzhou 221116, China
4
State Key Laboratory for Fine Exploration and Intelligent Development of Coal Resources, China University of Mining and Technology, Xuzhou 221116, China
*
Author to whom correspondence should be addressed.
Appl. Sci. 2025, 15(18), 10021; https://doi.org/10.3390/app151810021
Submission received: 15 August 2025 / Revised: 9 September 2025 / Accepted: 11 September 2025 / Published: 13 September 2025

Abstract

The stability of open-pit mines under low-temperature conditions is critical for safe and efficient coal extraction. However, the mechanisms of rock damage and fracture under combined temperature and stress effects remain unclear, particularly regarding the evolution of mechanical properties under repeated freeze–thaw cycles and varying peripheral pressures. This study investigates the damage and rupture behavior of coal-bearing sandstone in cold-region open-pit mines through experimental testing and theoretical modeling. The research was conducted in three stages: (1) freeze–thaw and peripheral pressure experiments to evaluate mechanical property evolution; (2) acoustic emission monitoring to analyze internal fracture initiation, propagation, and coalescence under temperature–stress coupling; (3) development of a local deterioration model to quantify post-damage strength decay considering low-temperature erosion and freeze–thaw effects. Results show that increasing freeze–thaw cycles leads to a transition from brittle to ductile behavior, while higher peripheral pressures significantly enhance ductility. Mechanical parameters are highly sensitive to peripheral pressure but largely independent of freeze–thaw cycle count. Acoustic emission signals respond strongly to temperature, and temperature–stress coupling governs the three-stage evolution of fracture germination, extension, and penetration. The local deterioration model effectively captures post-peak residual strength and damage evolution. These findings indicate that in regions with higher microcrack density, fault propagation is driven by rapid coalescence under stress concentration, whereas in lower-density regions, it is dominated by gradual fracture growth and temperature-induced expansion. The results provide theoretical guidance for stability assessment and support design in open-pit coal mines in cold environments.

1. Introduction

Stability of open-pit coal mines has always been one of the important research topics in mine engineering [1,2]. Their mechanical properties tend to change significantly under freeze–thaw action, which is manifested by damage accumulation, strength reduction and the evolution of rupture modes [3,4,5]. Freeze–thaw cycles cause water within rock masses to freeze and thaw repeatedly, resulting in volume changes that generate and expand microfractures, thereby weakening the rock’s structural integrity. This degradation of mechanical properties significantly increases the risk of slumps and landslides on slopes, posing a great challenge to the safe production of open-pit mines [6,7,8,9]. It has become a key problem to reveal the damage fracture characteristics and mechanism of coal sandstone under temperature–stress coupling and to establish its intrinsic equations to describe and predict the mechanical behavior of the rock body under freeze–thaw conditions [10,11].
Temperature and water–rock action are the environmental loads that mine rock bodies in cold regions are directly exposed to, and the physical and mechanical properties of rock materials can change significantly under the coupled action of temperature and stress [12]. Many scholars have focused on the effects of temperature fluctuation and water intrusion on rock materials under freeze–thaw action to study the pore structure, microfracture, and the evolution of mechanical properties of rocks [13,14,15]. For example, Chen [16] and Deprez [17] experimentally demonstrated that freeze–thaw cycles lead to the enlargement of the pore structure and the increase in microcracks in rocks, which significantly reduces their mechanical strength. Shi and Shu [18,19] examined the fatigue deterioration of rocks subjected to freeze–thaw cycles, uncovering the mechanisms of cumulative microstructural damage due to temperature–stress interactions. Researchers have increasingly focused on the impact of cycle numbers on rocks, alongside the development of fundamental physico-mechanical characterization parameters. Abdolghanizadeh [20] experimentally demonstrated that freeze–thaw cycles notably decreased the compressive strength and elastic modulus of coal sandstones. Li [21] used simulations and experiments to analyze the rock fracturing mechanism. Numerous experiments and theoretical analyses have been conducted on the freeze–thaw deterioration of rocks in engineering contexts. However, current findings inadequately address the intrinsic characterization of rock damage evolution under environmental influences, which is crucial for understanding the impact of temperature and water on this process [22,23,24].
Recently, researchers in rock mechanics have focused on the mechanical behavior and damage mechanisms of coal sandstone subjected to freeze–thaw cycles, proposing various constitutive models to capture its complex stress–strain relationship. Most scholars develop rock damage constitutive models using continuous medium damage mechanics, employing damage variables to describe the evolution of microfractures and pores within the rock [25,26]. These models often rely on Lemaitre’s strain equivalence assumption, which posits that rock loses all load-bearing capacity after damage. However, this assumption fails to accurately capture the residual strength characteristics observed in the post-peak stage of experiments. To address this issue, researchers have enhanced existing models by incorporating residual strength and developing a local damage model to more accurately depict the post-peak behavior of coal sandstone during loading [27]. Nonetheless, these models remain limited in practical applications and fail to comprehensively capture the interaction between temperature and stress damage processes. Several researchers have developed a multi-scale damage evolution model by integrating microscopic observations of internal structural changes in rocks post-freeze–thaw cycles with damage mechanics theory. While existing models offer detailed insights into the internal damage processes of rocks, their complexity and parameter acquisition challenges limit their practical application and generalization [28,29]. To address this, the paper introduces an enhanced damage constitutive model that integrates previous research with the microstructural evolution of coal sandstone during freeze–thaw cycles. This model aims to accurately simulate the damage and rupture processes of coal sandstone under temperature cycling by incorporating a microscopic parameter for internal damage accumulation and post-peak residual strength characterization.
In summary, existing research has relatively well elucidated the macro- and fine-scale mechanisms of specimens under normal water–rock interactions. However, fewer studies have addressed the mechanical characterization of rock damage under combined environmental loads and triaxial stresses, and theoretical models have rarely incorporated the hydration effects of rocks in flooded environments—factors that are critical for revealing the mechanisms underlying the stability weakening of flooded open pits at ambient temperatures. The primary purpose of this study is therefore to clarify the damage and weakening mechanisms of coal-bearing sandstone under coupled temperature, stress, and freeze–thaw conditions, and to establish a theoretical basis for stability evaluation in cold-region surface coal mines. To achieve this, experiments were conducted using the MTS815 electro-hydraulic servo rock testing system and the DS5-8B acoustic emission acquisition system to examine the evolution of mechanical parameters in coal sandstone under combined temperature and stress conditions. The results reveal the progression of rock damage under triaxial stress and quantitatively evaluate how increasing circumferential pressure enhances the rock’s resistance to deformation. Furthermore, a local damage model was developed to describe the residual strength of rock post-peak, explicitly incorporating the effects of axial loading stresses, peripheral pressure, and freeze–thaw cycles on fissure structure evolution. In this way, the study provides not only new insights into the fundamental mechanisms of rock degradation but also a theoretical and technical foundation for ensuring the safe and efficient operation of large surface coal mines in cold regions.

2. Materials and Methods

2.1. Specimen Preparation

The coal sandstone rock samples for the test were sourced from the An Taibao open-pit coal mine in Shanxi, China (as shown in Figure 1). The component analysis (XRD) reveals the composition as 78.0% quartz, 6.8% feldspar, 9.4% muscovite, and 5.8% clay minerals. The clay mineral composition, characteristic of medium-coarse sandstones, consists of 76% illite, 21.3% kaolinite, and 2.7% montmorillonite. The prepared cylindrical specimen, measuring 100 mm in height and 50 mm in diameter, complies with the ‘International Society for Rock Mechanics Test Procedure (ISRM2007)’ and the ‘Standard for Testing Methods for Engineering Rocks GB/T50266-2013’ [30]. The specimens underwent processing and testing. After excluding rock specimens with significant discrepancies, the processed samples were evaluated for mass, height, diameter, wave velocity, and porosity. The characteristic parameters of these specimens are presented in Table 1.

2.2. Test Equipment and Process

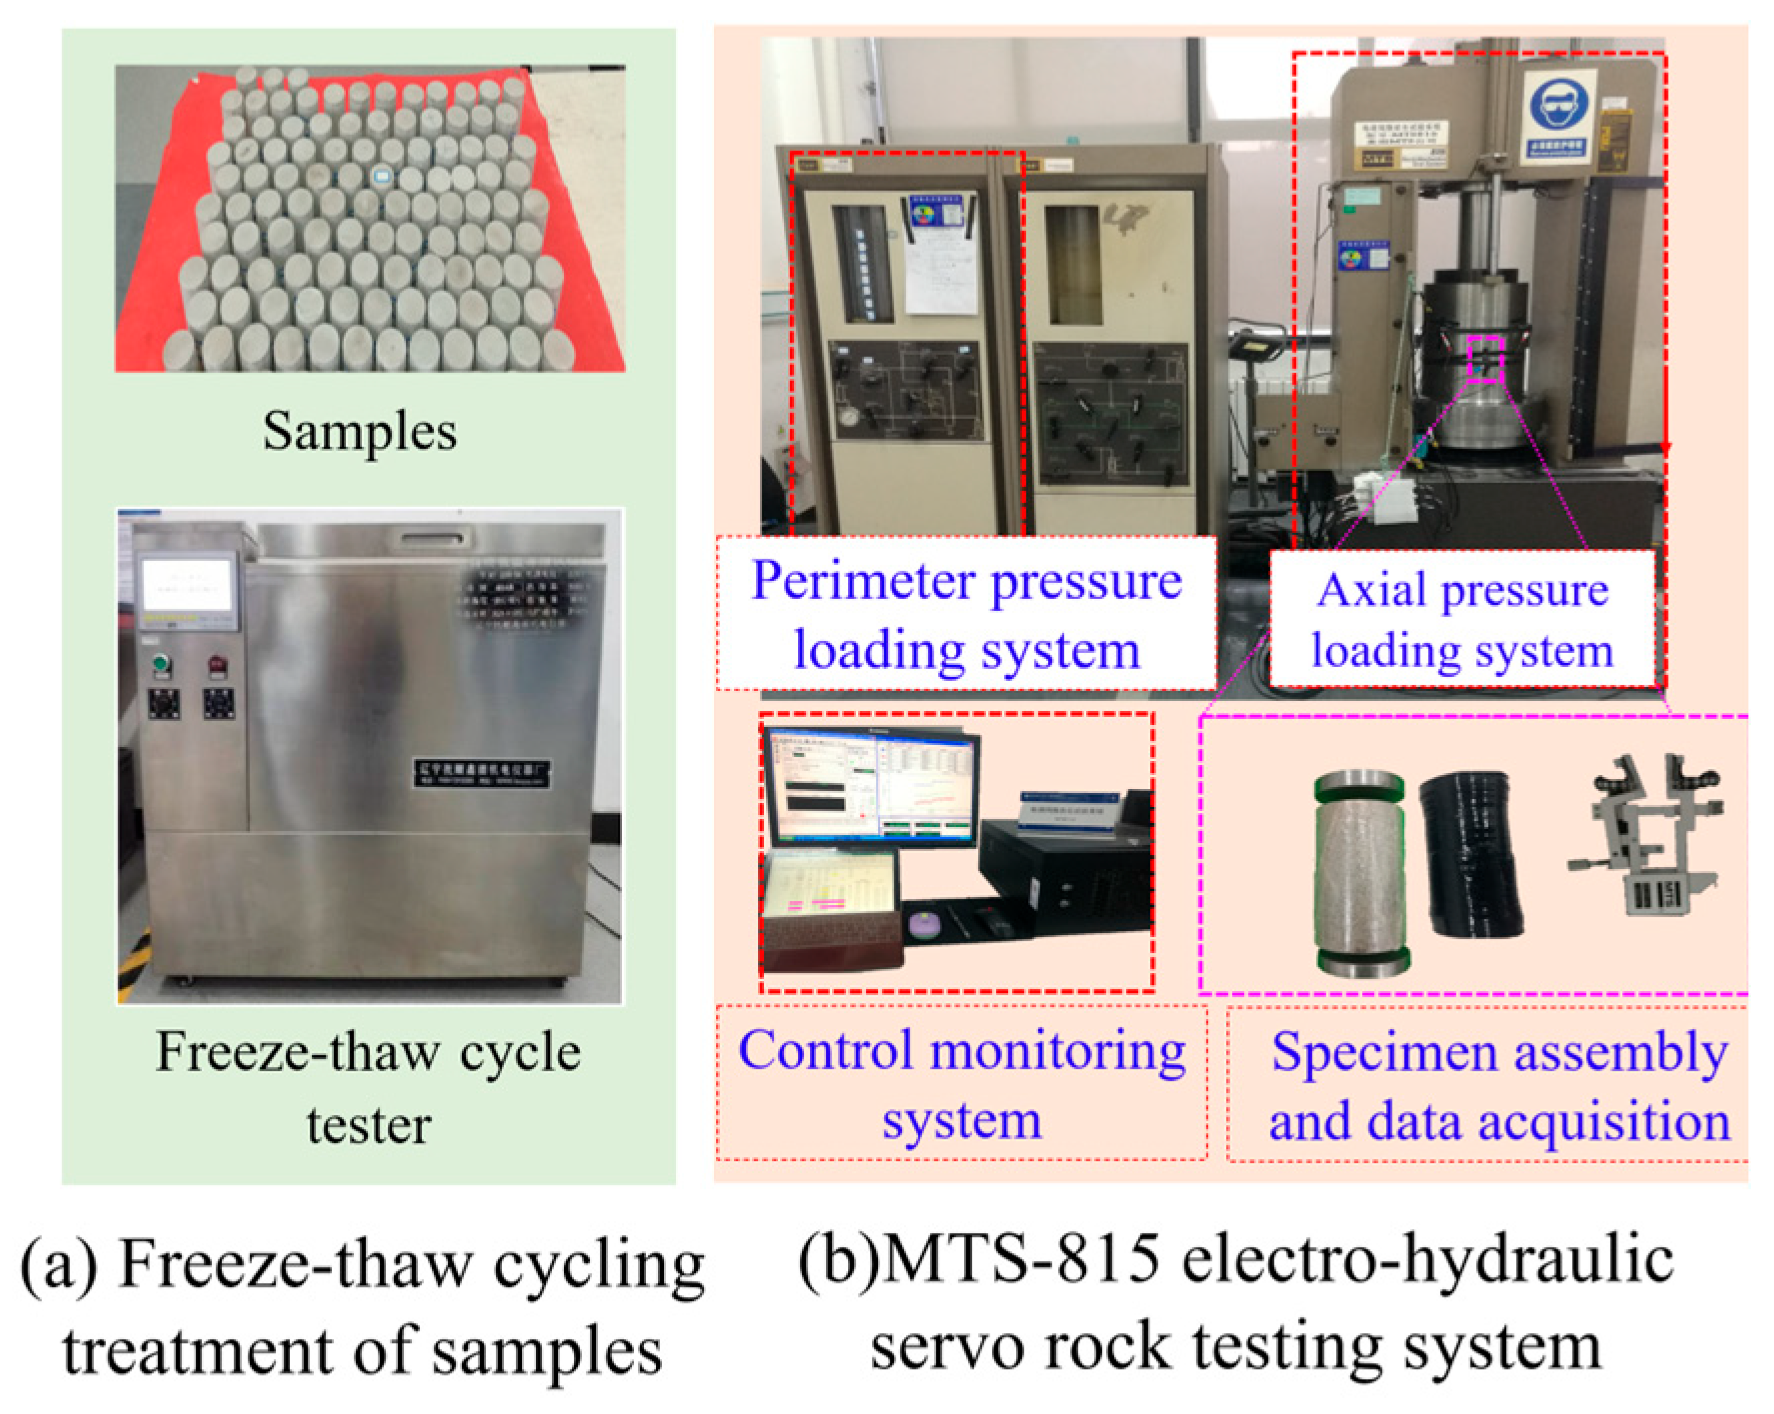
The test utilized the XY-QDR-50 full-automatic low-temperature freeze–thaw cycle testing machine, the MTS815 electro-hydraulic servo rock testing system, and the DS5-8B acoustic emission acquisition system, respectively. The specific test process is as follows:
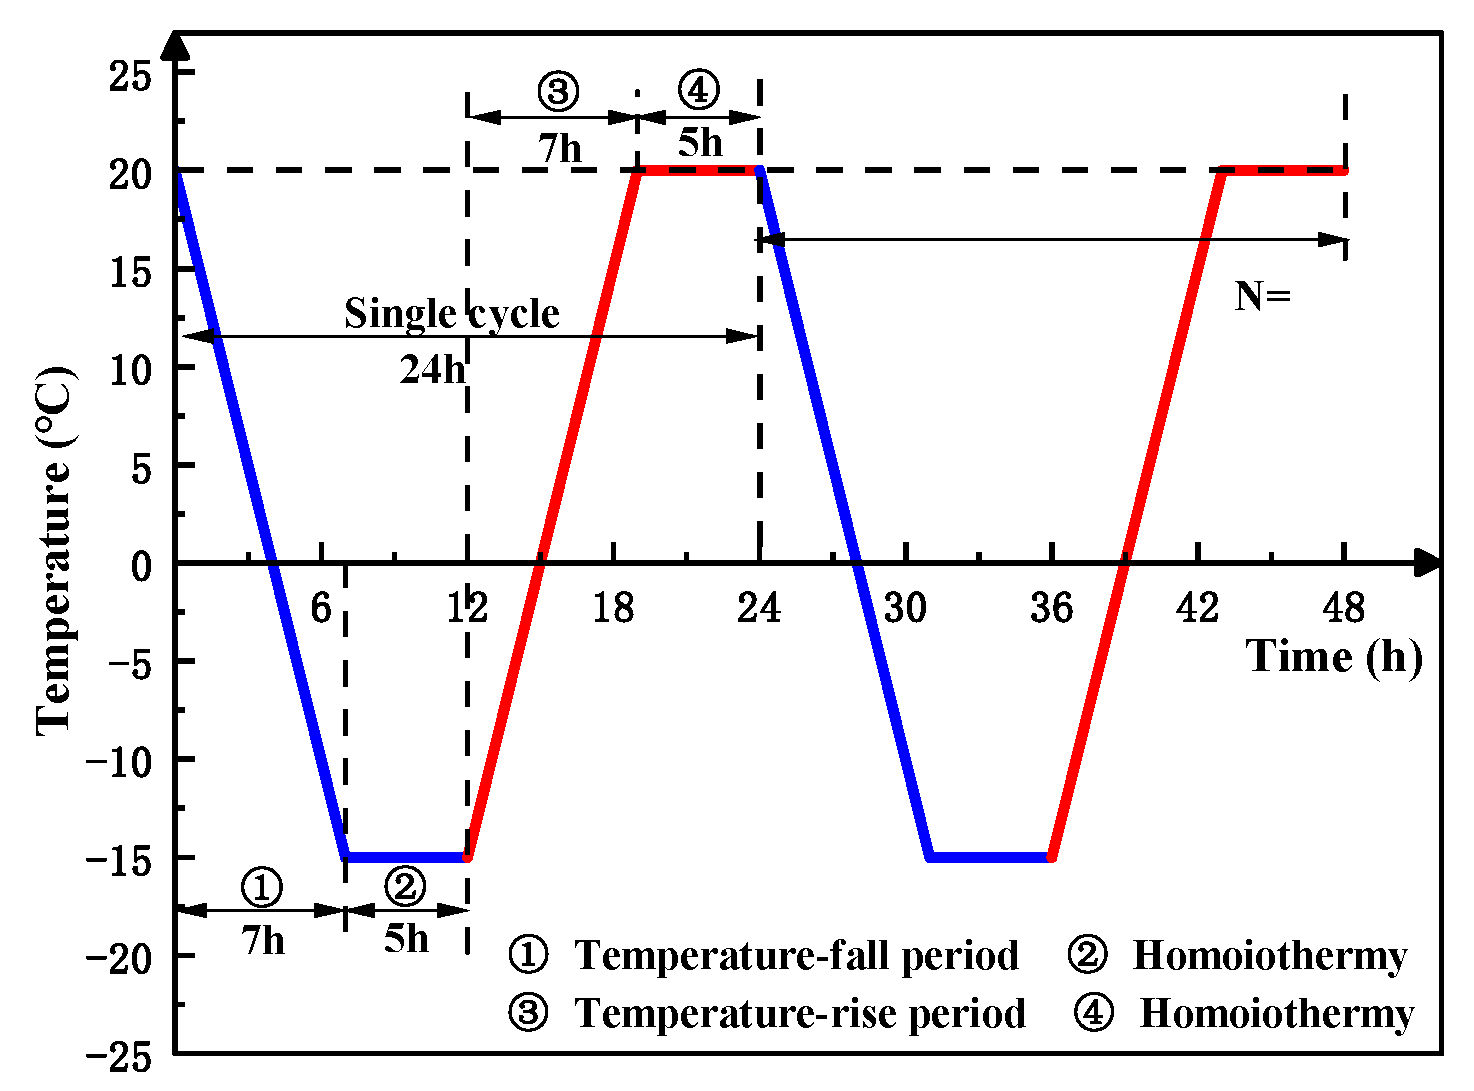
(1) The freeze–thaw cycle test was conducted on saturated sandstone specimens using a freeze–thaw cycle tester. The minimum freezing temperature was set at −15 °C, while the thawing temperature was maintained at room temperature (20 °C). The temperature loading and unloading paths are illustrated in Figure 2. The process of completing the indoor test was as follows: (1) cooling process: using the freezing mode, the cooling rate of 5 °C/h, room temperature (20 °C) down to −15 °C takes 7 h; (2) frozen to maintain: after the temperature reaches the set temperature, to maintain the frozen state for 5 h; (3) warming process: using the gas melt warming mode, the warming rate of 5 °C/h, −20 °C warming to room temperature (20 °C) takes 7 h; (4) room temperature to maintain: at room temperature (20 °C). For specimens with more than one cycle, the treatment is that the cycles are directly connected directly to each other. The test comprises 5 groups, each subjected to 0, 5, 10, 15, and 20 freeze–thaw cycles, respectively.
(2) Triaxial loading test: An annular extensometer was installed in the middle part of the specimen. The axial loading rate was maintained at 1 mm/min with an initial pre-pressure of 1 kN. In the peripheral pressure loading stage, a closed-loop servo control system is used to apply the peripheral pressure at a rate of 0.2 MPa/s in a graded manner until the preset value. Once the target pressure is achieved, the system stabilizes the pressure by maintaining fluctuations within ±0.05 MPa using a dynamic compensation mechanism, ensuring consistent peripheral pressure load during testing. Peripheral pressure under freezing and thawing significantly affects the mechanical and fracture behavior of coal sandstone. The experiment involved triaxial compression tests at peripheral pressures of 0 MPa, 0.5 MPa, 1.5 MPa, and 2.5 MPa across varying freeze–thaw cycles. A total of 20 test sets were conducted, with each set repeated five times, requiring 100 specimens in total. To improve the reliability of the results, the two most dispersed data points in each group were discarded, and the remaining three were used for analysis. This treatment helps to minimize the influence of occasional outliers caused by inherent rock heterogeneity, sample preparation defects, or minor experimental uncertainties, thereby ensuring that the analyzed data more accurately reflect the representative mechanical behavior of coal sandstone. The test setup and equipment are shown in Figure 3.
(3) During the triaxial loading test, the DS5-8B acoustic emission acquisition system is employed to collect and analyze acoustic emission signals and characteristics throughout the rupture process of the coal sandstone specimen in real-time, as shown in Figure 3. In this experiment, three acoustic emission probes were staggered on the specimen surface, positioned 20 mm from both the upper and lower ends. The acoustic emission sampling frequency was set at 3 MHz, with a preamplifier gain of 40 dB and a threshold of 0.1 V. The impact identification and locking times were 100 s and 500 s, respectively.

3. Test Results and Discussion

3.1. Characteristics of Variation in Mechanical Property Parameters of Sandstone Specimens

3.1.1. Stress–Strain Curve Characteristics

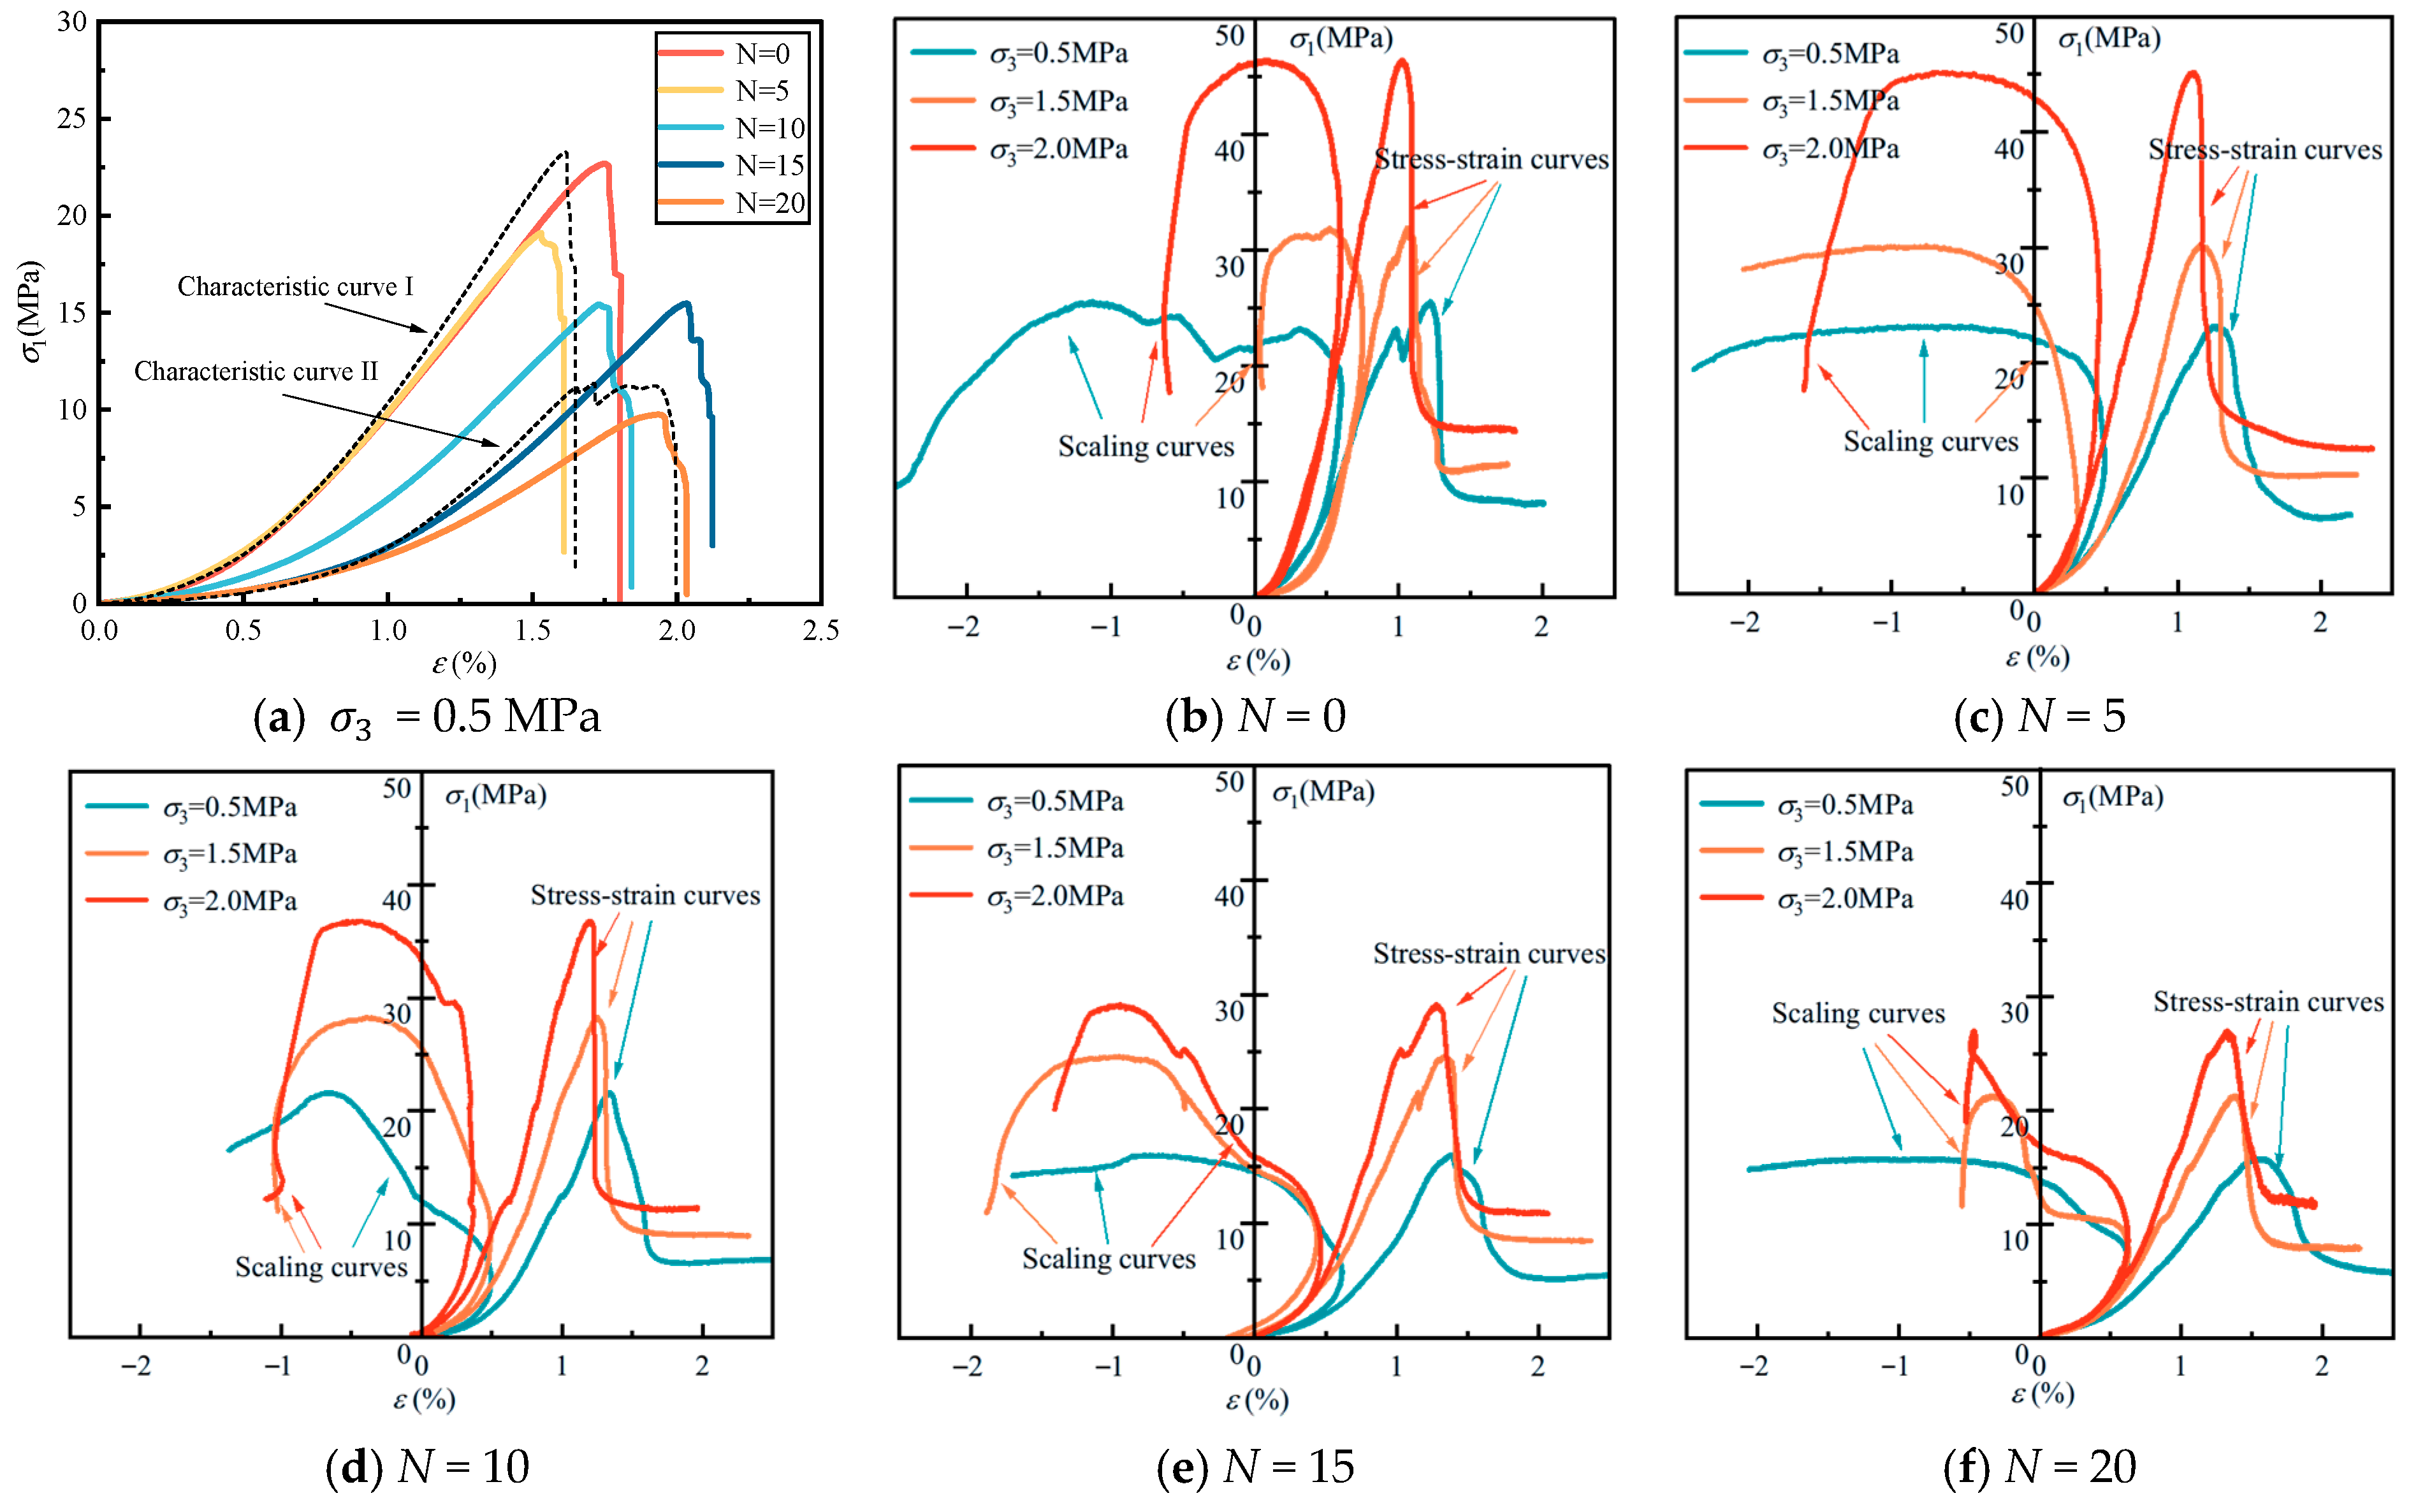
Figure 4 illustrates the stress–strain curves for sandstone specimens subjected to varying freeze–thaw cycles and enclosing pressures.
Under a constant perimeter pressure and after 5 to 10 freeze–thaw cycles, the stress–strain curves exhibit four distinct stages: compression density, near-linear elasticity, crack nonlinear extension, and post-peak behavior. The peak stress shows an instantaneous drop, indicating typical brittle damage characteristics, classifying the curve as type I. At 15 and 20 freeze–thaw cycles, the stress–strain curve stages resemble those at lower cycle counts, but the peak exhibits a fluctuating decline, indicating ductile damage characteristics typical of a class II curve. For 15 and 20 freezing-thawing cycles, the stress–strain curve mirrors that of fewer cycles but exhibits a fluctuating decline post-peak, indicating ductile damage characteristics typical of class II curves. The divergence between class I and class II stress–strain curves primarily occurs post-peak, indicating that the mechanical behavior of coal sandstone is somewhat influenced by the number of freeze–thaw cycles.
The stress–strain curves of sandstone samples under varying pressures, excluding the uniaxial loading test result (σ3 = 0 MPa), are consistent before and after the freeze–thaw cycle. These curves can be categorized into five phases: compression-density, linear-elasticity, pre-peak plastic yielding, post-peak softening and dropping, and residual-strength. This suggests that the alteration in the stress–strain curves is largely unaffected by the enclosing pressure level. The peak strength and modulus of elasticity of coal sandstone vary notably with increasing peripressure levels, irrespective of the number of freeze–thaw cycles. The detailed influence is outlined below.
As the enclosing pressure decreases, regardless of the number of freeze–thaw cycles, coal sandstone samples show an increased proportion and concavity in the compression-density stage. The slope and proportion of the linear elasticity stage decrease, while the pre-peak plastic yielding stage diminishes. Post-peak stress declines rapidly, enhancing brittleness.

3.1.2. Elastic Modulus

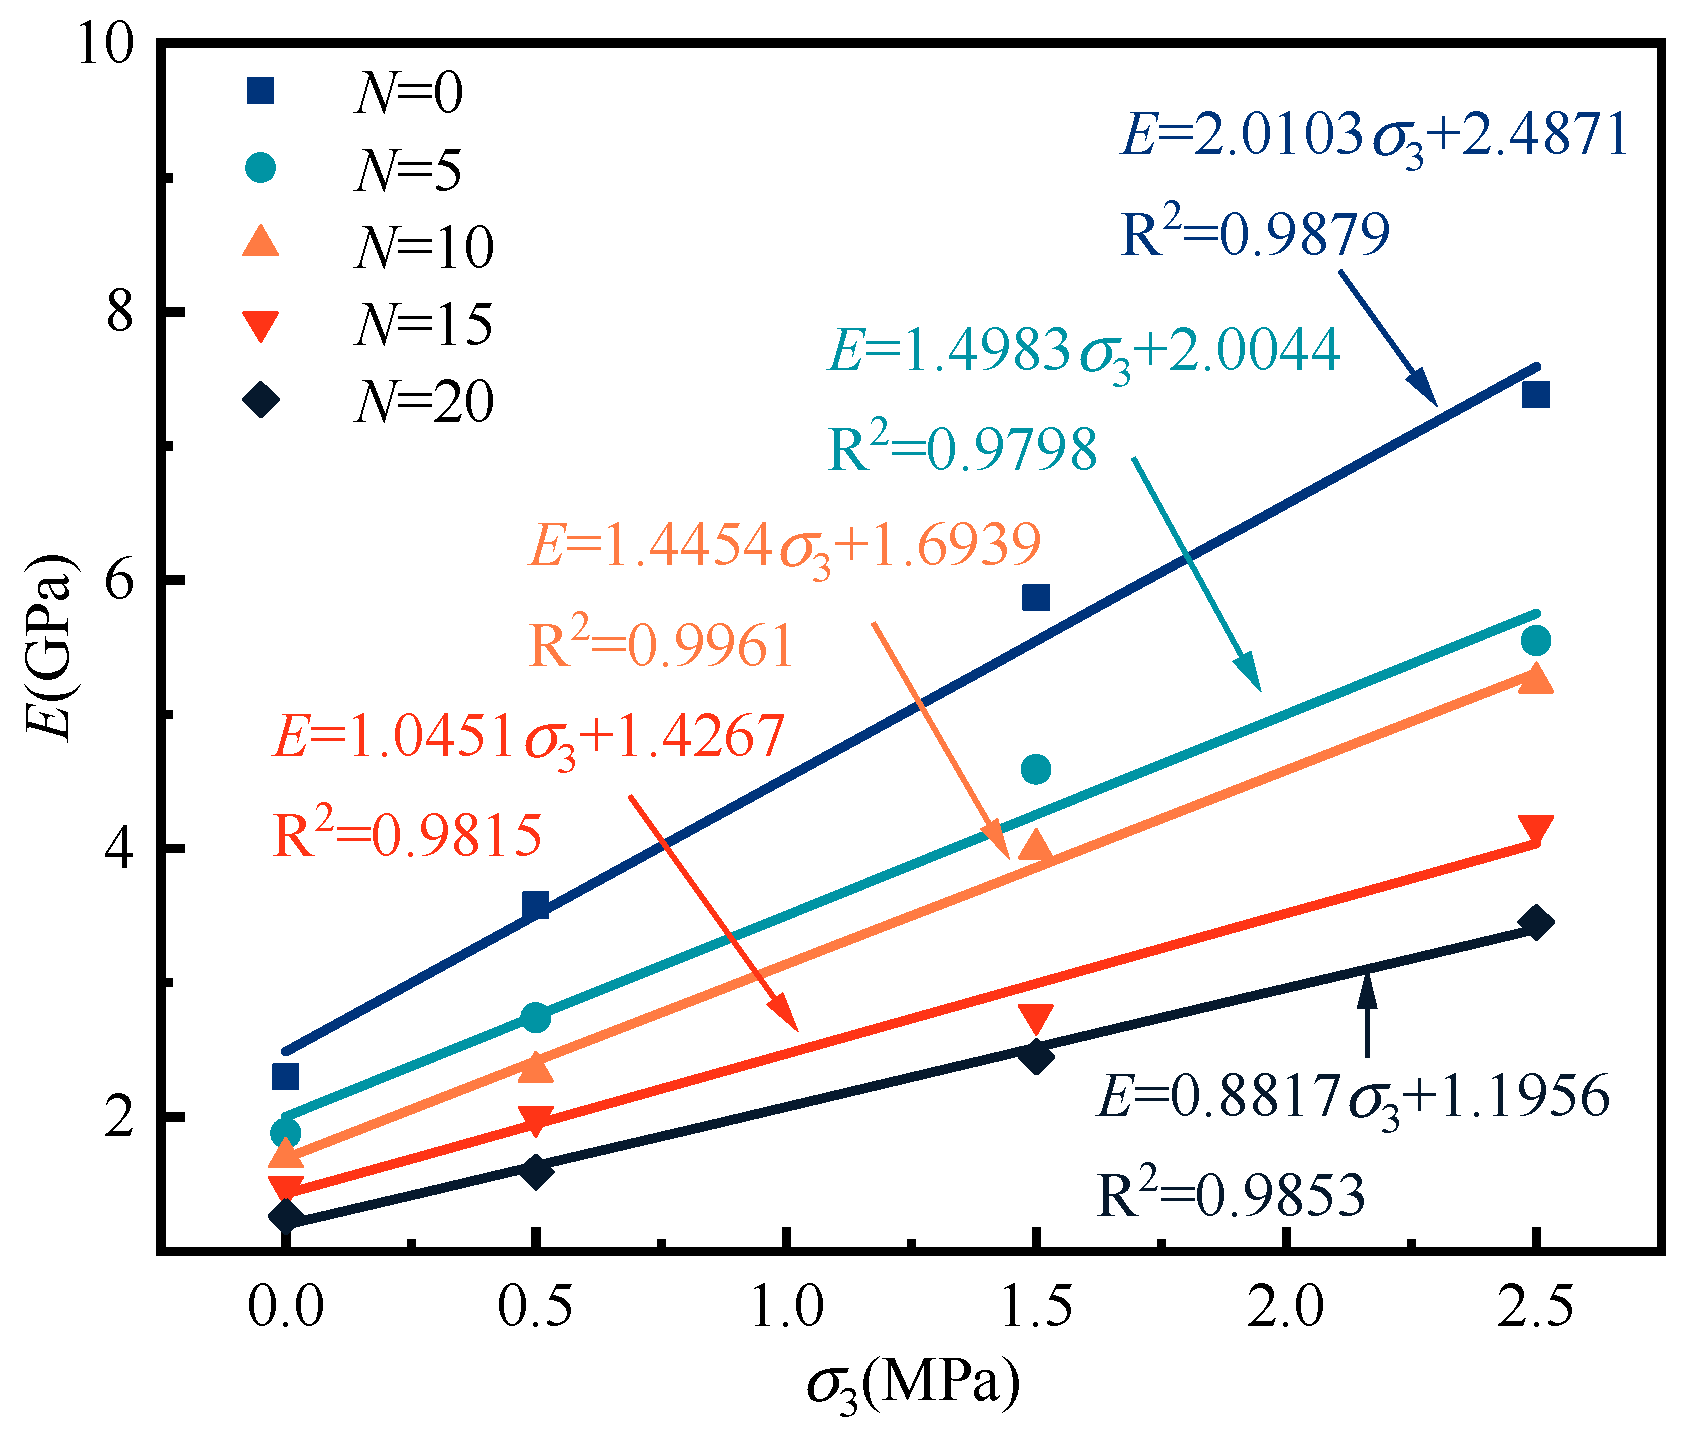
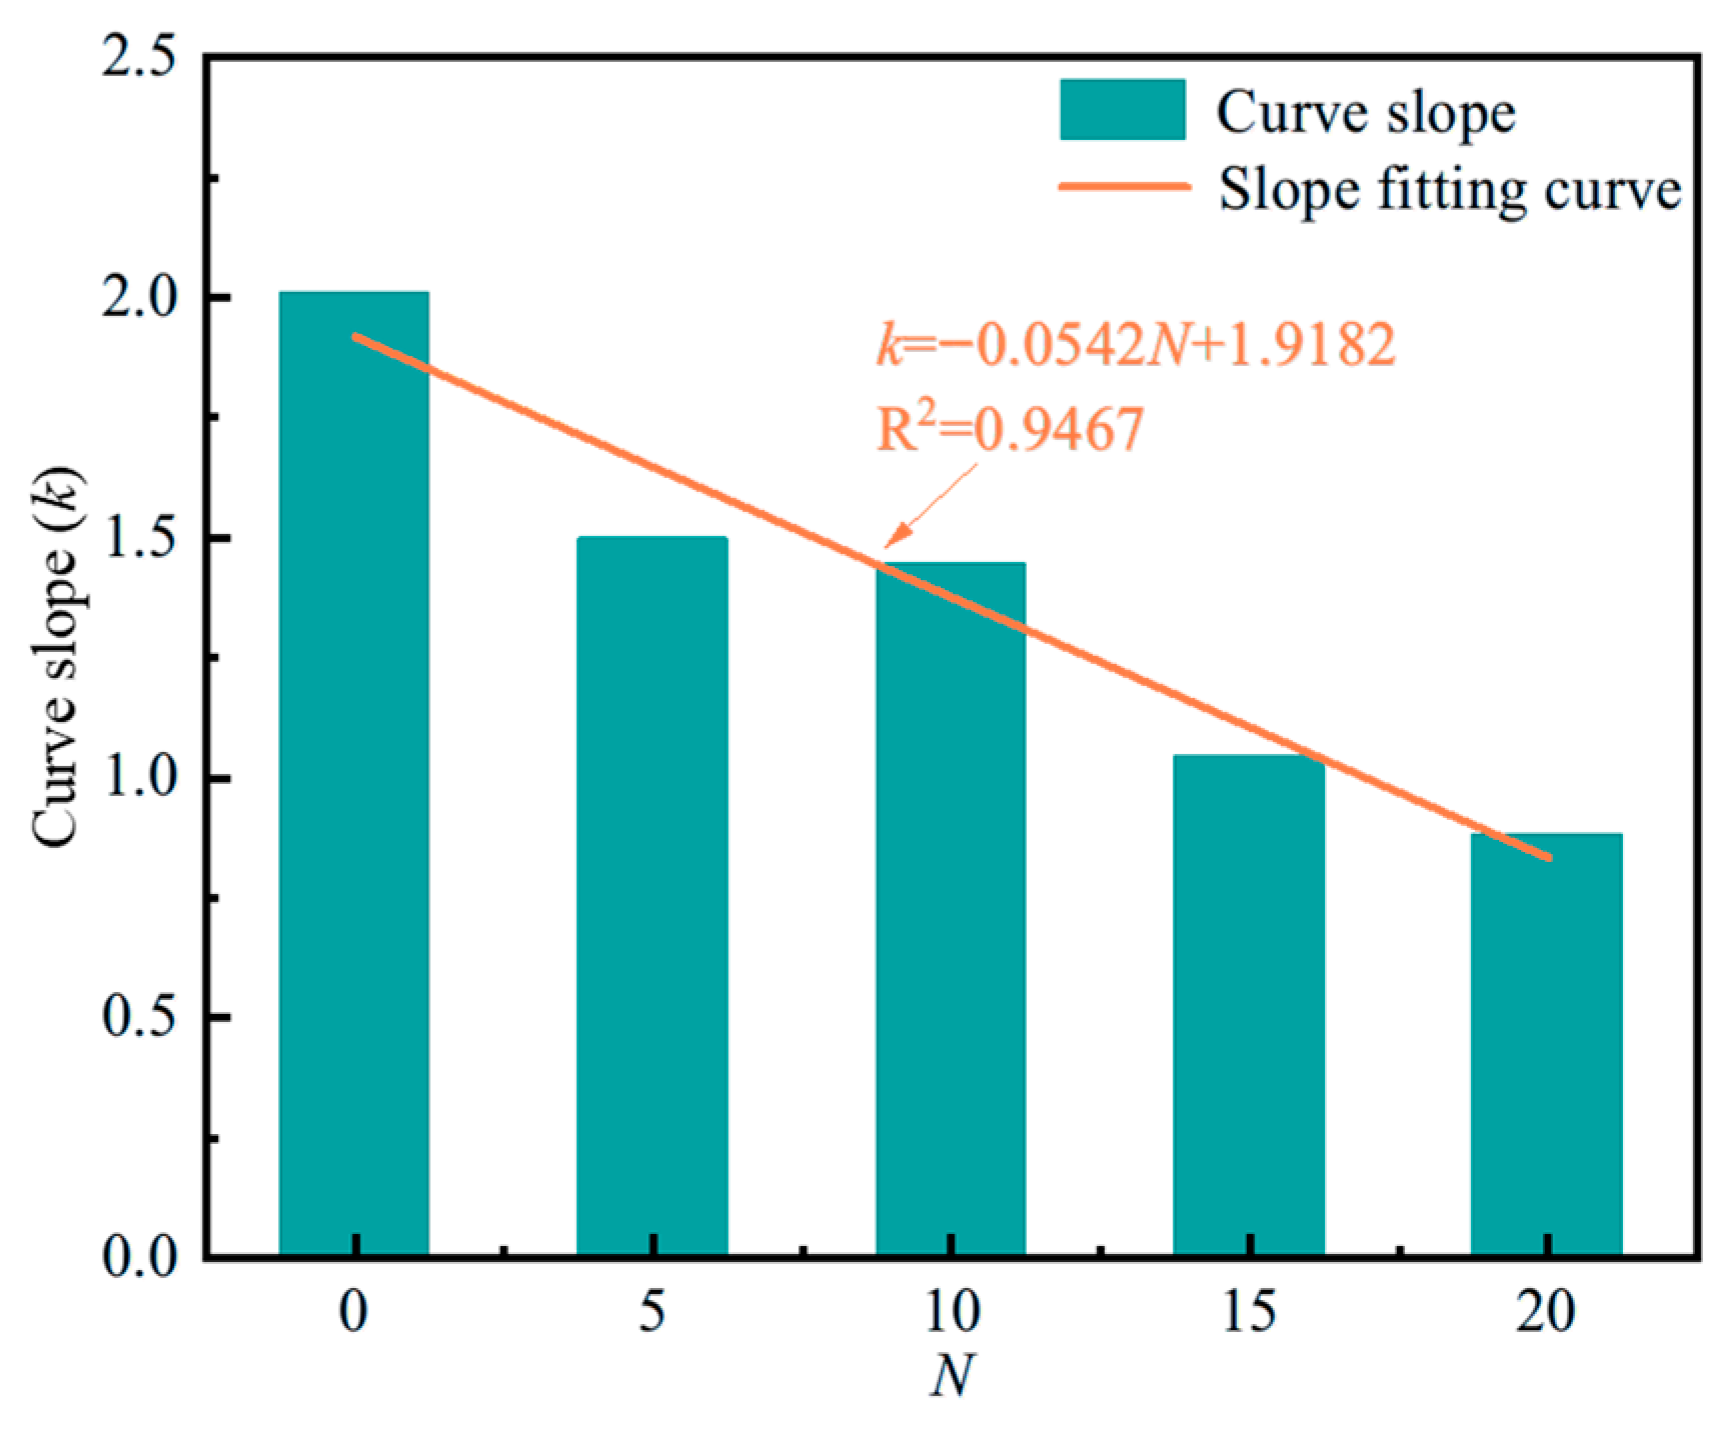
Figure 5 illustrates the relationship curves between the average elastic modulus of coal sandstone and enclosing pressure levels across varying freeze–thaw cycles, with the fitted slope depicted in Figure 6 concerning the frequency of freeze–thaw cycles.
For each number of freeze–thaw cycles, the average elastic modulus of coal sandstone increases almost linearly with higher peripheral pressure levels. For N = 15 freeze–thaw cycles, the elastic modulus of the specimen increases with perimeter pressure: from 1.48 GPa to 2.00 GPa (35.14% increase) as pressure rises from 0 MPa to 0.5 MPa; from 2.00 GPa to 2.76 GPa (38.00% increase) as pressure rises from 0.5 MPa to 1.5 MPa; and from 2.76 GPa to 4.17 GPa (51.09% increase) as pressure rises from 1.5 MPa to 2.5 MPa. The above data show that the circumferential pressure has a significant enhancement effect on the deformation resistance of coal sandstone specimens.
The influence of perimeter pressure on the elastic modulus of sandstone specimens was significantly affected by the number of freeze–thaw cycles. The impact of peripheral pressure on the elastic modulus of specimens is more pronounced at lower freezing and thawing cycles (0, 5, and 10) compared to higher cycles (15 and 20). This is because repeated cycles significantly damage the internal structure of sandstone specimens, weakening the load-bearing capacity of the skeleton particles. The internal structure of the sandstone specimen suffers significant damage after numerous freeze–thaw cycles, weakening the load-bearing capacity of the skeleton particles. Consequently, its deformation resistance becomes less sensitive to peripheral pressure, leading to a reduced growth slope.

3.1.3. Peak Intensity

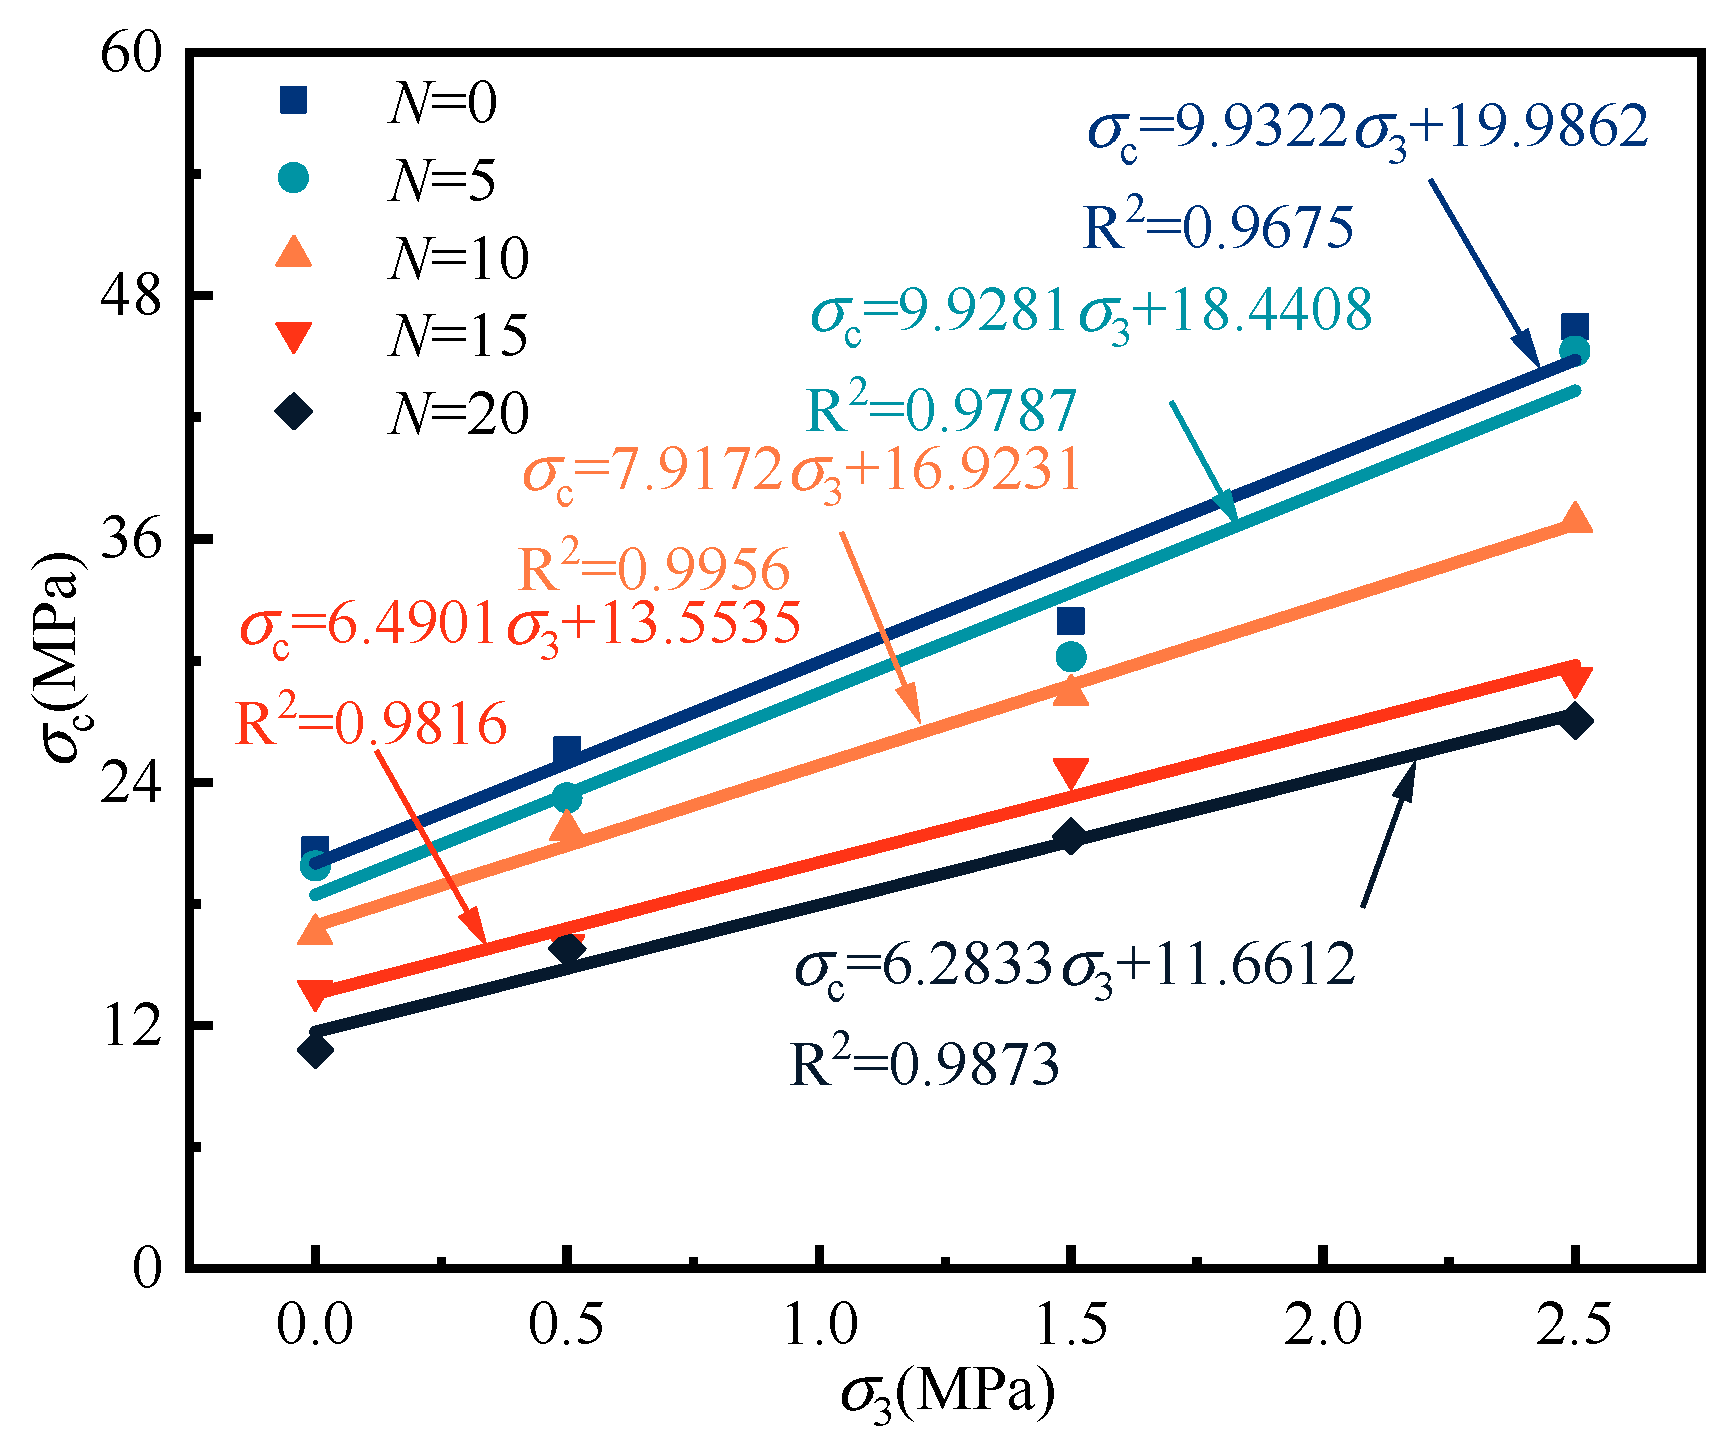
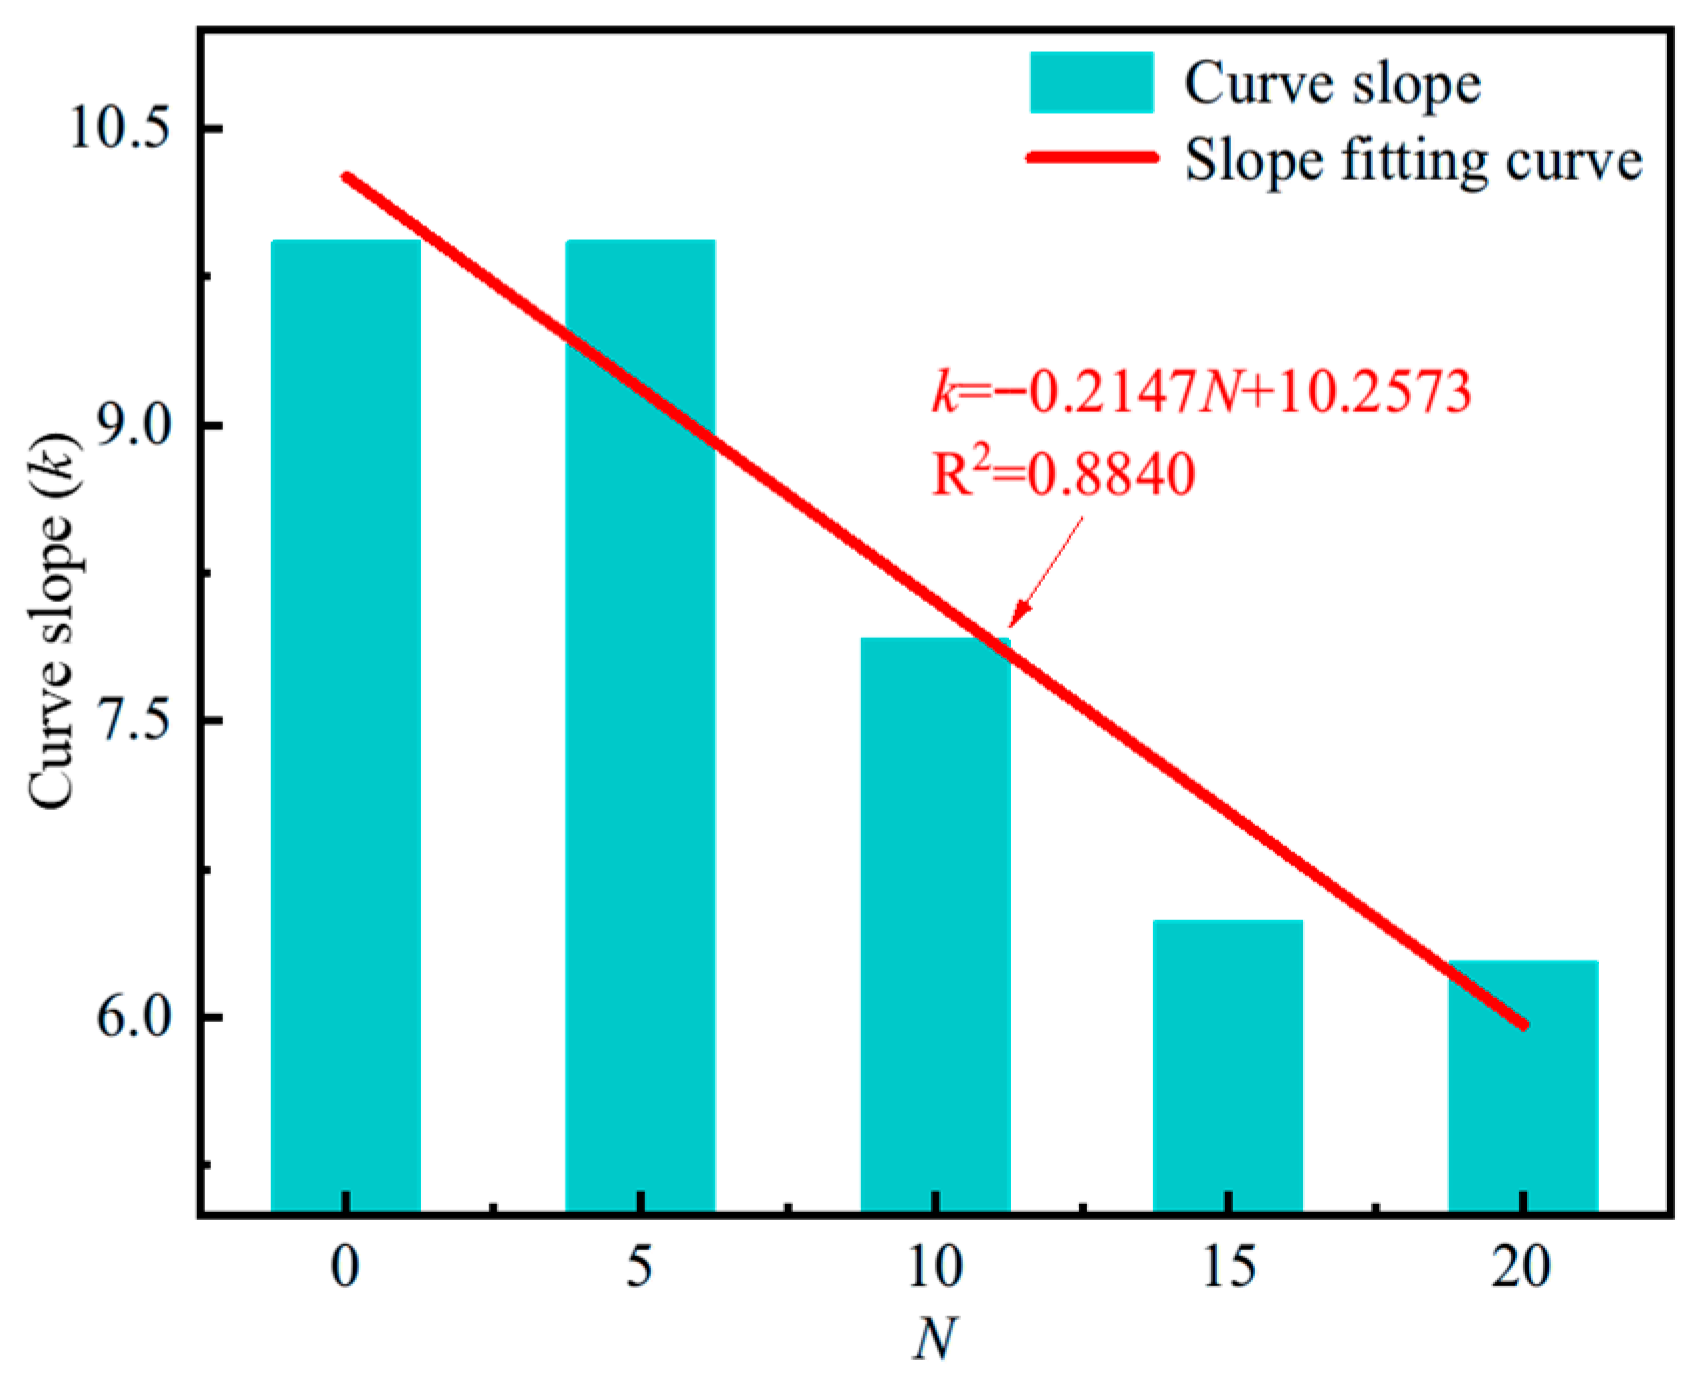
Figure 7 illustrates how the average peak strength of coal sandstone varies with perimeter pressure across different freeze–thaw cycles. Figure 8 presents the slope of this strength curve, highlighting its changes relative to the number of freeze–thaw cycles.
Under each freeze–thaw cycle number, the average peak strength of the coal sandstone increases linearly with the increase in the peripheral pressure level. For N = 15 freeze–thaw cycles, increasing perimeter pressure from 0 MPa to 0.5 MPa raises the specimen’s average peak strength by 16.74%, from 13.68 MPa to 15.97 MPa. Further increasing the pressure from 0.5 MPa to 1.5 MPa results in a 54.23% rise, reaching 24.63 MPa. Finally, increasing the pressure from 1.5 MPa to 2.5 MPa enhances the strength by 18.31%, achieving 29.14 MPa. The data analysis indicates that while the peak strength trend of coal sandstone remains largely unaffected by the number of freeze–thaw cycles, the peak strength value is significantly influenced by peripheral pressure, similar to its effect on the specimen’s elastic modulus.
As the number of freeze–thaw cycles increases, the slope of the peak strength curve for coal sandstone gradually decreases with higher enclosing pressure levels. The slope of the fitted curve is 9.63 with zero freeze–thaw cycles and 10.27 with five cycles. As the cycles increase to 10, 15, and 20, the slope decreases to 7.92, 6.49, and 6.28, respectively. The analyses indicate that peripheral pressure significantly impacts peak strength, particularly at a low number of cycles, primarily due to the high frequency of freeze–thaw cycles. The analyses indicate that peripheral pressure significantly impacts the specimen’s peak strength at low cycle times. This is primarily because the specimen’s internal structure suffers severe damage at high freeze–thaw cycles, reducing the sensitivity of peripheral pressure’s strengthening effect on peak strength, which in turn causes a gradual decrease in the curve’s slope.

3.1.4. Peak Strain

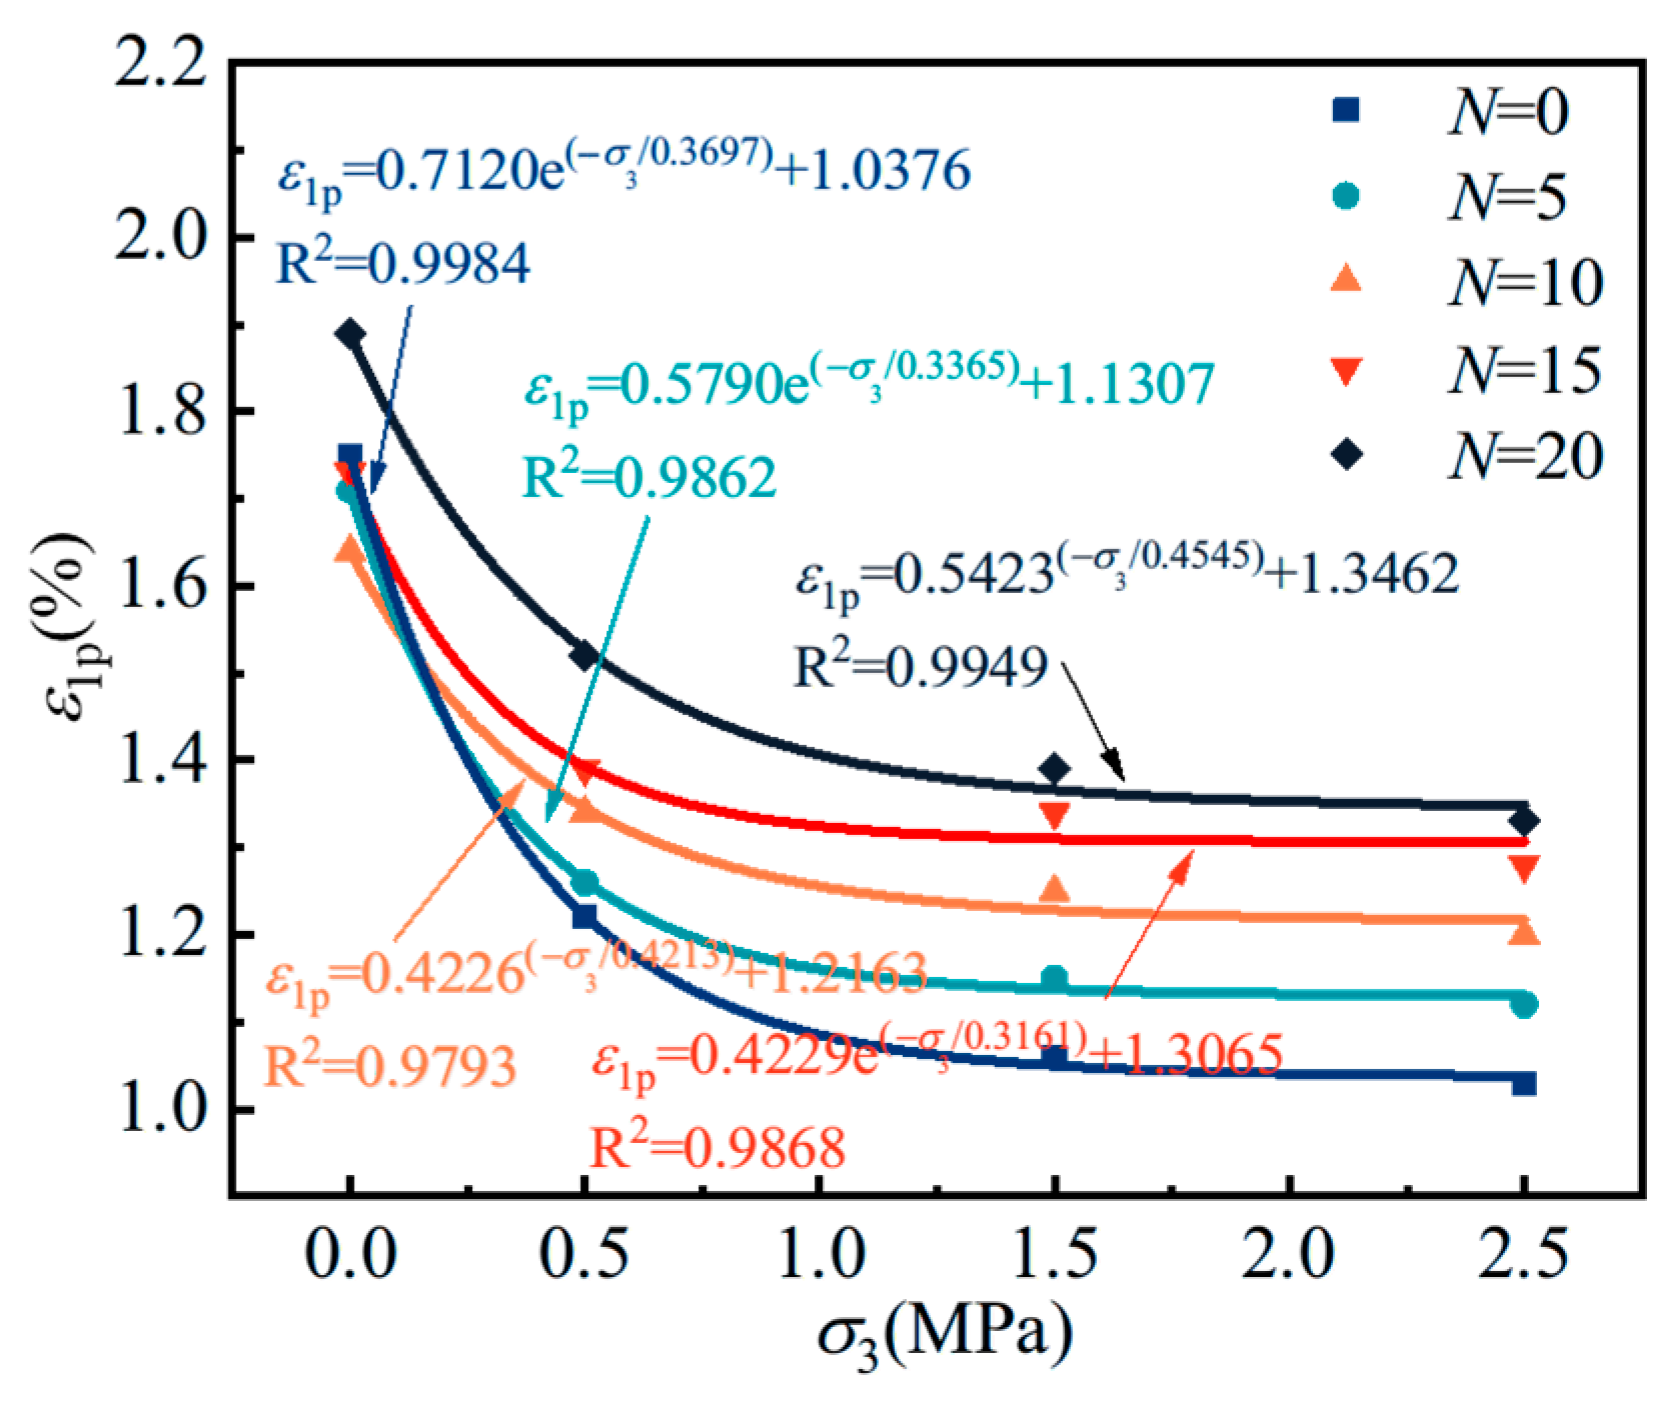
Figure 9 illustrates how the average peak strain of coal sandstone varies with perimeter pressure across different freeze–thaw cycle counts.
For each freeze–thaw cycle count, the average peak strain of coal sandstone decreases as peripheral pressure increases, with the rate of decrease diminishing progressively. For N = 5 freeze–thaw cycles, increasing peripheral pressure from 0 to 0.5 MPa reduces the specimen’s average peak strain from 1.71% to 1.26% (26.32% decrease); from 0.5 to 1.5 MPa, it decreases from 1.26% to 1.15% (8.73% decrease); and from 1.5 to 2.5 MPa, it remains at 1.15% (8.73% decrease). When the pressure increased from 1.5 MPa to 2.5 MPa, the specimen’s average peak strain decreased slightly from 1.15% to 1.12%, a reduction of 2.61%. With 15 freeze–thaw cycles, increasing peripheral pressure from 0 to 0.5 MPa reduces the specimen’s peak strain from 1.73% to 1.39%, a 19.65% decrease. Further increasing the pressure from 0.5 to 1.5 MPa results in a reduction from 1.39% to 1.34%, a 3.59% decrease. A subsequent increase from 1.5 to 2 MPa decreases the strain from 1.15% to 1.12%, a 2.61% reduction. When the pressure increased from 1.5 MPa to 2.5 MPa, the average peak strain of the specimens decreased from 1.34% to 1.28%, representing a reduction of 4.48%.
The peak strain trend of coal sandstone specimens remains largely unaffected by the number of freeze–thaw cycles, yet the peak strain value is highly sensitive to peripheral pressure conditions. In the range of 0 MPa~1.5 MPa, a low pressure, the trend of peak strain decreasing with the increase in pressure is more obvious, while in the range of 1.5 MPa~2.5 MPa, a relatively high pressure, the trend tends to flatten out, and the degree of influence is weakened.

3.2. Acoustic Emission Characterization

3.2.1. Acoustic Emission Parameter Characterization Methods

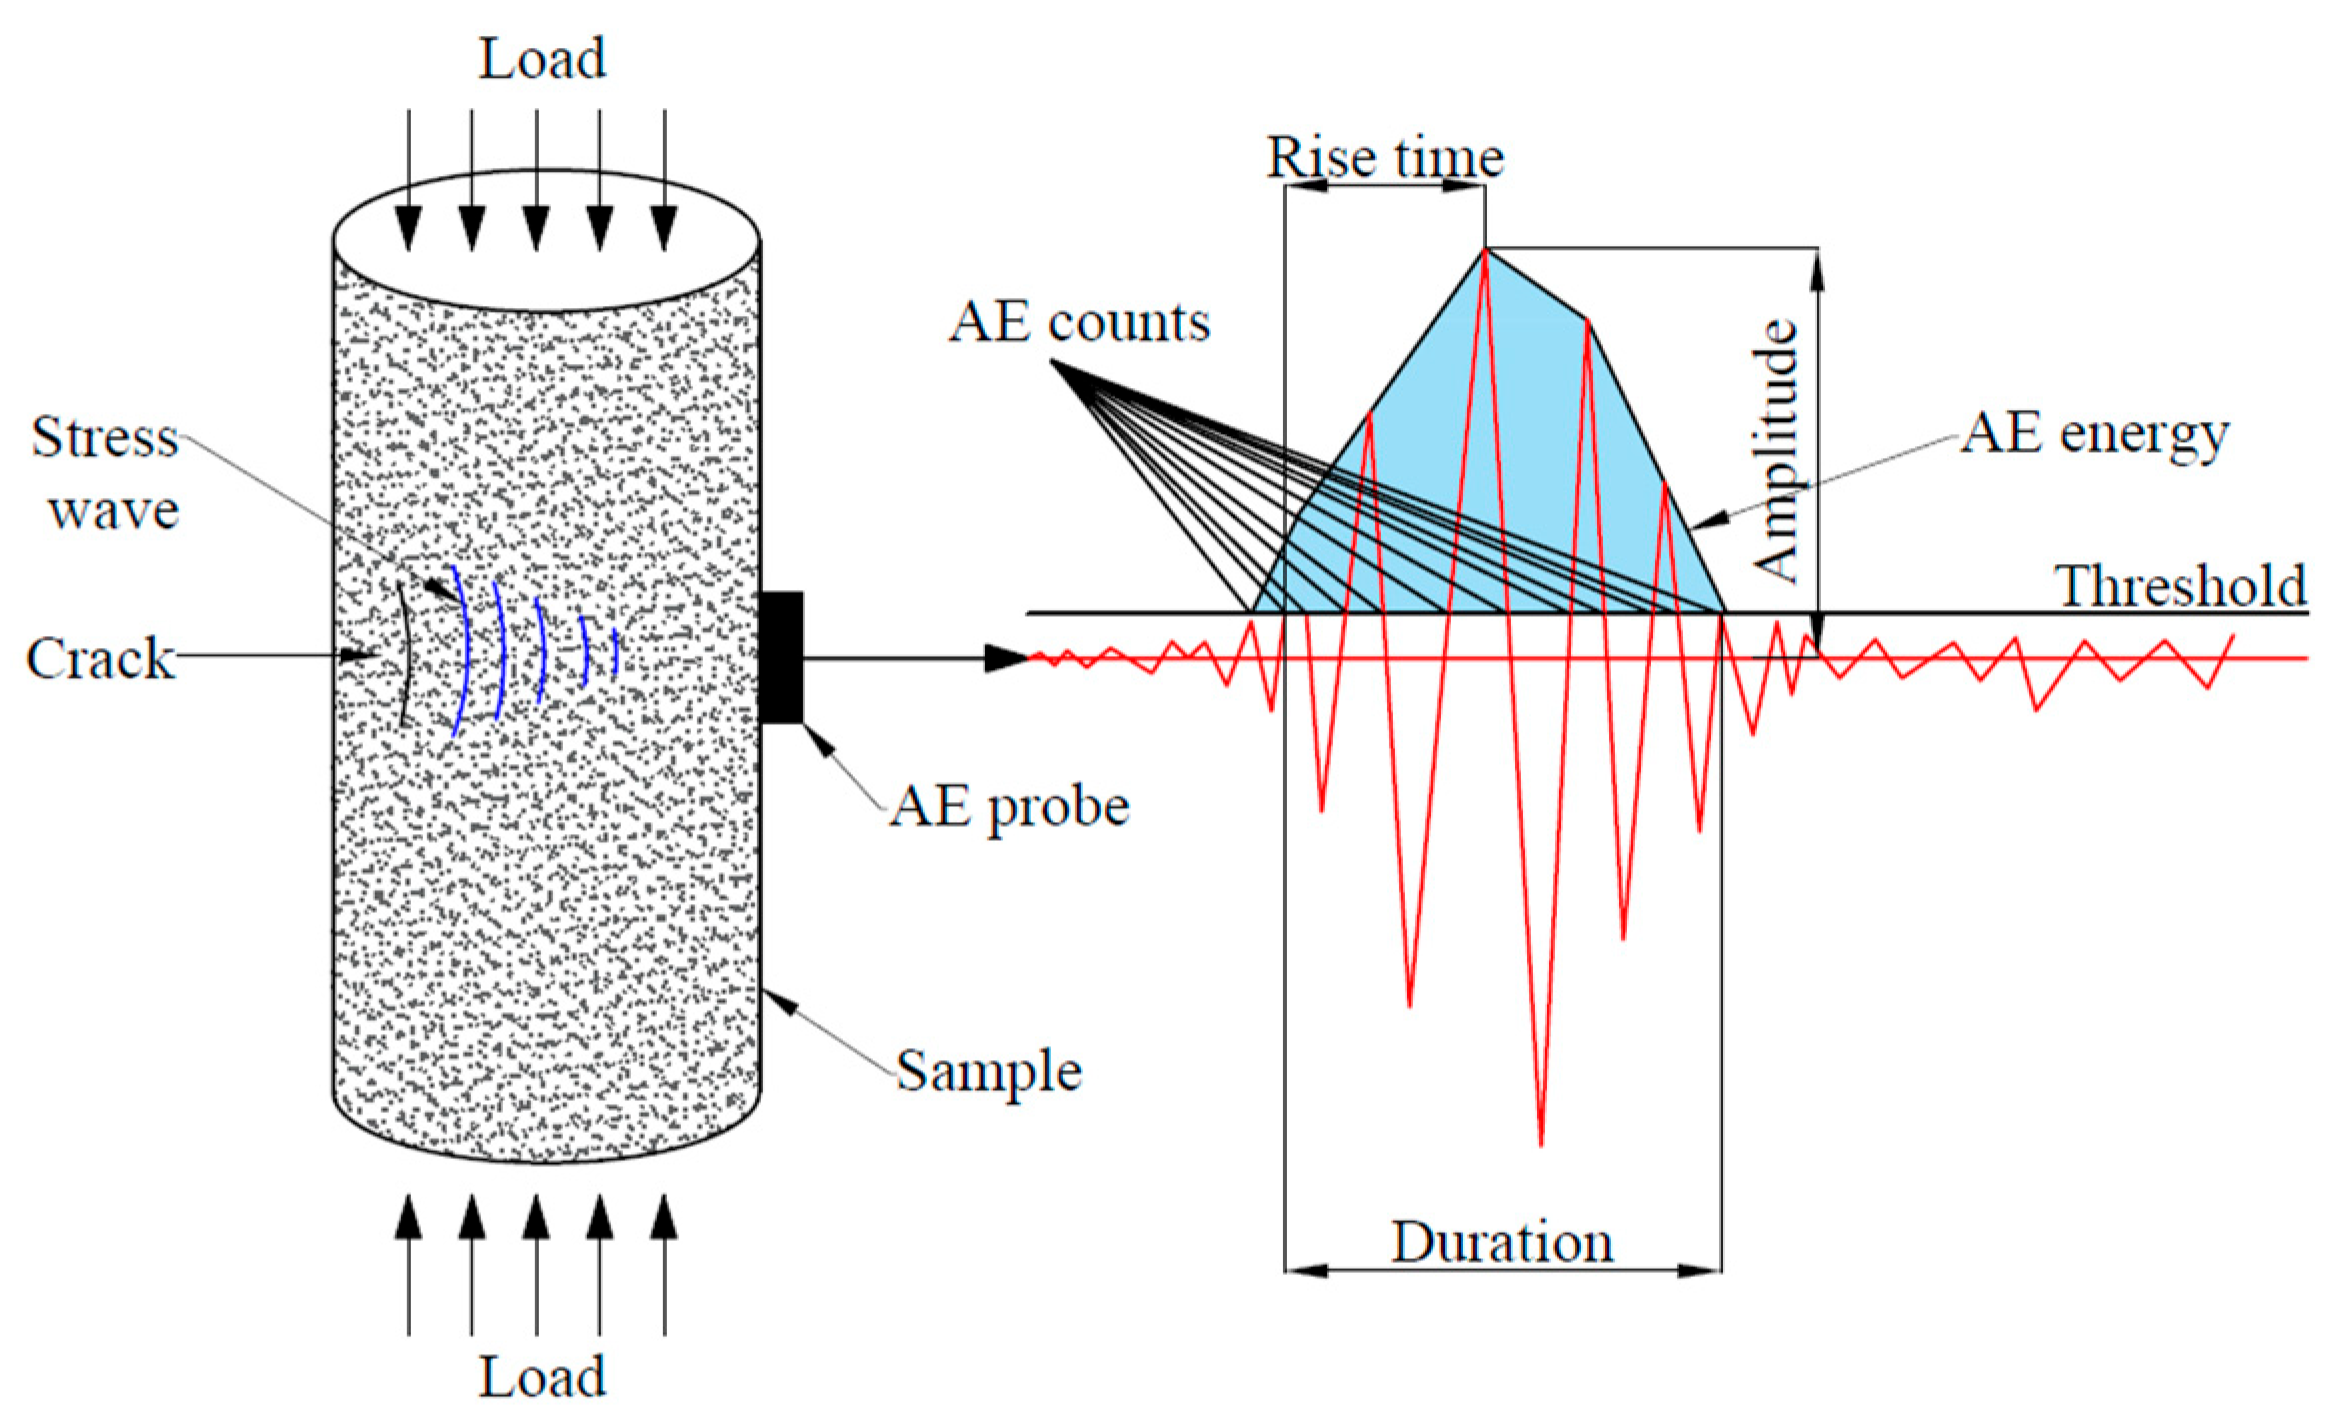
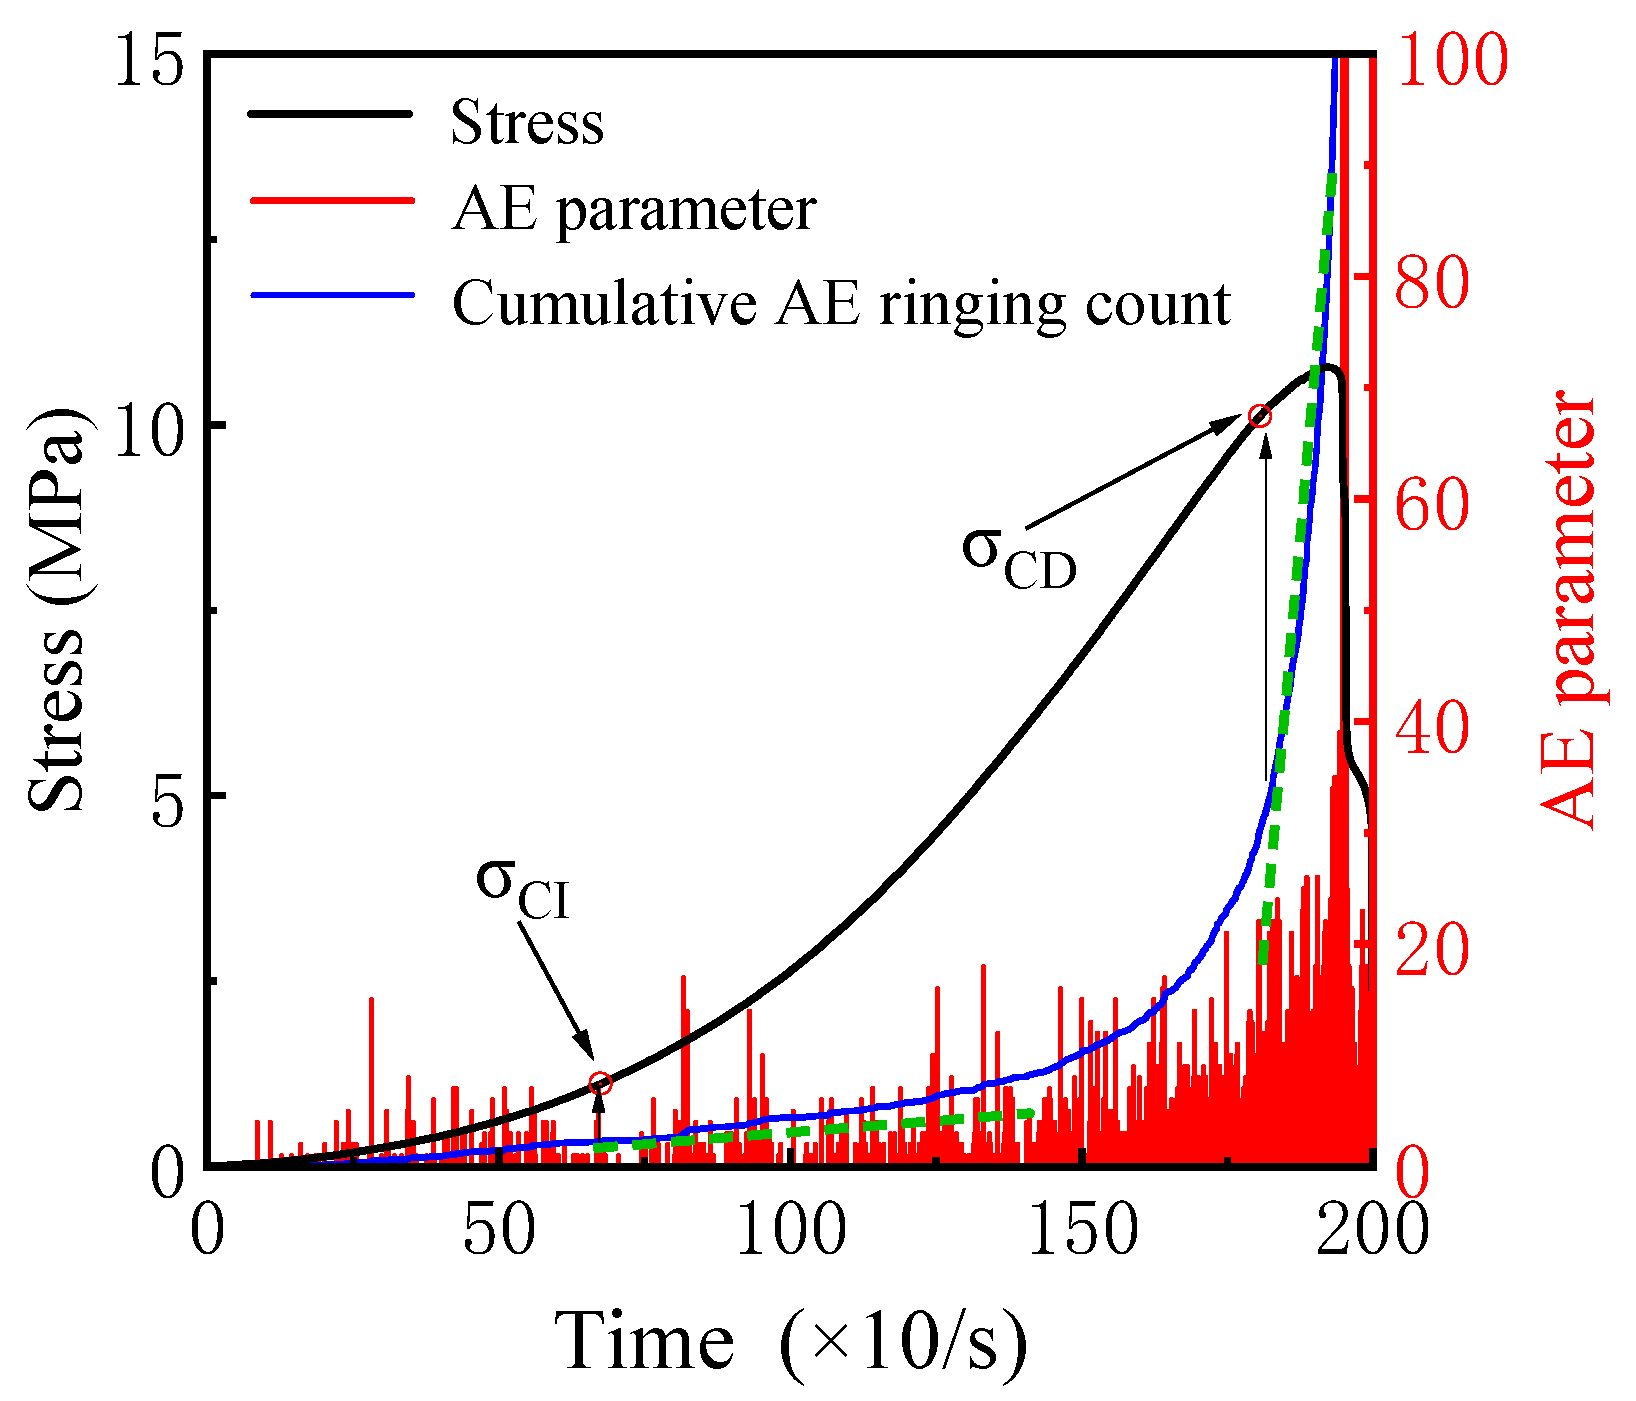
Acoustic emission characteristic parameters, such as ring count, energy, amplitude, duration, rising time, and average frequency, can characterize the acoustic emission signals of coal sandstone specimens in the loading process from multiple angles. The specific characterization of these parameters in the acoustic emission waveform is shown in Figure 8. Meanwhile, a large amount of elastic energy will be released during the deformation and destruction and strength weakening of the rock, and the degree of elastic energy released varies in different loading stages. These energies can be collected by acoustic emission technology and presented in the form of waveform signals, which provides a basis for acoustic emission parameters to characterize rock deformation damage and crack extension. Research indicates that analyzing slope mutation points on the ‘cumulative AE parameter versus time’ curve can identify rock crack initiation and damage thresholds [31,32,33]. Figure 10 illustrates the specific characterization method commonly employed in studying rock fracture behavior. Figure 11 shows the acoustic emission parameter characteristics of sample damage and fracture.

3.2.2. Acoustic Emission Ring Counts and Energy Characteristics
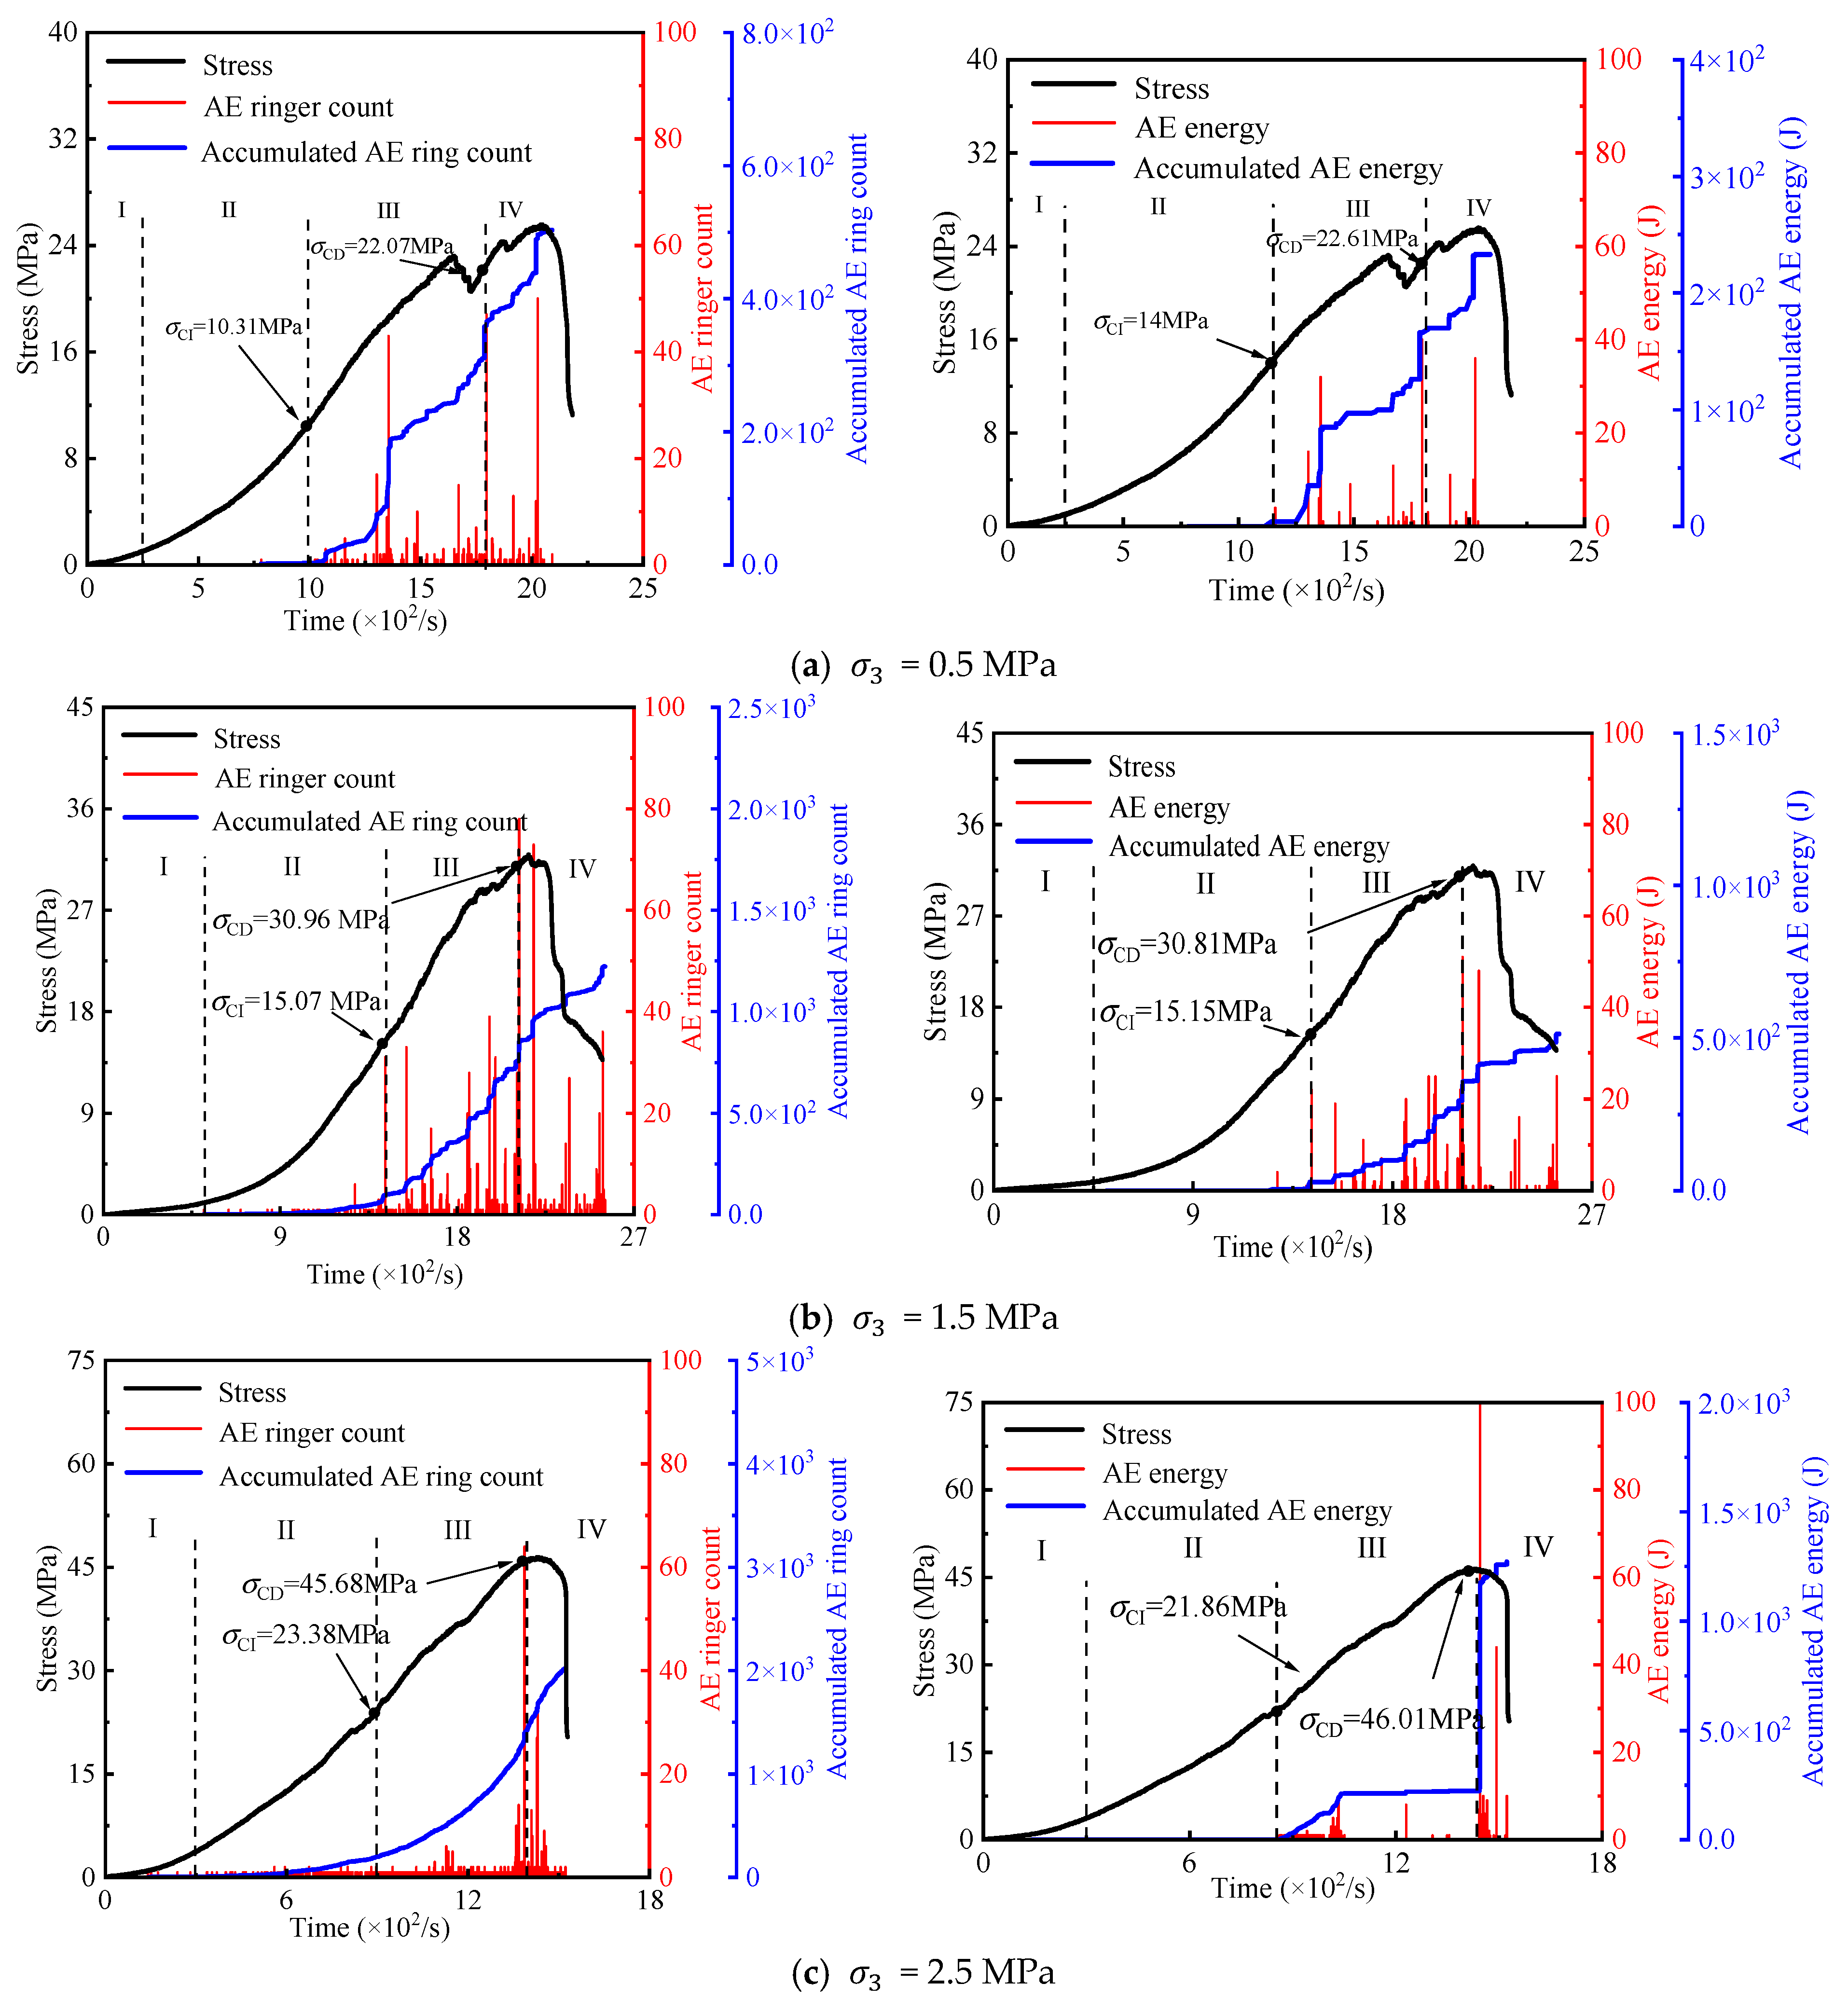
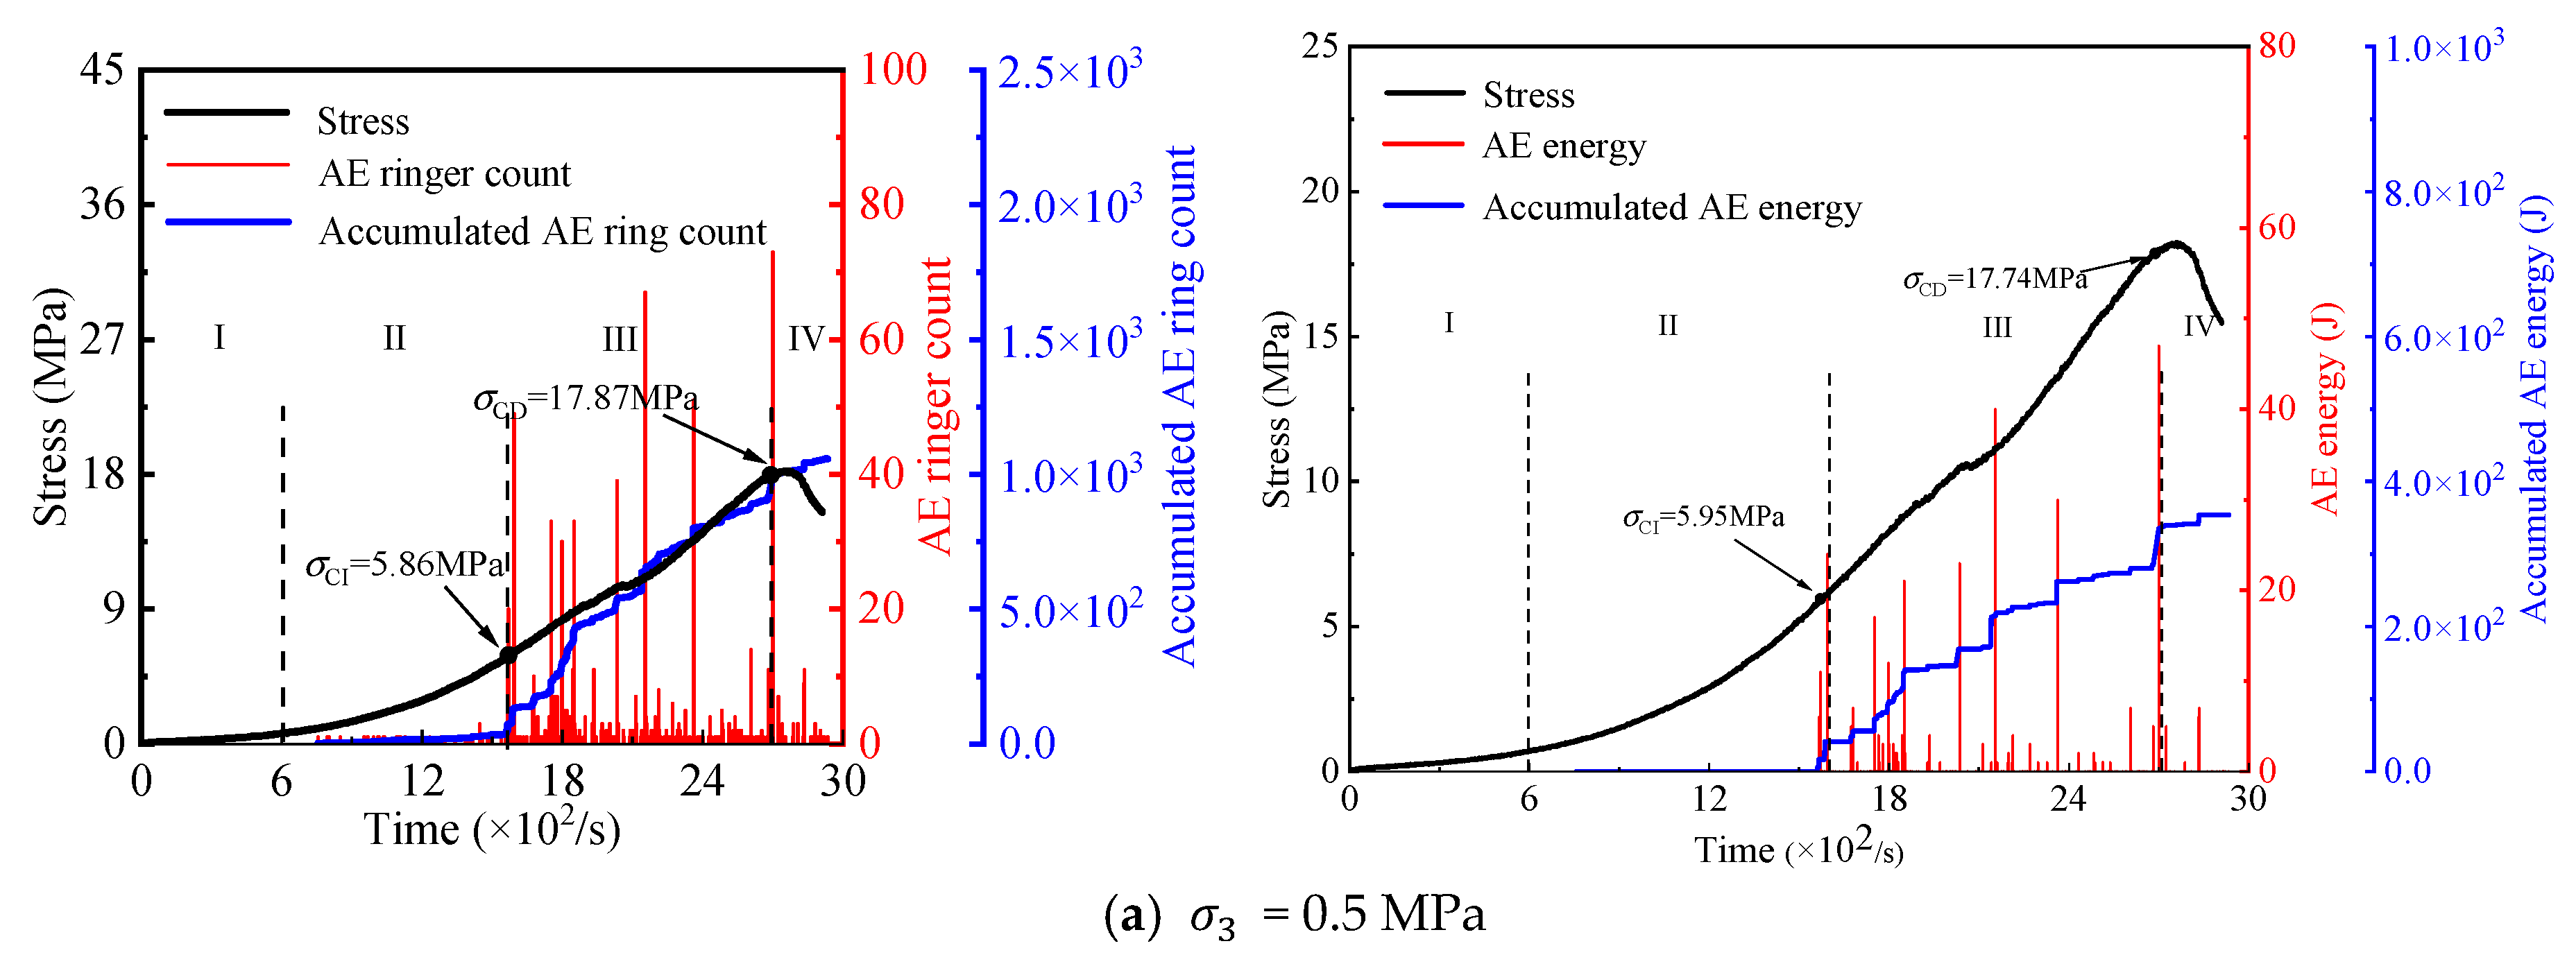
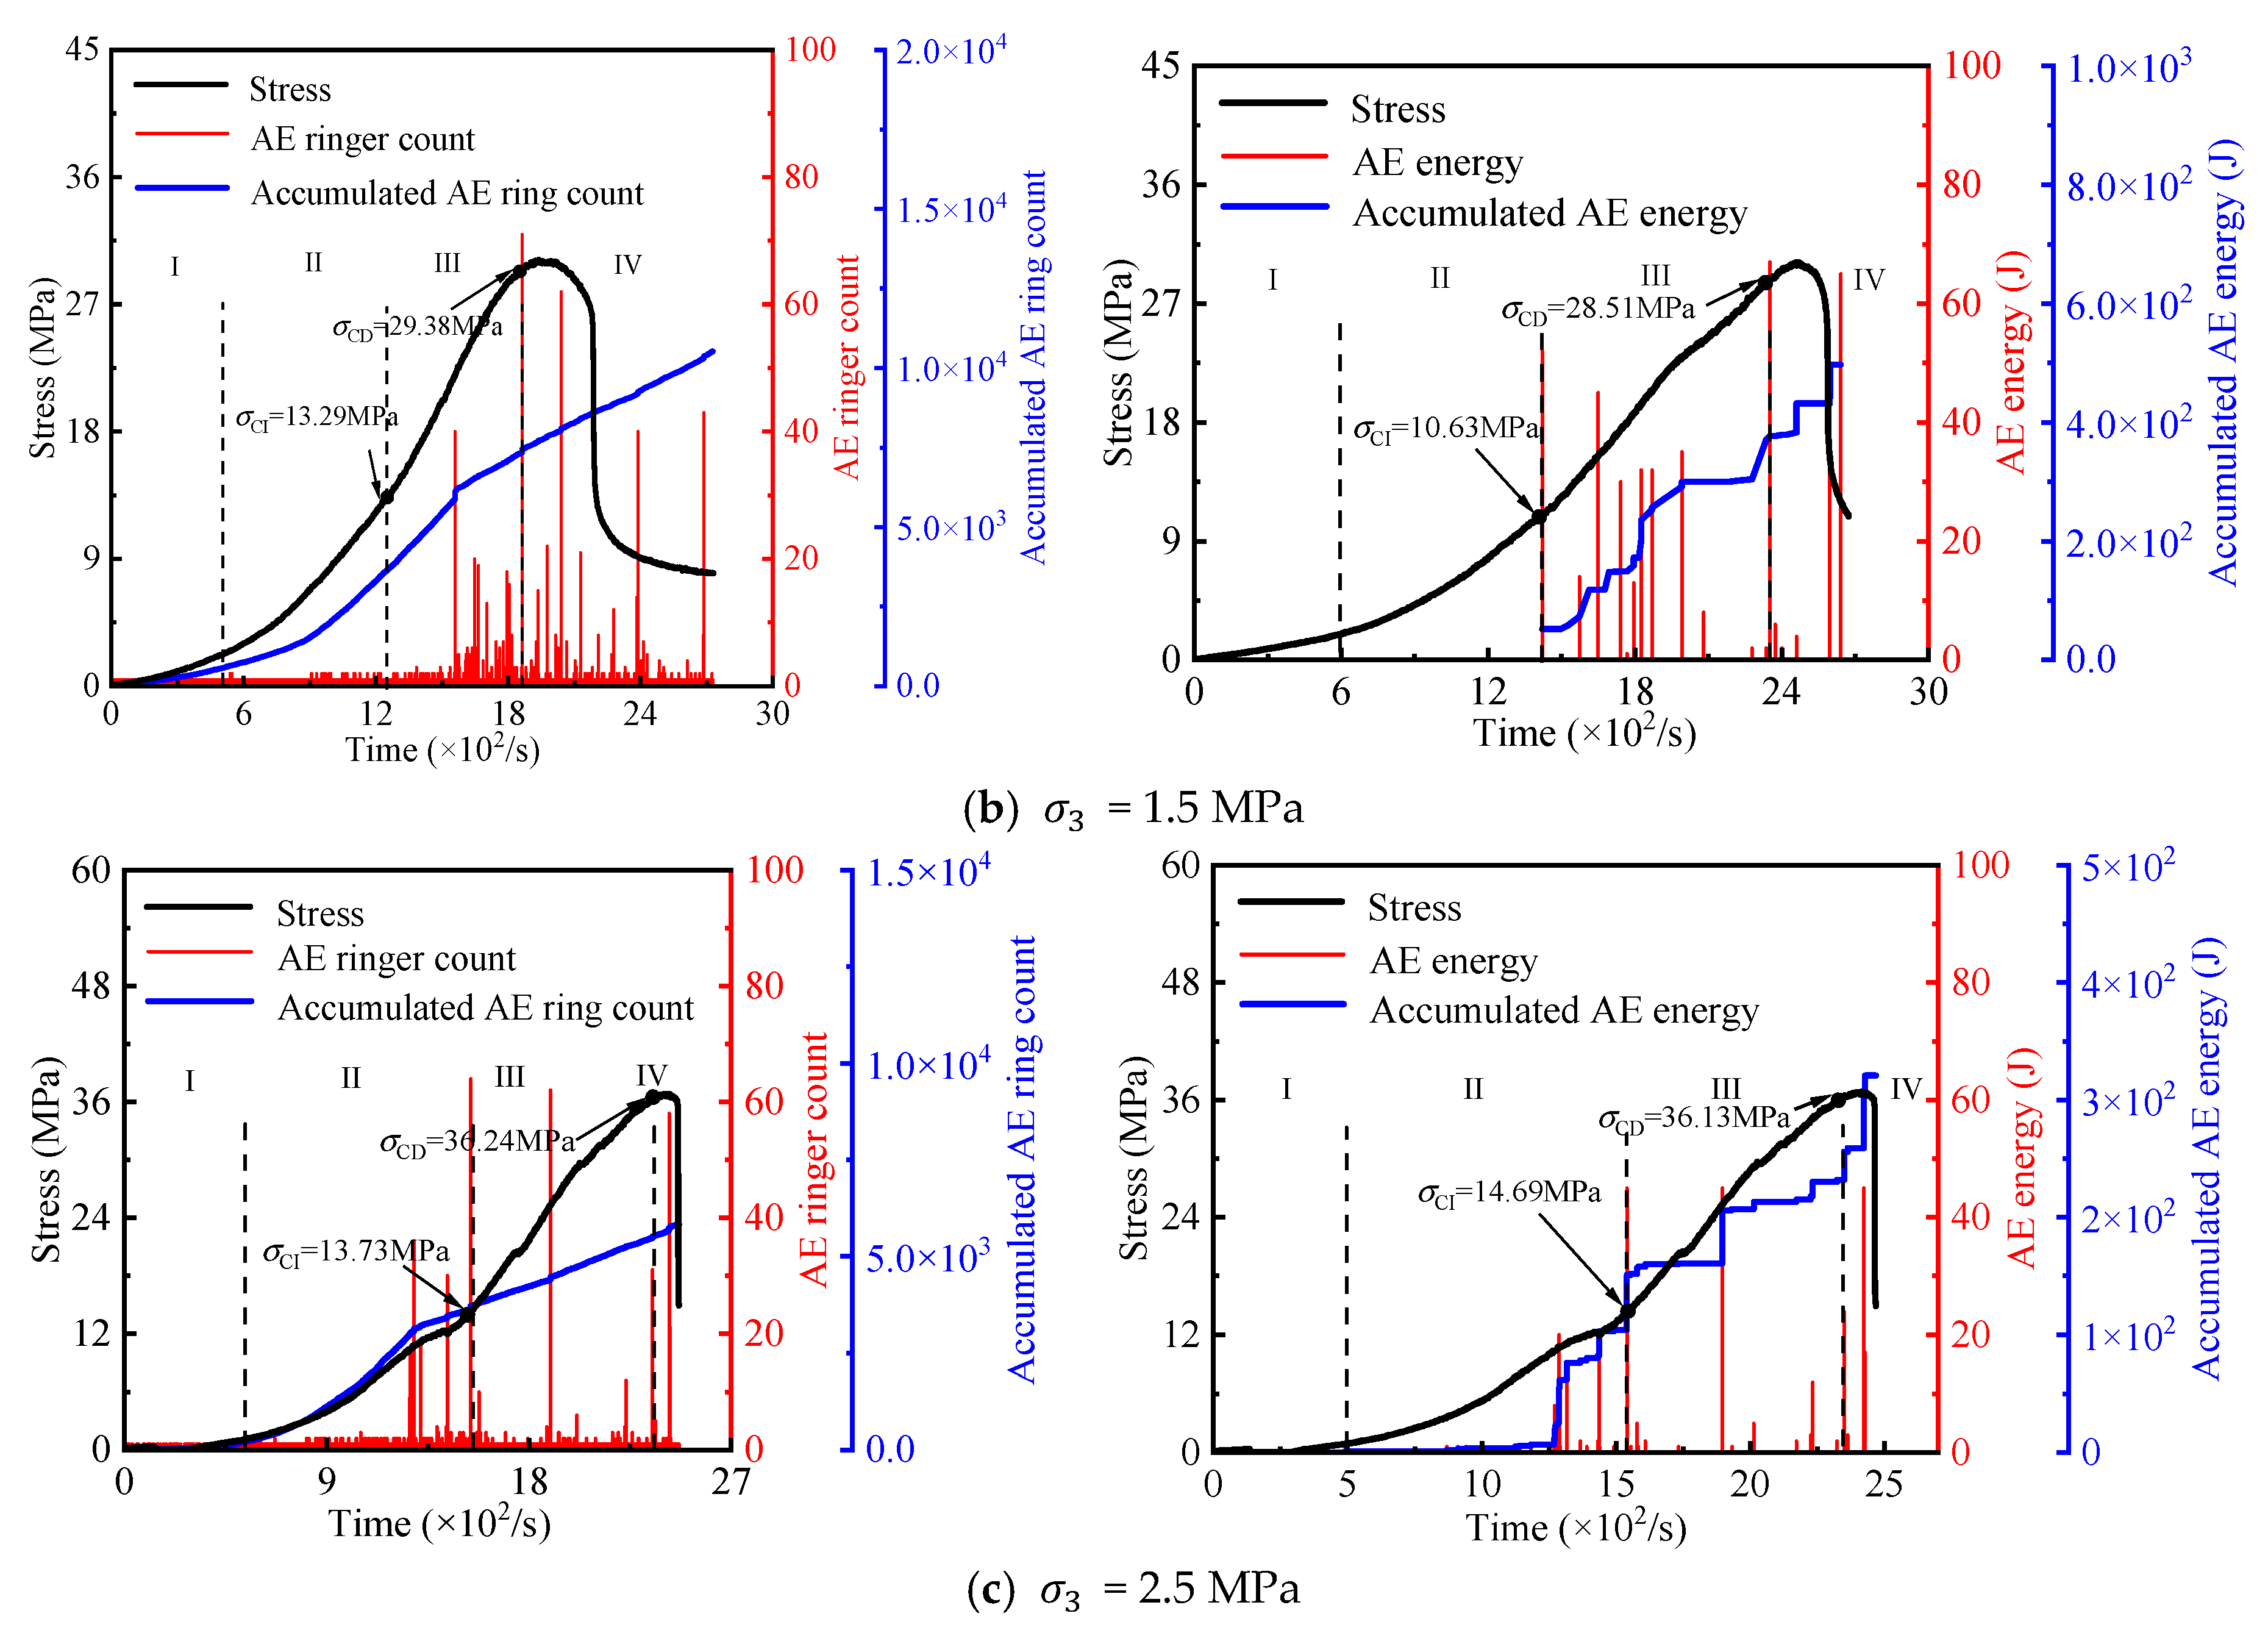
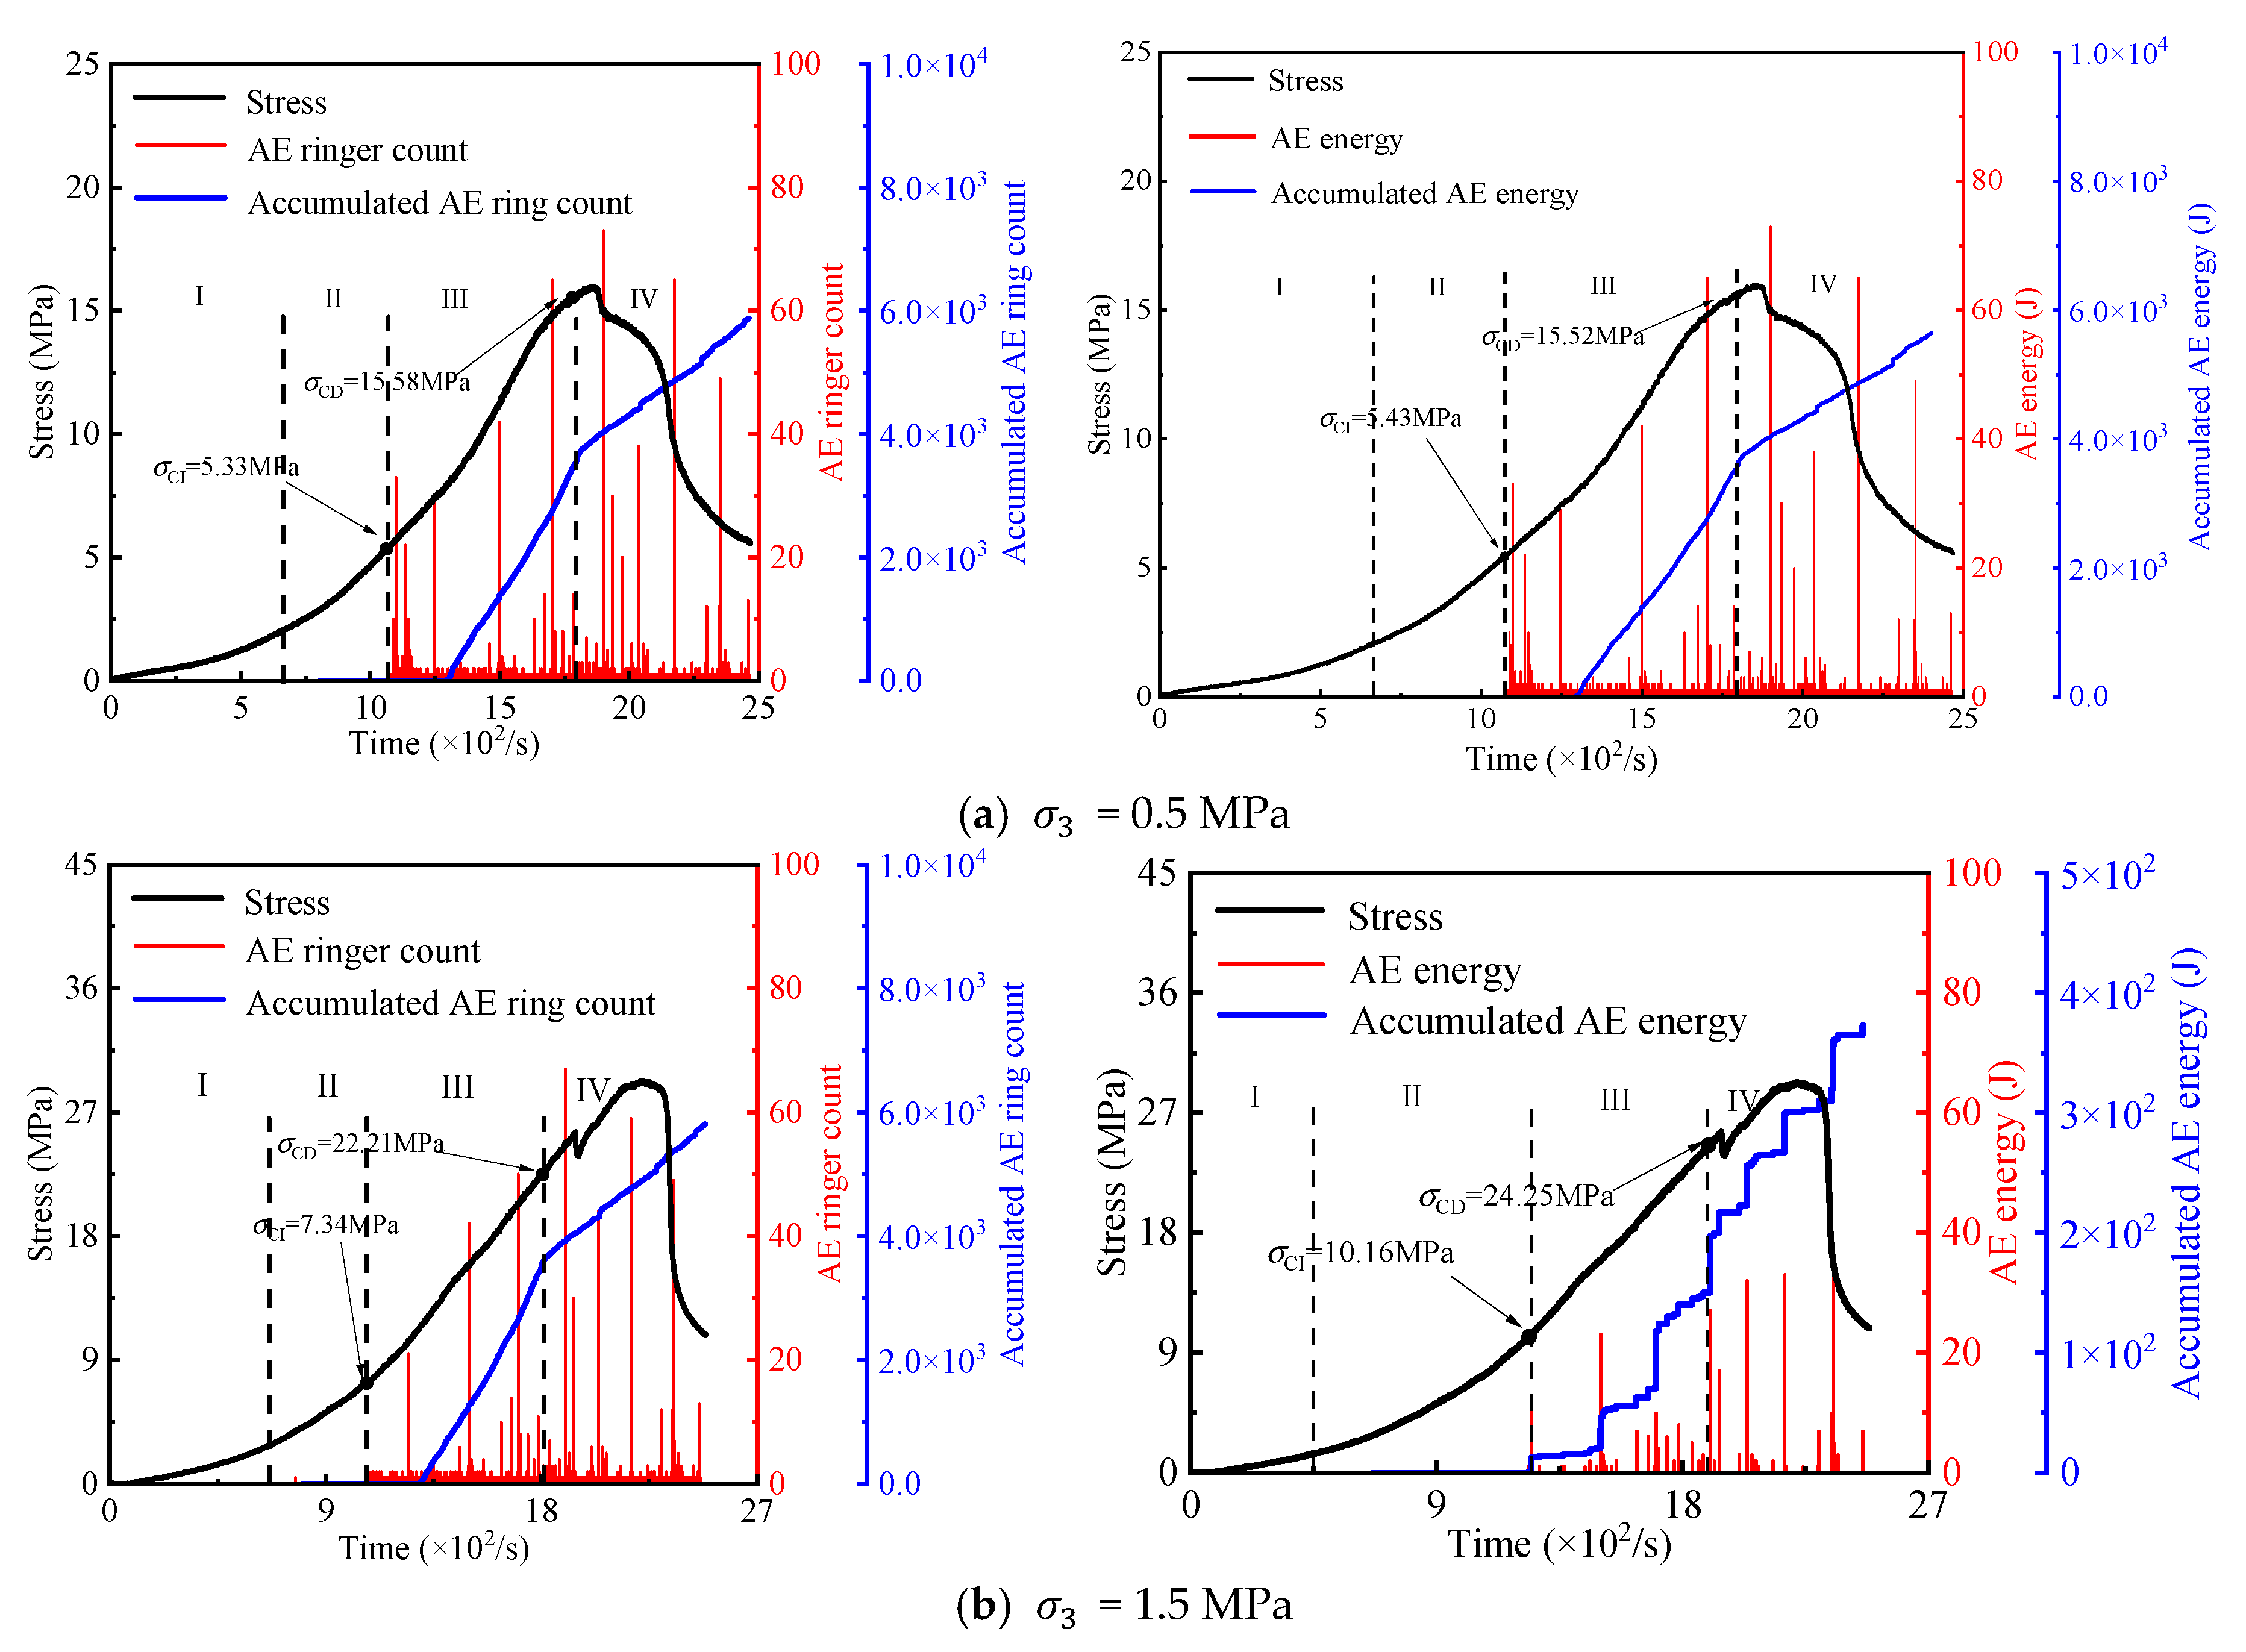
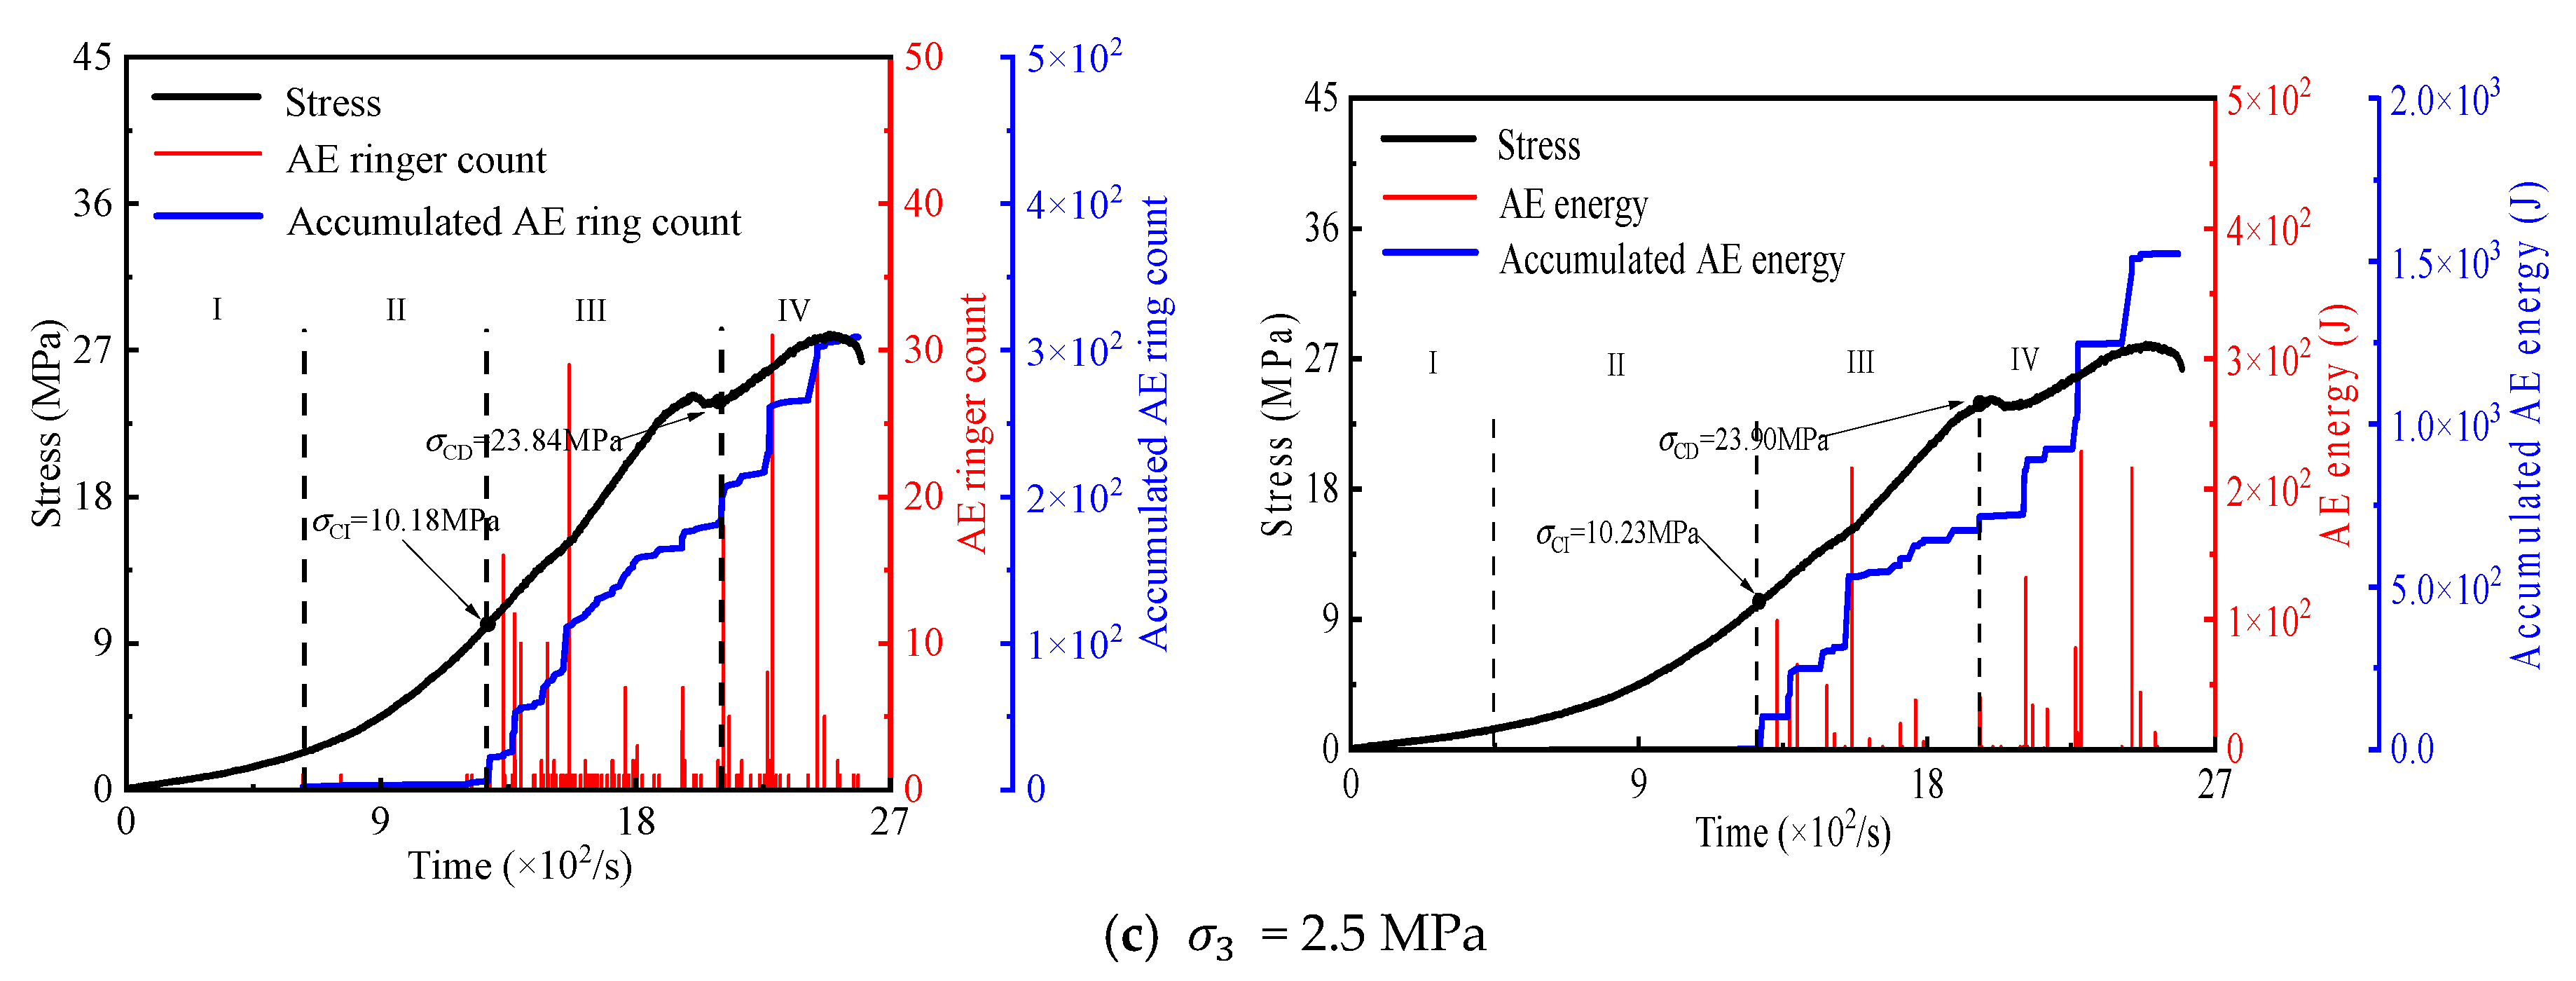
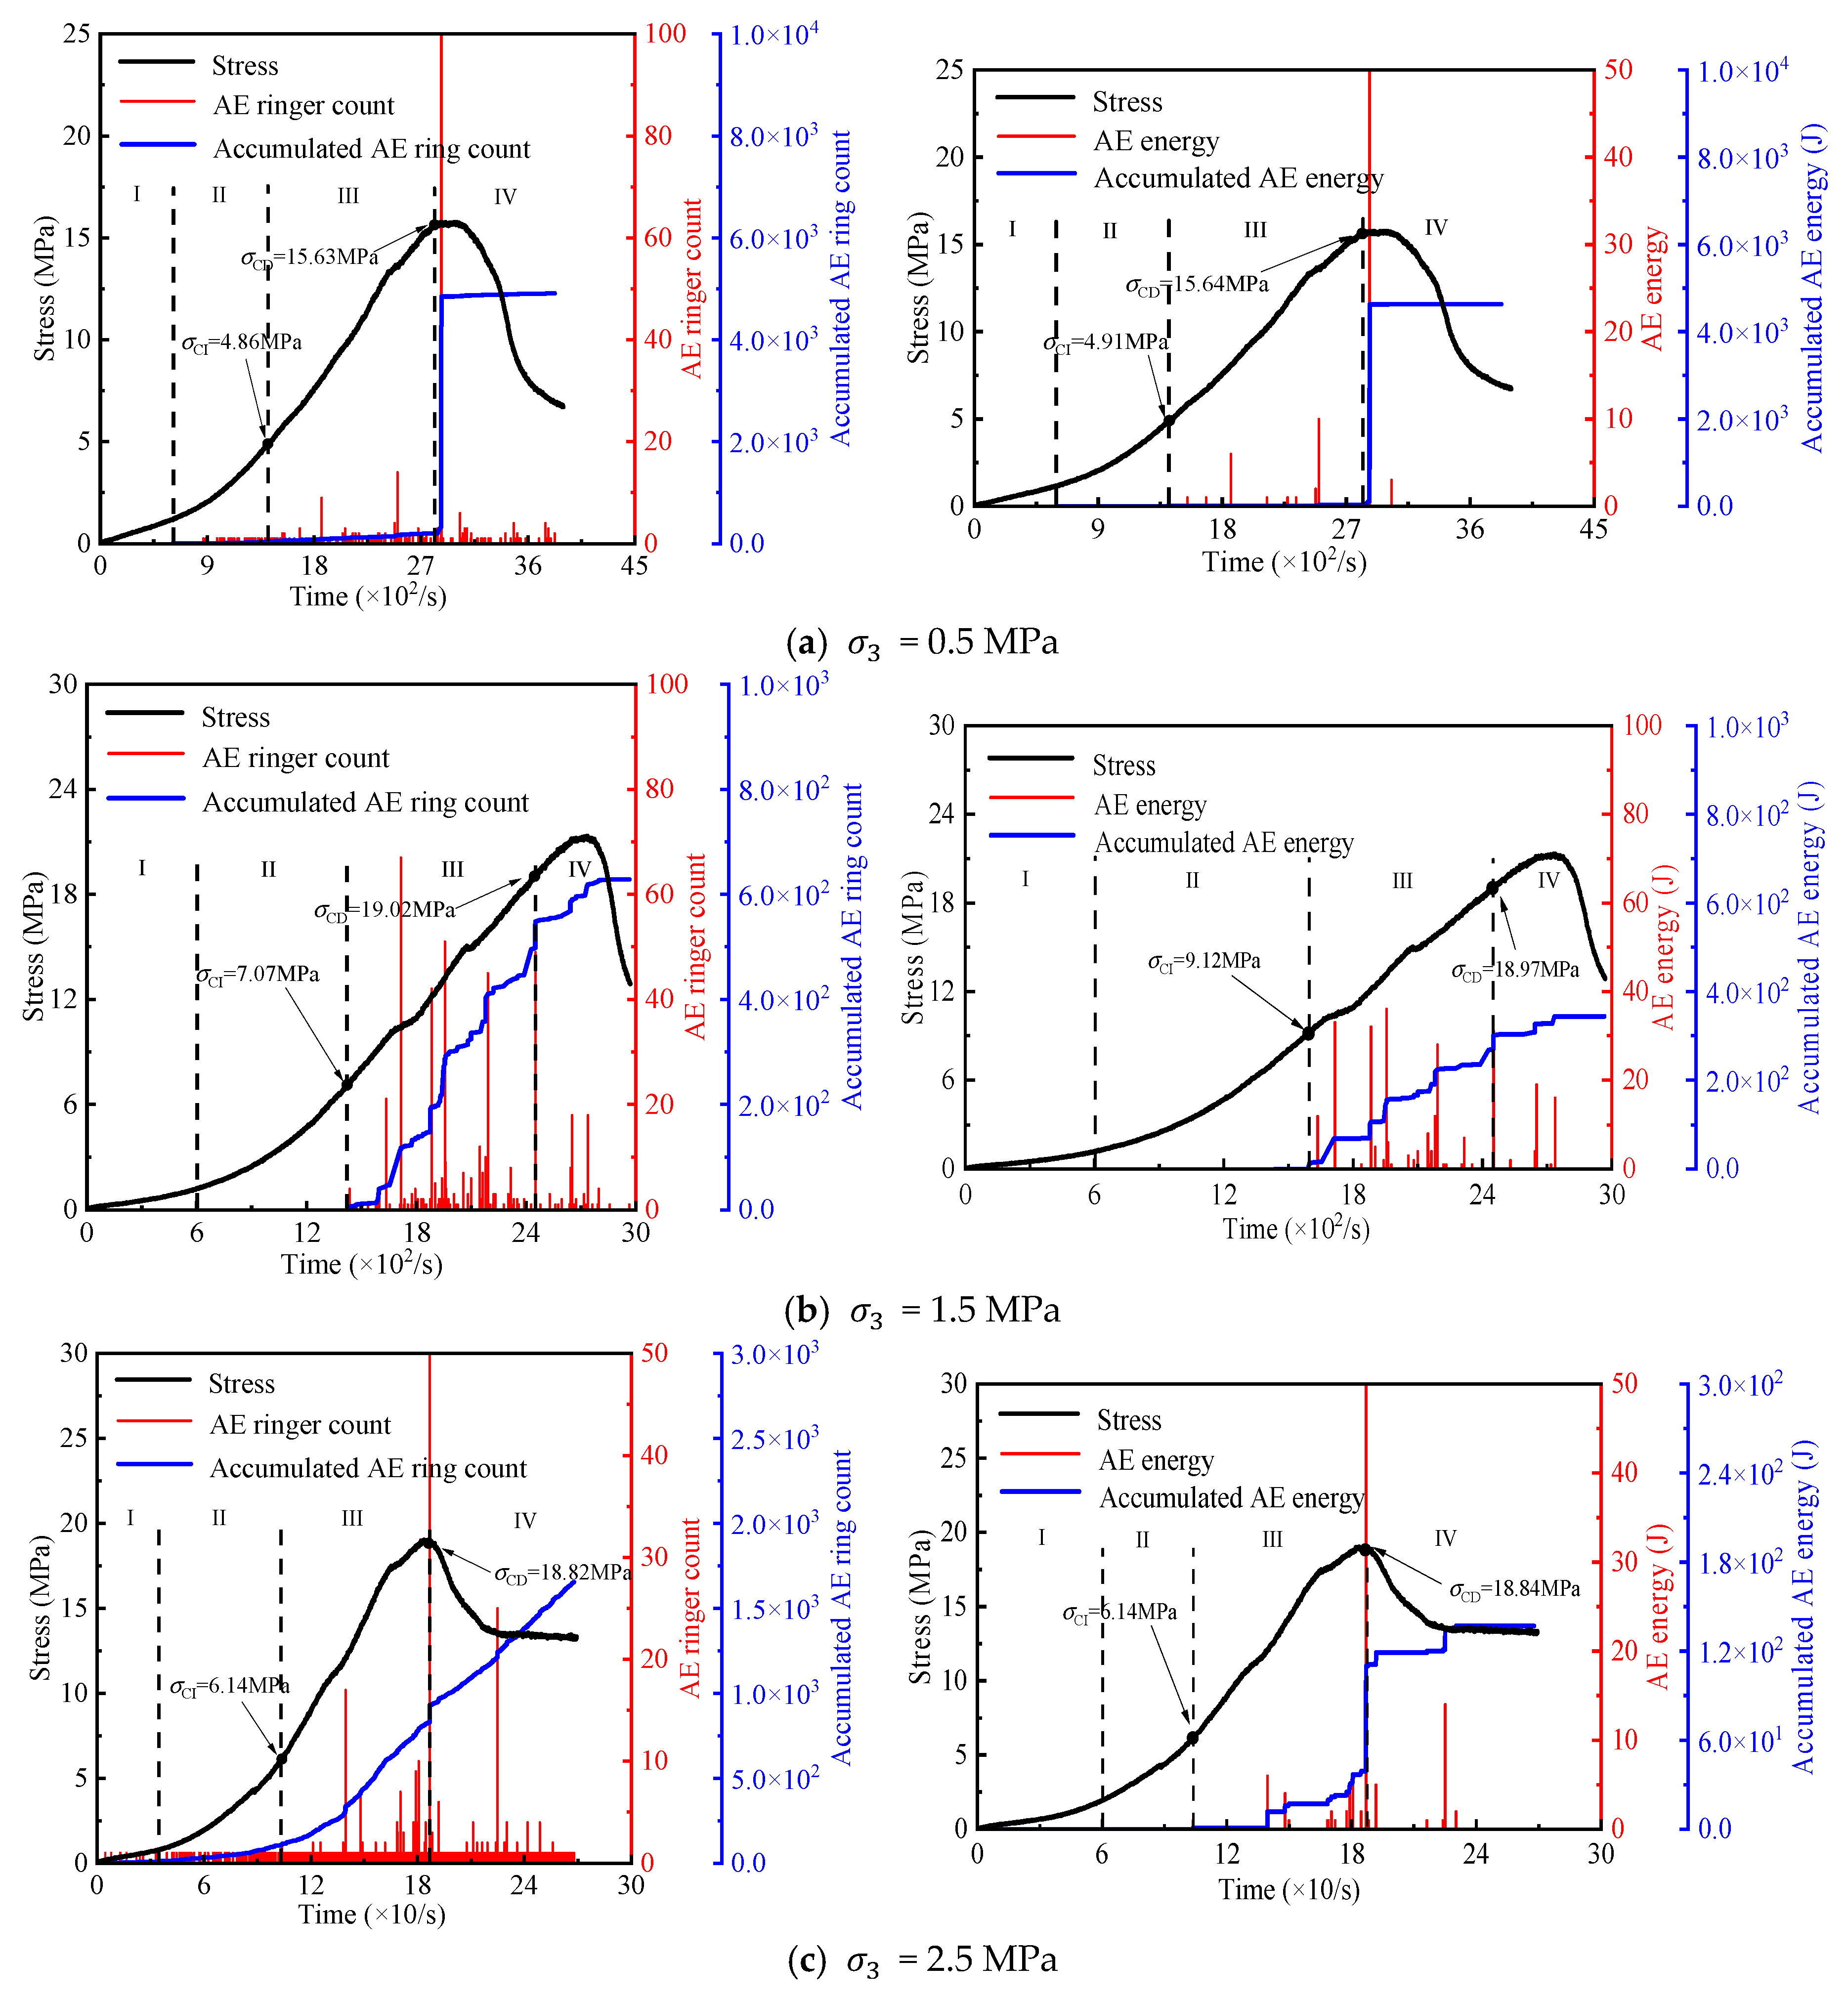
Figure 12, Figure 13, Figure 14, Figure 15 and Figure 16 present the time-domain curves for stress, ringing counts, and energy of the specimens at room temperature across varying freeze–thaw cycle counts. Figure 10 illustrates that coal sandstone specimens exhibit distinct stage characteristics in acoustic emission ringing counts and energies, irrespective of surrounding pressure conditions, when the number of freeze–thaw cycles is fixed:
Initial compaction stage (I stage): at the beginning of test loading, a small amount of energy will be released when the natural pores inside the coal sandstone are compacted and closed, the acoustic emission ringing counts are less, and the rock samples remain in a compact and intact state.
Elastic deformation stage (II stage): In this stage, the internal and external loading will not cause the expansion of the internal cracks of the coal sandstone, and there is less damage to the rock samples, i.e., there is no obvious release of elastic energy, but a small number of acoustic emission events can still be found under axial loading due to the inhomogeneity of the coal sandstone specimens. At the same time, this phase is dominated by elastic deformation, which accumulates a large amount of energy, but its release is small, so this phase can be regarded as a ‘quiet period’ of acoustic emission.
Stage III, the stable crack expansion phase, begins when the loading stress reaches the crack initiation threshold. At this point, the AE amplitude slightly increases compared to Stages I and II, indicating the formation and stable expansion of new cracks. However, a steep energy increase may also occur due to the heterogeneity of the coal sandstone’s internal structure. As the axial load continues to rise beyond the damage threshold, both the acoustic emission ring count and cumulative energy grow steadily, marking this phase as the ‘low amplitude growth period of acoustic emission’. When stress surpasses the damage threshold, both acoustic emission ring counts and cumulative energy rise steadily, marking the ‘low-amplitude acoustic emission growth period.
Stage IV, the crack non-stationary expansion stage, is characterized by the stress level surpassing the damage threshold, leading to a sharp and steep increase in AE counts and energy. The slopes of the cumulative acoustic emission counts and energy curves rise non-linearly, signifying the local occurrence of secondary microcracks. This transition marks the shift from stable to unstable crack expansion, termed the ‘Acoustic Emission High Growth’ stage. This phase is defined as the ‘acoustic emission high amplitude growth period’.
The trend of acoustic emission during loading is largely unaffected by pressure levels; however, the values of key acoustic emission parameters, such as the crack initiation and damage thresholds, are notably influenced by pressure levels. In addition, the cumulative ring counts and energy curves of the acoustic emission under different pressures are characterized by step fluctuations, which may be closely related to the inhibition of crack extension by the surrounding pressure and the uneven distribution of the pore and fracture structure of the specimens after the freeze–thaw treatment, but the effect of this phenomenon on the overall test results is relatively small and can be ignored.
It should be noted that Figure 12, Figure 13, Figure 14, Figure 15 and Figure 16 show the time-domain curves of stress, number of ringing and energy of the specimens at different σ3.
Figure 12. Time-domain curves of stress, ringing counts, and energy of the specimen at different σ3 (Note: T = 20 °C, N = 0).
Applsci 15 10021 g012
Figure 13. Time-domain curves of stress, ringing counts, and energy of the specimen at different σ3 (Note: T = −15 °C, N = 5).
Applsci 15 10021 g013
Figure 14. Time-domain curves of stress, ringing counts, and energy of the specimen at different σ3 (Note: T = −15 °C, N = 10).
Applsci 15 10021 g014aApplsci 15 10021 g014b
Figure 15. Time-domain curves of stress, ringing counts, and energy of the specimen at different σ3 (Note: T = −15 °C, N = 15).
Applsci 15 10021 g015aApplsci 15 10021 g015b
Figure 16. Time-domain curves of stress, ringing counts, and energy of the specimen at different σ3 (Note: T = −15 °C, N = 20).
Applsci 15 10021 g016

3.3. Correlation Between Crack Initiation, Damage Threshold, and Percentage with Surrounding Pressure

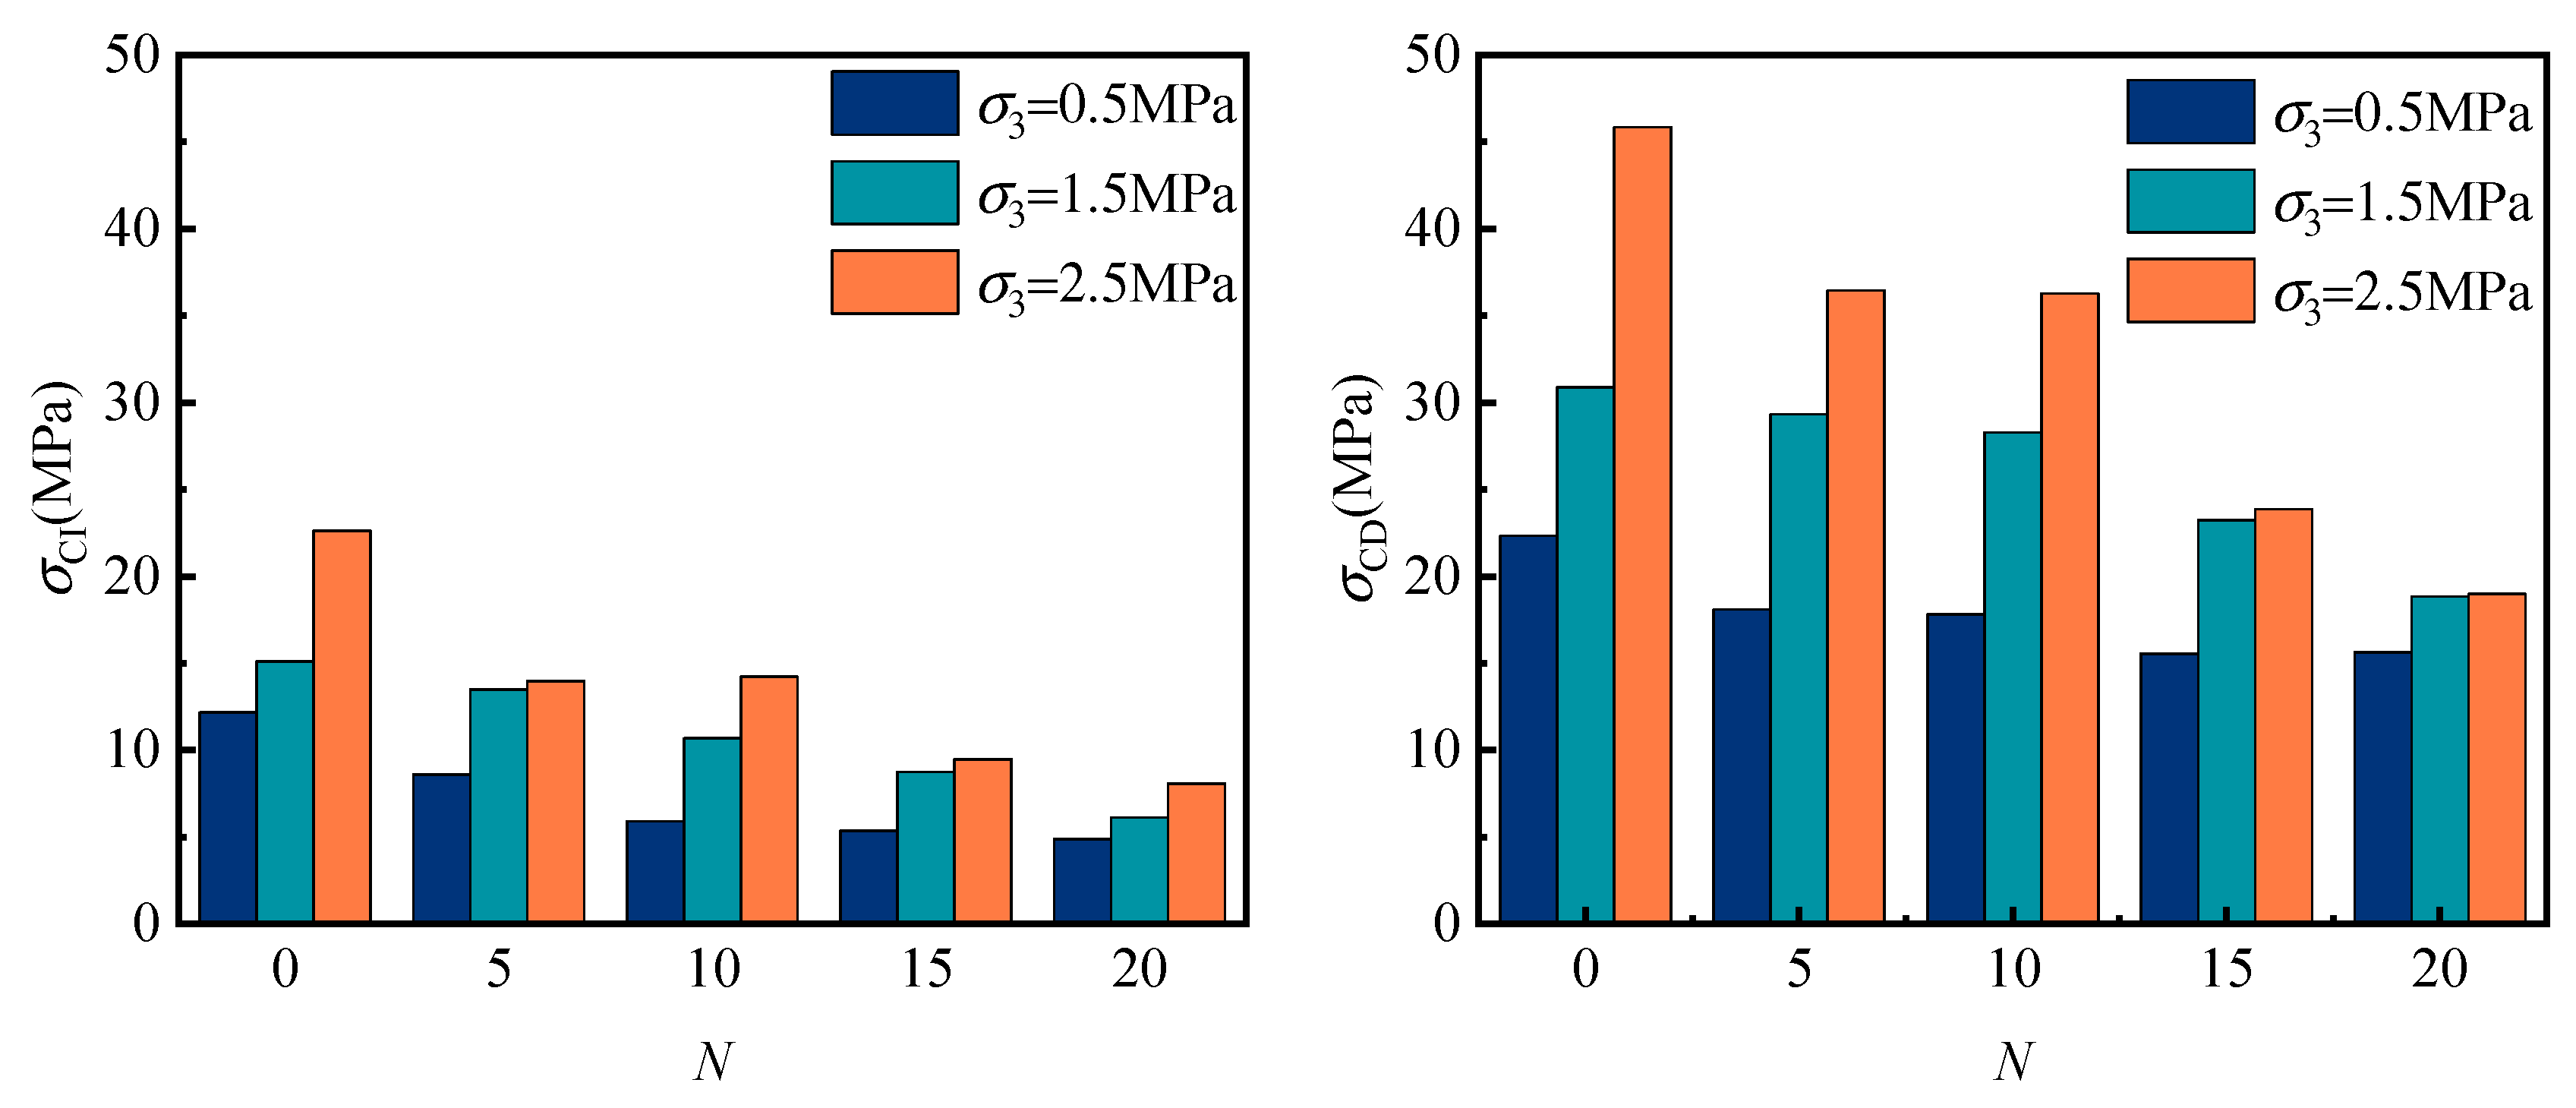
Figure 17 and Table 2 present the histograms of crack initiation and damage thresholds across varying σ3 and N conditions. Table 2 presents the crack initiation and damage thresholds, along with their ratios to peak stress, across various peripheral pressures and N, as illustrated in Figure 17 and Table 2. As shown in Figure 17 and Table 2, the crack initiation and damage thresholds of sandstone specimens rise with increasing peripheral pressure levels under a given number of freeze–thaw cycles. With N = 10, increasing the peripheral pressure from 0.5 MPa to 2.5 MPa raised the crack initiation stress threshold by 8.32 MPa and the damage stress threshold by 18.47 MPa, representing increases of 1.40 times and 1.04 times, respectively. The increase in peripheral pressure significantly inhibits crack initiation, extension, and penetration in coal sandstone specimens by raising the stress threshold necessary for crack initiation and unstable growth, thereby enhancing the specimens’ deformation resistance and strength.

4. Damage Eigenstructure Model and Evolution Equations

4.1. Establishment of Damage Model

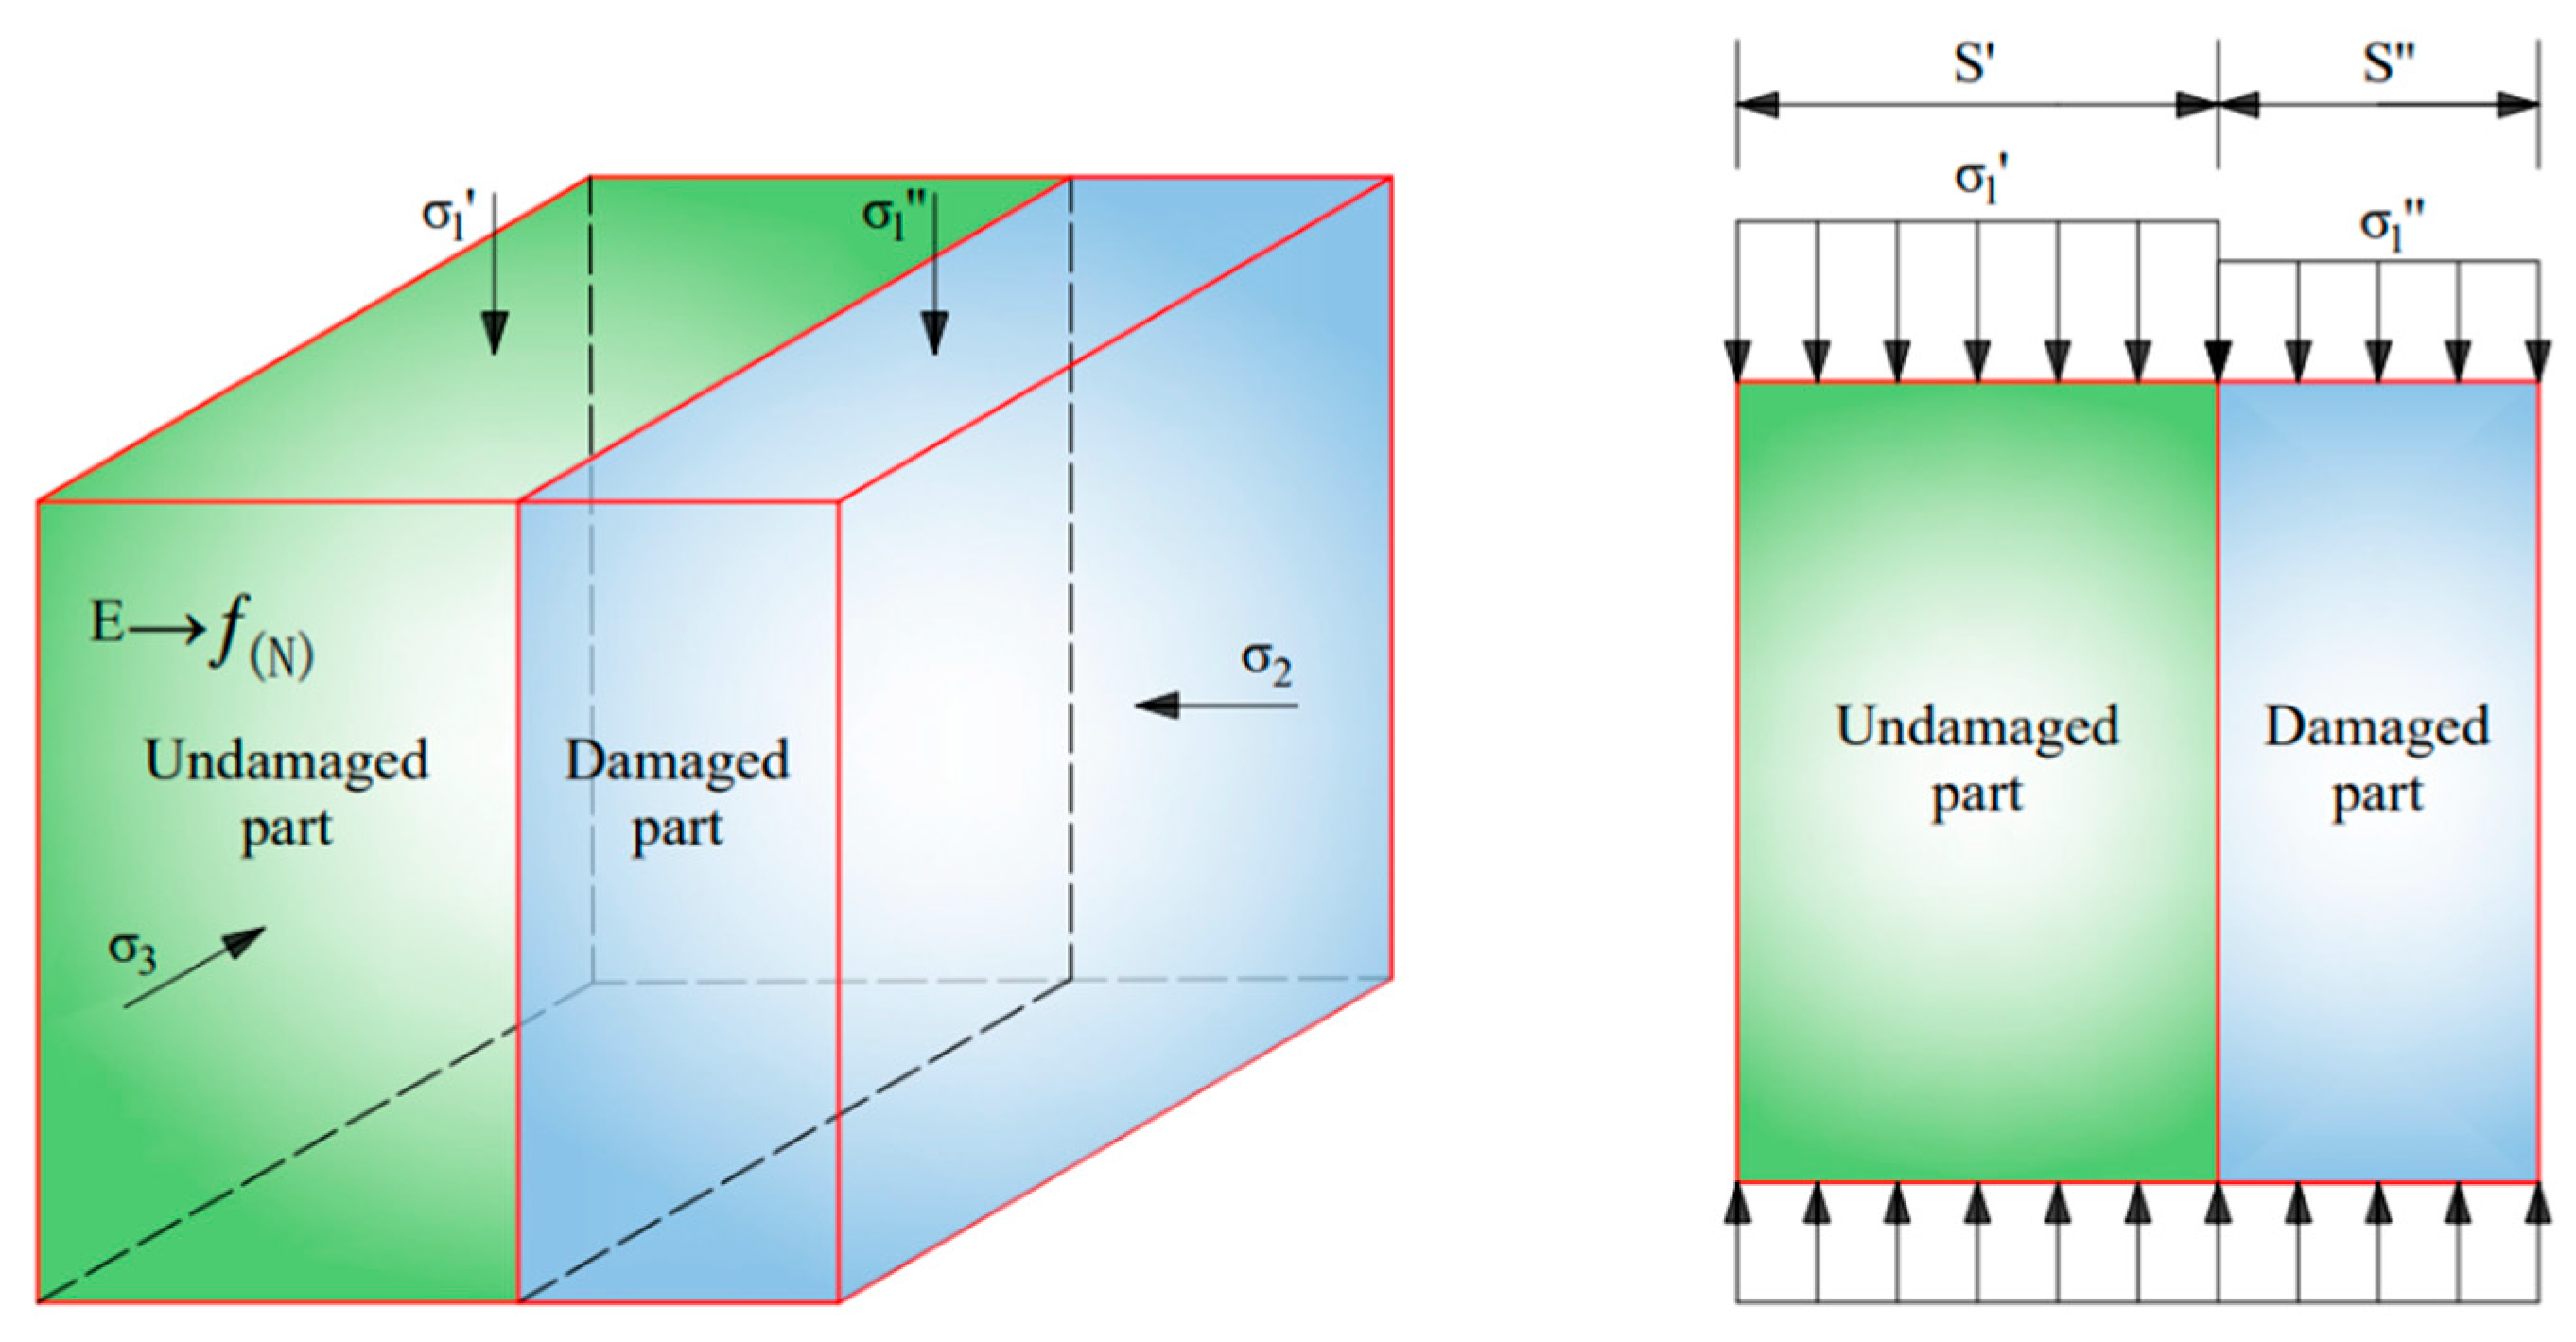
The progressive damage of coal sandstone under external load involves damage accumulation, influenced by axial stress, peripheral pressure, and internal structural changes from freezing and thawing [34,35,36]. Most of the commonly used rock damage models are based on the assumption of Lemaitre’s strain equivalence, which assumes that the post-peak residual strength of rock damage is 0, which is obviously inconsistent with the results of the actual rock triaxial compression test; some scholars agree with the former assumption on the basis of the revision of the model, the establishment of a local damage model that can describe the post-peak residual strength of the rock, and the model force schematic diagram is shown in Figure 18 [37,38,39].
The model divides the rock material into undamaged and damaged parts and assumes that the damage to the rock during the loading process only occurs in the direction normal to the cross-section of the specimen, where the cross-sectional areas of the undamaged and damaged parts are and, respectively, and the total area of the cross-section is. Then, the damage variable is defined as the following:
The model categorizes the rock material into undamaged and damaged sections, positing that damage during loading occurs solely in the direction perpendicular to the specimen’s cross-section. With cross-sectional areas of the undamaged and damaged parts denoted as respective variables, and the total cross-sectional area as a whole, the damage variable is defined accordingly.
D = S S
Since rock damage occurs only in the section where the normal direction is axial, the apparent stresses and strains in each direction of the rock satisfy the following relationship:
σ 1 = σ 1 1 D + σ 1
ε 1 = ε 1 = ε 1
σ 2 = σ 2 = σ 2
σ 3 = σ 3 = σ 3
The apparent stress applied to the rock cross-section in three directions (i = 1, 2, 3) is defined by the stresses σ i and σ i , which are borne by the undamaged and damaged parts of the rock, respectively, measured in MPa. The apparent axial strain of the rock is denoted by ε 1 , with ε 1 and ε 1 representing the axial strains of the undamaged and damaged sections, respectively.
In the undamaged section of the rock, where only elastic deformation is present, the stress–strain relationship adheres to the generalized Hooke’s law.
σ 1 = E ε 1 + ν σ 2 + σ 3
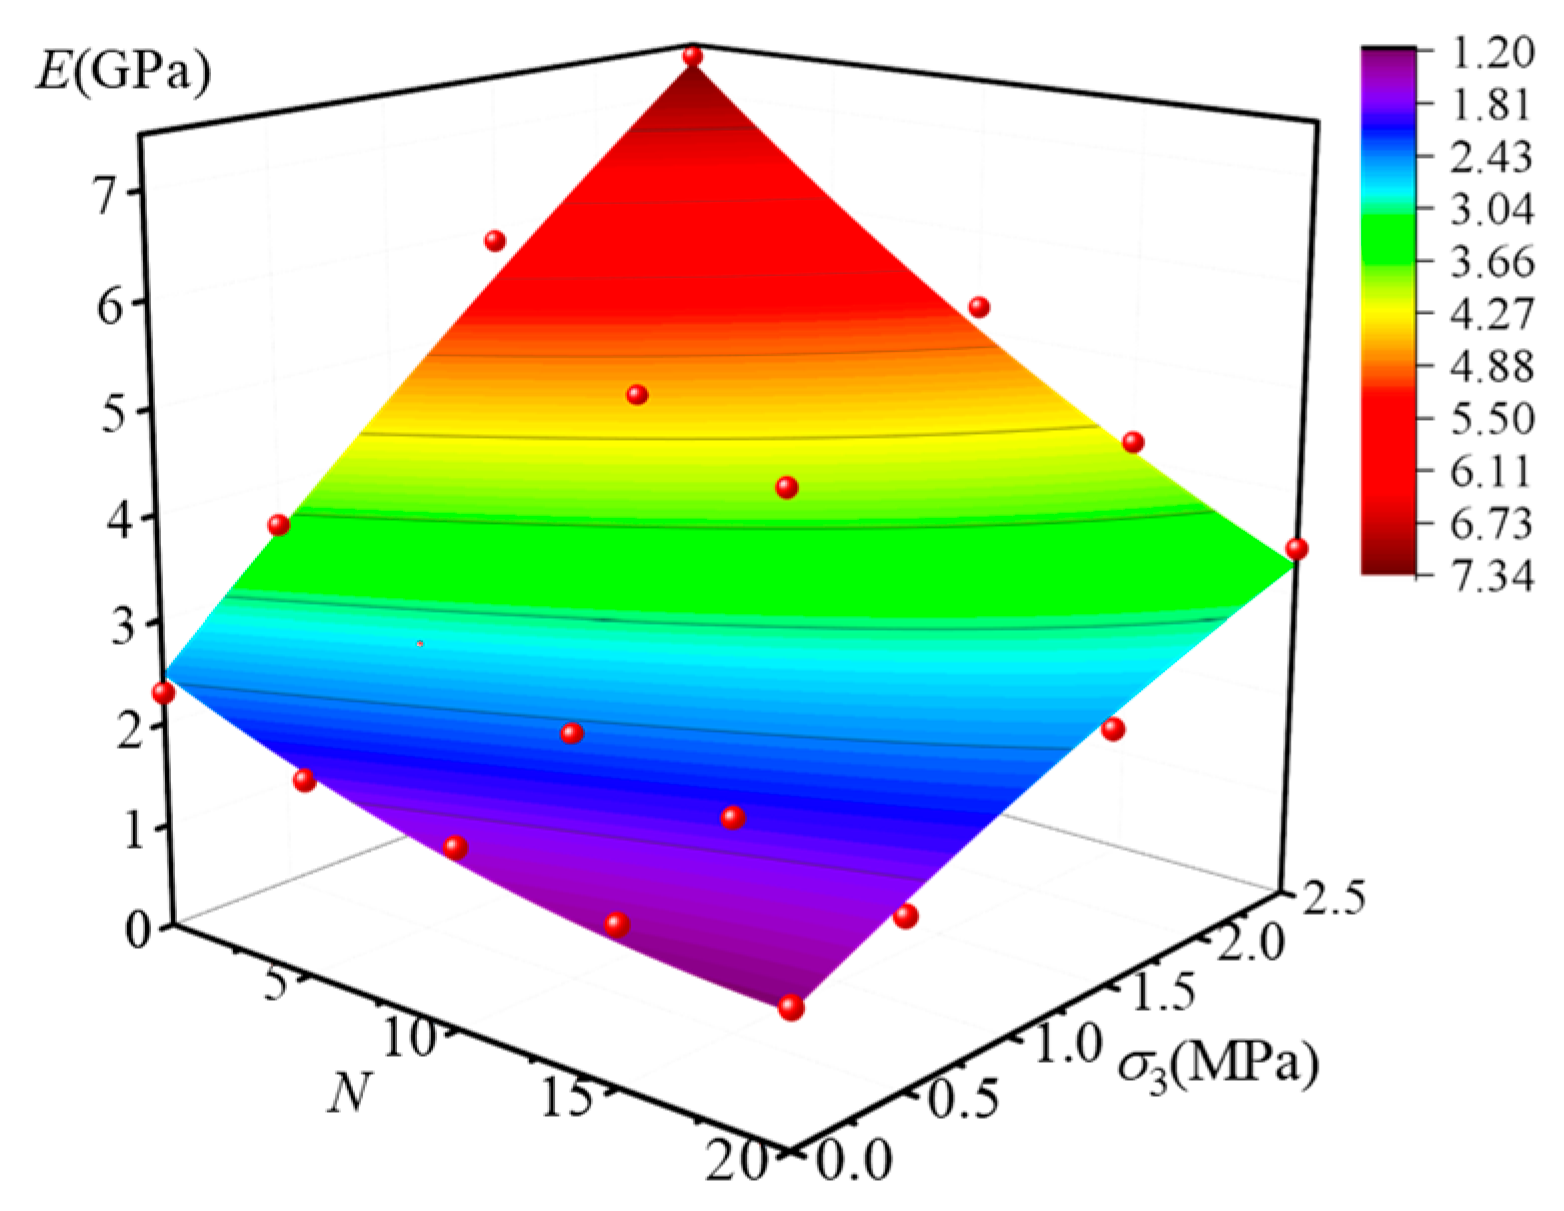
Poisson’s ratio ( ν ) and the modulus of elasticity ( E ), which is significantly influenced by the number of freeze–thaw cycles and perimeter pressure levels, are key parameters. According to the previous section, the relationship between (N, σ3) and the surface under triaxial compression is plotted as shown in Figure 19.
The surface is nonlinearly fitted using Origin 2022 software to obtain the expression of the surface in the general form:
E f ( N ) = E 1 ( A 1 N 2 + A 2 σ 3 2 + A 3 N σ 3 + A 4 N + A 5 σ 3 + A 6 ) R 2 = 0.9849
where E f ( N ) is the modulus of elasticity of the specimen under any freeze–thaw condition, GPa; E 1 is the initial modulus of elasticity of the specimen under uniaxial compression N = 0, T = 20 °C, GPa; A j is the coefficient of the surface fitting function, and its detailed values are shown in Table 3.
Assuming the axial stress in the damaged section of the rock corresponds to the specimen’s post-peak residual strength σ r e s , the stress borne by the damaged area adheres to the following relationship:
σ i = σ r e s
Substitute Equations (3) through (8) into Equation (2) in sequence. After organizing the data, the axial stress damage constitutive equation, which accounts for the influence of freezing and thawing cycles, is derived as follows:
σ 1 = ( 1 D ) E f ( N ) ε 1 + ν ( σ 2 + σ 3 ) + D σ r e s

4.2. Damage Evolution Equation

4.2.1. Establishment of Statistical Damage Evolution Equation

The study indicates that regardless of the freeze–thaw cycles, uniaxial compression of coal sandstone specimens results in a stress–strain curve with a distinct brittle drop and fluctuating ductility post-peak, with a residual strength of 0 [39,40]. In contrast, during triaxial compression tests, some specimens exhibit an instantaneous drop post-peak, while others show a gradual decline, both retaining residual strength after failure [41].To establish damage evolution equations that accurately describe the stress–strain peaks of sandstone specimens, it is essential to select an appropriate microelement strength distribution function that effectively characterizes the post-peak decline characteristics [42,43].
Research indicates that damage evolution equations based on microelement strength following a lognormal distribution effectively describe stress–strain curves with an instantaneous post-peak fall. In contrast, those based on a Weibull distribution are suited for curves with a gradual post-peak fall. However, by incorporating a modification coefficient Q into the Weibull distribution, certain academics have developed a damage evolution equation that effectively characterizes stress–strain curves with varying post-peak fall characteristics. The modified damage evolution equation and the expression for the microelement strength distribution function are provided in the literature [44,45,46].
D = 1 Q e x p F F 0 n = 1 e x p F F 0 k n e x p F F 0 n
p ( F ) = D F = n F 0 F F 0 n 1 1 + k F F 0 k 1 n exp F F 0 n 1 + F F 0 k 1 n
where the scale and shape parameters are denoted by F 0 and n , respectively; k represents the correction factor for the post-peak stress–strain curve shape; and F indicates the microstrength.
Since the rock is divided into undamaged and damaged parts, but the damaged part of the rock has already reached the post-peak yielding flow state, the definition of micro-element strength F is only applicable to the undamaged part of the rock. Assuming that the rock damage satisfies the Mohr-Coulomb yield criterion, the expression for the microelement strength F is the following:
F = ( 1 sin φ N ) σ 1 ( 1 + sin φ N ) σ 3
where φ N represents the rock’s internal friction angle for a given number of freeze–thaw cycles.
Substituting Equations (3)–(7) into Equation (12), the expression for the strength of microelement F can be obtained after collation:
F = ( 1 sin φ N ) E f ( N ) ε 1 + ν ( σ 2 + σ 3 ) ( 1 + sin φ N ) σ 3
By substituting Equations (10) and (13) into Equation (9), specific expressions for the axial stress damage constitutive equations for rocks at different numbers of freeze–thaw cycles can be obtained:
σ 1 = e x p ( 1 sin φ N ) E f ( N ) ε 1 + ν ( σ 2 + σ 3 ) ( 1 + sin φ N ) σ 3 F 0 k n e x p ( 1 sin φ N ) E f ( N ) ε 1 + ν ( σ 2 + σ 3 ) ( 1 + sin φ N ) σ 3 F 0 n E f ( N ) ε 1 + ν ( σ 2 + σ 3 ) + 1 e x p ( 1 sin φ N ) E f ( N ) ε 1 + ν ( σ 2 + σ 3 ) ( 1 + sin φ N ) σ 3 F 0 k n e x p ( 1 sin φ N ) E f ( N ) ε 1 + ν ( σ 2 + σ 3 ) ( 1 + sin φ N ) σ 3 F 0 n σ r e s

4.2.2. Solution of Damage Evolution Equation Parameters

From Equation (14), to derive the specific expressions for the damage evolution and axial stress damage constitutive equations, it is essential to first determine the scale, shape, and post-peak morphology parameters. Assuming the peak stress and peak strain at the specimen’s stress–strain curve peak are denoted as σ 1 max and ε 1 max , respectively, then Equations (9) and (10) can be obtained by the following coupling:
D ε 1 = ε 1 max = 1 exp F max F 0 n 1 + F max F 0 k 1 n = σ 1 max E f ( N ) ε 1 + ν ( σ 2 + σ 3 ) ε 1 max ν σ 2 ν σ 3 σ r e s E f ( N ) ε 1 + ν ( σ 2 + σ 3 ) ε 1 max ν σ 2 ν σ 3
Equation:
F max = ( 1 sin φ N ) σ 1 max ( 1 + sin φ N ) σ 3
At the peak point of the specimen’s axial stress–strain curve, the slope is zero, allowing for the derivation of Equation (9).
( 1 D ) E f ( N ) + σ res ν σ 2 ν σ 3 E f ( N ) ε 1 D ε 1 ε 1 = ε 1 max = 0
Substituting Equation (10) into Equation (16) gives the following:
1 = n F 0 F max F 0 n 1 1 + k F max F 0 k 1 n E f ( N ) ε 1 max + ν σ 2 + ν σ 3 σ r e s ( 1 sin φ N )
By integrating the Equation, the damage evolution and axial stress damage constitutive equations for coal sandstone subjected to varying freeze–thaw cycles can be derived from (15) and Equation (17).

5. Verification of the Accuracy of the Intrinsic Model

To validate the model’s accuracy, stress–strain curves under varying circumferential pressures, with freeze–thaw cycles of 5 and 20, were chosen for parameter fitting and verification. Table 4 presents the initial parameters for the validation model and the relative error of the results, while Figure 20 illustrates the comparison between test outcomes and theoretical model calculations.
Refer to Figure 20 for details. The stress–strain curve derived from the axial stress damage constitutive equation aligns well with experimental results. However, the pre-peak section exhibits greater fitting error compared to the post-peak section. Despite this, the error in the fitted post-peak residual strength remains within 8%, satisfying modeling requirements. The proposed damage evolution equation and axial stress damage constitutive model, accounting for freezing and thawing cycles, effectively describe the complete damage process in coal sandstone specimens under various loading conditions. They accurately capture the brittle failure, strain softening, and residual strength characteristics of this rock type.

6. Conclusions

In this study, the mechanical properties of coal sandstone under different freeze–thaw cycles and peripheral pressures were tested, and the evolution characteristics of rock strength and deformation indexes with the number of freeze–thaw cycles and peripheral pressure level were analyzed, and the evolution laws of acoustic emission parameter, crack initiation stress, and damage stress were investigated under different numbers of freeze–thaw cycles and peripheral pressure levels. The rock damage evolution equation and axial stress damage equation considering the number of freeze–thaw cycles were established, and the intrinsic nature of the freeze–thaw effect on the deformation and strength of coal sandstone was revealed from the experimental and mechanical perspectives, and the main conclusions of the study are summarized as follows:
(1)
The stress–strain behavior, elastic modulus, peak strength, and peak strain of coal sandstone under varying freeze–thaw cycles and confining pressures were analyzed. With a fixed confining pressure, increasing freeze–thaw cycles caused the post-peak response to shift from sudden to gradual decline, indicating a transition from brittle to ductile failure. Under the same freeze–thaw conditions, higher confining pressures led to linear increases in elastic modulus and peak strength, while peak strain decreased nonlinearly with a progressively slower rate. The effect of confining pressure on mechanical parameters was strongly dependent on the number of cycles: at fewer cycles, pressure reinforcement was more significant, but with more cycles, internal structural damage accumulated linearly, reducing sensitivity to confinement. Consequently, the fitted slopes of elastic modulus and strength versus confining pressure showed a linear decline, and the capacity of confining pressure to enhance strength weakened markedly at higher freeze–thaw damage levels.
(2)
The evolution of acoustic emission (AE) in coal sandstone under freeze–thaw cycles and confining pressure was investigated. Regardless of conditions, AE counts and energy exhibited three stages: quiet, low-amplitude growth, and high-amplitude growth. With increasing freeze–thaw cycles, cumulative AE counts and energy, as well as crack initiation and damage thresholds, decreased, indicating lower stress levels were required for crack initiation and unstable growth, and the material’s deformation resistance and strength weakened. In contrast, higher confining pressure delayed cracking and raised thresholds. Notably, the ratios of crack initiation and damage thresholds to peak stress remained within a specific range, showing these ratios are largely independent of freeze–thaw damage and confining pressure, reflecting an inherent mechanical scaling in the material’s failure process.
(3)
Considering the effects of temperature and stress coupling, a local damage model that can describe the post-peak residual strength of coal sandstone specimens was established, combined with the modified Weibull distribution function of the microelement strength, and the damage evolution equation and axial stress damage eigenstructure equation that can characterize the specimen drop were derived; the method of determining the parameters of the model was given, and the comparison between the theoretical and experimental results verified its accuracy. The comparison of theoretical and experimental results verified its accuracy and revealed the intrinsic nature of the freeze–thaw effect on the deformation and strength of coal sandstone from the mechanical point of view.

Author Contributions

Conceptualization, M.L. and F.F.; Methodology, F.Z., Z.K. and S.G.; Validation, J.D. and S.G.; Formal analysis, M.L., F.Z., B.W. and J.D.; Investigation, B.W.; Data curation, Z.K., F.F. and J.D.; Writing—original draft, M.L., Z.K. and L.C.; Writing—review & editing, M.L. and F.Z.; Visualization, L.C. and B.W.; Supervision, L.C.; Project administration, S.G. All authors have read and agreed to the published version of the manuscript.

Funding

This research was funded by the following programs: 1. Deep Earth Probe and Mineral Resources Exploration-National Science and Technology Major Project (Grant No. 2024ZD1004104). 2. National Key Research and Development Program of China (Grant No. 2023YFC3804204). 3. National Natural Science Foundation of China (Grant No. 52174090; 52474113) 4. Xinjiang Uygur Autonomous Region Science and Technology Major Program (Grant No. 2023A01002).

Institutional Review Board Statement

Not applicable.

Informed Consent Statement

Not applicable.

Data Availability Statement

The raw data supporting the conclusions of this article will be made available by the authors on request.

Conflicts of Interest

The authors declare no conflict of interest.

References

  1. Hong, Y.; Shao, Z.S.; Shi, G.B.; Dou, Y.; Wang, W.Q.; Zhang, W. Freeze-thaw effects on stability of open pit slope in high-altitude and cold regions. Geofluids 2021, 2021, 8409621. [Google Scholar] [CrossRef]
  2. Lu, X.; Qi, X.; Tian, Y.; Li, R.; Wang, Z.L.; Tu, L.X.; Zhang, Z.Y. Characterization of freeze-thaw cycle damage to mudstone in open pit in cold regions-based on nuclear magnetic resonance method. Appl. Sci. 2023, 13, 12264. [Google Scholar] [CrossRef]
  3. Liu, X.; He, T.; Yan, Y.; Meng, L.; Dong, J.; Guo, Y.; Zhou, P. Effects of axial offset and deflection on load-bearing characteristics of the permanent magnet bearing. Eng. Fail. Anal. 2023, 146, 107123. [Google Scholar] [CrossRef]
  4. Steiakakis, E.; Xiroudakis, G.; Lazos, I.; Vavadakis, D.; Bazdanis, G. Stability analysis of a multi-layered slope in an open pit mine. Geosciences 2023, 13, 359. [Google Scholar] [CrossRef]
  5. Zheng, M.; Li, S. A non-linear three-dimensional failure criterion based on stress tensor distance. Rock Mech. Rock Eng. 2022, 55, 6741–6760. [Google Scholar] [CrossRef]
  6. Cao, Y.; Xu, Z.J.; Tai, L.H.; Kong, Z.; Wu, P.; Li, C.; Mao, X.B. Experimental study on the mechanical properties and damage mechanism of saturated coal-measure sandstone in an open pit mine under the freeze-thaw effect. Appl. Sci. 2024, 14, 11381. [Google Scholar] [CrossRef]
  7. Chu, Y.P.; Zhang, D.M.; Song, S.Q.; Kai, O.Y.; Liu, F. Experimental study on the evolution of pore structure of coal samples under freeze-thaw. Phys. Fluids 2023, 35, 036602. [Google Scholar] [CrossRef]
  8. Liang, Y.T.; Guo, C.; Zhao, Y.M.; Tian, F.C.; Lu, Z.R. Multi-scale analysis of mudstone freeze-thaw damage mechanism. Environ. Earth Sci. 2024, 83, 298. [Google Scholar] [CrossRef]
  9. Ma, H.F.; Song, Y.Q.; Yang, J.K.; Zheng, J.J.; Shen, F.X.; Shao, Z.X.; Xia, Z.G. Experimental investigation on physical-mechanical behaviors and macro-micro-structural responses of lignite subjected to freeze-thaw cycles. Nat. Resour. Res. 2023, 32, 543–566. [Google Scholar] [CrossRef]
  10. Li, Y.X.; Wang, Z.B.; Cao, H.Q.; Wu, T.Y. Constitutive characteristics of rock damage under freeze-thaw cycles. Appl. Sci. 2024, 14, 4627. [Google Scholar] [CrossRef]
  11. Zhao, T.; Yang, G.; Xi, J.; Shen, Y.; Song, K. Factorial experiment study on the mechanical properties of sandstone-concrete specimens under different freeze-thaw conditions. Front. Phys. 2020, 8, 322. [Google Scholar] [CrossRef]
  12. Han, X.Z.; Sun, G.C.; Fu, H.L.; Tan, C.; Huang, Z.L.; Yin, P.; Zhang, Q.S.; Fan, W.C.; Yin, S.P. Experimental study on deformation and damage evolution of cracked red sandstone under freeze-thaw cycles. Appl. Sci. 2024, 14, 11174. [Google Scholar] [CrossRef]
  13. He, Y.; Liu, Y.; Li, J.; Fan, P.; Liu, X.; Chai, R.; Xue, L. Experimental study on the effect of CO2 dynamic sequestration on sandstone pore structure and physical properties. Fuel 2024, 375, 132622. [Google Scholar] [CrossRef]
  14. Huang, F.; Zhu, T.; Qu, Z.; Gao, X.; Zheng, A. The effect of joint inclination angle on mechanical properties of rock mass studied by model test and DEM simulation. Mech. Based Des. Struct. Mech. 2024, 52, 7122–7137. [Google Scholar] [CrossRef]
  15. Zhao, Y.; Qin, W.; Jin, A.; Wu, H.; Chen, Z. Research and analysis of the impact of the pore structure on the mechanical properties and fracture mechanism of sandstone. Mater. Today Commun. 2024, 38, 107753. [Google Scholar] [CrossRef]
  16. Chen, L.X.; Li, K.S.; Song, G.L.; Zhang, D.; Liu, C.X. Effect of freeze-thaw cycle on physical and mechanical properties and damage characteristics of sandstone. Sci. Rep. 2021, 11, 12315. [Google Scholar] [CrossRef]
  17. Deprez, M.; De Kock, T.; De Schutter, G.; Cnudde, V. A review on freeze-thaw action and weathering of rocks. Earth-Sci. Rev. 2020, 203, 103143. [Google Scholar] [CrossRef]
  18. Shi, S.; Zhu, F.; Hu, H. Investigation on the damage model of rock subjected to freeze-thaw cycles considering its fracture voids compaction. Cold Reg. Sci. Tech. 2024, 223, 104222. [Google Scholar] [CrossRef]
  19. Shu, J.; Deng, Z.; Huang, J.; Wu, B.; Zhang, X.; Ai, H. Stability deterioration analysis of toppling dangerous rock mass under the combined effect of vibration and freeze-thaw cycles. KSCE J. Civ. Eng. 2024, 28, 1729–1738. [Google Scholar] [CrossRef]
  20. Abdolghanizadeh, K.; Hosseini, M.; Saghafiyazdi, M. Effect of freezing temperature and number of freeze-thaw cycles on mode i and mode II fracture toughness of sandstone. Theor. Appl. Fract. Mech. 2020, 105, 102428. [Google Scholar] [CrossRef]
  21. Li, H.; Wu, Z.; Liu, S.; Gu, C.; Zhang, X.; Xu, P.; Zhang, L.; Meng, J.; Hao, Z. Rock fracturing mechanism and arrangement of fracturing holes using hydro-mechanical splitters. Eng. Fract. Mech. 2024, 301, 110055. [Google Scholar] [CrossRef]
  22. Cao, J.; Hu, J.; Wang, X.; Yang, Y.; Xia, Z.; Wang, H.; Yang, B. Numerical simulation of the meso-mechanical properties of double cruciform fissures rocks after freeze-thaw cycles. Comput. Part. Mech. 2025, 12, 1549–1564. [Google Scholar] [CrossRef]
  23. Gang, M.; Nonaka, S.; Utashiro, K.; Kodama, J.; Nakamura, D.; Fujii, Y.; Fukuda, D.; Wang, S. Impacts of frost heave susceptibility and temperature-changing conditions on freeze-thaw deterioration of welded tuffs. Cold Reg. Sci. Tech. 2024, 225, 104270. [Google Scholar] [CrossRef]
  24. Li, M.; Yu, H.; Zhang, J.Z.; Lin, G.; Zhang, L.Y.; Chen, Y.L.; Zhu, F.Q.; Mao, Y.W.; Chen, H.; Ding, Z.B.; et al. Study on dynamic mechanical response characteristics and fracture energy dissipation mechanism of sandstones with different saturations under real-time low temperature. Geomech. Geophys. Geo-Energy Geo-Resour. 2023, 9, 77. [Google Scholar] [CrossRef]
  25. Cao, H.; Zhu, D.; Bao, T.; Sun, P.; Li, J.; Erneste, H. Applicability of rock damage model based on power law distribution. Acta Geophys. 2024, 72, 3021–3036. [Google Scholar] [CrossRef]
  26. Liang, H.; He, M.; Zhao, H.; Zhang, Y.; Lu, Q.; Hao, S.; Gong, Z.; Guan, H. A macro-meso damage coupling rock mass damage model based on improved internal crack analysis. PLoS ONE 2025, 20, e0326786. [Google Scholar] [CrossRef]
  27. Li, T.; Liu, F.; Shan, K.; Zhu, H.; Liao, Z. Numerical and experimental study of fracture evolution in layered sandstone and mudstone above the cavity. Environ. Earth Sci. 2024, 83, 347. [Google Scholar] [CrossRef]
  28. Shi, S.; Zhu, F.J.; Zhu, J.C. Investigation on damage creep constitutive model of rock under the coupled effect of freeze-thaw cycles and loading. Fatigue Fract. Eng. Mater. Struct 2024, 47, 1281–1299. [Google Scholar] [CrossRef]
  29. Xiao, C.; Yang, R.; Zhao, Z.; You, S.; He, S.; Zhang, Y. Blasting damage control of slit charge structure. Mech. Adv. Mater. Struct. 2024, 31, 6848–6862. [Google Scholar] [CrossRef]
  30. GB/T50266-2013; Standard for Test Methods of Engineering Rock Mass. Available online: https://www.chinesestandard.net/PDF/English.aspx/GBT50266-2013 (accessed on 10 September 2025).
  31. Jia, Z.Q.; Xie, H.P.; Zhang, R.; Li, C.B.; Wang, M.; Gao, M.Z.; Zhang, Z.P.; Zhang, Z.T. Acoustic emission characteristics and damage evolution of coal at different depths under triaxial compression. Rock Mech. Rock Eng. 2020, 53, 2063–2076. [Google Scholar] [CrossRef]
  32. Liang, B.; Yang, G.S.; Yu, J.J. Study on acoustic emission and damage mechanical properties of freeze-thaw sandstone under uniaxial compression. Geofluids 2022, 2022, 3961317. [Google Scholar] [CrossRef]
  33. Wang, C.Y.; You, R.; Lv, W.Y.; Sui, Q.R.; Yan, Y.H.; Zhu, H.J. Damage evolution and acoustic emission characteristics of sandstone under freeze-thaw cycles. ACS Omega 2024, 9, 4892–4904. [Google Scholar] [CrossRef]
  34. Feng, Q.; Hou, S.J.; Liu, W.W.; Zhang, S.; Li, W.S.; Tian, M.L. Study on the simulation method and mesoscopic characteristics of rock freeze-thaw damage. Comput. Geotech. 2023, 153, 105038. [Google Scholar] [CrossRef]
  35. Feng, Q.; Jin, J.C.; Zhang, S.; Liu, W.W.; Yang, X.X.; Li, W.T. Study on a damage model and uniaxial compression simulation method of frozen-thawed rock. Rock Mech. Rock Eng. 2022, 55, 187–211. [Google Scholar] [CrossRef]
  36. Li, J.L.; Zhou, K.P.; Liu, W.J.; Zhang, Y.M. Analysis of the effect of freeze-thaw cycles on the degradation of mechanical parameters and slope stability. Bull. Eng. Geol. Environ. 2018, 77, 573–580. [Google Scholar] [CrossRef]
  37. Liu, Y.; Meng, X.Z.; Zhang, H.M.; Shen, Y.J. Correction method of mohr-coulomb strength criterion for rock based on freeze-thaw and residual effects. Sci. Rep. 2024, 14, 31005. [Google Scholar] [CrossRef] [PubMed]
  38. Yang, P.J.; Miao, S.J.; Li, K.S.; Shang, X.F.; Li, P.L.; Cai, M.F. The fractal dimension, structure characteristics, and damage effects of multi-scale cracks on sandstone under triaxial compression. Fractal Fract. 2025, 9, 51. [Google Scholar] [CrossRef]
  39. Liang, M.; Miao, S.; Cai, M.; Huang, Z.; Yang, P. A damage constitutive model of rock with consideration of dilatation and post-peak shape of the stress-strain curve. Chin. J. Rock Mech. Eng. 2021, 40, 2392–2401. [Google Scholar]
  40. Lan, Y.W.; Gao, H.M.; Zhao, Y.L. Pore structure characteristics and strength variation of red sandstone under freeze-thaw cycles. Materials 2022, 15, 3856. [Google Scholar] [CrossRef]
  41. Zhou, Z.J.; Zhan, H.C.; Hu, J.Y.; Ren, C.N. Characteristics of unloading creep of tuffaceous sandstone in east tianshan tunnel under freeze-thaw cycles. Adv. Mater. Sci. Eng. 2019, 2019, 7547564. [Google Scholar] [CrossRef]
  42. Cai, X.; Zhou, Z.L.; Tan, L.H.; Zang, H.Z.; Song, Z.Y. Fracture behavior and damage mechanisms of sandstone subjected to wetting -drying cycles. Eng. Fract. Mech. 2020, 234, 107109. [Google Scholar] [CrossRef]
  43. Li, J.L.; Zhu, L.Y.; Zhou, K.P.; Chen, H.; Gao, L.; Lin, Y.; Shen, Y.J. Non-linear creep damage model of sandstone under freeze-thaw cycle. J. Cent. South Univ. 2021, 28, 954–967. [Google Scholar] [CrossRef]
  44. Shi, Z.M.; Li, J.T.; Wang, J.; Chen, J.C.; Lin, H.; Cao, P. Experimental and numerical study on fracture characteristics and constitutive model of sandstone under freeze-thaw-fatigue. Int. J. Fatigue 2023, 166, 107236. [Google Scholar] [CrossRef]
  45. Yang, X.B.; Cheng, H.M.; Hou, X.; Nie, C.G.; Lv, J.Q. Research on characteristic stress and constitutive equation of confined sandstone during damage evolution based on energy evolution analysis. Adv. Mater. Sci. Eng. 2019, 2019, 4145981. [Google Scholar] [CrossRef]
  46. Zhang, Y.; Wu, X.; Guo, Q.F.; Zhang, Z.H.; Cai, M.F.; Tian, L.M. Research on the mechanical properties and damage constitutive model of multi-shape fractured sandstone under hydro-mechanical coupling. Minerals 2022, 12, 436. [Google Scholar] [CrossRef]
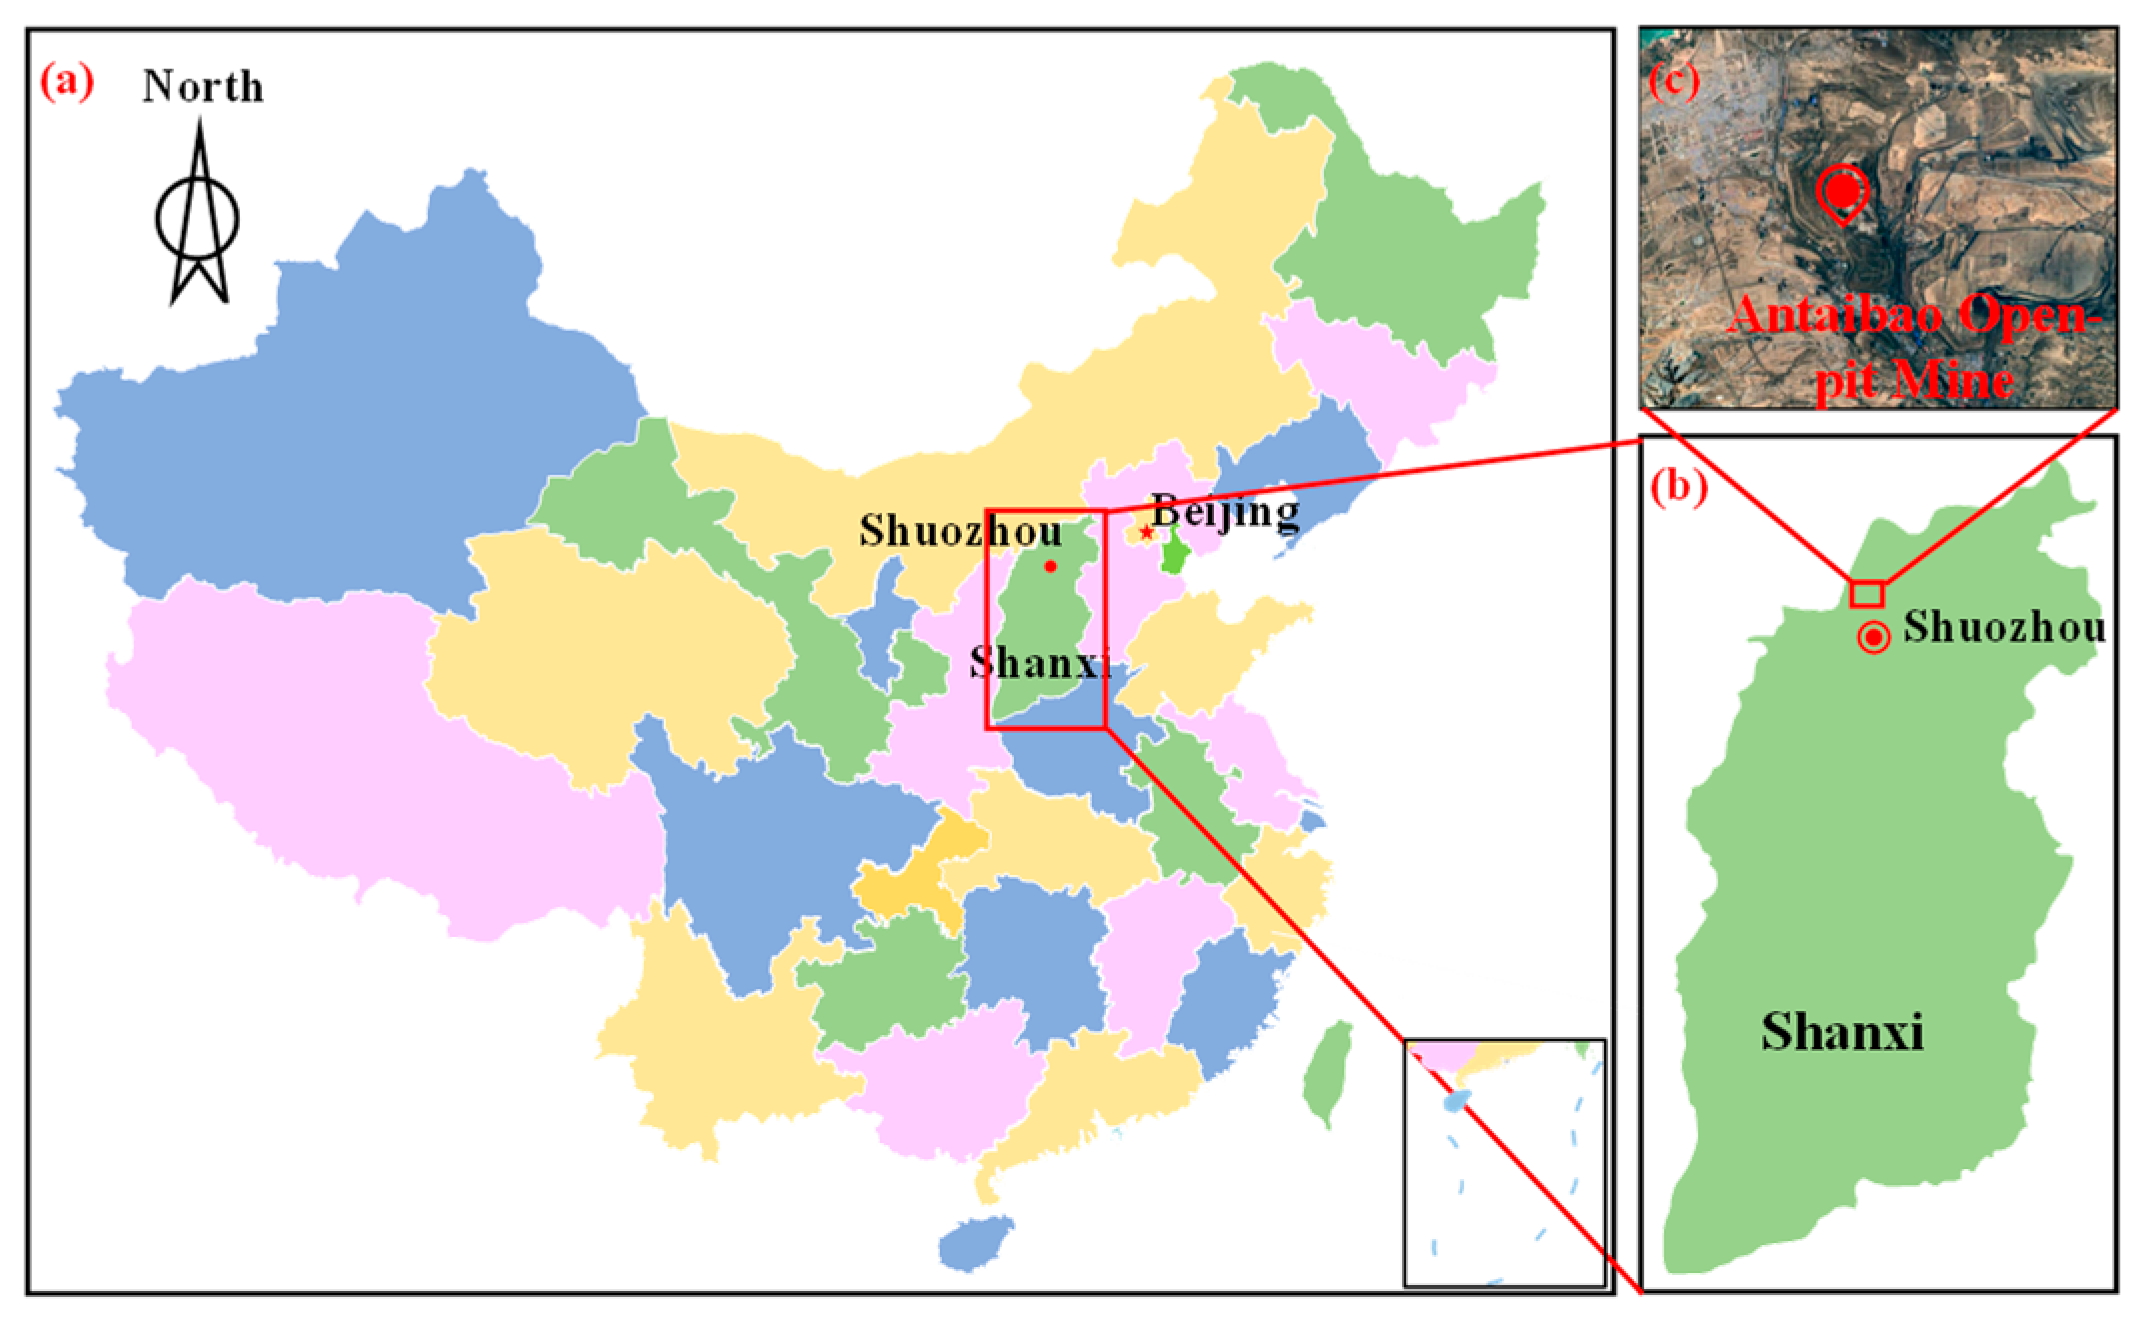
Figure 1. Specimen sampling locations.
Applsci 15 10021 g001
Figure 2. Temperature cycling control curves in freeze–thaw cycle test.
Applsci 15 10021 g002
Figure 3. Experimental equipment and flow chart.
Applsci 15 10021 g003
Figure 4. Stress–strain relationship curves of specimens with different N and σ3.
Applsci 15 10021 g004
Figure 5. Variation rule of specimen elastic modulus E with N and σ3.
Applsci 15 10021 g005
Figure 6. Change pattern of the slope of the fitted curve with N.
Applsci 15 10021 g006
Figure 7. Law of change in peak strength σc with σ3 under different N.
Applsci 15 10021 g007
Figure 8. Slope of the fitted curve with N change rule.
Applsci 15 10021 g008
Figure 9. Law of variation in peak strain εc with σ3 for specimens with different N.
Applsci 15 10021 g009
Figure 10. Typical acoustic emission parameter characterization methods.
Applsci 15 10021 g010
Figure 11. Acoustic emission characterization methods for crack initiation and damage thresholds.
Applsci 15 10021 g011
Figure 17. Histogram of σCI versus σCD changes at different σ3 and N.
Applsci 15 10021 g017
Figure 18. Schematic diagram of the rock force damage model.
Applsci 15 10021 g018
Figure 19. Surface plot of (N, σ3) versus elastic modulus E.
Applsci 15 10021 g019
Figure 20. Comparison between experimental and theoretical model calculation results.
Applsci 15 10021 g020
Table 1. The fundamental physical parameters of the specimens.
SamplesNatural Density
(kg/m3)
Dry Density
(kg/m3)
Porosity
(%)
Natural Water Content
(%)
Saturated Water Content
(%)
Coal sandstone2437.02417.111.140.8973.161
Table 2. σCI versus σCD and its ratio to σc at different σ3 and N.
N σ 3
(MPa)
σ C I
(MPa)
σ C D
(MPa)
σ c
(MPa)
σ C I / σ c σ C D / σ c
00.512.1622.3425.5647.562%87.416%
01.515.1130.8932.0647.132%96.338%
02.522.6245.8546.4648.685%98.672%
50.58.6118.0918.2847.073%98.933%
51.513.5029.3330.0744.895%97.522%
52.514.1936.4645.1931.401%80.683%
100.55.9117.8118.2232.409%97.722%
101.510.6928.2829.1636.660%96.982%
102.514.2336.2836.8138.644%98.547%
150.55.3815.5515.9533.730%97.492%
151.58.7523.2327.9831.272%83.024%
152.59.5023.8728.0233.887%85.189%
200.54.8915.6415.7730.977%99.144%
201.56.1418.8318.9532.401%99.367%
202.58.1018.9921.2838.040%89.262%
Table 3. Coefficients of the surface fitting function.
FormulasVariantA1A2A3A4A5A6
(7)(N, σ 3 )1.30 × 10⁻³−3.77 × 10⁻²−2.41 × 10⁻²−5.25 × 10−20.9371.079
Table 4. Relative error of initial assignment parameters and calculation results of theoretical model.
N σ 3
(MPa)
Damage Modeling ParametersGoodness-of-Fit R2
F 0 n k
50.529.425.102.720.98
1.535.985.2810.650.98
2.046.1019.201.000.99
200.519.884.413.960.97
1.522.357.154.210.97
2.030.5318.090.230.98
Disclaimer/Publisher’s Note: The statements, opinions and data contained in all publications are solely those of the individual author(s) and contributor(s) and not of MDPI and/or the editor(s). MDPI and/or the editor(s) disclaim responsibility for any injury to people or property resulting from any ideas, methods, instructions or products referred to in the content.