Article

Advancing Wastewater Surveillance: Development of High-Throughput Green Robotic SPE-UPLC-MS/MS Workflow for Monitoring of 27 Steroids and Hormones

1
RASID Laboratory of Abu Dhabi Quality & Conformity Council (ADQCC) & M42 Environmental Sciences, Abu Dhabi P.O. Box 853, United Arab Emirates
2
Abu Dhabi Quality and Conformity Council, Abu Dhabi P.O. Box 853, United Arab Emirates
*
Author to whom correspondence should be addressed.
These authors contributed equally to this work.
Appl. Sci. 2025, 15(18), 10012; https://doi.org/10.3390/app151810012
Submission received: 28 July 2025 / Revised: 2 September 2025 / Accepted: 8 September 2025 / Published: 12 September 2025
(This article belongs to the Special Issue Industrial Chemical Engineering and Organic Chemical Technology)

Abstract

Conventional methods for testing steroids and hormones (SHs) in environmental samples are exhaustive, complex, and score poorly in sustainability matrices. Therefore, this study evaluates the automated sample preparation approach using the modular Biomek i7 Workstation for the analysis of 27 SHs in wastewater. Method development involved optimizing Ultra Performance Liquid Chromatography–Tandem Mass Spectrometry (UPLC-MS/MS) parameters, preparing wastewater matrix blank, and assessing extraction efficiency using three solid phase extraction (SPE) cartridges. Extraction efficiency trials showed suitability in the order of Hydrophilic–Lipophilic Balance (HLB) > Mixed-Mode Cation Exchange (MCX) > Mixed-Mode Anion Exchange (MAX). The method demonstrated specificity for all targeted SHs, with Cholesterol showing a maximum interfering peak of 17.71% of the quantification limit (LOQ). The method met matrix effect tolerance of ±20% for 26 SHs, while Epi Coprostanol (34.92%) showed signal enhancement >20%. The 8-point calibration curve plotted using automated extraction demonstrated acceptable linearity across the tested range. Spiked studies at low (LQC), middle (MQC), and higher (HQC) quality control (QC) levels (n = 6, repeated on three separate occasions) demonstrated % RSD values within 20% and recoveries ranging from 71.54% to 115.00%. The method met validation criteria, showing reliability in Intra-Laboratory Comparison (ILC) and Blind Testing (BT). The method outperformed the conventional approach in greenness assessment (Complex Modified Green Analytical Procedure Index) and practicality evaluation (Blue Applicability Grade Index), offering an effective and sustainable protocol for environmental testing laboratories.

1. Introduction

The occurrence of both natural and synthetic endocrine-disrupting chemicals (EDCs) in the environment has emerged as an important topic of concern in environmental science and policymaking [1]. EDCs are substances that interfere with the body’s hormonal system, disrupting the regulation of various physiological functions [2]. The EDCs encompass several classes of compounds; however, steroids and hormones (SHs) belonging to the broader category of pharmaceuticals are among the most prevalent owing to their extensive use as active ingredients for diagnostic purposes [3]. Compounds from classes of SHs such as androgens, estrogens, progestins, and sterols are extensively used in pharmaceuticals and supplements for contraceptive, hormone therapy, menopause management, and Cholesterol control [3]. Synthetic estrogens are of particular concern due to their potent biological activity and widespread use. Beyond contraceptive applications, they are used therapeutically for menopausal symptom management and in treating hormone-dependent cancers like breast and prostate cancer [4,5]. A well-known example is the synthetic estrogen 17α-ethinylestradiol (EE2), widely used in hormone replacement therapy and as oral contraceptive [6].
SHs, due to their extensive use, are released into the environment through wastewater effluents, biosolid applications, and industrial discharges leading to the contamination of rivers, lakes, and oceans [6]. Research over the last decades has shown that several steroidal EDCs are commonly detected in rivers and surface waters, especially where significant wastewater is discharged. Detected concentrations of these compounds typically range from nanograms per Liter (ng/L) to micrograms per Liter (µg/L) [1,5]. Natural and synthetic androgens constitute approximately 96% of total steroidal hormones detected in wastewater treatment plant effluents, with reported concentrations of androsterone (2977.0 ng/L), epiandrosterone (640.0 ng/L), and androstenedione (270.0 ng/L) [7,8,9,10]. Commonly reported steroids and hormones in surface waters include androgens, estrogens, growth hormones, progesterone, and glucocorticoids. Concentrations have been reported in the range of 0.06–84.00 ng/L for androgens, 0.10–196.00 ng/L for estrogens, 26.60 ng/L to 100.00 ng/L for growth hormones, 0.10–439.00 ng/L for progesterone, and 0.10–433.00 ng/L for glucocorticoids [1]. In North America, groundwater samples have shown estrogen concentrations reaching up to 79.0 ng/L for estrone (E1), 147.0 ng/L for estradiol (E2), 1745.0 ng/L for estriol (E3), and 230.0 ng/L for ethinylestradiol (EE2). In Europe, reported estrogen levels in aquatic environments range from 0.02 to 100.00 ng/L [7,11,12]. Notably, testosterone has been detected at elevated concentrations in surface and drinking waters in countries such as China (up to 480.0 ng/L) and Brazil (up to 330.0 ng/L) [7].
The presence of SHs in water sources is concerning, as even low-level exposures have been linked to feminization, hermaphroditism, cancers, metabolic diseases, and behavioral alterations, impacting aging and causing reproductive and developmental abnormalities in both wildlife and humans [1,3,5,13,14]. Their persistence in the environment poses significant ecological risks [1]. One of the most pressing concerns related to environmental pollution is the impact of endocrine-disrupting SHs on aquatic ecosystems [2]. Numerous studies have linked these micropollutants to significant ecological consequences, particularly for aquatic organisms. Naturally occurring estrone (E1), 17β-estradiol (E2), and estriol (E3) were reported to alter oogenesis in female fish and induce the production of vitellogenin in male fish [6]. Additionally, β-sitosterol, a plant-derived natural sterol, has been linked to reproductive dysfunction in fish and endocrine and metabolic effects in European skunks [2]. Testosterone is one of the most well-known androgen hormones. Notably, synthetic androgens are the main component of most of the performance-enhancing drugs and are also used to treat testosterone deficiency [15]. In veterinary medicine and zootechny, synthetic hormones are also used to treat cows and mares with reproductive system abnormalities, synchronize estrus, and prepare donor and receptor animals for embryo transfer [16]. Additionally, they are provided to animals as growth promoters, enhancing feed efficiency [17]. Eventually, they are all excreted as endogenous hormones released by both humans and animals and make their way into the wastewater system.
Currently some SHs (17alpha-estradiol, Equilenin, Equilin, 17-beta estradiol, Estriol, Estrone, 17-alpha ethynyl estradiol, Mestranol, and Norethindrone) are listed on the U.S. EPA Contaminants Candidate List (CCL 4), indicating their presence in public water systems [18]. A major source of environmental contamination with SHs is domestic and industrial wastewater, which is a complex matrix, with variability depending on location, time, and season. Accurate and large-scale analysis of wastewater for these micropollutants is needed to safeguard human and environmental health. For many years, the environmental determination of steroids and hormones was dominated by radio immunoassays; however, radioimmunoassays may overestimate estrogen levels due to lack of selectivity [5,19,20,21,22]. Further, current conventional methods typically analyze a narrow range of steroidal hormones and often require large wastewater volumes (250–1000 mL) and solvent volumes (100–350 mL) for sample preparation. Also, these GC-based methods are labor-intensive, requiring derivatization and multiple complex steps [23].
Conventional methodologies, such as U.S. EPA 1698/2007, require substantial sample processing steps including extraction, purification, macro evaporation, concentration, and derivatization, which restrict their practicality for large-scale, high-frequency monitoring initiatives [20,24]. Although conventional methods are highly effective for the detection of steroids and hormones in environmental matrices, their application poses notable sustainability concerns. The approach depends extensively on the use of a large quantity of sample processing volumes and toxic organic solvents such as methylene chloride, acetone, hexane, and pyridine. These compounds contribute to air emissions, pose occupational safety risks, and require stringent hazardous waste disposal protocols [6]. The methodology also involves energy-demanding steps like prolonged Soxhlet extraction (up to 24 h) and high-temperature glassware treatment (300–500 °C) for cleaning, leading to poor energy efficiency [6]. Furthermore, the use of N,O-bis (trimethylsilyl) trifluoroacetamide with 1% trimethylchlorosilane (BSTFA: TMCS; 99:1) for derivatization is essential for improving analyte ionization in gas chromatography–high-resolution mass spectrometry (GC-HRMS), which introduces additional hazards [20]. This reagent is flammable, highly moisture-reactive, and corrosive. These limitations reduce the method’s alignment with green chemistry principles and make it less suitable for sustainable high-throughput monitoring of environmental samples. Further, the derivatization procedures employed are affected by many parameters and types of SHs and it can be difficult to maintain the stability of the derivatized moiety [13,24,25]. The accurate detection and quantification of steroids and hormones in wastewater remains challenging.
These cumulative drawbacks highlight an urgent need for sensitive, robust, and sustainable green analytical techniques capable of handling high sample throughput, providing reliable data across a wide range of steroids and hormones. The solid-phase extraction followed by liquid chromatography–tandem mass spectrometry (SPE–LC–MS/MS) has the potential to overcome the highlighted limitations [5,6,26,27,28]. However, generic LC–MS/MS-based analysis of SHs lacks capability for high-throughput due to manual sample preparation and its applicability to a wide range of SHs. Also, these methods pose specific analytical challenges due to the wide range of the negative logarithm of the acid dissociation constant (Ka) called (pKa) and the partition coefficient (logP) values of SHs (pKa values ranging from 2.82 to 15.14 and logP values from 1.144 to 5.330), poor ionization potential (with Electrospray Ionization (ESI) source), low sensitivity, along with wastewater matrix complexity and sample stability issues [1,29]. The application of atmospheric pressure chemical ionization (APCI) with LC–MS/MS, combined with automated SPE, has the potential to address these challenges while also supporting the United Nations 2030 Agenda for Sustainable Development Goals (SDGs).
Therefore, the objective of this study was to develop a comprehensive, fully automated, high-throughput method for accurate analysis of 27 steroids and hormones including 10 natural and synthetic estrogens, 4 progesterones, 3 androgen steroids, and 10 sterols in wastewater. This study aimed to evaluate the selection of the most suitable SPE 96-well plate chemistry and preparation of matrix blank sample, and performed method validation, establishing validation by Intra-Laboratory Comparison (ILC) and Blind Testing (BT). Further, to prove method suitability for sustainability, the method was assessed for its eco-friendliness (ComplexMoGAPI) and practicality by BAGI. To the best of the authors’ knowledge, this is the first comprehensive study to develop, evaluate, and validate a fully automated method for the analysis of 27 multiclass steroids and hormones by using a much lower volume of wastewater sample (4.5 mL), while also demonstrating its environmental sustainability and practical applicability.

2. Materials and Methods

2.1. Materials and Reagents

The entire process of method development and method validation was carried out at RASID Laboratory of Abu Dhabi Quality & Conformity Council (ADQCC) & M42 Environmental Sciences, Abu Dhabi, United Arab Emirates (UAE). LC-MS-grade formic acid and ammonium fluoride were purchased from Sigma–Aldrich (Darmstadt, Germany). The MS-grade methanol (MeOH), acetonitrile (ACN), iso-propanol (IPA), ethanol, n-hexane, and ethyl acetate were purchased from Honeywell (Charlotte, North Carolina (NC), United States of America (USA)). The ASTM Type I water used was taken from Milli-Q IQ7015 (Millipore, Bedford, Massachusetts, USA). Solid-phase extraction (SPE) 6cc 500 mg cartridges (Oasis® Hydrophilic–Lipophilic Balance (HLB), Mixed-Mode Cation Exchange (MCX), and Mixed-Mode Anion Exchange (MAX)) used for blank control sample preparation were purchased from Waters (Milford, MA, USA). The Oasis® HLB, MAX, MCX 96-well 60 µm (60 mg) plates were purchased from Waters (Milford, MA, USA) to be used for checking extraction efficiency and the selection of suitable chemistry to efficiently extract SHs from wastewater.
Reference standard solutions of all targeted 27 molecules with their 11 isotopically labeled internal standards (IS) were purchased from LGC Standards (Teddington, Middlesex, UK) and Sigma–Aldrich (Darmstadt, Germany). All the analytes were categorized into five groups based on instrument sensitivity and detection levels in wastewater. Standard stock solutions were prepared by using methanol, acetonitrile, and ethanol based on their solubility and stability. The stock solution of Cholesterol standard was prepared in methanol/ethanol (90:10) for better solubility. Intermediate Mix (IM) standard solutions were prepared at 1 µg/mL (group 1), 5 µg/mL (group 2), 50 µg/mL (group 3), 100 µg/mL (group 4), and 200 µg/mL (group 5) in methanol after applying the correction for the form (salt) and purity (%) of CRMs. Further, these IM standard solutions were used to prepare the working calibration standards and quality control samples by spiking them in screened wastewater matrix blank. The mixture of deuterated internal standards working solution (5 µg/mL) was prepared in methanol and spiked at a fixed concentration (0.5 µg/mL) before sample extraction. All standards and solutions were packed properly and stored in the dark at −20 °C.

2.2. Instrumentation

The Hamilton Microlab STAR M (Bonaduz, Graubünden, Switzerland) robotic system was used for aliquoting test portions of 100 wastewater samples collected from various locations. The Hamilton robotic system was equipped with a 4-channel pipette tool, auto decapper, and tube carriers for 50 mL and 15 mL centrifuge tubes. The aliquoting process was carried out using a pre-programmed method via the Venus 4 software.
Automated 96-well plate SPE was performed using the Biomek i7 Workstation (Indianapolis, IN, USA) equipped with an 8-channel pipetting tool, alps for placing SPE 96-well plates, reservoirs, elution plates, and tube racks to load the sample tubes. The Modular Biomek i7 workstation was equipped with a positive-pressure ALP Amplius extractor to perform SPE, a Thermo Fisher Multidrop Combi dispenser with guided selection valve to perform the SPE volume dispensing steps, and an a4S 4titude® automated role heat sealer to seal the elution plates. The complete instrument setup was controlled by the pre-programmed Biomek method launcher software (version 5.1). After the addition of ISTD, samples were vortexed using Benchmark® Bench mixer multi-tube vortexer (Benchmark Scientific, Sayreville, NJ, USA).
Data were acquired using a Waters Acquity UPLC® I-Class Plus system equipped with a binary pump, vacuum degasser, temperature-controlled autosampler with Flow-Through Needle (FTN) functionality, and column oven. The system was coupled to a tandem quadrupole mass spectrometer (Xevo TQ-XS, Waters Corporation, Manchester, UK) fitted with a Z-spray APCI source operating in both positive- and negative-polarity switching modes.

2.3. Outlines of Method Optimization and Validation

MRM method optimization was performed by infusing individual CRMs of the targeted 27 SHs and 11 internal standards (ISTDs). The optimized UPLC chromatographic method was used to finalize the column and mobile phase compositions. The extraction efficiency was evaluated using three different 96-well plate SPE cartridges (HLB, MAX and MCX) to compare targeted analytes’ elution profiles and extraction efficiencies. The initial sample extraction protocol was optimized using manual negative-pressure SPE manifold in ASTM Type I water and then in wastewater matrix. Manually optimized SPE protocol was transferred to the Biomek i7 automated sample preparation workstation. The fitness for purpose of the automated extraction protocol was evaluated by validating it on LC-MS/MS against standard validation parameters [30]. Measurement Uncertainty (MU) was calculated at the targeted limit of quantification (LOQ) using international guidelines JCGM 100:2008 and EURACHEM/CITAC Guide CG 4 [31,32,33]. The accuracy of the validated method was further proved by participating in Intra-Laboratory Comparison (ILC) and Blind Testing (BT) as per ISO/IEC17025:2017, clause no. 7.7.1 j and k, respectively [34]. The method greenness and practicability were evaluated by using online software tools like Complex MoGAPI (bit.ly/ComplexMoGAPI (accessed on 19 December 2024)) and BAGI (https://mostwiedzy.pl/en/justyna-plotka-wasylka,647762-1/BAGI (accessed on 19 December 2024, git.pg.edu.pl/p174235/bagi)) [35,36].

2.4. Mass Spectrometric and Liquid Chromatographic Method Optimization

Mass spectrometric method optimization was initiated by tuning individual SHs, including internal standards, on XEVO TQ-XS mass spectrometer with an APCI source of ionization. Tuning solutions were made for individual CRMs at 100 µg/L. Tuning parameters including corona pin voltage, cone voltage (CV), and collision energy (CE) were optimized for each analyte by infusing the tuning solution in combined mode (tuning solution combined with mobile phase). For initial trials three to four product ions were selected due to high matrix variability of wastewater samples, then quantifier and qualifier ions were accurately selected for each analyte to achieve better specificity and sensitivity. The segmented MRM method was created based on the Retention Times of analytes to achieve a minimum of 12 points per peak for all MRM channels. The MRM method was created with the polarity switching mode for both positive (+Ve) and negative ionization modes (−Ve) simultaneously. The optimized corona pin voltage was 3.0 kV for positive-mode ionization and 2.8 kV for negative-mode ionization. Nitrogen was used as the auxiliary and cone gas, while argon was used as the collision gas. The optimized cone and collision gas flow rates were 150 L/h and 1.5 mL/min., respectively. The source and APCI Probe temperatures were set at 500 °C, with a desolvation gas flow of 1000 L/h and a nebulizer gas pressure of 7.0 bar.
The developed MRM method using direct infusion without chromatography was evaluated on an X Bridge premier BEH C18 column, 2.5 μm × 2.1 mm × 100 mm, using Waters ACQUITY UPLC I Class Plus system with XEVO TQ-XS mass spectrometer (Waters Corporation, Manchester, UK). The mobile phase composition was optimized through multiple trials with varying buffer strengths and organic modifiers to ensure effective ionization and sensitivity for both positively and negatively charged molecules. To optimize chromatographic conditions, a 100 µg/L sample in wastewater and reagent water was used to check matrix interferences and separation. All 27 targeted analytes along with their internal standards (ISTDs) were eluted between 2.2 and 7.87 min. The remaining 5.13 min of runtime was utilized for comprehensive column washing and equilibration before and after the elution of all analytes to ensure the system was ready for subsequent injections.

2.5. Wastewater Matrix Blank Preparation Protocol

One of the most limiting factors in the analysis of routine wastewater samples was the absence of true blank wastewater, as commonly prescribed pharmaceuticals are ubiquitously present in wastewater samples [37]. A review of the existing literature and standard methodologies highlights a predominant reliance on ASTM Type I water or controlled water for preparing linearity and quality-control samples [24]. However, plotting a calibration curve using ASTM Type I water can affect the accuracy of quantified results due to the matrix effect arising from diverse wastewater matrix compositions collected from different locations. Without a procedural calibration curve, matrix effect correction and absolute recovery calculation from wastewater samples are required. However, performing it for routine analysis is not practical and could result in errors. To overcome this, a matrix blank or representative wastewater sample was prepared by randomly mixing real-time wastewater samples from 100 distinct locations and passing them through a cartridge. This approach aims to prepare the closest possible matrix blank sample.
From the 100 wastewater samples collected across distinct locations, four 500 mL samples were randomly selected and combined to prepare a 1.5 L blank matrix for the initial screening. Three types of solid-phase extraction (SPE) cartridges, HLB, MAX, and MCX (6cc, 500 mg), were used, enabling a three-tier selective mechanism that incorporates reverse-phase anion exchange and cation exchange to effectively remove SHs from wastewater. HLB cartridges were used to remove mid-polar to non-polar SHs which are neutral in nature; MAX cartridges were used to bind anionic SHs; and MCX cartridges were used to bind cationic SHs. These cartridges were stacked sequentially in the order MAX (top), MCX (middle), and HLB (bottom) using cartridge-holding adapters. The stacked cartridges were conditioned with 10 mL of methanol and equilibrated with 10 mL of ASTM Type I water. Then, 1.5 L of pooled wastewater sample was slowly passed through the cartridges, with the effluent collected at the bottom in polypropylene bottles and stored at 2–8 °C. After each 200 mL wastewater sample was loaded, the cartridges were washed twice with 10 mL of methanol and then re-equilibrated with 20 mL of ASTM Type I water.

2.6. Evaluation of SPE Cartridges for Extraction Efficiency

The solid-phase extraction efficiency was evaluated using three different 96-well plate SPE cartridges to compare their elution profiles and extraction efficiencies. The three types of SPE cartridges selected (HLB, MCX and MAX) were preconditioned with 1 mL methanol. Further, cartridges were equilibrated with 1 mL of ASTM Type I water (HLB), 1 mL of 2% formic acid in water (MCX), and 1 mL of 5% ammonium hydroxide in water (MAX). Screened wastewater samples spiked at MQC level (n = 4) were passed through all three types of cartridges. All three types of cartridges were washed with the corresponding solvents: 1.0 mL of 10% methanol in ASTM Type I water (HLB), 1 mL of 2% formic acid in water (MCX), and 1 mL of 5% ammonium hydroxide in water (MAX). The cartridges were dried under vacuum for 10 min at 1000 mbar, and analytes were eluted with 1 mL of elution solvents: Ethyl acetate/n-hexane (70:30 v/v) for HLB, 2% formic acid in methanol/acetonitrile (70:30 v/v) for MAX, and 5% ammonium hydroxide in methanol/acetonitrile (70:30 v/v) for MCX. The eluents were reconstituted with 500 µL of ASTM Type I water, vortex-mixed, and analyzed via LC-MS/MS.

2.7. Sample Extraction Automation

Sample preparation was automated using Biomek i7 Workstation, equipped with an automated 8-channel pipetting robotic arm, positive-pressure SPE extractor, and Multidrop Combi. The process of sample extraction begins with the user placing SPE plates, solvent reservoirs, and solvents (to conduct conditioning, equilibration, washing, and elution steps) on the workstation deck as guided by the software (Figure 1). The user then selects the tubes containing the samples and controls in the software to provide the pipetting and dispensing locations to the robotics. After the above tasks, the pre-programmed HLB SPE method is selected to run the complete extraction protocol. All the reagents are dispensed into full plates using the 8-channel pipetting tools and by Multidrop Combi dispenser by using diverting valve selection through software.
Pre-centrifuged 10 mL wastewater samples were transferred to 15 mL polypropylene centrifuge tubes using a Hamilton robotics system. To these samples, 100 µL of a deuterated internal standard mix was added. Then samples, calibration controls (CCs), and quality controls (QCs) were mixed thoroughly using a Benchmark multi-tube vortexer. The prepared samples along with CC and QC were then loaded onto the Biomek i7 Workstation for solid-phase extraction (SPE). Table 1 outlines the steps for the automated extraction of SHs in wastewater.

2.8. Estimation of Measurement Uncertainty (MU)

Measurement Uncertainty (MU) for the targeted analytes was calculated following the approach of grouping the uncertainty components into two categories, that is type A and type B. Type A uncertainty is related to the repeatability of results obtained using the automated protocol, whereas type B uncertainty pertains to factors such as standard purity and steps involving the volumetric apparatus. Calculated standard MU is converted to relative standard uncertainty (RSU) and thereafter, the square roots of the sum of squares of individual RSUs were combined to calculate the combined uncertainty. Combined uncertainty was then used to calculate expanded uncertainty using a coverage factor at a 95% confidence level [31,32,33].

2.9. Data Analysis, Calculation, and Representations

Data analysis was performed using TargetLynx (version 4.1.1.0) module of MassLynx (version 4.2). Microsoft Office 365 Excel worksheet was used for calculation of accuracy and repeatability (as % Relative Standard Deviation (RSD)) and plotting charts for data representation. The results of the extraction efficiency were statistically analyzed using Statistical Package (SPSS 30.0) software (IBM SPSS Statistics Version 30.0.0.0 (172), 2024, Armonk, NY, USA) for one-way Analysis of Variance (ANOVA). Online tools were used for evaluation of method greenness and its applicability.

2.10. Evaluation of the Method Greenness and Its Applicability

Given the growing emphasis on green chemistry principles, various approaches have been developed to assess method greenness and practicality. The proposed method was compared to the conventional U.S. EPA1698/2007 approach in terms of environmental sustainability, evaluated using the GAPI. Additionally, its suitability for high-throughput analysis was assessed with the Blue Applicability Grade Index (BAGI). GAPI is a semi-quantitative tool used to evaluate the environmental impact of analytical methods, considering stages such as sampling, sample preparation, reagents/chemicals, energy consumption, and other factors. It uses a color-coded pentagram (green, yellow, red) to indicate environmental impact. Its latest version, ComplexMoGAPI, was used to access method greenness [35]. The Blue Applicability Grade Index (BAGI) was used to assess the practicality of analytical methods, assigning scores between 25 and 100, with higher scores indicating greater practicality [36].

3. Results and Discussion

3.1. Outcome of Method Optimization

Parent and daughter ion scans were performed by infusing 100 µg/L of each analyte at 20 µL/min and mixing tuning solution with the mobile phase using the combining mode. All source-dependent and compound-dependent parameters like desolvation temperature, desolvation gas, cone gas, cone voltage (CV), and corona pin voltage were carefully optimized for better sensitivity. After selecting the parent ion, daughter ion, cone voltage, and collision energy (CE), all these ions were crosschecked for their sensitivity and specificity. As shown in Table 2, all ten analyzed steroids undergo a characteristic loss of water (H2O) during APCI following initial protonation to form [M + H − H2O]+ ions [38]. A dimilar ionization pattern was observed for four hormones (Estriol, 17 Alpha Ethinyl estradiol, Androsterone, and Desogestrel). It was observed during the mass spectrometric method development that five of the targeted hormones showed better sensitivity in negative ionization mode (Equilin, 17 Alpha dihydroequlin, 17 Beta estradiol, Estrone, and 17 Alpha estradiol) and the rest of the compounds showed better sensitivity in the positive mode of ionization. Further, it was observed that three Stereoisomers (Epi Coprostanol, Coprostanol, and Cholestanol) from the steroids class exhibited identical quantifiers and qualifier ions. The results indicated that Epi Coprostanol was chromatographically separated, whereas Coprostanol and Cholestanol were not distinctly separated. Therefore, the approach of reporting the results as the sum of Coprostanol and Cholestanol is recommended. From the group of hormones, eight isomeric pairs exhibited similar molecular weight (270 (for 17 Alpha dihydroequlin and Estrone), 272 (for 17 Beta estradiol and 17 Alpha estradiol), 288 (for Estriol and Testosterone), 310 (Mestranol and Desogestrel)), as shown in Table 2. However, all these hormones were well separated either chromatographically or by selection of distinct qualifier and quantifier ions. In the conventional mass spectrometric methodology from U.S. EPA 1698/2007, the most abundant fragment ions for the predominant trimethylsilyl (TMS- (–Si(CH3)3) group) derivative were selected. Derivatized TMS moieties of the targeted steroids and hormones come with limited stability and depend on compound chemistry, storage conditions, the sample-to-sample matrix effect, and pH. Derivatized compound moieties are unstable and upon exposure to air and moisture they degrade quickly in minutes or hours; this regenerates the original polar compound (steroid or hormone) affecting reproducibility and accuracy [24].
A major challenge observed during initial method development was the absence of interference-free wastewater samples for validation. During the initial method optimization studies, it was observed that several functional sterols (such as Cholesterol, Stigmasterol, Beta sitosterol, Campesterol, Stigmastanol, Cholestanol, Coprostanol, Epi Coprostanol, Ergosterol) and hormones (Androsterone, Androstenedione, Progesterone, Testosterone) were frequently detected in the pooled wastewater samples. Similar detections were reported in the recently published research papers [1,5,7,8,9,10,12]. Therefore, a cartridge-passed pooled wastewater sample was analyzed using an LC-MS/MS system to check the efficiency of cartridge cleanup for pre-detected analytes. It was observed that this approach effectively removed pre-detected analytes from wastewater samples while preserving essential wastewater matrix composition. Screened blank wastewater matrix sample was utilized to prepare procedural calibration curves (CCs) and quality control (QC) samples for method validation.
The trials conducted for the evaluation of extraction efficiency revealed that the order of suitability for different cartridges was as follows: HLB > MCX > MAX for the 27 targeted SHs. Comparable results were reported in many of the reported articles using HLB cartridge for SHs [27]. It was observed from the data (Table 2) that out of 162 data points (for intensity in terms of average area and % RSD of 27 SHs extracted using three cartridges), results for area and %RSD were least preferred on only 1 occasion for HLB, on 16 occasions for MCX, and on 37 occasions for MAX cartridge. Also, efforts were made to evaluate how many instances of results were the first/second highest (average area) and lowest (% RSD) for cartridge extraction. It was observed that the first/second highest results were observed for extraction using HLB (53 occasions), followed by MCX (38 occasions) and MAX (17 occasions). Table 2 shows that MAX cartridges generally gave the second-best results for steroid extraction, except for Ergosterol, though differences (between MAX and MCX) were not significant. Extraction using HLB and MCX cartridges produced results with a % RSD of less than 10 for all targeted SHs. Further, it was observed from the data in Table 2 that all three tested cartridges showed quantifiable areas at an MQC level of concentration with excellent precision (less than 20% RSD, n = 4), with the highest %RSD of 15.6 achieved for Ergosterol using the MAX cartridge. Looking at the overall results for average area and % RSD, the HLB SPE cartridge chemistry was selected for further method development and validation of the method. The % RSD values demonstrate that the automated extraction method is fit for its intended application and ready for more comprehensive validation.
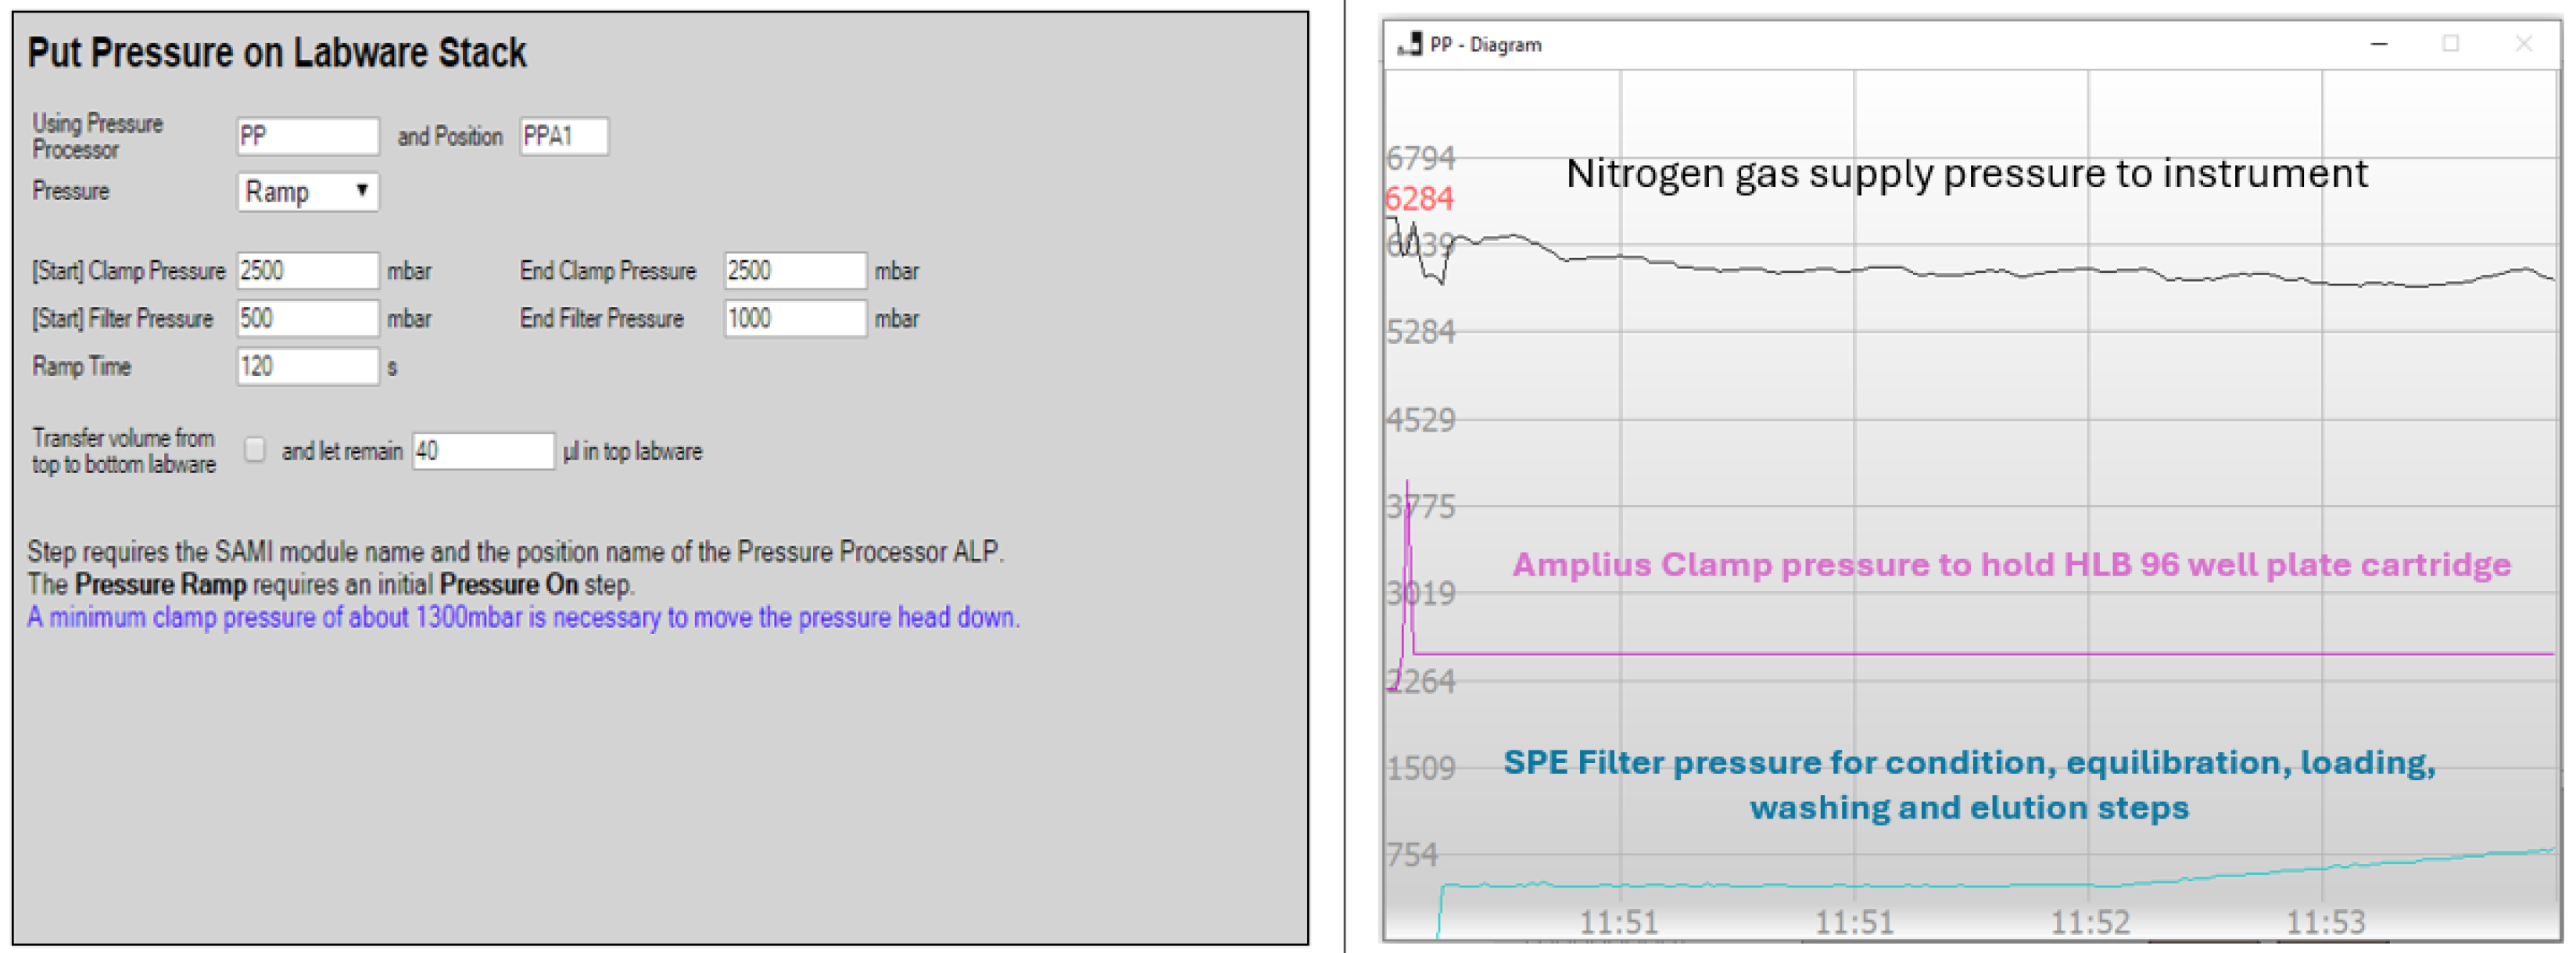
Optimized extraction protocol was subjected to further validation on a Beckman Coulter Biomek i7 automated workstation using an HLB 96-well plate for 27 SHs. A sample volume of 4.5 mL was processed using the programmed extraction protocol steps as shown in Table 1 on Biomek i7 system. Conditioning, equilibration, and washing reagents were added to the 96-well plate using the Thermo Fisher Multidrop Combi dispenser with a selection valve. Conditioning and equilibration steps were performed using 1.0 mL 100% MeOH and 1.0 mL of 100% ASTM Type I water, respectively, to activate the active sites of the stationary phase and to remove impurities for optimal interaction with the sample. The optimization of the pressure gradient was observed to be crucial for proper conditioning, equilibration, loading, washing, and elution. It was observed from initial trials that a pressure gradient starting from 500 millibar and ramping to 1000 millibar within 120 s using Amplius positive-pressure extractor (Figure 2) was most suitable for recovering all targeted analytes. Target analytes were eluted into the collection tray using elution solvent and subsequently analyzed by LC-MS/MS. All peripheral instruments on the automated workstation were seamlessly integrated with the Biomek i7 and all functions were controlled using Biomek Automatic Workstation software (version 5.1).

3.2. Method Validation

The specificity of the method was evaluated for each of the MRM transitions by analyzing six replicates of the control sample along with a process blank and solvent blank. During initial specificity trials, maximum interferences of more than 10% were observed (Table 3) for six compounds, namely Cholesterol (17.71%), 17 Beta estradiol (12.49%), Coprostanol (11.77%), Cholestanol (11.69%), Stigmastanol (11.04%), and Beta sitosterol (11.25%); however, these interfering responses were less than the acceptable criteria of 30% [30].
Matrix effect (% ME) was evaluated during the initial stages of the method validation to select a suitable calibration approach for accurate quantification. The matrix effect was evaluated by comparing responses of targeted SHs in ASTM Type I water and in extracted wastewater control matrix at LOQ concentration. Signal suppression was observed in 14 cases and signal enhancement was observed for 13 of the targeted SHs. The results from Table 3 showed that the method met acceptance criteria for a matrix effect of less than 20% for 26 of the targeted SHs. It was observed that Epi Coprostanol (34.92%) failed to meet the matrix effect acceptance criteria of less than 20% [30]. Also, in the case of eight other compounds (Desogestrel, Beta Estradiol 3 benzoate, Coprostanol, Cholestanol, 17 Alpha estradiol, Desmosterol, Beta sitosterol, and Cholesterol), the matrix effect was more than 5%. These findings highlight that calibration curves prepared using either ASTM Type I water or pure solvent are insufficient when analyzing multiple steroidal hormones (SHs) in wastewater from diverse sources with complex matrices. Hence, for accurate analysis of the target SHs, a procedural calibration technique was adopted with ISTD addition for plotting the calibration curve and quantitation [30].
The sensitivity of the method was estimated by calculating the LOD (Table 3), multiplying the standard deviation of the lowest spike level tested by 3.3. The estimated LODs were observed to range from 0.022 µg/L to 0.703 µg/L for Estriol and Cholesterol, respectively. The results in Table 3 establish high sensitivity without the need for evaporative concentration during the analytical method using LC-MS/MS. Based on method sensitivity, it was observed during the method development trials that procedural calibration curves with five different concentration ranges were required to cover all targeted SHs (Table 3). The higher linearity range of 40.0 to 600.0 µg/L was observed for only two analytes (Cholesterol and Ergosterol). Higher linearity ranges for Cholesterol were attributed to the known or expected presence in wastewater samples, which were also evident from the remarks and wide quality control acceptance criteria in U.S. EPA 1698:2007 [24]. The low sensitivity of Ergosterol can be attributed to its complex chemical nature and susceptibility to oxidation during the extraction process, which is evident from the high Maximum Level (ML) set out in U.S. EPA 1698:2007, which is 50 µg/L even after the more than 1000 times evaporative concentration of the sample during extraction [24].
During the validation study, the method linearity was assessed using an eight-point calibration curve for all compounds, as detailed in Table 3. It was observed from the validation trials that the average coefficient of determination (r2) (n = 3, from day 1, 2, and 3 validation data) of procedural calibration was higher than 0.980 for 16 SHs. For the remaining 11 SHs, average coefficient of determination (r2) ranged from 0.9602 to 0.9799. The lowest average coefficient of determination (r2) for Beta Estradiol 3 benzoate was 0.9602, with an average deviation in back-calculated concentration under 20% across all calibration curve points during validation. Further, it was observed from the data in Table 3 that for nine steroids, deviations from back-calculated concentrations were above 20% at the L2 level of the calibration curve, reaching a maximum of 24.45% with a minimum coefficient of determination (r2) of 0.9631 for Ergosterol. However, these high deviations of up to 24.45% for nine steroids are acceptable when compared with QC acceptance criteria for calibration verification (VER), ongoing precision and recovery (OPR), and initial precision and recovery (IPR), which are mentioned in the conventional method for analysis of steroids and hormones [24].
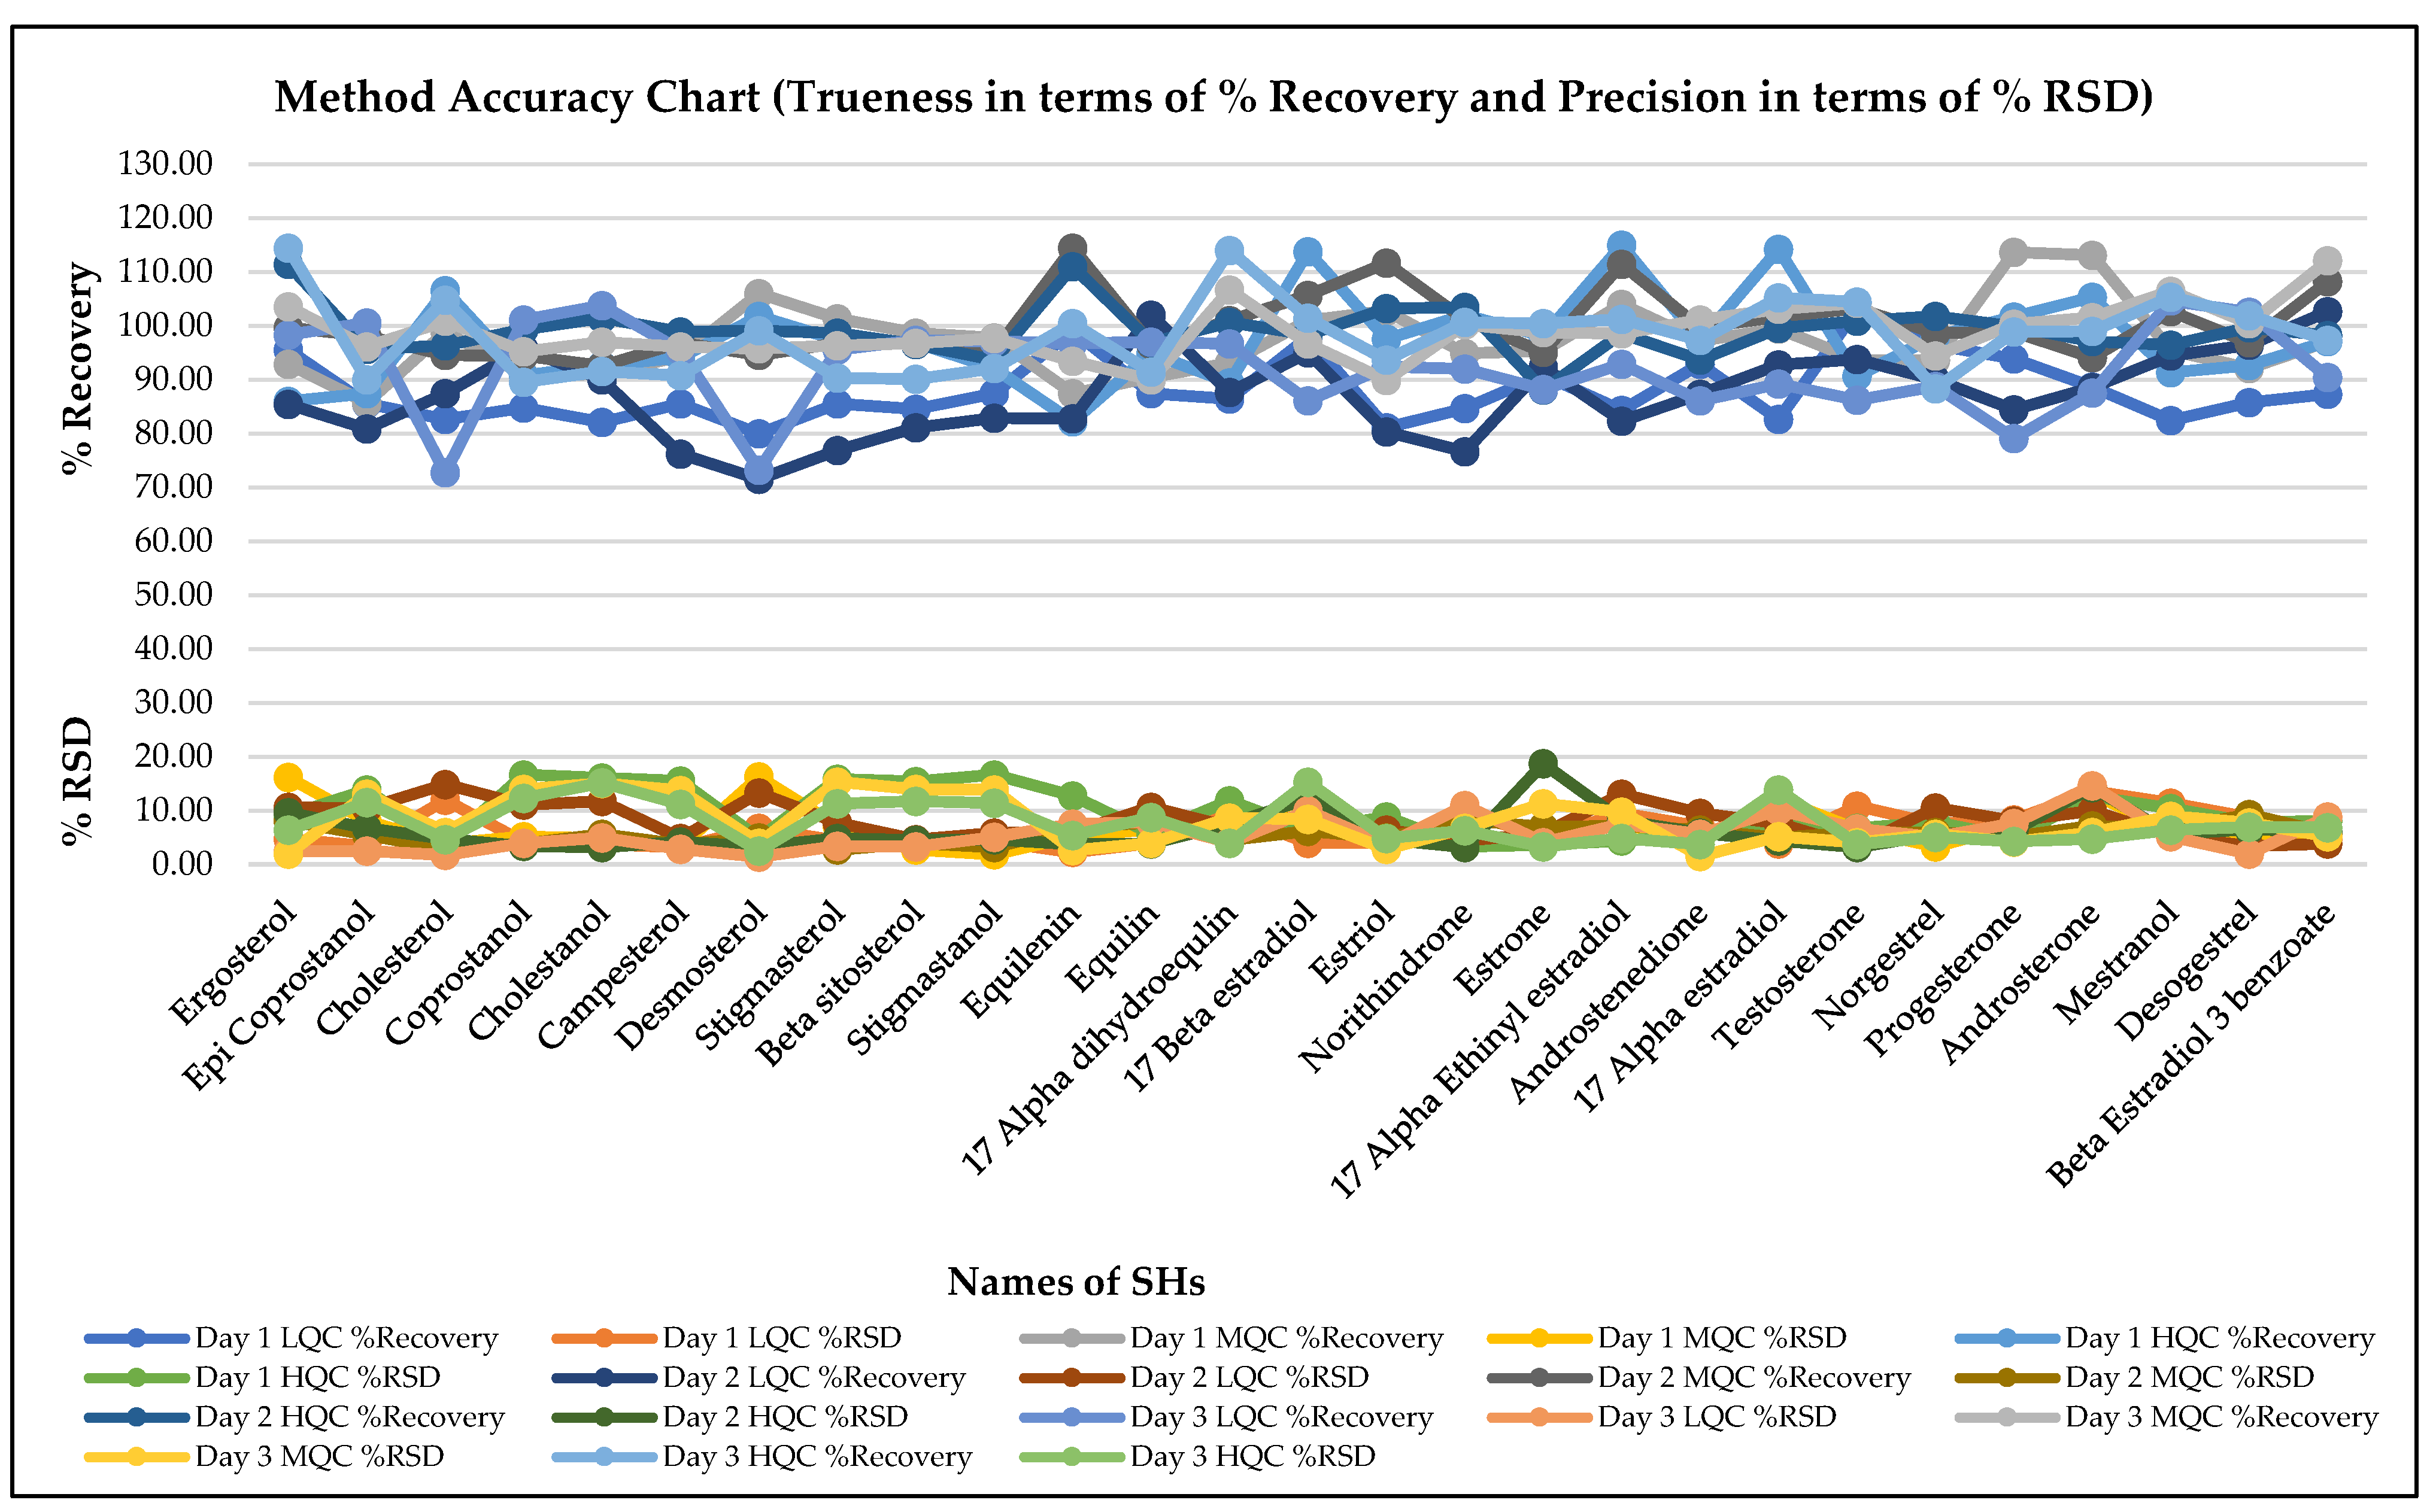
The estimated LOQ was determined theoretically by calculating 10 times the standard deviation of the lowest spiked level tested for each SH (n = 6). It was observed that the estimated LOQs ranged from a minimum of 0.162 µg/L to a maximum of 38.235 µg/L (Table 3). In this work, the focus was on demonstrating that the lowest reported concentration met the requirements for the analysis at the detected limits in wastewater. Since no regulatory Maximum Limits (MLs) are defined for SHs in wastewater, the lowest sensitive and accurately quantifiable targeted LOQ concentration was assessed during method validation by evaluating the % RSD and mean % recovery. The data in Figure 3 show that at the targeted LOQs listed in Table 3, the method met the acceptable performance criteria for % recovery and % RSD across validation trials.
The accuracy of the method in terms of precision (repeatability) and trueness (% recovery) was evaluated by injecting six replicates of LQC, MQC, and HQC standards on three different occasions. The % RSD of 27 analytes were evaluated for compliance with the acceptable method performance criteria of less than 20% [30]. The data represented in Figure 3 indicates the method is precise and meets the acceptable performance criteria (at LQC, MQC, and HQC, n = 18 at each level of QC) for all targeted SHs. The average % recovery for all 27 targeted analytes were evaluated to ensure compliance with the acceptable method performance criteria of 70 to 130%. The data presented in Figure 3 indicates that average % recovery of the method falls between 71.54 and 115% during validation for all SHs.
During the method validation, the small changes that were most likely to occur during routine analysis were tested for their impact on the method accuracy and trueness. The expected changes evaluated were analysis by different analysts and use of different instruments. Two trials of method validation were conducted on the instrument with AEQ ID 145 and one trial was performed on the instrument with AEQ ID 146 (internal identification code for Analytical Equipment (AEQ)). Furthermore, two trials conducted on instruments with AEQ ID 146 were performed by two different analysts. It is evident from the results shown in Figure 3 that the method is robust, as it meets the acceptable performance criteria of mean % recovery and % RSD with the most likely changes during routine analysis being changes in analysts and equipment.
The ion ratios were observed to be consistent within the batch conducted on three different occasions during the validation study for 27 SHs. At all instances for the 27 SHs, ion ratios met the acceptable performance criterion of 30%, with deviations ranging from a minimum of 1.96 for Campesterol to a maximum of 9.15 for Progesterone (Table 2). Retention Times (RTs) for all analytes were observed to be consistent, with deviations of no more than ±0.02 min within the batch (Table 2). The Measurement Uncertainty (MU) of all analytes was calculated as shown in Table 3 and ranged from a minimum of 6.12 to a maximum of 32.72% at the targeted LOQ for Androsterone (0.915 ± 0.056) and Campesterol (14.6 ± 4.778), respectively.
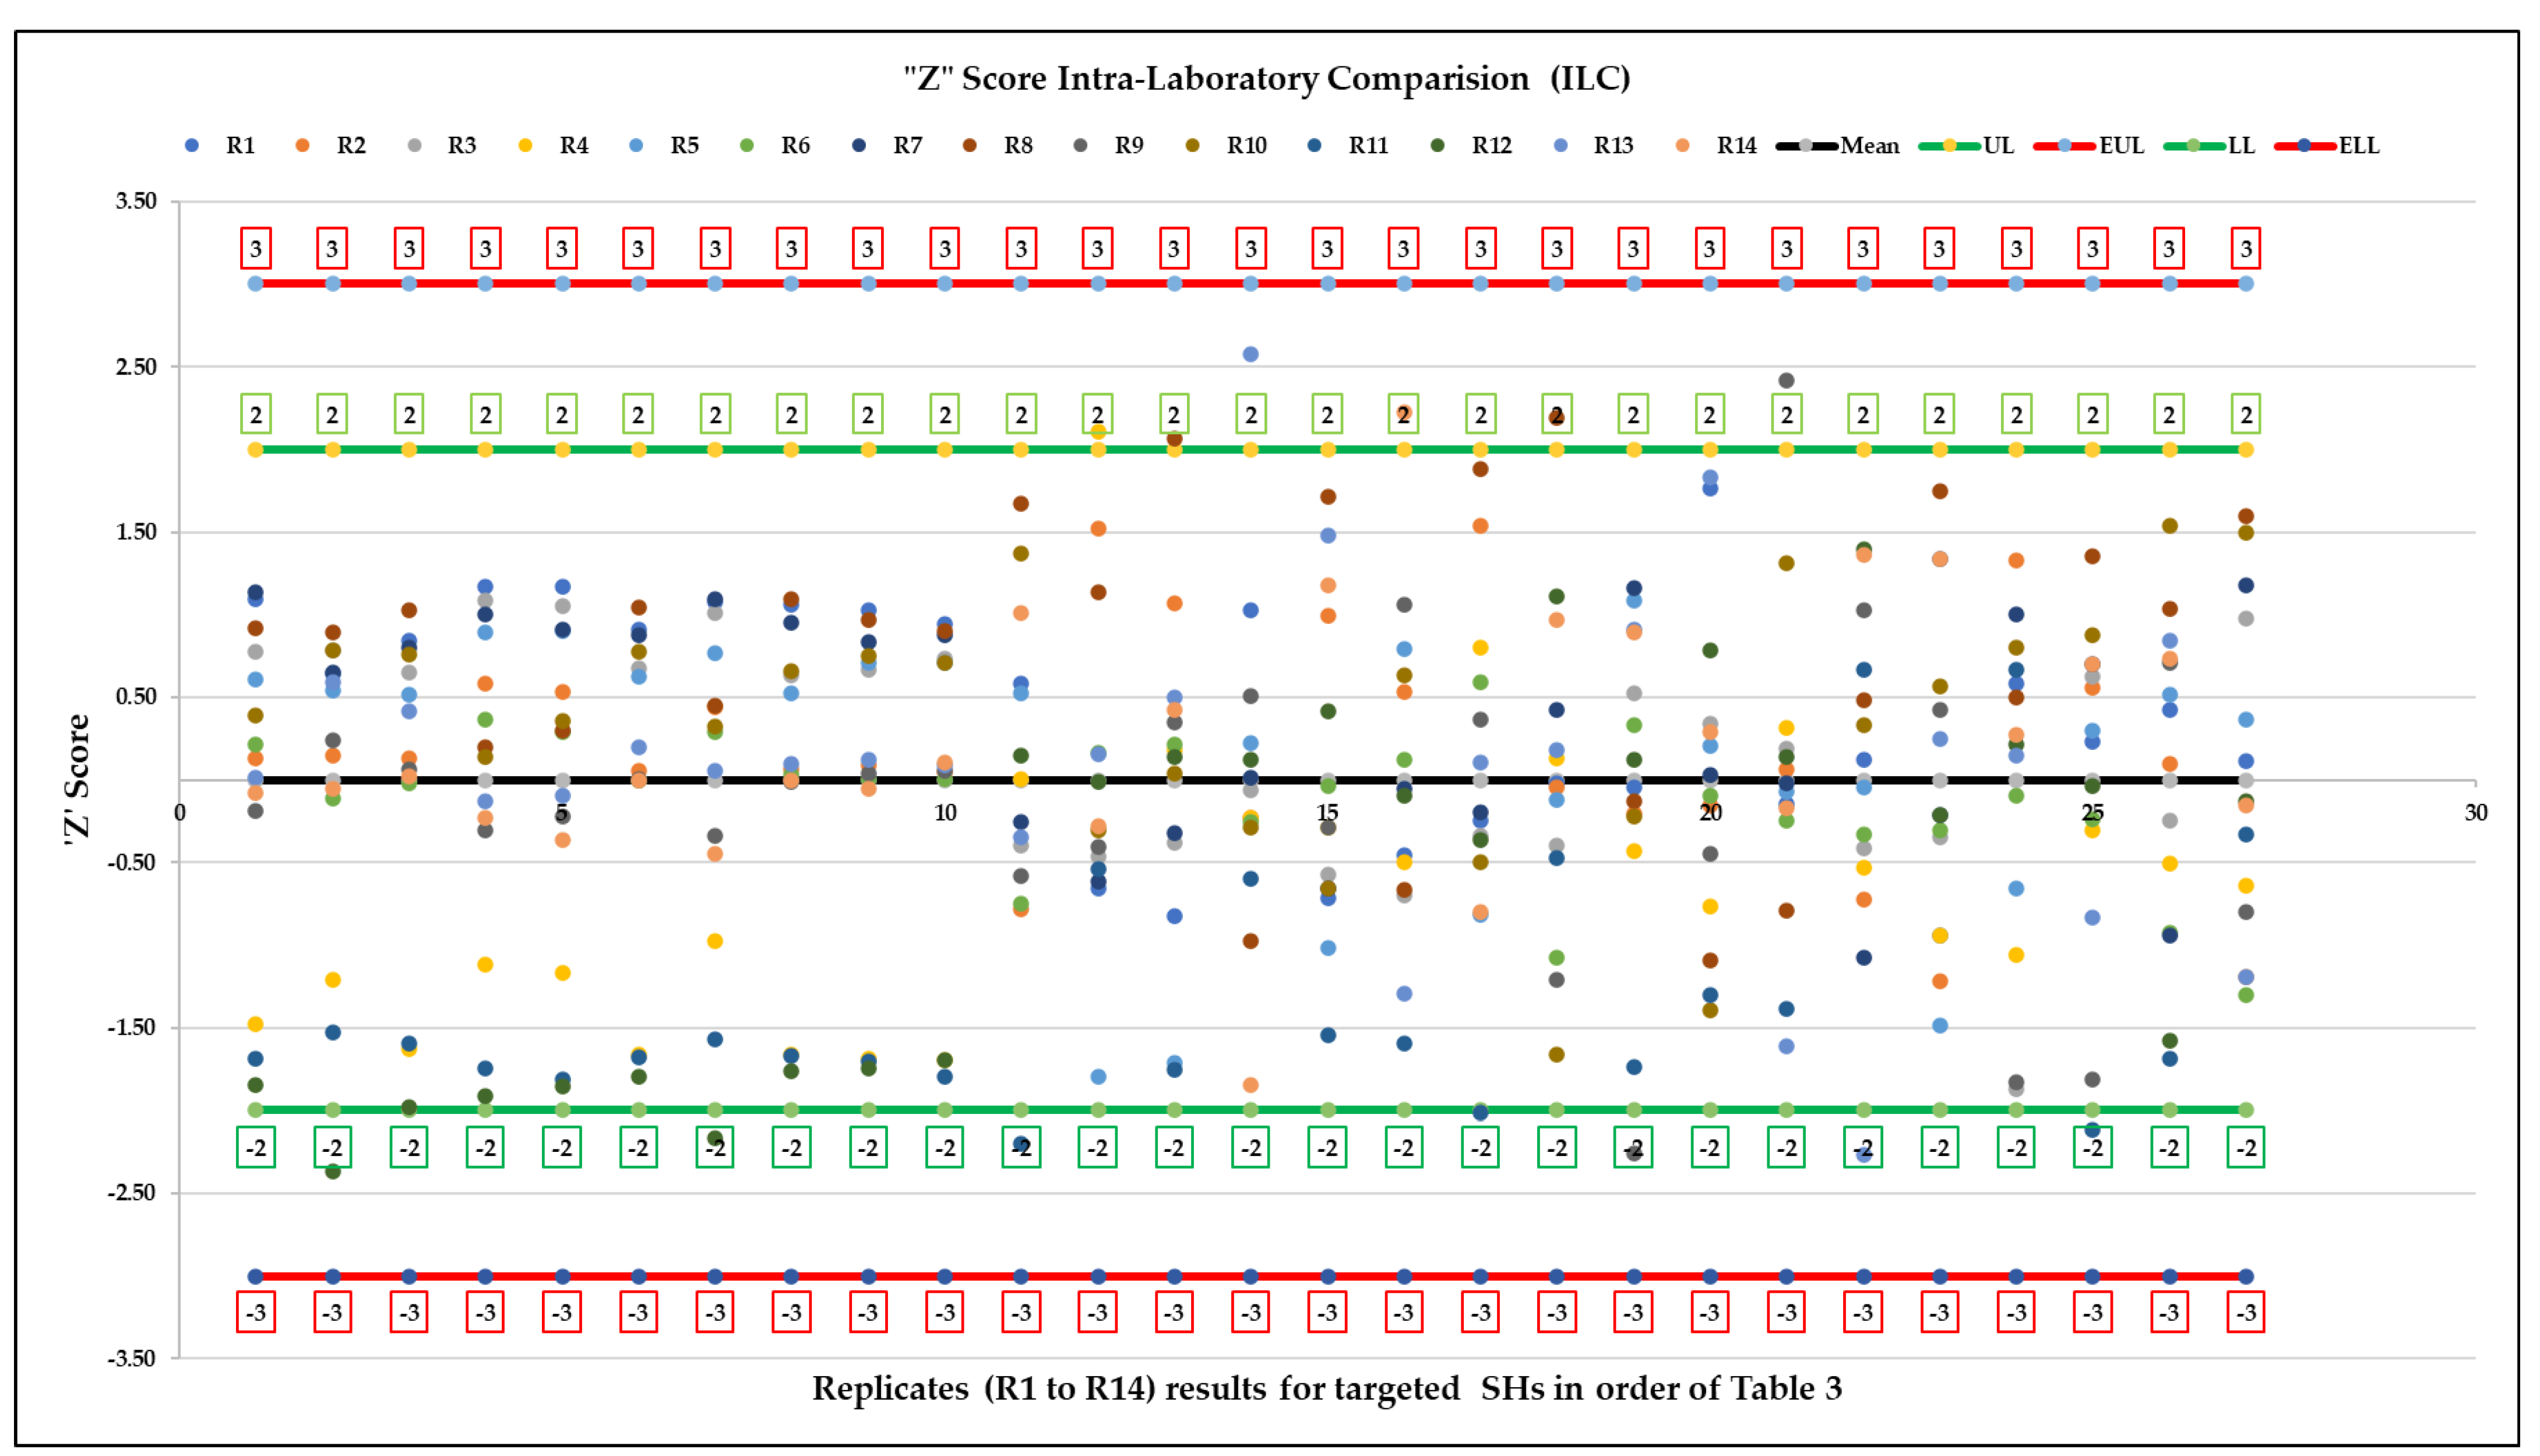
Intra-Laboratory Comparison (ILC) was conducted to evaluate validation across different settings (equipment and analysts) as per the requirement of ISO/IEC 17025/2017 [34]. Blank control samples, spiked at concentrations within the testing range (n = 7), were analyzed by two chemists. Intra-Laboratory Comparison results were evaluated by the lead scientist using “Z” score, calculated according to ISO 13528, with Standard Deviation for Proficiency Assessment (SDPA) derived from calculated concentrations (n = 14, replicates from both analysts) [39]. Results were deemed acceptable with a “Z” score between −2 and 2, satisfactory between −3 and +3, and unacceptable outside this range. From the 378 data points (n = 14 for 27 SHs), 96.56% of the “Z” scores fell within the acceptable range (−2 to 2), and 3.43% were within the satisfactory range (−3 to 3), as shown in Figure 4.
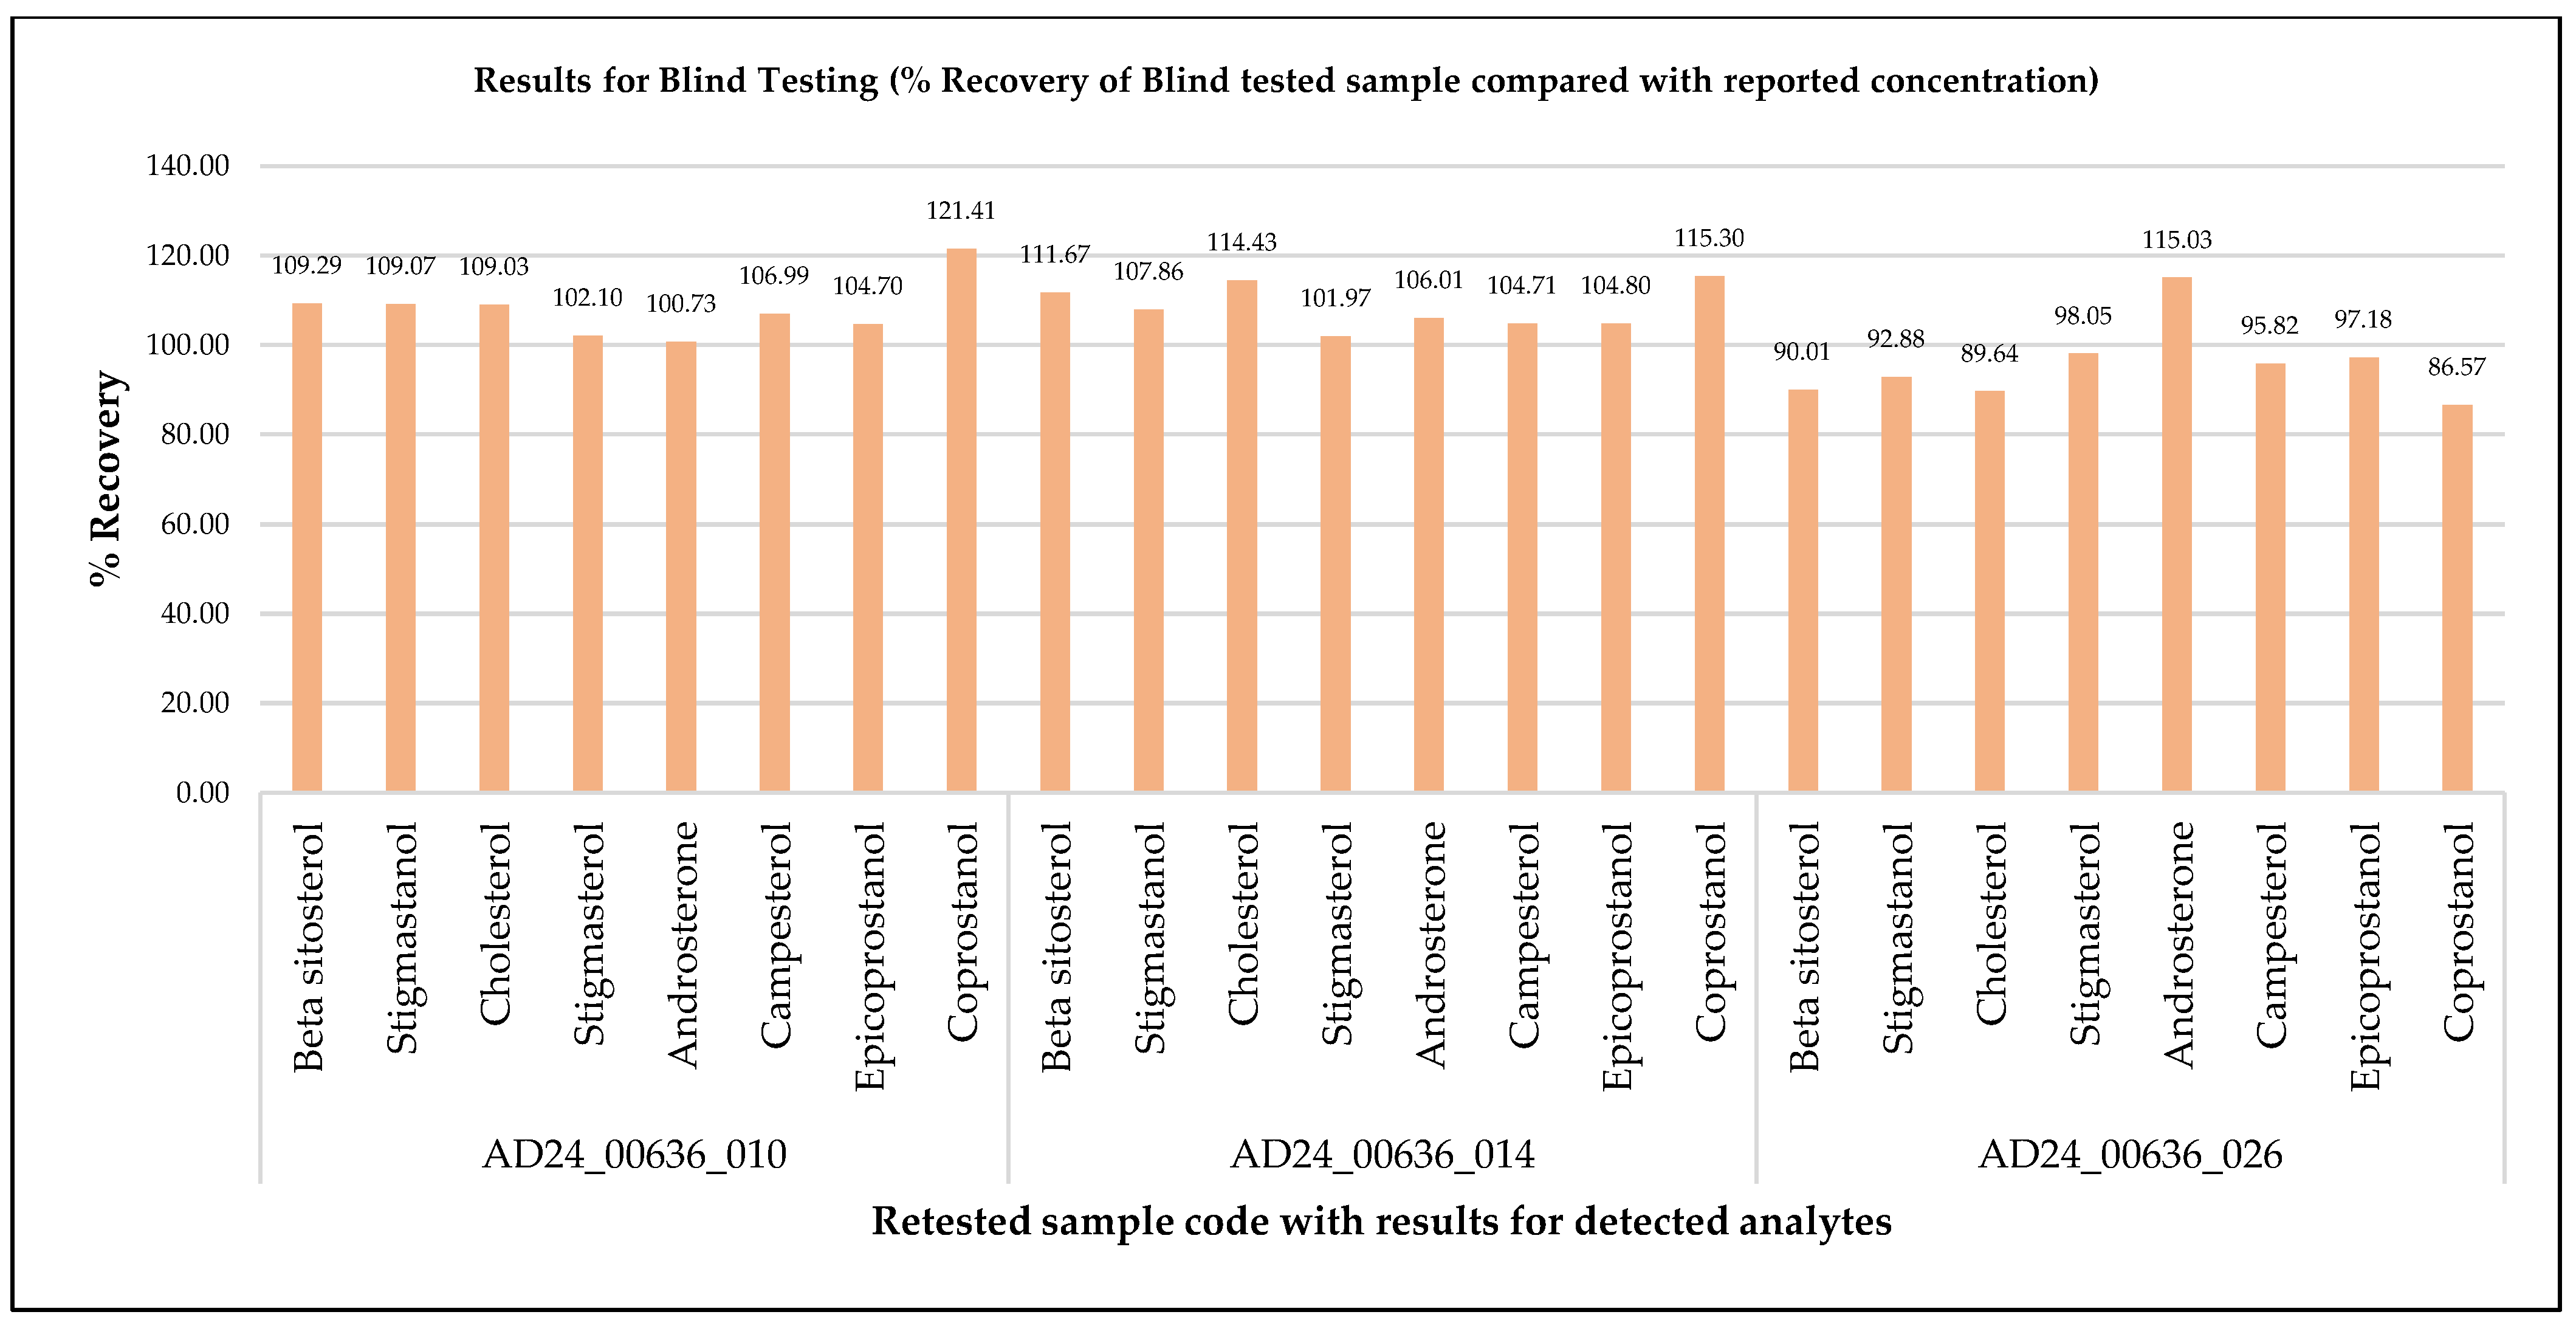
Blind Testing (BT) was carried out without analyst information by rebooking and retesting three samples previously reported as positive for the common eight SHs. Sample identification was kept confidential and only accessible to the quality assurance manager until the BT evaluation was complete [34]. Analysts followed routine sample analysis protocols, and results were assessed by the quality assurance manager for a % recovery compared to original reported results. Results were considered acceptable with a % recovery between 70% and 130%. The % recovery for analytes testing positive in the BT round ranged from a minimum of 86.57% to a maximum of 121.41% for Coprostanol, as shown in Figure 5.

3.3. Comparative Evaluation of Method Greenness and Practicality

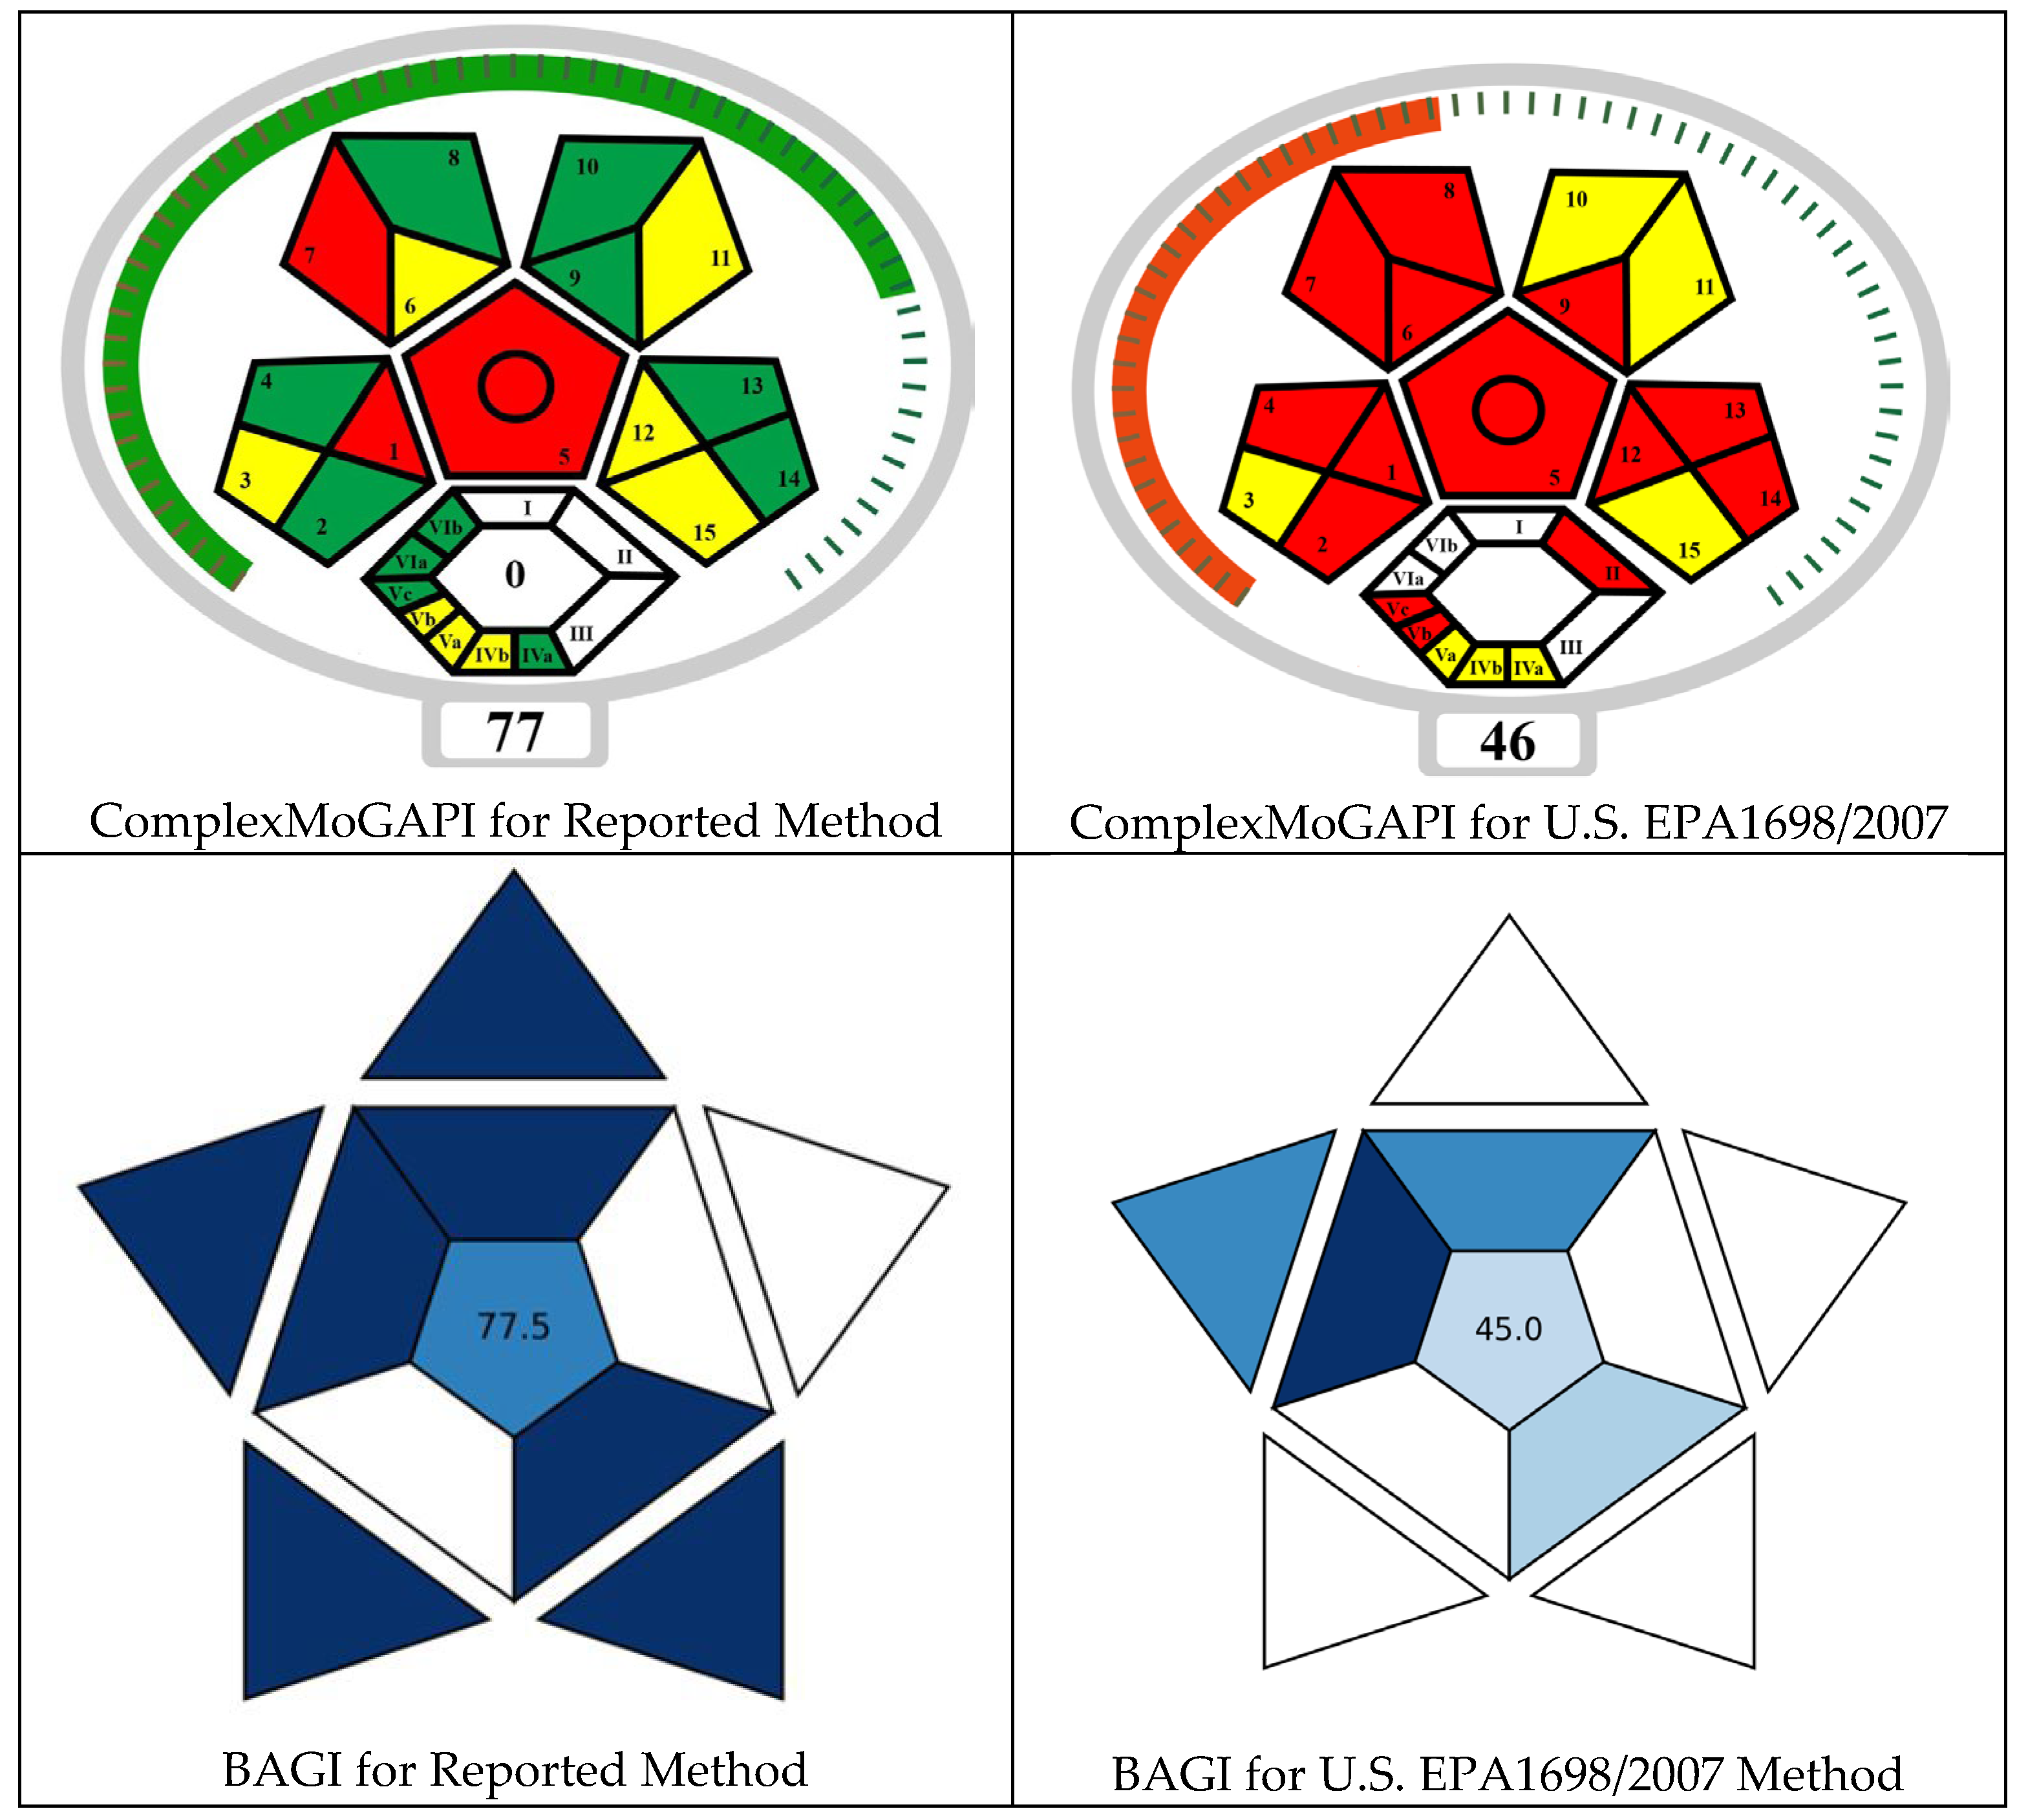
Evaluation of method greenness was performed using the online tool ComplexMoGAPI (). It is an enhanced framework of the GAPI. This framework was enhanced by adding a hexagonal segment to assess activities beyond sample preparation and final analysis, considering parameters like recovery yields, processing conditions, green economy principles, occupational hazards, and E-factor for relevant methods with a unified scoring system for individual methods [35]. The scoring system ranged from 0 to 100, wherein a score of 100 represents a method that is 100% green, greater than 75 is excellent, greater than 50 is acceptable, less than 50 is not acceptable. Parameters which are not applicable for reported and conventional methods like purification (VIa and Vib) and E-factor were not considered in evaluations, as shown in Figure 6. Combining pentagram and hexagram assessments, ComplexMoGAPI confirmed that the proposed method aligns with sustainability criteria, achieving an overall excellent eco-friendly score of 77, whereas the conventional method scores 46, highlighting the method’s limitations with respect to environmental sustainability.
Evaluation of method practicality and applicability for high-throughput analysis was performed using Blue Applicability Grade Index (). BAGI evaluates ten attributes related to the method in terms of its applicability and practicality. These attributes are type of analysis, the number of analytes assessed in a single method, the simultaneous analysis of multiple analytes, the analytical technique employed, sample analysis rate per hour, level of automation, reagents and materials used, instrument type, sample preparation process, and processing volume. These inputs are used to create an asteroid-shaped pictogram for the proposed method with scoring from 25 to 100 [36], where the high score of 77.5 indicates the greater practicality of the reported method compared to the low score of 45 for the conventional method (Figure 6).

4. Conclusions

The method proved to be fit for efficient analysis of 27 SHs in complex wastewater samples by integrating high-throughput sample preparation (Biomek i7 sample preparation robotics), HLB 96-well plate SPE, and LC-MS/MS detection with an APCI source. The method validation demonstrated acceptable specificity, sensitivity, precision, and accuracy. The method also exhibited reliability in Blind Testing (BT) and Intra-Laboratory Comparison (ILC). The automated sample preparation reduced human error and cross-contamination. During specificity trials the maximum interfering peak was observed for six compounds, namely Cholesterol (17.71%), 17 Beta estradiol (12.49%), Co-prostanol (11.77%), Cholestanol (11.69%), Stigmastanol (11.04%), and Beta sitosterol (11.25%), which were well below the acceptable tolerance of 30% [30].
Furthermore, it was observed that Epi Coprostanol (34.92%) was affected the most due to the matrix effect and failing to meet the acceptance criteria of less than 20% for the matrix effect [29]. Also, in the case of eight other compounds (Desogestrel, Beta Estradiol 3 ben-zoate, Coprostanol, Cholestanol, 17 Alpha estradiol, Desmosterol, Beta sitosterol, and Cholesterol), the matrix effect was more than 5%. This observation highlights the necessity to use a blank control wastewater matrix for plotting a procedural calibration curve to address matrix effects, as recommended in method validation guidelines [30]. Therefore, a novel approach was developed to prepare a wastewater control matrix from routine wastewater samples using selective cartridges.
The optimized extraction protocol using HLB cartridges proved to be comparatively more effective than the conventional method. The optimized automated MAX 96-well plate SPE protocol (automated extraction of 96 samples within 2 h and 40 min) and 13 min LC-MS/MS run time allow high-throughput analysis of up to 100 samples in 24 h. It has also received a high ranking in greenness evaluations (ComplexMoGAPI) and an impressive Blue Applicability Grade Index (BAGI) score for practicality. The reported method, with its high-throughput capabilities and integration of AI-generated dashboards for evaluating real-time data across multiple locations, enables efficient large-scale surveillance of SHs.
This study concludes that this automated protocol effectively overcomes the limitations of conventional methods used in analysis of SHs and can be used as an efficient alternative for high-throughput monitoring of environmental contamination. By promoting sustainable monitoring of micropollutants in wastewater, it not only strengthens the capacity of environmental laboratories but also contributes to global efforts toward the United Nations 2030 Agenda for Sustainable Development Goals (SDGs). Particularly, SDG 3 (Good Health and Well-being), SDG 6 (Clean Water and Sanitation), SDG 9 (Industry, Innovation, and Infrastructure), SDG 13 (Climate Action), SDG 14 (Life Below Water), and SDG 15 (Life on Land), thereby supporting both human and ecological health [40].

Author Contributions

Conceptualization, Method design, Development, Validation, Review—editing of original draft, Writing—original draft, Visualization, Validation, Supervision, Software, Methodology, Investigation, Formal analysis, Data curation: B.K., C.D. and D.S.; Validation, Software, Methodology, Formal analysis, Review—editing of original draft: R.S., G.H. and R.T.; Review—editing of original draft, Visualization, Supervision, Resources: S.B.S.; Review—editing of original draft, Visualization, Supervision, Resources, Project administration: W.E.; Writing, Review, Editing, Visualization, Validation, Supervision, Resources, Project administration, Methodology, Formal analysis, Data curation, Conceptualization: G.B. All authors have read and agreed to the published version of the manuscript.

Funding

This research received no external funding.

Acknowledgments

Authors duly acknowledge the management of RASID Laboratory of Abu Dhabi Quality & Conformity Council (ADQCC) & M42 Environmental Sciences, United Arab Emirates (UAE) for providing all resources and facilities to carry out this research work.

Conflicts of Interest

The authors declare no conflicts of interest.

References

  1. Yazdan, M.M.S.; Kumar, R.; Leung, S.W. The Environmental and Health Impacts of Steroids and Hormones in Wastewater Effluent, as Well as Existing Removal Technologies: A Review. Ecologies 2022, 3, 206–224. [Google Scholar] [CrossRef]
  2. Aydoğan, D.; Yurdun, T. Determination of Selected Steroid Compounds in Sediment Samples from Golden Horn Estuary (the Sea of Marmara, Turkey) Using LC-ESI/MS-MS. J. Black Sea/Mediterr. Environ. 2021, 27, 342–364. Available online: https://blackmeditjournal.org/volumes-archive/vol-27-2021/vol-27-2021-no-3/determination-of-selected-steroid-compounds-in-sediment-samples-from-golden-horn-estuary-the-sea-of-marmara-turkey-using-lc-esi-ms-ms/ (accessed on 16 July 2025).
  3. Almazrouei, B.; Islayem, D.; Alskafi, F.; Catacutan, M.K.; Amna, R.; Nasrat, S.; Sizirici, B.; Yildiz, I. Steroid Hormones in Wastewater: Sources, Treatments, Environmental Risks, and Regulations. Emerg. Contam. 2023, 9, 100210. [Google Scholar] [CrossRef]
  4. Díaz-Cruz, M.S.; López de Alda, M.J.; López, R.; Barceló, D. Determination of Estrogens and Progestogens by Mass Spectrometric Techniques (GC/MS, LC/MS and LC/MS/MS). J. Mass Spectrom. 2003, 38, 917–923. [Google Scholar] [CrossRef]
  5. Naldi, A.C.; Fayad, P.B.; Prévost, M.; Sauvé, S. Analysis of Steroid Hormones and Their Conjugated Forms in Water and Urine by On-Line Solid-Phase Extraction Coupled to Liquid Chromatography Tandem Mass Spectrometry. Chem. Cent. J. 2016, 10, 30. [Google Scholar] [CrossRef]
  6. Goeury, K.; Vo Duy, S.; Munoz, G.; Prévost, M.; Sauvé, S. Assessment of Automated Off-Line Solid-Phase Extraction LC-MS/MS to Monitor EPA Priority Endocrine Disruptors in Tap Water, Surface Water, and Wastewater. Talanta 2022, 241, 123216. [Google Scholar] [CrossRef]
  7. Biswas, S.; Shapiro, C.A.; Kranz, W.L.; Mader, T.L.; Shelton, D.P.; Snow, D.D.; Bartelt-Hunt, S.L.; Tarkalson, D.D.; van Donk, S.J.; Zhang, T.C.; et al. Current Knowledge on the Environmental Fate, Potential Impact, and Management of Growth-Promoting Steroids Used in the US Beef Cattle Industry. J. Soil Water Conserv. 2013, 68, 325–336. [Google Scholar] [CrossRef]
  8. Liu, S.; Ying, G.-G.; Zhao, J.-L.; Zhou, L.-J.; Yang, B.; Chen, Z.-F.; Lai, H.-J. Occurrence and Fate of Androgens, Estrogens, Glucocorticoids and Progestagens in Two Different Types of Municipal Wastewater Treatment Plants. J. Environ. Monit. 2012, 14, 482–491. [Google Scholar] [CrossRef]
  9. Mouatassim-Souali, A.; Tamisier-Karolak, S.L.; Perdiz, D.; Cargouët, M.; Levi, Y. Validation of a Quantitative Assay Using GC/MS for Trace Determination of Free and Conjugated Estrogens in Environmental Water Samples. J. Sep. Sci. 2003, 26, 105–111. [Google Scholar] [CrossRef]
  10. Zamri, M.F.M.A.; Bahru, R.; Suja’, F.; Shamsuddin, A.H.; Pramanik, S.K.; Fattah, I.M.R. Treatment Strategies for Enhancing the Removal of Endocrine-Disrupting Chemicals in Water and Wastewater Systems. J. Water Process Eng. 2021, 41, 102017. [Google Scholar] [CrossRef]
  11. Yazdan, M.Md.S.; Ahad, M.T.; Mallick, Z.; Mallick, S.P.; Jahan, I.; Mazumder, M. An Overview of the Glucocorticoids’ Pathways in the Environment and Their Removal Using Conventional Wastewater Treatment Systems. Pollutants 2021, 1, 141–155. [Google Scholar] [CrossRef]
  12. Tölgyesi, Á.; Verebey, Z.; Sharma, V.K.; Kovacsics, L.; Fekete, J. Simultaneous Determination of Corticosteroids, Androgens, and Progesterone in River Water by Liquid Chromatography–Tandem Mass Spectrometry. Chemosphere 2010, 78, 972–979. [Google Scholar] [CrossRef] [PubMed]
  13. Bilal, M.; Iqbal, H.M.N. Persistence and Impact of Steroidal Estrogens on the Environment and Their Laccase-Assisted Removal. Sci. Total Environ. 2019, 690, 447–459. [Google Scholar] [CrossRef] [PubMed]
  14. Ojoghoro, J.O.; Scrimshaw, M.D.; Sumpter, J.P. Steroid Hormones in the Aquatic Environment. Sci. Total Environ. 2021, 792, 148306. [Google Scholar] [CrossRef] [PubMed]
  15. Snyder, P.J. Clinical Use of Androgens. Annu. Rev. Med. 1984, 35, 207–217. [Google Scholar] [CrossRef]
  16. Rocha, M.; Rocha, E. Synthetic Progestins in Waste and Surface Waters: Concentrations, Impacts and Ecological Risk. Toxics 2022, 10, 163. [Google Scholar] [CrossRef]
  17. Kuster, M.; José López de Alda, M.; Barceló, D. Analysis and Distribution of Estrogens and Progestogens in Sewage Sludge, Soils and Sediments. TrAC Trends Anal. Chem. 2004, 23, 790–798. [Google Scholar] [CrossRef]
  18. U.S. Environmental Protection Agency. Contaminant Candidate List 4-CCL. Available online: https://www.epa.gov/ccl/contaminant-candidate-list-4-ccl-4-0 (accessed on 19 December 2024).
  19. Liu, S.; Ying, G.-G.; Zhao, J.-L.; Chen, F.; Yang, B.; Zhou, L.; Lai, H.-J. Trace Analysis of 28 Steroids in Surface Water, Wastewater and Sludge Samples by Rapid Resolution Liquid Chromatography–Electrospray Ionization Tandem Mass Spectrometry. J. Chromatogr. A 2011, 1218, 1367–1378. [Google Scholar] [CrossRef]
  20. Snyder, S.A.; Keith, T.L.; Verbrugge, D.A.; Snyder, E.M.; Gross, T.S.; Kannan, K.; Giesy, J.P. Analytical Methods for Detection of Selected Estrogenic Compounds in Aqueous Mixtures. Environ. Sci. Technol. 1999, 33, 2814–2820. [Google Scholar] [CrossRef]
  21. Huang, C.-H.; Sedlak, D.L. Analysis of Estrogenic Hormones in Municipal Wastewater Effluent and Surface Water Using En-zyme-Linked Immunosorbent Assay and Gas Chromatography/Tandem Mass Spectrometry. Environ. Toxicol. Chem. 2001, 20, 133–139. [Google Scholar] [CrossRef]
  22. Ferguson, P.L.; Iden, C.R.; McElroy, A.E.; Brownawell, B.J. Determination of Steroid Estrogens in Wastewater by Immunoaffinity Extraction Coupled with HPLC−Electrospray-MS. Anal. Chem. 2001, 73, 3890–3895. [Google Scholar] [CrossRef] [PubMed]
  23. Tseng, S.-P.; Lu, C.-C.; Liao, P.-C.; Chou, C.-H.; Sheu, H.-M.; Tsai, J.-C. Detection and Distribution of Endogenous Steroids in Human Stratum Corneum. Dermatol. Sin. 2014, 32, 19–24. [Google Scholar] [CrossRef]
  24. U.S. EPA Method 1698: Steroids and Hormones in Water, Soil, Sediment, and Biosolids by HRGC/HRMS. 2007. Available online: https://www.epa.gov/sites/default/files/2015-10/documents/method_1698_2007.pdf (accessed on 19 December 2024).
  25. Bowden, J.A.; Colosi, D.M.; Mora-Montero, D.C.; Garrett, T.J.; Yost, R.A. Enhancement of Chemical Derivatization of Steroids by Gas Chromatography/Mass Spectrometry (GC/MS). J. Chromatogr. B 2009, 877, 3237–3242. [Google Scholar] [CrossRef] [PubMed]
  26. Ammann, A.A.; Macíková, P.; Groh, K.J.; Schirmer, K.; Suter, M.J.F. LC-MS/MS Determination of Potential Endocrine Disruptors of Cortico Signalling in Rivers and Wastewaters. Anal. Bioanal. Chem. 2014, 406, 7653–7665. [Google Scholar] [CrossRef]
  27. Sapozhnikova, Y.; Hedgespeth, M.; Wirth, E.; Fulton, M. Analysis of Selected Natural and Synthetic Hormones by LC-MS-MS Using the US EPA Method 1694. Anal. Methods 2011, 3, 1079. [Google Scholar] [CrossRef]
  28. Ripollés, C.; Ibáñez, M.; Sancho, J.V.; López, F.J.; Hernández, F. Determination of 17β-Estradiol and 17α-Ethinylestradiol in Water at Sub-Ppt Levels by Liquid Chromatography Coupled to Tandem Mass Spectrometry. Anal. Methods 2014, 6, 5028. [Google Scholar] [CrossRef]
  29. Tomšíková, H.; Aufartová, J.; Solich, P.; Nováková, L.; Sosa-Ferrera, Z.; Santana-Rodríguez, J.J. High-Sensitivity Analysis of Female-Steroid Hormones in Environmental Samples. TrAC Trends Anal. Chem. 2012, 34, 35–58. [Google Scholar] [CrossRef]
  30. SANTE 11312/2021v2. Analytical Quality Control and Method Validation Procedures for Pesticide Residues Analysis in Food and Feed, EURL for Residues of Pesticides. 2024. Available online: http://food.ec.europa.eu/system/files/2023-11/pesticides_mrl_guidelines_wrkdoc_2021-11312.pdf (accessed on 19 December 2024).
  31. Joint Committee for Guides in Metrology. Evaluation of Measurement Data Guide to the Expression of Uncertainty in Measurement. JCGM 2008, 100, 1–116. [Google Scholar] [CrossRef]
  32. Ellison, S.L.R.; Williams, A. (Eds.) EURACHEM/CITAC Guid: Quantifying Uncertainty in Analytical Measurement, 3rd ed.; EURACHEM: Teddington, UK, 2012; Available online: https://www.eurachem.org/index.php/publications/guides/quam (accessed on 19 December 2024).
  33. Shinde, D.; Murugan, V.; Dhagat, U.; Gupta, P.; Tadala, R.; Karubothula, B.; Golebiewska, I.; Salem, S.B.; Elamin, W.; Brudecki, G. Introduction of a Small Volume Ethyl Acetate Based Liquid-Liquid Extraction Procedure for Analysis of Polycyclic Aromatic Hydrocarbons in Wastewater by Atmospheric Pressure Gas Chromatography-Mass Spectrometry and Evaluation of Method Greenness. J. Chromatogr. A 2025, 1740, 465563. [Google Scholar] [CrossRef]
  34. ISO/IEC 17025:2017; International Organization for Standardization, 2017 General Requirements for the Competence of Testing and Calibration Laboratories. 3rd ed. ISO: Geneva, Switzerland, 2017. Available online: https://www.iso.org/standard/66912.html (accessed on 19 December 2024).
  35. Mansour, F.R.; Omer, K.M.; Płotka-Wasylka, J. A Total Scoring System and Software for Complex Modified GAPI (Com-plexMoGAPI) Application in the Assessment of Method Greenness. Green Anal. Chem. 2024, 10, 100126. [Google Scholar] [CrossRef]
  36. Manousi, N.; Wojnowski, W.; Płotka-Wasylka, J.; Samanidou, V. Blue Applicability Grade Index (BAGI) and Software: A New Tool for the Evaluation of Method Practicality. Green Chem. 2023, 25, 7598–7604. [Google Scholar] [CrossRef]
  37. Fabregat-Safont, D.; Gracia-Marín, E.; Ibáñez, M.; Pitarch, E.; Hernández, F. Analytical Key Issues and Challenges in the LC-MS/MS Determination of Antibiotics in Wastewater. Anal. Chim. Acta 2023, 1239, 340739. [Google Scholar] [CrossRef]
  38. Jauković, Z.D.; Grujić, S.D.; Matić, I.V.; Laušević, M.D. Determination of Sterols and Steroid Hormones in Surface Water and Wastewater Using Liquid Chromatography-Atmospheric Pressure Chemical Ionization-Mass Spectrometry. Microchem. J. 2017, 135, 39–47. [Google Scholar] [CrossRef]
  39. ISO 13528:2022; Statistical Methods for Use in Proficiency Testing by Interlaboratory Comparison. International Organi-zation for Standardization: Geneva, Switzerland, 2022. Available online: https://www.iso.org/standard/78879.html (accessed on 19 December 2024).
  40. United Nations. Transforming Our World: The 2030 Agenda for Sustainable Development; United Nations: New York, NY, USA, 2015; Available online: https://sdgs.un.org/publications/transforming-our-world-2030-agenda-sustainable-development-17981 (accessed on 16 July 2025).
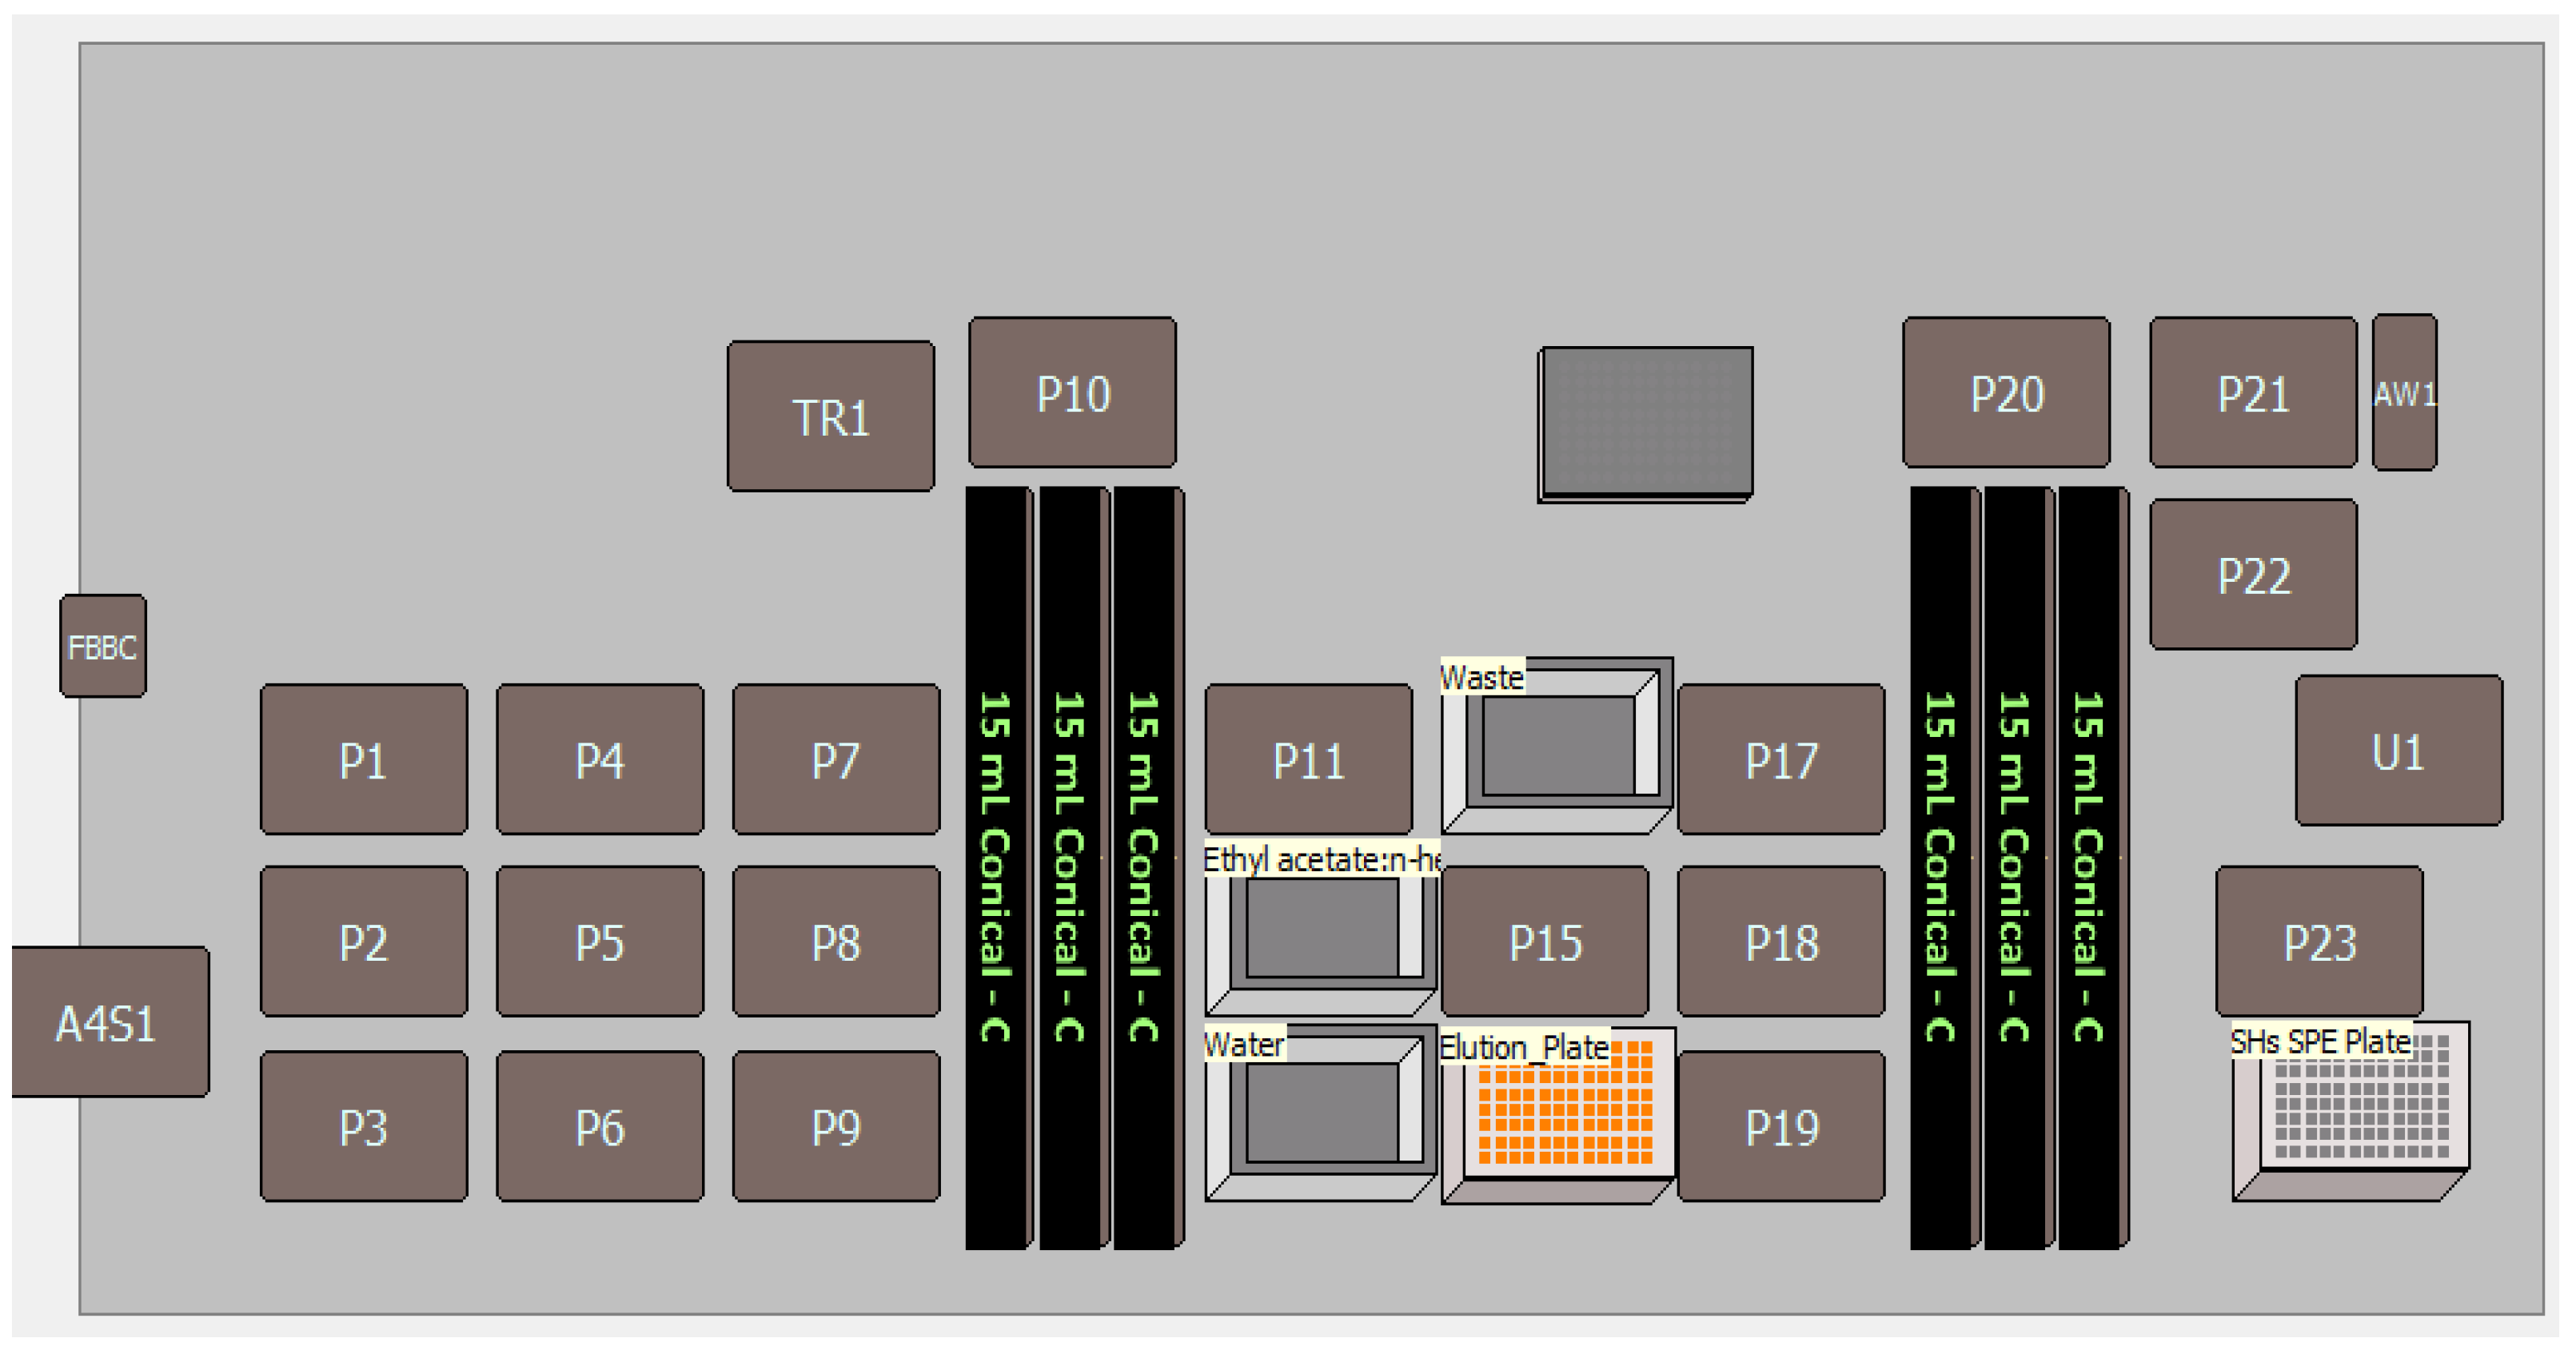
Figure 1. P1 to P11—Alps to keep SPE plate and reservoirs. AW1 is washing and rinsing station for 8-channel pipette arms, tube rack 1 to 6 (15 mL conical) is for loading samples, A4S1 is elution plate sealer, TR1 is diverting valve for SPE solvent selection, P23 (1 SPE plate) station is SPE 96-well plate parking location for positive-pressure SPE run.
Applsci 15 10012 g001
Figure 2. Pressure gradient profile for simultaneous extraction of 96 wastewater samples.
Applsci 15 10012 g002
Figure 3. Method accuracy chart (trueness in terms of % recovery and precision in terms of % RSD).
Applsci 15 10012 g003
Figure 4.Z” score Intra-Laboratory Comparison for targeted SHs.
Applsci 15 10012 g004
Figure 5. Results for Blind Testing (% recovery compared with original reported concentration).
Applsci 15 10012 g005
Figure 6. Comparative evaluation with ComplexMoGAPI and BAGI.
Applsci 15 10012 g006
Table 1. Method for automated extraction and detection of SHs in wastewater.
StepsSample Preparation Task
Procedure for automated extraction of IDs in wastewater using Biomek i7
Sample preparationUnknown and spiked (QC) wastewater samples with ISTD were loaded in the 15 mL conical tube racks (10.0 mL samples) and precleared by centrifugation at 4500 (Eppendorf).
ConditioningCondition the HLB 96-well plate cartridge with 1.0 mL 100% MeOH.
EquilibrationEquilibrate the cartridge with 1.0 mL of 100% ASTM Type I water.
Sample loadingLoad 1.5 mL of samples and quality controls three times (total sample volume: 4.5 mL) on respective 96-well plate cartridge.
WashingWash the cartridge with 1.0 mL of 10% methanol in ASTM Type I water. Dry the cartridge at 1000 mbar for up to 10 min.
ElutionElute cartridge two times with 1 mL of Ethyl acetate/n-hexane (70:30 v/v) in plate.
Dilution and well plate sealingAfter drying (at 60 °C temperature under stream of nitrogen at gas flow of 60 L/m for approx. 30 min) completely, reconstitute the well plate with 0.200 mL of methanol/acetonitrile (70:30) v/v and 0.400 mL of ASTM Type I water and seal the cartridge plate by a4S 4titude automated-role heat sealer and vortex mixture at lower rpm.
LC-MS/MS detectionSHs: Load sealed 96-well plate cartridge autosampler and inject 10 μL of sample.
Equipment Details
Ion sourceZ Spray XEVO Ion Source
PumpAcquity UPLC I Class plus
AutosamplerFTN Sample Manager
Column ovenAcquity UPLC Column Heater
LC columnSHs: X Bridge premier BEH C18 Column, 2.5 µm, 2.1 mm × 100 mm
LC Parameters
Mobile phase A0.2 mM ammonium fluoride in water
Mobile phase B100% methanol
Sample purgeACN/MeOH/IPA/Water: [1:1:1:1 with 0.1% formic acid v/v/v/v]
Sample washACN/MeOH/IPA: [20:40:40 with 0.1% formic acid v/v/v]
Seal washMeOH/Water [90/10, v/v]
Flow rate0.40 mL/min
Column oven65 ± 5 °C
Sample manger8 ± 5 °C
Injection10.0 µL
LC Gradient
Flow (mL/min)Time (Min)Pump A%Pump B%
0.4Initial5050
0.40.105050
0.43.03565
0.43.101288
0.48.50100
0.49.00100
0.410.50100
0.4115050
0.413.05050
MS Parameters
Mode and polarityAPCI +/−
Scan type(MRM)
Source temperature (°C)500
APCI Probe temp. (°C)500
Desolvation gas flow (L/h)1000
Cone gas flow (L/h)150
Corona pin voltage (kV)3.0 kV (+tive mode of ionization) and 2.80 kV (−tive mode ionization)
Nebulizer gas flow (Bar)7
Table 2. MRM transitions for targeted SHs and internal standards (IS) and results of extraction efficiency (EE) study.
Sr. No.Name of the Steroids and Hormones (Molecular Weight in Da)Details of MRM Parameters, Retention Time (RT), and Ion Ratios (SHs and IS)Evaluation of SPE Efficiency of Targeted SHs
(Average Area ± RSD at MQC, n = 4)
Parent IonProduct Ion
(Q1, Q2)
CV
(V)
CE
(Q1, Q2)
(eV)
Within-Batch Stability (n = 26)Details of the Internal Standard (IS)
Used for Quantification
Ion Ratio (Q2/Q1 ± % RSD)RT ± Stdev.Name of ISIS MRM
Transition
RT ± Stdev. (IS)CV
(V)
CE
(eV)
HLBMCXMAX
Steroids
1Ergosterol (396)379.00253.00, 295.002015, 150.6619 ± 2.856.72 ± 0.02NANANANANA625,181 a ± 9.0393,706 b ± 3.736,738 c ± 15.6
2Epi Coprostanol (388)371.1095.00, 109.033024, 240.4881 ± 3.307.06 ± 0.02NANANANANA463,104 a ± 4.158,545 b ± 4.876,129 b ± 11.2
3Cholesterol (386)369.4095.20, 147.002038, 380.2278 ± 2.267.11 ± 0.02Cholesterol d7376.50 > 160.907.09 ± 0.0220223,419,103 a ± 4.4633,836 b ± 0.6808,024 b ± 10.8
4Coprostanol (388)371.2195.00, 109.003018, 240.7135 ± 3.247.34 ± 0.02NANANANANA483,266 a ± 4.598,376 b ± 2.8122,289 b ± 12.7
5Cholestanol (388)371.4095.00, 109.003032, 300.5976 ± 2.157.34 ± 0.02NANANANANA655,427 a ± 4.5136,824 b ± 2.2170,979 b ± 12.5
6Campesterol (400)383.40147.05, 94.992530, 300.7288 ± 1.967.37 ± 0.02NANANANANA1,191,273 a ± 4.8211,903 b ± 1.1275,635 b ± 9.6
7Desmosterol (384)367.2081.20, 95.302050, 500.6954 ± 2.527.38 ± 0.02NANANANANA1,097,725 a ± 4.0155,213 b ± 0.6209,846 b ± 11.0
8Stigmasterol (412)395.4081.10, 83.101537, 170.7923 ± 3.717.39 ± 0.02NANANANANA983,741 a ± 4.9122,557 b ± 1.1155,351 b ± 8.4
9Beta sitosterol (414)397.30147.05, 161.173524, 241.0878 ± 2.477.63 ± 0.02NANANANANA2,638,114 a ± 5.1468,256 b ± 1.9606,609 b ± 9.9
10Stigmastanol (416)399.2695.00, 109.043520, 200.6754 ± 2.347.87 ± 0.02NANANANANA490,392 a ± 4.286,668 c ± 0.5114,266 b ± 10.6
Hormones
11Equilenin (266)267.10209.03, 194.01834, 180.3385 ± 6.852.20 ± 0.01NANANANANA599,672 a ± 0.5393,706 b ± 3.7331,612 c ± 4.0
12Equilin (268)-266.95142.88, 264.943535, 350.6667 ± 4.642.37 ± 0.02NANANANANA364,391 a ± 1.1204,613 b ± 3.4171,654 c ± 3.1
1317 Alpha dihydroequlin (270)-269.19195.10, 181.052050, 501.1271 ± 4.822.39 ± 0.02NANANANANA123,337 a ± 4.898,560 b ± 4.580,726 c ± 3.1
1417 Beta estradiol (272)-271.00144.89, 182.904040, 401.0364 ± 5.552.43 ± 0.0217 Beta estradiol d4275.00 > 186.902.43 ± 0.024040297,140 a ± 1.4218,896 b ± 4.7180,570 c ± 2.8
15Estriol (288)271.07132.99, 159.003519, 190.7618 ± 7.892.51 ± 0.02NANANANANA2,715,259 a ± 1.01,541,987 b ± 2.51,271,781 c ± 2.9
16Norethindrone (298)299.10109.00, 231.103126, 200.274 ± 5.532.51 ± 0.02Norethindrone d6305.15 > 237.352.48 ± 0.022520599,669 a ± 2.3356,057 b ± 2.5293,135 c ± 2.7
17Estrone (270)-269.00144.90, 182.904037, 350.1515 ± 4.942.51 ± 0.02Estrone 2,3,4 13 13C3272.10 > 148.002.51 ± 0.0240401,422,038 a ± 1.1796,730 b ± 2.8644,303 c ± 3.2
1817 Alpha Ethinyl estradiol (296)279.30159.00, 132.90208, 120.9835 ± 4.082.51 ± 0.02Ethinyl estradiol d4299.00 > 146.762.49 ± 0.0215401,536,082 a ± 2.81,052,247 b ± 2.0866,339 c ± 2.2
19Androstenedione (286)287.1097.00, 109.004022, 240.688 ± 7.312.57 ± 0.02Androstene 3,17 dione 13C3290.14 > 100.032.57 ± 0.022020284,362 a ± 2.0269,325 a ± 2.7220,032 b ± 4.3
2017 Alpha estradiol (272)-271.01144.89, 182.914040, 400.3092 ± 5.042.67 ± 0.0217 Beta estradiol d4275.00 > 186.902.43 ± 0.024040429,770 a ± 2.3288,300 b ± 5.1235,498 c ± 4.5
21Testosterone (288)289.0097.03, 109.051524, 240.8871 ± 5.922.82 ± 0.02Testosterone d3292.16 > 97.032.80 ± 0.021524274,572 a ± 0.5201,858 b ± 0.4168,043 c ± 5.1
22Norgestrel (312)313.20109.00, 245.103826, 180.6239 ± 8.513.18 ± 0.02Norgestrel d6319.30 > 251.123.15 ± 0.022520429,995 a ± 1.0219,172 b ± 2.5181,053 c ± 2.8
23Progesterone (314)315.2097.00, 109.003822, 240.8817 ± 9.153.85 ± 0.20Progesterone d9324.23 > 99.873.84 ± 0.012220274,572 a ± 5.0142,145 b ± 2.9130,306 c ± 1.7
24Androsterone (290)273.05255.02, 147.043522, 150.3579 ± 5.803.90 ± 0.01Androsterone d4295.40 > 259.303.89 ± 0.013520430,044 a ± 0.6257,091 b ± 2.6214,604 c ± 3.3
25Mestranol (310)311.20121.00, 146.953525, 250.1691 ± 9.094.09 ± 0.01NANANANANA755,652 a ± 1.7340,778 b ± 3.3321,768 b ± 1.7
26Desogestrel (310)293.00146.95, 172.962020, 200.7968 ± 6.934.09 ± 0.01NANANANANA5,527,326 a ± 1.02,279,912 b ± 2.72,154,891 c ± 1.6
27Beta Estradiol 3 benzoate (376)377.20104.81, 76.633045, 250.18 ± 9.484.35 ± 0.02NANANANANA507,504 a ± 2.068,375 b ± 1.979,020 b ± 4.6
NA—Not Applicable. Q1—Quantifier Ion, Q2—Qualifier Ion, CV—Cone Voltage, CE—Collision Energy, MRM—Multiple-Residue Monitoring, RT—Retention Time, RSD—Relative Standard Deviation, Stdev—Standard Deviation, IS—Internal Standard, MQC—Mid-Quality Control, MCX—Mixed-Mode Cation Exchange, HLB—Hydrophilic–Lipophilic Balance, MAX—Mixed-Mode Anion Exchange. Mean in each row with different superscripts for evaluation of extraction efficiency (a > b > c) indicating that they are significantly different (p < 0.05) from each other.
Table 3. Results for method validation parameters for SHs.
Sr. No.Name of the SHsResults for Method Validation
Specificity
(%)
Matrix
Effect (%)
Linearity
Range (µµg/L)
Coefficient of Determination (r2) and % Deviation from Back-Calculated Concentration of Linear Calibration Curve (Average of Results from Day 1, 2, and 3 Validation Trials)E-LOD (µg/L)E-LOQ (µg/L)T-LOQ (µg/L)MU (@Mean Calculated Concentration at LOQ ± MU) µg/L
r2L1L2L3L4L5L6L7L8
1Ergosterol0.00−4.3840.0–600.00.963113.32−24.45−7.81−2.36−0.35−4.3416.949.195.91638.23540.00039.891 ± 7.096
2Epi Coprostanol5.8834.9210.0–150.00.967312.02−22.09−3.91−8.34−9.524.6213.599.540.9658.55510.0008.184 ± 0.595
3Cholesterol17.718.7340.0–600.00.973911.94−22.86−6.644.07−1.98−2.1111.409.1713.05733.04740.00035.317 ± 9.396
4Coprostanol11.7718.2510.0–150.00.967811.54−19.48−8.99−6.01−7.563.3713.659.911.188.47610.0007.529 ± 0.945
5Cholestanol11.6918.7410.0–150.00.965412.44−21.81−7.34−7.52−8.054.3515.448.761.0178.21510.0007.854 ± 0.845
6Campesterol3.070.7620.0–300.00.968811.56−20.61−6.13−7.75−6.923.1814.408.041.7717.11120.00014.600 ± 4.778
7Desmosterol0.005.1720.0–300.00.980310.87−21.23−4.61−2.650.655.213.577.733.55115.99420.00015.406 ± 4.868
8Stigmasterol11.044.4220.0–300.00.969011.63−20.62−6.00−7.08−7.371.8013.1210.902.45717.48120.00016.719 ± 1.989
9Beta sitosterol11.255.2220.0–300.00.971112.81−23.17−5.88−7.31−8.234.3913.9510.061.89816.91720.00015.575 ± 3.646
10Stigmastanol11.044.4220.0–300.00.968111.71−20.54−6.11−8.29−6.543.2914.858.442.4717.10420.00016.719 ± 1.989
11Equilenin0.00−3.351.0–15.00.99235.83−13.131.48−3.250.20−1.962.755.070.0660.9011.0000.948 ± 0.081
12Equilin0.00−2.1510.0–150.00.98397.65−13.47−2.51−9.45−3.506.834.147.261.1518.74910.0009.283 ± 1.658
1317 Alpha dihydroequlin0.003.3310.0–150.00.99343.35−4.07−6.910.420.613.25−0.555.212.7148.64310.0009.991 ± 1.243
1417 Beta estradiol12.493.610.0–150.00.99262.37−4.33−1.43−0.36−7.425.381.602.031.2889.79110.0008.439 ± 1.454
15Estriol0.00−4.390.2–3.00.99394.50−8.92−0.09−3.70−0.69−3.351.878.130.0220.1620.2000.175 ± 0.022
16Norethindrone0.00−1.641.0–15.00.99542.37−6.773.20−1.833.57−0.16−1.20−0.120.2750.8471.0000.851 ± 0.197
17Estrone0.00−2.4910.0–150.00.99553.14−6.34−1.610.783.452.983.37−3.251.4759.08710.0009.15 ± 1.125
1817 Alpha Ethinyl estradiol0.00−3.7720.0–300.00.98946.21−13.620.00−2.125.00−0.913.431.752.6418.43910.0008.437 ± 1.969
19Androstenedione0.00−3.430.2–3.00.99354.00−9.75−0.62−0.072.675.52−0.75−2.870.0430.1860.2000.186 ± 0.032
2017 Alpha estradiol0.008.8510.0–150.00.9911−0.20−1.816.76−0.86−5.363.37−2.040.081.0558.26410.0008.306 ± 0.815
21Testosterone0.001.150.2–3.00.99214.33−10.501.112.003.643.002.31−4.120.0740.2060.2000.208 ± 0.054
22Norgestrel0.00−1.511.0–15.00.99072.10−5.92−3.757.456.031.65−0.47−6.340.2370.9641.0000.873 ± 0.172
23Progesterone0.00−1.420.2–3.00.99384.67−7.58−6.71−0.57−0.445.155.27−0.470.0510.1880.2000.188 ± 0.037
24Androsterone0.002.231.0–15.00.97993.03−7.700.124.599.88−4.20−2.701.660.3890.8661.0000.915 ± 0.056
25Mestranol0.00−3.8920.0–300.00.98757.35−13.85−3.68−3.411.81−2.937.225.906.19916.49420.00016.834 ± 2.976
26Desogestrel0.58−6.990.2–3.00.98707.33−14.00−1.20−8.27−1.87−0.553.5210.420.050.1720.2000.172 ± 0.037
27Beta Estradiol 3 benzoate0.00−10.921.0–15.00.960213.339.42−15.35−15.98−5.750.3113.3917.260.1340.8741.0000.804 ± 0.101
ME: Matrix Effect, E-LOD: Estimated Limit of Detection, E-LOQ: Estimated Limit of Quantification, T-LOQ: Targeted Limit of Quantification, MU: Measurement Uncertainty.
Disclaimer/Publisher’s Note: The statements, opinions and data contained in all publications are solely those of the individual author(s) and contributor(s) and not of MDPI and/or the editor(s). MDPI and/or the editor(s) disclaim responsibility for any injury to people or property resulting from any ideas, methods, instructions or products referred to in the content.