Article

Study on the Evaluation System of Rock Mass Quality of Slopes Under the Influence of Freeze–Thaw Cycles

1
Shanjin Design Consulting Co., Ltd., Yantai 264000, China
2
School of Resources and Civil Engineering, Northeastern University, Shenyang 110819, China
3
Changchun Gold Research Institute Co., Ltd., Changchun 130012, China
*
Author to whom correspondence should be addressed.
Appl. Sci. 2025, 15(18), 10010; https://doi.org/10.3390/app151810010
Submission received: 14 July 2025 / Revised: 8 September 2025 / Accepted: 9 September 2025 / Published: 12 September 2025
(This article belongs to the Special Issue Rock Mechanics and Mining Engineering)

Abstract

This study takes the Wushan open-pit mine, a typical open-pit mine in cold regions, as the engineering background. Based on the measured extreme temperature values of slope rock masses over one year, a freeze–thaw cycle testing scheme is designed. By conducting experiments under varying numbers of freeze–thaw cycles and burial depths, the degradation patterns of uniaxial compressive strength and tensile strength of the rock are revealed. The rock material constant m i , representing the rock’s hardness and brittleness, is calculated based on the experimental results. Furthermore, shear tests are carried out on rock masses containing through-going structural planes and infill materials to derive the variation patterns of cohesion and internal friction angle. A comprehensive analysis is conducted on the effects of freeze–thaw cycling and burial depth on rock mechanical properties and infill material parameters, leading to the construction of a spatial variability characterization model for mechanical parameters. Finally, the rock mass fracture coefficient K w and infill fracture coefficient K f are proposed to modify the Hoek–Brown failure criterion under freeze–thaw conditions, thereby providing theoretical support for slope stability analysis and engineering design in cold regions.

1. Introduction

In open-pit slope engineering in cold regions, freeze–thaw-induced degradation of rock masses is one of the key factors affecting slope stability and failure modes. Freeze–thaw action not only reduces the intrinsic strength of the rock itself but also induces strength deterioration and permeability changes in weak structural features such as joints and interlayers, thereby significantly altering the overall stability of the slope. Against this background, many researchers in recent years have conducted extensive studies on the mechanical property changes, failure mechanisms, and energy responses of rock materials under freeze–thaw conditions, yielding fruitful results.
Yu et al. [1] systematically analyzed the mechanical behavior and permeability evolution of sandstone under varying numbers of freeze–thaw cycles and confining pressures through triaxial compression tests, revealing the coupling mechanism between freeze–thaw degradation and confining stress. Gao et al. [2] and Wang et al. [3] further investigated the fracture evolution paths, energy dissipation processes, and damage development laws of sandstone and marble under freeze–thaw conditions, highlighting the critical influence of initial freeze–thaw cycles on rock failure behavior. These findings have provided important theoretical foundations for understanding the mechanisms by which freeze–thaw cycles affect rock mechanical properties.
Building on this, research has gradually extended to the degradation response at the rock mass structural level. Fu et al. [4] studied the mechanical characteristics and failure modes of fault gouge interlayered rock masses, revealing the strength evolution mechanisms of highly weathered mudstone, argillaceous interlayers, and weak interlayered mudstone under different interlayer angles and confining pressures. Huang et al. [5], Li et al. [6], and Tan et al. [7] focused on shear behavior, creep properties, and failure modes involving dual weak interlayers in fault zones, clarifying the controlling role of interlayer materials in slope instability. These studies, from a structural perspective, have deepened the understanding of slope degradation mechanisms.
However, in actual slope rock masses, weak interlayers, saturated structural planes, and heterogeneous infilling materials are often present. Their shear strength and degradation mechanisms are more complex and require further investigation based on microscopic structures and rheological properties. Luo et al. [8] studied the effects of different filling degrees and moisture contents on the shear strength of weakly interlayered joints under multistage normal stress, finding that the peak shear strength first increases and then decreases with water content, while it first decreases and then stabilizes with increasing filling degree. Wu et al. [9] examined the influence of infill thickness on joint shear strength and failure modes. Naghadehi et al. [10] proposed a new predictive model for shear strength based on different infill materials such as clay and sand. Jahanian et al. [11] conducted a comparative analysis of forward and reverse shear responses under different roughness and infill conditions, revealing the coupling relationship between infill characteristics and surface roughness. Hu et al. [12] found through shear tests at varying saturation levels that increased saturation significantly reduces both peak and residual shear strength. Gong et al. [13] used FLAC/two-phase flow coupling simulations to analyze the shear behavior of unsaturated jointed soils, emphasizing the role of shear-induced changes in effective stress and permeability evolution. Ju et al. [14] systematically reviewed the controlling mechanisms of structural surface strength influenced by interlayer strength, interface angle, and dynamic loads. Ladanyi and Archambaul [15] defined the filling degree as the ratio of interlayer thickness to surface undulation amplitude ( t / a ) and identified it as a key parameter governing shear strength evolution. Indraratna et al. [16] further pointed out that when t / a is within the range of 1.4–1.8, surface roughness has the dominant influence; beyond this range, shear behavior is primarily governed by the infill material.
Meanwhile, the Hoek–Brown strength criterion, widely used in engineering for rock mass strength estimation, has also received significant attention in terms of its applicability and parameter degradation mechanisms under freeze–thaw conditions. Lin et al. [17] used the Hoek–Brown criterion to calculate slope safety factors before and after freeze–thaw cycles, finding that freeze–thaw significantly reduces the compressive strength of granite and leads to a decrease in safety factor. Luo et al. [18] established a mapping relationship between the Geological Strength Index ( G S I ) and the Tianshan Slope Mass Rating ( T S M R ), analyzing rock mass stability characteristics. Chen et al. [19] proposed a negative exponential degradation model for Hoek–Brown parameters ( G S I and m i ) with increasing freeze–thaw cycles in fractured rock masses, and derived a shear formulation of the criterion. Cao et al. [20], focusing on tunnel frost damage control, proposed an elasto-plastic solution for frost heave force based on the nonlinear Hoek–Brown criterion, pointing out that reduced G S I and increased disturbance parameter D significantly enlarge the plastic zone and frost heave response. Rezaei et al. [21] applied the Hoek–Brown criterion to develop a numerical model for slope stability in the Angouran open-pit mine, and validated its accuracy through monitoring data, achieving a coefficient of determination of R 2 .
In summary, current studies have systematically revealed the mechanisms through which freeze–thaw environments affect slope rock mass stability, from the perspectives of material degradation, structural weakening, and mechanical modeling. However, most existing research is based on uniformly set temperature conditions and idealized structural assumptions, lacking full consideration of the coupling relationship among burial depth, temperature, and structural surface degradation under actual mining conditions. In particular, empirical corrections to the Hoek–Brown criterion parameters remain insufficient.
To address these limitations, this study takes the Wushan open-pit mine—a representative cold-region open-pit mine—as the engineering background. Based on in situ measurements, the annual extreme temperatures corresponding to different burial depths are extracted to design a freeze–thaw cycle testing scheme representative of real engineering conditions. A systematic analysis is conducted on the evolution of mechanical properties of rock specimens and typical infill materials under freeze–thaw effects. The rock material constant   m i is calculated based on test results, and combined with the Geological Strength Index ( G S I ) and the generalized Hoek–Brown strength criterion to correct the parameter degradation model and construct a spatial variability characterization model for mechanical parameters. Furthermore, numerical simulation and strength reduction methods are used to evaluate slope safety factors and potential failure modes. This study not only enhances the field applicability of rock mass degradation mechanisms but also provides theoretical and practical support for extending and modifying the Hoek–Brown criterion in freeze–thaw environments.

2. Project Overview

2.1. Engineering Background

The Wushan open-pit mine covers an area of 9.84 km2 and exhibits the typical characteristics of low resource grade (average copper grade of 0.29% and molybdenum grade of 0.039%), high mining intensity (processing capacity of 75,000 tons/day and annual ore handling of 24.75 million tons), large mining depth (current slope height exceeds 200 m, with a designed final slope height difference of approximately 510 m), steep slope angles (overall slope angle of 43–45° and bench face angle of 65°), high clay mineral content in the surrounding rock (locally up to 60%), and pronounced freeze–thaw effects (annual temperature variation exceeding 80 °C).
Due to long-term high-intensity mining combined with structural disturbances, joint development, water infiltration, and freeze–thaw processes, the stability and safety of the rock mass have been continuously deteriorating. Therefore, evaluating the mechanical parameters of slope rock masses under freeze–thaw conditions is crucial for ensuring safe production in open-pit mines.

2.2. Relationship Between Rock Mass Temperature and Burial Depth

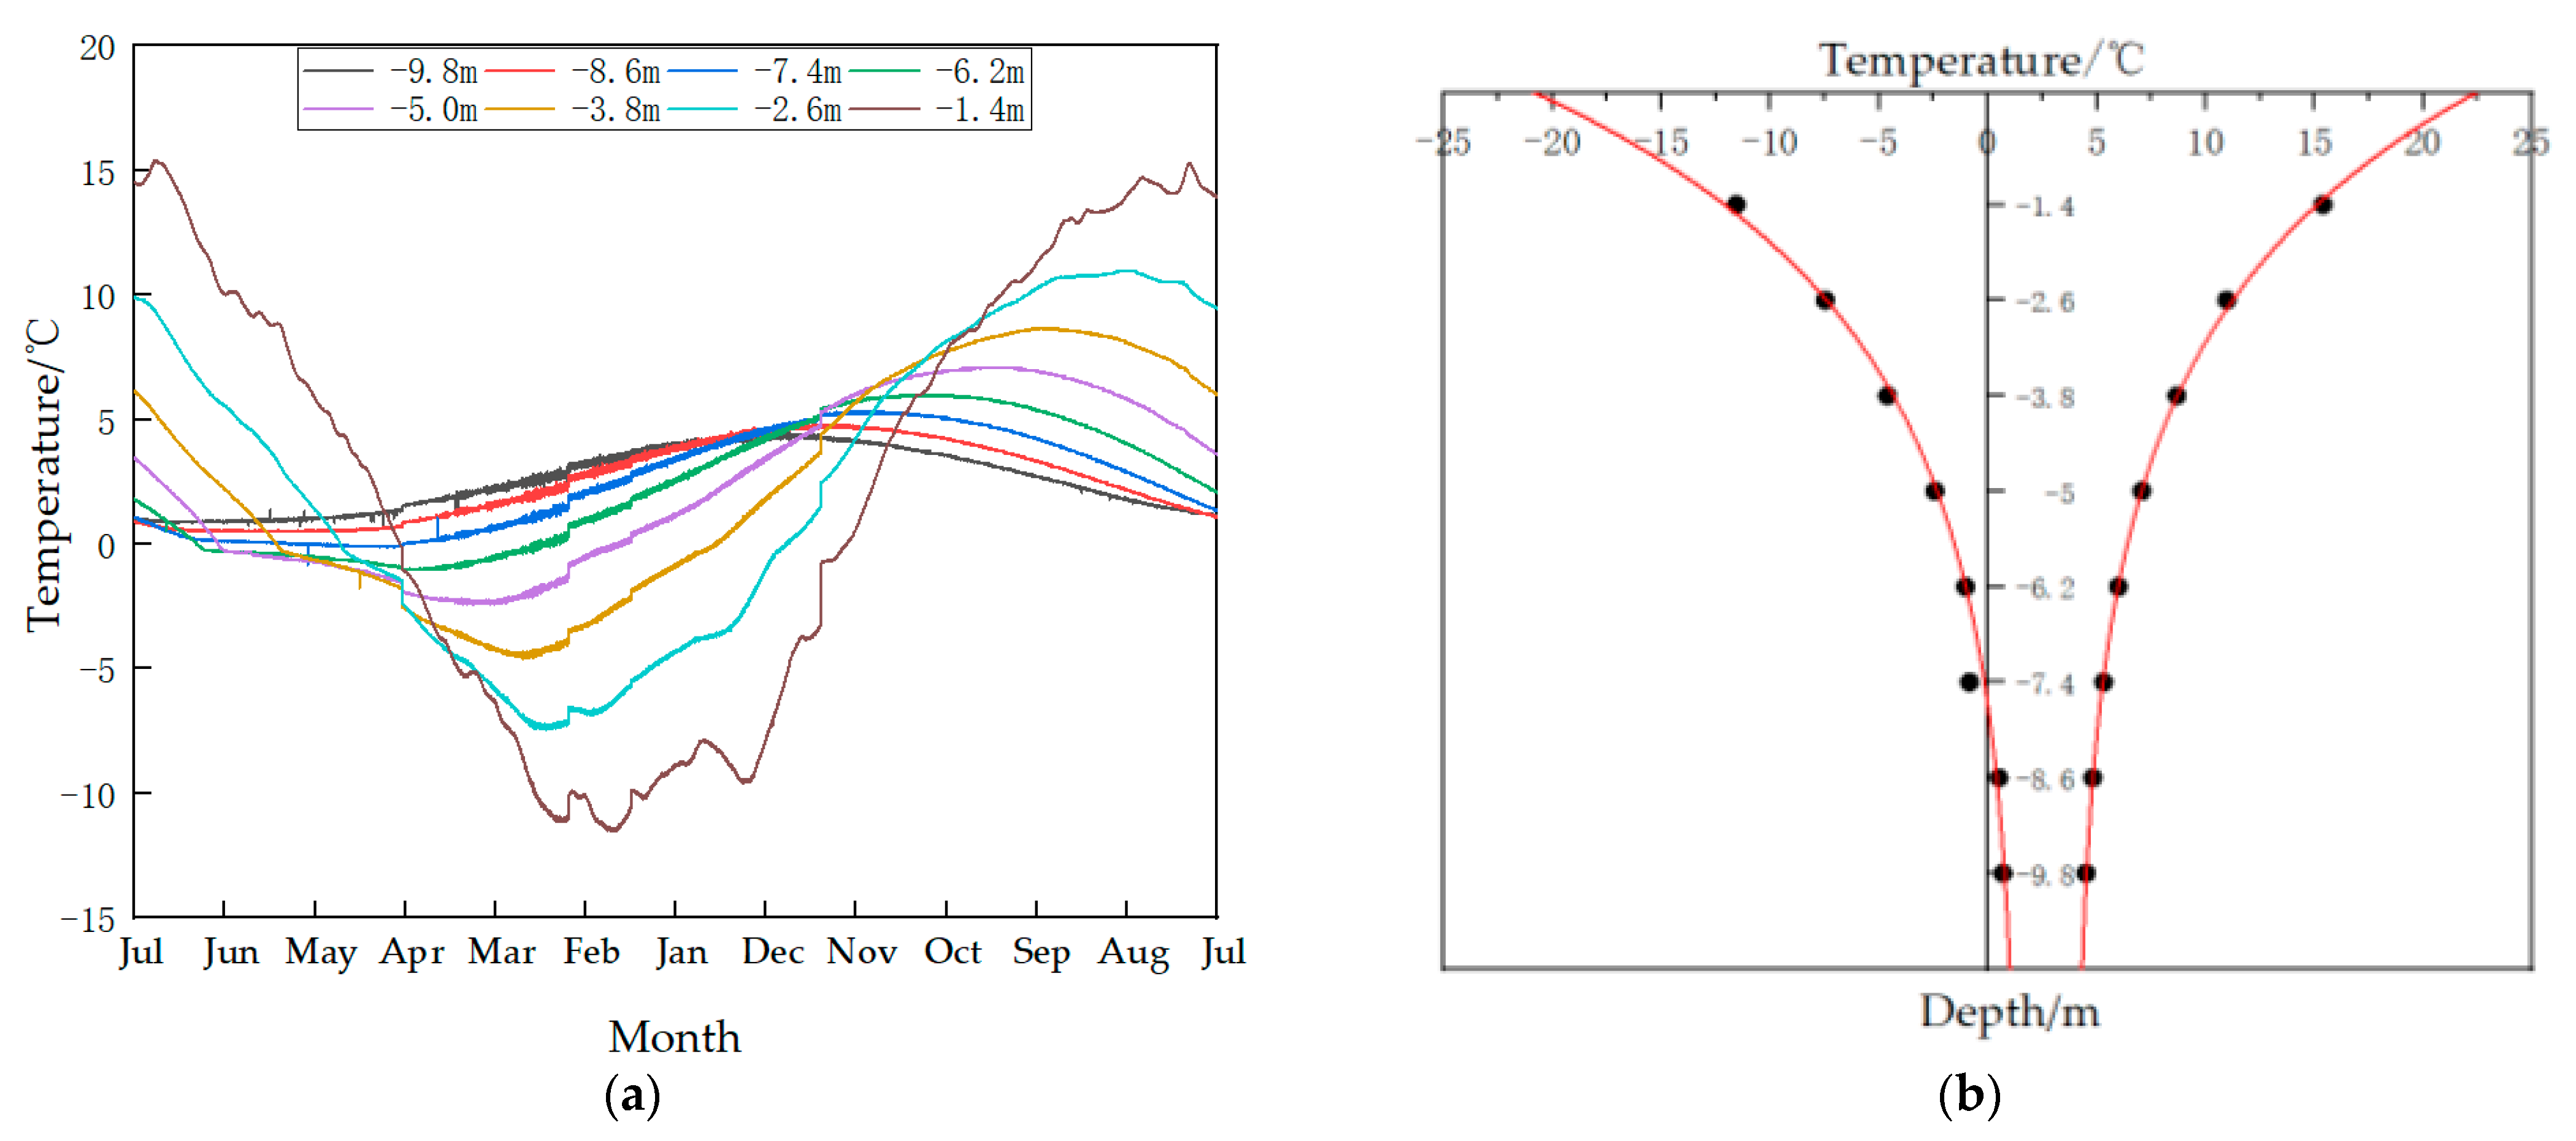
Figure 1a illustrates the temporal variation in rock mass temperature at different depths of the Wushan open-pit slope. It can be observed that the overall temperature follows a sinusoidal trend consistent with seasonal cycles. However, response characteristics vary with depth: shallow rock masses experience frequent heat exchange with the atmosphere, resulting in significant and rapid temperature fluctuations; in contrast, deep rock masses are less influenced by atmospheric conditions, leading to reduced temperature amplitude and slower variation rates.
Furthermore, Figure 1b presents the distribution of temperature extremes at various depths. As depth increases, both positive and negative temperature extremes gradually converge, with the convergence rate decreasing with depth. Notably, the depth at which the negative temperature extreme approaches 0 °C is approximately 7.5 m, which can be regarded as the maximum freezing depth of the rock mass in this region.

3. Uniaxial Compressive Strength and Tensile Strength Testing of Rock Specimens

3.1. Specimen Preparation and Testing Scheme

3.1.1. Preparation Method of Cylindrical Specimens

According to the testing standards of the International Society for Rock Mechanics (ISRM), granite collected from the 795 m platform of the Wushan open-pit mine was processed into standard cylindrical specimens with dimensions Φ50 mm × 100 mm, and standard Brazilian disc specimens with dimensions Φ50 mm × 25 mm. The dimensional tolerances were controlled within ±0.3 mm for diameter and height, and the end face flatness within ±0.5 mm.
After machining, the specimens were subjected to ultrasonic velocity testing using a sonic pulse velocity tester to ensure quality consistency. Specimens with wave velocities deviating by more than ±100 m/s from the average were excluded, as shown in Figure 2a,b.
Given the low porosity of granite, the specimens were saturated using a two-step procedure: first vacuum saturation for 8 h, followed by natural water immersion for 48 h. After the specimens reached constant mass, surface moisture was gently wiped off, and the specimens were wrapped with plastic film to prevent moisture loss during the freeze–thaw process.

3.1.2. Testing Method for Mechanical Properties

The freeze–thaw temperatures in this experiment were set based on the actual temperature variation ranges of rock masses at different burial depths. Each freeze–thaw cycle consisted of a freezing phase and a thawing phase, both lasting 4 h. The number of cycles was set to 0, 5, 10, 15, and 20. The detailed testing scheme is shown in Table 1.
After completing the prescribed number of freeze–thaw cycles, uniaxial compression tests and Brazilian splitting tests were conducted. A displacement-controlled loading method was adopted, with a displacement rate of 0.002 mm/s.

3.2. Analysis of Experimental Results for Mechanical Properties

To systematically evaluate the coupled effects of freeze–thaw cycling and burial depth on the mechanical properties of the material, a series of uniaxial compressive strength and tensile strength tests were conducted after different numbers of freeze–thaw cycles at four burial depths: 0.10 m, 1.88 m, 3.50 m, and 5.27 m. The results are shown in Table 2 and Table 3 and Figure 3.
The uniaxial compressive strength results show that, before freeze–thaw (i.e., 0 cycles), the specimens from all depths had nearly identical strengths (approximately 98.4 MPa), indicating a highly consistent initial mechanical state. However, with increasing freeze–thaw cycles, the compressive strength exhibited a clear downward trend, and the rate of decline was more pronounced in shallow specimens. After 20 cycles, the strength of the shallowest specimen (0.10 m) dropped to 30.72 MPa, representing a reduction of over 68%; whereas the deepest specimen (5.27 m) retained a strength of 45.87 MPa, with a smaller reduction of approximately 53%. This suggests that greater burial depth reduces the weakening effect of freeze–thaw on compressive failure, indicating a potential “burial depth buffering effect”.
Tensile strength showed a similar trend. Initially, specimens at all depths had a tensile strength of 7.06 MPa. With more freeze–thaw cycles, this strength gradually declined. After 20 cycles, the shallow specimen (0.10 m) decreased to 3.30 MPa, and the deep specimen (5.27 m) decreased to 3.91 MPa, corresponding to reductions of approximately 53% and 45%, respectively. Compared to compressive strength, the reduction in tensile strength was slightly less pronounced, suggesting that the tensile failure mechanism may possess greater resistance to freeze–thaw disturbances, though significant degradation still occurs.
In summary, freeze–thaw cycling significantly weakens both the compressive and tensile strength of the material, and this degradation becomes more severe with decreasing burial depth, showing a typical pattern of “higher sensitivity at shallow depths and slower degradation at greater depths.” Among the two, compressive strength is more sensitive to freeze–thaw damage, likely due to mechanisms involving pore expansion, microcrack development, and cumulative frost heave stress. This pattern offers valuable reference for evaluating material degradation and analyzing the durability of engineering structures in cold regions.

3.3. Quantification of Rock Mass Mechanical Parameters Under Freeze–Thaw Cycles

The rock material constant m i , which characterizes the hardness and brittleness of intact rock, can be calculated using Equation (1). By analyzing the degradation of m i under freeze–thaw conditions, the influence of freeze–thaw on intact rock can be directly reflected in the mechanical parameters of the rock mass [22]:
m i = 16 σ t σ c σ c σ t
In Equation (1), σ t represents the indirect tensile strength of the rock, and σ c denotes the uniaxial compressive strength of the rock.
By substituting the uniaxial compressive strength and indirect tensile strength of the rock obtained from laboratory tests after freeze–thaw cycles into Equation (1), the variation in the rock material constant m i with respect to burial depth and number of freeze–thaw cycles can be determined. The calculation results are presented in Table 4.

4. Shear Tests on Through-Going Structural Planes and Infill Materials Under Freeze–Thaw Cycles

4.1. Shear Tests on Through-Going Structural Planes Under Freeze–Thaw Cycles

4.1.1. Processing and Preparation of Through-Going Structural Plane Specimens

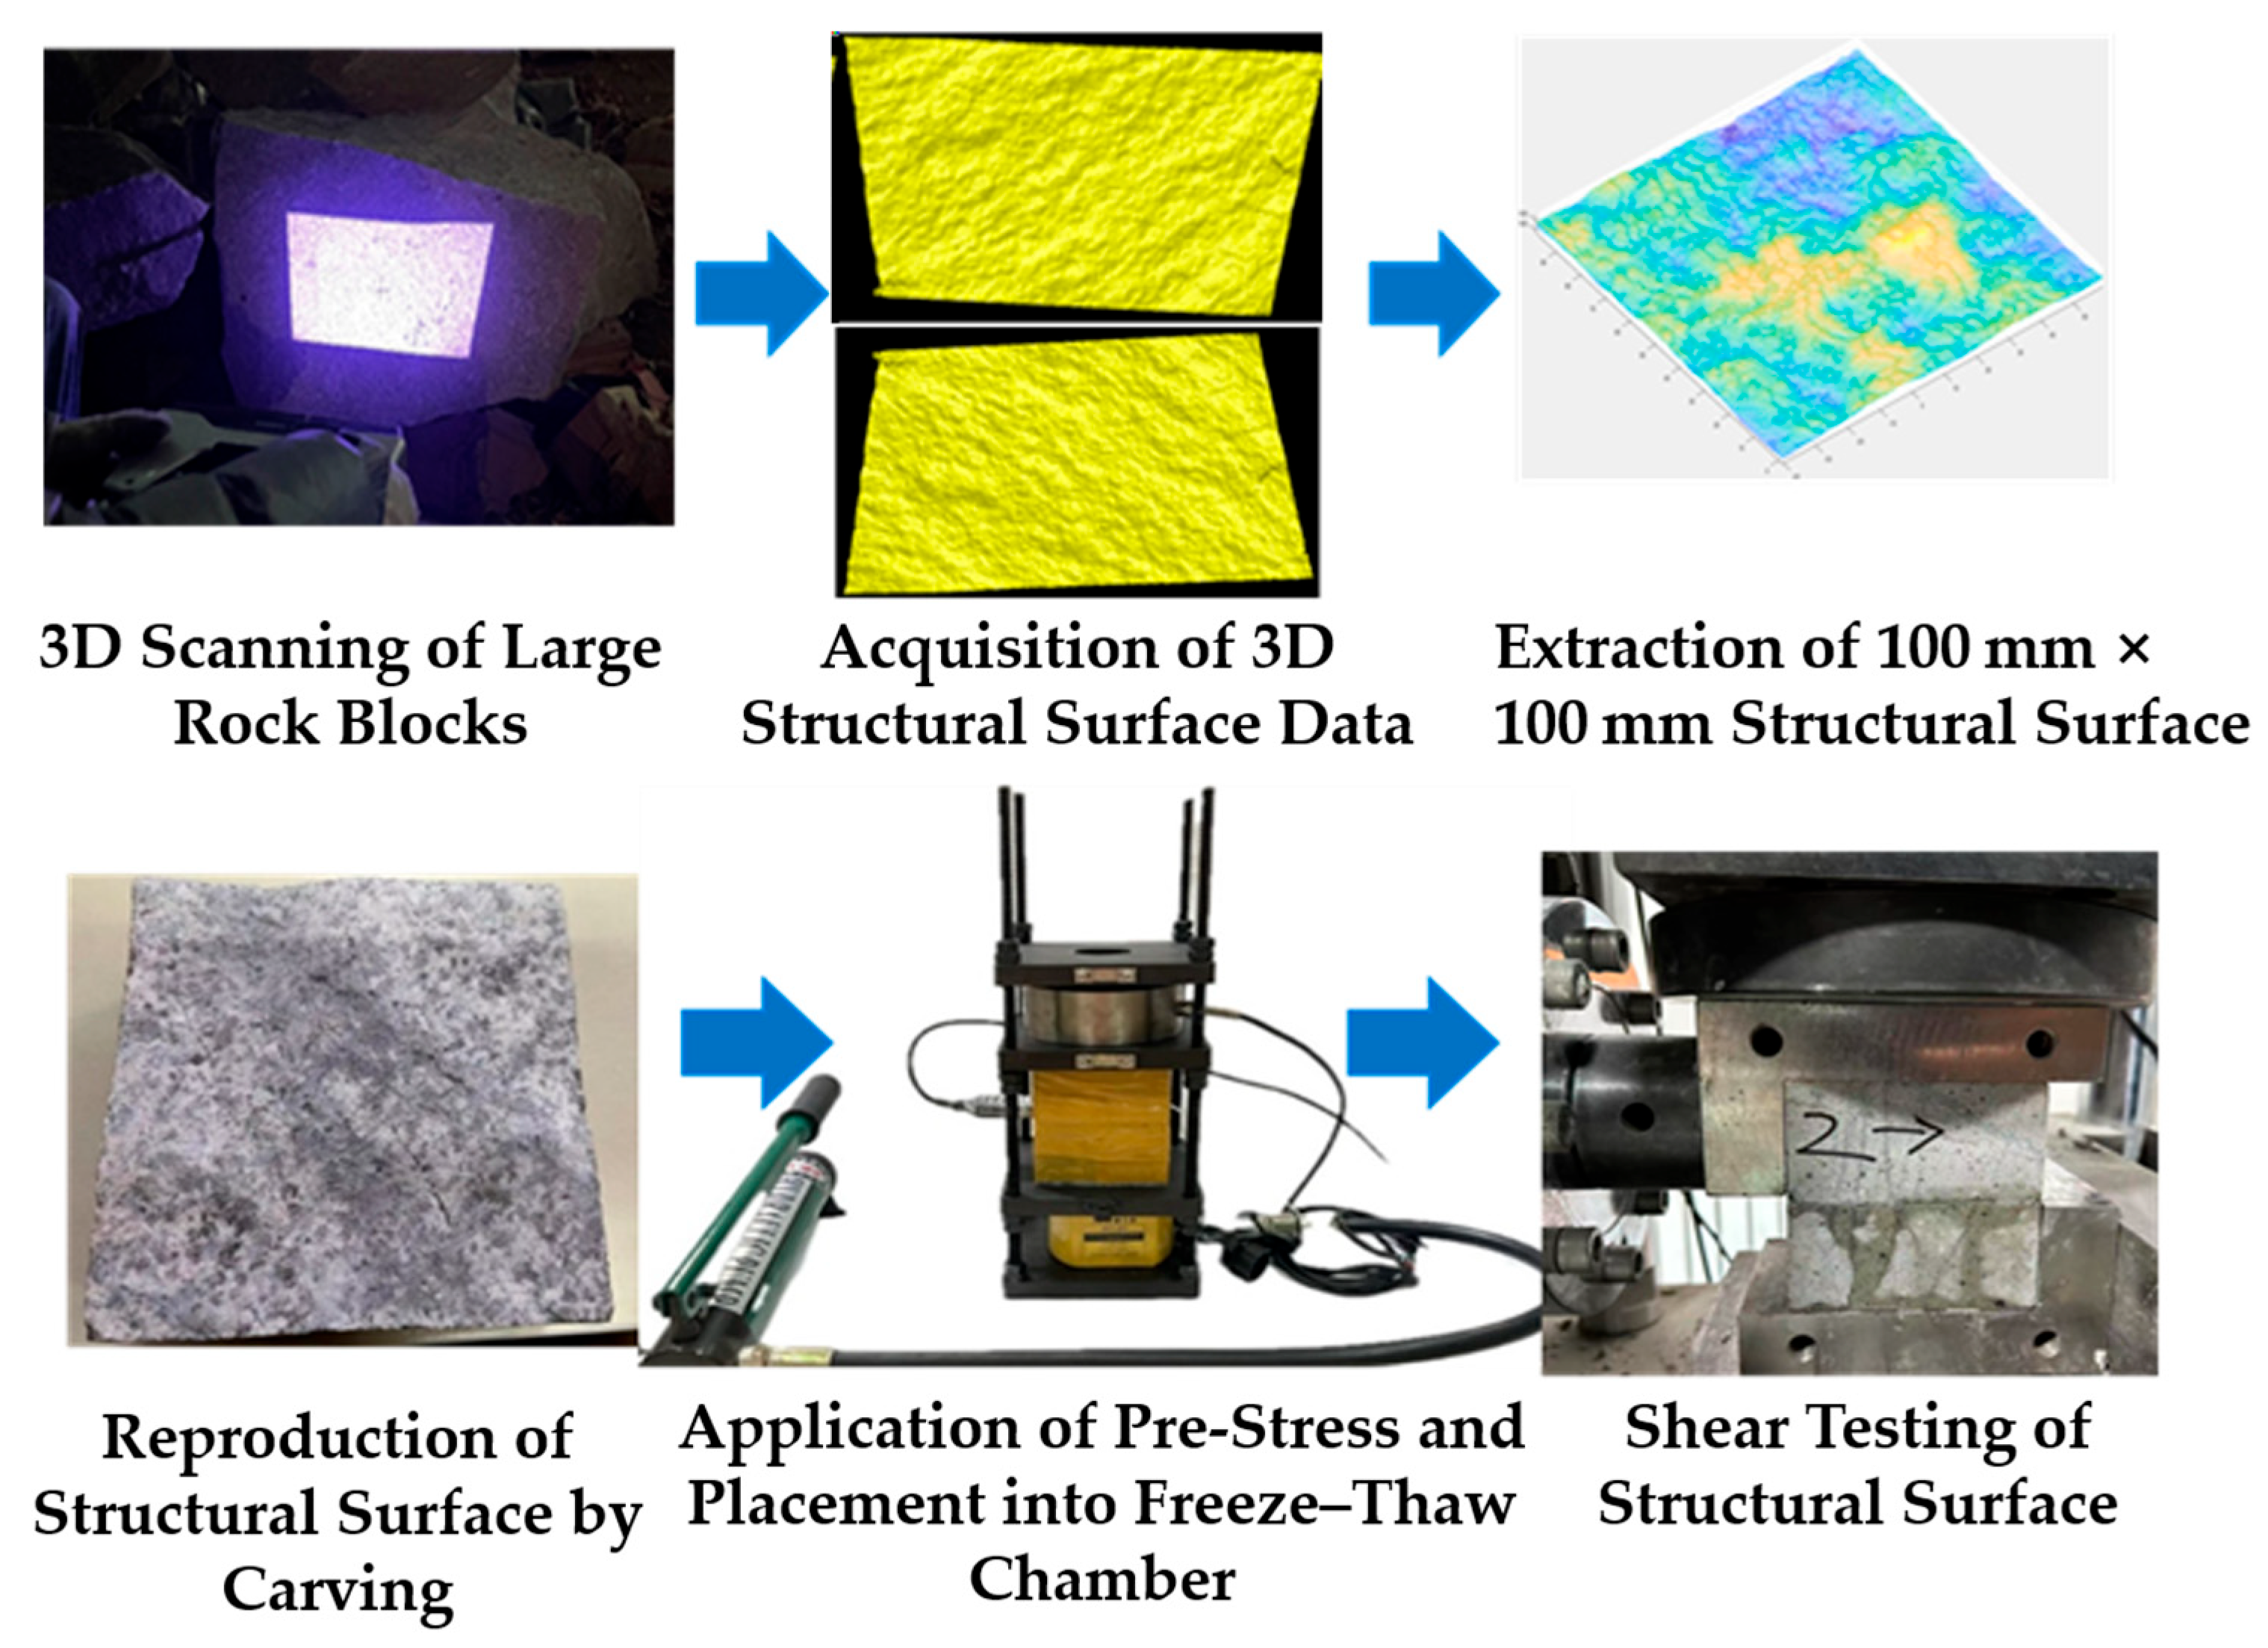
According to the testing standards of the International Society for Rock Mechanics (ISRM), granite collected from the 795 m platform of the Wushan open-pit mine was processed into standard cubic specimens with dimensions of 100 mm × 100 mm × 100 mm. The procedures for unifying the structural surface morphology and the experimental process are as follows, with a schematic flowchart shown in Figure 4:
(1)
The structural surfaces of large rock blocks obtained from the reference mine were scanned using 3D scanning technology.
(2)
The 3D point cloud data of the structural surfaces were acquired, and surface roughness values were calculated.
(3)
The structural surfaces were trimmed to 100 mm × 100 mm for ease of engraving;
(4)
Stone carving techniques were used to replicate the structural surfaces onto each cubic specimen, ensuring uniform morphology and reducing variability in the experimental results caused by surface differences.
(5)
The engraved structural surfaces were re-scanned, and their roughness parameters were recalculated to verify the consistency of the JRC values after replication;
(6)
A clamping device was used to apply prestress to the prepared specimens, which were then placed in a freeze–thaw chamber to initiate coupled freeze–thaw–loading testing. The freeze–thaw cycles were set as follows: freezing temperature −20 °C, freezing duration 4 h; thawing temperature 20 °C, thawing duration 4 h; with cycle counts of 5, 10, 15, and 20.
(7)
After completing the freeze–thaw cycles, shear tests were conducted on the structural planes of the specimens.

4.1.2. Shear Testing Method for Through-Going Structural Planes

The freeze–thaw temperatures in this test were determined based on the actual temperature variation ranges of rock masses at different burial depths. Each freeze–thaw cycle consisted of a 4 h freezing phase and a 4 h thawing phase, with the total number of cycles set to 0, 5, 10, 15, and 20. The detailed testing scheme is shown in Table 5.
After completing the prescribed number of freeze–thaw cycles, direct shear tests were conducted. The applied normal stress in the shear tests was set to 1 MPa, and the normal loading during the test was controlled using a displacement-controlled method, with a loading rate of 0.002 mm/s.

4.1.3. Analysis of Experimental Results for Through-Going Structural Planes

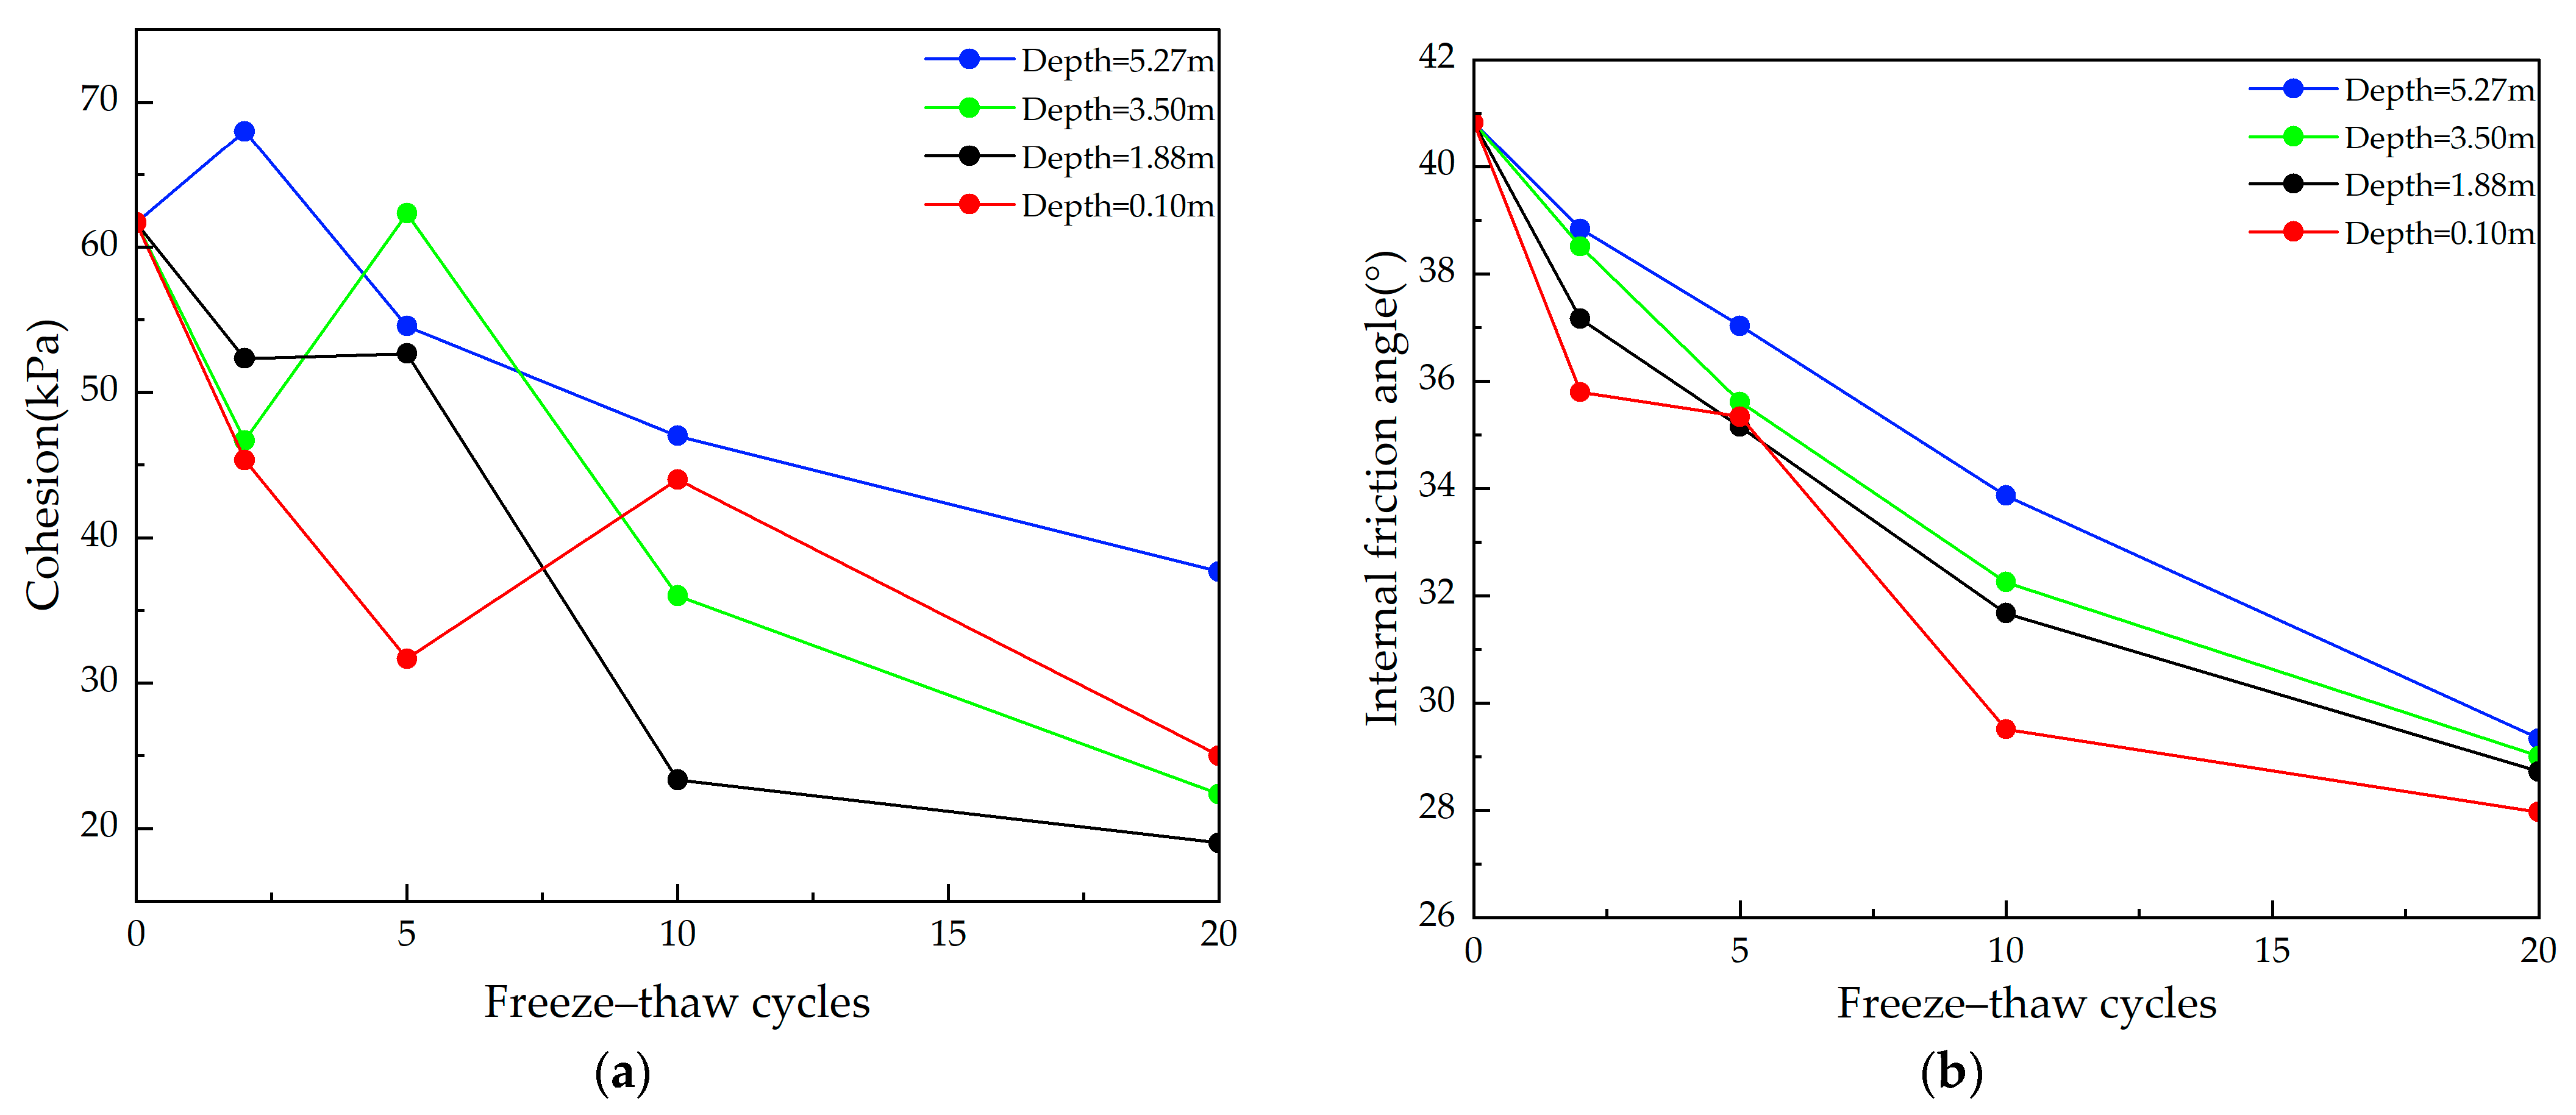
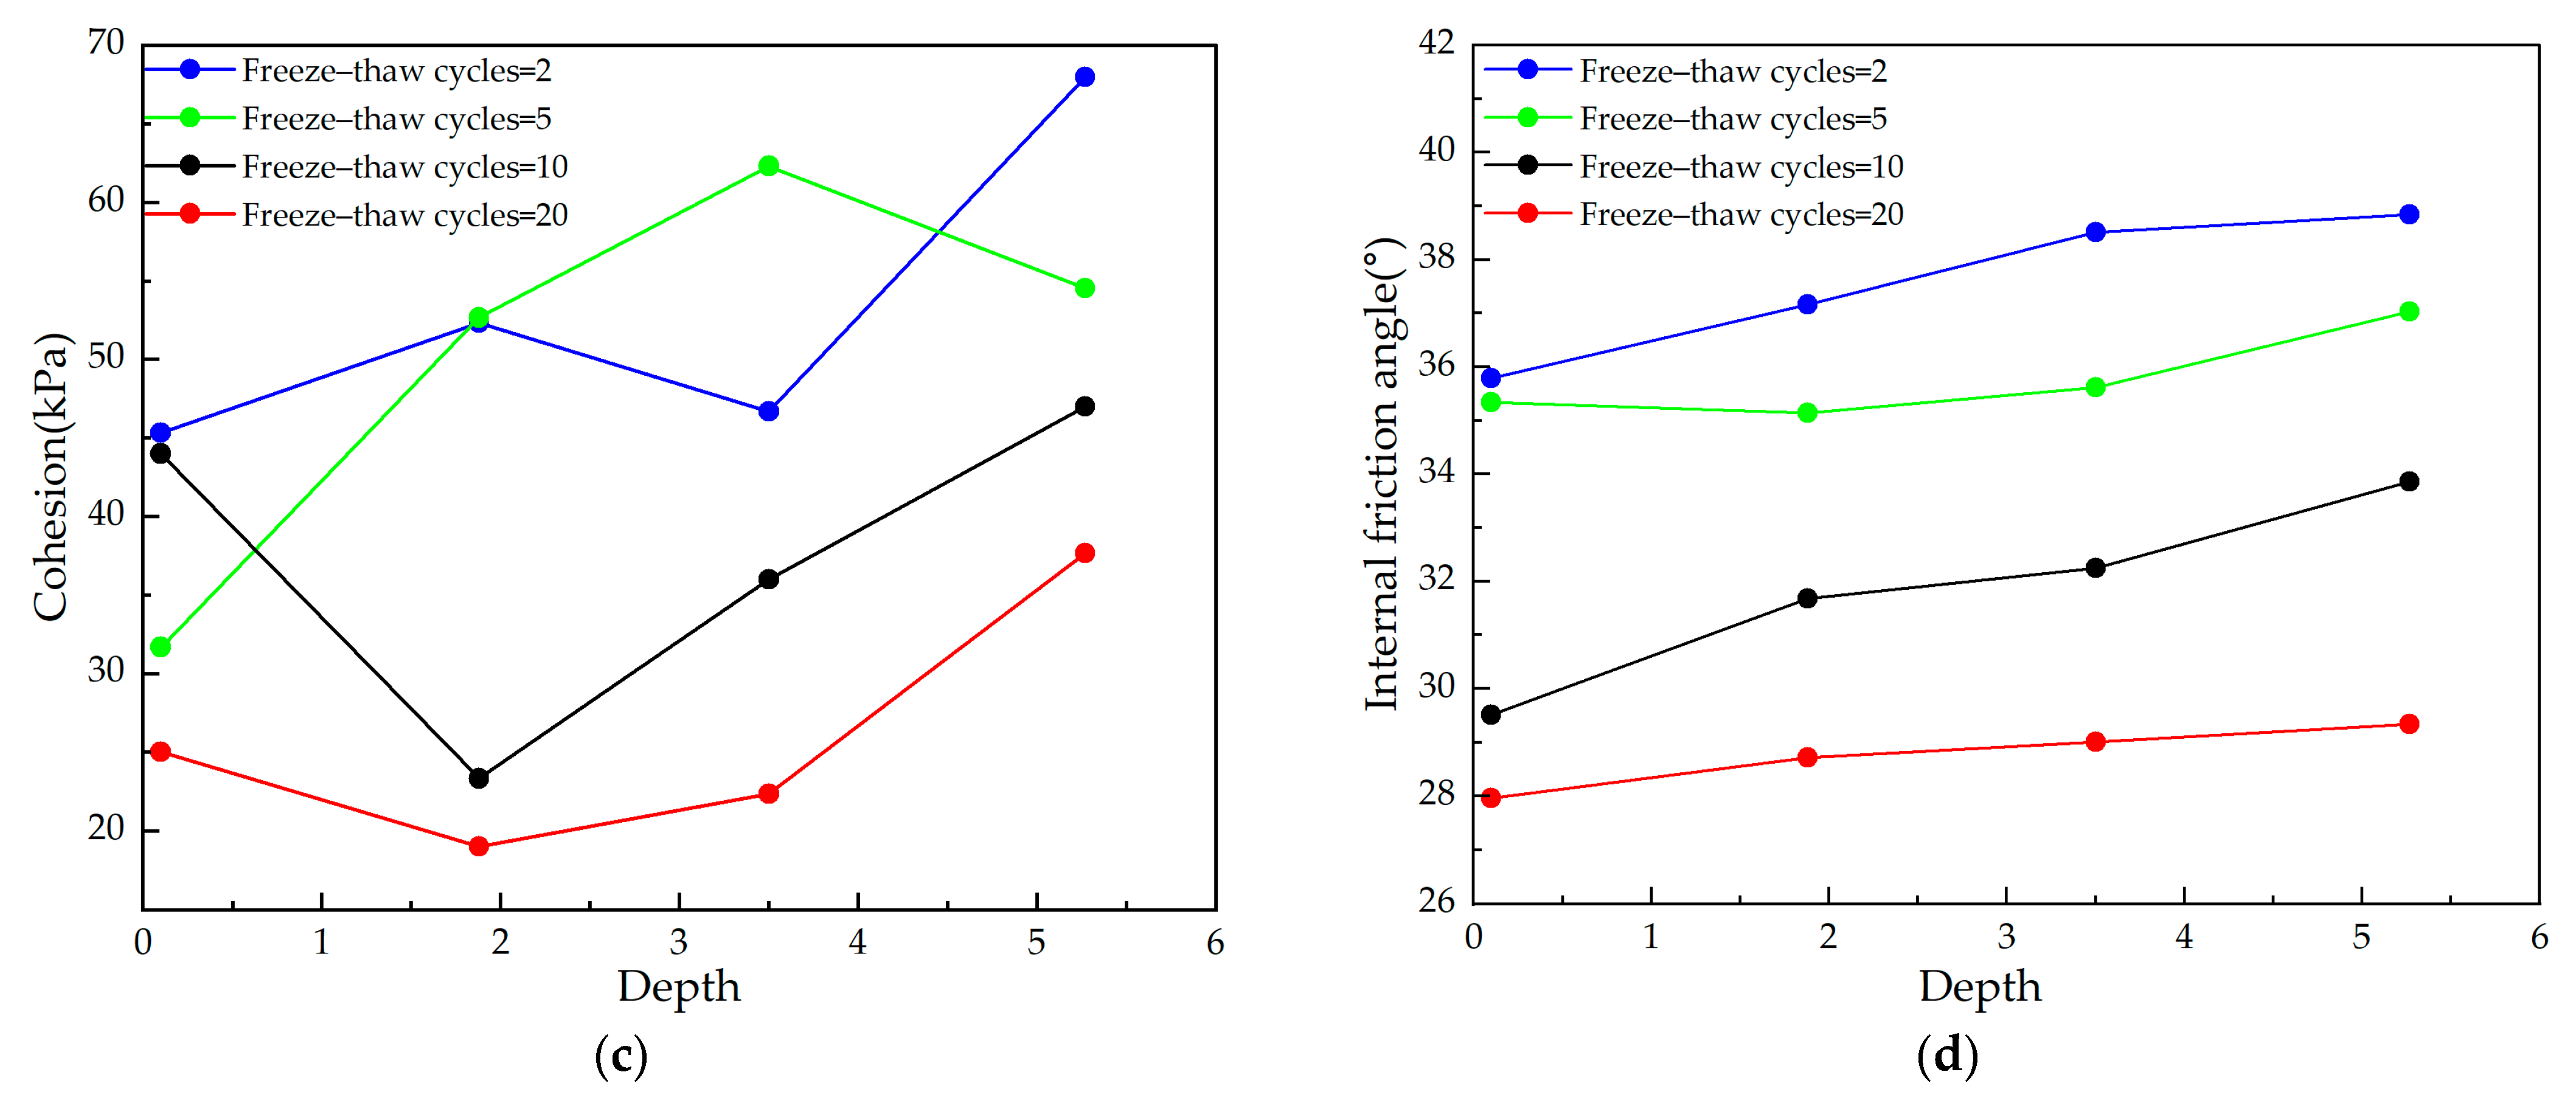
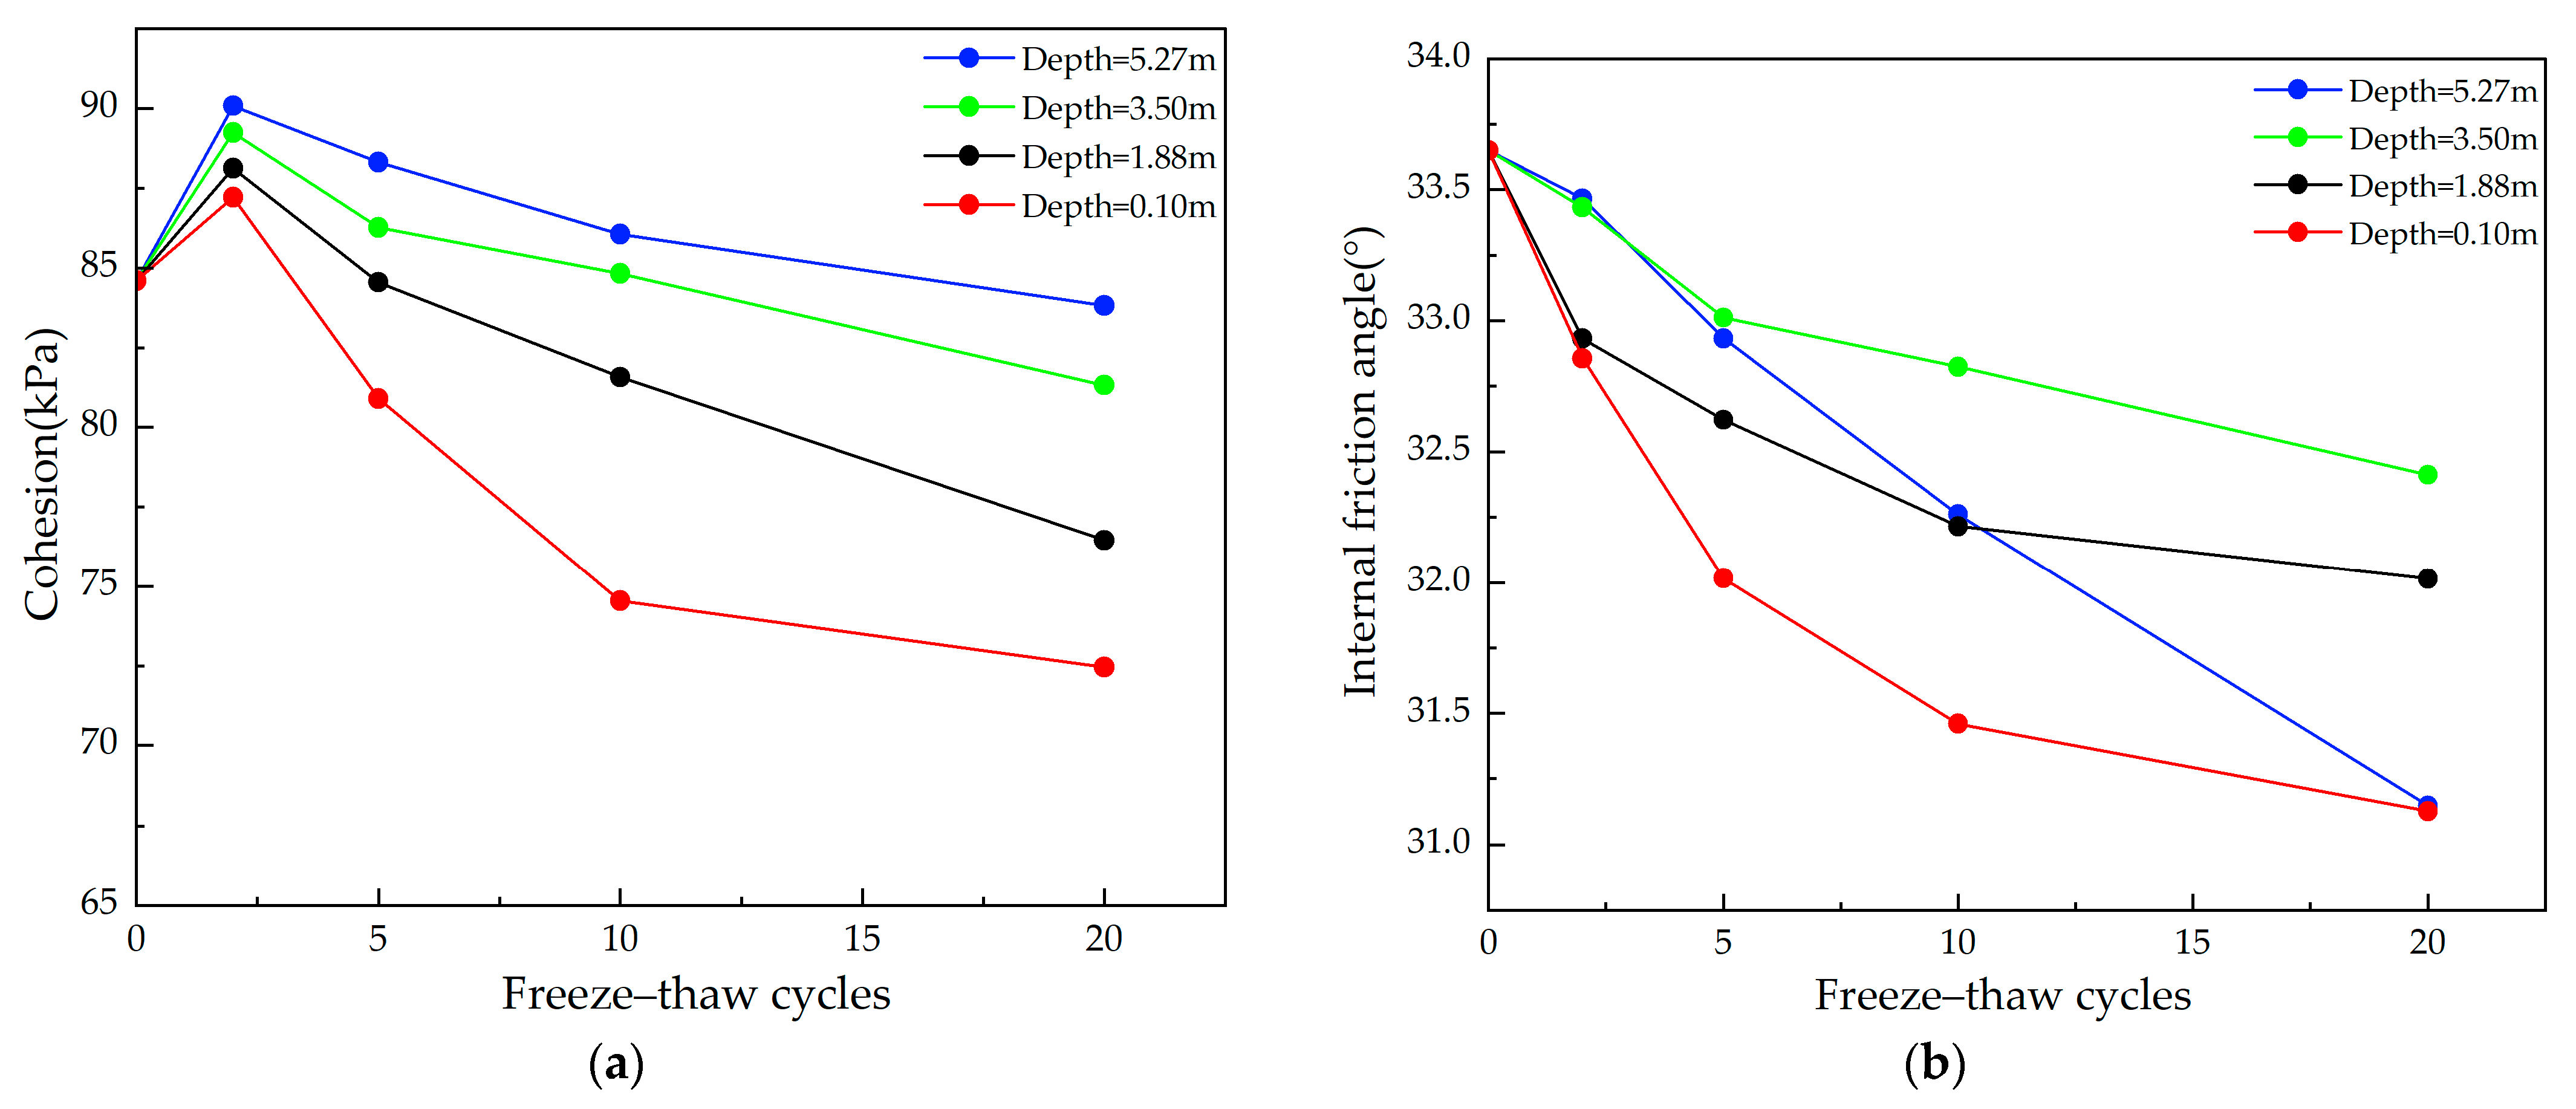
To further investigate the evolution of shear strength parameters of through-going structural planes under the coupled effect of freeze–thaw cycles and burial depth, representative structural plane specimens at depths of 0.10 m, 1.88 m, 3.50 m, and 5.27 m were selected for direct shear tests after 0, 1, 5, 10, and 20 freeze–thaw cycles. The resulting trends in cohesion and internal friction angle are shown in Figure 5.
The shear strength parameters of through-going structural planes exhibit high sensitivity to freeze–thaw disturbances, generally showing a progressive decline with increasing number of cycles. This degradation process is significantly influenced by burial depth. In shallow structural planes (e.g., 0.10 m), intense freeze–thaw-induced cracking, interface opening, and structural disturbance are observed. After 20 cycles, cohesion and internal friction angle decreased by approximately 22% and 2.6°, respectively, indicating a pronounced structural vulnerability. In contrast, deeper structural planes (e.g., 5.27 m) experience weaker temperature gradients, reduced moisture migration, and less intense freeze–thaw stress fields, leading to significantly lower degradation rates. Their shear properties remain relatively stable, reflecting a “burial depth buffering effect.”
Interestingly, a slight increase in cohesion was observed across all depths after the first freeze–thaw cycle, which is presumed to result from a microstructural densification effect. This includes the closure of interface microcracks, rearrangement of bonded particles, or redistribution of capillary water, leading to localized bonding enhancement. However, this initial densification is short-lived. As the number of freeze–thaw cycles increases, interface roughness decreases, weak cementing materials deteriorate, and fracture propagation becomes dominant, resulting in a rapid decline in cohesion. In contrast, internal friction angle exhibits relatively minor variation, characterized by a gradual decrease and eventual stabilization, suggesting that frictional mechanisms at the structural interface possess certain resistance to freeze–thaw disturbances.
The degradation process of shear strength in through-going structural planes is clearly nonlinear and layered, governed jointly by the number of freeze–thaw cycles and burial depth. Cohesion is more sensitive to freeze–thaw effects and serves as the primary controlling parameter in shear deterioration. Meanwhile, burial depth influences the spatial–temporal evolution of structural plane parameters by regulating fracture strength, crack activity, and pore water migration. These findings provide theoretical support and parameter references for slope stability analysis and freeze–thaw disaster prediction in jointed rock masses in cold regions.

4.2. Shear Tests on Infill Materials Under Freeze–Thaw Cycles

4.2.1. Mixing and Preparation of Filling Material Specimens

The infill material used in this test was collected from structural planes of the Wushan open-pit slope and appears yellowish-brown in color. The natural water content of the sample was measured as 9%. After collection, the sample was sieved through a 5 mm mesh and then oven-dried at 104 °C for 24 h. It was subsequently rehydrated to a target moisture content of 9%.
The moistened infill material was compacted into cylindrical specimens with a diameter of 61.8 mm and a height of 20 mm using the mechanical compaction method. No fewer than 4 parallel specimens were prepared for each testing condition to ensure repeatability.

4.2.2. Shear Testing Method for Filling Materials

The freeze–thaw temperature conditions were set based on the actual temperature variation ranges of rock masses at different burial depths. Each freeze–thaw cycle consisted of a freezing phase and a thawing phase, both lasting 4 h. The number of cycles was set to 0 (no freeze–thaw), 5, 10, 15, and 20, in order to simulate different degrees of freeze–thaw damage. The detailed testing scheme is provided in Table 6.
After completing the prescribed number of freeze–thaw cycles, the specimens were subjected to direct shear testing using a strain-controlled shear apparatus. For each test condition, four specimens were prepared and tested under four different vertical stress levels. The selected stress levels were determined based on engineering relevance and the stiffness of the material, with efforts made to ensure uniform intervals between stress levels.
The vertical stresses were set to 100 kPa, 200 kPa, 300 kPa, 400 kPa, 600 kPa, and 800 kPa. These stress levels could be applied continuously and slowly in a single stage. For soft specimens, a stepwise loading approach was adopted to prevent extrusion or disturbance prior to shearing. The shearing process employed strain-controlled loading with a shearing rate of 2 r/min, to ensure stable and accurate data acquisition.
Three specimens were prepared for each condition. However, due to occasional abnormal failures during freeze–thaw or shear testing, only the most complete and reliable results were retained for analysis. Therefore, the present results mainly reflect the overall trends, and their statistical significance should be interpreted with caution.

4.2.3. Analysis of Experimental Results for Filling Materials

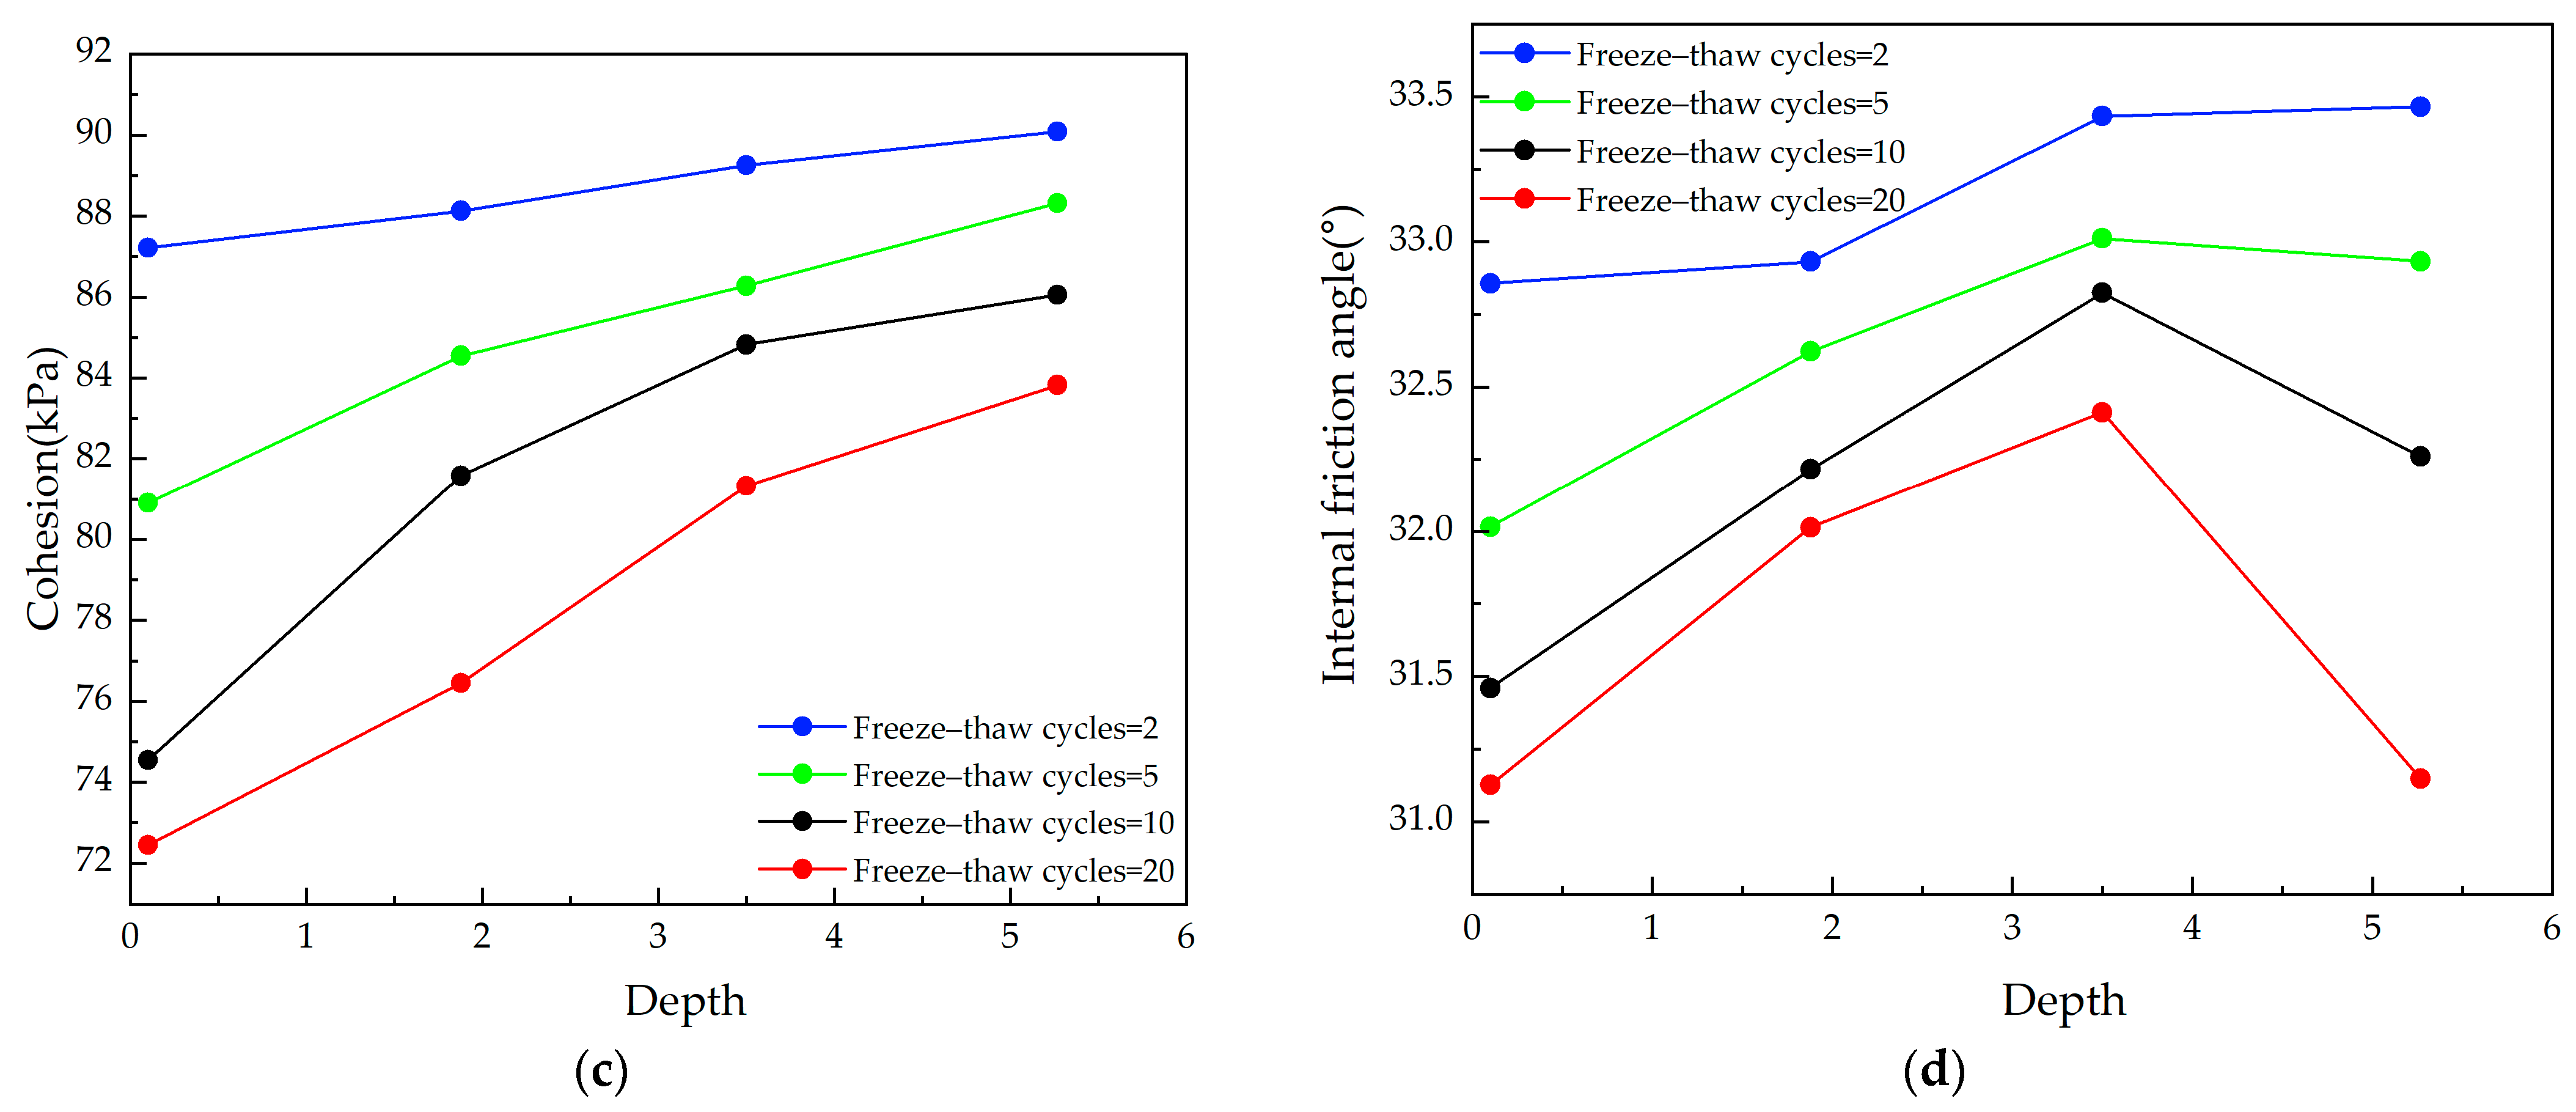
The experimental results indicate that the shear strength parameters of fault gouge are highly sensitive to freeze–thaw cycles, exhibiting a progressive degradation trend with increasing cycles, while burial depth exerts a significant regulating effect. Shallow specimens (0.10 m) were most vulnerable to freeze–thaw disturbance, with cohesion showing a cumulative reduction of more than 25% after 20 cycles, representing a pronounced degradation trend. In contrast, the internal friction angle decreased by approximately 2–3°. Although this magnitude of change is relatively small and may partly fall within the range of experimental uncertainty, the overall tendency still suggests a weakening of frictional resistance. Deep specimens (3.50 m and 5.27 m), on the other hand, were less affected by temperature gradients and moisture migration, and thus exhibited much smaller reductions in strength parameters, demonstrating greater resistance to freeze–thaw disturbance.
During the evolution of cohesion, specimens at different burial depths exhibited a slight increase after the first freeze–thaw cycle, followed by a rapid decrease, showing a characteristic “rise-then-fall” pattern. This phenomenon can be attributed to the temporary strengthening caused by microcrack closure and pore compaction during the initial freezing–thawing stage. However, such structural reinforcement is insufficient to withstand the fatigue damage and microstructural weakening induced by continuous cycles. In particular, under conditions of high water content and fine clay minerals in fault gouge, freeze–thaw cycling readily triggers particle rearrangement and cementation degradation, ultimately leading to a sharp reduction in cohesion.
The internal friction angle generally exhibited a slow decreasing trend with minor fluctuations. Its decline was modest (around 2–3°), and in some cases close to the level of measurement uncertainty, which warrants cautious interpretation. Nevertheless, shallow specimens still showed more pronounced frictional degradation than deeper ones, indicating that particle interlocking structures gradually break down under repeated freeze–thaw shear disturbance. Additionally, lubrication effects induced by high moisture conditions may further contribute to the reduction in friction angle.
Overall, the degradation of shear strength parameters in fault gouge is jointly controlled by freeze–thaw cycles and burial depth, with cohesion deterioration being the dominant mechanism, while the internal friction angle changes are smaller and less significant. Shallow fault gouge, due to its loose structure, high water content, and weak cementation, is more susceptible to freeze–thaw damage, whereas deeper fault gouge remains relatively intact and resistant. These findings provide important implications for the evaluation of strength degradation and slip potential in fault gouge zones under cold-region conditions. However, the role of the internal friction angle requires further confirmation through additional parallel tests in future work.

5. Study on the Evaluation System of Rock Mass Quality Under Freeze–Thaw Effects

5.1. Freeze–Thaw Rock Mass Hoek–Brown Strength Criterion

The fundamental assessment of rock mass quality serves as the starting point of the evaluation system. It quantifies the intrinsic stability of the rock mass before it is affected by external disturbances such as freeze–thaw cycles or excavation, by evaluating its natural mechanical properties and structural characteristics. This study adopts conventional rock mass classification systems—such as GSI, RMR, and the Q-system—as key references and applies adaptive modifications based on the characteristics of cold-region slopes.
Although RMR includes indices such as rock strength and R Q D , its weighting system is fixed (e.g., R Q D accounts for 20%), which limits its flexibility in reflecting dynamic changes caused by freeze–thaw effects. For example, freeze–thaw damage may drastically reduce RQD (due to core fragmentation), but R M R cannot distinguish whether such changes are inherent or induced by freeze–thaw processes. The Q-system, on the other hand, is more tailored for tunnel support design and includes parameters such as the number of joint sets, which may be less applicable to open-pit slopes. Moreover, the Q-system does not explicitly account for temperature field effects, making it difficult to extend directly to cold-region scenarios.
The Geological Strength Index ( G S I ), proposed by Hoek and Brown, was designed to quantify the overall strength of rock masses based on their structure and discontinuity characteristics. Its key advantage lies in simplifying complex rock mechanical behavior into a quantifiable rating system, applicable across a wide spectrum of rock mass conditions—from intact to heavily fractured. G S I effectively compensates for the limitations of traditional parameters like uniaxial compressive strength when describing the macroscopic mechanical behavior of fractured rock masses, especially those dominated by joints and fissures.
In cold-region slope engineering, rock mass stability depends not only on the intrinsic strength of the rock, but also on dynamic factors such as freeze–thaw cycling, crack propagation, and moisture migration. First, G S I is directly related to structural integrity; for example, volumetric joint count ( J v ) reflects how fracture density and distribution weaken rock strength. Second, GSI can be dynamically adjusted based on field survey results, such as joint parameters updated in real time via 3D laser scanning or UAV photogrammetry, thus accommodating structural changes caused by freeze–thaw cycles. Finally, GSI is a core parameter in the Hoek–Brown strength criterion, which facilitates mechanical parameter estimation and provides input for numerical simulation and slope stability analysis.
By capturing strong correlations between structural features and mechanical behavior, G S I overcomes the limitations of RMR and the Q-system, while its dynamic scoring system allows flexible incorporation of correction factors such as freeze–thaw, burial depth, etc., making it possible to quantify the cumulative damage effects caused by repeated freeze–thaw cycles.
Based on the findings of previous sections, this chapter proposes a Freeze–Thaw Rock Mass Hoek–Brown Strength Criterion, which incorporates the influence of freeze–thaw effects. This criterion uses G S I as the foundational metric and introduces two correction coefficients: the fracture degradation coefficient ( K W ) and the infill degradation coefficient ( K f ). These are used to obtain a modified GSI that reflects strength deterioration under freeze–thaw conditions. This modified G S I is then combined with the generalized Hoek–Brown strength criterion to calculate rock mass mechanical parameters under different numbers of freeze–thaw cycles, providing a scientific basis for slope design and maintenance in cold regions.
The G S I score ranges from 0 to 100, based on rock mass structure (e.g., block size, fracture development) and joint surface characteristics (e.g., roughness, weathering degree). Its calculation is expressed in Equation (2). The structural rating S R is determined by the volumetric joint count Jv (joints/m3); the surface condition rating S C R is derived from a combined evaluation of roughness, weathering, and infilling conditions. In this model, K W is introduced to represent freeze–thaw-induced degradation of through-going fractures, while K f quantifies the deterioration of infill material under freeze–thaw conditions. Both correction coefficients are normalized into the [0, 1] range to ensure compatibility with the original G S I (0–100) scale. For fractured or infilled rock masses affected by freeze–thaw, the weathering index R w and the infill condition R f are multiplied by their respective correction factors ( K W , K f ) to yield modified scoring inputs
Equations (2)–(5) were proposed in this study to extend the application of the rock mass degradation model to engineering quality indices. The establishment of these equations is based on the experimental results presented earlier and is integrated within the general framework of rock mass classification. It should be emphasized that these equations represent the original contribution of this work. Among them, the GSI [22] follows the conventional definitions and applications in rock mechanics. By combining such well-established indices with the degradation correction coefficients proposed in this study, the deterioration characteristics of rock mass under freeze–thaw conditions can be evaluated in a more consistent manner.
G S I = S R + S C R
S C R = R r + R w K w + R f   R o c k   m a s s   c o n t a i n i n g   d i s c o n t i n u i t i e s R r + R w + R f K f   R o c k   m a s s   c o n t a i n i n g   i n f i l l e d   j o i n t s

5.1.1. Correction of the Rock Mass Fracture Coefficient K W

The north slope of the Wushan open-pit mine has developed multiple sets of through-going fractures due to natural geological processes and external disturbances such as blasting and freeze–thaw cycling. These fractures, typically ranging from 3 m to 5 m in trace length, have resulted in a 40% reduction in the safety factor of the shallow rock mass. Through-going fractures are continuous cracks that penetrate entire rock layers or structural planes, significantly weakening the rock mass integrity and its shear strength. Their influence is primarily manifested through stress concentration at the fracture tips, which accelerates crack propagation; increased permeability that allows moisture infiltration and intensifies freeze–thaw damage; and structural instability, as the rock mass tends to fail along these weakened planes.
To quantify the weakening effect of such fractures on shear strength, this study introduces a fracture degradation coefficient, K W , which reflects the extent to which through-going fractures reduce the mechanical strength of the rock mass. Based on the shear test results for through-going structural planes presented in Section 4 (Figure 5), the shear strength of fractured rock masses was observed to decline by approximately 10–30%. Accordingly, K W is defined as the ratio of the mechanical parameter of the fractured rock mass to that of the intact rock mass:
K w = a c i c 0 + b φ i φ 0
In this equation, c and φ represent the cohesion and internal friction angle of the fractured rock mass, while c 0 and φ 0 denote the initial cohesion and internal friction angle of the intact rock mass. The coefficients a and b are the weighting factors assigned to cohesion and internal friction angle, respectively, satisfying the condition a + b = 1 . Their values are determined through iterative computation.

5.1.2. Correction of the Infill Degradation Coefficient K f

Weak interlayers (e.g., fault gouge) represent zones of reduced strength within a rock mass. Their impacts include strength softening—where the cohesion within the interlayer can be as low as 60% of that in intact rock; creep deformation—manifested as time-dependent strain under long-term loading, which may induce progressive failure; and increased permeability—since the interlayer facilitates moisture migration, exacerbating damage from freeze–thaw cycling.
To quantify the weakening effect of such infilled features, the infill degradation coefficient K f is introduced. This coefficient reflects the influence of materials such as fault gouge on the mechanical quality of the rock mass. A thicker weak interlayer corresponds to a lower value of K f . Based on shear tests on structural planes containing fault gouge (Section 4, Figure 6), it was observed that a 10 mm thick layer of fault gouge can reduce cohesion by approximately 30%. Accordingly, the expression for K f is provided in Equation (5):
K f = m c j c 0 + n φ j φ 0
In this equation, c and φ represent the cohesion and internal friction angle of the rock mass containing infill materials, while c 0 and φ 0 denote the initial cohesion and internal friction angle of the fractured (non-infilled) rock mass. The coefficients m and n are the weighting factors corresponding to cohesion and internal friction angle, respectively, and satisfy the constraint m + n = 1 . Their values are determined through iterative computation.

5.2. Application of Freeze–Thaw Rock Mass Hoek–Brown Strength Criterion

5.2.1. Example of Application of Freeze–Thaw Rock Mass Hoek–Brown Strength Criterion

Due to the presence of multiple faulted and fractured zones and the long-term influence of freeze–thaw cycling, the shallow rock mass on the north slope of the Wushan open-pit mine has experienced significant degradation, posing a potential sliding risk. By applying the proposed strength criterion, high-risk zones can be accurately identified, and targeted mitigation measures can be developed. This section uses the north slope of the Wushan open-pit mine as a case study to verify the practicality and accuracy of the Freeze–Thaw Rock Mass Hoek–Brown Strength Criterion.
Based on the engineering characteristics of the north slope and the design of correction coefficients in the proposed criterion, the application process is as follows:
(1)
First, the weathering degree R w and infill condition R f of the fractured rock mass and infilled rock mass under freeze–thaw conditions are modified by multiplying them with the correction coefficients K w and K f , respectively. This adjustment yields a revised structural surface rating ( S C R ), which is then used to obtain a modified G S I .
(2)
Next, the modified G S I values, combined with the rock material constant m i   obtained from Section 3, are substituted into the generalized Hoek–Brown strength criterion to calculate the mechanical parameters ( c , φ ) of rock masses at different depths and under different numbers of freeze–thaw cycles.
(3)
Finally, the calculated values of c and φ are compared with those obtained from laboratory tests (Appendix A), and the error between the two is used to assess the accuracy of the proposed method.
For the correction coefficients K w and K f , the weighting coefficients of cohesion and internal friction angle (a, b, m, and n) were determined by iterative calculation within the range (0, 0.1, …, 1). The optimal values were identified as those minimizing the total error between the corrected and measured mechanical parameters ( c , φ ), and these values were taken as the contribution coefficients. The final results of the iteration yielded a = b = 0.5 and m = 0.4, n = 0.6.
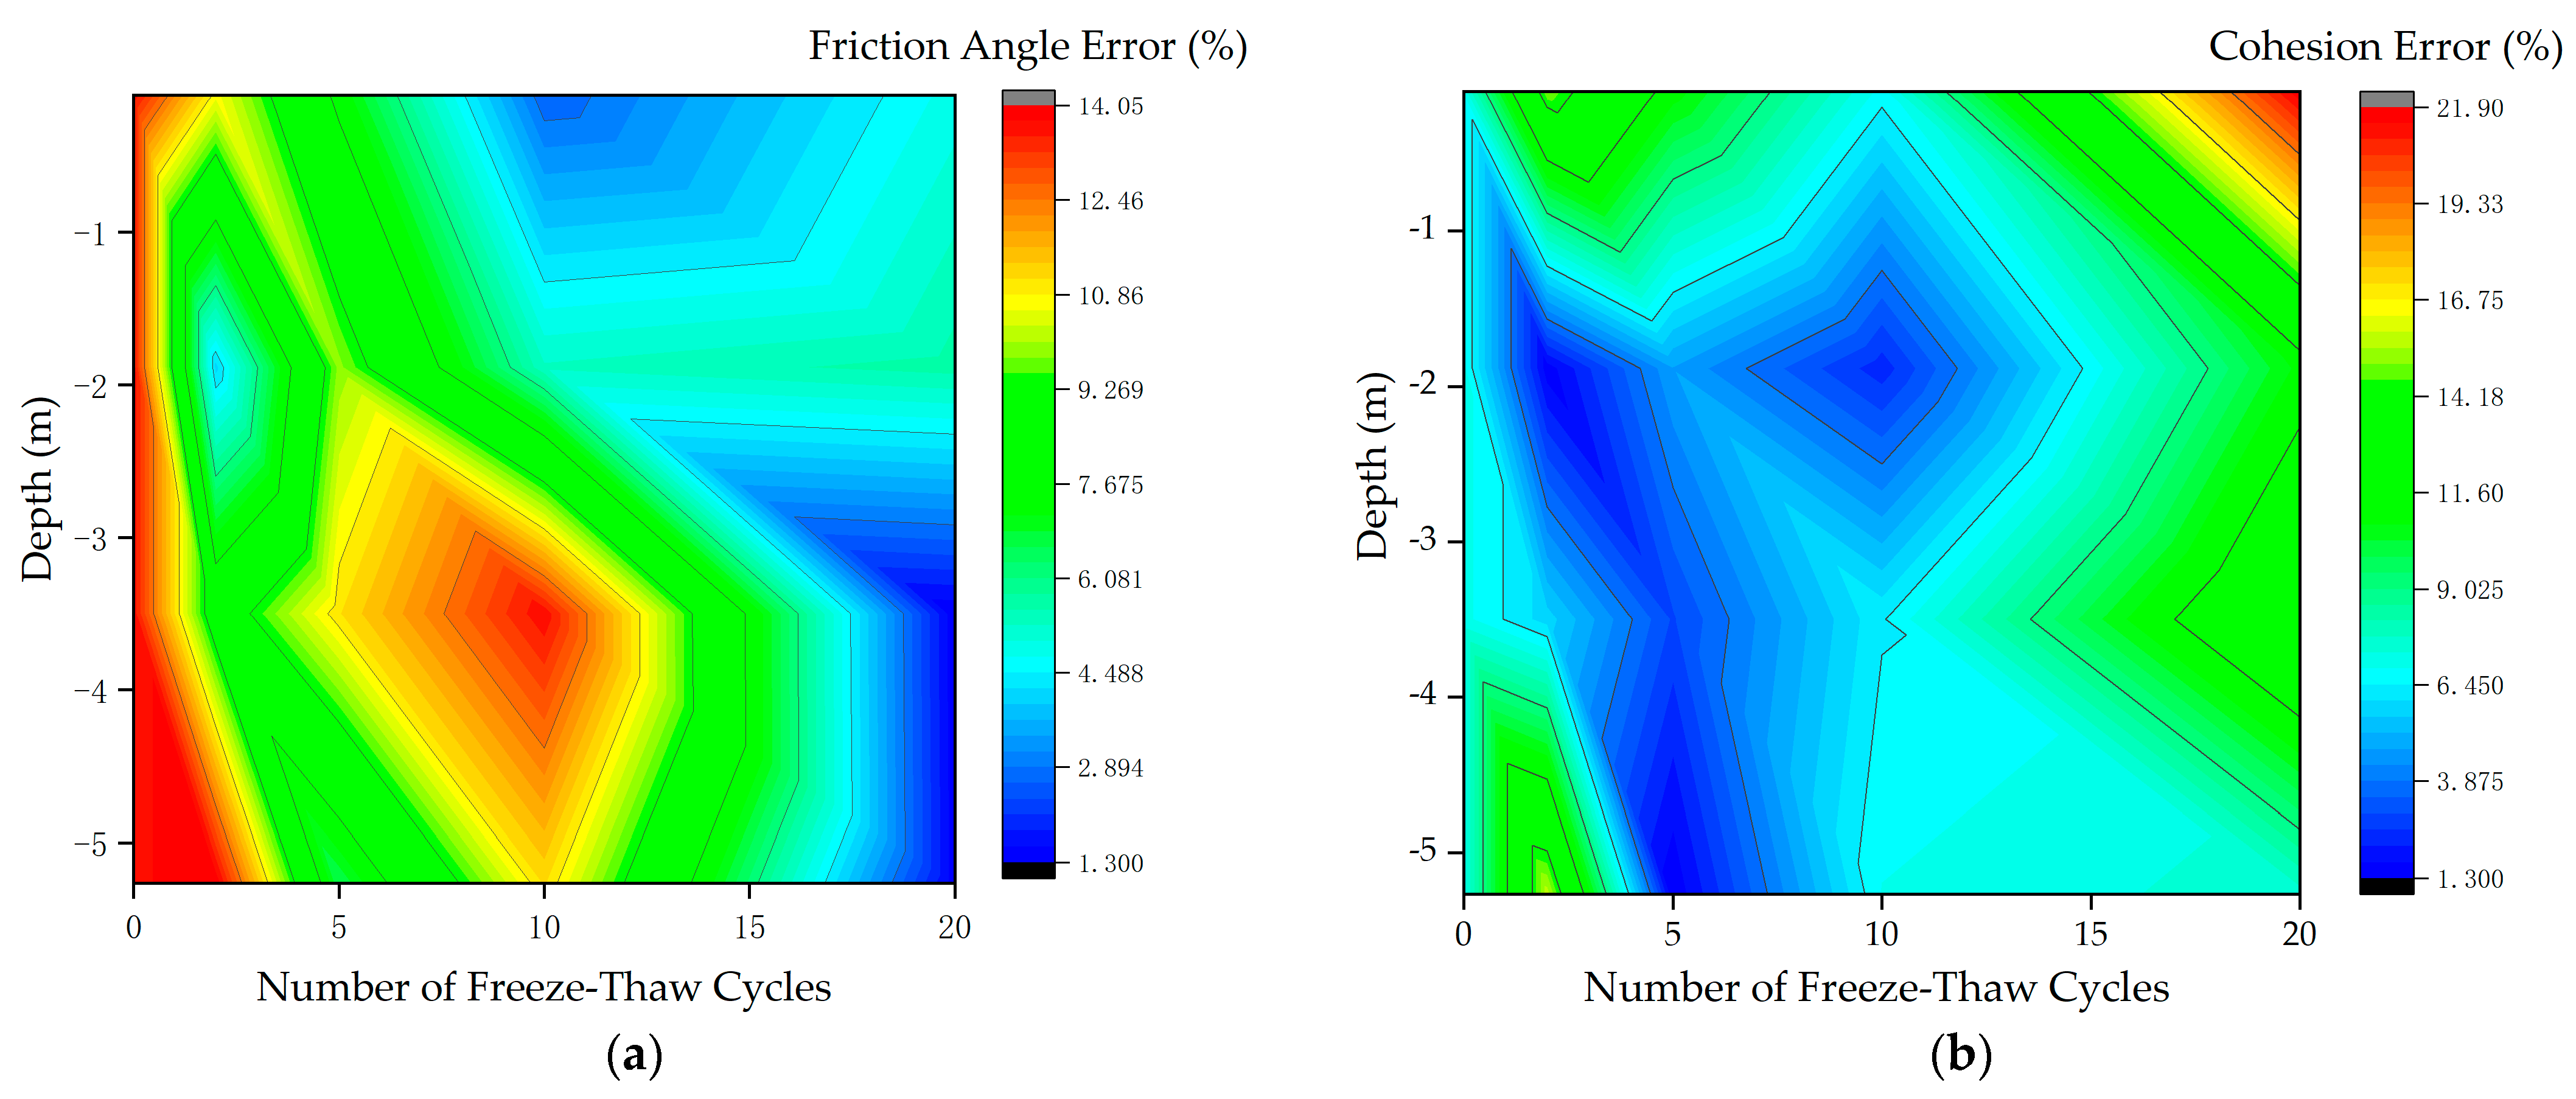
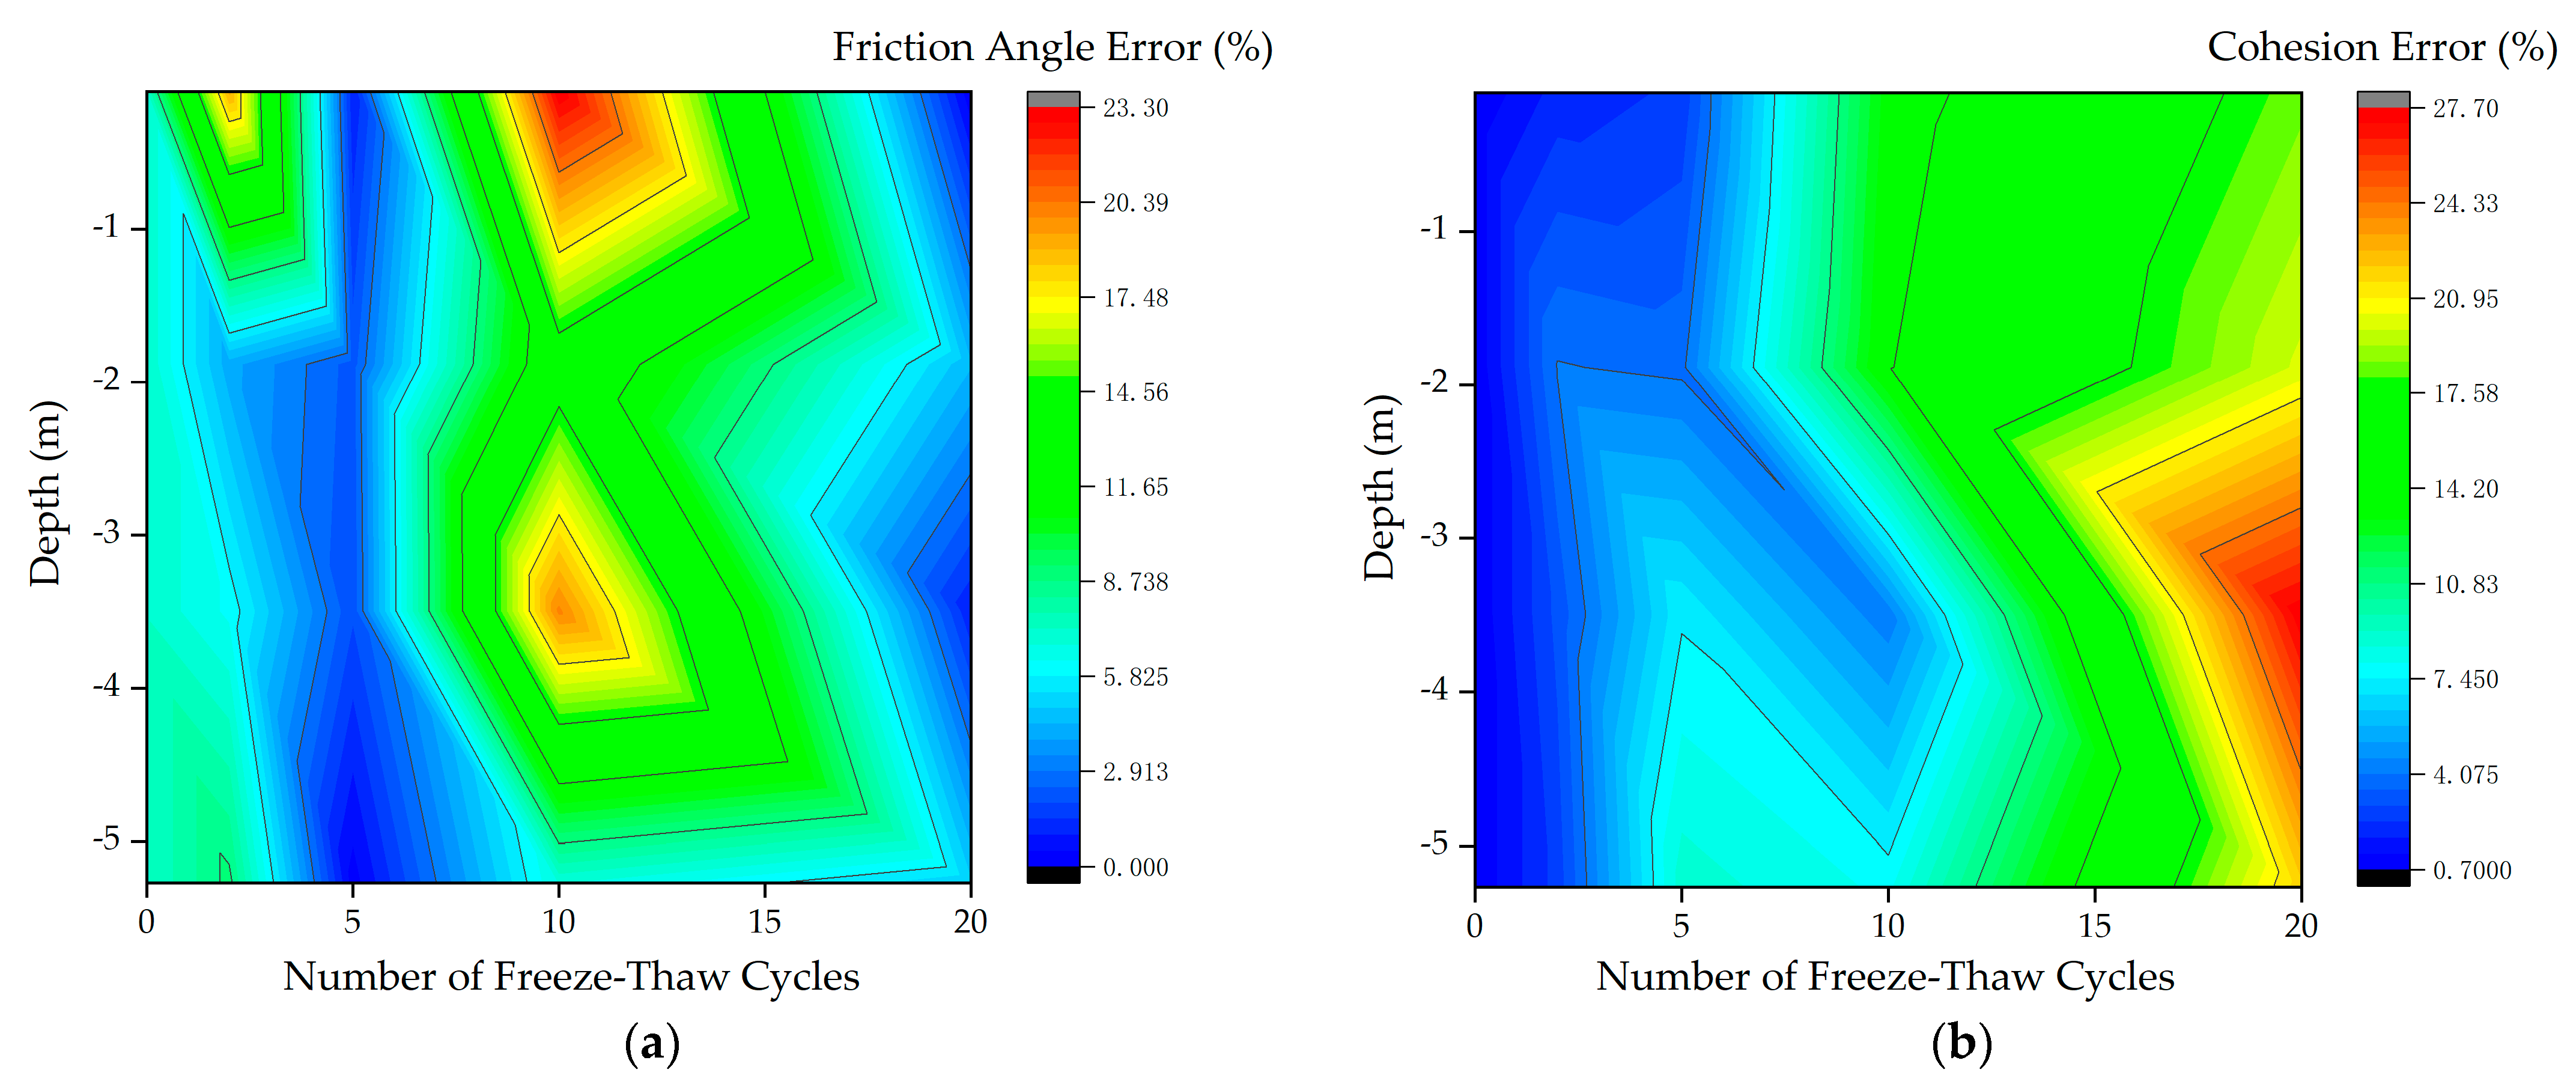
The freeze–thaw corrected mechanical parameters and associated error analysis for fractured rock masses are presented in Table 7, and those for infilled rock masses are shown in Table 8. The corresponding error distribution cloud maps are illustrated in Figure 7 and Figure 8.
It was found that the mean correction errors for the internal friction angle and cohesion of fractured rock masses were 7.78% and 8.33%, respectively, while for infilled rock masses the values were 7.36% and 9.59%, respectively. These results indicate that the Freeze–Thaw Rock Mass Hoek–Brown Strength Criterion provides reliable predictions with high accuracy.

5.2.2. Engineering Implications

To enhance the practical applicability of the research outcomes, this study proposed a Freeze–thaw Rock Mass Hoek–Brown Strength Criterion incorporating correction coefficients K w and K f with calibrated weights. This criterion enables quantitative evaluation of the degradation of rock mass mechanical parameters under in situ freeze–thaw conditions, thus providing a more scientific basis for engineering design in cold regions. The potential applications include:
(1)
In slope stability analysis, the method allows for more accurate estimation of the long-term reduction in cohesion and internal friction angle due to freeze–thaw effects, thereby improving the reliability of stability assessments.
(2)
In underground excavation projects, the framework can be applied to evaluate the reliability of filling materials, assisting in the selection of suitable reinforcement measures.
(3)
It should be noted that the correction coefficients obtained in this study were calibrated for granite and a specific filling material, and further validation is required for other lithologies or different engineering environments.
6. Conclusions

(1)
Field monitoring data indicate that the rock mass temperature of the Wushan open-pit slope exhibits an annual sinusoidal fluctuation, and therefore one year can be considered as one natural freeze–thaw cycle. However, under laboratory conditions, it is necessary to adopt an accelerated freeze–thaw scheme in order to complete a sufficient number of cycles within a limited time. In this study, the setting of “freezing for 4 h and thawing for 4 h” was determined mainly based on two considerations: (i) the relevant provisions of the Specification for Rock Tests in Water Resources and Hydropower Engineering, and (ii) preliminary tests in which temperature sensors were embedded inside the specimens and sealed, showing that the internal temperature dropped from room temperature to −20 °C within approximately 1.5 h, indicating complete freezing. Taking into account both operational feasibility and the representativeness of the freeze–thaw process, the accelerated scheme of freezing for 4 h and thawing for 4 h was adopted. It should be noted that this experimental method and the resulting model may be limited to the granitic porphyry of the Wushan open-pit mine, and their applicability to other lithologies requires further validation.
(2)
Freeze–thaw cycles significantly reduce the uniaxial compressive strength and tensile strength of rock masses, with degradation more pronounced in shallow samples than in deep ones. After 20 freeze–thaw cycles, the compressive and tensile strength of specimens at 0.10 m depth decreased by approximately 68.7% and 53.3%, respectively, whereas the corresponding reductions at 5.27 m depth were relatively smaller, at 53.4% and 44.6%, respectively. Substituting test results into the formula for the rock material constant yields a decreasing trend of   m i with increasing freeze–thaw cycles, exhibiting a distinct pattern of “nonlinear decay–depth buffering.” This indicates that freeze–thaw cycling not only degrades strength parameters but also significantly affects the deformation compatibility and brittleness of the rock mass. The results confirm the persistent erosive effects of freeze–thaw on rock structural integrity and strength deterioration mechanisms, providing a quantitative basis for long-term stability assessment of cold-region rock masses.
(3)
The shear strength parameters of through-going structural planes exhibit pronounced deterioration under freeze–thaw cycling, with cohesion showing the most significant reduction, indicative of a bond-dominated shear degradation process. Test results show that shallow structural planes are more susceptible to crack opening, roughness reduction, and bond failure under freeze–thaw conditions, leading to continuous degradation of strength. In contrast, deep structural planes experience limited strength variation due to reduced thermal disturbance and moisture migration, thus exhibiting some resistance to freeze–thaw effects. In addition, slight strength increases were observed in many specimens during the initial freeze–thaw stage, likely due to short-term structural densification induced by freezing, but this effect is insufficient to offset the long-term fatigue and microstructural degradation caused by cyclic freezing and thawing.
(4)
Fault gouge exhibits a strong shear strength degradation trend under the coupled influence of freeze–thaw and burial depth, particularly under shallow, high-moisture conditions where structural integrity and bonding capacity are severely impaired. Cohesion rapidly declines with increasing freeze–thaw cycles, with some specimens showing a brief increase after the first cycle, followed by accelerated degradation. Internal friction angle shows a relatively smaller reduction, reflecting the relative stability of the interparticle friction mechanism. Similar to through-going structural planes, fault gouge also demonstrates a strength evolution mode of “cohesion-dominated degradation with depth-buffering.” However, its high water content, fine particle size, and loose structure make it more sensitive to freeze–thaw disturbance, warranting focused attention in stability analyses of slip zones in cold regions.
(5)
Fractures and infill materials are key controlling factors in the degradation of rock mass structure and exert a significant weakening effect on shear strength. The study shows that through-going fractures can induce stress concentration, moisture penetration, and freeze–thaw damage, significantly reducing the shear strength of the rock mass. After correction, the fracture degradation coefficient K w typically decreases by 10–30%. Simultaneously, weak interlayers containing infill materials such as fault gouge—which exhibit low strength, high deformability, and high water retention capacity—are highly prone to instability under freeze–thaw–infiltration–shear coupling. The infill degradation coefficient K f correspondingly decreases by 30–60%. Together, K w and K f represent the composite weakening effect of structural deterioration on the shear mechanical properties of rock masses. The corrected parameters provide a quantitative basis for evaluating the anti-sliding stability and strength reduction in structurally weak rock masses.
(6)
A freeze–thaw rock mass Hoek–Brown strength criterion was proposed in this study. The criterion is established on the basis of the GSI, incorporating fracture and filling correction factors to account for freeze–thaw effects and thus yielding a modified GSI. By applying the generalized Hoek–Brown criterion, the mechanical parameters of rock mass under different freeze–thaw conditions can be evaluated, providing a scientific basis for slope design and stability assessment in cold regions.

Author Contributions

Conceptualization, Z.G., P.Z. and H.L.; Methodology, Z.G., P.Z. and H.L.; Software, Z.G., P.Z., W.Y. and J.H.; Validation, N.G., W.Y. and J.H.; Formal analysis, N.G. and J.H.; Investigation, N.G. and W.Y.; Resources, Z.G., P.Z. and J.H.; Data curation, N.G. and W.Y.; Writing—original draft, N.G. and W.Y.; Writing—review and editing, P.Z. and N.G.; Visualization, N.G. and W.Y.; Supervision, Z.G., P.Z. and H.L.; Project administration, P.Z. and H.L.; Funding acquisition, Z.G., P.Z., H.L. and J.H. All authors have read and agreed to the published version of the manuscript.

Funding

The work presented in this paper is financially supported by the National Key R&D Program of China (Grant No. 2022YFC2903903) and the National Natural Science Foundation of China (Grant No. 52174070).

Institutional Review Board Statement

Not applicable.

Informed Consent Statement

Not applicable.

Data Availability Statement

The original contributions presented in this study are included in the article. Further inquiries can be directed to the corresponding authors.

Conflicts of Interest

Author Zhenling Gao was employed by Shanjin Design Consulting Co., Ltd. Author Jun Hou was employed by Changchun Gold Research Institute Co., Ltd. The remaining authors declare that the research was conducted in the absence of any commercial or financial relationships that could be construed as a potential conflict of interest.

Appendix A

Appendix A.1. Quantification Method for Mechanical Parameters of Fractured Rock Mass Under Freeze–Thaw Cycles

According to both theoretical understanding and practical experience, the σ 1 σ 3 method in triaxial test data analysis is considered one of the more reliable approaches [17]. In this method, σ 3 is taken as the independent variable (x) and σ 1 as the dependent variable (y). A linear regression is performed using the least squares method to obtain the best-fit equation: σ 1 = a + b σ 3 .
The constants a and b are then related to the rock mass cohesion c and internal friction angle φ through the following relationships:
sin φ = b 1 b + 1
c = a 1 sin φ 2 cos φ
Under low confining pressure conditions, the strength envelope can be approximated as a straight line, i.e., a linear strength criterion. All data points ( σ 3 , σ 1 ) are subjected to linear regression, and the regression coefficients are calculated using the following expressions:
b = i = 1 n σ 3 i σ 3 σ 1 i σ 1 i = 1 n σ 3 i σ 3 2
a = σ 1 b σ 3
Correlation coefficient
r = i = 1 n σ 3 i σ 3 σ 1 i σ 1 i = 1 n σ 3 i σ 3 2 i = 1 n σ 1 i σ 1 2
The internal friction angle φ and cohesion c are calculated using the following equations, respectively:
φ = sin 1 b 1 b + 1
c = a 1 sin φ 2 cos φ
In these equations, φ is the internal friction angle of the rock ( ° ); c is the cohesion of the rock (MPa); σ 3 i is the confining (lateral) stress at failure for the i-th specimen (MPa); and σ 1 i is the axial stress at failure for the i-th specimen (MPa).

Appendix A.2. Quantification Results of Fractured Rock Mass Mechanical Parameters Under Freeze–Thaw Cycles

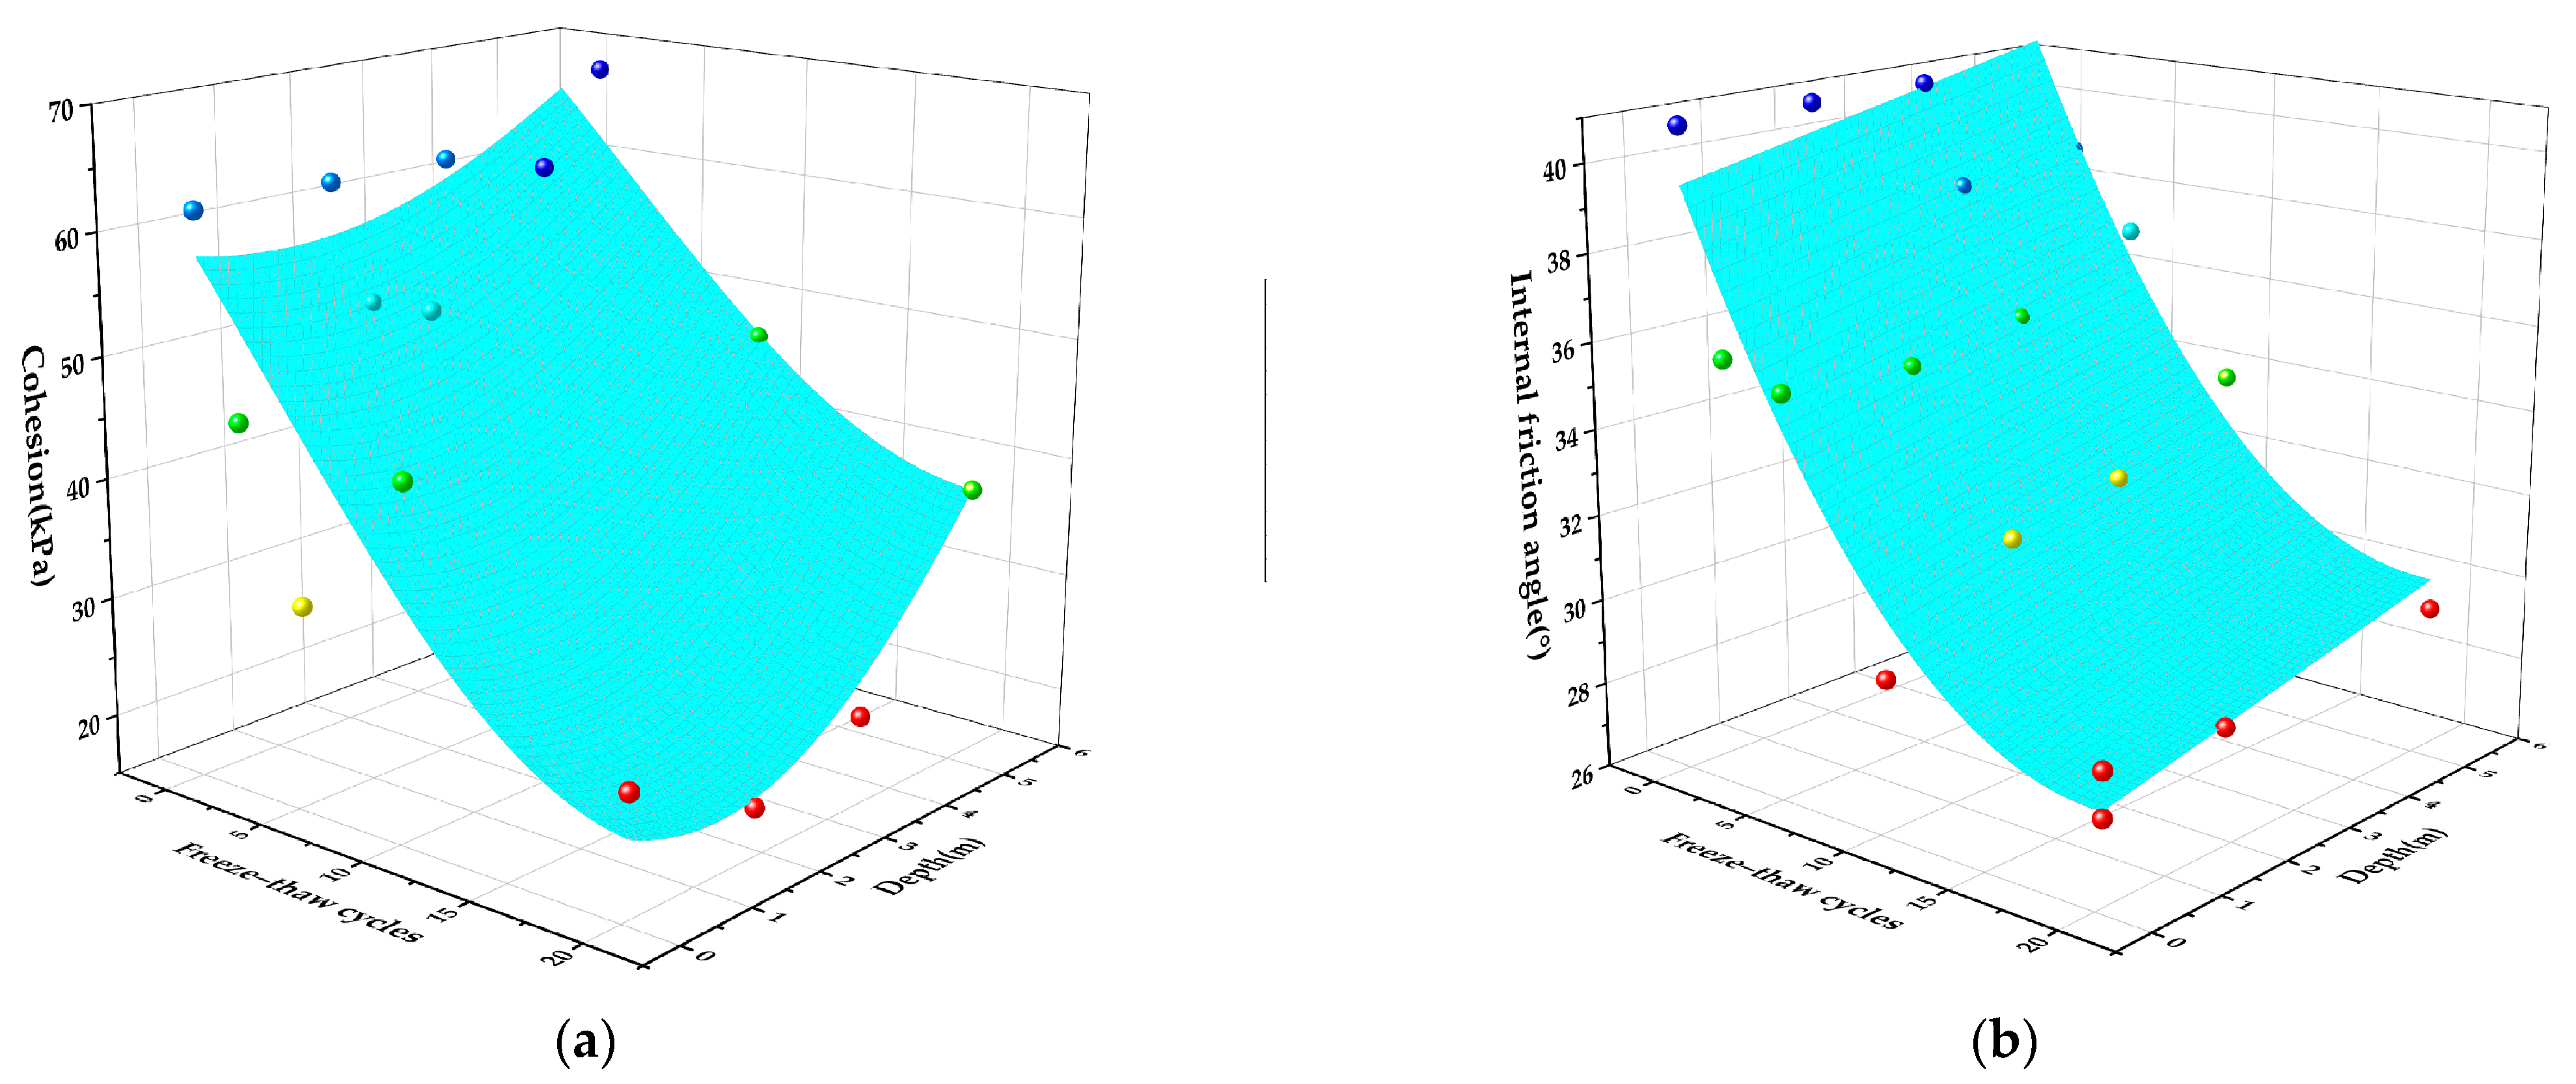
Figure A1a,b present the fitted curves of cohesion and internal friction angle for the through-going structural surface. Equations (A8) and (A9) represent the corresponding fitting functions, and the coefficients of determination (R2) are 0.80131 and 0.99577.
c = 92.19813 72.95892 e 1 2 N 20.74672 17.15917 2 1 2 y 1.32385 5.17613 2
φ = 1225.1485 1207.41668 e 1 2 N 19.3014 139.20837 2 1 2 y + 52.37476 400.56485 2
where Y is the depth of the rock mass (m, positive values indicate burial depth) and N is the number of freeze–thaw cycles.
Figure A1. Fitted curves for the through-going structural surface: (a) cohesion; (b) internal friction angle.
Applsci 15 10010 g0a1
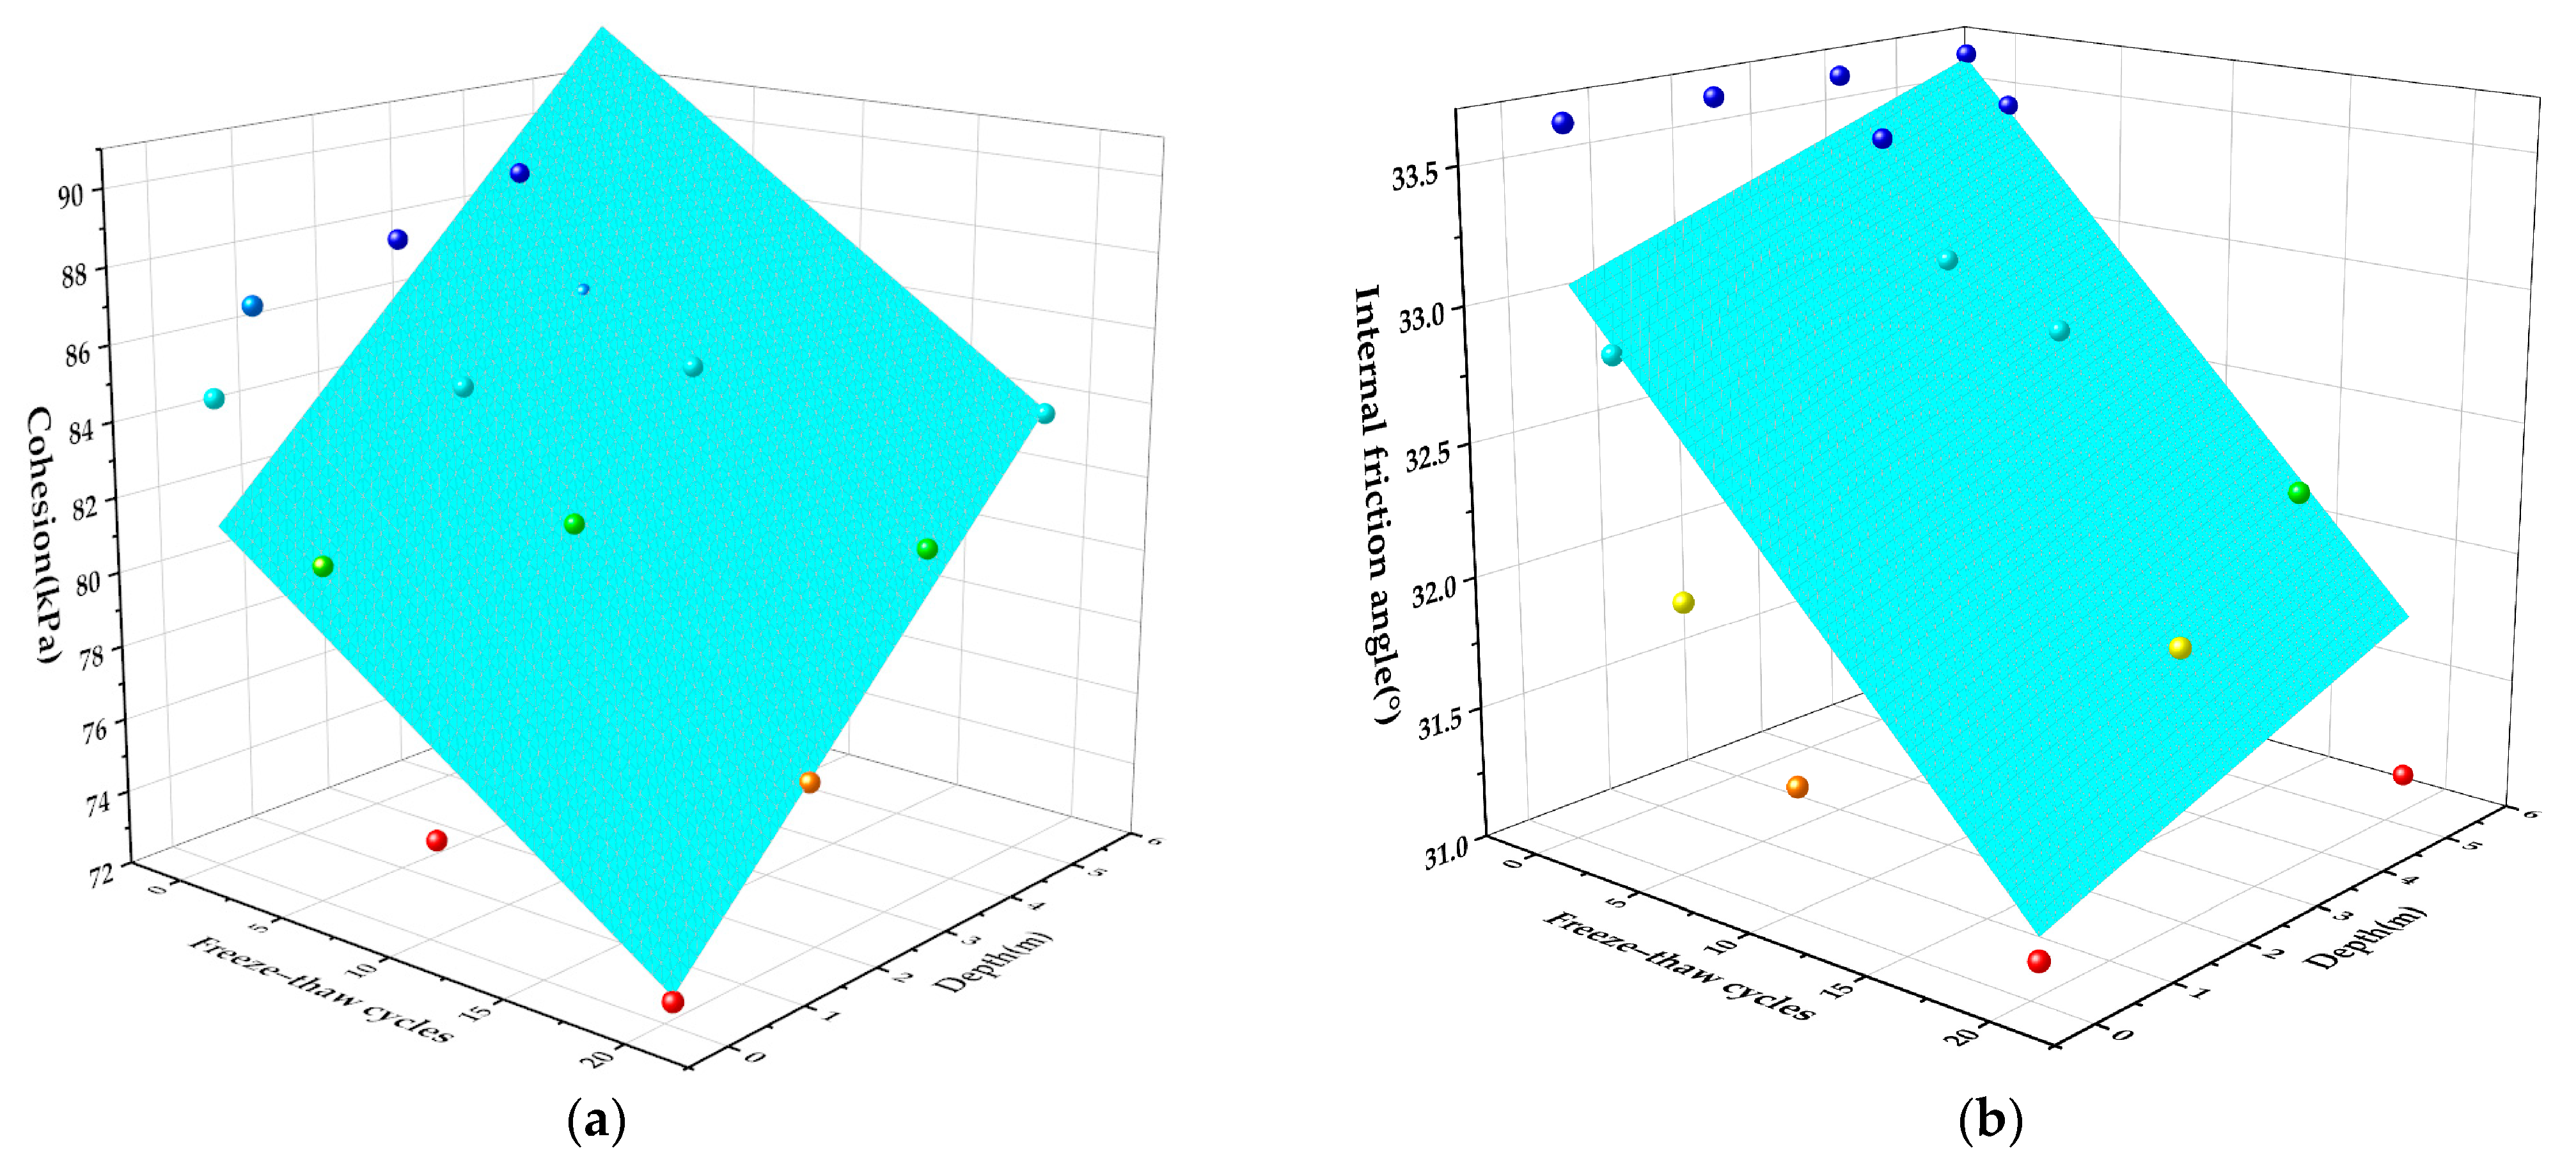
Figure A2a,b shows the fitted curves of cohesion and internal friction angle for the fault gouge. Equations (A10) and (A11) represent the corresponding fitting functions, and the coefficients of determination (R2) are 0.98004 and 0.99711.
c = 6293.82156 + 6374.82212 e N 14756.61002 + y 2903.62757
φ = 1973.04999 1939.98553 e N 2820840.65281 y 17908.07435
Figure A2. Fitted curves for the fault gouge: (a) cohesion; (b) internal friction angle.
Applsci 15 10010 g0a2

Appendix A.3. Quantification Results of Fractured Rock Mass Mechanical Parameters Under Freeze–Thaw Cycles

Based on the methodology described in Appendix A.1, the cohesion and internal friction angle of fractured rock masses and those with infilled structural planes were determined under varying numbers of freeze–thaw cycles and different burial depths. The calculation results are presented in Table A1 and Table A2.
Table A1. Degradation of Mechanical Parameters of Fractured Rock Mass with Increasing Freeze–Thaw Cycles [23].
Number of Freeze–Thaw Cycles (n)Depth (m)Internal Friction Angle (°)Cohesion (kPa)
0\32.914209.206
2−5.2727.879187.164
−3.5027.425185.452
−1.8827.222185.254
−0.1025.026182.637
5−5.2726.845180.635
−3.5025.169180.131
−1.8825.006178.094
−0.1024.036174.598
10−5.2725.462165.402
−3.5025.097165.061
−1.8823.947151.859
−0.1023.017144.120
20−5.2723.991151.580
−3.5022.01851145.2109
−1.8821.24265139.91702
−0.1018.5551118.922
Table A2. Table of degradation of filling material mechanical parameters with freeze–thaw cycles [24].
Number of Freeze–Thaw Cycles (n)Depth (m)Internal Friction Angle (°)Cohesion (kPa)
0\36.167207.485
2−5.2727.146197.045
−3.5026.550183.860
−1.8826.313175.314
−0.1023.518169.668
5−5.2726.461188.396
−3.5026.018183.756
−1.8826.019163.952
−0.1025.922162.480
10−5.2724.657181.733
−3.5022.572179.011
−1.8821.565174.508
−0.1019.344165.805
20−5.2723.788171.410
−3.5021.419170.732
−1.8820.849158.081
−0.1017.687121.495

References

  1. Yu, J.; Chen, X.; Li, H.; Zhou, J.; Cai, Y. Effect of freeze-thaw cycles on mechanical properties and permeability of red sandstone under triaxial compression. J. Mt. Sci. 2015, 12, 218–231. [Google Scholar] [CrossRef]
  2. Gao, F.; Cao, S.; Zhou, K.; Lin, Y.; Zhu, L. Damage characteristics and energy-dissipation mechanism of frozen–thawed sandstone subjected to loading. Cold Reg. Sci. Technol. 2020, 169, 102920. [Google Scholar] [CrossRef]
  3. Wang, Y.; Gao, S.H.; Li, C.H.; Han, J.Q. Energy dissipation and damage evolution for dynamic fracture of marble subjected to freeze-thaw and multiple level compressive fatigue loading. Int. J. Fatigue 2021, 142, 105927. [Google Scholar] [CrossRef]
  4. Fu, X.D.; Lu, J.Z.; Huang, B.; Zhang, Y. Experimental study on strength and failure mode of strongly weathered mudstone with weak interlayer. J. Southeast Univ. Nat. Sci. Ed. 2021, 51, 242–248. [Google Scholar]
  5. Huang, M.; Wang, H.; Sheng, D.; Liu, Y. Rotational–translational mechanism for the upper bound stability analysis of slopes with weak interlayer. Comput. Geotech. 2013, 53, 133–141. [Google Scholar] [CrossRef]
  6. Li, A.; Deng, H.; Zhang, H.; Jiang, M. The shear-creep behavior of the weak interlayer mudstone in a red-bed soft rock in acidic environments and its modeling with an improved Burgers model. Mech. Time-Depend. Mater. 2023, 27, 1–18. [Google Scholar] [CrossRef]
  7. Tan, X.; Ren, Y.; Li, T.; Zhou, S.; Zhang, J.; Zhou, S. In-situ direct shear test and numerical simulation of slate structural planes with thick muddy interlayer along bedding slope. Int. J. Rock Mech. Min. Sci. 2021, 143, 104791. [Google Scholar] [CrossRef]
  8. Luo, Z.; Zhang, Y.; Du, S.; Huang, M.; Lyu, Y. Experimental study on shear performance of saw-tooth rock joint with weak interlayer under different moisture contents and filling degrees. Front. Earth Sci. 2023, 10, 982937. [Google Scholar] [CrossRef]
  9. Wu, D.; Chen, F.; Tang, L.; Wei, H. Influence of Weak Interlayer Filling State on the Failure Patterns of Natural Rock Joints. Int. J. Geomech. 2022, 22, 04022086. [Google Scholar] [CrossRef]
  10. Naghadehi, M.Z. Laboratory study of the shear behaviour of natural rough rock joints infilled by different soils. Period. Polytech. Civ. Eng. 2015, 59, 413–421. [Google Scholar] [CrossRef]
  11. Jahanian, H.; Sadaghiani, M.H. Experimental study on the shear strength of sandy clay infilled regular rough rock joints. Rock Mech. Rock Eng. 2015, 48, 907–922. [Google Scholar] [CrossRef]
  12. Hu, Y.; Wang, X.; Zhong, Z. Investigations on the jointed influences of saturation and roughness on the shear properties of artificial rock joints. Geomech. Geophys. Geo-Energy Geo-Resour. 2022, 8, 115. [Google Scholar] [CrossRef]
  13. Gong, L.; Nemcik, J.; Ren, T. Numerical simulation of the shear behavior of rock joints filled with unsaturated soil. Int. J. Geomech. 2018, 18, 04018112. [Google Scholar] [CrossRef]
  14. Ju, M.; Li, X.; Li, X.; Zhang, G. A review of the effects of weak interfaces on crack propagation in rock: From phenomenon to mechanism. Eng. Fract. Mech. 2022, 263, 108297. [Google Scholar] [CrossRef]
  15. Ladanyi, B.; Archambault, G. Shear strength and deformability of filled indented joints. In Proceedings of the an International Symposium on the Geotechnics of Structurally Complex Formations, Capri, Italy, 4–7 April 1977; Associazione Geotechnica Italiana: Roma, Italy, 1975. [Google Scholar]
  16. Indraratna, B.; Haque, A.; Aziz, N. Shear behaviour of idealized infilled joints under constant normal stiffness. Geotechnique 1999, 49, 331–355. [Google Scholar] [CrossRef]
  17. Li, J.; Zhou, K.; Liu, W.; Zhang, Y. Analysis of the effect of freeze-thaw cycles on the degradation of mechanical parameters and slope stability. Bull. Eng. Geol. Environ. 2018, 77, 573–580. [Google Scholar] [CrossRef]
  18. Luo, X.; Jiang, N.; Fan, X.; Mei, N.; Luo, H. Effects of freeze-thaw on the determination and application of parameters of slope rock mass in cold regions. Cold Reg. Sci. Technol. 2015, 110, 32–37. [Google Scholar] [CrossRef]
  19. Chen, Y.; Lin, H. Deterioration laws of Hoek-Brown parameters in freeze–thaw multi-fractured rock mass. Theor. Appl. Fract. Mech. 2023, 123, 103716. [Google Scholar] [CrossRef]
  20. Cao, S.; Xia, C.; Zhou, S.; Duan, J.; Peng, W. Elasto-plastic solution for frost heave force considering Hoek-Brown criterion and freezing temperature gradient in cold region tunnels. Tunn. Undergr. Space Technol. 2024, 147, 12. [Google Scholar] [CrossRef]
  21. Rezaei, M.; Mousavi, S.Z.S. Slope stability analysis of an open pit mine with considering the weathering agent: Field, laboratory and numerical studies. Eng. Geol. 2024, 333, 107503. [Google Scholar] [CrossRef]
  22. Sonmez, H.; Ulusay, R. Modifications to the geological strength index (GSI) and their applicability to stability of slopes. Int. J. Rock Mech. Min. Sci. 1999, 36, 743–760. [Google Scholar] [CrossRef]
  23. Zhang, P.; Gao, N.; Yan, W.; Hou, J.; Liu, H. Strength Deterioration Pattern and Stability Evaluation of Open−Pit Mine Slopes in Cold Regions Under Freeze–Thaw Cycles. Appl. Sci. 2025, 15, 4853. [Google Scholar] [CrossRef]
  24. Hou, J.; Zhang, P.; Gao, N.; Yan, W.; Yu, Q. Freeze–Thaw-Induced Degradation Mechanisms and Slope Stability of Filled Fractured Rock Masses in Cold Region Open-Pit Mines. Appl. Sci. 2025, 15, 7429–7451. [Google Scholar] [CrossRef]
Figure 1. Internal temperature variation process of the Wushan Open−Pit Mine slope: (a) temperature changes at different depths over time; (b) depth-dependent variation in temperature range.
Applsci 15 10010 g001
Figure 2. Granite specimens: (a) Uniaxial compression specimen; (b) Brazilian disc specimen.
Applsci 15 10010 g002
Figure 3. Normalized loss: (a) Normalized loss of compressive strength. (b) Normalized loss of tensile strength.
Applsci 15 10010 g003
Figure 4. Flowchart of Specimen Preparation and Experimental Procedure.
Applsci 15 10010 g004
Figure 5. Evolution of Internal Friction Angle and Cohesion of Persistent Discontinuities under Different Freeze–Thaw Cycles and Burial Depths: (a) Variation in cohesion at different depths. (b) Variation in internal friction angle at different depths. (c) Variation in cohesion with freeze–thaw cycles. (d) Variation in internal friction angle with freeze–thaw cycles.
Applsci 15 10010 g005aApplsci 15 10010 g005b
Figure 6. Evolution of Internal Friction Angle and Cohesion of Filling Materials under Different Freeze–Thaw Cycles and Burial Depths: (a) Variation in cohesion at different depths. (b) Variation in internal friction angle at different depths. (c) Variation in cohesion with freeze–thaw cycles. (d) Variation in internal friction angle with freeze–thaw cycles.
Applsci 15 10010 g006aApplsci 15 10010 g006b
Figure 7. Error Distribution Cloud Map of Corrected Mechanical Parameters for Fractured Rock Mass: (a) Friction Angle Correction Error Distribution. (b) Cohesion Correction Error Distribution.
Applsci 15 10010 g007
Figure 8. Error Distribution Cloud Map of Corrected Mechanical Parameters for Rock Mass with Infill Materials: (a) Friction Angle Correction Error Distribution. (b) Cohesion Correction Error Distribution.
Applsci 15 10010 g008
Table 1. Freeze–thaw testing scheme for mechanical properties.
No.Freeze–Thaw Temperature (°C)Depth (m)Freeze–Thaw CyclesNumber of Specimens
Uniaxial CompressionBrazilian Splitting
1−20–220.100, 2, 5, 10, 2055
2−10–141.8855
3−5–103.5055
4−2–75.2755
Table 2. Uniaxial Compressive Strength of Standard Specimens (Unit: MPa).
Depth5.273.501.880.10
Freeze–Thaw Cycles
098.4498.4498.4498.44
296.9888.8584.5475.50
573.8871.1670.8868.26
1068.1767.1955.9150.60
2045.8741.3140.9330.72
Table 3. Uniaxial Tensile Strength (Unit: MPa).
Depth5.273.501.880.10
Freeze–Thaw Cycles
07.067.067.067.06
26.926.786.726.23
55.895.505.385.25
105.194.644.463.97
203.913.793.483.30
Table 4. Calculation of Corrected m i Values.
Depth5.273.501.880.10
Freeze–Thaw Cycles
012.8012.8012.8012.80
212.8711.8811.3112.38
511.2611.7011.9711.76
1011.9113.3611.2611.48
2010.379.4410.397.59
Table 5. Freeze–thaw testing scheme for through-going structural planes.
No.Freeze–Thaw Temperature (°C)Depth (m)Freeze–Thaw CyclesNumber of SpecimensNormal Stress (MPa)
1−20–220.100, 2, 5, 10, 2051
2−10–141.885
3−5–103.505
4−2–75.275
Table 6. Freeze–thaw testing scheme for filling materials.
No.Freeze–Thaw Cycle Boundary Temperature (°C)Corresponding Burial Depth (m)Freeze–Thaw CyclesInfill MaterialNo. of Specimens
1−20–220.100, 2, 5, 10, 20A thickness of 10 mm and a moisture content of 9%5 × 4
2−10–141.885 × 4
3−5–103.505 × 4
4−2–75.275 × 4
Table 7. Freeze–Thaw Corrected Mechanical Parameters and Error Analysis of Fractured Rock Mass.
Freeze–Thaw CyclesDepth (m) Fracture   Correction   Factor   K w Friction   Angle   ( ° )Friction Angle Error (%)Cohesion (kPa)Absolute Error (%)
0\137.4313.71%223.897.02%
2−5.270.87131.7914.02%216.6115.73%
−3.50.86029.788.57%196.225.80%
−1.880.85628.344.11%182.511.48%
−0.10.81727.7110.72%155.2614.99%
5−5.270.84028.626.60%183.091.36%
−3.50.81327.9611.10%174.812.96%
−1.880.80627.489.91%169.714.71%
−0.10.78225.827.43%155.3111.05%
10−5.270.78228.3011.16%176.826.90%
−3.50.77628.5513.75%175.596.38%
−1.880.72725.225.33%148.322.33%
−0.10.69423.622.63%134.456.71%
20−5.270.72724.321.39%140.137.56%
−3.50.68222.311.33%125.1213.84%
−1.880.65722.455.67%124.6410.92%
−0.10.56617.654.87%92.9521.84%
Table 8. Freeze–Thaw Corrected Mechanical Parameters and Error Analysis of Rock Mass with Filling Materials.
Freeze–Thaw CyclesDepth (m) Filling   Correction   Factor   K f Friction   Angle   of   Filled   Rock   Mass   ( ° )Friction Angle Error (%)Cohesion of Filled Rock Mass (kPa)Absolute Error (%)
0\138.787.22%205.900.76%
2−5.270.85029.578.92%202.202.62%
−3.50.81028.196.20%189.603.12%
−1.880.78627.394.09%182.544.12%
−0.10.73428.0219.14%166.192.05%
5−5.270.82026.530.24%171.668.88%
−3.50.80326.552.04%170.267.34%
−1.880.75526.592.20%170.353.90%
−0.10.75026.181.01%166.542.50%
10−5.270.77926.346.84%167.427.87%
−3.50.74327.1020.07%171.404.25%
−1.880.71924.4613.42%149.8514.13%
−0.10.66723.8523.30%143.5113.45%
20−5.270.74222.624.93%133.8421.92%
−3.50.70821.211.00%123.5527.63%
−1.880.66921.774.43%126.4720.00%
−0.10.53717.680.04%98.9818.53%
Disclaimer/Publisher’s Note: The statements, opinions and data contained in all publications are solely those of the individual author(s) and contributor(s) and not of MDPI and/or the editor(s). MDPI and/or the editor(s) disclaim responsibility for any injury to people or property resulting from any ideas, methods, instructions or products referred to in the content.