Article

Research on the Internal Flow Characteristics of Single- and Coaxial-Nozzle Ejectors for Hydrogen Recirculation in PEMFC

1
Department of Mechanical Engineering, Soongsil University, Seoul 07040, Republic of Korea
2
Department of Convergence of Energy Policy and Technology, Soongsil University, Seoul 07040, Republic of Korea
*
Author to whom correspondence should be addressed.
Appl. Sci. 2025, 15(17), 9845; https://doi.org/10.3390/app15179845 (registering DOI)
Submission received: 12 August 2025 / Revised: 2 September 2025 / Accepted: 5 September 2025 / Published: 8 September 2025

Abstract

Hydrogen proton exchange membrane fuel cells (PEMFCs) are a promising clean energy technology for automotive applications owing to their high efficiency and environmentally friendly characteristics. Efficient hydrogen recirculation is critical for sustaining the PEMFC performance, and ejector-based systems offer a passive, energy-efficient solution. However, traditional ejectors suffer from performance degradation across varying fuel-cell loads owing to their limited adaptability. To address this limitation, this study investigated the internal flow behavior and recirculation performance of single- and coaxial-nozzle ejectors, focusing on the influence of the diameter ratio between the mixing chamber and nozzle throat. Numerical simulations were performed to evaluate the flow structures and recirculation ratios under various operating conditions. The diameter ratio between the mixing chamber and the nozzle throat played a crucial role in determining the flow uniformity and recirculation efficiency. Specifically, lower diameter ratios reduce the recirculation ratio across all operating conditions, whereas higher diameter ratios exhibit diminished performance only under very low power outputs (≤4 bar) but show enhanced performance at medium-to-high outputs. These findings suggest that tailoring the geometric parameters of coaxial-nozzle ejectors can significantly improve hydrogen recirculation adaptability in PEMFC systems, thereby supporting more stable and efficient operation across a wide range of vehicle load conditions.

1. Introduction

With the increasing severity of environmental pollution and global warming, studies on reducing greenhouse gas emissions have intensified. In particular, the mobility sector has witnessed growing interest in eco-friendly vehicles owing to regulations on internal combustion engine vehicles. Among eco-friendly vehicles, hydrogen fuel cell vehicles are considered the most environmentally friendly from the perspectives of life cycle assessment and well-to-wheel analysis [1].
Figure 1 illustrates the key components of a hydrogen fuel-cell vehicle, including its powertrain, hydrogen recirculation system with an ejector and a blower, and polymer electrolyte membrane fuel cell (PEMFC). PEMFCs, known for their eco-friendly nature and high energy-conversion efficiency, operate at relatively low temperatures, making them ideal for automotive applications that require cold-start capability and reliable performance under low-temperature conditions.
Hydrogen recirculation systems, shown in Figure 1b,c, are essential to enhance hydrogen utilization in PEMFCs. These systems employ either blowers or ejectors; blowers offer high efficiency and precise flow control but consume additional energy, whereas ejectors are energy-efficient and easy to maintain, albeit with lower recirculation efficiency.
The ejector in this study, consisting of a nozzle, mixing chamber, and diffuser, recirculates hydrogen by utilizing the primary flow from a high-pressure hydrogen tank to create a low-pressure region that draws excess hydrogen (secondary flow) from the anode outlet. These flows mix and exchange kinetic energy in the mixing chamber before being directed to the fuel-cell stack, enabling hydrogen recirculation without requiring moving parts or additional energy.
However, ejector performance is strongly influenced by both operating conditions and internal geometry. On the operational side, increasing the primary pressure leads to a much greater increase in primary mass flow compared to the secondary flow, resulting in a decrease in the entrainment ratio (ER). Additionally, small variations in back pressure can cause regime transitions from critical to sub-critical and eventually to back-flow, highlighting the importance of maintaining the critical mode of operation [5]. On the geometric side, key parameters such as the area ratio (defined as the ratio of the constant-area mixing section to the nozzle throat), nozzle-exit position (NXP), and mixing-section length significantly affect both ER and the critical back pressure. Specifically, ER is highly sensitive to the area ratio and NXP, with practical recommendations suggesting an area ratio below 16 for typical operating conditions. In contrast, the critical back pressure is more strongly influenced by the mixing-section length [6]. In coupled or multi-stage ejector designs, increasing the pressure-lift ratio reduces the peak ER and alters the optimal second-stage geometry (area ratio, NXP), highlighting the strong interaction between the operating point and internal structure [7]. For PEMFC hydrogen ejectors, the optimal mixing-chamber diameter depends on the stack load. Larger diameters (e.g., 5.9 mm) perform best near rated power, whereas narrower chambers are preferable at lower power levels. However, excessively large chambers (e.g., 8 mm) may fail to entrain flow effectively below approximately 70 kW [8].
Also, several studies [9,10,11] have elucidated key mechanisms influencing entrainment performance in ejectors, including mixing-layer (ML) evolution, shock–shear interactions, and boundary-condition sensitivities. Ding et al. developed a CFD model and showed that the ML evolves in three stages, identifying a critical expansion ratio that maximizes effective mixing thickness (e.g., effective mixing thickness of mixing layer peaks at 5.4 mm when expansion ratio is 1.87), thereby establishing a direct link between mixing development and recirculation performance [9]. Nikiforow et al. [10] conducted a comparative analysis of three turbulence models (SST k–Ω, RNG k–ε, enhanced wall treatment k–ε) for a 5 kW PEMFC system. Consequently, they experimentally benchmarked turbulence models up to 6 bar and found that the SST k–ω model provided the best overall performance predictions, while the RNG and Realizable k–ε models more accurately predicted the location of maximum entrainment efficiency—highlighting the importance of model selection in resolving internal flow features [10]. Complementarily, Yin et al. showed that secondary-inlet conditions and outlet pressure strongly modulate performance, especially at low primary pressures, and that 3D modeling better reproduces experiments when side-branch effects are present [11].
Building on these diagnostics, recent optimization efforts have targeted throat diameter, mixing-chamber length-to-diameter ratio, and nozzle-exit position (NXP). Considering boundary-layer separation (BLS), Bian et al. identified feasible design ranges: throat diameters (Dt) = 6.2–7.2 mm, mixing chamber lengths (Lm) = 26.8–33.5 mm, and NXP=−8 to +2 mm, and reported a 33.2% efficiency gain at 6 bar following geometric optimization. They further showed that the optimal Lm/Dm ratio shifts with motive pressure, favoring a range of 4–6, with larger values preferred at higher pressures [12].
In parallel, Zhang et al. quantified the coupling between NXP and pressure, reporting that at 4 bar, the entrainment ratio peaks at recirculation ratio 2.43 when NXP = −15.6 mm, and that the optimal NXP becomes more negative as primary pressure increases and back pressure decreases [13]. To ensure stable anode recirculation across a wide range of stack loads, various multi-, twin-, and nested-nozzle architectures have been proposed and validated. Han et al. presented a multi-nozzle ejector (mixing chamber diameter is 5.0 mm, throat tilt angle of symmetrical nozzles is 8°) that expands the primary-flow window from ≈0.48–1.6 g/s (conventional) to 0.27–1.6 g/s, with simulation–experiment deviations mostly below 10% [14]. Similarly, Xue et al. showed that coordinated nozzle-mode switching can maintain acceptable recirculation ratios while stabilizing anode pressure across 20–25 kW and 35–100 kW stack operation bands [15]. Additionally, Chen et al. introduced a nested-nozzle configuration with independently controlled coaxial nozzles sharing common chambers. By optimizing exit spacing and scheduling nozzle modes, their design maintained effective entrainment across a 150 kW stack’s operating window while satisfying stoichiometric requirements [16].
In multi-nozzle ejectors, as the nozzle inclination angle increases, kinetic energy losses occur, and the misalignment of the nozzles significantly reduces the ejector performance. Accordingly, coaxial-nozzle ejectors have been proposed to address these issues. Coaxial-nozzle ejectors are attractive candidates for PEMFC anode recirculation because they support a wide operating range while mitigating nozzle misalignment effects. Previous studies have introduced multi-, dual-, and coaxial-nozzle configurations to extend operating windows and enhance mixing performance. However, direct comparisons between single- and coaxial-nozzle ejectors under identical boundary conditions remain limited. Moreover, the influence of the mixing-chamber-to-nozzle-throat diameter ratio (Dr) on internal flow structures and recirculation efficiency has not been systematically investigated. Table 1 presents a comparative summary of ejectors employing single-, multi-, and coaxial-nozzle configurations, detailing their structural schematics, performance characteristics, and associated limitations.
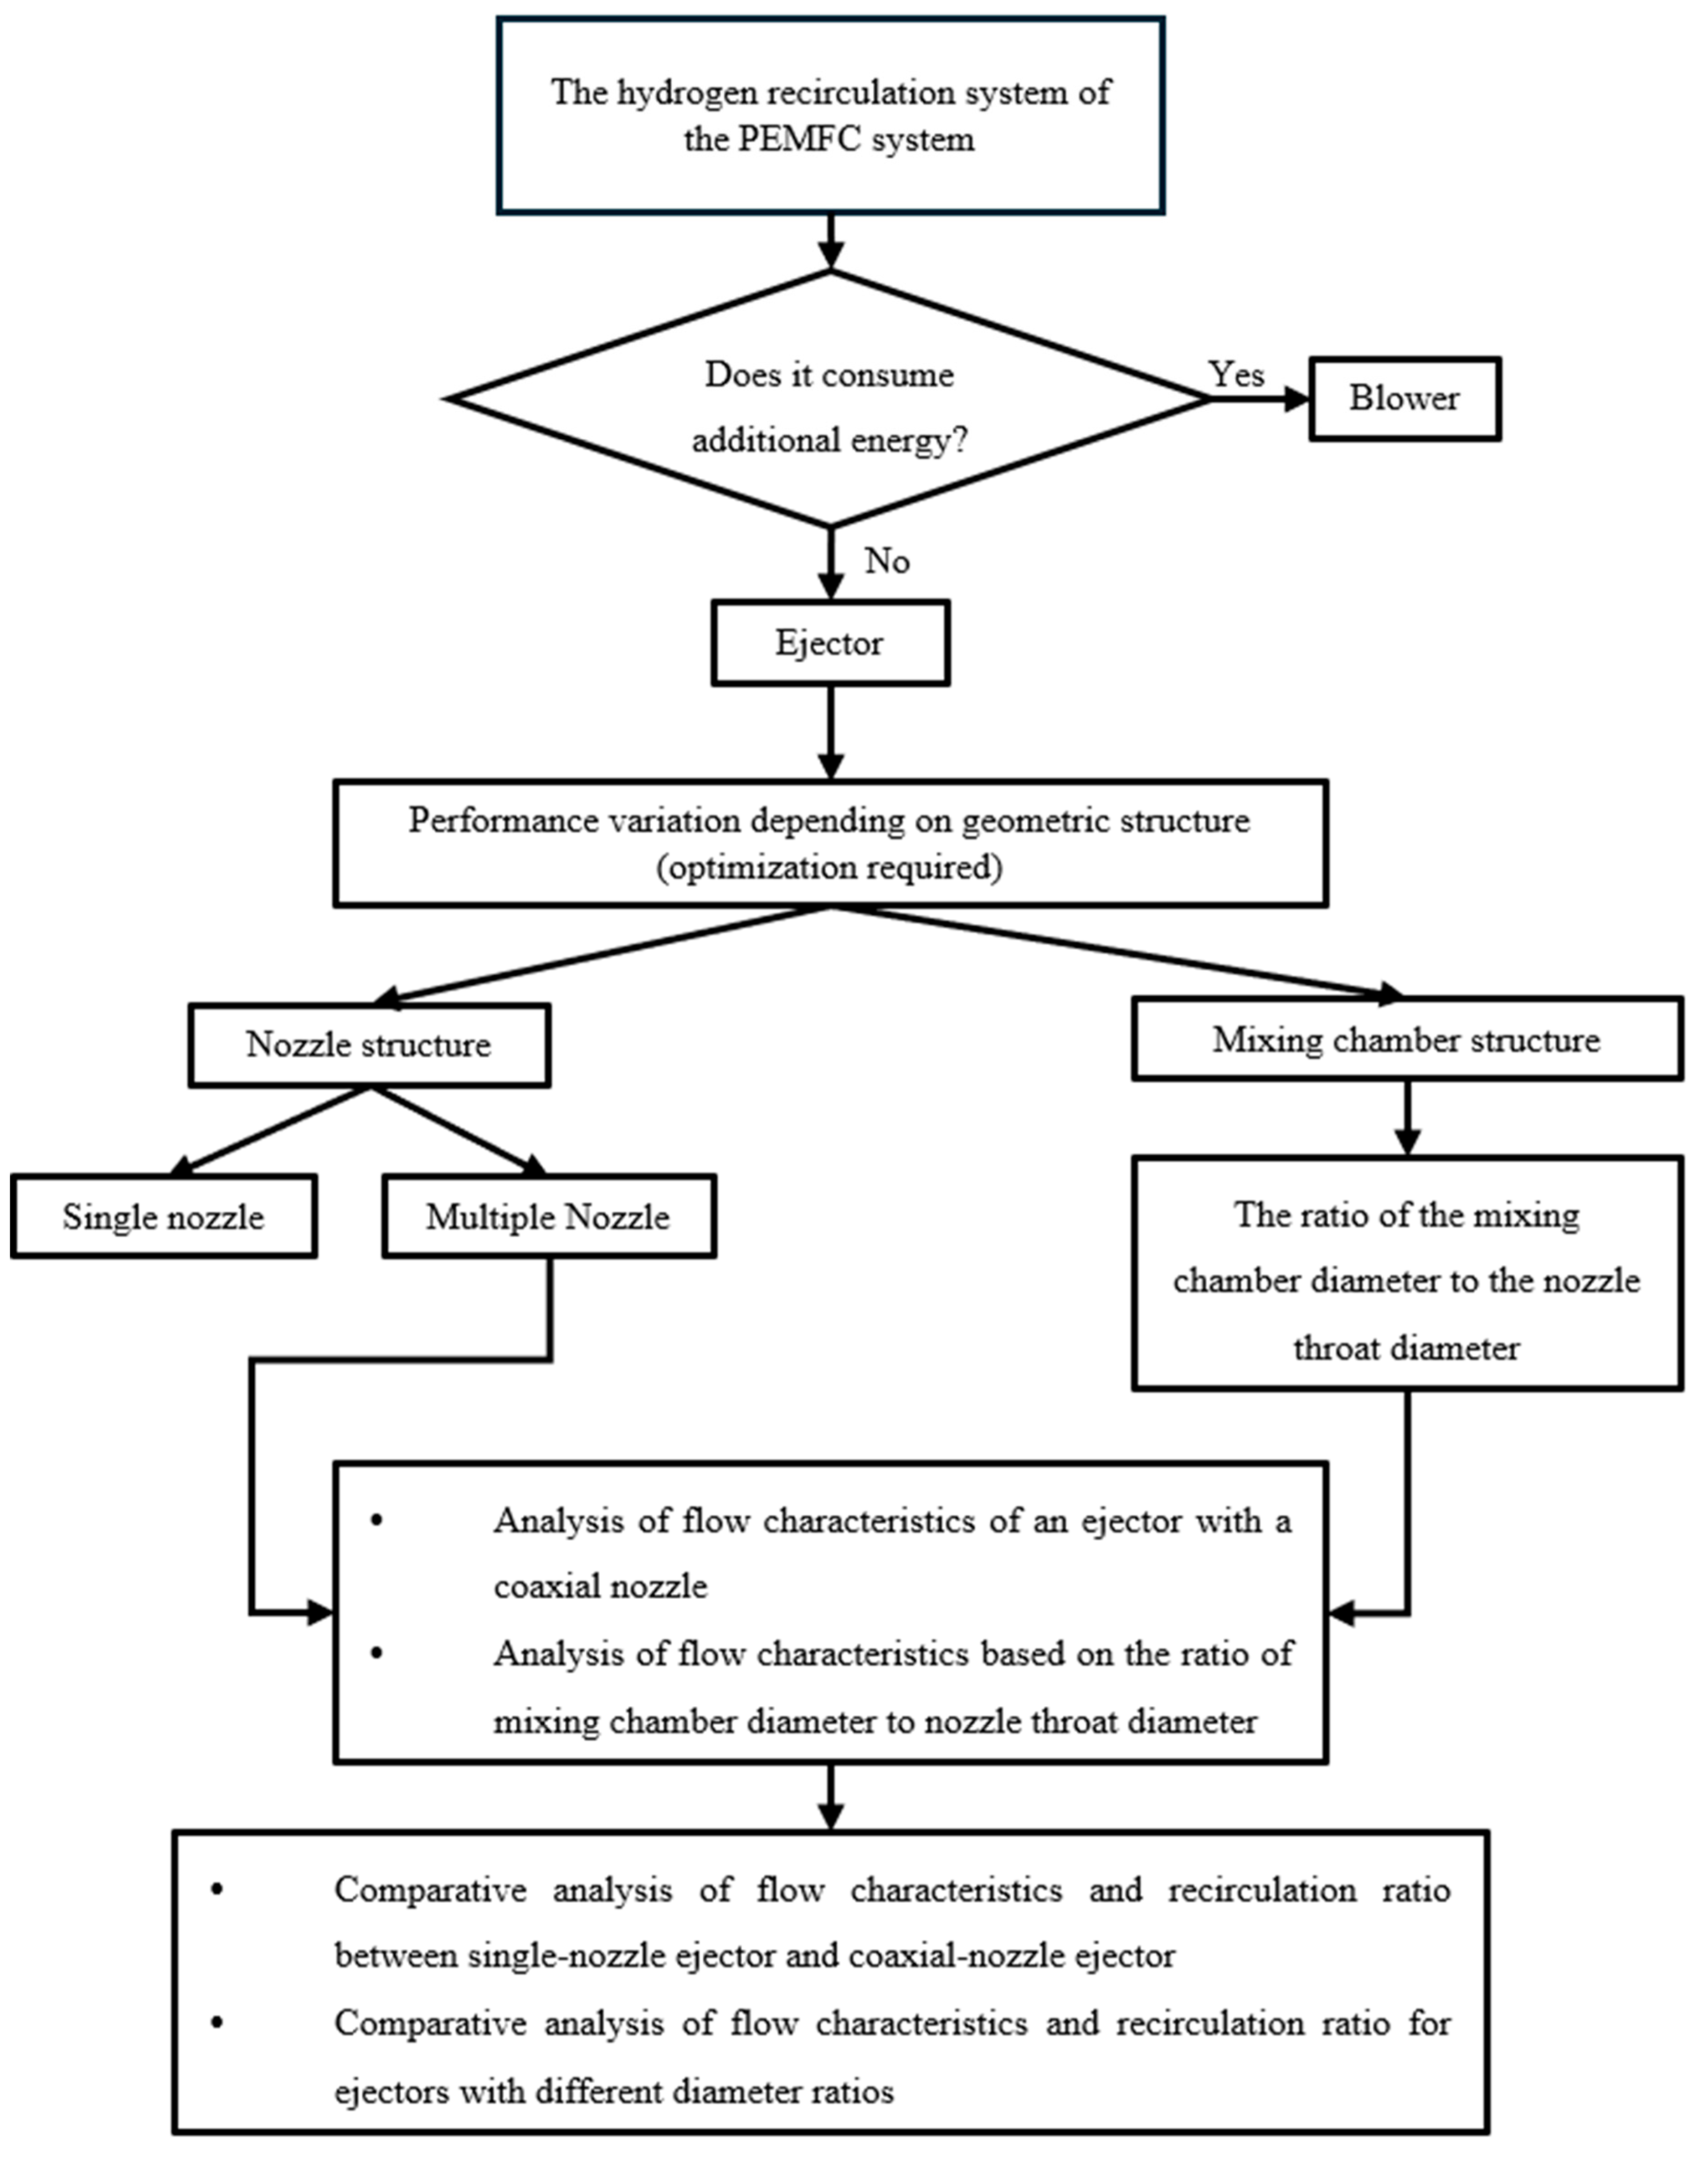
Therefore, this study focused on coaxial-nozzle ejectors with wide operating ranges, aiming to overcome nozzle misalignment problems and enhance ejector performance. This study involved a comparative analysis of the flow characteristics of coaxial- and single-nozzle ejectors, as well as an investigation into the flow behavior and recirculation ratios based on the ratio between the diameters of the mixing chamber and nozzle throat. So, numerical simulations are conducted to (i) directly compare the flow characteristics of single and coaxial nozzle ejectors under matched conditions, and (ii) quantify the effects of varying Dr on static pressure distributions, Mach number fields, and recirculation ratios across a primary flow pressure range of 4–8 bar. The originality of this work lies in establishing a quantitative relationship between Dr and ejector performance in coaxial-nozzle configurations, thereby addressing a key gap in the literature on hydrogen recirculation for PEMFC systems. The flowchart of the research process is shown in Figure 2.

2. Analysis of Internal Flow Characteristics of Hydrogen Recirculation Ejectors

2.1. Modeling of Single- and Coaxial-Nozzle Ejectors

2.1.1. Geometric Modeling

In this study, the recirculation ratio, which is a key performance indicator of ejectors, was calculated based on the primary flow pressure. This study aimed to determine the optimal geometric conditions by comparing the recirculation ratios of various ejector configurations. The recirculation ratio (Φ) is defined as follows:
Φ = m s m p = m s m f p + m s p .
In Equation (1), mp is the primary mass flow rate, ms is the secondary mass flow rate, mfp is the mass flow rate from the first nozzle, and msp is the mass flow rate from the second nozzle.
The diameter ratio of the coaxial-nozzle ejector, which is defined as the ratio of the mixing-chamber diameter to the nozzle-throat diameter, is expressed as follows:
D r = D c D n  
In Equation (2), Dr is the diameter ratio, Dc is the diameter of the mixing chamber, and Dn is the diameter of the nozzle throat.
In this study, the 3D modeling of a coaxial-nozzle ejector was conducted using Autodesk Inventor 2024. The coaxial-nozzle ejector model used in this study was based on the geometry experimentally validated by Du et al. [17]. First, the sum of the throat areas of the two nozzles is calculated using the following equation [17]:
A n t = m p v c r x p c r p p ,
p c r = p * p p = 2 x + 1 x x 1 ,
v c r = 2 x x + 1 R T p * .
In Equations (3)–(5), vcr is the critical velocity of the gas, x is the specific heat ratio of the primary gas flow, pcr is the relative pressure at the nozzle throat, and pp is the primary flow pressure. p and Tp are the critical pressure and temperature, respectively, and R is the gas constant.
The throat areas of the first and second nozzles are determined using the following equations [17]:
A f n t = p m i n p m a x + p m i n A n t
A s n t = A n t A f n t
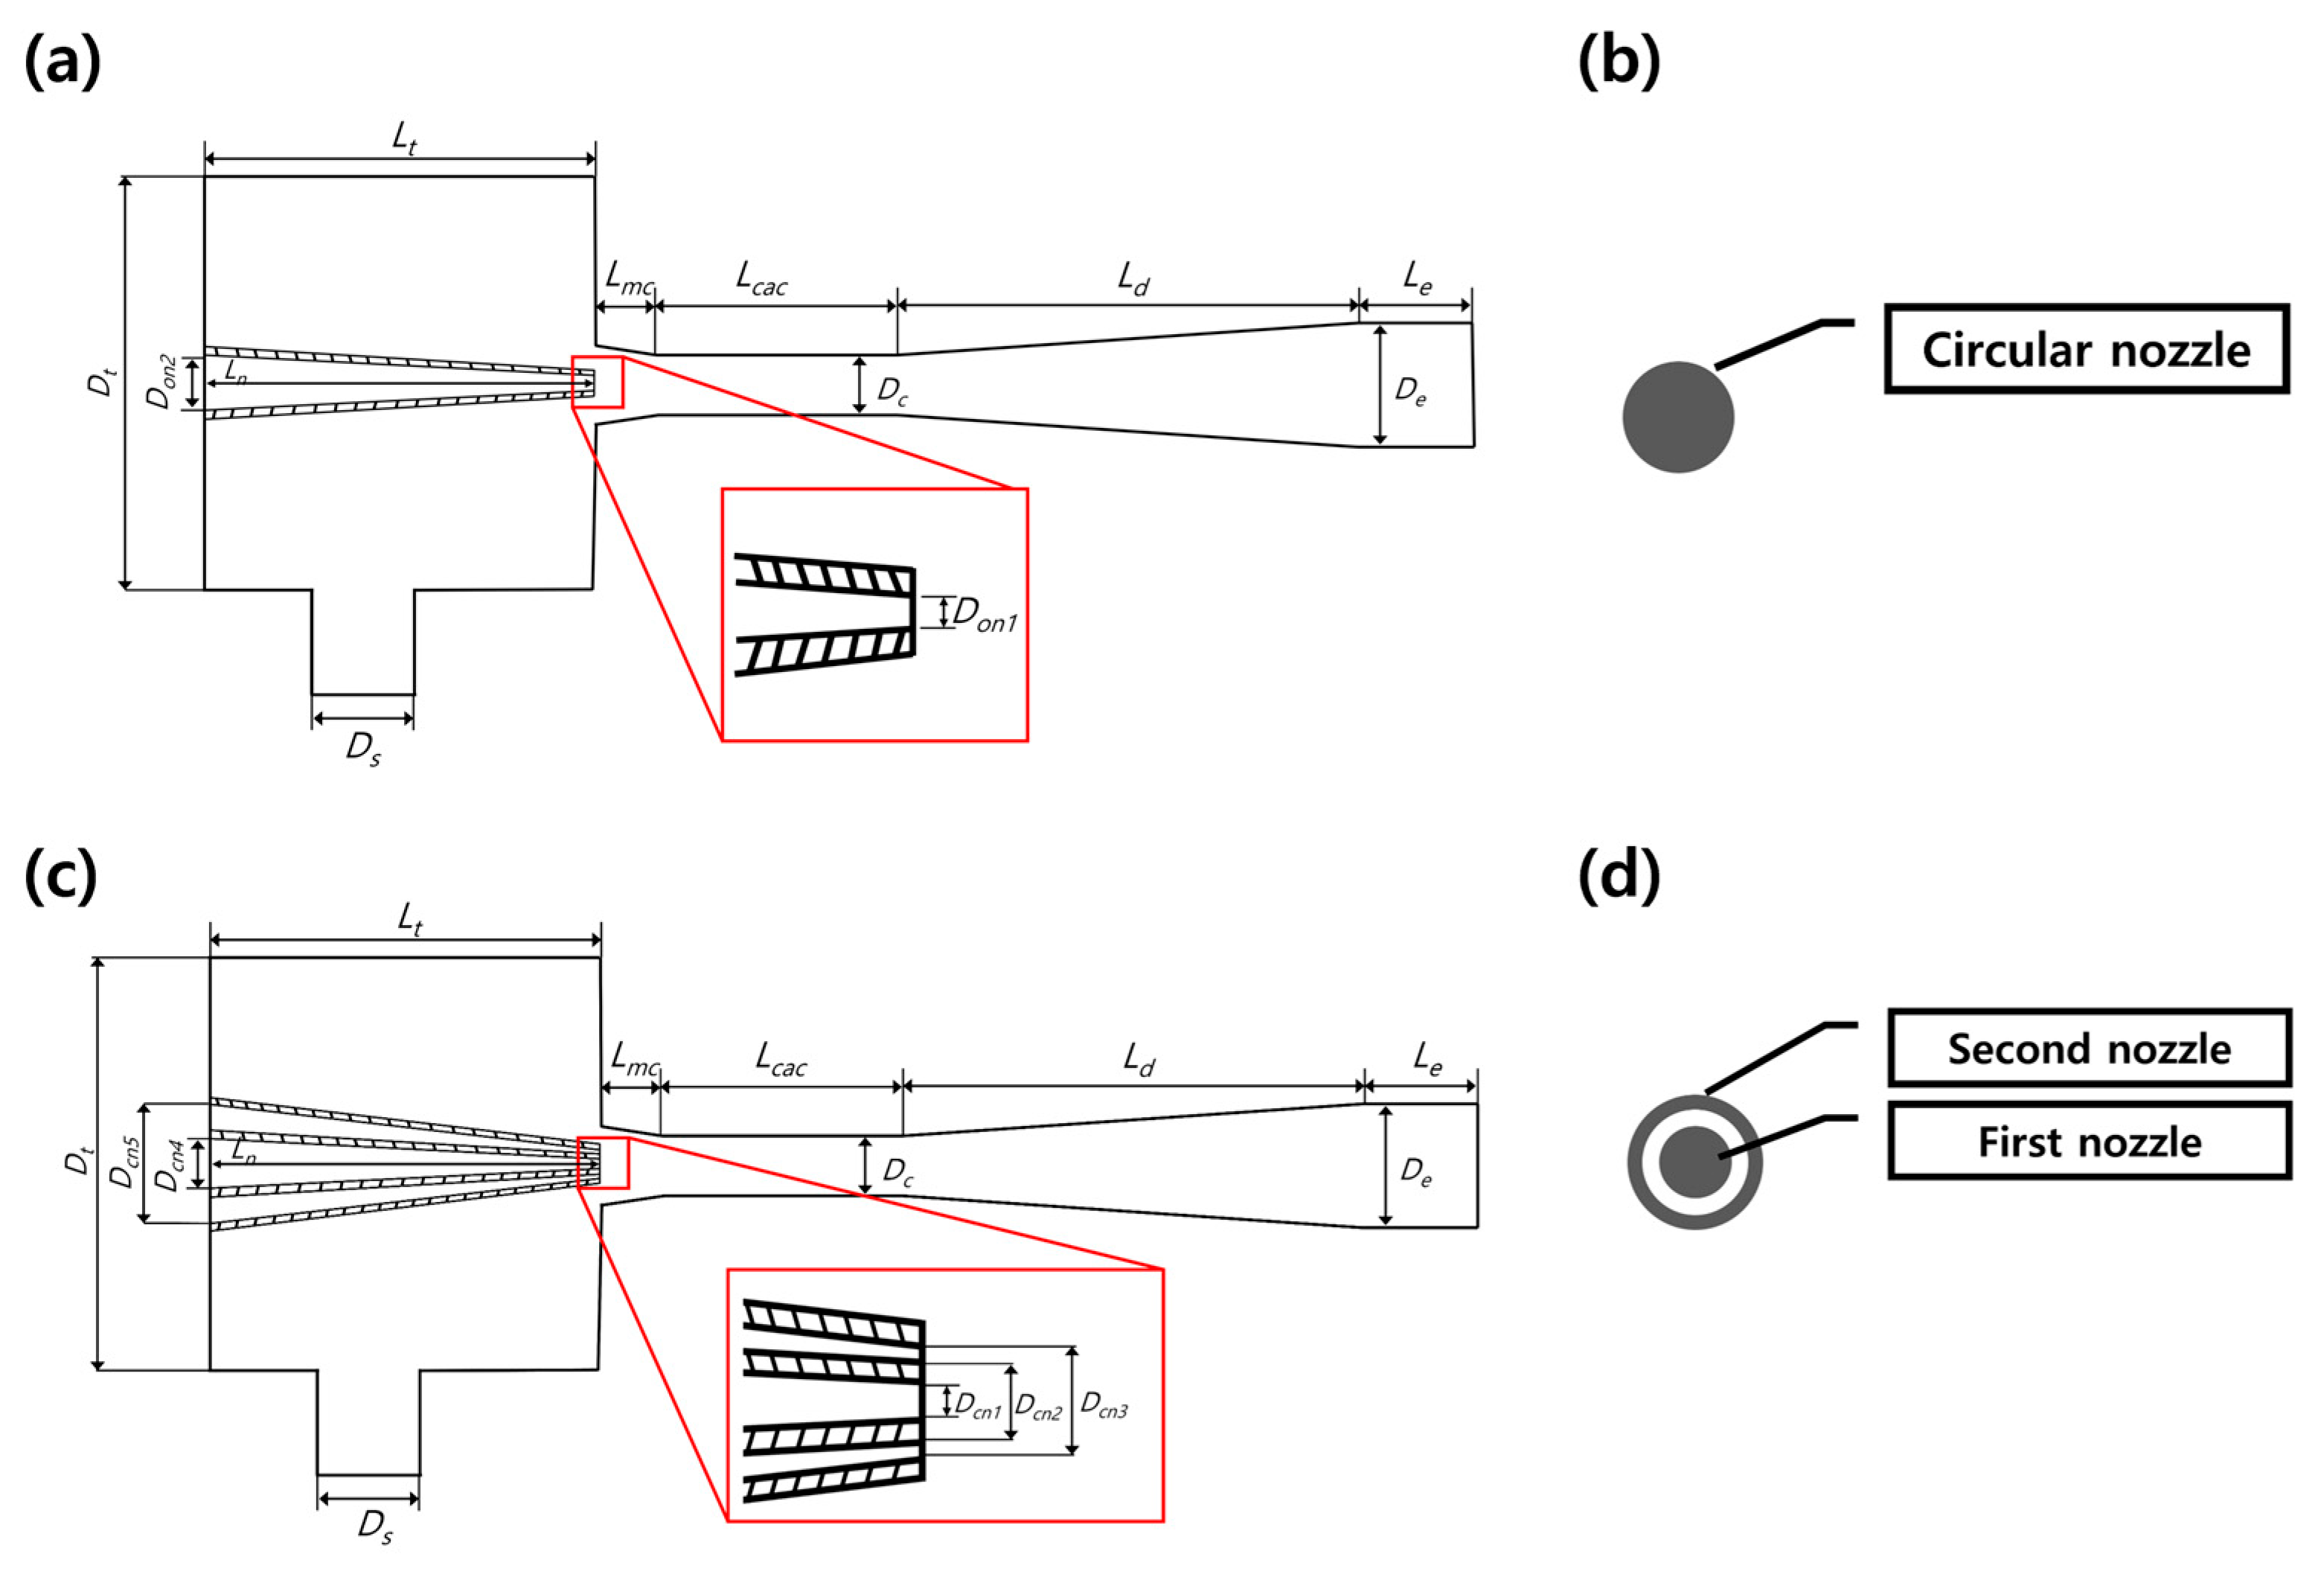
Figure 3a,c illustrate the structures of single-nozzle and coaxial-nozzle ejectors, respectively, and Figure 3b,d present their cross-sectional views. Figure 4a,b indicate the locations where the flow is introduced within the single-nozzle and coaxial-nozzle ejectors, respectively. To analyze the flow characteristics and recirculation ratios, the throat diameter of the single-nozzle ejector was determined by converting the combined throat area of the two nozzles into an equivalent single-nozzle area. All the other structural parameters, except for the nozzle geometry, were maintained constant. The geometric parameters are listed in Table 2. Table 3 presents the mixing-chamber diameters and corresponding nozzle-throat diameters for different diameter ratios. Using the reference model with a diameter ratio Dr = 2.55 as proposed in [17], which provides an experimentally validated CFD baseline for PEMFC anode recirculation within the relevant operating window (primary pressure: 4–7 bar; stack power: 17.9–84.0 kW), we adopted its geometry as our baseline case. This model demonstrated stable entrainment performance (recirculation ratio Φ ≥ 0.9 across the full output range and Φ > 2.0 at low power), making it a reliable benchmark for comparative analysis.
Based on this reference, additional coaxial ejector models were generated with Dr = 1.55, 2.05, 3.05, and 3.55 (ΔDr = 0.5) to quantify the sensitivity of recirculation ratio and internal flow structures to Dr under identical boundary conditions.

2.1.2. Numerical Modeling

The numerical simulations were conducted using ANSYS Fluent 14.5 and the RNG k–ε turbulence model was employed, as multiple prior validations have demonstrated its superior or comparable agreement with experimental data for global performance metrics such as the Entrainment Ratio (ER). This includes a supersonic air ejector study, where the RNG k–ε model was deemed suitable for ER prediction, and an adjustable-ejector study, where it showed the best agreement with measurements [18,19]. Zhu and Jiang evaluated four turbulence models (standard k–ε, realizable k–ε, RNG k–ε, and k–ω SST) and found that the RNG k–ε model provided the best agreement with experimental results in terms of mass flow rate and shock structure, while the k–ω SST model performed second best [20]. By contrast, Large Eddy Simulation (LES) captures unsteady shock trains with high fidelity but requires fine spatial grids and small time steps (due to CFL limitations), rendering broad parametric studies computationally impractical [21]. Thus, RNG k–ε is adopted in this work as a validated and computationally efficient baseline.
To accurately capture the boundary layer, particularly the near-wall region, we employed the Enhanced Wall Treatment (EWT) in accordance with the ANSYS Fluent Theory Guide. EWT automatically switches to its two-layer low-Re formulation, enabling resolution of the viscous sublayer without relying on log-law wall functions. For the turbulence boundary conditions, the turbulence intensity and hydraulic diameter were specified to ensure a fully developed inlet flow. The SIMPLEC algorithm was applied for pressure–velocity coupling, and the physical properties of hydrogen were obtained from the Fluent Database in ANSYS Fluent 14.5. Convergence was considered achieved when the residuals of all the governing equations dropped below 10−6. The boundary conditions used in the simulations were based on those used in previous studies [17]. The operating conditions of an 80 kW PEMFC stack are summarized in Table 4, and the corresponding simulation boundary conditions are presented in Table 5, considering both the PEMFC stack conditions and the experimental setup for the coaxial-nozzle ejector in reference [17].
The primary flow pressure is defined by the PEMFC stack output conditions, whereas the secondary flow and ejector outlet pressures are determined by the stack inlet and outlet pressures, respectively. Based on the experimental setup in [17], the primary flow pressure was set in the range of 4–8 bar, the secondary flow pressure at 1.9 bar, and the outlet pressure at 2.1 bar. The primary flow temperature was set to ambient temperature (293 K), and the secondary flow temperature was set to the stack operating temperature (338 K). The ejector walls were assumed to be adiabatic with a surface roughness of 0.5 mm. A comparison of the static pressure and Mach number distributions was conducted under a primary flow pressure of 7 bar, whereas all other boundary conditions were maintained as described above. For the coaxial-nozzle ejector, the simulations were performed using both activated nozzles.

2.2. Validation of the Ejector Analysis Model

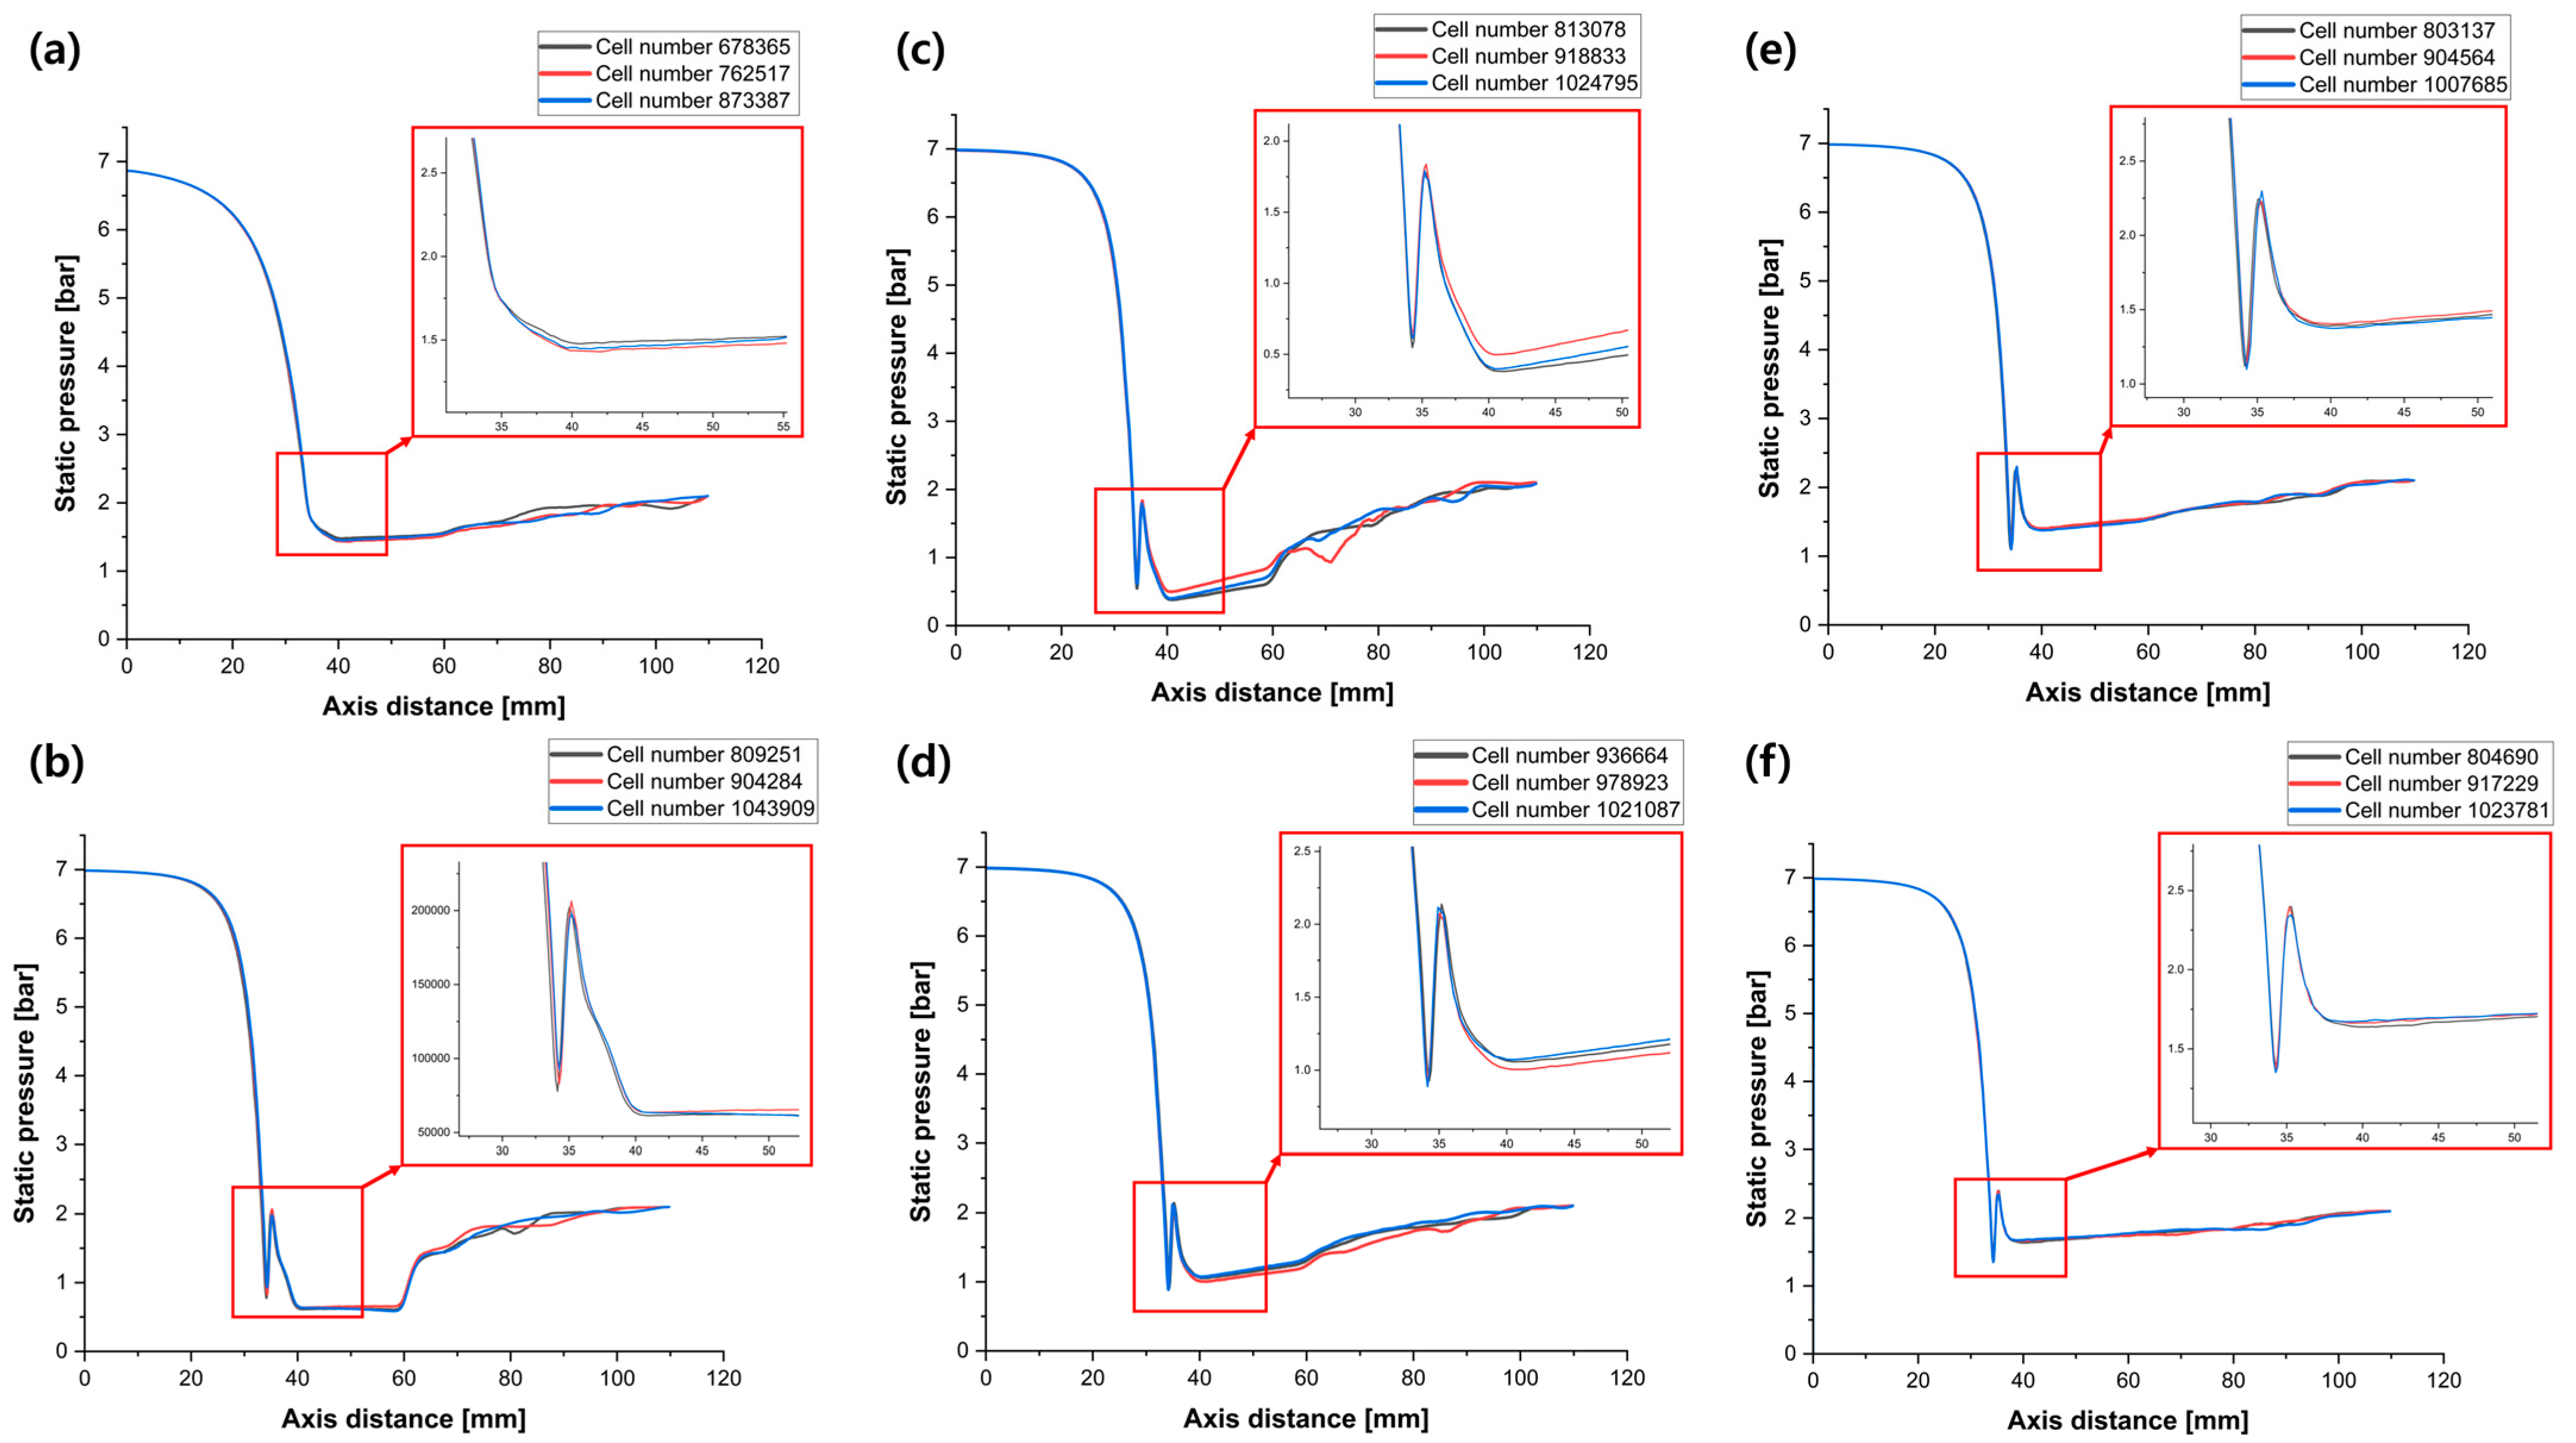
The ejector geometry was meshed in ANSYS ICEM CFD using a multi-block structured grid, with local refinements applied at the nozzle throat and exit, along the shear (mixing) layer, and in near-wall regions. Three grids were prepared for grid-independence verification (coarse ≈ 6.78 × 10⁵ cells, medium ≈ 7.63 × 10⁵ cells, and fine ≈ 8.73 × 10⁵ cells). Axial static pressure distributions obtained from the three mesh levels were highly consistent, indicating mesh independence. Therefore, the medium-resolution mesh was selected for all production simulations. Mesh quality, evaluated using the ICEM Determinant 3 × 3 × 3 metric, showed that over 83% of the cells had a determinant value greater than 0.9, and 100% exceeded 0.5, satisfying quality requirements for accurate CFD computation.
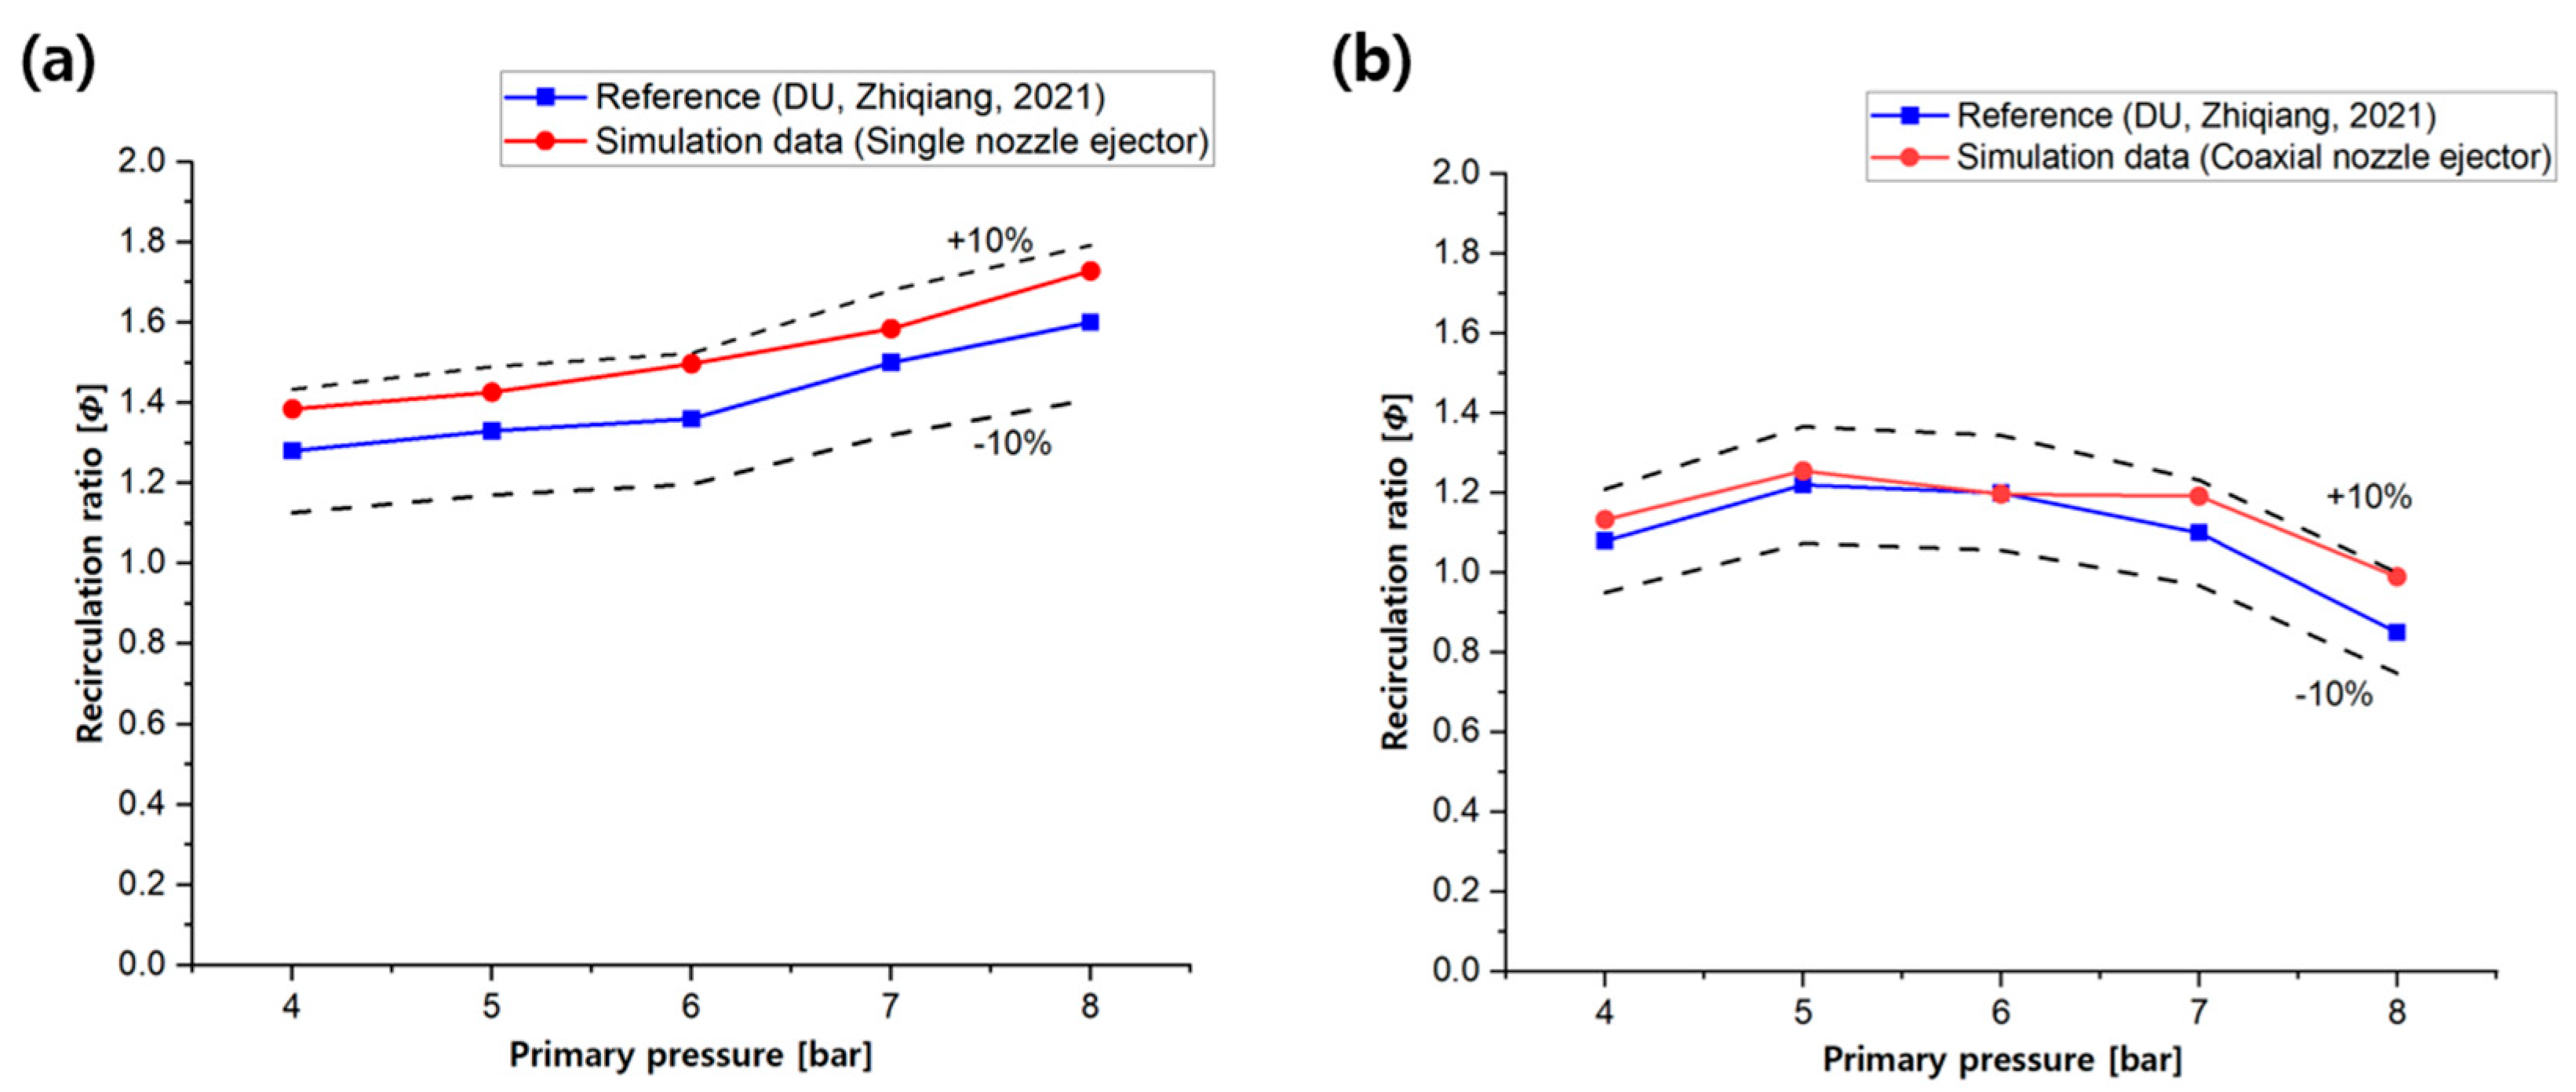
Figure 5 shows the mesh distributions. Figure 6a–f show the axial (x-axis) static pressure distributions at different mesh densities. To ensure mesh independence, three mesh densities were applied to all five models. The analysis results for the different mesh densities were highly consistent. A medium-density mesh was selected for the final numerical analysis, considering the balance between the simulation accuracy and the computational efficiency. Additionally, the reliability of the simulation results was verified by validating the coaxial-nozzle ejector model and comparing it with the experimental data from reference [17].
Figure 7 shows the recirculation ratio as a function of the primary flow pressure. The difference in the recirculation ratios between the simulation results in this study and those of the reference model remained within an error margin of approximately 10% over the entire primary-flow pressure range. Moreover, the trend of the variation in the recirculation ratio with respect to the primary flow pressure was qualitatively consistent. Therefore, it can be concluded that the ejector model employed in this study was reliable and accurate.

3. Analysis Results and Discussion

In this study, the flow characteristics of ejectors were analyzed using static pressure distributions and Mach numbers to evaluate the flow mixing efficiency and pressure drop based on the changes in pressure and velocity. Additionally, the Mach number was used to identify supersonic flow regions and detect the occurrence of shockwaves, thereby providing insights into potential flow instabilities.
M = v a
In Equation (8), M is the Mach number, v is the velocity of the fluid, and a is the local speed of sound. For an ideal gas, a = √γRT, with γ = cp/cv and R the specific gas constant of the working gas. The speed of sound was calculated under each pressure and temperature condition.

3.1. Flow Characteristics of Single- and Coaxial-Nozzle Ejectors

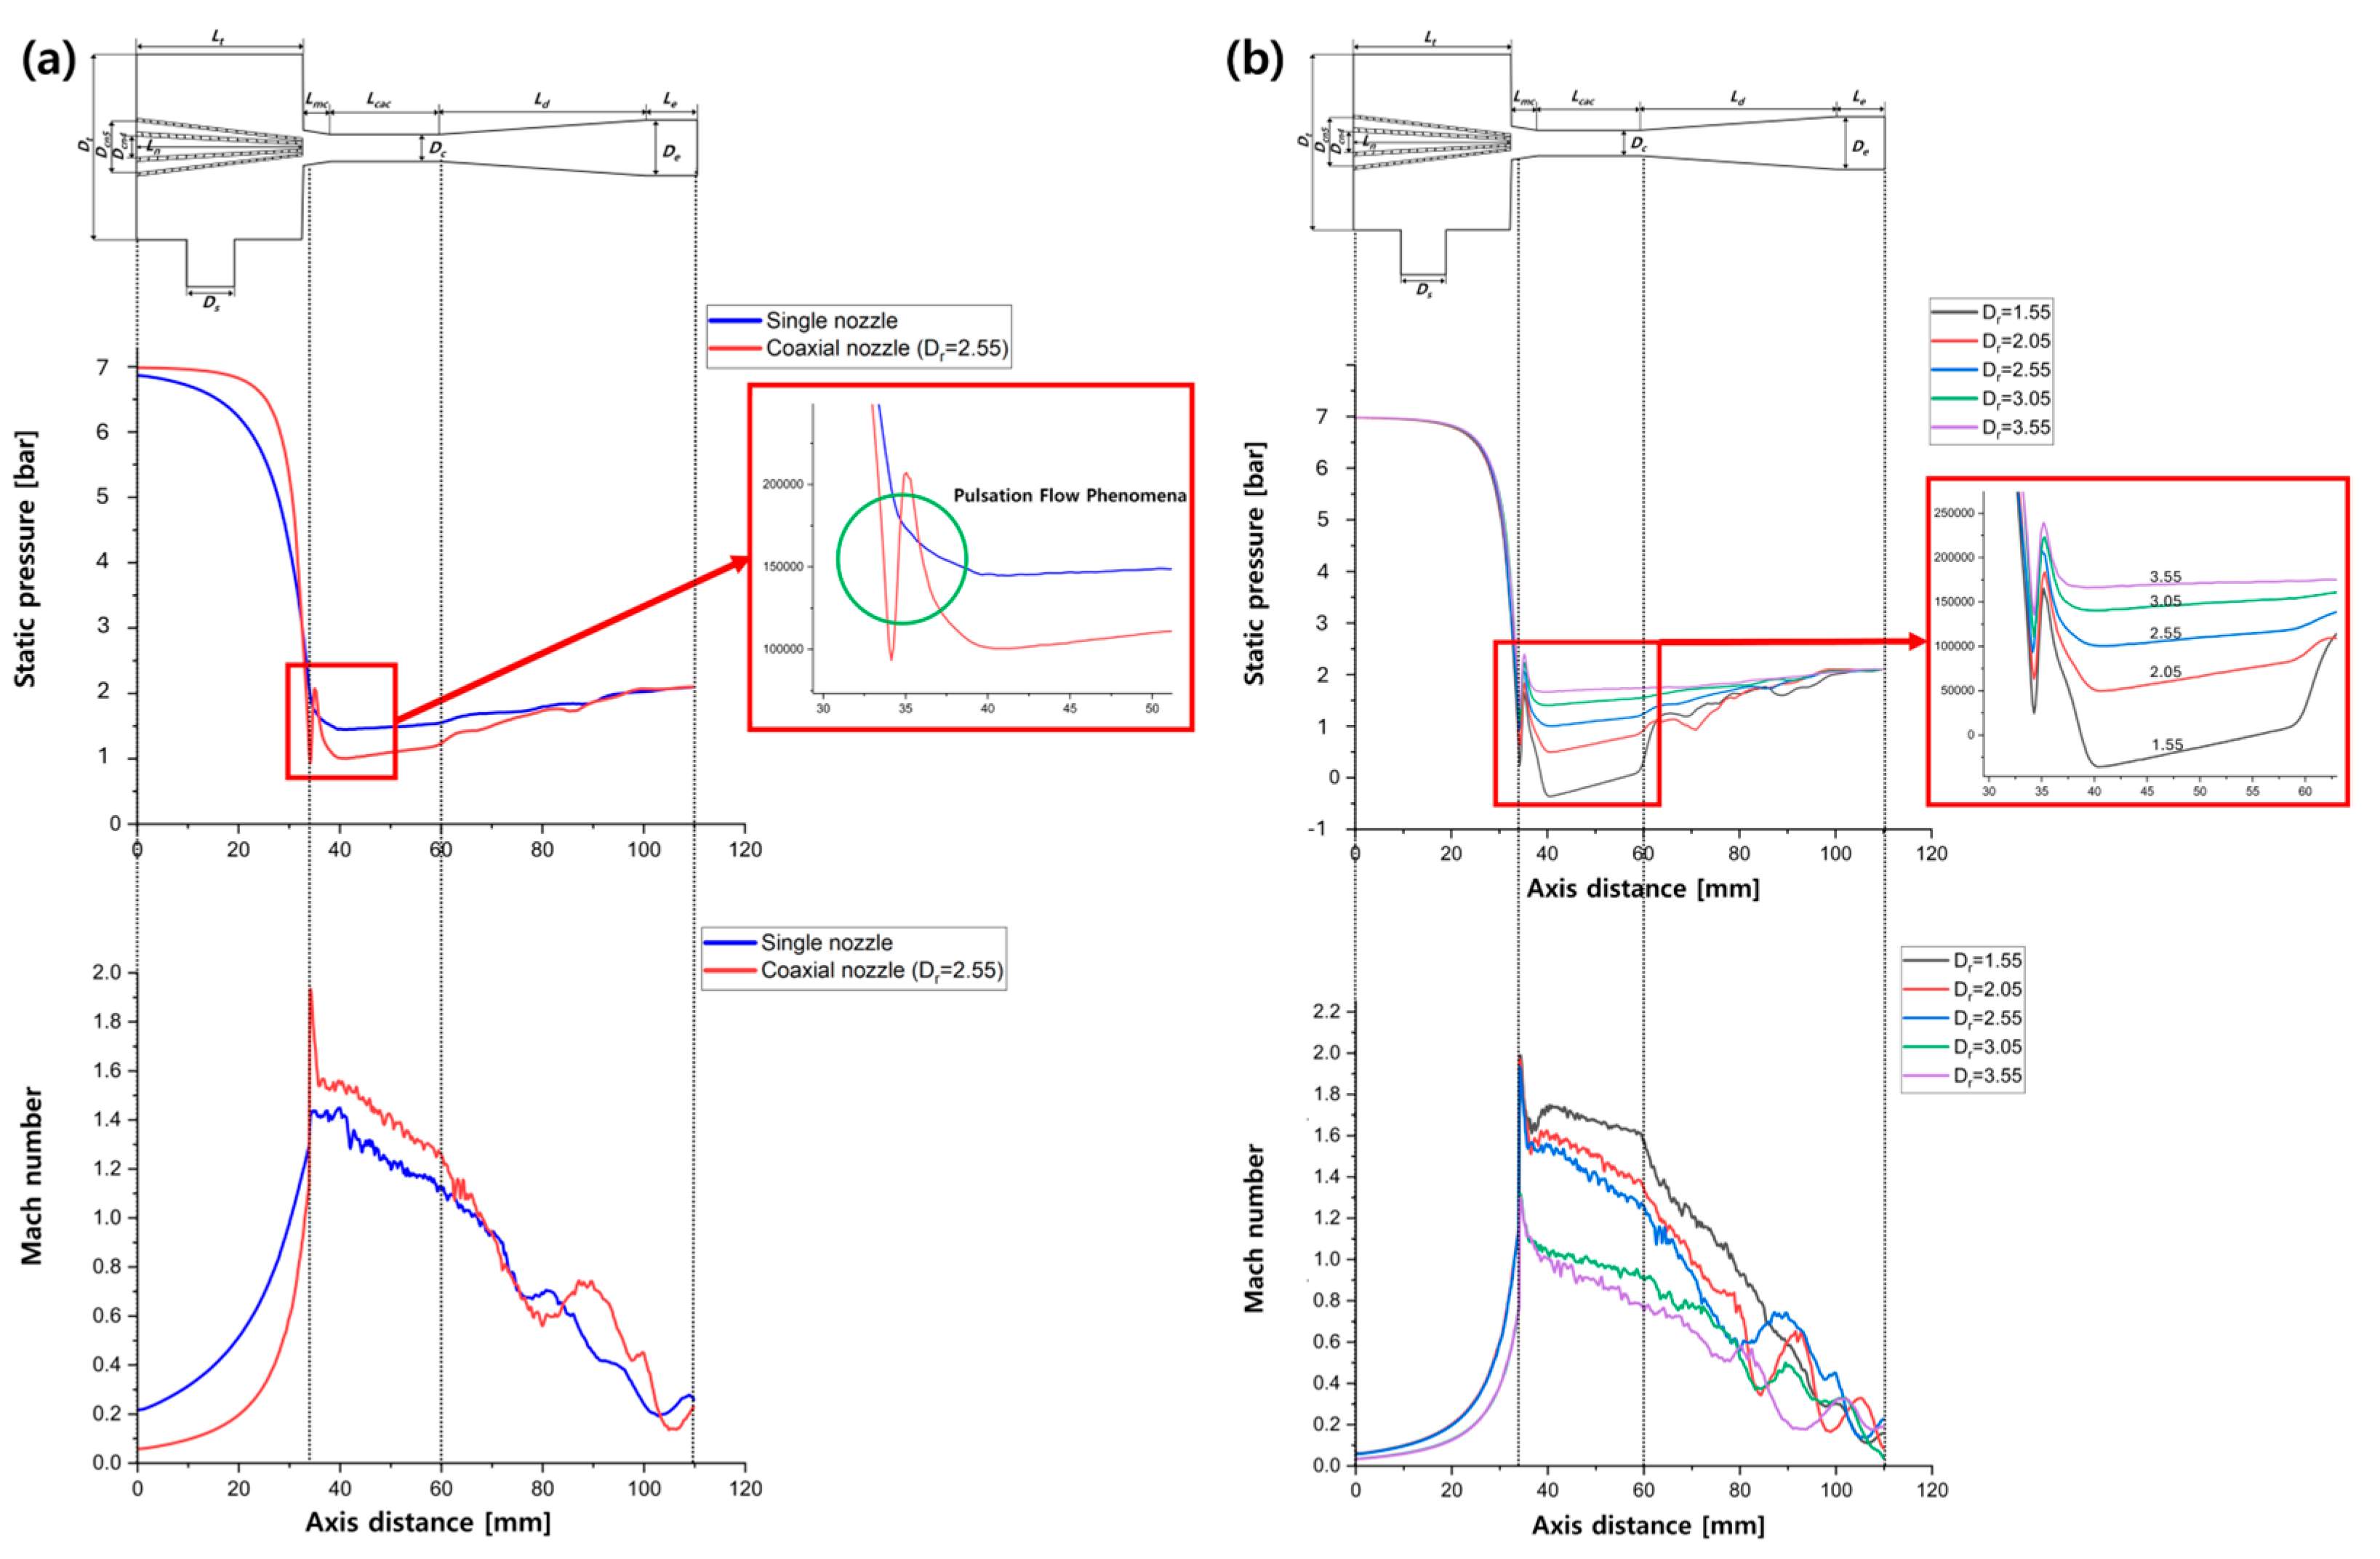
Figure 8 shows the static pressure and Mach number distributions in the axial direction for each ejector. Table 6 summarizes the minimum static pressures and maximum Mach numbers near the nozzle exits for each ejector.
For the single-nozzle ejector, the static pressure decreased to approximately 1.452 bar at an axial distance of 39.70 mm near the nozzle exit, before stabilizing and gradually recovering. The Mach number transitioned to a supersonic flow as the flow entered the mixing chamber, which had a larger cross-sectional area than the nozzle exit. The Mach number peaked at approximately 1.450 at the location of the minimum static pressure, and then decreased as the pressure recovered within the mixing chamber.
In contrast, for the coaxial-nozzle ejector (Dr = 2.55), the static pressure dropped sharply to approximately 1.010 bar at 34.27 mm, then increased to approximately 2.032 bar, and subsequently dropped again to 1.005 bar, followed by gradual pressure recovery in the mixing chamber.
The Mach number increased sharply within the nozzle, reached a peak of approximately 1.934 at the point of minimum pressure, and then decreased abruptly to approximately 1.522.
The most notable difference between the two ejectors was the presence of pulsation near the nozzle exit. Although both ejectors experienced a transition to supersonic flow when entering the mixing chamber, pulsation was observed only in the coaxial-nozzle ejector. This phenomenon occurred because the two flows from the coaxial nozzles interacted within a common mixing chamber. This phenomenon arises because the two jets from the coaxial nozzles interact within a shared mixing chamber, giving rise to complex structures driven by shear-layer instabilities and shock–shear interactions, which are commonly associated with coherent vortical patterns in ejectors [22,23]. These flow structures, combined with supersonic acceleration, result in shock wave formation, thereby inducing pulsation.
Figure 8b shows the static pressure and Mach number distributions for five coaxial-nozzle ejector models with different diameter ratios (Dr). Decreasing the mixing-chamber diameter led to increased pressure fluctuations, particularly near the nozzle exit.
At 34.27 mm, the minimum static pressure decreased to approximately 0.247 bar for the Dr = 1.55 model and 0.631 bar for the Dr = 2.05 model. The Mach numbers were approximately 1.989 and 1.954, respectively. Although the pressure in the mixing chamber gradually recovered, it remained relatively low.
In contrast, as the mixing-chamber diameter increased, the static pressure fluctuations decreased. At the same axial location, the minimum static pressure increased to 1.109 bar for the Dr = 3.05 model and 1.358 bar for the Dr = 3.55 model, with the corresponding Mach numbers of 1.317 and 1.301, respectively.
This indicates that increasing the mixing-chamber diameter improves the flow stability, reduces the flow acceleration and pressure fluctuations, decreases the pressure loss, and enhances the suction performance.
The effect of the diameter ratio on the Mach number is as follows: for lower diameter ratios (Dr = 1.55, Dr = 2.05), a supersonic flow with a Mach number of approximately 2.0 was observed near the nozzle exit. By contrast, as the mixing-chamber diameter increased, the Mach number decreased. For the highest diameter ratios (Dr = 3.05, Dr = 3.55), the Mach number was approximately 1.301. This confirms that a larger mixing-chamber diameter results in weaker flow acceleration, leading to a lower Mach number.
As mentioned earlier, pulsation was observed near the nozzle exit in the coaxial ejectors, and this phenomenon appeared in all models with varying diameter ratios. As shown in Figure 8b and Table 6, the magnitudes of the fluctuations in the static pressure and Mach number differed across the models.
When the mixing-chamber diameter was small (Dr = 1.55, Dr = 2.05), the variability was high. As the flow enters the relatively narrow mixing chamber, the unstable flow structures amplify the shockwaves and pulsations.
Conversely, for higher diameter ratios (Dr = 3.05, Dr = 3.55), the flow acceleration was weaker, and the flow diffused into a wider mixing chamber, reducing pressure fluctuations. Consequently, the shockwave intensity and pulsation were significantly attenuated.
Furthermore, in the low-diameter-ratio models, the secondary minimum static pressure was lower than the primary minimum static pressure, but the Mach number was also smaller. This indicates that energy losses owing to strong vortices and shockwaves are more pronounced in the lower-diameter-ratio models than in the higher-diameter-ratio ones.

3.2. Velocity Distribution in Single- and Coaxial-Nozzle Ejectors

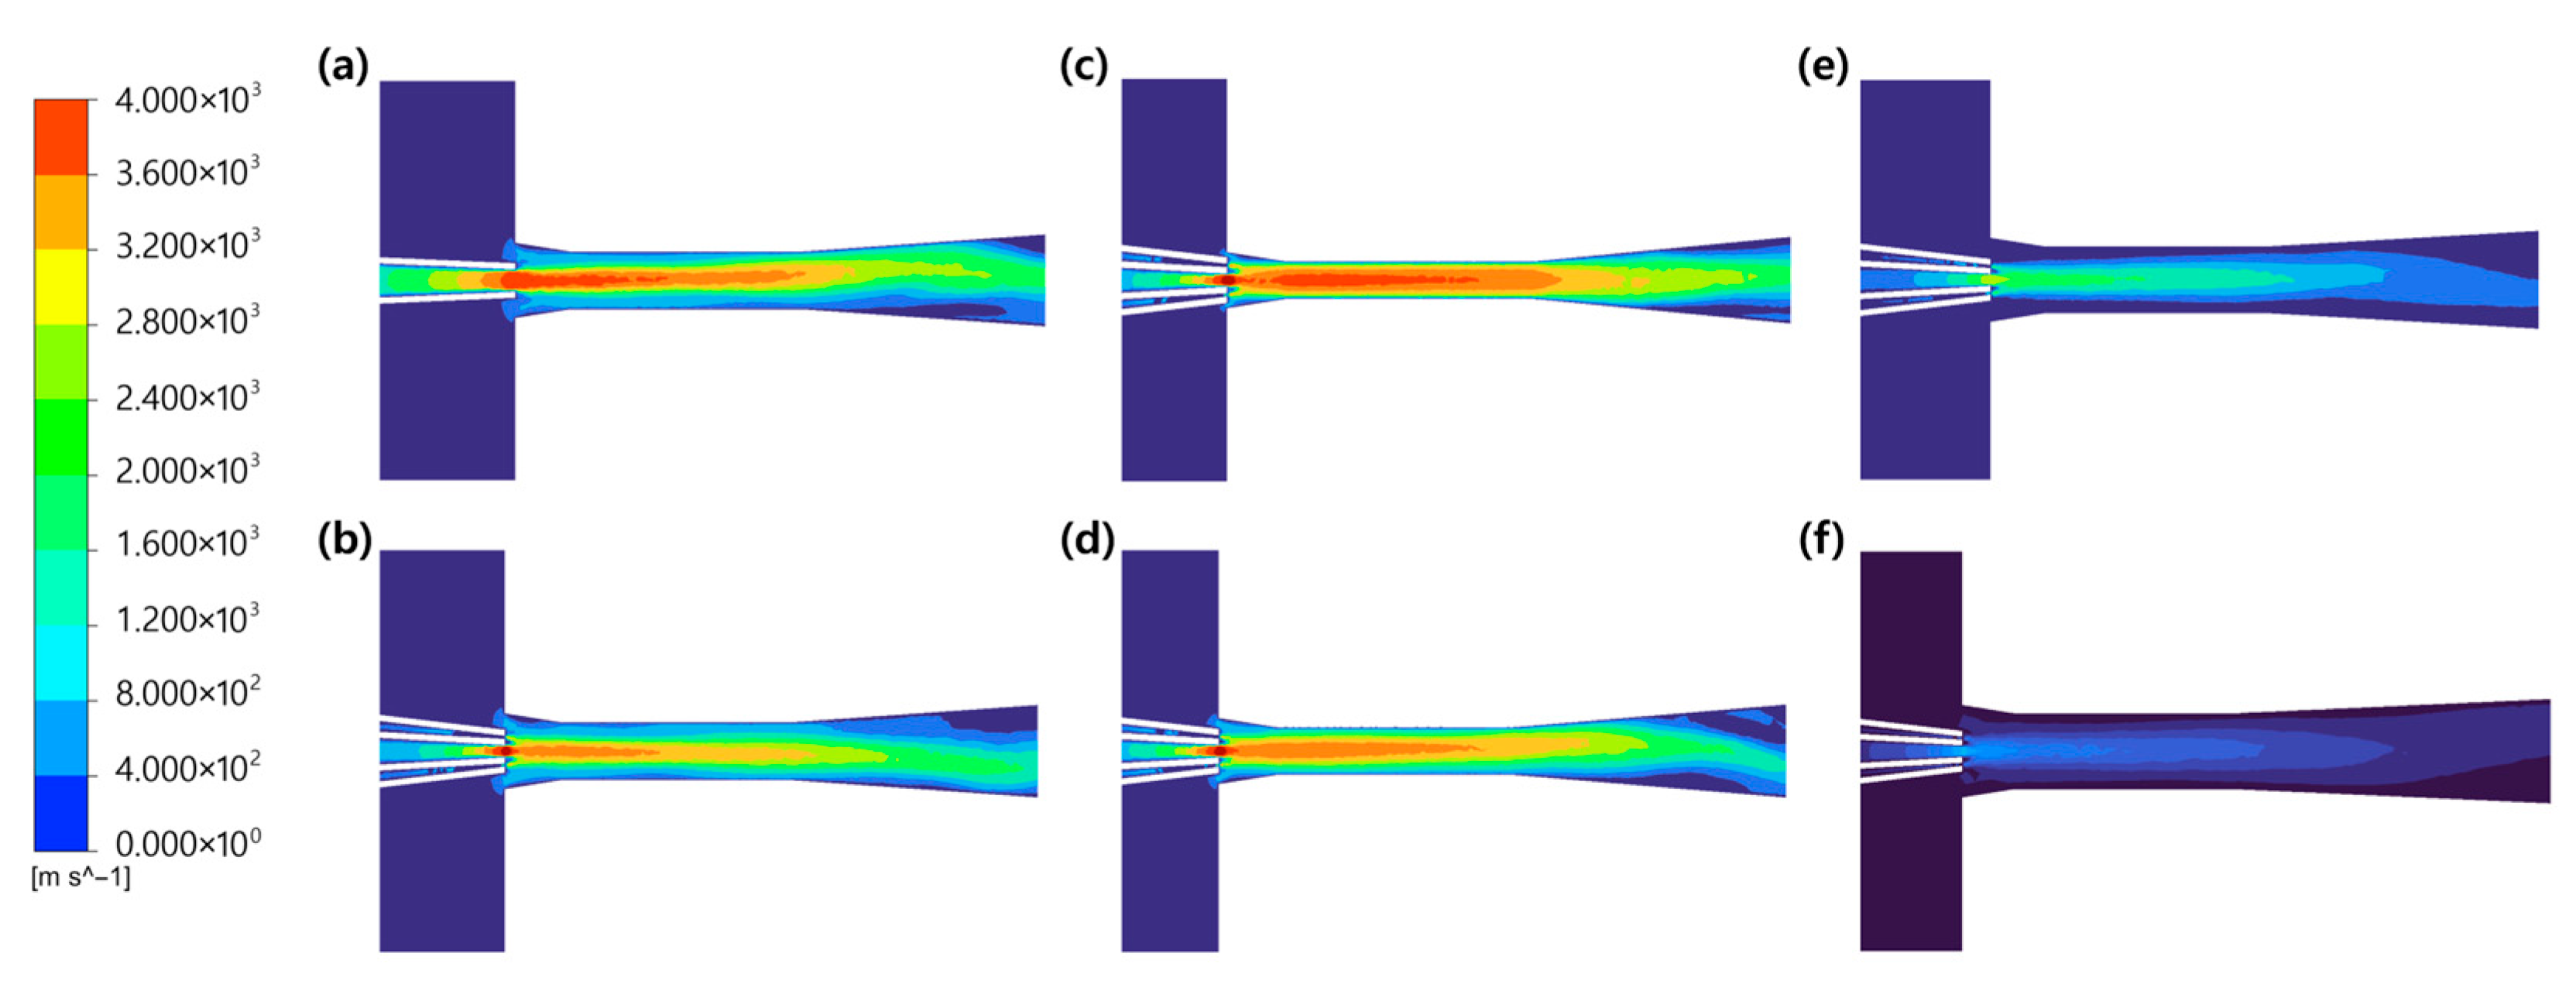
Figure 9a,b illustrate the velocity distribution for the single-nozzle ejector and coaxial-nozzle ejector (Dr = 2.55), respectively, and Figure 9c–f show the velocity distributions for coaxial-nozzle ejectors with various diameter ratios. All the velocity distributions in Figure 9 were analyzed under the following operating conditions: primary flow pressure = 7 bar, secondary flow pressure = 1.9 bar, and outlet pressure = 2.1 bar.
In the single-nozzle ejector, high velocity was maintained up to the diffuser section. Additionally, the single-nozzle ejector features a relatively wide connection region between the mixing chamber and the mixing area where the secondary flow enters, enabling a smoother entrainment of the secondary flow. This observation suggests that geometric optimization, such as adjusting the convergence angle of the mixing chamber in the coaxial-nozzle ejector, could further enhance the suction performance.
Furthermore, as shown in Figure 9b–f, the flow field in the mixing chamber region of the coaxial-nozzle ejector exhibited apparent axial symmetry. For ejectors with lower diameter ratios (Dr = 1.55, Dr = 2.05), the secondary flow suction was relatively limited. By contrast, ejectors with higher diameter ratios (Dr = 3.05, Dr = 3.55) demonstrated greater entrainment of the secondary flow, as evidenced by the velocity field.

3.3. Recirculation Ratio in Single- and Coaxial-Nozzle Ejectors

The flow characteristics significantly affected the recirculation ratio. As shown in Figure 10a and Table 7, the recirculation ratio of the single-nozzle ejector was slightly higher than that of the coaxial-nozzle ejector across the range of primary flow pressures.
In the single-nozzle ejector, the recirculation ratio increased as the primary flow pressure increased, owing to a larger pressure drop. In contrast, the coaxial-nozzle ejector exhibited reduced suction performance, primarily owing to its complex flow structures and shockwave formation, as previously discussed. Thus, the structural differences between the single and coaxial nozzles significantly affect recirculation performance.
Figure 10 shows the recirculation ratio as a function of the primary flow pressure, and Table 7 lists the specific values of the recirculation ratio under various primary pressure conditions. As shown in Figure 10b,c, changes in the diameter ratio affect both the flow characteristics and recirculation ratio. For lower diameter ratios (Dr = 1.55, Dr = 2.05), despite experiencing lower static pressure near the nozzle exit (Dr = 1.55:0.247 bar, Dr = 2.05:0.631 bar), the recirculation ratio remained lower than that of the reference model (Dr = 2.55) across all primary pressure levels. This indicates that strong vortices and shockwaves caused by rapid acceleration lead to energy loss and weakened entrainment of secondary flow.
However, for higher diameter ratios (Dr = 3.05, Dr = 3.55), smaller pressure and velocity gradients and more stable flow fields resulted in higher recirculation ratios. As the primary pressure increased, the recirculation ratio exhibited a consistent increase. In particular, the Dr = 3.55 model achieved the highest recirculation ratio at pressures above 6 bar. However, at 4 bar, this ratio was very low. This is likely due to the weakened flow acceleration in the larger mixing chambers, resulting in a reduced kinetic energy of the primary flow and preventing the ejector from operating in the critical mode.
As shown in Table 7, the Dr = 3.05 and Dr = 3.55 models recorded higher recirculation ratios than the single-nozzle ejector at pressures above 5 bar. This suggests that coaxial-nozzle ejectors have the potential to improve performance through operating-mode control. In particular, under low-output conditions, operating only the inner nozzle of the coaxial configuration can improve the recirculation ratio and outperform the single-nozzle ejector across the full operating range.

4. Conclusions

In this study, the internal flow characteristics and recirculation ratios of a coaxial-nozzle ejector, a key component for hydrogen recirculation in PEMFC systems, were investigated by varying the ratio of the mixing-chamber diameter to the nozzle-throat diameter and the primary flow pressure. The following conclusions were drawn.
(1)
Unlike single-nozzle ejectors, coaxial-nozzle ejectors exhibited supersonic flow acceleration near the nozzle exit as the two flow streams converged, accompanied by the formation of shock waves and observable pressure pulsations. These flow characteristics contribute to a decrease in the recirculation ratio.
(2)
For coaxial-nozzle ejectors with lower diameter ratios, the flow was more intensely accelerated, resulting in stronger vortices and shock waves. Although larger pressure drops were observed, these flow characteristics led to a reduction in the recirculation ratio. The ejectors with the diameter ratios of 1.55 and 2.05 showed relatively low and stable recirculation performance across the entire range of primary flow pressures, with the recirculation ratios of approximately 0.5 and 1.0, respectively.
(3)
For higher diameter ratios, the flow acceleration weakened, and the flow field became relatively stable. The ejector with a diameter ratio of 3.05 achieved a recirculation ratio above 1.5 when the primary flow pressure exceeded 5 bar, whereas the ejector with a diameter ratio of 3.55 achieved the highest recirculation ratio at pressures above 6 bar. Both the ejectors outperformed the single-nozzle ejector under high-output conditions.
(4)
The ratio of the mixing-chamber diameter to the nozzle-throat diameter significantly affected the recirculation ratio. A comparison of the relationship between the primary flow pressure and recirculation ratio revealed that optimal geometric conditions exist within the operating range.
Based on these findings, it is evident that the application of various nozzle configurations and geometric optimization is essential for improving the ejector performance of 80–100 kW-class PEMFC systems used in hydrogen fuel cell vehicles. In particular, coaxial-nozzle ejectors are promising alternatives capable of overcoming the limitations of conventional ejectors. This study confirms that performance improvement can be achieved through geometric optimization. Further enhancements in the performance of coaxial-nozzle ejectors are expected through the optimization of geometric parameters, such as the diameter ratio, nozzle exit position, mixing-chamber length, and convergence angle.

Author Contributions

Conceptualization, J.H. and J.L.; methodology, J.H.; software, J.H.; validation, J.H.; formal analysis, J.H.; investigation, J.H.; resources, J.H.; data curation, J.H. and S.W.; writing—original draft preparation, J.H. and S.W.; writing—review and editing, J.L.; visualization, J.H. and S.W.; supervision, J.L.; project administration, J.L.; funding acquisition, J.L. All authors have read and agreed to the published version of the manuscript.

Funding

This study was funded by the Korea Institute of Energy Technology Evaluation and Planning (KETEP) and Ministry of Trade, Industry, and Energy (MOTIE) of the Republic of Korea (No. RS-2024-00398166).

Institutional Review Board Statement

Not applicable.

Informed Consent Statement

Not applicable.

Data Availability Statement

The data presented in this study are available upon request from the corresponding author.

Conflicts of Interest

The authors declare no conflicts of interest.

References

  1. Ministry of Land, Infrastructure and Transport. Vehicle Registration Statistics in South Korea. Available online: https://www.molit.go.kr/USR/NEWS/m_71/dtl.jsp?lcmspage=1&id=95086498 (accessed on 24 August 2025).
  2. Hyundai Motor Group. The Path to a Hydrogen Society: How Is the World Moving? Available online: https://www.hyundai.co.kr/amp/CONT0000000000000865 (accessed on 24 August 2025).
  3. Hyundai Motor Group. The Principle of Hydrogen Fuel Cell Vehicles Driving the Future. Available online: https://www.hyundai.co.kr/story/CONT0000000000005046 (accessed on 24 August 2025).
  4. Top TiTechs. How Is the Generated Water Controlled in Proton Exchange Membrane Fuel Cells (PEMFC)? Available online: https://toptitechs.com/how-is-the-generated-water-controlled-in-proton-exchange-membrane-fuel-cells-pemfc/ (accessed on 24 August 2025).
  5. Wang, C.; Wang, L. Investigation of fluid characteristic and performance of an ejector by a wet steam model. Entropy 2023, 25, 85. [Google Scholar] [CrossRef] [PubMed]
  6. Dong, J.-M.; Song, H.; Yu, M.-Q.; Wang, W.-N.; Pan, X.-X. Numerical investigation of miniature ejector refrigeration system embedded with a capillary pump loop. Micromachines 2017, 8, 235. [Google Scholar] [CrossRef] [PubMed]
  7. Yan, J.; Shu, Y.; Wang, C. Effect of back pressure on performances and key geometries of the second stage in a highly coupled two-stage ejector. Entropy 2022, 24, 1847. [Google Scholar] [CrossRef] [PubMed]
  8. Wang, X.; Xu, S.; Xing, C. Numerical and experimental investigation on an ejector designed for an 80 kW polymer electrolyte membrane fuel cell stack. J. Power Sources 2019, 415, 25–32. [Google Scholar] [CrossRef]
  9. Ding, G.; Cao, X.; Chen, J.; Zhang, Y.; Bian, J. Impact of the expansion ratio on the properties of hydrogen recirculation ejectors. Appl. Energy 2024, 374, 124026. [Google Scholar] [CrossRef]
  10. Nikiforow, K.; Koski, P.; Karimmäki, H.; Ihonen, J.; Alopaeus, V. Designing a hydrogen gas ejector for 5 kW stationary PEMFC system–CFD-modeling and experimental validation. Int. J. Hydrogen Energy 2016, 41, 14952–14970. [Google Scholar] [CrossRef]
  11. Yin, Y.; Fan, M.; Jiao, K.; Du, Q.; Qin, Y. Numerical investigation of an ejector for anode recirculation in proton exchange membrane fuel cell system. Energy Convers. Manag. 2016, 126, 1106–1117. [Google Scholar] [CrossRef]
  12. Bian, J.; Zhang, Y.; Liu, Y.; Gong, L.; Cao, X. Structural optimization of hydrogen recirculation ejector for proton exchange membrane fuel cells considering the boundary layer separation effect. J. Clean. Prod. 2023, 397, 136535. [Google Scholar] [CrossRef]
  13. Zhang, X.; Wang, L.; Zhang, H.; Jia, L. Optimization of ejector structure for the PEMFC hydrogen recirculation system. In Proceedings of the 2020 Chinese Automation Congress (CAC), Shanghai, China, 6–8 November 2020; pp. 2954–2959. [Google Scholar] [CrossRef]
  14. Han, J.; Feng, J.; Hou, T.; Peng, X. Performance investigation of a multi-nozzle ejector for proton exchange membrane fuel cell system. Int. J. Energy Res. 2020, 45, 3031–3048. [Google Scholar] [CrossRef]
  15. Xue, H.; Wang, L.; Zhang, H.; Jia, L.; Ren, J. Design and Investigation of Multi-Nozzle Ejector for PEMFC Hydrogen Recirculation. Int. J. Hydrogen Energy 2020, 45, 14500–14516. [Google Scholar] [CrossRef]
  16. Chen, L.; Xu, K.; Yang, Z.; Yan, Z.; Zhai, C.; Dong, Z. Optimal design of a novel nested-nozzle ejector for PEMFC’s hydrogen supply and recirculation system. Int. J. Hydrogen Energy 2023, 48, 27330–27343. [Google Scholar] [CrossRef]
  17. Du, Z.; Liu, Q.; Wang, X.; Wang, L. Performance investigation on a coaxial-nozzle ejector for PEMFC hydrogen recirculation system. Int. J. Hydrogen Energy 2021, 46, 38026–38039. [Google Scholar] [CrossRef]
  18. Chong, D.; Hu, M.; Chen, W.; Wang, J.; Liu, J.; Yan, J. Experimental and numerical analysis of supersonic air ejector. Appl. Energy 2014, 130, 679–684. [Google Scholar] [CrossRef]
  19. Zhang, K.; Shen, S.; Yang, Y. Numerical investigation on performance of the adjustable ejector. Int. J. Low-Carbon Technol 2010, 5, 51–56. [Google Scholar] [CrossRef]
  20. Zhu, Y.; Jiang, P. Experimental and numerical investigation of the effect of shock wave characteristics on the ejector performance. Int. J. Refrig. 2014, 40, 31–42. [Google Scholar] [CrossRef]
  21. Croquer, S.; Lamberts, O.; Poncet, S.; Moreau, S.; Bartosiewicz, Y. Large Eddy Simulation of a supersonic air ejector. Appl. Therm. Eng. 2022, 209, 118177. [Google Scholar] [CrossRef]
  22. Mazzelli, F.; Little, A.B.; Garimella, S.; Bartosiewicz, Y. Computational and experimental analysis of supersonic air ejector: Turbulence modeling and assessment of 3D effects. Int. J. Heat Fluid Flow 2015, 56, 305–316. [Google Scholar] [CrossRef]
  23. Li, Y.; Niu, C.; Shen, S.; Mu, X.; Zhang, L. Turbulence Model Comparative Study for Complex Phenomena in Supersonic Steam Ejectors with Double Choking Mode. Entropy 2022, 24, 1215. [Google Scholar] [CrossRef] [PubMed]
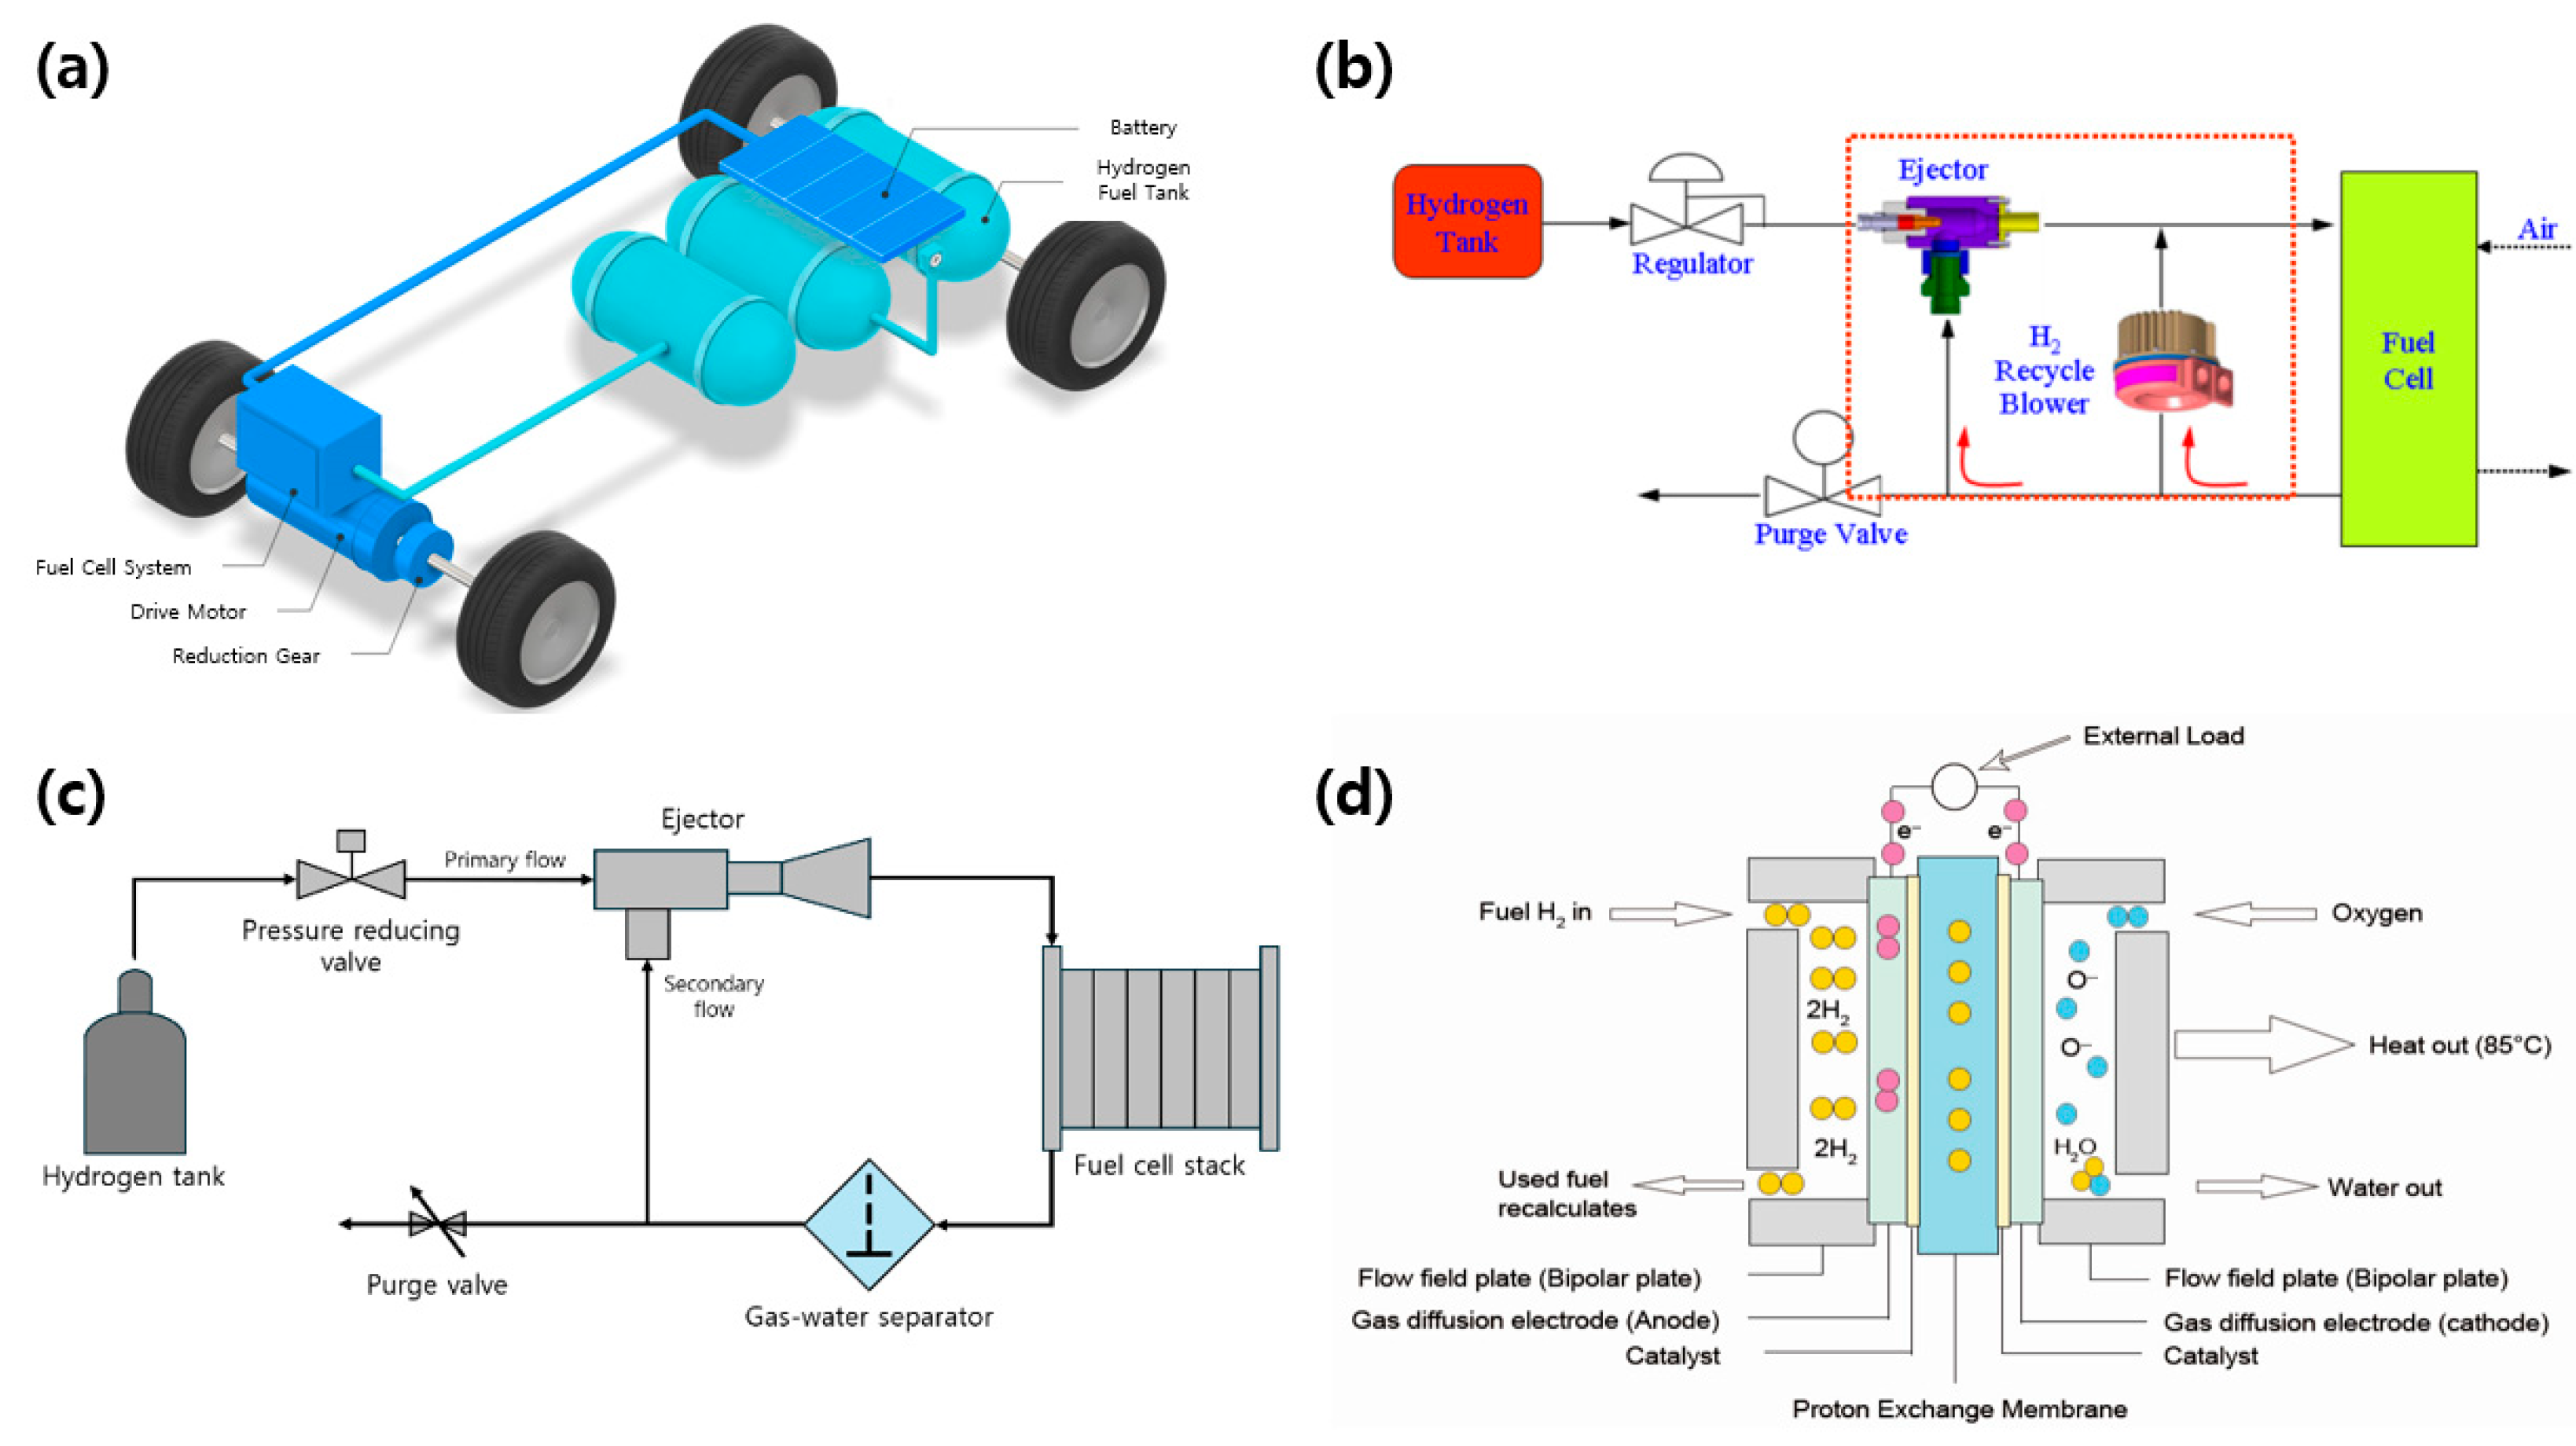
Figure 1. Schematic of hydrogen fuel cell vehicles and PEMFC systems: (a) Powertrain of a hydrogen fuel cell vehicle (Source: Hyundai Motor Group) [2,3], (b) Configuration of a hydrogen recirculation system using an ejector and a blower, (c) Schematic of a hydrogen recirculation system utilizing an ejector, (d) PEMFC fuel cell (Source: TOP TITECHS) [4].
Applsci 15 09845 g001
Figure 2. Schematic of the research process.
Applsci 15 09845 g002
Figure 3. Structures of single- and coaxial-nozzle ejectors: (a) Structure of single-nozzle ejector, (b) Cross-section of single nozzle, (c) Structure of coaxial-nozzle ejector, (d) Cross-section of coaxial nozzle.
Applsci 15 09845 g003
Figure 4. Schematics of the inlet flow in ejector: (a) single-nozzle configuration and (b) coaxial-nozzle configuration.
Applsci 15 09845 g004
Figure 5. CFD mesh distribution for ejector performance analysis.
Applsci 15 09845 g005
Figure 6. Axial static pressure distribution by mesh density: (a) For Single Nozzle, (b) For Dr = 1.55, (c) For Dr = 2.05, (d) For Dr = 2.55, (e) For Dr = 3.05, (f) For Dr = 3.55.
Applsci 15 09845 g006
Figure 7. Comparison of numerical results with Reference [17]: (a) Single-nozzle ejector, (b) Coaxial-nozzle ejector.
Applsci 15 09845 g007
Figure 8. Comparison of flow characteristics between single- and coaxial-nozzle ejectors: (a) Static pressure and Mach number distributions of single- and coaxial-nozzle ejectors, (b) Static pressure and Mach number distributions of coaxial-nozzle ejectors by diameter ratio.
Applsci 15 09845 g008
Figure 9. Velocity distribution in single- and coaxial-nozzle ejectors: (a) Single-nozzle ejector, (b) Coaxial-nozzle ejector case of Dr = 2.55, (c) Case of Dr = 1.55, (d) Case of Dr = 2.05, (e) Case of Dr = 3.05, (f) Case of Dr = 3.55.
Applsci 15 09845 g009
Figure 10. Recirculation ratio in single- and coaxial-nozzle ejectors: (a) Comparison of recirculation ratios in single- and coaxial-nozzle ejectors, (b) Recirculation ratio for low diameter ratios, (c) Recirculation ratio for high diameter ratios.
Applsci 15 09845 g010
Table 1. Characteristics of ejectors with various nozzle configurations.
Single-Nozzle Ejector [5]Multi-Nozzle Ejector [15]Coaxial-Nozzle Ejector
Structural DiagramApplsci 15 09845 i001Applsci 15 09845 i002Applsci 15 09845 i003
Characteristics
Simple structure, easy maintenance
Uses convergent nozzles or convergent-divergent nozzles
Operates with control based solely on primary flow pressure
Utilizes two nozzles with a fixed angle
Enhances mixing efficiency through structural features
Expands operating range by controlling the two nozzles based on output conditions
Utilizes two nozzles with a fixed angle
Enhances mixing efficiency through structural features
Expands operating range by controlling the two nozzles based on output conditions
Unaffected by nozzle misalignment
Disadvantages
Limited efficiency and operating range
Difficult to achieve precise control owing to operating characteristics
Complex structure
Performance can significantly decrease owing to misalignment.
High energy loss owing to asymmetrical internal flow fields
Challenging to control operating mode transitions
Complex structure
Requires intricate design and precise manufacturing
Challenging to control operating mode transitions
Table 2. Geometric parameters of the ejectors.
ParameterValue [mm]
Single-Nozzle Exit Diameter, Don12.04
Single-Nozzle Inlet Diameter, Don25.00
First-Nozzle Exit Diameter, Dcn11.12
Second-Nozzle Inner Exit Diameter, Dcn22.20
Second-Nozzle Outer Exit Diameter, Dcn32.78
Nozzle Length, Ln34.00
First-Nozzle Inlet Diameter, Dcn45.00
Second-Nozzle Inlet Diameter, Dcn510.80
Uniform Pressure Mixing-Chamber Length, Lmc5.00
Uniform Cross-Section Mixing-Chamber Diameter, Dc5.20
Uniform Cross-Section Mixing-Chamber Length, Lcac20.80
Diffuser Diameter, De10.80
Diffuser Length, Ld40.00
Suction Chamber Diameter, Dt36.00
Suction Chamber Length, Lt30.00
Secondary Flow Inlet Diameter, Ds9.00
Table 3. Diameter ratio variables for the numerical analysis of coaxial-nozzle ejector.
Diameter Ratio (Dr = Dc/Dn)
[mm]
Mixing-Chamber Diameter (Dc)
[mm]
Nozzle-Throat Diameter (Dn)
[mm]
1.553.152.04
2.054.172.04
2.555.202.04
3.056.212.04
3.557.232.04
Table 4. Operating conditions of PEMFC stack based on Reference [8].
Power Output [kW]Voltage [V]Single-Cell Voltage [V]Current [A]Ejector Primary Flow Rate [g/s]Ejector Primary Flow Pressure [kPa]
842820.653001.36819
702910.672401.097660
603000.6892000.914550
48.33220.741500.685413
33.73370.771000.46277
17.93580.82500.229138
Table 5. Physical parameters for numerical analysis.
ParameterUnitValue
Primary Flow Pressurebar4, 5, 6, 7, 8
Secondary Flow Pressurebar1.9
Outlet Pressurebar2.1
Primary Flow TemperatureK293
Secondary Flow TemperatureK338
Flow Temperature at OutletK308
Table 6. Minimum static pressure and maximum Mach number near the nozzle exit.
Diameter Ratio (Dr)1.552.052.553.053.55Single-Nozzle Ejector
Comparison Item
Primary Minimum Static Pressure [bar]0.2470.6311.0101.1091.3581.452
Maximum Pressure Between Primary and Secondary Minima [bar]1.6521.8372.0322.2282.394-
Secondary Minimum Static Pressure [bar]−0.3590.4981.0051.4041.662-
Mach Number at Primary Static Pressure Minimum1.9891.9541.9191.3171.3011.450
Mach Number at Secondary Static Pressure Minimum1.7471.5831.5071.0211.015-
Table 7. Recirculation ratio (Φ) by primary flow pressure.
Diameter RatioCoaxial-Nozzle EjectorSingle-Nozzle Ejector
Primary Flow Pressure [bar]1.552.052.553.053.55
40.5381.0081.1331.0870.4461.384
50.5331.0171.2551.4381.2151.426
60.5701.0861.1971.5291.5911.497
70.5591.0661.1921.7291.7431.584
80.5791.0011.0261.7691.8421.728
Disclaimer/Publisher’s Note: The statements, opinions and data contained in all publications are solely those of the individual author(s) and contributor(s) and not of MDPI and/or the editor(s). MDPI and/or the editor(s) disclaim responsibility for any injury to people or property resulting from any ideas, methods, instructions or products referred to in the content.