3.1. ESO Topology Optimization Algorithm
Following the execution of mechanical and modal analyses, the resultant data forms the basis for topological optimization, which is implemented through the ESO methodology. The ESO algorithm employs finite element mesh analysis to assess the stress distribution within the model, thereby determining the elimination of specific elements based on their stress states. In the context of finite element analysis, mesh elements function as both computational entities and stress transfer mechanisms. These elements discretize the model into a finite number of components, thereby defining the computational domain for topological optimization [
22]. Consequently, the quality of these mesh elements exerts a substantial influence on the efficacy of topological optimization processes. The iterative procedure persists until the volume response criteria are satisfied. The optimization objective is consistently defined as compliance minimization (equivalent to stiffness maximization), and structural lightweighting is realized under the imposed volume constraint. Compliance is the inverse measure of stiffness, and minimizing compliance means increasing the rigidity of the structure, thereby making it more resistant to deformation. The formulation is given as follows [
23]:
In the formula,
represents the compliance of the structure,
represents the magnitude of displacement,
represents the stiffness matrix, and
and
are the displacement vector and stiffness matrix of the
e-th element, respectively. The weight reduction objective of the structure is taken as the function index, and the structure volume is used as the constraint condition [
24].
The volume constraints of the progressive structure optimization method are as follows:
Among them, is the volume of unit , and is the target volume.
Progressive structural optimization is carried out by deleting the cell regions with low stress or low strain capacity. The calculation formula for the grid threshold of the deleted cells is as follows:
In this formula,
is the optimized proportion of the total stiffness of the cell. When the value of
is less than a certain threshold, the grid cells are deleted. In terms of the sensitivity of the execution of deleting grid cells, the absolute value of the sensitivity is determined by the following formula [
25].
The determination of inefficient cells in the ESO algorithm depends on the sensitivity of the objective function to the density of this cell. In this formula,
represents the density sensitivity threshold, which ranges from 0 to 1. Grid cells with values lower than this are deleted. The optimization process of the progressive structural optimization method is as follows. After defining the optimized design area, set
and the number
of grid elements deleted in each iteration process, solve the displacement balance equation
, obtain the displacement and stress-strain of the iteration process, and analyze the sensitivity value of the grid elements according to the magnitude of the stress-strain. Arrange the grid retention cells in order of
, and delete the first
n cells according to the sensitivity threshold so that the total product after deletion satisfies
. In the formula,
is the target response after deleting the redundant units [
26]. After this operation is completed, one round of iteration is completed. After the iteration is completed, check the convergence of the structure. If the volume of
is less than
, terminate the iteration and output the topological optimization result.
3.2. Improve the ESO Topology Optimization Algorithm
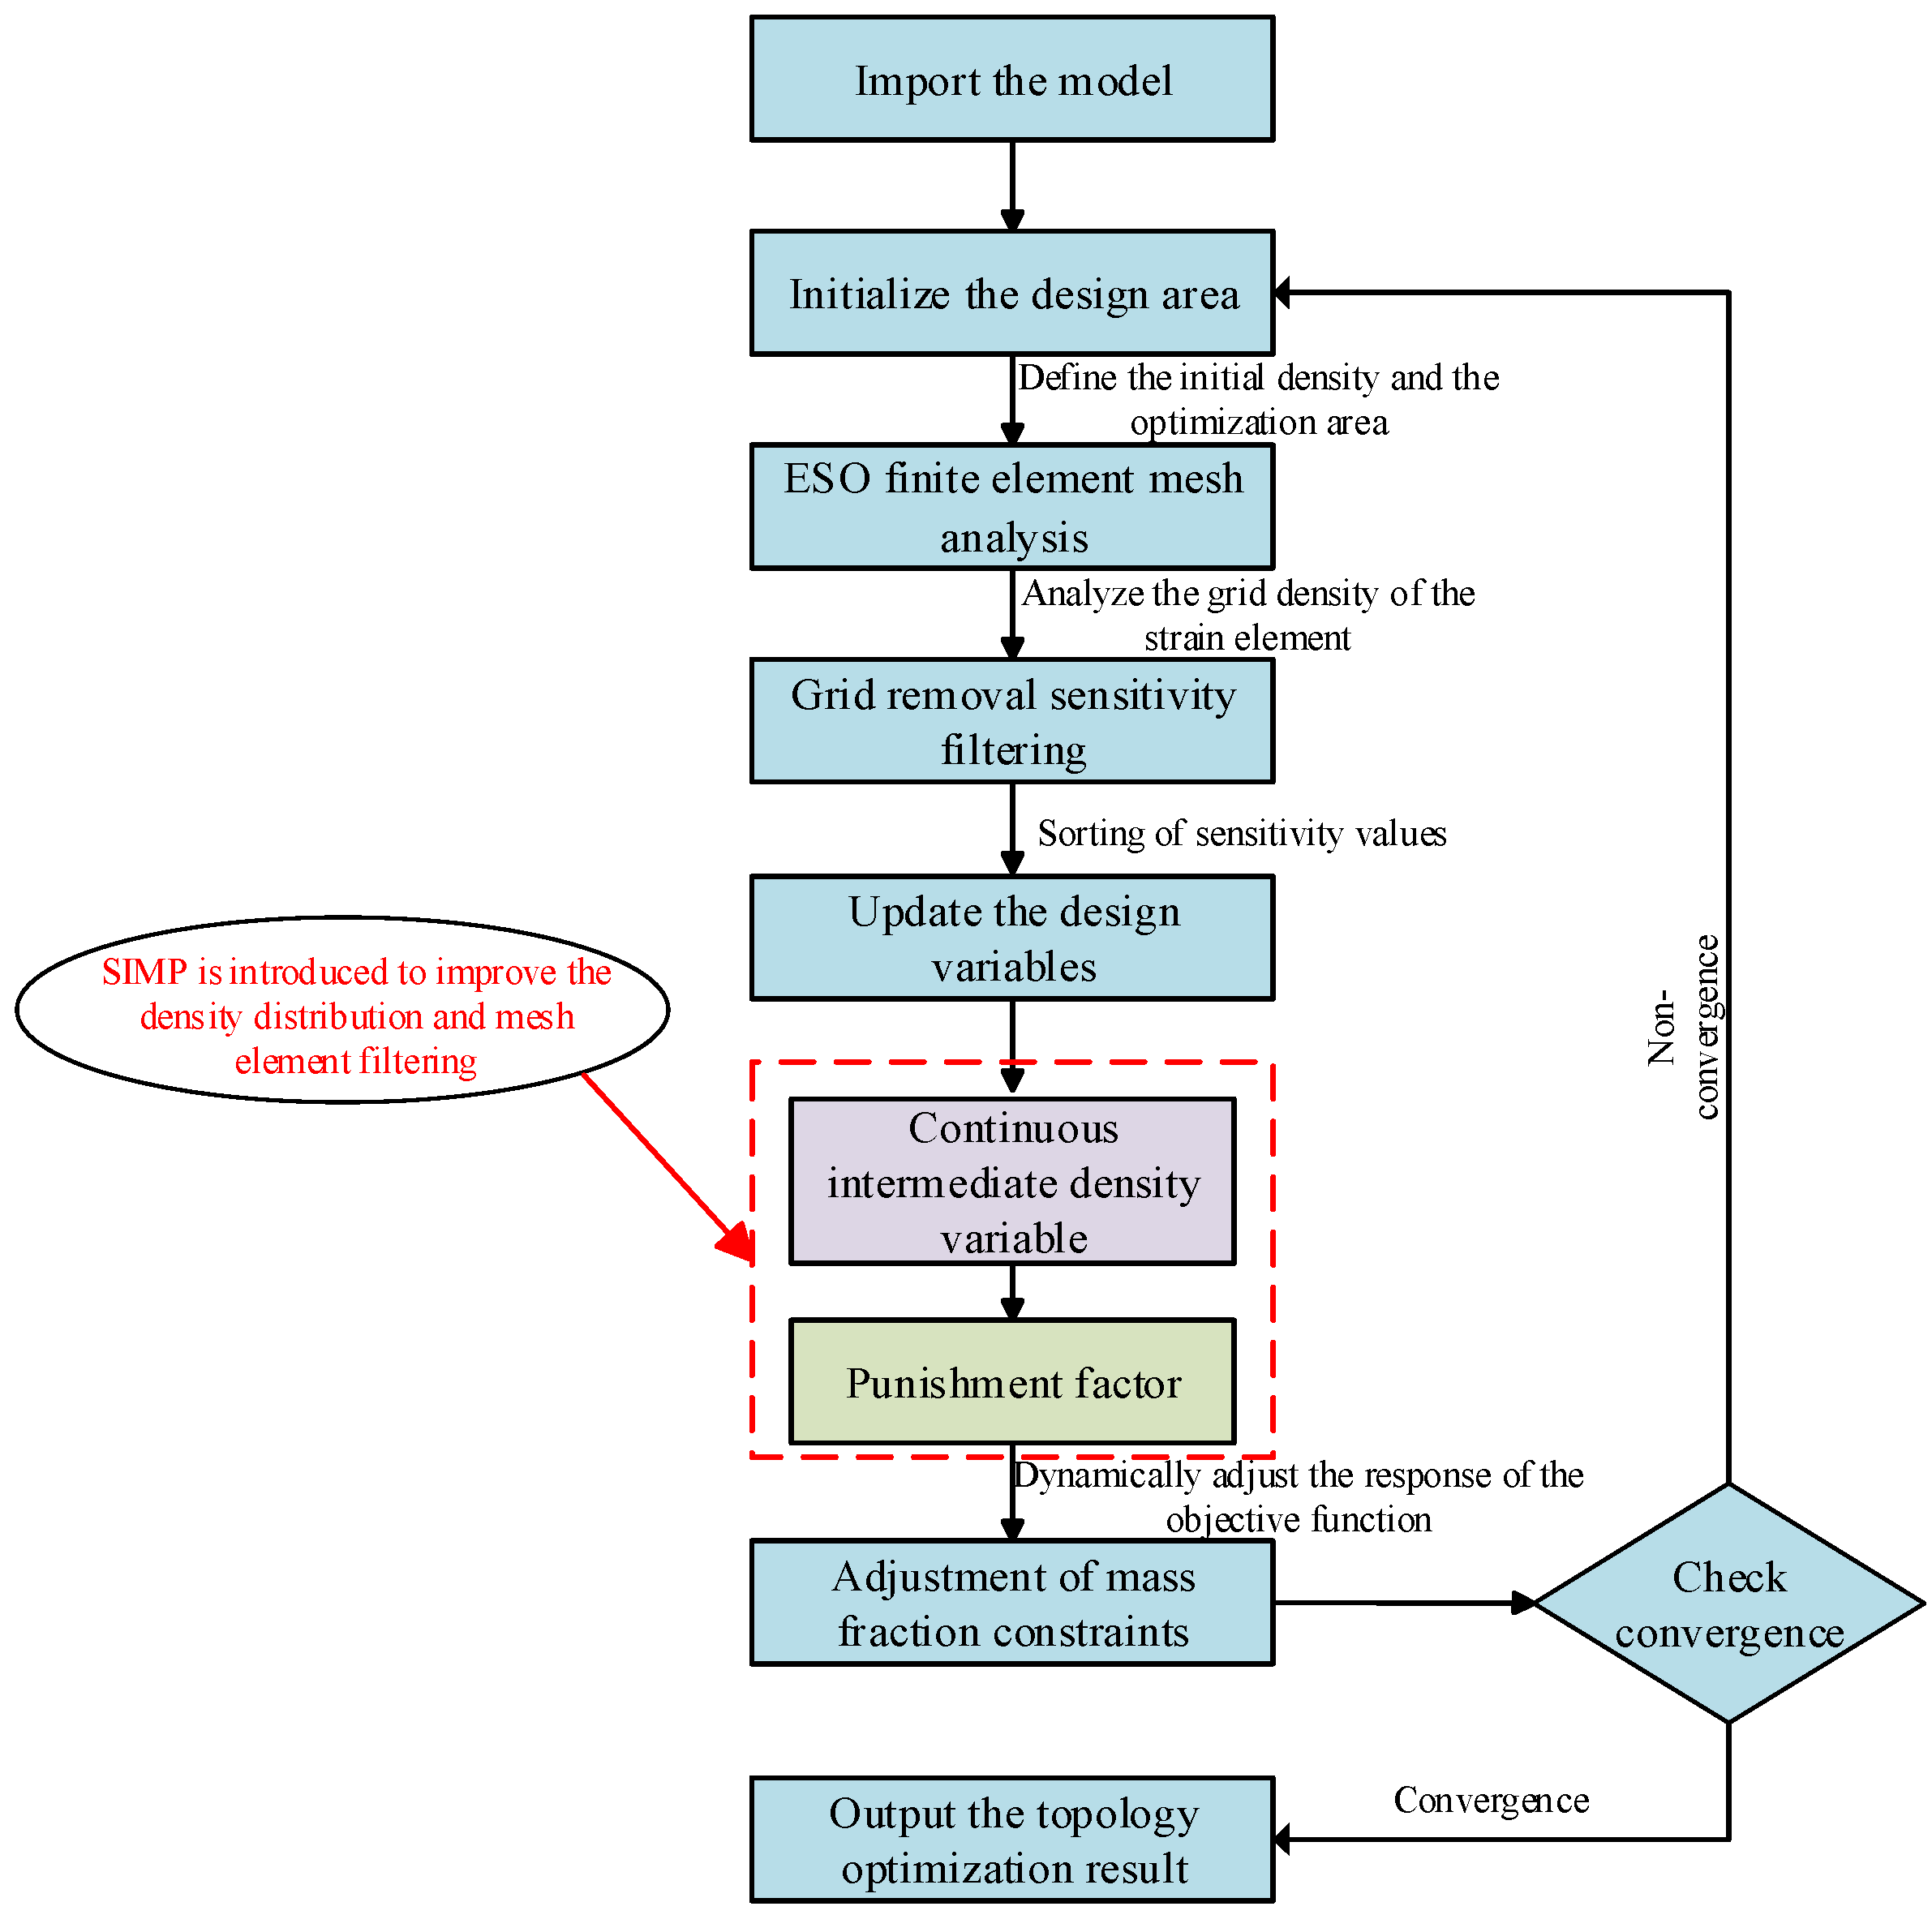
Since the ESO method directly removes inefficient mesh elements, this operation tends to increase structural divergence and degrade element quality. The SIMP (Solid Isotropic Material with Penalization) method introduces continuous intermediate density variables and penalty factors [
27] during the ESO process. Integrated with ESO’s finite element analysis, it performs sensitivity analysis and filtering for mesh element removal. The filtered objective function is sorted in descending order of sensitivity to update the design variables. Mesh elements with sensitivity below the threshold are eliminated, and the mass fraction is adjusted according to target constraints. Once the mass fraction satisfies the response constraint, convergence is verified. The optimization process of the enhanced SI-ESO is illustrated in
Figure 4 below.
The introduction of SIMP in the SI-ESO algorithm improves the convergence of the progressive structure optimization method in the process of discrete model mesh cells. SIMP consists of an intermediate density interpolation model and a penalty factor. The ESO method categorizes the grid cells of the model into two groups: those assigned a value of 0 and those assigned a value of 1 [
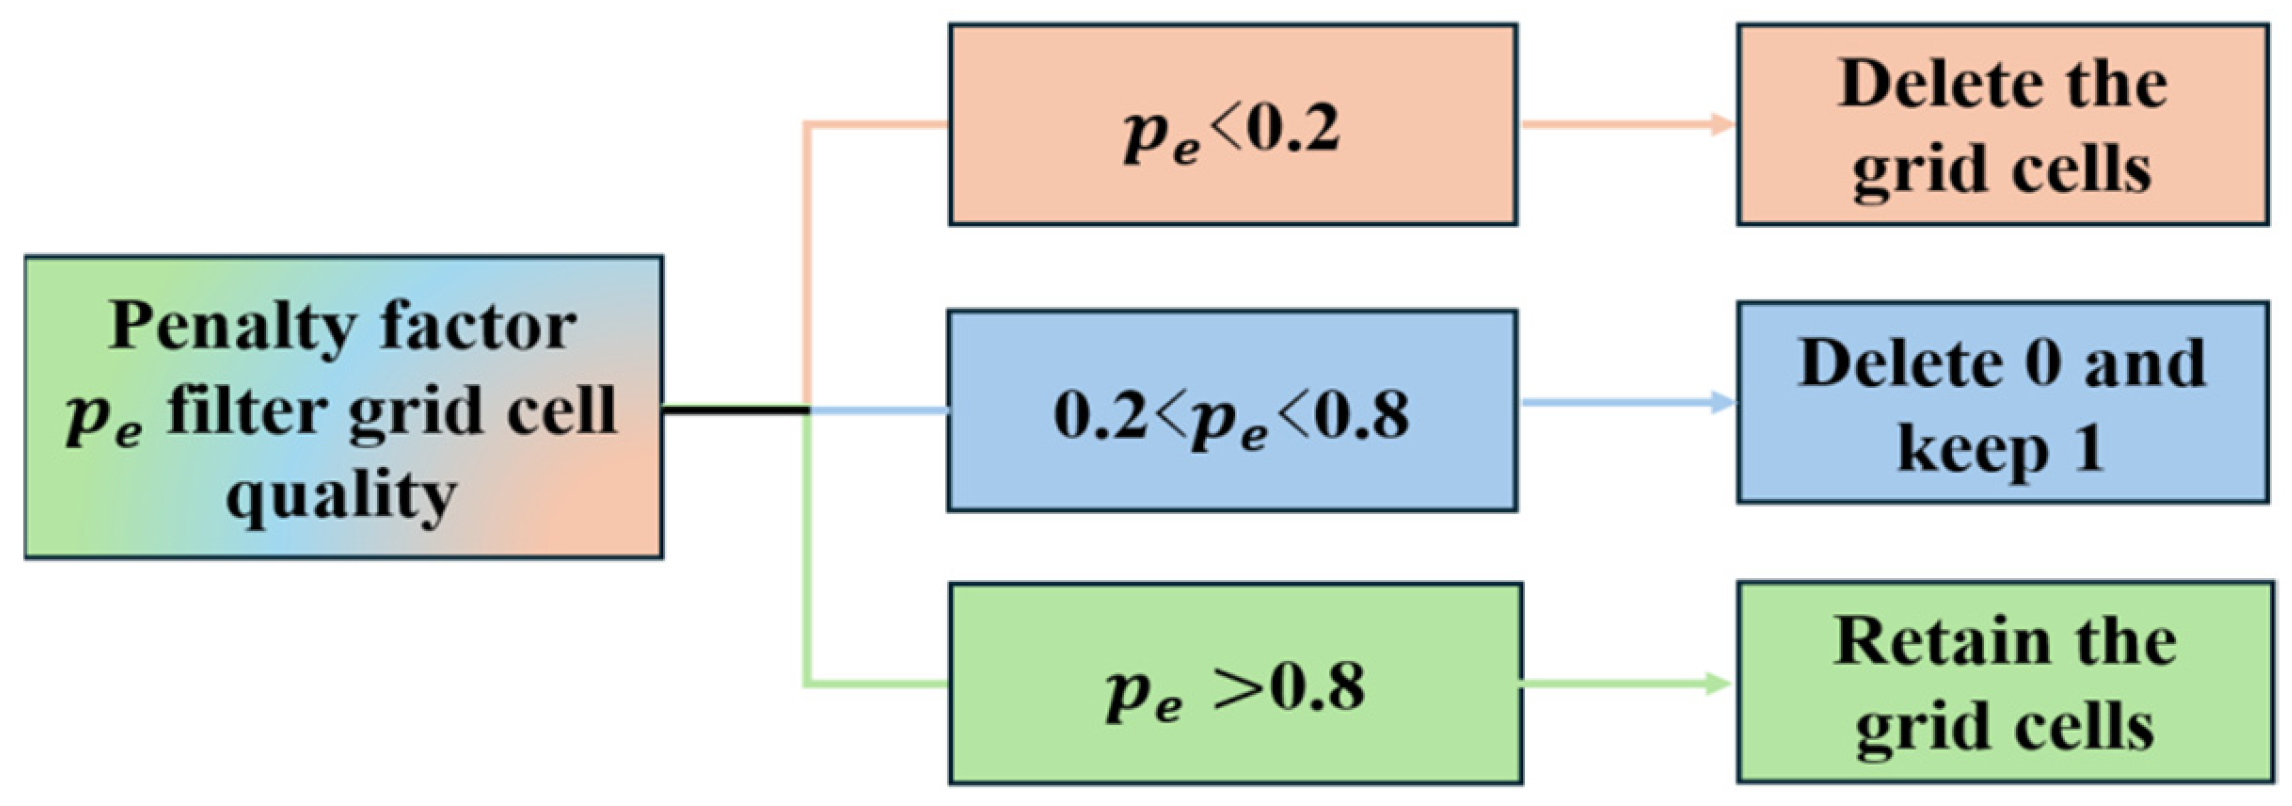
28]. All grid cells designated as 0 are eliminated, while all grid cells classified as 1 through discrete evaluations are preserved. However, certain meshes exhibiting intermediate densities and relatively low sensitivity values still play a crucial role in maintaining structural integrity and must be retained. The removal of these meshes could result in divergence within the model’s mesh structure. Grid cell densities that fall between 0 and 1 represent intermediate densities, commonly referred to as fuzzy regions. These intermediate densities encompass both the grid density cells that should be deleted and those that need to be retained. The SIMP approach introduces the concept of intermediate density and applies penalty factors to re-evaluate the grid cells initially judged as 0 in ESO. The functionality of the intermediate density unit is illustrated in
Figure 5.
Mesh elements designated as 0 in the ESO process are re-evaluated using a penalty factor, which mitigates the sensitivity of the filtering mechanism. Within the SIMP penalty factor model, specific mesh elements possessing intermediate density values are subjected to penalization. This approach discretizes the design domain into a finite number of mesh elements, thereby accelerating the convergence of element densities towards either 0 or 1. Each mesh element is normalized by the parameter
, yielding a continuous value ranging from 0 (denoting removable elements) to 1 (indicating elements that must be preserved). The computational formulation for the penalty factor within the SIMP framework is presented as follows.
When the penalty factor
approaches 0,
− approaches 0, and the influence of cells with intermediate density on the objective function also tends to 0. At this time, SI-ESO improves the efficiency of removing grid cells with lower intermediate density (
. When
approaches 1, It indicates that the quality of the grid cells is relatively high and can be directly retained. When
, the grid cells within this range gradually converge to 0 or 1. In simple terms, the penalty factor serves to reclassify the intermediate density regions identified in the ESO algorithm as non-zero or non-one into three categories of grid density cells: high, medium, and low. Subsequently, through a process of gradual convergence, the medium- and high-density grid cells are assigned a value of 1, while the low-efficiency grid cells are designated as 0. This approach enhances the efficiency of processing intermediate density grid cells [
29]. The impact of the penalty factor
is illustrated in
Figure 6.
In contrast to the direct elimination of inefficient elements in ESO, the penalty factor mechanism preserves mesh elements exhibiting stress effects by facilitating the removal of inefficient intermediate density elements. This approach drives the density of mesh elements towards either 0 or 1, thereby enhancing the quality of elements within the evolutionary topology optimization framework. Subsequently, the convergence of optimization results is verified, and the convergence formulation is presented as follows.
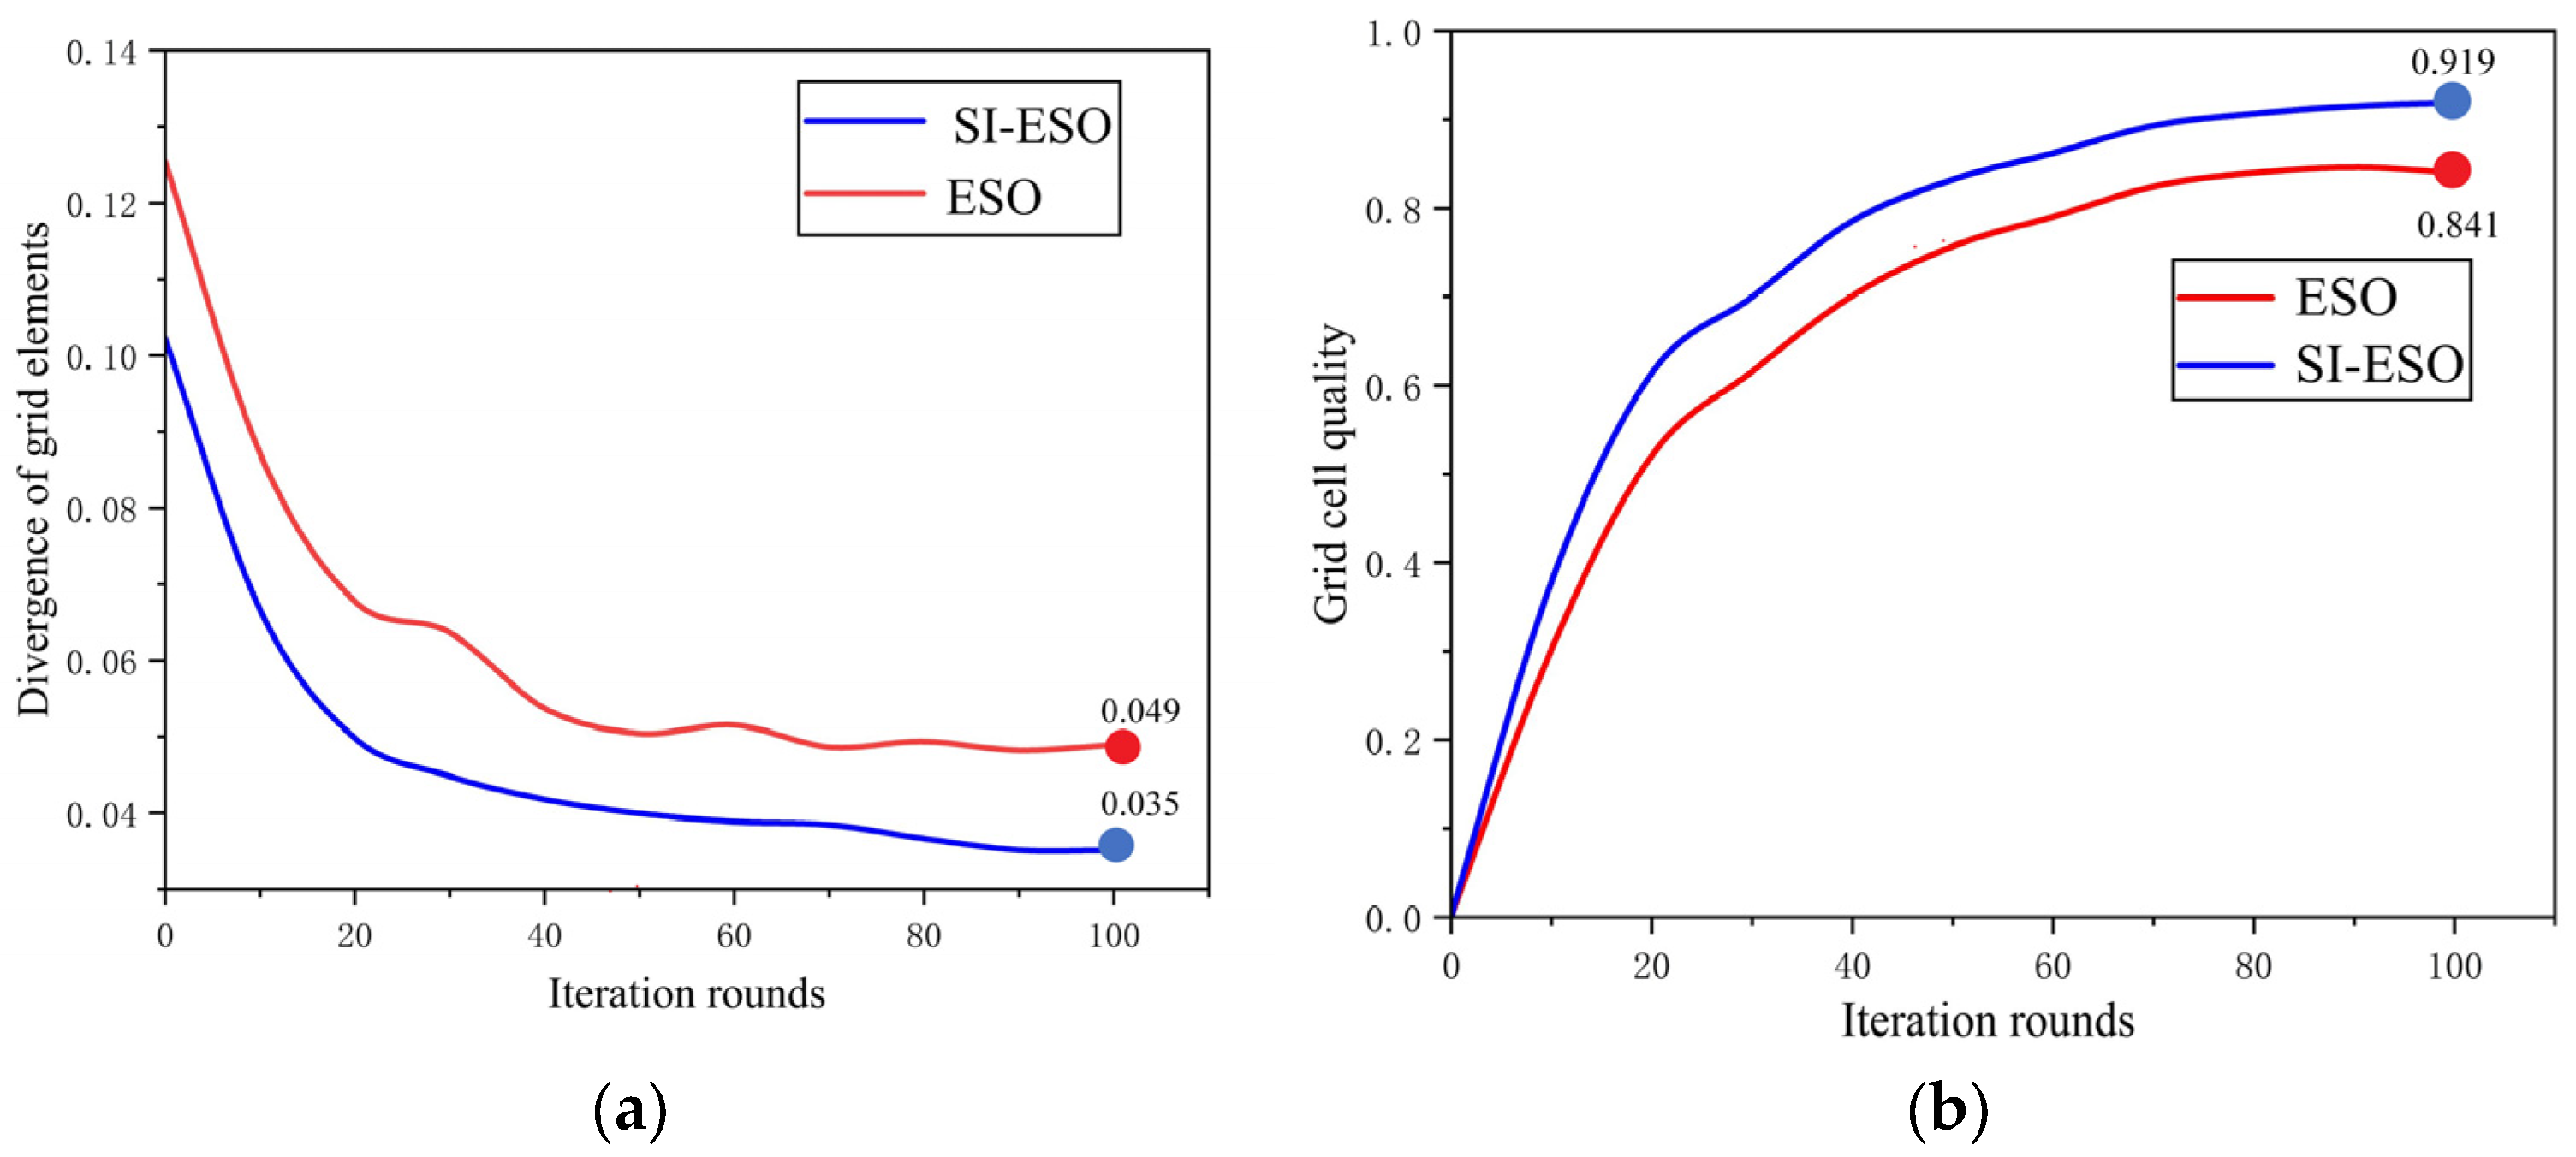
When the convergence rate falls below the threshold ε, which represents the rate of change in the objective function, it indicates the convergence of the topological structure, thereby facilitating the generation of the topologically optimized configuration. The enhanced SI-ESO algorithm exhibits substantial improvements in both mesh convergence and element quality. Through the execution of 100 iterations of model optimization experiments, a comprehensive analysis was conducted on the mesh divergence and quality throughout the iterative process of the SI-ESO algorithm [
30].
Figure 7a presents a comparison of mesh divergence between the SI-ESO and ESO methods after 100 iterations. The results, along with the characteristics of SIMP, indicate that the penalty factor filtering in SI-ESO effectively eliminates meshes associated with intermediate density elements. This process encourages the element densities to converge towards a binary distribution—either 0 or 1—thereby minimizing the fuzzy density regions typically produced by intermediate densities. In contrast, such regions are retained in the ESO algorithm, which contributes to increased divergence among mesh elements in that method. Consequently, SI-ESO mitigates this divergent behavior during its iterative modeling process by eliminating the need to compute mesh cells within blurred areas, resulting in enhanced convergence speed and improved computational efficiency compared to ESO [
31]. Additionally, SI-ESO reduces iterative oscillations and mesh dispersion caused by direct material removal, leading to a more stable iteration process.
Figure 7b presents a comparative analysis of cell quality between SI-ESO after 100 iterations. The grid cell quality attained through SI-ESO demonstrates significant superiority over that achieved via ESO. The penalty factor implemented in SI-ESO facilitates a binarized density distribution for grid cells while effectively reducing fuzzy regions; these areas would otherwise be occupied by low-quality sawtooth cells during material distribution computations. Moreover, the sensitivity filtering mechanism integrated into the SI-ESO algorithm mitigates shape distortion and reduces sharp edge meshes caused by abrupt cell deletions [
32], which are characteristic of ESO. These enhancements result in smoother and more distinct structural transitions within material distributions. Consequently, it is evident that SI-ESO consistently produces higher-quality mesh cells compared to its counterpart.
The introduction of the penalty factor aims to drive the determination result of the grid cell density closer to either 0 or 1, thereby enhancing the clarity of the optimization outcome. When performing optimization analysis under identical conditions, a larger penalty factor
results in fewer intermediate density elements during topological optimization. Consequently, more elements approach 0 or 1, leading to a superior optimization effect. For structures intended for additive manufacturing, the
value should be set to no less than 3. This is because when
, excessive intermediate density regions fail to accurately represent the mechanical transfer path, complicating the manufacturing and processing of the optimized structure. A grid generation experiment was conducted to compare the impact of different penalty factors on the model’s display effect, with the results illustrated in
Figure 8 below.
It can be seen from the results in
Figure 8 that the division effect of the grid cells with
= 3 is smoother and more refined than that with
, and the quality of the grid cells is higher. When
, the grid undergoes sharp mutations, resulting in a sharp serrated structure. The cause of this phenomenon is the sensitivity failure caused by excessive punishment. The calculated sensitivity value has an excessive error compared with the change in structural flexibility after the deletion of the element, resulting in the failure of the checkerboard element suppression. The rapid disappearance of the intermediate density elements causes changes in the material distribution of the mesh elements, generating serrated mesh elements at the transition parts and edges of the model structure. The iterative process of
gradually converges to 0 or 1, avoiding the rapid deletion of intermediate density elements. The division of grid elements is smoother, reducing jagged edge grids. The performance in controlling the smoothness of intermediate density elements and grid elements is more balanced. Therefore, from the application experience and actual effect, when the penalty factor
is taken as 3, the effect on the division of grid elements is better [
33].
As the
value increases, the optimization results tend to increase towards the element density of 0 or 1. When
is taken as 4, due to the intermediate density element approaching 0 or 1 too quickly, the penalty sensitivity is slightly higher, causing a change in the global stiffness matrix and resulting in a decrease in the element density. The decrease in the element density will affect the model stiffness and lead to a decrease in the model stiffness [
34]. When
is taken as 5, the model shows a relatively obvious structural dispersion phenomenon due to the overly steep penalty sensitivity, which makes it difficult for some structures to converge. The modal frequencies corresponding to different
values are shown in
Table 2.
When the value of is 3, the density of the intermediate element and the modal frequency are significantly greater than those of the elements when is 4 and 5. The higher the modal frequency, the higher the stiffness of the model. Therefore, in the optimization of the rear cover of the aviation generator, it is more appropriate to set the penalty factor to 3.
3.3. Quality Response Analysis
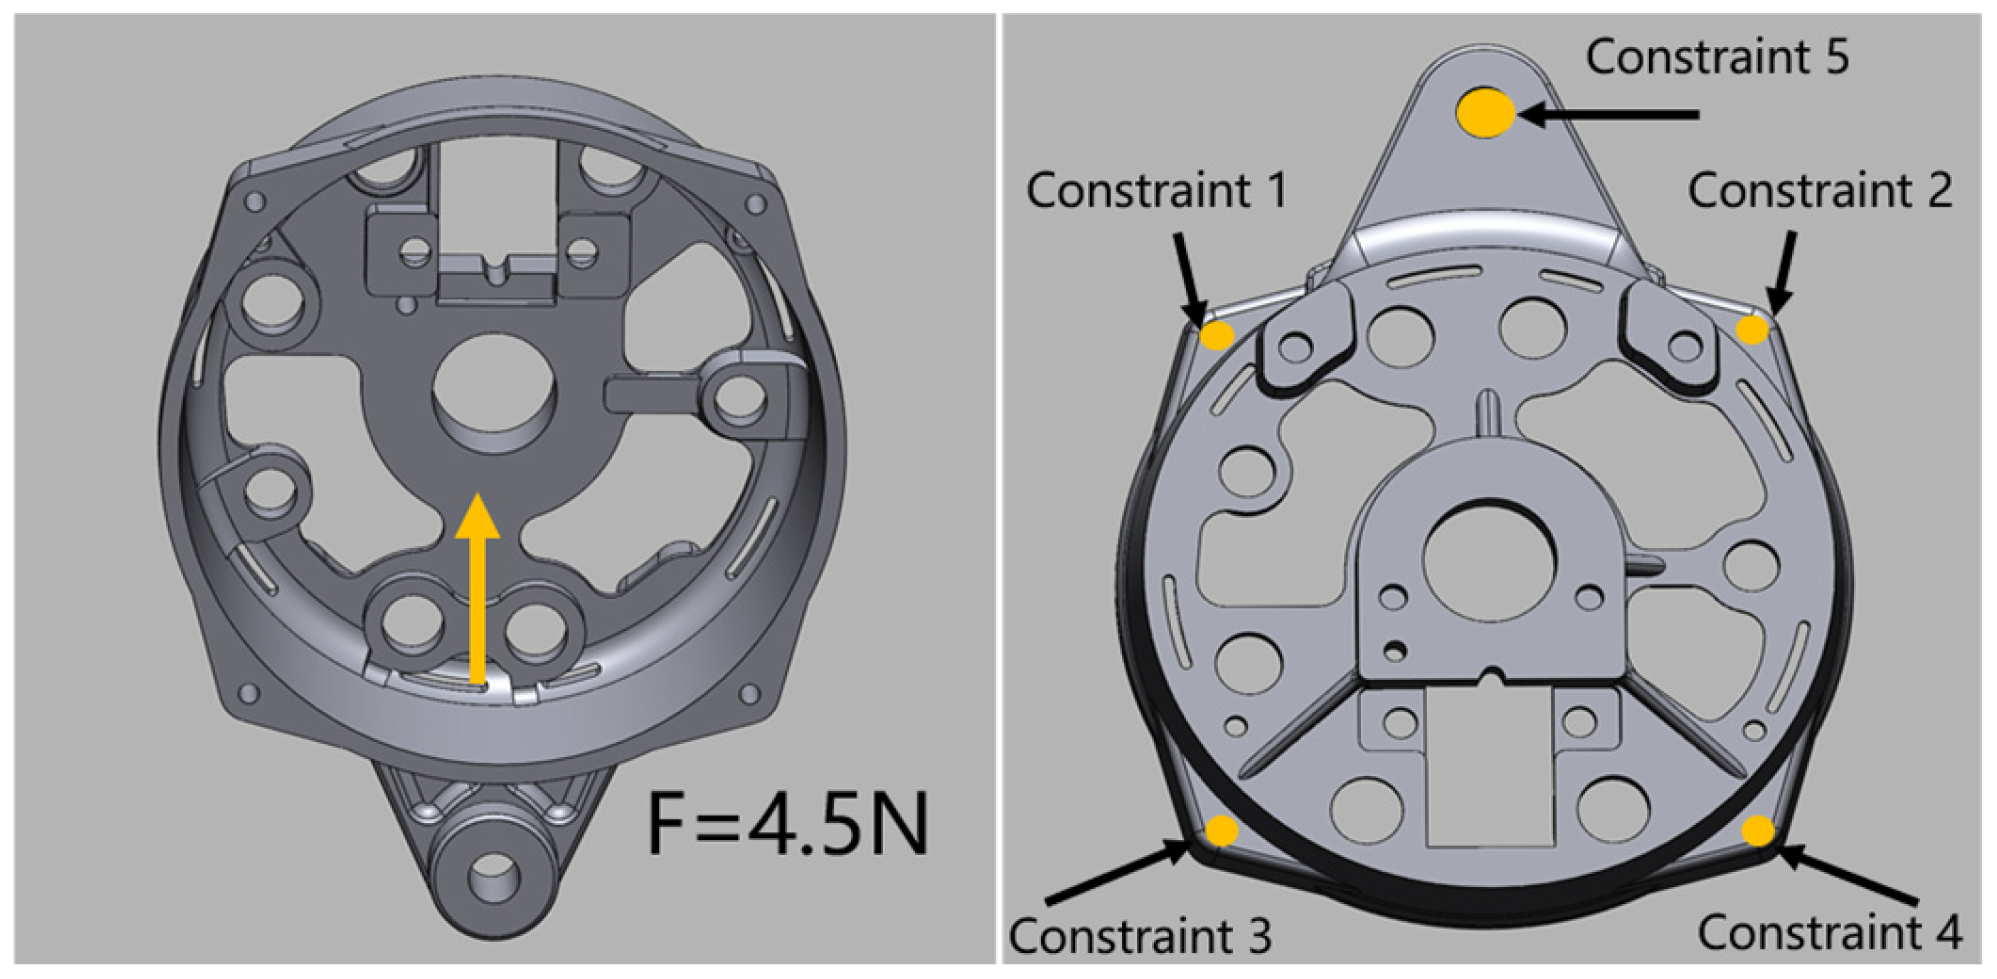
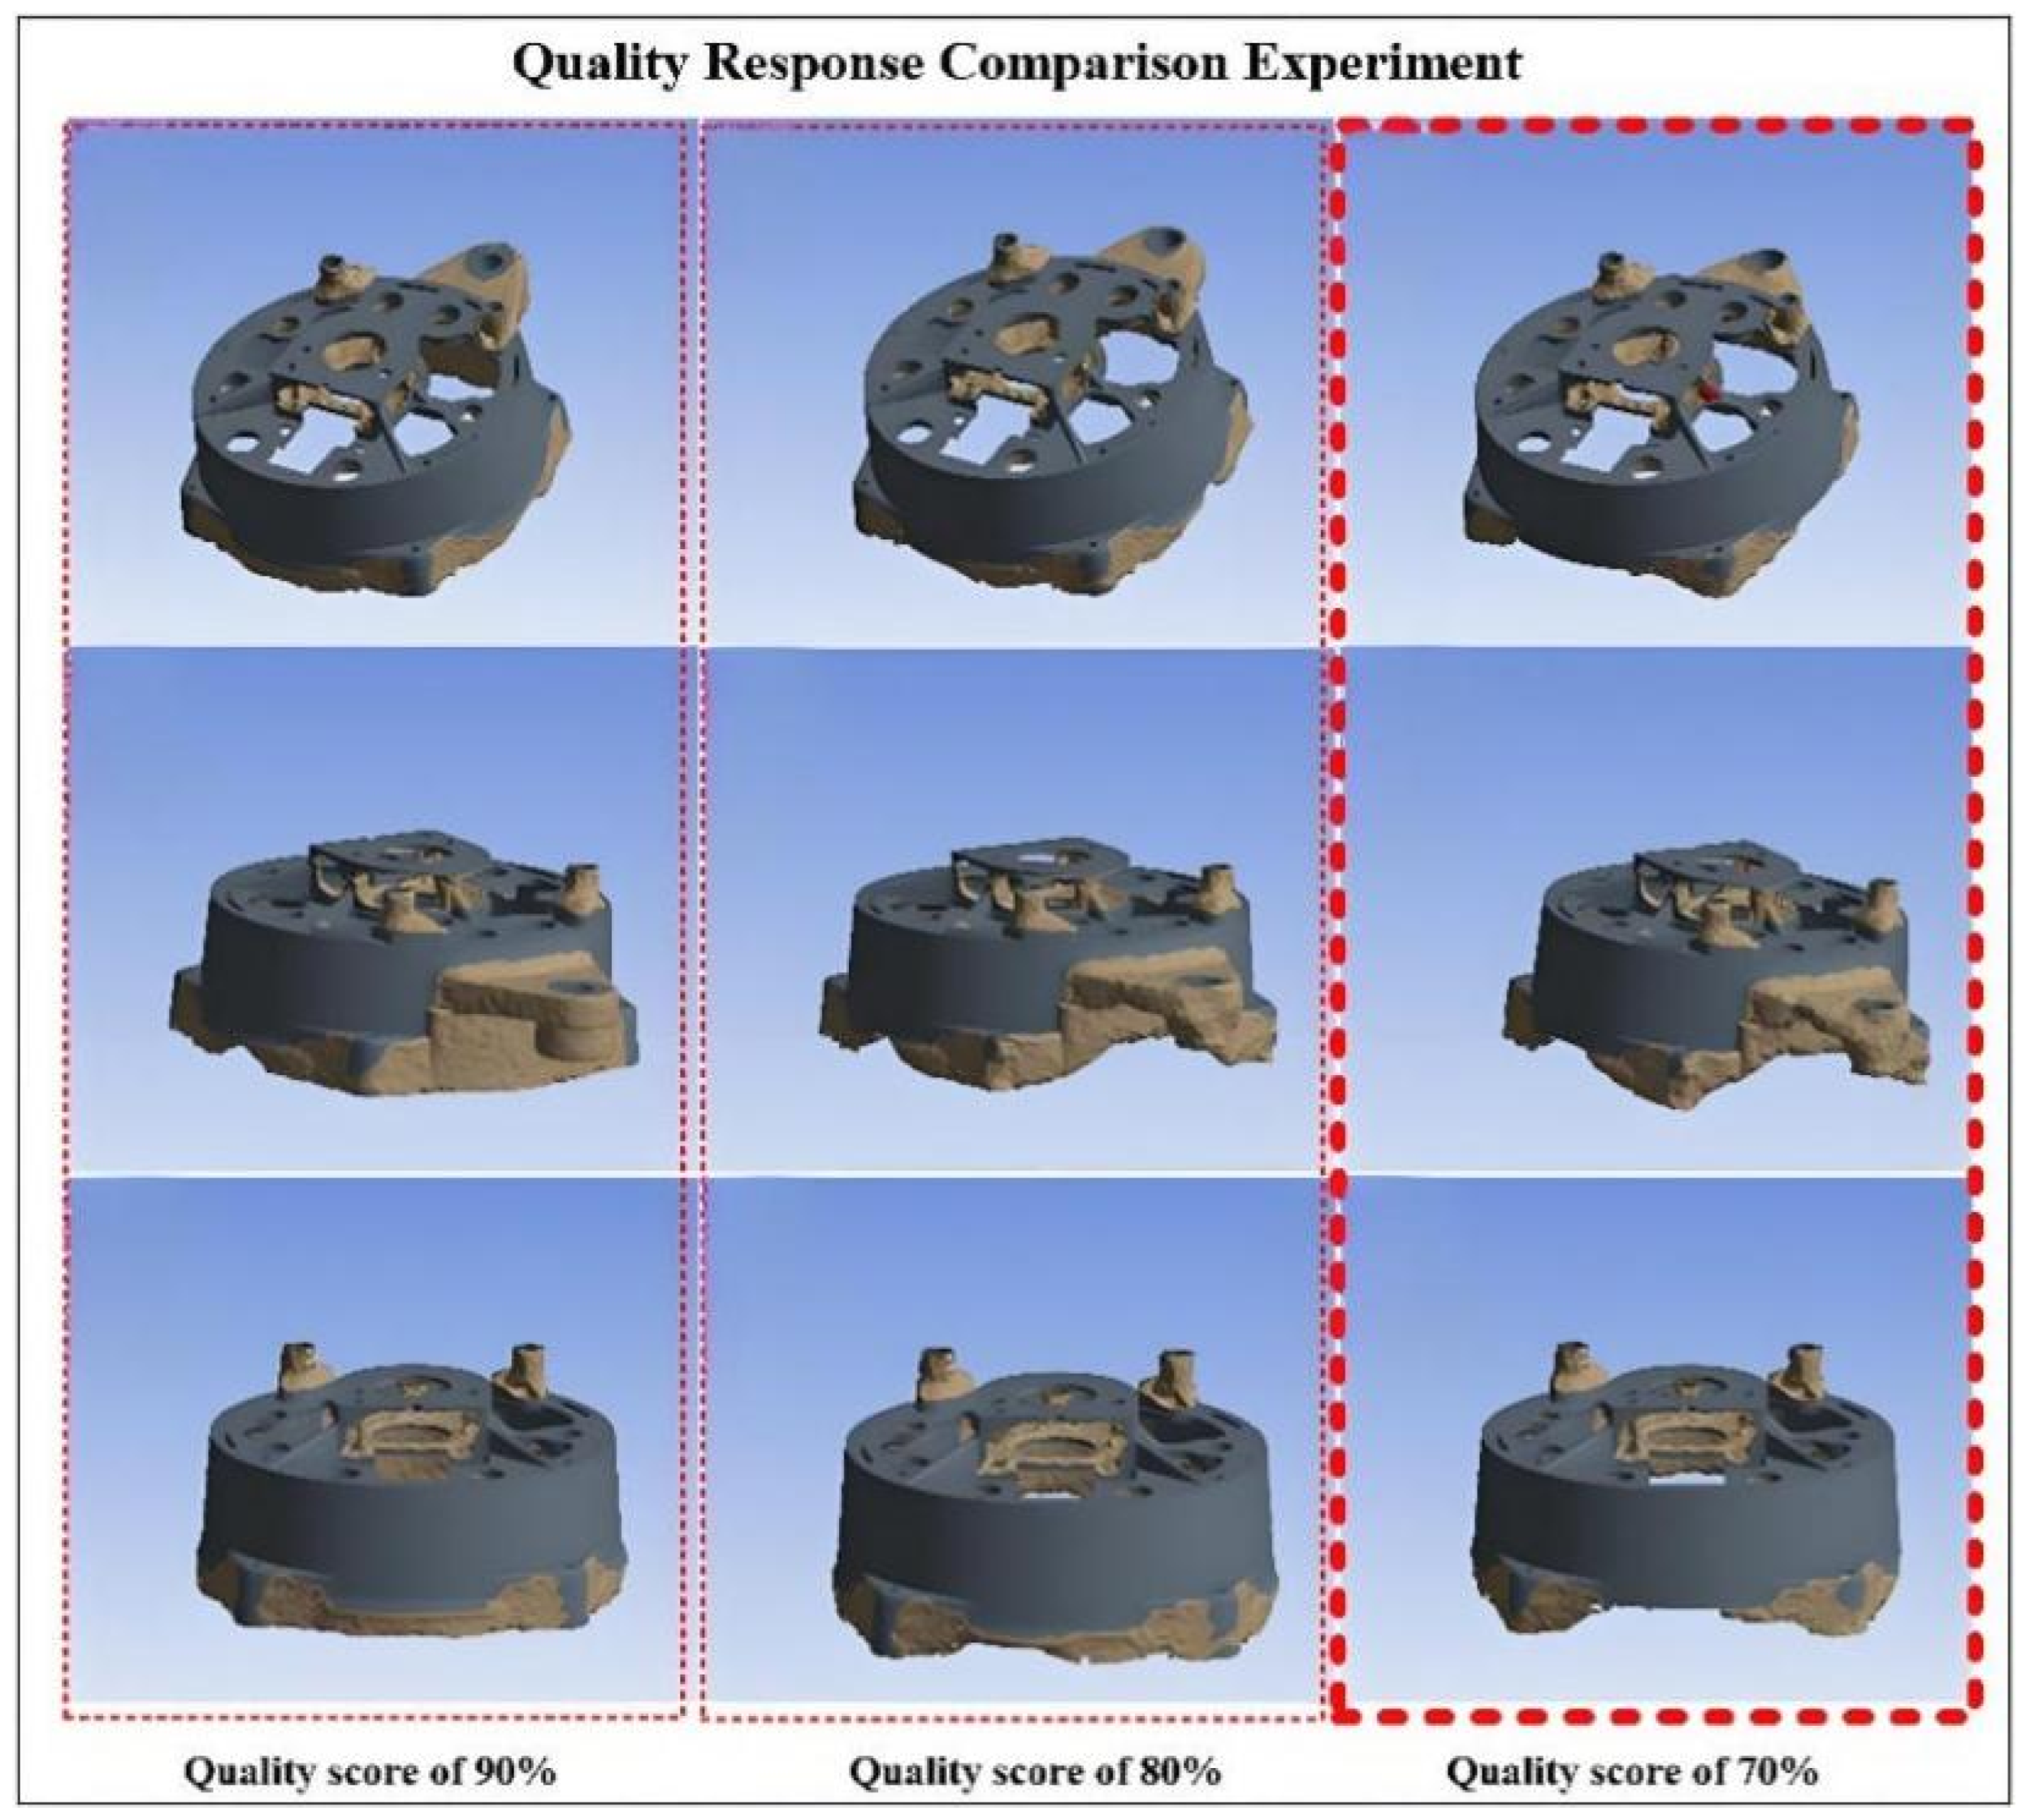
The rear cover of the aviation generator sustains its own weight during operational conditions. The combined effects of the fixing forces at the five bolt holes and the external vibrational excitation generated by the system collectively represent the actual working conditions. The primary objective of topology optimization is weight reduction. Consequently, topology optimization is systematically performed by sequentially reducing the mass fraction by 10% increments within the constraints of available computational resources. Through comparative analysis of the topological optimization outcomes obtained under various mass fraction constraints, the results are illustrated in
Figure 9.
From the perspective of topological optimization results, when the mass fraction is maintained at 90%, the base part and the triangular hole region of the generator rear cover exhibit minimal optimization. The optimization outcomes are conservative, with negligible weight reduction effects. When the mass fraction is reduced to 80%, a moderate weight reduction is observed in the base and triangular hole regions. However, the discontinuous structure in the base part may induce stress concentration, adversely affecting subsequent reconstruction models and additive manufacturing processes. Based on the mechanical analysis presented earlier, the base part experiences minimal stress, yet the material removal during optimization remains insufficient, indicating further optimization potential. At a mass fraction of 70%, the boundaries of the four bolt holes in the base are clearly defined after topological optimization, resulting in a structurally complete and stable configuration that facilitates subsequent reconstruction. Therefore, the topological optimization model of the aviation generator rear cover under the constraint of retaining 70% of the mass response was selected as the subsequent research object.
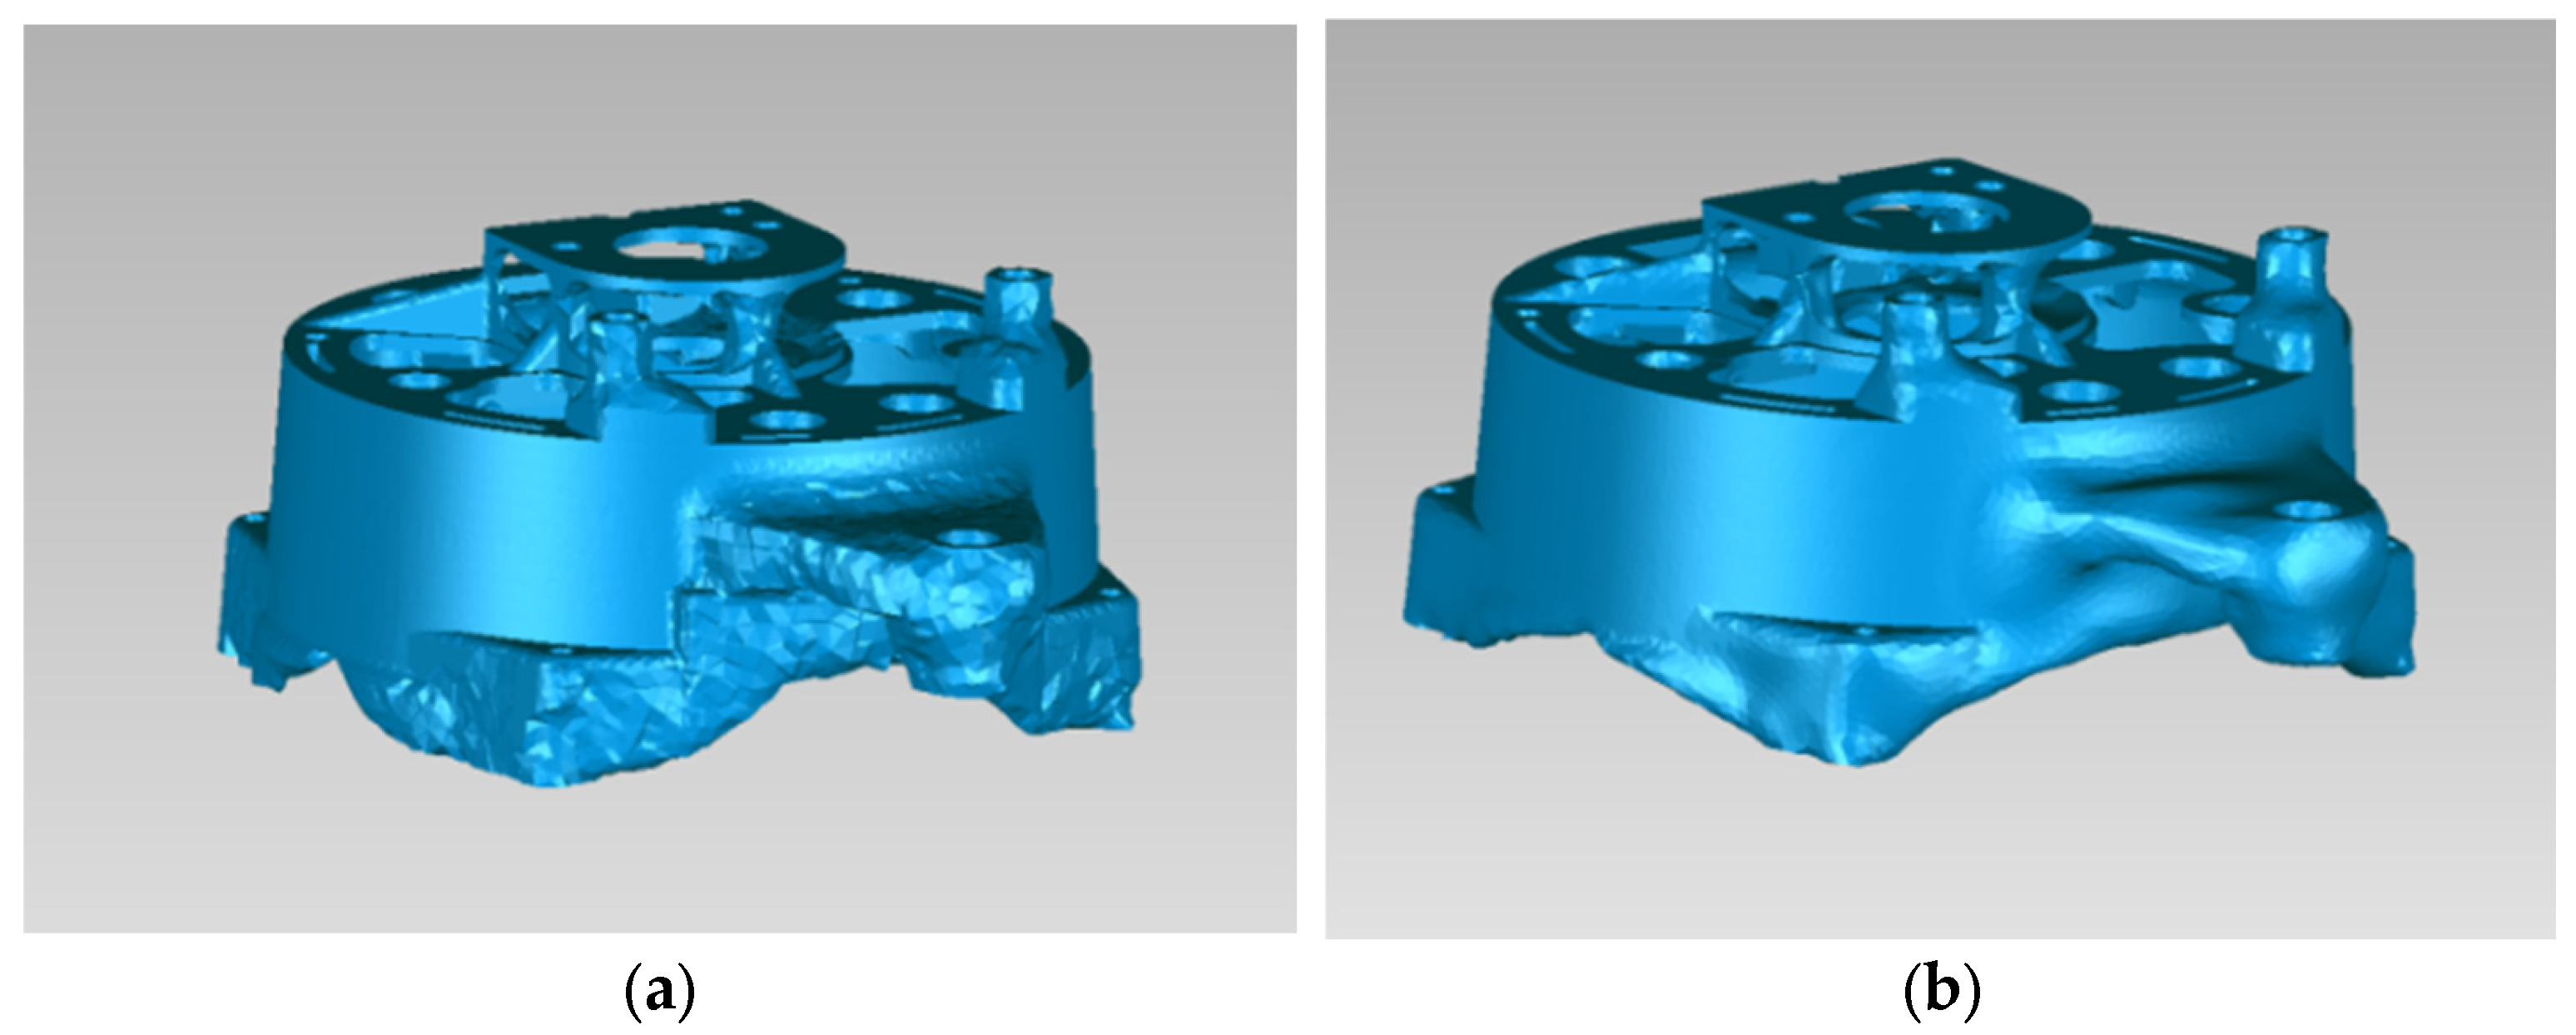
After the topological optimization is completed, the surface of the model is very rough. The rough surface cannot establish mesh elements for stress analysis and needs to be smoothed before stress analysis can be carried out [
35]. The mesh is redivided by using methods such as patching and surface fitting. The mesh division for redrawing is set to 0.3 mm, which can achieve the best smoothing effect for the rear cover model. The flattened model retains the structural features of the model after topological optimization while having a smoother surface. The reconstructed model is shown in
Figure 10.
3.4. Comparison of Stress and Natural Frequency Optimized by ESO and SI-ESO
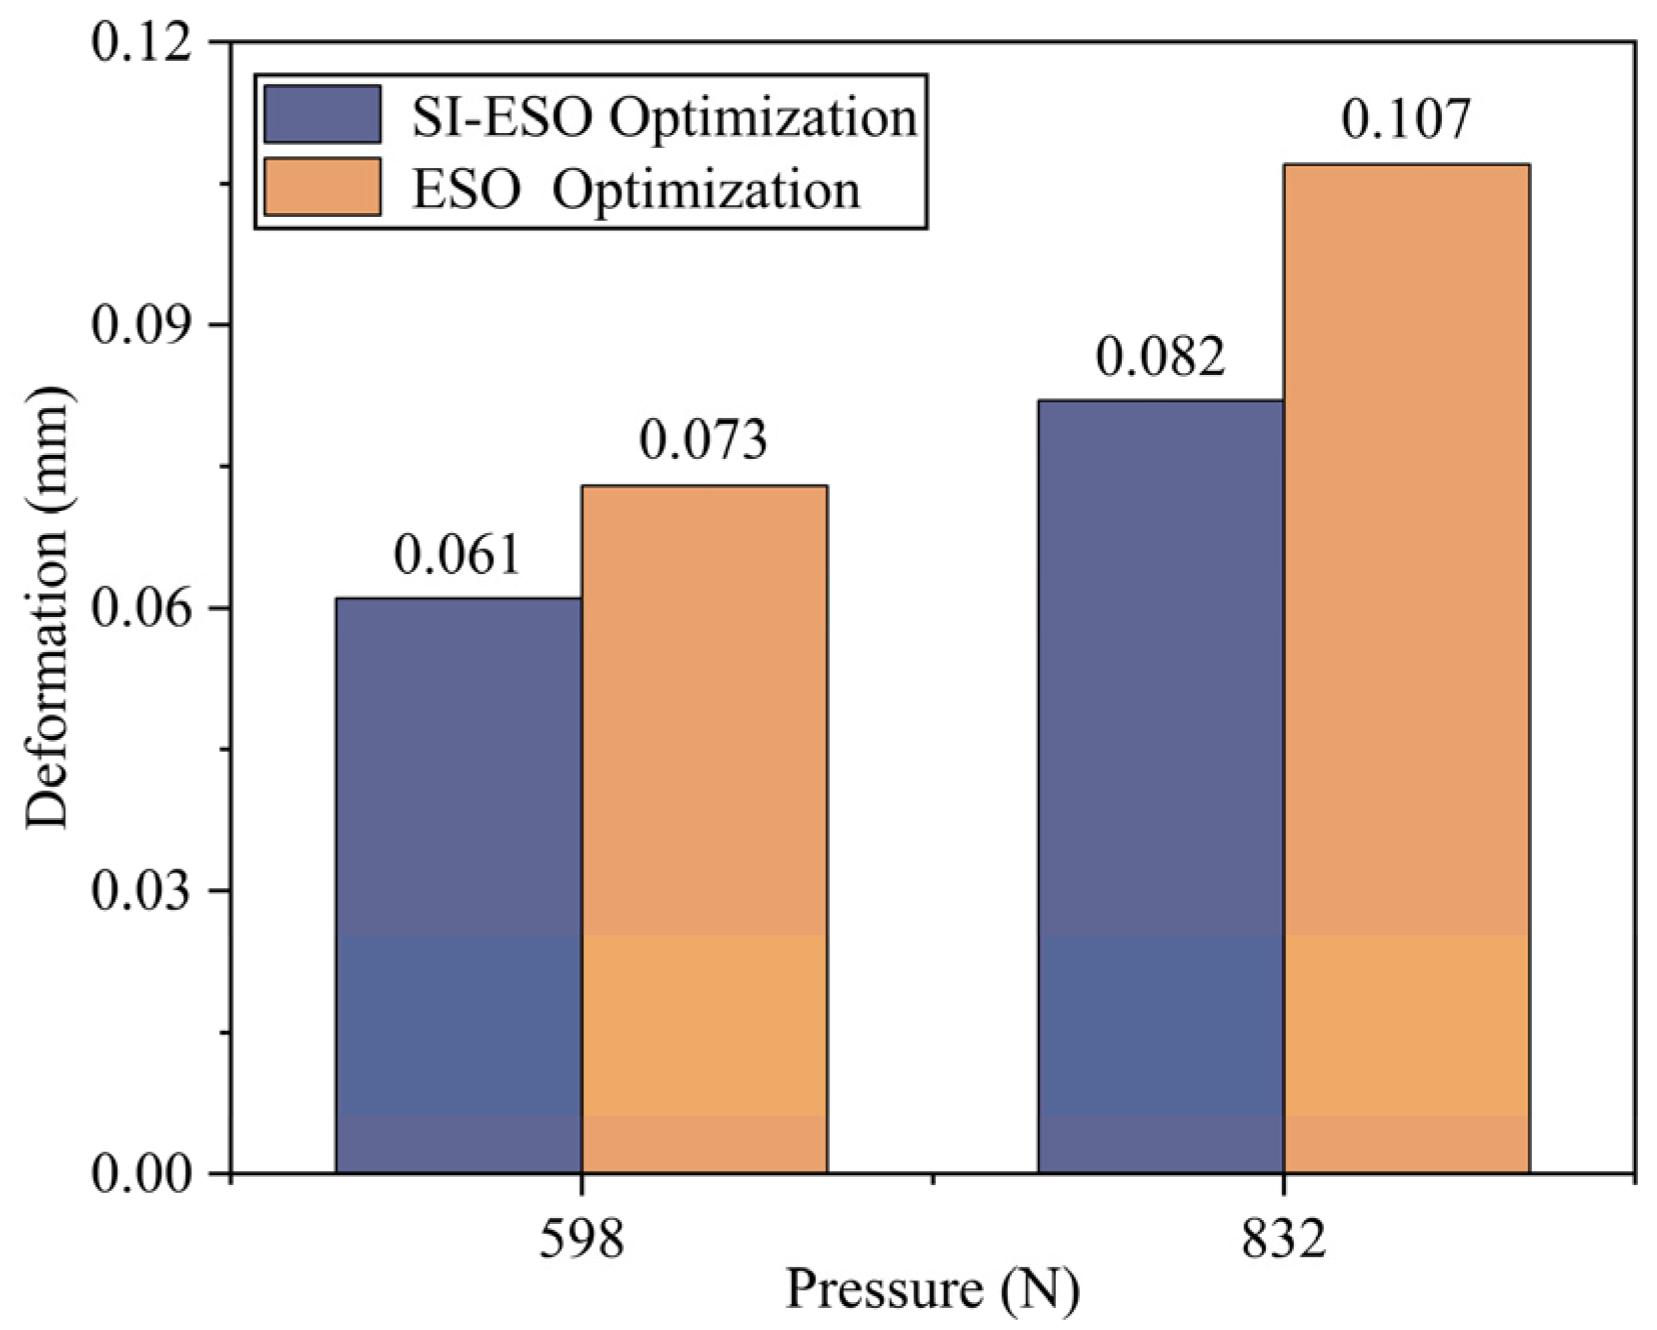
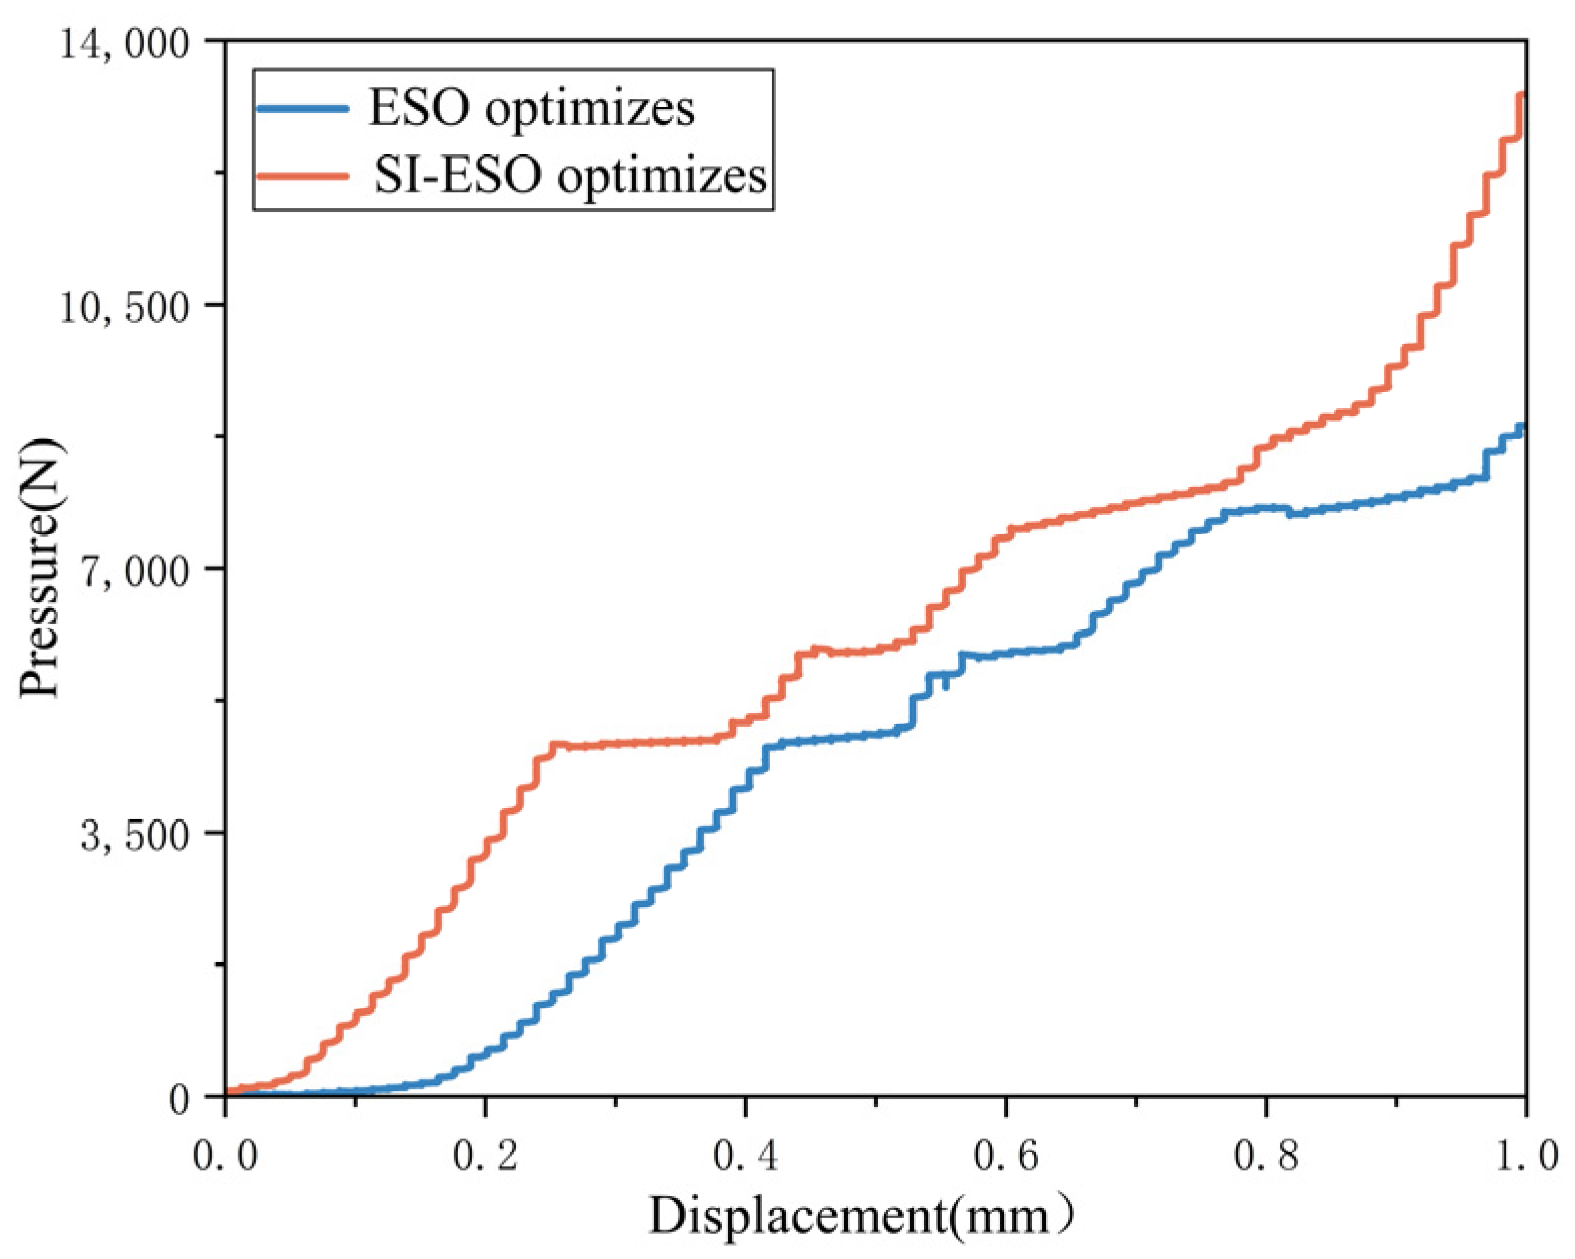
To validate the superior mechanical integrity of the SI-ESO-optimized rear cover model, a comparative performance analysis was conducted. The model was assessed under operational conditions, which included its gravitational load and fixed constraints at the five circular holes, while being subjected to external excitation frequencies ranging from 50 to 133 Hz. The analysis confirmed that the SI-ESO-optimized model satisfies all performance requirements, demonstrating its enhanced suitability for normal operational conditions compared to baseline methods.
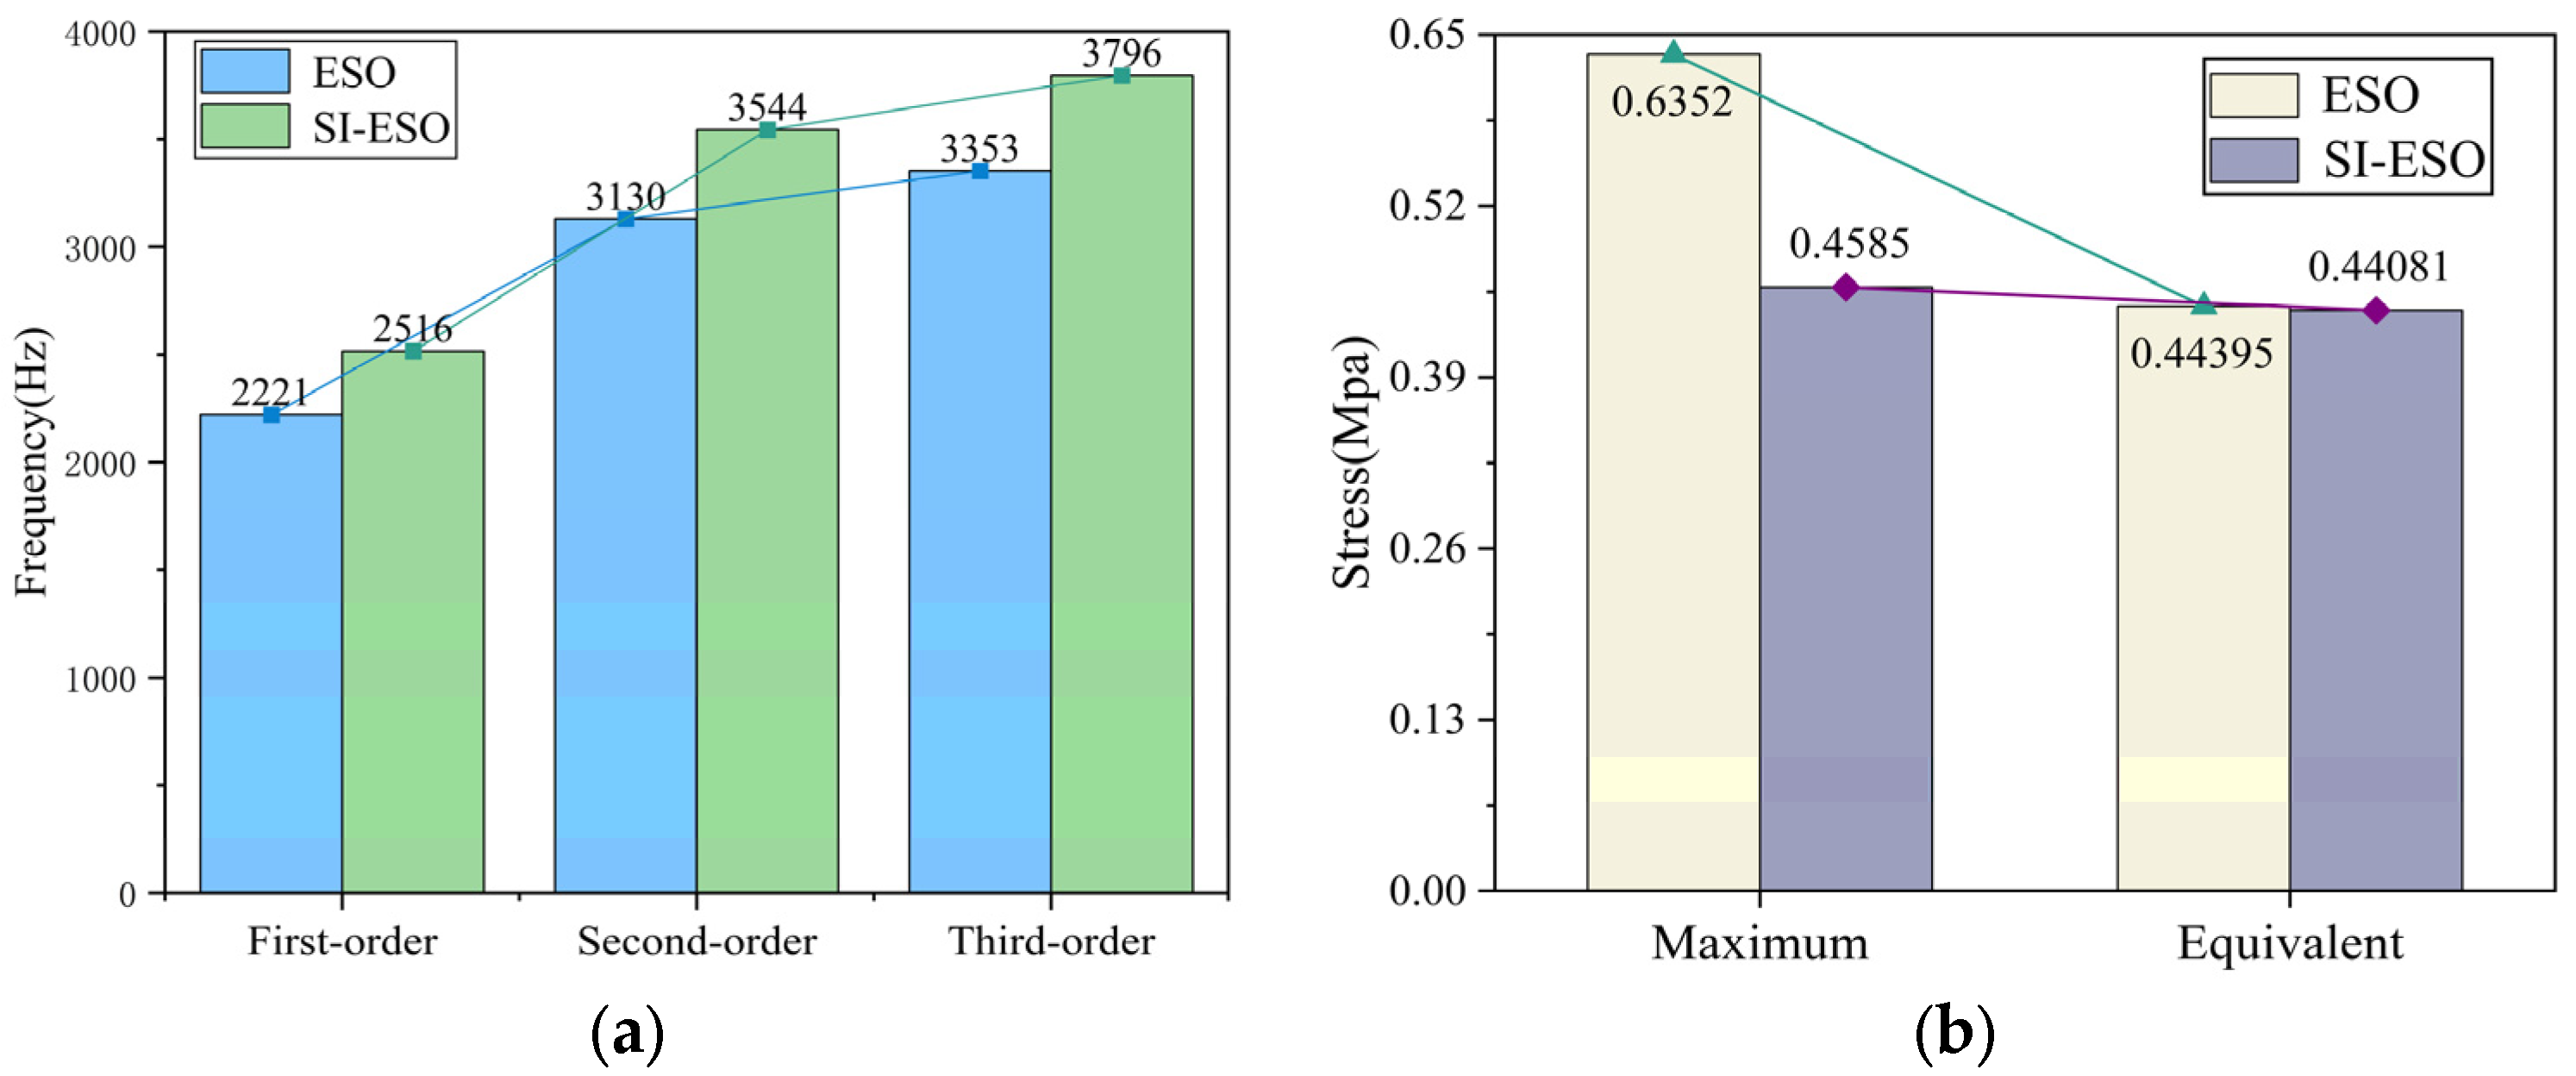
A comparative stress analysis was conducted to evaluate the performance of the SI-ESO-optimized model against the ESO-optimized model. The results demonstrated a significant performance enhancement with the proposed SI-ESO method. Under gravitational load, the maximum stress in the SI-ESO model was approximately 0.460 MPa. This value represents a 27% reduction (0.175 MPa) relative to the stress exhibited by the ESO-optimized model under identical conditions. Moreover, the equivalent stress was measured at 0.440 MPa, also indicating a marginal decrease. These comparative findings, presented in
Figure 11, confirm the structural improvements achieved by the SI-ESO algorithm over the conventional ESO approach.
Figure 11 demonstrates that the optimization and reconstruction process resulted in material removal, consequently reducing the equivalent stress value. The maximum stress concentration was identified at the reinforcing ribs’ locations, which improved stress distribution and increased the natural frequency. The SI-ESO algorithm’s optimization of intermediate density variables enabled smoother material transitions and alleviated stress concentrations caused by abrupt geometric features. Furthermore, the penalty factor effectively moderated penalty intensity in high-stress regions, permitting enhanced material retention for more uniform stress distribution and achieving a balanced dynamic load across the model.
The uniformly distributed dynamic load reduces local stress interference on modal frequency while simultaneously enhancing natural frequency and reducing maximum stress values. Significantly, the equivalent stress value of the optimized rear cover model maintained stability, successfully achieving lightweight design objectives without compromising mechanical integrity, thus meeting the lightweight requirements for the aero generator’s rear cover model [
36]. Modal verification experiments were conducted on the first three vibration frequencies, with detailed results presented in
Table 3.
Given that the modal frequency is directly proportional to the stiffness of structural components, an increase in structural stiffness consequently leads to a corresponding elevation in modal frequency. The first-order modal frequency exerts the most significant influence on stiffness, which is predominantly determined by material distribution. The SI-ESO method facilitates the binarization of density distribution in grid cells, reduces the transitional density regions, clarifies the stress distribution pattern, and enhances structural stiffness. The introduction of continuous intermediate density variables in SI-ESO optimizes material distribution. In simulation mode, the first-order natural frequency threshold demonstrated a 13% increase, while experimental results showed a 10.53% enhancement, surpassing the modal frequency obtained through ESO analysis. The maximum third-order error of the SI-ESO optimization method remains within 5%, primarily attributable to manufacturing precision and modal truncation errors. All third-order errors fall within acceptable tolerance ranges. Free vibration mode experiments confirm that the finite element model exhibits high accuracy in modal analysis, effectively expanding the resonance frequency range and significantly improving the stiffness of designed components.
Comparative experiments were established to evaluate the improvements of the SI-ESO method over other optimization approaches. The data in
Table 4 indicate that the first-order modal frequencies for both the BESO and MMA methods are lower than that of the SI-ESO method. During optimization, the BESO and MMA methods indirectly influence the modal frequencies by adjusting the overall mass and stiffness distribution. In contrast, the SI-ESO method refines the mesh optimization elements, creating a smoother material transition between them. This allows for a better adjustment of local material distribution to optimize the stiffness and mass distribution of the structure, thereby enhancing the modal frequency. Simultaneously, it enables a more uniform material mass distribution in the designed model and reduces sawtooth-like sharp features, which leads to a decrease in the model’s stress values.
