Abstract
The increasing sophistication of malware and the use of evasive techniques such as obfuscation pose significant challenges to traditional detection methods. This paper presents a deep convolutional neural network (CNN) framework that integrates static and dynamic analysis for malware classification using RGB image representations. Binary and memory dump files are transformed into images to capture structural and behavioural patterns often missed in raw formats. The proposed system comprises two tailored CNN architectures: a static model with four convolutional blocks designed for binary-derived images and a dynamic model with three blocks optimised for noisy memory dump data. To enhance generalisation, we employed Cycle-Consistent Generative Adversarial Networks (CycleGANs) for cross-domain image augmentation, expanding the dataset to over 74,000 RGB images sourced from benchmark repositories (MaleVis and Dumpware10). The static model achieved 99.45% accuracy and perfect recall, demonstrating high sensitivity with minimal false positives. The dynamic model achieved 99.21% accuracy. Experimental results demonstrate that the fused approach effectively detects malware variants by learning discriminative visual patterns from both structural and runtime perspectives. This research contributes to a scalable and robust solution for malware classification unlike a single approach.
1. Introduction
As cyber threats continue to evolve, so too does malware adapt in complexity and sophistication [1]. The increasing profitability of malware has been associated with a rise in data breaches, disruptions to services, and substantial recovery costs, as seen in cases of ransomware attacks [2,3]. Ransomware, despite its longstanding presence in the cybersecurity landscape, has evolved markedly in both scale and complexity in recent years. Notably, in 2023, the incidence of documented ransomware attacks increased by approximately 68%, with one of the most severe cases involving a ransom demand of USD 80 million directed at Royal Mail [4]. Cybersecurity practitioners are required to consistently evolve and refine their detection methodologies to effectively counteract the impact of sophisticated adversarial threats.
The increasing sophistication and rapid evolution of malicious software has rendered its detection a fundamental challenge in contemporary cybersecurity. Advanced malware variants like polymorphic and memory-resident variants are engineered to circumvent conventional security mechanisms. Polymorphic malware, in particular, is capable of dynamically altering its code structure or file signature during propagation while retaining its underlying malicious functionality. Detecting this category of malware poses significant challenges due to its ability to transform into multiple variants that, while structurally distinct, maintain identical functionality [5]. Cybercriminals increasingly utilise methods like code obfuscation, intentionally transforming malicious code into a convoluted form to hinder detection and analysis [6].
Considering these challenges and the growing dependence on digital infrastructure for contemporary business operations and service provision, advancing malware detection methods is essential. This can be achieved either by refining existing techniques or by developing novel strategies and solutions. This study addresses this challenge by examining the effectiveness of static and dynamic malware analysis techniques in standardised RGB image formats using the CNN approach. The aim of this study was to establish which analysis strategy offers a more robust foundation for ML-based malware detection. The primary objective was to evaluate the effectiveness of convolutional neural networks in distinguishing between malicious and benign software with a particular focus on comparing the influence of static and dynamic representations on classification performance.
This study presents a novel approach to malware detection by integrating static and dynamic malware analyses into a unified RGB image representation by combining multi-modal analysis, novel augmentation techniques, and architecture-specific CNN design to tackle evolving threats.
The primary contributions presented in this study are summarised as follows:
- We propose a novel deep convolutional neural network framework that integrates static and dynamic malware analyses into a unified RGB image representation to enable more comprehensive and accurate classification by capturing both structural and behavioural patterns.
- We introduce an advanced data augmentation approach leveraging CycleGAN-based cross-domain image synthesis which significantly expands the malware dataset to enhance the model’s ability to generalise across diverse malware variants.
- We design and optimise two tailored CNN architectures specifically adapted to the characteristics of static binary images and dynamic memory dump data by incorporating architectural modifications that effectively address noise and complexity.
2. Related Works
Malware detection approaches are generally categorised into two principal methodologies: static analysis and dynamic analysis [7]. Static analysis is a conventional and widely adopted technique which has traditionally been employed to detect less sophisticated malware threats. Static analysis refers to the examination of software artefacts without their execution to identify potential vulnerabilities or structural issues. It examines packet headers, associated metadata, and file signature information. Signature-based detection techniques are supported by comprehensive databases of known malware signatures to offer high reliability in identifying previously identified malicious software with minimal false positives. However, adversaries are increasingly adopting evasion strategies such as code obfuscation and encryption to avoid detection. Although static analysis offers rapid and dependable detection for known threats, it exhibits limitations in characterising program behaviour and is often ineffective against novel or obfuscated malicious code.
Dynamic analysis involves a comprehensive understanding of a file’s behaviour by observing its execution within a controlled environment [8]. Dynamic analysis provides comprehensive insights into program behaviour by enabling real-time observation of malware interactions with the system. By observing activities such as file alterations and network communication, file structures are identified during dynamic analysis [9]. These behavioural characteristics frequently evade detection through static analysis especially for the effective detection of zero-day and advanced malware variants. However, dynamic approaches often demand substantial computational resources which are time-consuming [10] and there are higher risks of malware infection [11]. Virtual sandboxes and artificial environments are commonly employed for malware execution and analysis to mitigate associated risks. The challenge is that these tools may not fully capture the malware’s behaviour, as discrepancies often arise between its actions in such controlled environments and those observed in real-world scenarios [12].
Static and dynamic analysis methods continue to be fundamental in malware examination, each offering unique advantages tailored to specific use cases. Dynamic analysis enables an in-depth exploration of malware behaviour through the observation of code during execution, whereas static analysis focuses on assessing the software’s structure and functionalities without running the code. The integration of these two approaches has demonstrated considerable improvements in detection accuracy and a greater comprehension of the analysed malware [13]. While hybrid approaches have the potential to yield more reliable outcomes, they are accompanied by notable drawbacks. Hybrid approaches tend to incur higher costs which demand greater resources. Secondly, they present increased complexity in terms of maintenance. These challenges often render them impractical for widespread application, particularly in routine malware detection scenarios. This observation prompts a critical inquiry: Are hybrid strategies indispensable or can a single well-optimised method augmented by advanced machine learning techniques offer a more efficient and viable alternative? Machine learning (ML) represents an advanced computational approach that has the potential to transform malware detection [14]. ML leverages artificial neural networks to model and interpret complex data structures. These networks draw inspiration from the architecture of the human brain [15].
ML consists of interconnected layers of artificial neurons. Each layer processes input from the preceding one, progressively extracting intricate features and patterns from the data. By leveraging data-driven learning, ML techniques can recognise complex patterns and make autonomous decisions without dependence on explicitly programmed rules. The introduction of backpropagation algorithms facilitated the efficient training of multi-layer neural networks, thereby enhancing their capability to model complex data relationships. This advancement enables neural networks to effectively identify intricate patterns, making them particularly well suited for the analysis of malicious software across various contexts, including file-based malware, memory dumps, and behavioural traces.
Machine learning offers substantial advancements in the design of contemporary malware detection methods. One significant benefit of machine learning (ML) in malware analysis is its ability to automate the examination of large-scale data with remarkable speed and efficiency [16]. However, adversaries have begun leveraging ML techniques to create novel and more sophisticated malware variants by training algorithms on previously identified malicious code [17]. Machine learning models trained on labeled datasets comprising both malicious and benign software samples enable the classification of software into benign or malicious categories [18]. After training, such models can generalise from previously observed malware characteristics to identify novel threats, thereby offering significant potential in the detection of zero-day attacks.
The performance of machine learning (ML) models in identifying emerging cyber threats is closely linked to the quality, diversity, and representativeness of the training data, as well as the robustness of the model architecture. Insufficient or unbalanced datasets can hinder the learning process, potentially resulting in elevated rates of false positives or false negatives [19]. To address this challenge, one promising strategy involves the use of RGB image representations [20]. This technique transforms malware-related data into colour-encoded images. The RGB image representation technique enhances malware detection models by distinguishing between benign and malicious instances from a set of features embedded within each sample. While static and dynamic malware analysis techniques have been extensively investigated in isolation, there remains a significant gap in comparative studies that utilise consistent convolutional neural network (CNN) architectures trained on uniformly pre-processed image-based representations from both analysis modalities. Deep learning is a subfield of machine learning (ML). It facilitates the automatic extraction of intricate features from raw malware input data with minimal human intervention [21].
Deep learning architectures such as Convolutional Neural Networks (CNNs) and Recurrent Neural Networks (RNNs) have emerged as prominent models due to their effectiveness in various learning tasks including malware detection [22]. Convolutional neural networks (CNNs) are known for efficient capturing of visual patterns with malware attributes. CNNs demonstrated stronger performance in image-based classification tasks than traditional ML models [23]. A novel approach involves encoding malware binaries into RGB image formats. This enables both static and dynamic analyses to be interpreted within a unified image-centric malware detection. CNNs have demonstrated significant efficacy in malware detection using image-based data representations, owing to their capacity to autonomously learn and extract spatially invariant features from malware inputs.
In ref. [24], the authors proposed the transformation of malware binaries into greyscale images to effectively capture and analyse texture-based similarities among malware samples. The transformation allows the CNN model to identify patterns and textures within the image representations which correspond to structural and behavioural similarities in the malware code. The RGB representation demonstrated enhanced classification performance by facilitating the extraction of deeper structural features through CNNs. However, despite their effectiveness in capturing spatial characteristics, there is a major limitation in processing data with malware intrinsic sequential dependencies. Recent developments in machine learning (ML) for malware detection have prompted the investigation of alternative data representation techniques to enhance model training and pattern recognition capabilities [25]. The authors of [26] designed a malware detection system using a CNN by converting malware files into image representations. The MDS method consists of spatial pyramid pooling layers to accept varying image dimensions. The proposed method can differentiate image colour spaces among malware features to enhance detection and can resist API injections.
In another study, ref. [27] explored visualisation-based malware detection by image augmentation using a CNN technique. In this study, malware samples were initially represented in matrix form and subsequently converted into grayscale and RGB image formats through the application of a pooling technique. The experimental results indicated that when utilised within the B2IMG framework, the RGB image representation outperformed its grayscale counterpart in terms of malware detection accuracy. Notably, the evaluation was primarily conducted using earlier versions of convolutional neural network (CNN) architectures. However, further analysis employing more advanced CNN models, such as VGG-3 and higher versions, reinforced the superiority of RGB-based representations over grayscale images for the task of malware classification [28]. While both approaches [27,28] are effective, RGB images offer a more comprehensive representation of data as each pixel comprises three distinct colour channels. Each of these colours is capable of independently encoding information, thereby enriching the overall content.
In addition to colour representation, the selection of the appropriate image file format is crucial when converting binary or memory data into visual representations. It is important to note that the chosen format maintains the pixel-level fidelity of the data and avoids the introduction of compression artefacts or distortions. The authors of [29] proposed a novel MalJPEG framework to detect malicious JPEG images. The framework extracts ten simple yet discriminative features directly from the JPEG file structure. While the results demonstrated that the framework accurately distinguishes between benign and malicious JPEG images even in the presence of a class imbalance, the features used are static. This may not capture the more sophisticated obfuscation or payload concealment techniques employed by advanced attackers. In addition, even though the authors used a large and real-world dataset, this may not cover all variants or evolving threats associated with malicious JPEGs. As shown in Table 1, despite incremental progress, none of the reviewed works offered a holistic model that simultaneously incorporates static and dynamic analysis, modern machine learning techniques, robust augmentation strategies, and RGB-based image representations. To address this, our proposed model integrates all five dimensions, namely: static and dynamic feature extraction, advanced machine learning, augmentation of the dataset to improve generalisation, and RGB image representation for enriched feature space. This comprehensive approach enhances detection accuracy, model robustness, and interpretability. These make the proposed work a significant advancement over existing techniques.

Table 1.
Comparison of related papers. A ✓ symbol indicates that the study addresses the respective topic, though it may not offer an in-depth or comprehensive discussion. A symbol X indicates that the study did not address the respective topic.
3. Methods and Materials
3.1. System Setup
This section presents the methodology adopted for the technical implementation of the study. It encompasses the configuration of the controlled environment, data collection and pre-processing, design and optimisation of the CNN model, and the generation of outputs for performance assessment. Each phase of the workflow is elaborated upon with particular attention paid to how the choices and iterative enhancements were guided by insights derived from the related work in Section 2. The development and training phases of this study were carried out on a local workstation running Windows 11 (version 10.0.26100, Build 26100), featuring an AMD Ryzen 9 7950X processor (16 cores), 64 GB of RAM, and an NVIDIA GeForce RTX 4090 GPU with 24 GB of VRAM. Python 3.12.10 was used as the primary programming language within the Visual Studio Code integrated development environment (version 1.98.2).
Core libraries used included TensorFlow 2.18.0 (utilised with the Keras API) [30], NumPy, and OpenCV. Although the physical machine used was equipped with a high-performance GPU, model training was executed using the CPU version of TensorFlow due to compatibility issues with Python 3.12 during the development period. To facilitate controlled data acquisition, a virtualised environment was designed using VMware Workstation Pro (version 17.6.1, build-24319023) running a dedicated Windows 10 (version 22H2) instance. The virtual machine was provisioned with 4 CPU cores, 16 GB of RAM, and 100 GB of NVMe SSD storage. This configuration enabled reliable software execution and analysis while maintaining strict isolation between the data collection environment and the model development pipeline.
3.2. Dataset Pre-Processing
The implementation of our model was carried out using two publicly and widely used memory malware image samples, Dumpware10 [31] and vision-based malware samples MaleVis [32]. The datasets used in this study were chosen based on their relevance to the domain of image-based malware classification and their suitability for evaluating both static and dynamic analysis techniques. From the Dumpware10 samples, we collected a total of 4294 RGB images derived from malicious memory dump files. From the MaleVis samples, we collected a total of 14,226 RGB images from 25 malware classes from binary streams of executable files. These datasets not only facilitated our framework but also eliminated the necessity for direct handling of live malware samples. Each dataset consisted of pre-processed and standardised images uniformly resized to 300 × 300 pixels. Although both datasets exhibited methodological overlap and shared certain malware families, the benign samples originally included in them were excluded from this investigation.
In the dataset, benign software was represented solely by cryptographic hash values which could not be traced back to the actual executable files. This limitation restricted access to essential metadata, including application context and functionality. The difficulty in resolving these hashes is primarily attributed to the limited submission of benign software to threat intelligence platforms such as VirusTotal, unlike malware which is more frequently reported. To overcome this limitation, a new collection of 252 benign executable samples was manually collected. These were processed using the same tools and procedures applied to the malicious dataset to ensure methodological consistency of our model approach. A total of 504 software instances were collected, comprising 252 benign and 252 malicious samples for use in both static and dynamic analysis datasets. All representations were generated from identical source programs to maintain consistency and support an unbiased comparative evaluation of the two analysis methodologies.
To construct a representative and controlled dataset, a total of 252 software samples were manually acquired through the Ninite [33] and Windows Remix [34]. These platforms provide a standardised and reliable approach for batch application installation. Ninite is also widely recognised for facilitating the unattended download and installation of multiple applications directly from official sources. Windows Remix is a community-driven solution built upon the Chocolatey package manager for generating batch installation scripts [35]. This approach allows for the efficient deployment of software from trusted repositories for customisation and control. In this research, the applications selected through these tools were for the representation of a diverse range of functionalities and vendors. As illustrated in Figure 1, each was systematically categorised according to its primary function, such as communication, file compression, media, and system utilities. This classification is to support comprehensive evaluation.

Figure 1.
Hierarchical organisation and categorical distribution of benign software instances used in this study.
To enhance the practical relevance of the dataset, representative malware families were selected to correspond with each category of legitimate software where feasible. For instance, benign web browsers were aligned with samples from the BrowseFox family [36], which is a known browser hijacker that manipulates user sessions. Online storage was paired with malware such as AutoRun, which emulates synchronisation-like behaviour. This methodology was used to reflect plausible threat scenarios wherein malicious programs impersonate commonly used software. This approach in dataset creation accurately mirrored the complexities encountered in real-world malware detection. To collect memory snapshots of benign applications, ProcDump was used [37]. Each application was executed and allowed to run for approximately two minutes prior to memory capture. This approach enabled the capture of memory-resident behaviours and execution patterns prior to process termination. In instances where the target software initiated multiple concurrent processes, the one with the highest memory utilisation was selected for analysis. A detailed overview of the dataset composition is presented in Table 2. The categorical distribution across both the benign and malicious sets is presented in Table 3.

Table 2.
Comparative summary of the structure and key attributes of the datasets employed in the experimental evaluation.

Table 3.
Class-wise allocation of malware and benign software instances.
This criterion assumed that the process consuming the most memory was likely to represent the primary execution context and encompass the most relevant behavioural data of the application. To ensure environmental consistency and prevent cross-contamination during data acquisition, system snapshots were reverted after every 25 to 50 software installations. The final dataset comprised a total of 504 software samples, evenly divided into 252 benign programs. Each sample was subjected to both static and dynamic analysis procedures to yield two distinct but parallel datasets, each containing 504 image representations. All benign binary samples were transformed into RGB PNG images using bin2png_lanczos, which is an enhanced variant of the original bin2png script [38]. The primary enhancement in this version is the integration of an optional image resizing feature utilising OpenCV’s Lanczos interpolation. The generated images were rescaled to a uniform resolution of 300 × 300 pixels using the Lanczos resampling technique [39]. The Lanczos resampling technique was used to standardise the input dimensions across all samples.
While the original bin2png script directly converted binary input into RGB images using the Python Imaging Library (PIL) [40], the modified version introduces an intermediate step to enable OpenCV resizing. The PIL image is first converted to an OpenCV-compatible format for resizing, after which it is converted back to the PIL to retain compatibility with the output specifications of the original implementation. The conversion approach processes each binary file as a continuous byte stream by mapping every three bytes to a single RGB pixel. Each byte ranging from 0 to 255 corresponds to one of the red, green, or blue channels. This encoded the binary structure of the file into colour-based representations. This visual encoding preserves the intrinsic features and layout of the binary data while enabling our model to extract spatial patterns and detect potential anomalies. A schematic overview of the image pre-processing workflow is provided in Figure 2.

Figure 2.
Conceptual diagram detailing the implementation strategy of the bin2png script.
The output images were stored in PNG format, aligning with the original formats used in the Dumpware10 and MaleVis datasets. The PNG format was chosen for its lossless compression capabilities, which are essential for maintaining the integrity of byte-level features for accurate detection. To construct the RGB image datasets, two distinct processing pipelines were used. For static analysis, each executable (.exe) file was directly converted into an RGB image. For dynamic analysis, memory dump files were captured with ProcDump and saved as .dmp files representing runtime memory behaviour.
The comprehensive data transformation workflow is depicted in Figure 3. All generated images, ranging from raw binary files to memory dumps, were systematically organised into directories according to their respective malware family classifications.
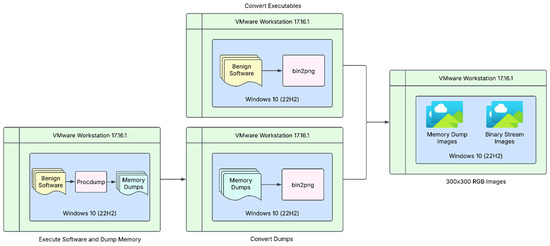
Figure 3.
Schematic representation of the image transformation pipeline for benign samples prior to model training.
3.3. Dataset Augmentation
This study presents a convolutional neural network-based approach for the classification of static and dynamic malware behaviours, structured into two key phases: data augmentation and classification. To increase feature diversity, model generalisation, and reduction in data imbalance, the collected sample was augmented using the technique described in [19]. Given the limited availability of benign samples and the challenge of acquiring novel malware binaries, augmentation was applied only to the malware class. Two sequences of controlled image transformations, namely, brightness adjustments [41,42] and Gaussian noise injection [42] brightness, were applied to each malware image. For each original malware image, augmented variants were generated to expand the dataset size without compromising the integrity of the image.
To enhance model generalisation in malware image classification, we constructed an enriched dataset using both conventional data augmentation and CycleGAN-based domain transformation, as illustrated in Figure 4. Let the original static image dataset be represented as , where are RGB image representations collected from the MaleVis dataset. Similarly, the dynamic dataset is denoted as , where each is derived from Dumpware10. To construct diverse variants of the original images, we define an augmentation transformation set , with each transformation function , to preserve the image quality while transforming the image spectral properties to be augmented.
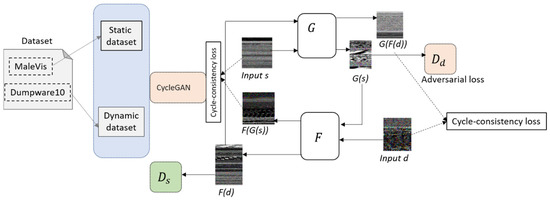
Figure 4.
Architecture of the proposed data augmentation approach.
The dynamic dataset is augmented similarly, as follows:
To complement conventional augmentation, we employed a cycle-consistent generative adversarial network (CycleGAN) to generate synthetic inter-domain samples. Let be a generator that maps static images to the dynamic domain, and be the inverse generator, where and are accompanied by discriminators for distinguishing real from fake images in their individual domain. To govern adversarial training, we use the loss function, as follows:
To enforce spatial consistency of the synthetic feature attributes, we applied a cycle-consistent constraint such that each of the malware RGB images is mapped to the opposite domain and then back to its original domain to yield the original image, expressed as in Equation (11). To balance adversarial and cycle consistent losses, regularisation was used to give the full objective function, expressed in Equation (12).
where is a regularisation parameter balancing adversarial and cycle consistency losses. Synthetic samples generated through and are added to the discriminator’s domains for inter-domain diversity of the images expressed in Equations (13)–(18), as follows:
The adversarial and cycle consistency losses enable the generation of high-fidelity synthetic samples that capture the statistical nuances of the target domain. This approach in our proposed method contributes to dataset diversity and minimises overfitting during the model training. The augmentation strategy applied to the dataset is detailed in Algorithm 1. The distribution of malware classes in the static augmented dataset is presented in Table 3, where the total number of images is 56,904. The samples were derived from the original dataset using an 80:20 train–test split, with counts proportionally scaled based on the original class distribution outlined in Table 4 to maintain representativeness. Similarly, Table 5 details the malware class distribution in the dynamically augmented dataset, comprising 17,176 images. The symbols and notations employed throughout the dataset preparation, augmentation, and CycleGAN-based synthetic generation are summarised in Table 6.
| Algorithm 1: Augment Dataset. | |
| Input: | D_static ← {s1, s2, …, sn} Static dataset (MaleVis) D_dynamic←{d1, d2, …, dm} Dynamic dataset (Dumpware10) A ← {a1, a2, …, ak} Augmentation operations |
| Output: | Augmented_images |
| 1. | Initialize D_static_aug← ∅ |
| 2. 3. | Initialize D_dynamic_aug ← ∅ for each image si ∈ D_static do |
| 4. | for j = 1 to n do |
| 5. | Randomly choose aj ∈A |
| 6. 7. | s_aug←aj(si) add s_aug to D_static_aug |
| 8. 9. | end for end for |
| 10. 11. 12. 13. 14. 15. 16. 17. | for each
image di ∈D_dynamic do for j = 1 to n do randomly choose aj ∈A d_aug←aj(di) add d_aug to D_dynamic_aug end for end for return D_static ∪ D_static_aug, D_dynamic ∪ D_dynamic_aug |

Table 4.
Malware class distribution in the Static Augmented Dataset (Total = 56,904 Images). Class-wise distribution of samples derived from the original dataset using an 80:20 train–test split. Counts are proportionally scaled based on the original class distribution (refer to Table 2) to reflect the total size of the augmented dataset.

Table 5.
Malware class distribution in the Dynamic Augmented Dataset (17,176 Images). The total image count sums to 21,452 for an approximate 80:20 train–test split.

Table 6.
Symbols and their meanings.
3.4. Distribution by Families
The heatmap presented in Figure 5a illustrates the distribution of various malware families utilised in the dataset. Each row corresponds to a malware variant, and the heatmap values denote the frequency count of each within the sample pool. The malware families installcore, Multiplug, and adposhel each had the highest occurrence count (n = 29), indicating a deliberate attempt to maintain a balanced distribution across predominant malware variants. This balanced approach is pivotal for ensuring that the convolutional neural network (CNN) model receives consistent exposure across diverse malware types during training, thereby reducing bias and enhancing generalisation. The relatively uniform distribution mitigates class imbalance problems, which are common in distorting classification accuracy in multi-class scenarios.
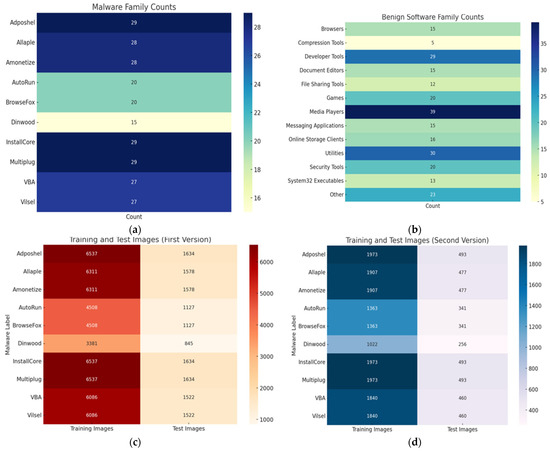
Figure 5.
Heatmap visualisations of dataset composition used for malware classification. (a) heatmap of malware family frequencies, (b) heatmap of benign software categories, (c) training and test sample counts in the dynamic dataset, and (d) training and test sample counts in the static dataset.
The heat map in Figure 5b captures the distribution of benign software categories integrated into the dataset. With Media Players (n = 39), Utilities (n = 30), and Developer Tools (n = 29) occupying the top three categories by count, the dataset reflects a rich diversity of non-malicious applications. This is essential for ensuring the robustness of the classifier in distinguishing between legitimate software and malware that might mimic benign behaviours or signatures. The inclusion of niche categories such as Compression Tools (n = 5) and System32 Executables (n = 13) ensures that the benign dataset is not overly skewed towards popular software types. This promotes realistic emulation of real-world system environments. Such diversity in benign classes strengthens the discriminative capacity of the CNN model and minimises the risk of false positives.
Figure 5c depicts the number of training and test samples for each malware family in a large-scale dynamic analysis dataset. This version is indicative of a more resource-intensive dataset captured from memory dumps, reflecting post-execution behavioural artefacts. The training images range from 3381 (dinwood) to 6537 (installcore, multiplug, adposhel), demonstrating a substantial volume of feature-rich data derived from memory. The relatively consistent test sizes (e.g., vba and vilsel each at 1522) allow for meaningful model evaluation with minimised variance. Such a distribution enables the proposed model to exploit spatio-temporal correlations present in runtime environments, which are often imperceptible in static binaries. Figure 5d, in contrast, presents a downscaled version of the dataset designed for lightweight experimentation and deployment in resource-constrained environments. The training image counts ranged between 1022 (Dinwood) and 1973 (InstallCore, Multiplug, Adposhel) with proportionally reduced test samples. This dataset originates from static analysis of executable binaries converted into RGB image representations. While less computationally demanding during experimentation, they lack deep behavioural insights, making them more vulnerable to evasion via code obfuscation. However, they are faster to process and more scalable, especially in real-time.
4. Model Approach
4.1. CNN Model
The proposed model is designed to process image representations of static and dynamic software behaviours for the purpose of binary classification to identify whether a given software instance is benign or malicious. The model was developed using a convolutional neural network. In the CNN architecture of the model, as illustrated in Figure 6a, the network begins by accepting a standardised augmented image input of size 300 × 300 × 3, representing RGB image data generated from either binary files or memory dumps. The uniform input size ensures consistency across the dataset, which comprises 74,080 augmented samples derived from 504 original software artefacts through brightness and noise transformations. A structural overview of the proposed CNN model is presented in Figure 6b.
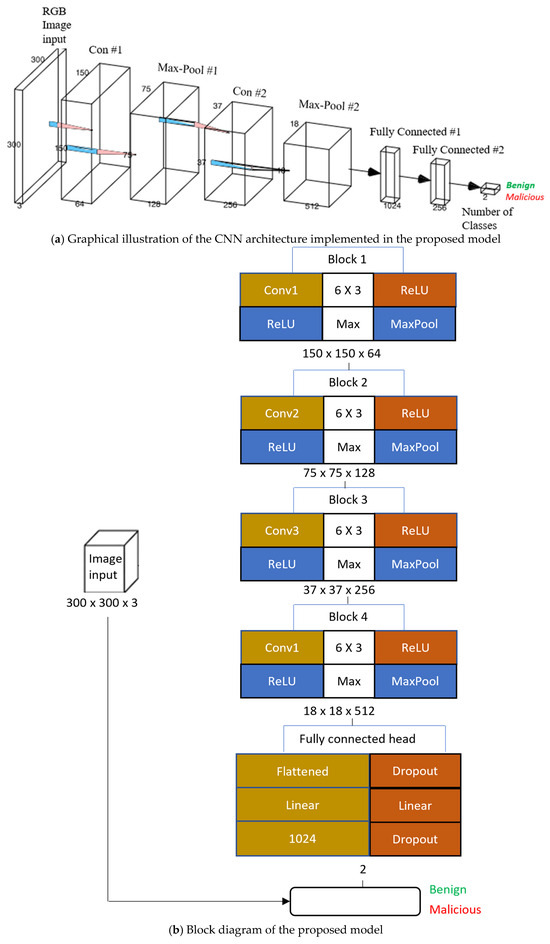
Figure 6.
Graphical representation of the proposed model and corresponding block diagram illustrating the model’s processing pipeline.
The CNN pipeline developed for the proposed model is structured into four sequential convolutional blocks, each consisting of a convolutional layer followed by a ReLU activation and max pooling operation. Block 1 performs the initial feature extraction using 64 filters of size 3 × 3, capturing low-level patterns such as edges, blobs, and simple textures. The ReLU activation introduces non-linearity, which is essential for enabling the model to approximate complex functions. The max pooling in the model reduces the spatial dimensions from 300 × 300 to 150 × 150 to enhance computational efficiency and promote translational invariance. This early reduction helps manage memory requirements while preserving relevant structural information. Block 2 builds upon the output of Block 1 by increasing the depth to 128 feature maps. Maintaining the 3 × 3 convolutional kernels, this layer detects mid-level abstractions like curves, corners, and simple motifs that are often associated with typical patterns in malware structures or application behaviours. The consistent application of max pooling further downsamples the feature maps to 75 × 75 × 128 to facilitate a gradual abstraction of spatial hierarchies while compressing the image feature space. At this stage, our model begins to capture more distinctive visual signatures associated with specific malware families and benign software clusters.
In Block 3, the number of filters is doubled again to 256, and the spatial resolution is halved to 37 × 37. This increase in filter depth enables the model to learn more complex and task-specific patterns. These include embedded payload indicators, obfuscation patterns, or highly repetitive benign elements, such as UI layouts. Each convolution continues to be followed by a ReLU activation, and pooling is employed to preserve the most salient features while further reducing dimensionality. The growing depth also supports the learning of features that span larger spatial extents, which is particularly beneficial for identifying global patterns in software structure. Block 4 serves as the final stage of convolutional processing, employing 512 filters to extract highly abstracted and semantically rich features from the input. In this block, we reduced the spatial resolution to 18 × 18 to strike a balance between maintaining sufficient spatial context and achieving significant data compression. This deep feature representation is critical for differentiating between subtle yet impactful behaviours in malware versus benign applications.
The use of ReLU and max pooling continues to ensure efficient computation and gradient propagation, which contributes to the stability and robustness of the training process of our model. Following the convolutional backbone, the output tensor is flattened into a one-dimensional vector to serve as input to the fully connected classification head. This section of our proposed architecture is designed to interpret the learned high-dimensional representations for final decision making. The first dense layer consists of 1024 neurons with ReLU activation, which provides sufficient capacity to model the complex distribution of malware and benign classes.
Dropout regularisation is applied at multiple points within the head to mitigate overfitting, which is a critical consideration given the class augmentation and potential for label noise in malware data. The final classification layer reduces the 1024-dimensional vector to an output of two classes corresponding to the binary classification categories malicious and benign. This is followed by a softmax activation to produce normalised probability distributions over the two classes. The network is trained using a categorical cross-entropy loss function with performance optimised via the Adam optimiser. The separation between the convolutional feature extractor and the dense classifier ensures flexibility for future extensions, including transfer learning, multimodal fusion, or attention mechanisms. This makes the network a robust baseline model for intelligent malware classification. Table 7 presents a summary of the architectural stages along with the corresponding output shapes.

Table 7.
Comprehensive summary of the architectural stages of the proposed model, detailing each layer’s configuration along with the corresponding output shapes to facilitate a clear understanding of the hierarchical structure and dimensional transformations that occur throughout the model network.
4.2. Static Binary Model
Figure 7 illustrates the convolutional blocks of the static model prior to the fully connected layers and after. The convolutional neural network (CNN) architecture developed for static malware analysis was tailored to classify RGB image representations generated from the binary streams of executable files, effectively distinguishing benign from malicious software instances.
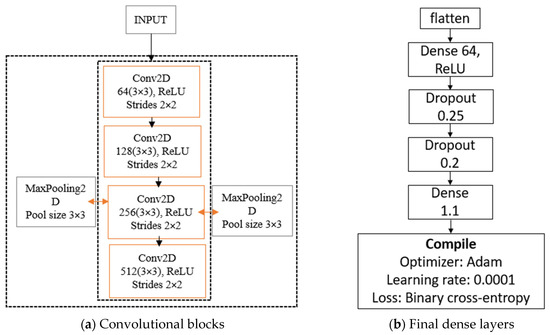
Figure 7.
Structural overview of the convolutional layers in the static malware classification model before and after the transition to fully connected layers.
The model comprises four convolutional blocks. The first block employs 64 filters, while the subsequent three blocks utilise 128, 256, and filters. This design approach was to achieve a balance between model expressiveness and computational efficiency. This configuration was determined empirically to optimise performance and mitigate overfitting. Each convolution operation employs a 3 × 3 kernel with ReLU activation, followed by a 3 × 3 max-pooling layer to progressively downsample the spatial dimensions. A stride of 2 was applied during convolution to further accelerate spatial reduction and enhance training efficiency, particularly considering the relatively simpler structure of the binary-derived images compared to memory-based representations. The resulting two-dimensional feature maps were transformed into a one-dimensional vector using a flattening operation to enable compatibility with subsequent dense layers for classification. This vector was then fed into two successive fully connected layers. To mitigate overfitting, dropout regularisation was applied after each dense layer with rates of 0.25 and 0.2. These dropout values were empirically determined through preliminary hyperparameter tuning.
4.3. Dynamic Memory Dump Model
An additional convolutional neural network (CNN) model was designed to perform classification based on dynamic analysis, utilising RGB images derived from memory dumps collected during software execution within a controlled virtualised environment. These visual representations captured the in-memory behaviour and structural characteristics of the running programs. Given the inherent variability between dynamic and static datasets, this model was independently fine-tuned, while still adhering to the core architectural framework detailed in Section 4.2. Unlike static binary representations, memory dump images exhibited higher structural complexity and noise, necessitating architectural modifications to preserve classification accuracy. As illustrated in Figure 8, the memory-based architecture, similar in structure to the binary model, was composed of three convolutional blocks.

Figure 8.
Dense layers of the dynamic model.
Each block integrated a 3 × 3 convolutional layer, followed by a 2 × 2 max pooling operation, which is slightly smaller than the 3 × 3 pooling used in the binary model. This was to preserve more spatial detail. Dropout layers were incorporated after pooling to mitigate the risk of overfitting. This design supported effective non-linear feature extraction while retaining architectural coherence with the static model. However, unlike the static configuration, which utilised a more conservative filter depth, the memory model implemented a progressively increasing number of filters to accommodate the higher complexity and variability characteristic of memory dump data. Also, the stride parameter was reduced from 2 to 1 to enhance the resolution of spatial features, which was essential for capturing fine-grained behavioural patterns in dynamic contexts. After feature extraction, the resulting output was flattened and subsequently fed into two fully connected layers comprising 64 and 32 units, respectively. Both layers incorporated L2 regularisation (with a coefficient of 0.09) to reduce overfitting by dealing with severely excessively large weights. Dropout layers with rates of 0.4 and 0.3 were inserted between the dense layers. These rates were elevated relative to the static model to address the increased variability and further prevent overfitting. A detailed summary of the architectures for both models with the final parameter values was determined through hyperparameter tuning, as presented in Table 8.

Table 8.
Hyperparameter settings for static vs. dynamic CNN approaches.
5. Results
5.1. Evaluation Metrics
To assess the effectiveness of the convolutional neural network (CNN) models, a comprehensive set of evaluation metrics was employed. These included accuracy, precision, recall, F1-score, and confusion matrices. Among these, accuracy and recall were emphasised due to their critical role in measuring the models’ capability to detect malware accurately while minimising classification errors. In particular, recalls were deemed highly significant, as false negatives instances where malware is misclassified as benign present a greater security threat than false positives. Collectively, these metrics offer a holistic view of each model’s discriminatory power between benign and malicious software instances. The definitions and corresponding formulas for each metric are provided below, along with their relevance to the study.
TP (True Positives): malicious samples correctly identified as malicious. TN (True Negatives): benign samples correctly identified as benign. FP (False Positives): benign samples incorrectly classified as malicious. FN (False Negatives): malicious samples incorrectly classified as benign. To evaluate the classification performance of the proposed model, several standard metrics were employed. Accuracy offers a general indication of the proportion of correct predictions relative to the total number of predictions made, as expressed in Equation (19). While useful, accuracy can be misleading in cases of class imbalance, which is common in malware datasets. Precision assesses the proportion of instances predicted as malicious that are truly malicious, providing insight into the model’s ability to minimise false alarms, which is an important consideration in malware detection tasks, as defined in Equation (20). Recall, also known as sensitivity, quantifies the proportion of actual malicious samples that the model correctly identifies. This metric highlights the model’s capacity to detect true threats, as expressed in Equation (21). To account for the trade-off between precision and recall, the F1-score is employed. This harmonic mean provides a single measure of the model’s balance between detecting malware and avoiding false positives, particularly relevant in imbalanced classification settings. The F1-score is calculated as expressed in Equation (22).
5.2. Binary Streams
The static CNN model exhibited robust classification performance on the test dataset, attaining an overall accuracy of 0.9945 (99.45%) and a recall of 1.00, as illustrated in Figure 9. The confusion matrix, as illustrated in Figure 10, summarises the performance of a binary classification model distinguishing between Benign and Malicious classes. The classifier demonstrates exceptionally high accuracy, with most predictions falling on the diagonal of the confusion matrix. This result, while impressive, was not interpreted in isolation, especially in a security-sensitive domain, such as malware, where false positives and false negatives carry different consequences; the sensitivity for both Malicious and Benign classes was calculated as well. The static CNN model achieves 0.9933 (99.33%) sensitivity for the Malicious class. High recall indicates that our model is highly effective at identifying malicious samples and reducing the likelihood of malware bypassing detection. A specificity of 0.9957 (99.57%) for benign samples was achieved by the static model, suggesting that benign samples are rarely misclassified as malicious. This is crucial to minimise disruption to legitimate users or applications in real-time detection. The model achieves a precision (Malicious class) of 0.9957 and an F1-score of 0.9945. This reflects a low false positive rate in minimising unnecessary alerts. The metrices values reflect the model’s consistent ability to accurately differentiate between classes across various threshold values. The learning curves in Figure 11 reveal that both training and validation accuracies remain consistently high throughout the training process, with no observable signs of overfitting. The corresponding loss curves further support this by showing a smooth and stable convergence over 46 epochs. Collectively, these findings confirm the strong classification performance of the static CNN model in effectively distinguishing between benign and malicious files with minimal misclassification.
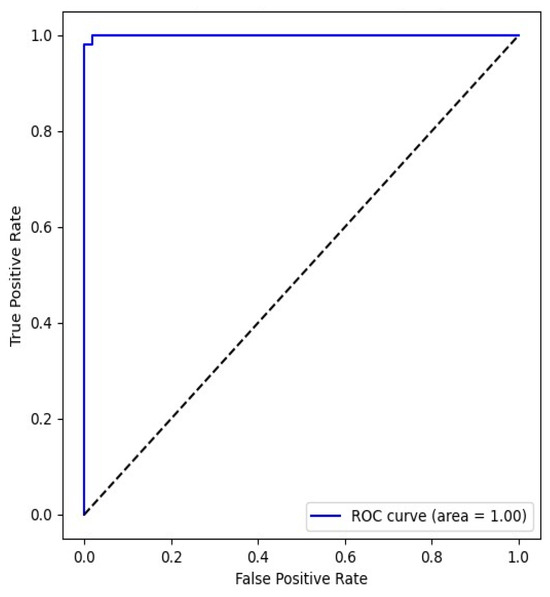
Figure 9.
Static model receiver operating characteristic (ROC) curve.
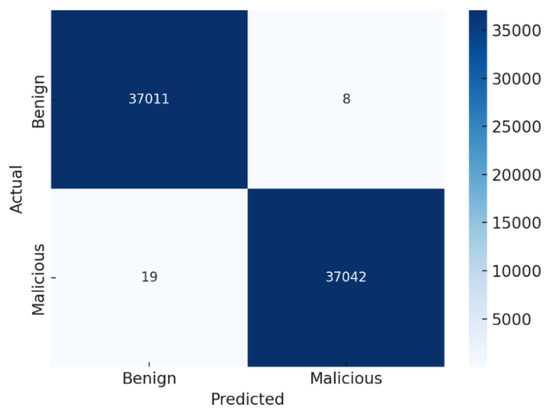
Figure 10.
Static model’s confusion matrix.
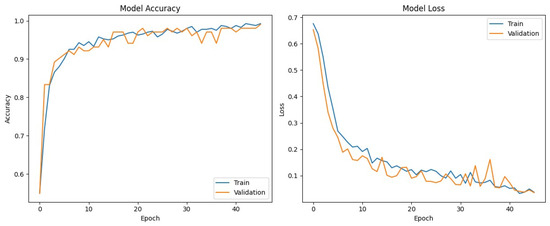
Figure 11.
Training and validation performance trends of the static model over successive epochs.
While the static model performance is exceptionally strong across all major metrics, a deeper inspection is warranted for real-world deployment benefit. It is observed that out of the 74,080 samples, a low false positive rate of 8 was recorded, ensuring that benign applications are not flagged unnecessarily, which is crucial in enterprise environments. Also, a moderate FN of 19 was recorded by the model. Although small in absolute terms, these instances represent malicious samples that evaded detection. In security contexts, even a small number of undetected threats can lead to significant vulnerabilities or breaches. This is especially critical when scaled to millions of samples in a deployment. Several underlying factors may contribute to the 19 false negatives observed. Malicious instances may exhibit feature distributions similar to benign samples. In this sample, there could be polymorphic malware that might mimic benign behaviour to evade detection, leading the model to misclassify them due to overlapping patterns in the feature space. However, since FN < 0.1%, this model is robust enough to be deployed in compliance-driven industries for industry best practice.
5.3. Memory Dump
The convolutional neural network (CNN) trained on the dynamic (memory dump) dataset demonstrated strong classification performance, achieving an overall accuracy of 99.21%, recall of 97.9%, and F1-score of 99.21%, as illustrated in the confusion matrix in Figure 12. The low false positive rate is particularly critical in real-world deployment scenarios, where erroneously classifying benign software as malicious can result in unnecessary operational disruptions and administrative overhead. The use of augmented attributes potentially derived through feature engineering techniques such as entropy analysis, opcode frequency transformation, and memory pattern abstraction contributed to enhanced separability between the two classes. This augmentation enabled the dynamic model to learn more discriminative features, leading to tighter decision boundaries.
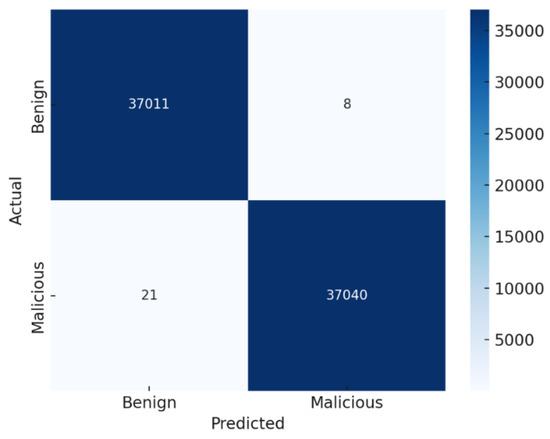
Figure 12.
Dynamic (memory dump) data confusion matrix.
While accuracy remains high, the marginal reduction in recall for the Malicious class relative to the static model suggests a minor decline in the model’s sensitivity to certain malware variants. This degradation, though numerically small, is of particular concern in threat detection contexts, where even a few undetected malicious instances can have significant operational and security implications. The presence of false negatives in the dynamic environment may stem from temporal variability in runtime behaviour or insufficient generalisation over memory state features. The model has a high precision for the Malicious class, indicating a minimal false positive rate and strong reliability in positively identified threats. However, the precision achieved in the dynamic model is lower by 0.0157 compared to the static model. To further evaluate the discriminatory power of the proposed CNN model, a Receiver Operating Characteristic (ROC) analysis was conducted. The resulting Area Under the Curve (AUC) of 0.98 demonstrates near-optimal performance, indicating the model’s exceptional ability to distinguish between benign and malicious samples across varying classification thresholds, as illustrated in Figure 13.
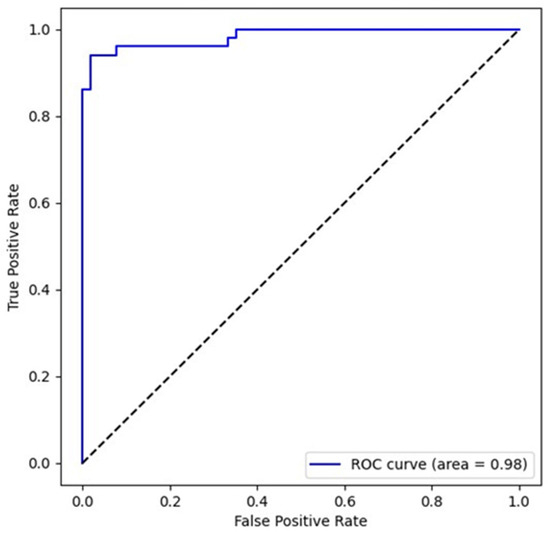
Figure 13.
Receiver operating characteristic (ROC) curve for the CNN model trained on dynamic (memory dump) data.
The ROC curve, which plots the True Positive Rate (TPR) against the False Positive Rate (FPR) at different decision thresholds, provides a threshold-independent assessment of classifier performance. The achieved AUC of 0.98 places the model within the excellent performance tier, signifying that it correctly ranks a randomly chosen malicious sample higher than a benign one 98% of the time. This high AUC value also complements previously reported metrics, such as recall, precision and F1-score, confirming that the model performs well not only at its fixed classification threshold but also across a range of possible operating points. This is particularly important in security-sensitive applications, where the optimal decision threshold may vary depending on operational constraints, such as prioritising low false negatives in high-risk deployments. Moreover, the convex shape of the ROC curve reflects consistent performance trade-offs between sensitivity and specificity, reinforcing the model’s robustness. The marginal deviation from a perfect AUC is most likely attributable to edge-case samples that exhibit behaviour or characteristics common to both benign and malicious classes. The training dynamics of the CNN model, as depicted in Figure 14, indicate consistent convergence across 34 epochs.
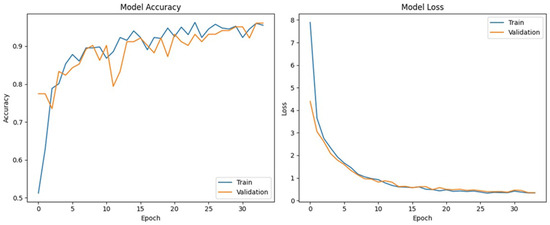
Figure 14.
Training and validation performance trends of the CNN model on the dynamic memory dump dataset. This figure illustrates the convergence behaviour of the convolutional neural network during the training phase on the dynamic (runtime memory) dataset, highlighting the progression of accuracy and loss across training and validation sets. The trends reflect the model’s learning dynamics, stability, and potential generalisation capability over successive epochs.
This is characterised by a monotonic reduction in both training and validation loss, accompanied by a corresponding increase in classification accuracy. The absence of divergence between training and validation curves suggests no observable overfitting. This suggests that the model’s capacity to generalise effectively to previously unseen dynamic samples is high. Despite its overall robustness in classifying memory-based malware, the CNN’s performance on the dynamic dataset exhibited a marginal decline in recall relative to its static counterpart. This slight reduction in sensitivity is likely attributable to the higher temporal and behavioural variability inherent in memory dump data, which may introduce subtle feature ambiguities during runtime. When evaluating the comparative performance of CNN architectures trained on static (binary stream) and dynamic (memory dump) datasets, both models demonstrated strong generalisation capabilities and high overall accuracy. Nevertheless, the static model exhibited consistently superior performance across all key evaluation metrics, suggesting enhanced discriminative power in capturing invariant patterns present in static representations.
5.4. RGB Visualisation
The visual representations illustrated in Figure 15 are categorised based on the hierarchical structure which outlines the dataset organisation and feature mapping taxonomy. The RGB images were derived from binary and memory dumps through a byte-to-pixel encoding. Each byte is linearly mapped across the RGB channels to produce a two-dimensional spatial representation of the executable content. This transformation enables the preservation of local and global binary and memory dump structures within the visual domain.
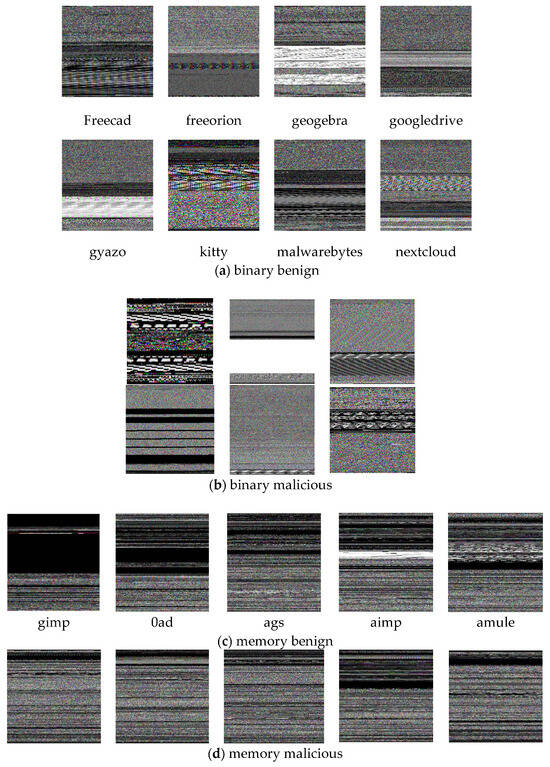
Figure 15.
Visualisation of RGB image transformations derived from distinct dataset modalities: (a) binary representation of a benign sample; (b) binary representation of a malicious sample; (c) memory dump of a benign process; and (d) memory dump of a malicious process. Each image reflects the structural and behavioural differences encoded through byte-to-pixel mapping.
Figure 15a illustrates a diverse set of benign software binaries, including freecad, freeorion, geogebra, googledrive, gyazo, kitty, malwarebytes, and nextcloud. These images exhibit relatively high entropy and heterogeneous textures, reflecting structured compilation and modular code practices typical of legitimate software development. The result shows that the pixel patterns display smoother gradients and multi-tonal distributions, particularly in gyazo and nextcloud. This suggests regularity in the code layout and data sections. The prevalence of colour noise in these images may be attributed to embedded media, GUI libraries, or multilingual resource packs. Figure 15b reveals the RGB-transformed visual characteristics of malicious binaries. In contrast to benign samples, these samples exhibit highly distinctive visual traits, such as sharp contrast blocks, abrupt transitions, and uniform horizontal/vertical striping patterns. For example, the first image in Figure 15b contains repetitive rectangular artefacts that suggest packed or obfuscated code, which is commonly used in malware to evade static analysis. The second sample demonstrates a dominant white block, likely indicating padded sections or alignment artefacts introduced by packers. In addition, it shows reduced visual entropy and heightened structural regularity, pointing to the presence of synthetic code injection and encrypted payloads.
Figure 15c,d illustrate memory dump visualisations of benign and malicious software. The visual patterns provide a structural and behavioural contrast between legitimate applications and malware executing in memory. In Figure 15c, the memory visualisations of benign software reveal high intra-sample variability, yet share a common theme of structured horizontal bands, uniform textures, and clear segment separations. These characteristics suggest systematic memory allocation and modular execution flows, consistent with compiler optimisations and standard operating system routines for legitimate applications. For instance, gimp exhibits a large upper block of uniform black, possibly representing unused memory or zeroed regions, which is common in idle or GUI-intensive applications. These patterns reflect predictable and regulated runtime behaviour for stable benign execution fingerprints. On the other hand, Figure 15c presents more uniform, noisy, and dense textures across the image plane. This indicates highly packed or obfuscated memory regions, often resulting from runtime unpacking, self-modifying code, or the use of encryption. Also, a lack of modularity or segmentation compared to benign samples suggests non-standard memory access patterns and volatile behaviour common in advanced malware variants. The dense pixel streaks observed in some samples point to code injection, API hooking, shellcode execution, or memory scraping which overwrites or manipulates memory for exploitation.
6. Discussion
6.1. Performance Comparison of the Two Models
The experimental results revealed that although both models exhibited strong generalisation capabilities, the static CNN consistently outperformed its dynamic counterpart across all evaluation metrics. The architectural divergence is evident in Figure 16a, where the dynamic model significantly increases its convolutional filter count in the final layer. Meanwhile, Figure 16b shows the dynamic model also employs higher dropout rates, reflecting a more robust regularisation strategy.
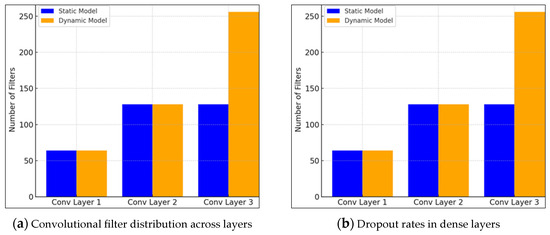
Figure 16.
Dropout rate variations in dense layers between static and dynamic CNN models.
Both models start with similar filter counts in Conv Layer 1, suggesting a comparable initial feature extraction capacity. In Conv Layer 2, both models maintain parity with 128 filters each, indicating a similar depth of feature abstraction at this intermediate stage. However, a marked divergence occurs at Conv Layer 3, where the dynamic model increases its filter count to 256, doubling that of the static model’s 128 filters. This significant increase implies that the dynamic model is designed to capture more complex, high-level feature representations in deeper layers, which is particularly important for analysing dynamic aspects of malware behaviour that may require richer feature hierarchies. The dynamic model consistently employs higher dropout rates than the static model across both dense layers, with 0.40 in Dense Layer 1 and 0.30 in Dense Layer 2, compared to the static model’s 0.20 and 0.25, respectively. The elevated dropout rates in the dynamic model suggest a stronger regularisation strategy, potentially reflecting a need to counterbalance the increased model complexity due to higher filter counts. This approach aims to improve generalisation performance, especially given the variability and noise inherent in dynamic malware features. This implies that the dynamic model’s increased convolutional capacity and stronger dropout regularisation indicate an emphasis on capturing intricate temporal or behavioural patterns of malware while maintaining robustness against overfitting, while the static model, with fewer filters and lower dropout, suggests a simpler, more straightforward feature extraction process optimised for static code analysis where patterns may be less complex but more stable. These differences impact the models’ effectiveness in their respective domains. The dynamic model’s capacity to learn richer feature representations can enhance detection of evasive and polymorphic malware exhibiting behavioural variations, whereas the static model’s leaner architecture may provide faster inference with sufficient accuracy for well-defined static signatures.
The results of this research exhibit strong agreement when compared to previous state-of-the-art findings that achieved an accuracy of 96.38% [43] for the challenge of detecting sophisticated fileless malware, by proposing a novel approach that converts memory dumps of suspicious processes into RGB images. Notably, the static CNN model implemented in this work attained a marginally higher accuracy of 99.45%. However, it is important to highlight that the previous model was trained on a smaller manually curated subset of malware samples derived from the same source dataset. Moreover, the architecture employed here is considerably simpler than the DenseNet framework utilised in the referenced study, indicating that lightweight CNNs can still deliver highly effective performance. Although deeper architectures such as DenseNet may provide advantages when handling more complex datasets, increasing the sample size remains crucial regardless of model complexity, as it enhances generalisation capabilities and enables more robust performance evaluation. For instance, Bozkir et al. [43] achieved an accuracy of 96.39% by applying the Sequential Minimal Optimisation (SMO) algorithm combined with handcrafted GIST and HOG features derived from memory-rendered RGB images.
In contrast, the CNN developed in this work attained comparable accuracy by leveraging a deep learning approach trained directly on pre-processed and augmented memory images, bypassing the necessity for explicit feature extraction. These findings suggest that CNNs provide a robust alternative in malware classification tasks and offer competitive performance alongside enhanced flexibility and reduced reliance on extensive pre-processing. The compared model introduced a novel approach for extracting memory data from malware processes and converting it into RGB image formats suitable for classification tasks. Their technique did not explicitly address scenarios in which malicious software initiates multiple child processes or dynamically modifies its memory usage during execution. In our experiments, numerous samples were found to spawn additional processes at runtime, potentially leading to fragmented memory acquisition. Such fragmentation can result in partial or incomplete representations of dynamic behaviour, thereby limiting the fidelity of the generated memory images. This reduction in behavioural completeness may negatively impact the quality of feature patterns and the performance of convolutional neural network (CNN)-based classifiers.
Shah et al. [44] proposed a computationally efficient approach to grayscale malware classification by integrating a Dual-Stage Discrete Wavelet Transform (DWT) with a modified DenseNet-121 model. The model demonstrates that combining wavelet-based compression with transfer learning enables high-performance detection (98.58% accuracy) while reducing image dimensionality for resource-aware cybersecurity applications. While their study focuses on optimising grayscale image classification through wavelet-based dimensionality reduction and modified pre-trained models, our research highlights the limitations of current dynamic memory capture methods, particularly in handling multi-process behaviours, and demonstrates the need for more comprehensive memory imaging techniques to improve CNN-based malware classification, with dynamic accuracy of 99.21% achieved using a large augmented dataset of 74,080. These results highlight the importance of the dynamic behavioural context in malware detection and demonstrate that enhancing memory capture fidelity can significantly improve the robustness and real-world applicability of image-based malware classifiers. While the models developed in this study exhibited robust performance, several avenues remain for enhancing both their analytical depth and operational coverage. The dynamic memory acquisition approach was constrained to the primary executable process. However, many sophisticated software commonly spawn auxiliary subprocesses or engage in code injection across unrelated processes. Consequently, restricting memory capture to the main process risks overlooking critical behavioural signatures that may reside in ancillary memory regions.
A side-by-side comparison of the two CNN models highlights their relative strengths and limitations. The key results are summarised in Table 9 based on the output observations.

Table 9.
Comparative performance of the static and dynamic models.
6.2. Performance Comparison with Recent RGB Malware Detection Models
Apart from comparison with Bozkir et al. [43], we contextualise our findings against more recent RGB-based malware detection approaches. While our static CNN achieved 99.45% and the dynamic CNN 99.21% accuracy, these results are interpreted relative to differences in dataset scale, image construction pipelines, and backbone complexity reported in contemporary studies.
Liu et al. [45] proposed MRm-DLDet which converts process memory dumps into RGB images and applies a CNN-based detector, achieving 97.3% accuracy. Their work demonstrates the promise of memory-rendered RGB images, but the evaluation was conducted on a smaller, less diverse dataset. In contrast, our models were trained on 74,080 augmented samples, suggesting that improvements in data scale and augmentation can yield higher generalisations without requiring significantly deeper architectures.
Wang et al. [46] fused multiple Android features (DEX files, API calls, and Manifest data) into RGB channels. Although this work confirms the utility of RGB fusion, its scope is limited to static Android applications where structural stability is higher. In contrast, our results emphasise that dynamic memory imaging introduces additional challenges, such as multi-process execution and runtime code injection. These factors are not addressed in static APK pipelines. Similarly to Wang et al. [46], Ashawa et al. [47] reported 99.62% accuracy by converting binaries into images using transformer-based architectures. While their performance marginally exceeds ours, their approach relies on computationally intensive models. This raises concerns about scalability for real-time malware detection. Our findings show that lightweight CNNs when paired with large-scale augmented datasets can reach comparable accuracy with substantially lower complexity to offer a practical trade-off for operational environments.
Robustness against adversarial manipulation has also emerged as a critical dimension in RGB-based malware detection. Du et al. [48] incorporated local histogram equalisation and Gabor filtering into RGB Android malware detection with GhostNetV2. The study reported 97.7% accuracy on benign samples and 92% resilience under adversarial perturbations. This highlights that future research should not only seek marginal accuracy improvements but also evaluate robustness under realistic evasion scenarios. Our dynamic model’s strength lies in its ability to capture behavioural context. However, our study acknowledges that robustness to adversarial variants remains an open challenge, particularly when memory acquisition is restricted to a single process.
Attention-driven architectures such as MAD-ANET and hybrid CNN frameworks [49,50] further illustrate the trend toward integrating spatial attention and generative augmentation to improve classification. While these studies report strong static detection performance, they remain largely untested in dynamic environments with noisy and fragmented memory captures where our experiments highlight the central bottleneck.
7. Conclusions
This study proposes a unified detection framework that leverages both static and dynamic analysis features for malware classification based on RGB image representations. By transforming both binary and memory dump data into visual RGB image formats, our approach effectively bridges the structural and behavioural perspectives of malicious software. The architectural specialisation of the static and dynamic models allowed for domain-specific feature extraction by optimising performance in each analysis context. The extensive use of data augmentation, including CycleGAN-based cross-domain synthesis, significantly expanded the training dataset and contributed to model generalisability. The static model demonstrated exceptional performance, achieving an accuracy of 99.45% and perfect recall, underscoring its precision in detecting structural malware patterns. Meanwhile, the dynamic model achieved a commendable accuracy of 99.21%, despite the inherent noise and variability of memory-based data. These results show the efficacy of multimodal visual learning for detecting both known and evolving malware variants.
The heatmap-based dataset analysis confirms the balanced and diverse composition of both benign and malicious samples, which is an essential factor in ensuring fair and unbiased model training. The complementary nature of the two CNN architectures highlights the practical potential for deployment in layered malware detection systems where static pre-screening is followed by dynamic profiling for ambiguous cases. These findings point to a broader trade-off between representation complexity and dataset completeness, especially in dynamic analysis scenarios where subprocess interactions or incomplete memory acquisition can degrade performance. Unlike previous works relying heavily on handcrafted descriptors or static grayscale transformations, this study demonstrates the viability of direct RGB image conversion from both binaries and memory snapshots by streamlining the pipeline while maintaining high classification accuracy. One of the unique features of the proposed model is its architectural simplicity, which when paired with data augmentation and controlled pre-processing is sufficient for achieving robust malware detection.
While the experimental framework was designed to isolate and compare static and dynamic features under uniform conditions, certain limitations of the proposed model should be noted. The dynamic analysis was constrained to the memory region of the primary process, omitting potential behavioural artefacts arising from spawned child processes or inter-process code injection. This limitation may have led to incomplete behavioural representations. To address this limitation, future work should consider implementing full-system memory dumps or adopting process tree tracing techniques to ensure a more holistic characterisation of runtime behaviour by strengthening the completeness of the dynamic analysis pipeline. In addition, real-time performance optimisation and the incorporation of memory-efficient lightweight CNNs will be explored to enable on-device inference in endpoint protection systems.
Author Contributions
M.A.: Writing—original draft, writing—review and editing, project administration, supervision; R.M.: Data curation, resources, methodology, conceptualisation; N.P.O.: Validation, writing—review and editing; J.O.: Writing—review and editing; J.A.: Writing—review and editing. All authors have read and agreed to the published version of the manuscript.
Funding
This research received no external funding.
Informed Consent Statement
Not applicable.
Data Availability Statement
The data used for this research are included in the article. Other supplementary data can be found at: https://github.com/robert-mcg208/ProjectCNN/ (accessed on 31 May 2025) and https://github.com/robert-mcg208/ProjectBin2png/ (accessed on 31 May 2025).
Conflicts of Interest
The authors declare that they have no conflicts of interest.
Correction Statement
This article has been republished with a minor correction to improve its formatting. This change does not affect the scientific content of the article.
References
- Tounsi, W.; Rais, H. A survey on technical threat intelligence in the age of sophisticated cyber attacks. Comput. Secur. 2018, 72, 212–233. [Google Scholar] [CrossRef]
- Zimba; Chishimba, M. On the economic impact of crypto-ransomware attacks: The state of the art on enterprise systems. Eur. J. Secur. Res. 2019, 4, 3–31. [Google Scholar] [CrossRef]
- Tao, H.; Alam Bhuiyan, Z.; Rahman, A.; Wang, G.; Wang, T.; Ahmed, M.; Li, J. Economic perspective analysis of protecting big data security and privacy. Futur. Gener. Comput. Syst. 2019, 98, 660–671. [Google Scholar] [CrossRef]
- Seng, Y.J.; Cen, T.Y.; Raslan, M.A.H.B.M.; Xin, L.Y.; Kin, S.J.; Long, M.S.; Sindiramutty, S.R. In-Depth Analysis and Countermeasures for Ransomware Attacks: Case Studies and Recommendations. Preprints 2024, 2024082261. [Google Scholar] [CrossRef]
- Thompson, G.R.; Flynn, L.A. Polymorphic malware detection and identification via context-free grammar homomorphism. Bell Labs Tech. J. 2007, 12, 139–147. [Google Scholar] [CrossRef]
- Ashawa, M.; Owoh, N.P.; Riley, J.; Osamor, J.; Hosseinzadeh, S. An Exploration of shared code execution for malware analysis. In Proceedings of the 2024 International Conference on Artificial Intelligence, Computer, Data Sciences and Applications (ACDSA), Mahé Island, Seychelles, 1–2 February 2024; IEEE: Piscataway, NJ, USA, 2024; pp. 1–9. [Google Scholar]
- Luhach, K.; Arpad, J.; Ramesh, K.; Poonia, C.; Gao, X.-Z.; Singh, D. Advances in Intelligent Systems and Computing 1045 First International Conference on Sustainable Technologies for Computational Intelligence Proceedings of ICTSCI 2019. Available online: http://www.springer.com/series/11156 (accessed on 31 May 2025).
- Afianian, A.; Niksefat, S.; Sadeghiyan, B.; Baptiste, D. Malware dynamic analysis evasion techniques: A survey. ACM Comput. Surv. 2019, 52, 1–28. [Google Scholar] [CrossRef]
- Ayub, M.A.; Siraj, A.; Filar, B.; Gupta, M. RWArmor: A static-informed dynamic analysis approach for early detection of cryptographic windows ransomware. Int. J. Inf. Secur. 2024, 23, 533–556. [Google Scholar] [CrossRef]
- Kim, J.-W.; Namgung, J.; Moon, Y.-S.; Choi, M.-J. Experimental Comparison of Machine Learning Models in Malware Packing Detection. Available online: www.virusshare.com (accessed on 23 May 2025).
- Sakshi, J.; Manoj, K.; Vivek, K. A retrospect on different side of captcha techniques. In Proceedings of the 2018 International Conference on Advanced Computation & Telecommunication: ICACAT-2018, Bhopal, India, 28–29 December 2018; IEEE: Piscataway, NJ, USA, 2018. [Google Scholar]
- Islam, R.; Tian, R.; Batten, L.M.; Versteeg, S. Classification of malware based on integrated static and dynamic features. J. Netw. Comput. Appl. 2013, 36, 646–656. [Google Scholar] [CrossRef]
- Ullah, F.; Srivastava, G.; Ullah, S. A malware detection system using a hybrid approach of multi-heads attention-based control flow traces and image visualization. J. Cloud Comput. 2022, 11, 75. [Google Scholar] [CrossRef] [PubMed]
- Akhtar, M.S.; Feng, T. Malware Analysis and Detection Using Machine Learning Algorithms. Symmetry 2022, 14, 2304. [Google Scholar] [CrossRef]
- Habib, A.; Junaid, M.T.; Altoubat, S.; Houri, A.A.L. Physics-based neural networks for the characterization and behavior assessment of construction materials. J. Build. Eng. 2025, 100, 111788. [Google Scholar] [CrossRef]
- Qureshi, S.U.; He, J.; Tunio, S.; Zhu, N.; Nazir, A.; Wajahat, A.; Ullah, F.; Wadud, A. Systematic review of deep learning solutions for malware detection and forensic analysis in IoT. J. King Saud Univ. Comput. Inf. Sci. 2024, 36, 102164. [Google Scholar] [CrossRef]
- Aryal, K.; Gupta, M.; Abdelsalam, M. A Survey on Adversarial Attacks for Malware Analysis. IEEE Access 2021, 13, 428–459. [Google Scholar] [CrossRef]
- Akhtar, M.S.; Feng, T. Evaluation of Machine Learning Algorithms for Malware Detection. Sensors 2023, 23, 946. [Google Scholar] [CrossRef]
- Tekerek, A.; Yapici, M.M. A novel malware classification and augmentation model based on convolutional neural network. Comput. Secur. 2022, 112, 102515. [Google Scholar] [CrossRef]
- Yu, Y.; Cai, B.; Aziz, K.; Wang, X.; Luo, J.; Iqbal, M.S.; Chakrabarti, P.; Chakrabarti, T. Semantic lossless encoded image representation for malware classification. Sci. Rep. 2025, 15, 7997. [Google Scholar] [CrossRef]
- Gyamfi, N.K.; Goranin, N.; Ceponis, D.; Čenys, H.A. Automated System-Level Malware Detection Using Machine Learning: A Comprehensive Review. Appl. Sci. 2023, 13, 11908. [Google Scholar] [CrossRef]
- Sarker, H. Deep Cybersecurity: A Comprehensive Overview from Neural Network and Deep Learning Perspective. SN Comput. Sci. 2021, 2, 154. [Google Scholar] [CrossRef]
- Ahmad, M.; Shabbir, S.; Roy, S.K.; Hong, D.; Wu, X.; Yao, J.; Khan, A.M.; Mazzara, M.; Distefano, S.; Chanussot, J. Hyperspectral Image Classification-Traditional to Deep Models: A Survey for Future Prospects. IEEE J. Sel. Top. Appl. Earth Obs. Remote. Sens. 2022, 15, 968–999. [Google Scholar] [CrossRef]
- Francois, L.; Sonia, C.; Anil, S.; José, M. Technological and human factors of malware attacks: A computer security clinical trial approach. ACM Trans. Priv. Secur. (TOPS) 2018, 21, 1–30. [Google Scholar]
- Gibert, D.; Mateu, C.; Planes, J. The rise of machine learning for detection and classification of malware: Research developments, trends and challenges. J. Netw. Comput. Appl. 2020, 153, 102526. [Google Scholar] [CrossRef]
- He, K.; Kim, D.S. Malware detection with malware images using deep learning techniques. In Proceedings of the 2019 18th IEEE International Conference on Trust, Security and Privacy in Computing and Communications/13th IEEE International Conference on Big Data Science and Engineering, TrustCom/BigDataSE, Rotorua, New Zealand, 5–8 August 2019; Institute of Electrical and Electronics Engineers Inc.: Piscataway, NJ, USA, 2019; pp. 95–102. [Google Scholar] [CrossRef]
- Dharmalaksana, P.S.; Mantoro, T.; Khakim, L.; Nurseno, M. Improved Malware Detection Results using Visualization-Based Detection Techniques ant Convolutional Neural Network. In Proceedings of the 2022 IEEE 8th International Conference on Computing, Engineering and Design, ICCED, Sukabumi, Indonesia, 28–29 July 2022; Institute of Electrical and Electronics Engineers Inc.: Piscataway, NJ, USA, 2022. [Google Scholar] [CrossRef]
- Zhang, D.; Song, Y.; Xiang, Q.; Wang, Y. IMCMK-CNN: A lightweight convolutional neural network with Multi-scale Kernels for Image-based Malware Classification. Alex. Eng. J. 2025, 111, 203–220. [Google Scholar] [CrossRef]
- Cohen, A.; Nissim, N.; Elovici, Y. MalJPEG: Machine Learning Based Solution for the Detection of Malicious JPEG Images. IEEE Access 2020, 8, 19997–20011. [Google Scholar] [CrossRef]
- Azzaz, R.; Jahazi, M.; Kahou, S.E.; Moosavi-Khoonsari, E. Prediction of Final Phosphorus Content of Steel in a Scrap-Based Electric Arc Furnace Using Artificial Neural Networks. Metals 2025, 15, 62. [Google Scholar] [CrossRef]
- Ersan, S.B.; Murat, T.; Ilker, A.; Ahmet, K. Dumpware10: A Dataset for Memory Dump Based Malware Image Recognition. Available online: https://web.cs.hacettepe.edu.tr/~selman/dumpware10/ (accessed on 23 May 2025).
- Bozkir, O.C.M.A.A.S. MaleVis: A Dataset for Vision Based Malware Recognition. Available online: https://web.cs.hacettepe.edu.tr/~selman/malevis/ (accessed on 23 May 2025).
- Ninite-Install or Update Multiple Apps at Once. Available online: https://ninite.com/ (accessed on 31 May 2025).
- WindowsRemix-Free software Installed with a Single Click. Available online: https://www.windowsremix.com/ (accessed on 31 May 2025).
- Vonblohn, K. Centralizing server and workstation provisioning, configuration, and management with foreman and puppet. In Proceedings of the ACM SIGUCCS User Services Conference, Chicago, IL, USA, 25–28 October 2021; Association for Computing Machinery: New York, NY, USA, 2021; pp. 23–25. [Google Scholar] [CrossRef]
- Naeem, H.; Dong, S.; Falana, O.J.; Ullah, F. Development of a deep stacked ensemble with process based volatile memory forensics for platform independent malware detection and classification. Expert Syst. Appl. 2023, 223, 119952. [Google Scholar] [CrossRef]
- Microsoft, ProcDump v11.0. Available online: https://learn.microsoft.com/en-us/sysinternals/downloads/procdump (accessed on 31 May 2025).
- Evan Sultanik, bin2png. Available online: https://www.sultanik.com/ (accessed on 2 June 2025).
- Wang, Q.; Howard, H.R.; Mcmillan, J.M.; Wang, G.; Xu, X. A CNN-based rescaling algorithm and performance analysis for spatial resolution enhancement of Landsat images. Int. J. Remote. Sens. 2022, 43, 607–629. [Google Scholar] [CrossRef]
- Pérez-García, F.; Sparks, R.; Ourselin, S. TorchIO: A Python library for efficient loading, preprocessing, augmentation and patch-based sampling of medical images in deep learning. Comput. Methods Programs Biomed. 2021, 208, 106236. [Google Scholar] [CrossRef]
- Kanumalli, S.S.; Dalavayi, N.; Veernapu, V.; Kota, P.; Katari, R.P. Enhanced Malware Detection using Convolutional Neural Network with Robust Ensemble Algorithm-”LIGHTGBM”. In Proceedings of the 2nd International Conference on Intelligent and Innovative Technologies in Computing, Electrical and Electronics, ICIITCEE, Bengaluru, India, 24–25 January 2024; Institute of Electrical and Electronics Engineers Inc.: Piscataway, NJ, USA, 2024. [Google Scholar] [CrossRef]
- Catak, F.O.; Ahmed, J.; Sahinbas, K.; Khand, Z.H. Data Augmentation based Malware Detection Using Convolutional Neural Networks. PeerJ Comput. Sci. 2021, 7, e346. [Google Scholar] [CrossRef]
- Bozkir, S.; Tahillioglu, E.; Aydos, M.; Kara, I. Catch them alive: A malware detection approach through memory forensics, manifold learning and computer vision. Comput. Secur. 2021, 103, 102166. [Google Scholar] [CrossRef]
- Shah, S.S.H.; Jamil, N.; Khan, A.U.R. Transfer learning with dual-stage discrete wavelet transform for enhanced visual malware image compression and classification. J. Supercomput. 2025, 81, 879. [Google Scholar] [CrossRef]
- Liu, J.; Feng, Y.; Liu, X.; Zhao, J.; Liu, Q. MRm-DLDet: A memory-resident malware detection framework based on memory forensics and deep neural network. Cybersecurity 2023, 6, 21. [Google Scholar] [CrossRef]
- Wang, Z.; Yu, Q.; Yuan, S. Android Malware Detection Based on RGB Images and Multi-feature Fusion. arXiv 2024, arXiv:2408.16555. [Google Scholar] [CrossRef]
- Ashawa, M.; Owoh, N.; Hosseinzadeh, S.; Osamor, J. Enhanced image-based malware classification using transformer-based convolutional neural networks (CNNs). Electronics 2024, 13, 4081. [Google Scholar] [CrossRef]
- Du, Y.; Gao, C.; Chen, X.; Cui, M.; Xu, L.; Ning, A. Mobile malware detection method using improved GhostNetV2 with image enhancement technique. Sci. Rep. 2025, 15, 25019. [Google Scholar] [CrossRef]
- Al-Ghanem, W.K.; Qazi, E.U.H.; Zia, T.; Ahmad, I. MAD-ANET: Malware Detection Using Attention-Based Deep Neural Networks. Comput. Model. Eng. Sci. 2025, 143, 1009–1027. [Google Scholar] [CrossRef]
- Demirkan, E.E. Enhancing Malware Detection via RGB Assembly Visualization. Appl. Sci. 2025, 15, 7163. [Google Scholar] [CrossRef]
Disclaimer/Publisher’s Note: The statements, opinions and data contained in all publications are solely those of the individual author(s) and contributor(s) and not of MDPI and/or the editor(s). MDPI and/or the editor(s) disclaim responsibility for any injury to people or property resulting from any ideas, methods, instructions or products referred to in the content. |
© 2025 by the authors. Licensee MDPI, Basel, Switzerland. This article is an open access article distributed under the terms and conditions of the Creative Commons Attribution (CC BY) license (https://creativecommons.org/licenses/by/4.0/).