Article

Application of the Expectation-Maximization Clustering Method for Identifying Li Geochemical Anomalies in Stream Sediments in Southeastern Hunan Province, China

1
College of Information Engineering, Gan Dong University, Fuzhou 344000, China
2
College of Intelligent Robotics and Advanced Manufacturing, Fudan University, Shanghai 200433, China
3
College of Geo-exploration Science and Technology, Jilin University, Changchun 130026, China
*
Author to whom correspondence should be addressed.
Appl. Sci. 2025, 15(17), 9827; https://doi.org/10.3390/app15179827
Submission received: 31 July 2025 / Revised: 29 August 2025 / Accepted: 5 September 2025 / Published: 8 September 2025

Abstract

The identification of lithium (Li) geochemical anomalies is crucial for the exploration of Li mineral resources. However, variations in lithological backgrounds in lithologically complex regions often hinder the accurate identification of these anomalies. In this study, we employ an unsupervised Expectation-Maximization (EM) clustering algorithm to tackle this issue. Using 1:200,000 scale geochemical data from 2559 stream sediment samples in Chenzhou, Hunan Province, China, we selected seven major elements—SiO2, Al2O3, Fe2O3, MgO, CaO, Na2O, and K2O—as clustering indicators. This approach allowed us to classify the samples into six distinct groups, significantly reducing the influence of lithological background on the detection of Li anomalies. After applying the 3σ technique to eliminate 122 outliers and conducting Z-score normalization on Li concentration data within each group, Li anomalies were identified using a uniform threshold of the mean + two standard deviations. The results indicate that the EM clustering method effectively suppresses pronounced yet spurious anomalies in high-background areas where granitic intrusions are present, accounting for approximately 0.6% of the total study area, while simultaneously uncovering subtle but significant anomalies in low-background regions characterized by slightly metamorphic and siliceous rocks, accounting for approximately 1.7% of the total study area. This approach substantially improves the reliability of anomalies, offering a robust tool for Li exploration in lithologically complex regions.

1. Introduction

Lithium is the lightest metal, characterized by its strong reactivity and reducing properties. It is widely utilized in energy storage, metallurgy, chemical engineering, and various other fields [1,2]. In recent years, the rapid development of the new energy vehicle industry has driven explosive growth in global demand for lithium resources. The exploration of Li resources is becoming increasingly important [3]. Given the current circumstances, it is essential to enhance the accuracy of identifying Li geochemical anomalies and to improve the effectiveness of Li mineral resource exploration. However, many traditional methods for identifying geochemical anomalies have limited accuracy in lithologically complex regions [4]. Consequently, the development of Li anomaly identification technology tailored for these areas has become crucial for overcoming the challenges in Li resource exploration.
In identifying geochemical anomalies within lithologically complex regions, variations in elemental background often present significant challenges [5,6]. Lithium is particularly affected by these issues. It is preferentially enriched in acidic rocks, such as granitic pegmatites and granites, while exhibiting lower concentrations in ultramafic and carbonate rocks [7]. Different rock types generally possess varying background concentrations of Li. Consequently, the identification of Li anomalies is often complicated by variations in elemental or lithological backgrounds, particularly in lithologically complex areas [8,9,10,11,12]. Additionally, due to the inheritance of the chemical composition of the bedrock, similar challenges may arise in identifying Li anomalies in stream sediments and soils. If the common practice of using a uniform background value across the entire region for Li anomaly identification is adopted, two errors may arise. (1) In high-background areas, background samples could be misclassified as anomalous samples, resulting in strong but meaningless geochemical anomalies. (2) In low-background regions, anomalous samples may be incorrectly categorized as background samples, thereby obscuring subtle yet economically significant anomalies [8,9,10,11,12].
To address this limitation, researchers have proposed various methods, including the cumulative probability graph [13], the moving average technique [14,15], the linear regression method [16,17], and the fractal/multifractal method [18,19,20]. These methods offer distinct advantages and tackle the issue of elemental background heterogeneity from diverse perspectives, playing significant roles in the detection of geochemical anomalies. However, these methods share a common characteristic: they only address the problem of fluctuation in elemental background from a peripheral viewpoint, and to some extent, they all possess certain limitations. For example, the cumulative probability graph and fractal techniques estimate local background values by accurately identifying inflection points within related plots, thereby reducing the impact of background variations [13,21]. However, pinpointing these inflection points can be quite challenging. Furthermore, these methods partition geochemical data rather than samples, often complicating the calculation of local background values [8]. The linear regression method explores the linear relationships between ore-forming elements and elements indicative of specific lithologies, effectively eliminating the influence of elemental background fluctuations in anomaly identification. Nevertheless, this approach is not applicable to elements that do not demonstrate a significant linear relationship with the chemical composition of rocks [17]. The moving average technique utilizes virtual windows with variable radii to standardize elemental concentrations and mitigate lithological background effects. However, a significant limitation is the challenge of determining the optimal window size. An excessively large window may not sufficiently suppress lithological background effects, while a window that is too small risks obscuring genuine geochemical variations, potentially masking true anomalies [22].
In recent years, machine and deep learning algorithms, which are capable of addressing complex non-linear problems without stringent data distribution assumptions, have been widely applied in the recognition of geochemical anomalies [23,24,25,26,27]. It is important to note that training supervised learning algorithms (e.g., support vector machines, artificial neural networks, and random forests) for this task necessitates the definition of both anomalous and background training samples, which presents significant challenges for the application of these methods. Unsupervised algorithms, on the other hand, bypass sample selection issues and exhibit robust clustering capabilities, thereby playing a crucial role in addressing the problem of elemental background variation [8,27]. Previous research has suggested that fluctuations in elemental background levels often result from the mixing of (approximately) normally distributed data derived from distinct lithological units [28,29]. Consequently, the issue of element background variation can be framed as a Gaussian Mixture problem [8], which can be addressed using the Expectation-Maximization (EM) algorithm [30], an unsupervised machine learning technique.
Chenzhou, located in the southeastern part of Hunan Province, China, possesses highly favorable geological conditions for Li mineralization. It is home to several significant granite-hosted Li deposits, including Xianghualing [31,32,33], Jiepailing [34], Changchengling [35], and Jijiaoshan, indicating substantial potential for Li resource exploration. Extensive foundational geological research in Chenzhou has generated a wealth of geological and geochemical data. Applying novel methodologies to thoroughly analyze geochemical data and effectively extract information on Li mineralization is of significant importance. This study utilizes regional-scale stream sediment geochemical data at a scale of 1:200,000 from Chenzhou and employs the EM clustering algorithm to reduce the influence of lithological background on the identification of Li anomalies. The aim is to enhance the accuracy of delineating Li anomalies and to provide a reference for identifying Li geochemical anomalies in lithologically complex regions.

2. The Study Area and Samples

2.1. Geological Setting of the Study Area

The study area is situated in the southeastern region of Hunan Province, in central and southern China, covering approximately 10,000 km2. Tectonically, this area lies at the junction of the Yangtze Plate and the Cathaysia Plate (Figure 1a) [36]. The stratigraphic sequence exposed within the study area demonstrates relatively complete coverage, spanning from the Neoproterozoic to the Paleogene, with a notable absence of Ordovician and Silurian strata (Figure 1b). The Neoproterozoic strata, predominantly found in the eastern and southeastern sectors of the study area, are primarily composed of siliceous rock and metamorphic fine-grained sandstone. The Cambrian strata form EW- and NE-trending belts within the Neoproterozoic strata, primarily consisting of slightly metamorphic fine sandstone. The Devonian strata occur as narrow, elongated belts dominated by clastic and carbonate rocks. The Carboniferous strata are well-developed and extensively exposed in the central part of the study area, primarily consisting of limestone and marl. The Permian strata are mainly distributed in the northwest and southwest regions, composed predominantly of siliceous rock and sandstone. The Triassic strata have a limited distribution, primarily consisting of sandstone and shale. The Jurassic strata exhibit overall limited exposure, dominated by siliciclastic rocks. The Cretaceous strata are concentrated in the northern and southwestern parts of the study area, with lithologies predominantly comprising red sandstone and siltstone. The Paleogene strata are restricted to the northwest part of the study area, exhibit minor exposure, and consist mainly of light-colored mudstone and marl.
The study area is situated in a core region where multi-directional tectonic belts converge [38]. It is bordered to the west by the main ridge of the Luoxiao Mountains and to the north by the northern edge of the Nanling tectonic belt. Fault structures are extensively developed within the area, exhibiting a higher density in the west compared with the east (Figure 1b). Predominantly trending NE, these faults transect multiple stratigraphic units and exert significant control over both the distribution of strata and mineralization. The study area is part of the NE-trending tectonic-magmatic belt of the Xiang-Gui Block within the South China Fold System. Intrusive complexes are concentrated in the western, southeastern, and northeastern sectors of the study area (Figure 1b). The western region hosts the largest exposures, primarily composed of Qitianling monzogranite. The southeastern sector is characterized by the Zhuguangshan monzogranite pluton, while the northeastern sector features Caledonian monzogranite. Additionally, scattered Caledonian quartz diorites and Indosinian diorites can be found in the central part of the study area.
Influenced by multiple tectonic and magmatic events during the Caledonian, Indosinian, and Yanshanian periods, the study area hosts a diverse array of mineral deposits [39]. The region is characterized by well-developed fault systems and extensive igneous rock formations, which facilitate the development of numerous skarn-type and hydrothermal vein-type deposits. The principal commodities include Li, W, Pb, Zn, Fe, and Mn. Significant Li mineralization potential is closely associated with granitic intrusions. Key deposits, such as Xianghualing, Jiepailing, Changchengling, and Jiangjunzhai [31,32,33,34,35], primarily occur either within highly fractionated granitic intrusions (e.g., the Qitianling, Xianghualing, and Zhuguangshan intrusions) or along the contact zones between these granitic intrusions and the surrounding Paleozoic carbonate rocks or Mesozoic siliciclastic rocks. Lithium enrichment primarily results from extreme fractional crystallization of granitic melts, which concentrates Li in residual melts or exsolved fluids. Deposits like Xianghualing and Changchengling exemplify this process, where Li is hosted in spodumene, lepidolite, and beryl within pegmatitic phases, greisen zones, or quartz veins directly associated with the granitic intrusions themselves [31,32,35]. The area exhibits a variety of mineralization types, substantial resource endowments, and distinct tectonic controls on mineralization, collectively indicating excellent potential for exploration and development [33].

2.2. Samples and Analysis

The stream sediment samples in the study area were collected during the implementation of the Regional Geochemistry–National Reconnaissance (RGNR) program in China, totaling 2559 samples. The working scale for this project is 1:200,000. To address the challenge of sparse sampling, which may overlook anomalies, versus overly dense sampling that increases the analytical burden, samples were collected at a density of one per square kilometer to ensure the detection of anomaly information. After collection, the samples were air-dried and sieved. Portions exceeding 300 g with particle sizes smaller than 0.85 mm were selected for subsequent analysis. During analysis, four adjacent samples were combined in equal mass to form a composite sample, thereby reducing the analytical workload while maintaining sufficient representativeness. The concentrations of Li and seven major elements, including SiO2, Al2O3, Fe2O3, MgO, CaO, Na2O, and K2O, were determined. The major elements were analyzed using X-ray fluorescence spectrometry (XRF), and Li was quantified using inductively coupled plasma mass spectrometry (ICP-MS). For XRF analysis, ground samples were mixed with H3BO3 and other additives, then pressed into pellets using a tablet press. Before ICP-MS analysis, sample powders were digested with a mixture of HCl, HNO3, HClO4, and HF. All analytical procedures were conducted at the Central Laboratory of the Hunan Geological and Mineral Exploration and Development Bureau. To ensure data quality, National Class I reference materials for stream sediments were inserted at a frequency of 1 per 500 samples. The accuracy and precision of the analytical methods were monitored by calculating the logarithmic difference and the relative standard deviation (RSD) between the mean and standard deviation, respectively. The precision of the major element analyses exceeded 5%, while that of the trace element analyses exceeded 10%, confirming the reliability of the data.

3. Methods

3.1. The EM Clustering Algorithm

Previous research has demonstrated that applying the Expectation-Maximization (EM) clustering algorithm to geochemical samples in complex lithological terrains effectively mitigates lithological background effects and plays a crucial role in distinguishing between geochemical background and anomalies [8,40]. Dempster et al. introduced the EM algorithm in 1977 [30], which is fundamentally an iterative method for decomposing Gaussian Mixture Models (GMMs) and consists of two main steps: the Expectation (E-step) and the Maximization (M-step). The core principle of the algorithm involves maximizing the likelihood of the mixture model parameters, thereby asymptotically converging to the optimal grouping solution. The algorithm was initialized using the k-means++ method to ensure robust and stable starting points. The iteration process continued until the change in log-likelihood between consecutive steps either ceased or was less than a specified threshold [8]. This procedure can be implemented in MATLAB 2023a or Python 3.9. Utilizing geochemical data from stream sediments—specifically, compositional data—the EM clustering algorithm enables the classification of stream sediment samples into various groups. Samples from different groups exhibit distinct chemical composition characteristics, which correspond to different underlying lithologies. Crucially, the EM clustering algorithm autonomously identifies distinct lithological background populations based on the characteristics of geochemical data. This approach eliminates the need for predefined geological units and circumvents the subjectivity and errors inherent in manual subdivision. To mitigate the influence of lithological background variations on Li anomaly identification, this study employs the EM clustering algorithm to differentiate lithological backgrounds within the study area. Subsequently, by utilizing a commonly used geochemical anomaly delineation method, Li geochemical anomalies can be identified from the classification data.

3.2. Data Processing Procedure

(1) The selection of classification indicators for the EM clustering method. Based on the geological characteristics of the study area, several elements were chosen as classification indicators according to the following criteria: (i) minimal association with the mineralization of the study area, and (ii) the ability to reflect the compositional characteristics of the major types of rocks present. Major elements and lithophile trace elements were prioritized, as their concentrations demonstrate significant variations across different lithologies, thereby serving as effective proxies for the regional geological background.
(2) The determination of the optimal number of clusters. Execute the EM clustering algorithm in MATLAB or Python to analyze the concentration data of the selected classification indicators. The preliminary range for the number of clusters (k) into which the stream sediments were clustered was established by integrating the results of the Akaike Information Criterion (AIC) with the lithological conditions of the study area. Through iterative optimization, clusters characterized by insufficient sample sizes or ambiguous geological significance were eliminated, resulting in the identification of the optimal k. Ultimately, the stream sediments in the study area can be classified into k clusters.
(3) Data standardization. For each resulting cluster, the 3σ technique was employed to remove outliers from the Li concentration data. Data points that fell outside the range of [mean − 3 standard deviations, mean + 3 standard deviations] were repeatedly eliminated until no further points could be removed. Subsequently, the robust mean ( μ ) and robust standard deviation ( σ ) were calculated for the remaining data within each cluster. Z-score standardization, represented by the equation Z   =   ( X     μ ) / σ , where X is the original concentration data, was then performed separately for each cluster. This standardization enables the comparison of elemental concentrations across different lithological groups on a unified scale. Finally, the standardized data from all clusters were merged into a single dataset.
(4) Anomaly delineation and interpret. The merged dataset, which minimizes the influence of lithological heterogeneity, facilitates anomaly delineation using a regionally uniform background threshold. In this study, the most commonly employed method—mean plus k times the standard deviation—was utilized to estimate the threshold. The identified anomalies were subsequently subjected to a comprehensive analysis that integrated the geological background, lithological distribution, and structural features of the study area to evaluate their reliability and exploration potential.

4. Results and Discussion

4.1. The Elimination of the Influence of Elemental Background Variations

4.1.1. The Result of EM Clustering

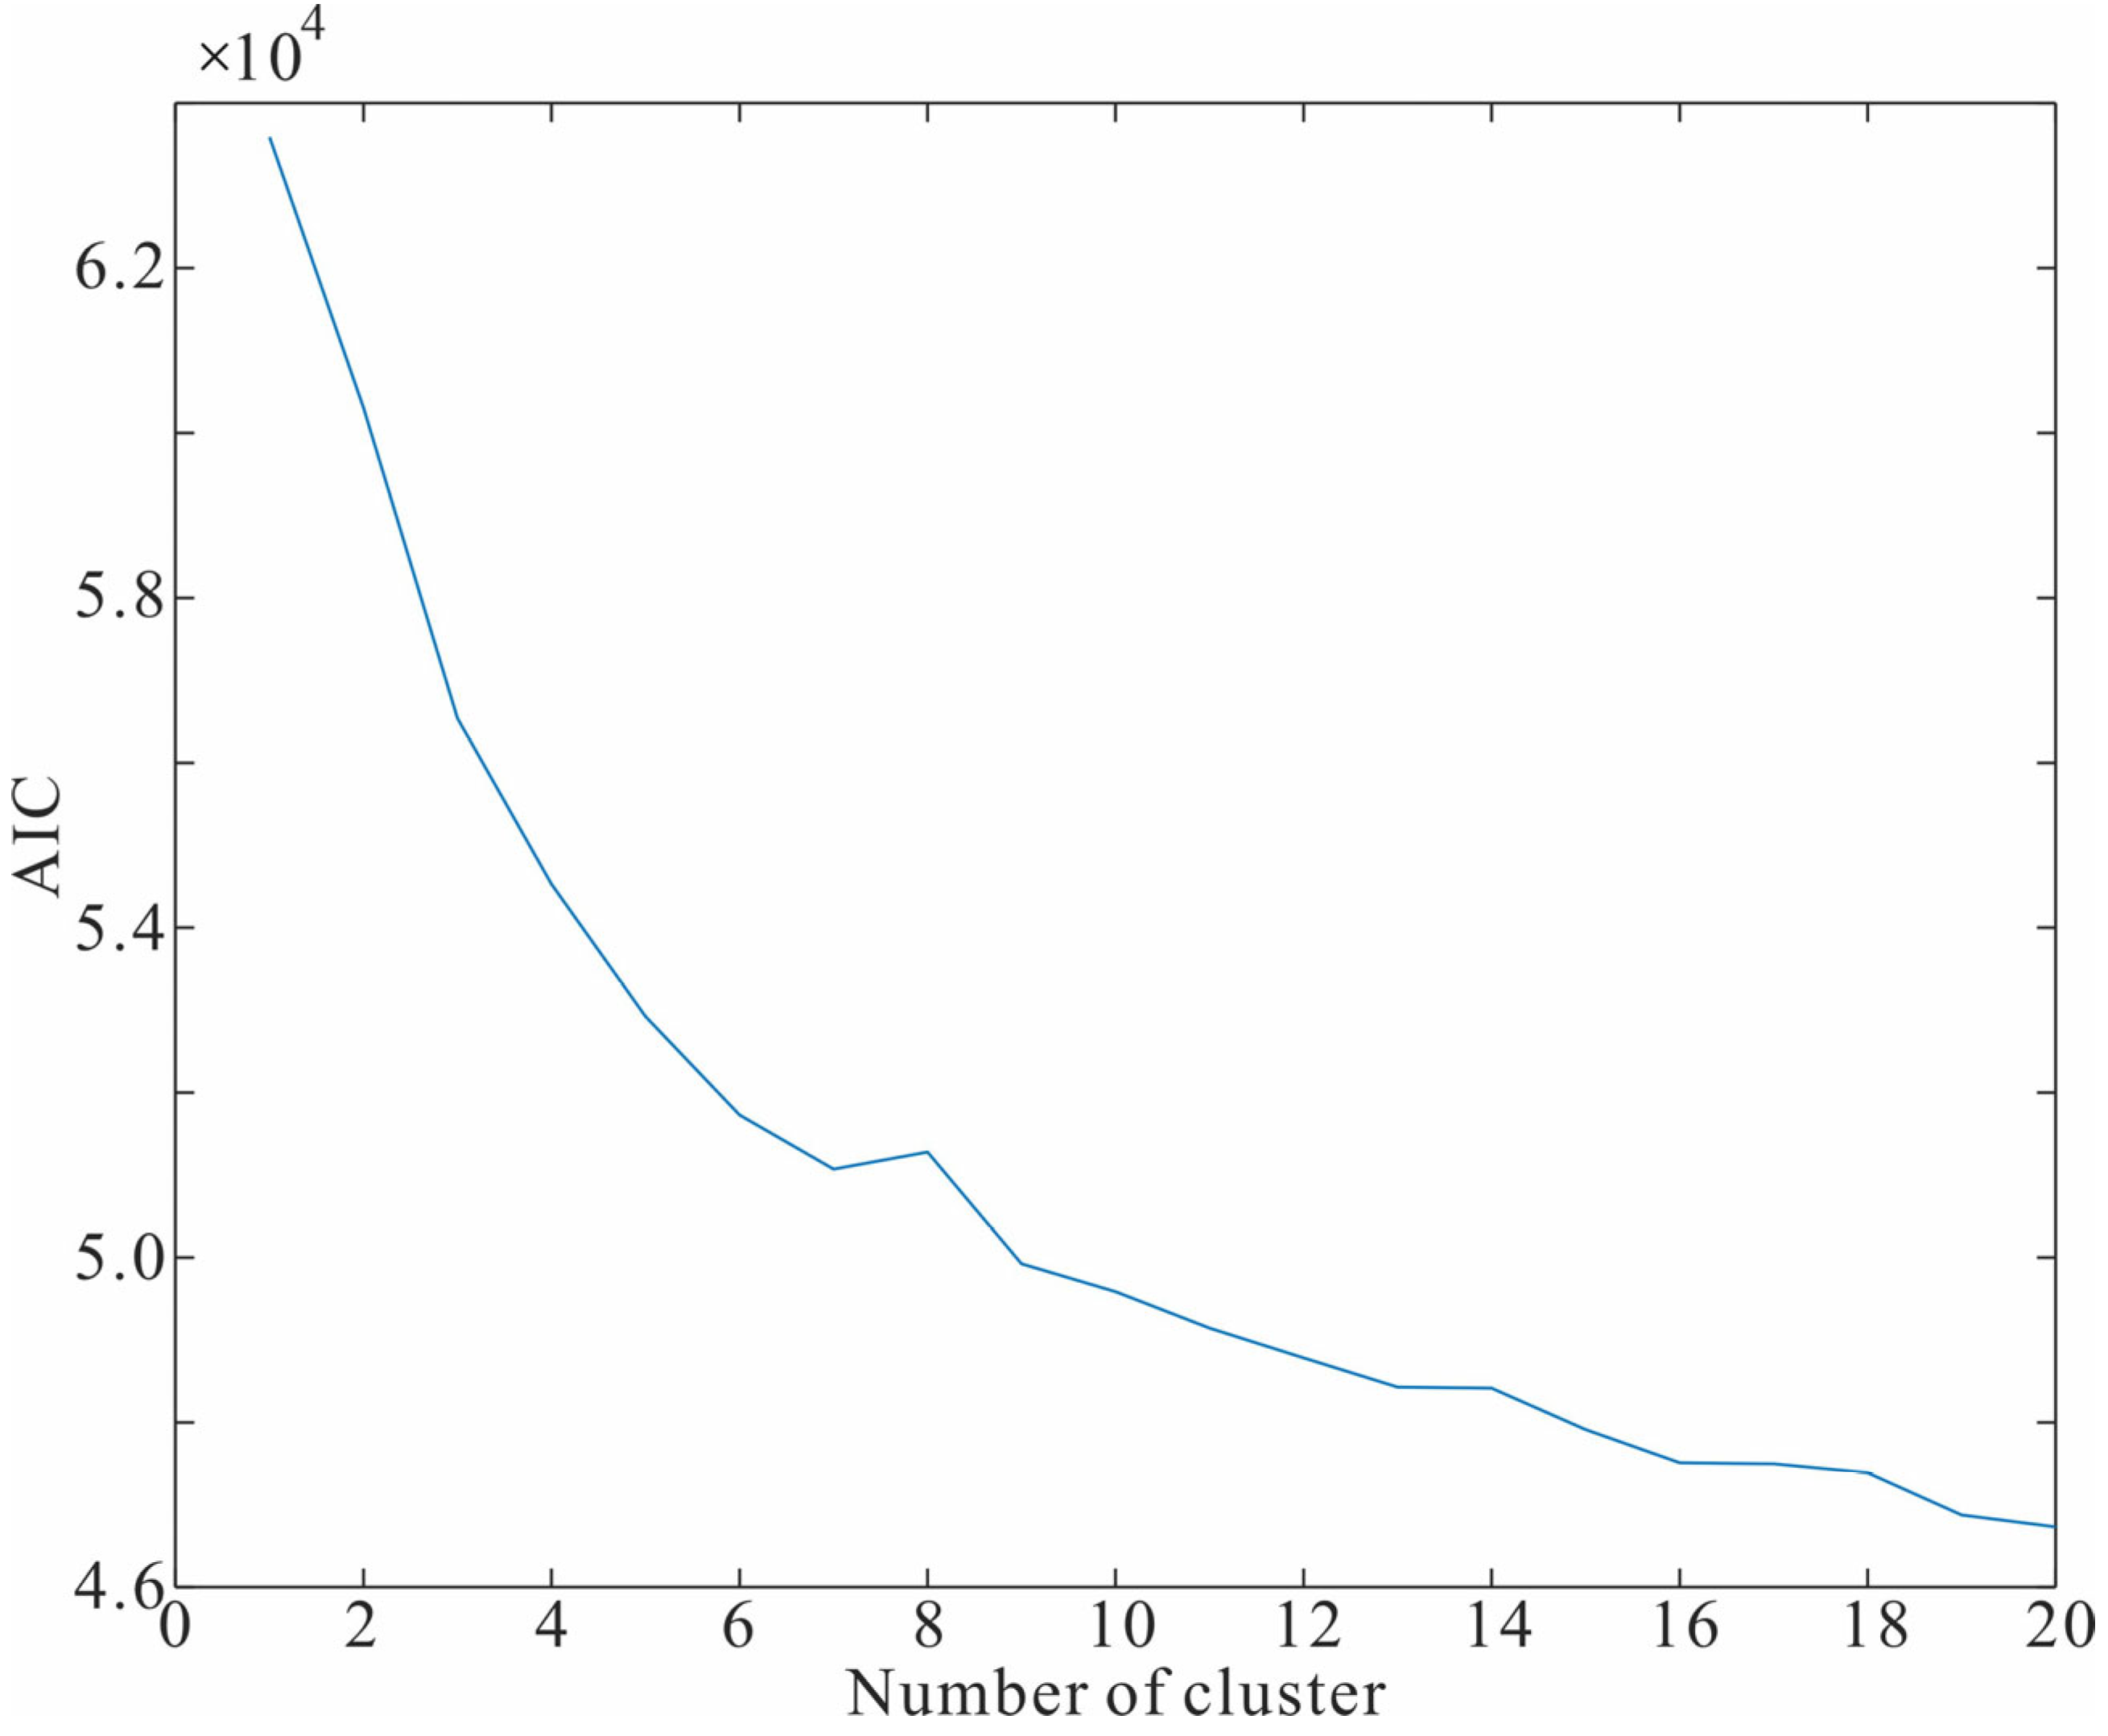
Based on the established criteria for selecting classification indicators [8], seven major elements—Al2O3, CaO, Fe2O3, K2O, MgO, Na2O, and SiO2—were chosen as classification variables. These elements are non-metallogenic and strongly reflect the chemical composition of the primary rock types in the study area. We then utilized the concentration data of these elements to cluster the stream sediment samples into distinct groups. In determining the optimal number of clusters, we thoroughly considered the trends in Akaike Information Criterion (AIC) values alongside the lithological development of the study area. There are primarily six types of rocks present in the study area; therefore, the optimal number of clusters should be six or slightly larger. However, when the number of clusters exceeds six, the decrease in the AIC value becomes negligible (Figure 2). Additionally, in some clusters, the number of samples is too small to meet the requirements for statistical analysis. Consequently, the EM clustering algorithm partitioned all stream sediment samples into six distinct groups, each characterized by unique geochemical signatures.
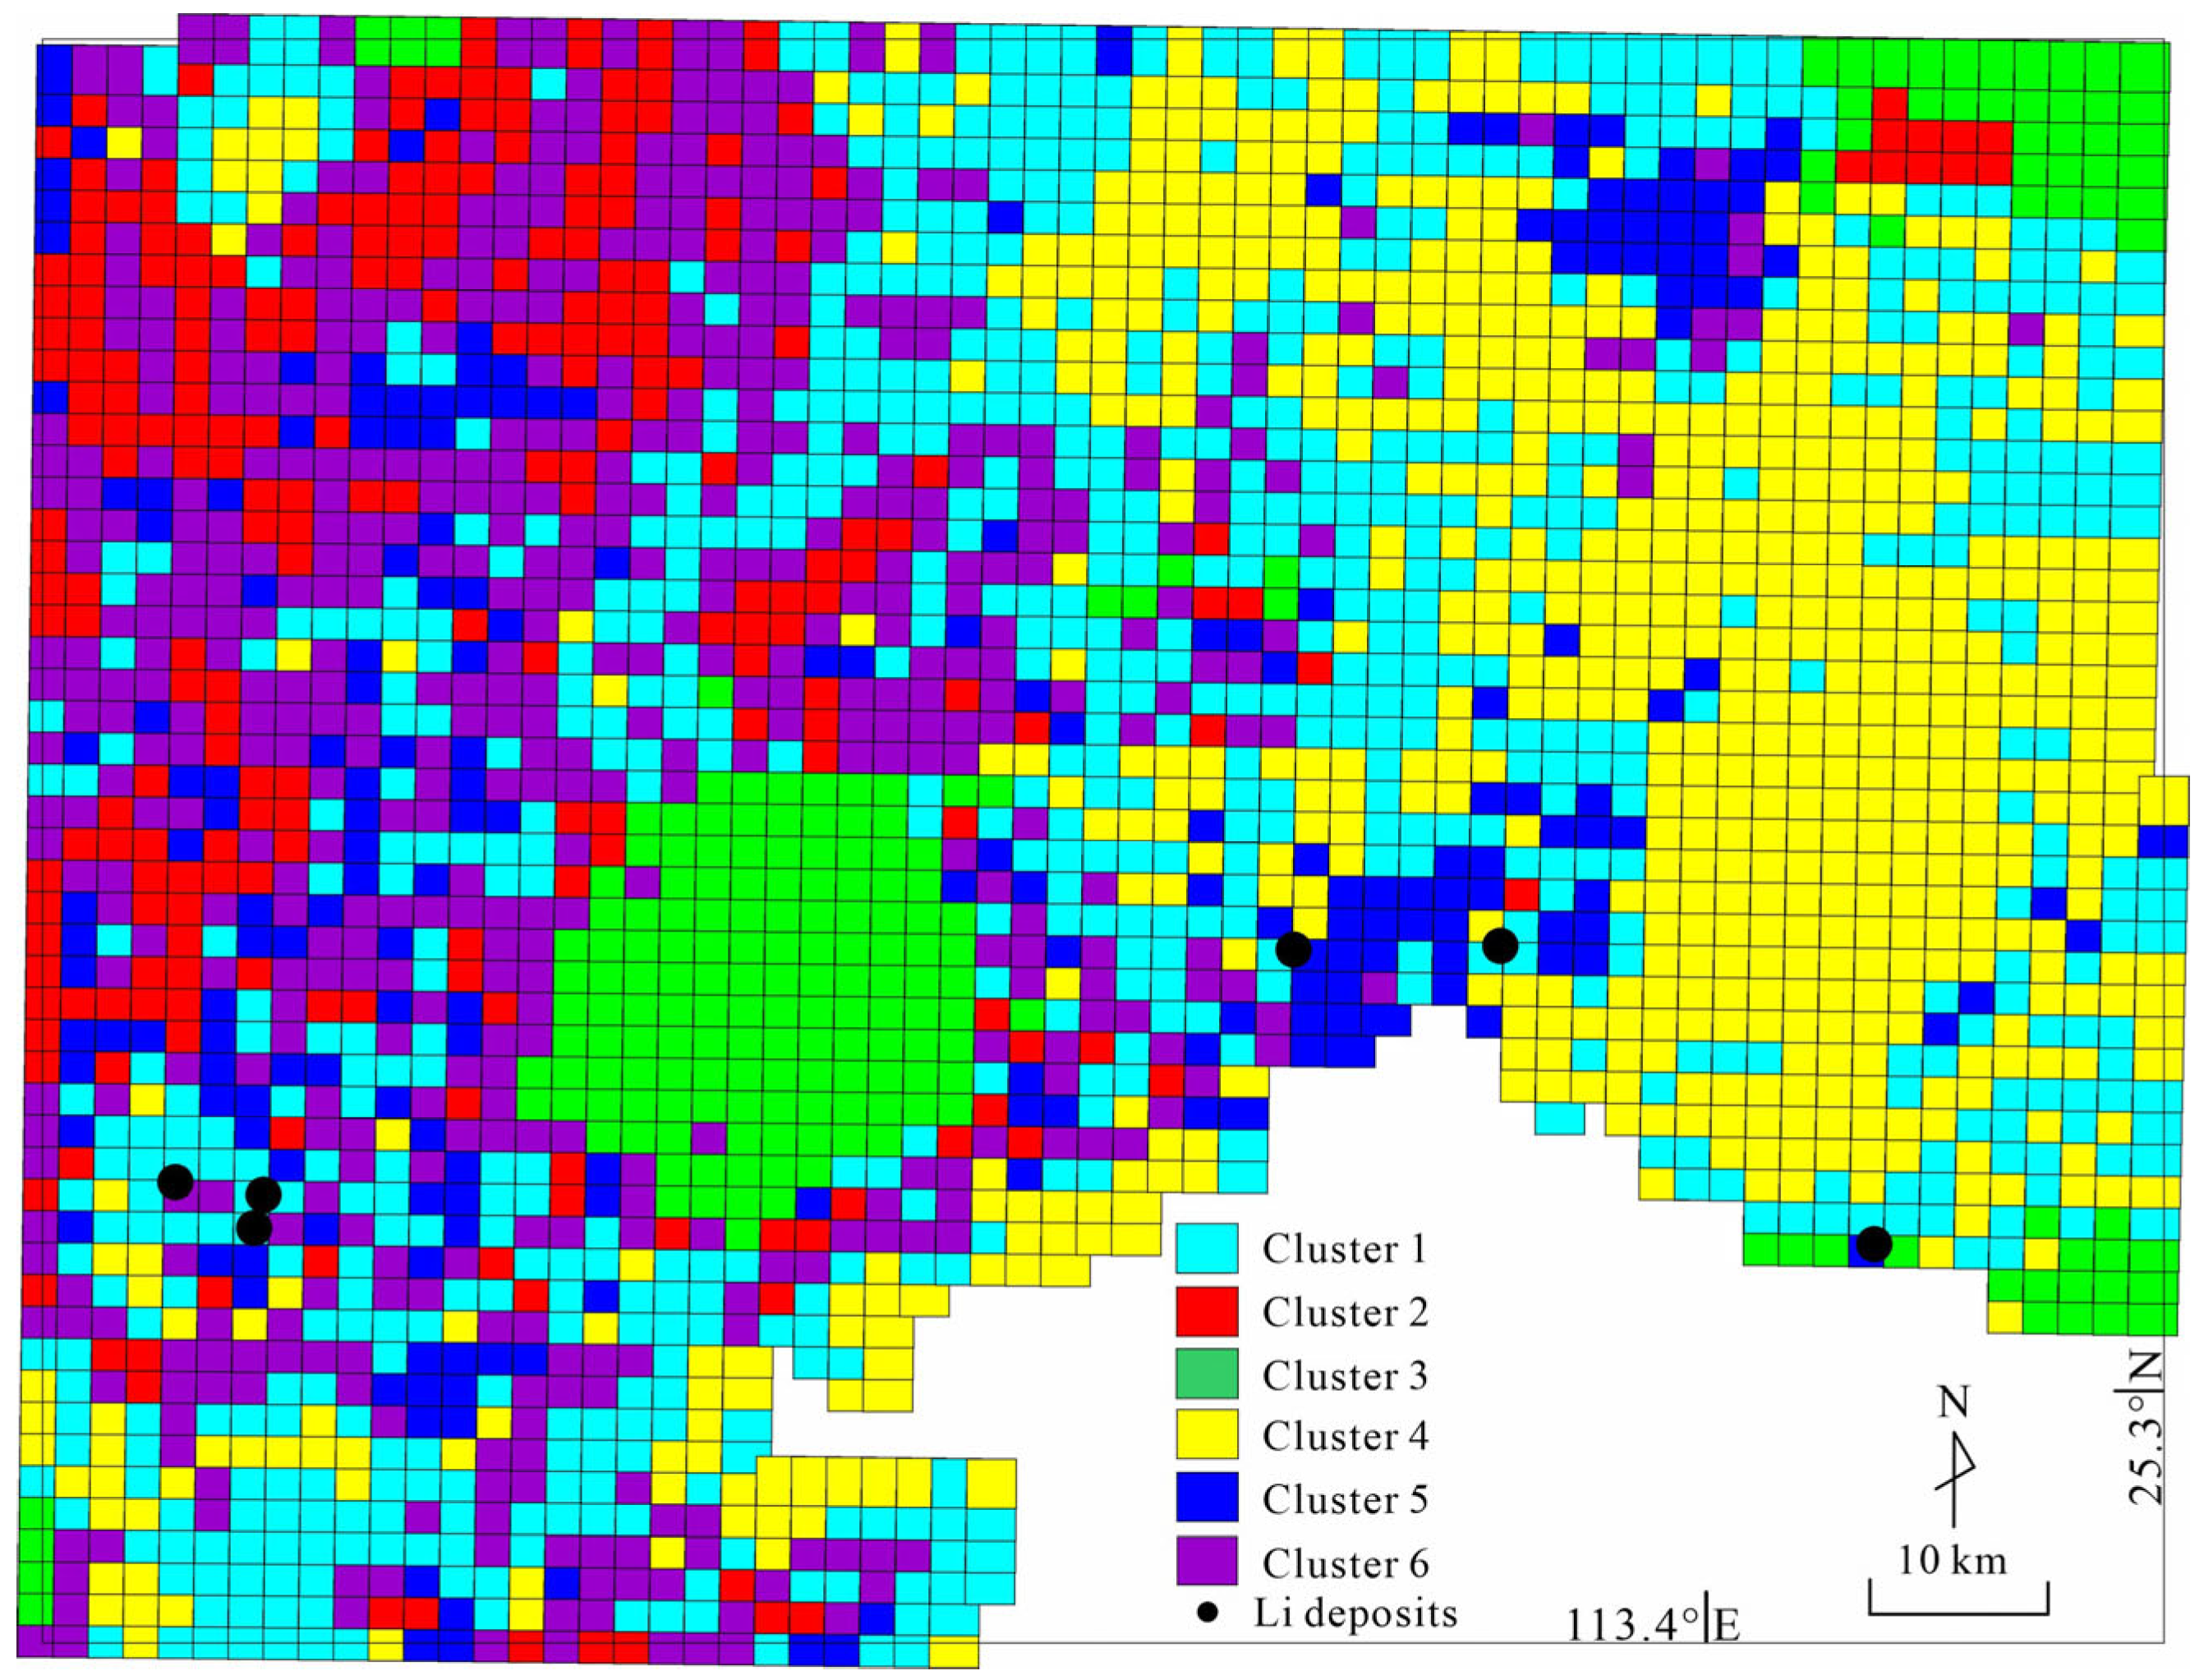
These clusters were visually delineated using color-coding on a spatial distribution map (Figure 3), effectively differentiating the lithological backgrounds within the study area and establishing a solid foundation for subsequent anomaly identification. This approach confirms that oxides are effective indicators for characterizing regional lithological variations. Comparative analysis demonstrated that the clustering results exhibit a strong spatial correspondence with the regional lithological background. Cluster 1 (n = 725), which corresponds to slightly metamorphic fine sandstone, predominates in the central and southwestern regions, with scattered occurrences in the east. Cluster 2 (n = 241), representing shale, exhibits a dispersed distribution pattern across the west and southwest. Cluster 3 (n = 204), associated with monzogranite, is concentrated in the west, northeast, and southeast, with minor occurrences in the southwest that closely align with monzogranite outcrop areas. Cluster 4 (n = 648), identified as siliceous rocks and sandstone, is corroborated by a high SiO2 concentration of 80%. It occupies extensive, contiguous areas primarily in the central and eastern sectors, with minor scattered occurrences in the south. Cluster 5 (n = 218), corresponding to limestone and dolomite, is corroborated by a high CaO content of 6.9%. It is sparsely distributed across the western, central, and northern regions. Cluster 6 (n = 523), mapped to marl, is predominantly located in the central and western regions, with a minimal presence in the east.

4.1.2. The Effect of EM Clustering

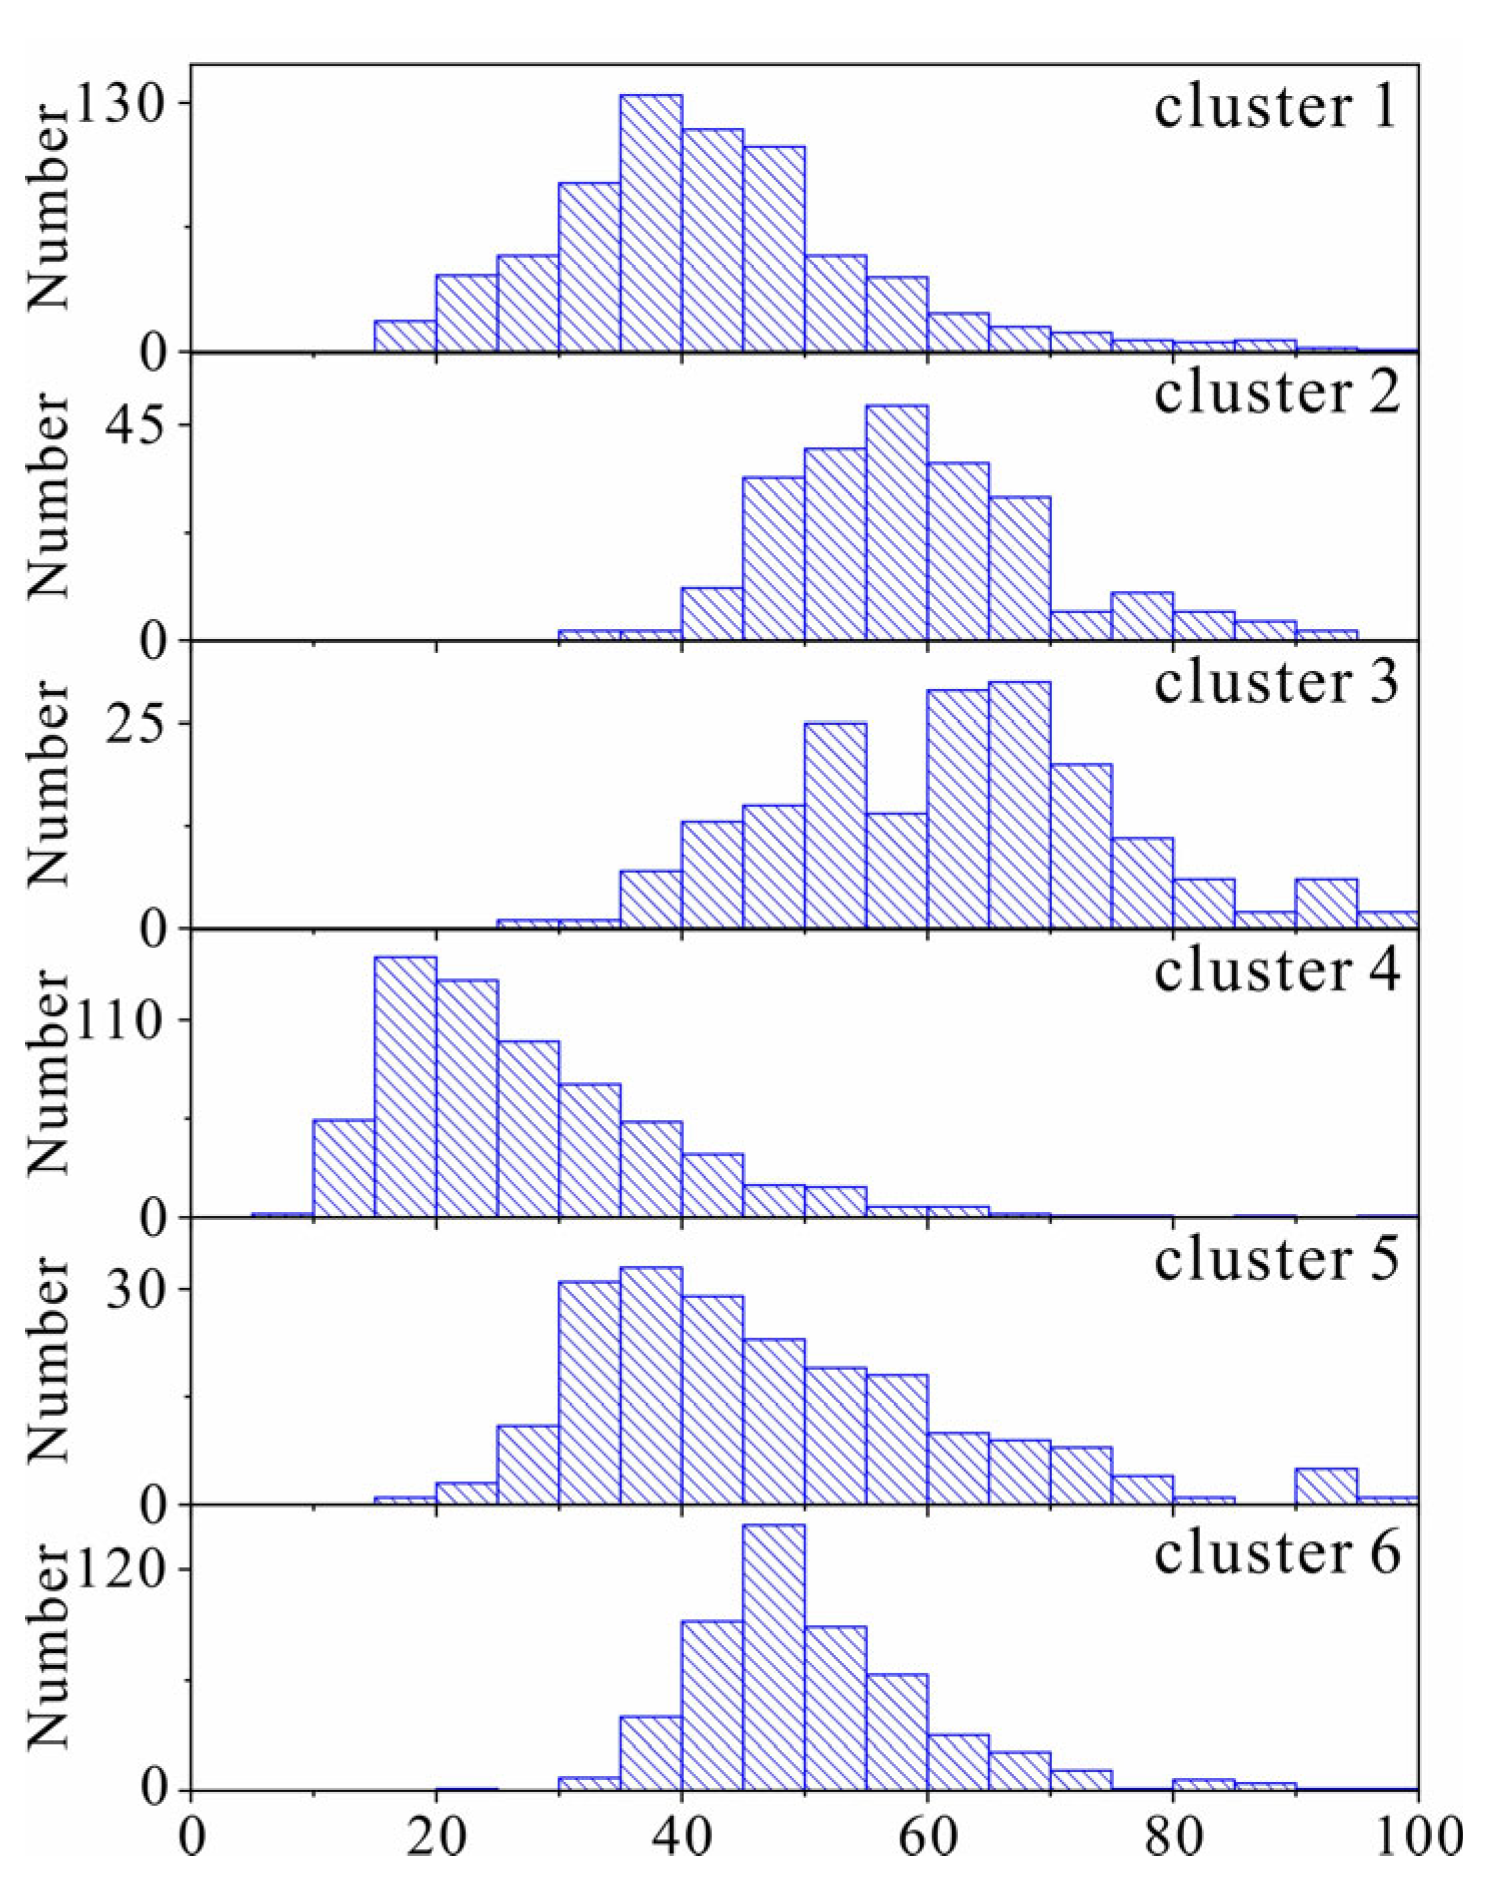
After decomposing the mixed normal distributions, the Li concentration data within each cluster approximates a normal distribution (Figure 4). This distribution pattern validates the effectiveness of the Expectation-Maximization (EM) clustering method in distinguishing distinct lithological backgrounds and provides a statistically sound basis for calculating subsequent anomaly thresholds. The probability distribution curves of Li in the six clusters exhibit some long tails on the right side, reflecting the presence of outliers in the Li concentration data or indicating Li mineralization within each cluster.
The background values of Li for each cluster were calculated as the robust mean after removing outliers using the 3σ technique (Table 1). The results clearly indicate the background variation of Li in the study area. In comparison to the background value derived from the original dataset, Cluster 4 (composed of siliceous rocks and sandstone) exhibits a significantly lower Li background. Clusters 2 (shale) and 3 (monzogranite) demonstrate notable Li enrichment. Clusters 1 (slightly metamorphic fine sandstone), 5 (limestone/dolomite), and 6 (marl) show Li background values that are similar to those of the original dataset. The mean Li concentration in Cluster 4 is 40.4% lower than the regional average, while Clusters 2 and 3 exceed the average by 36.2% and 48.8%, respectively. These findings highlight the significant variations in elemental background across different rock types. Utilizing a single regional background for anomaly delineation would result in substantial deviations. For example, Li’s background in granitic rocks can differ from that in sedimentary rocks by more than threefold. Ignoring such lithologically controlled background heterogeneity critically undermines the reliability of anomaly extraction.

4.2. Li Geochemical Anomalies Based on the Classified Data

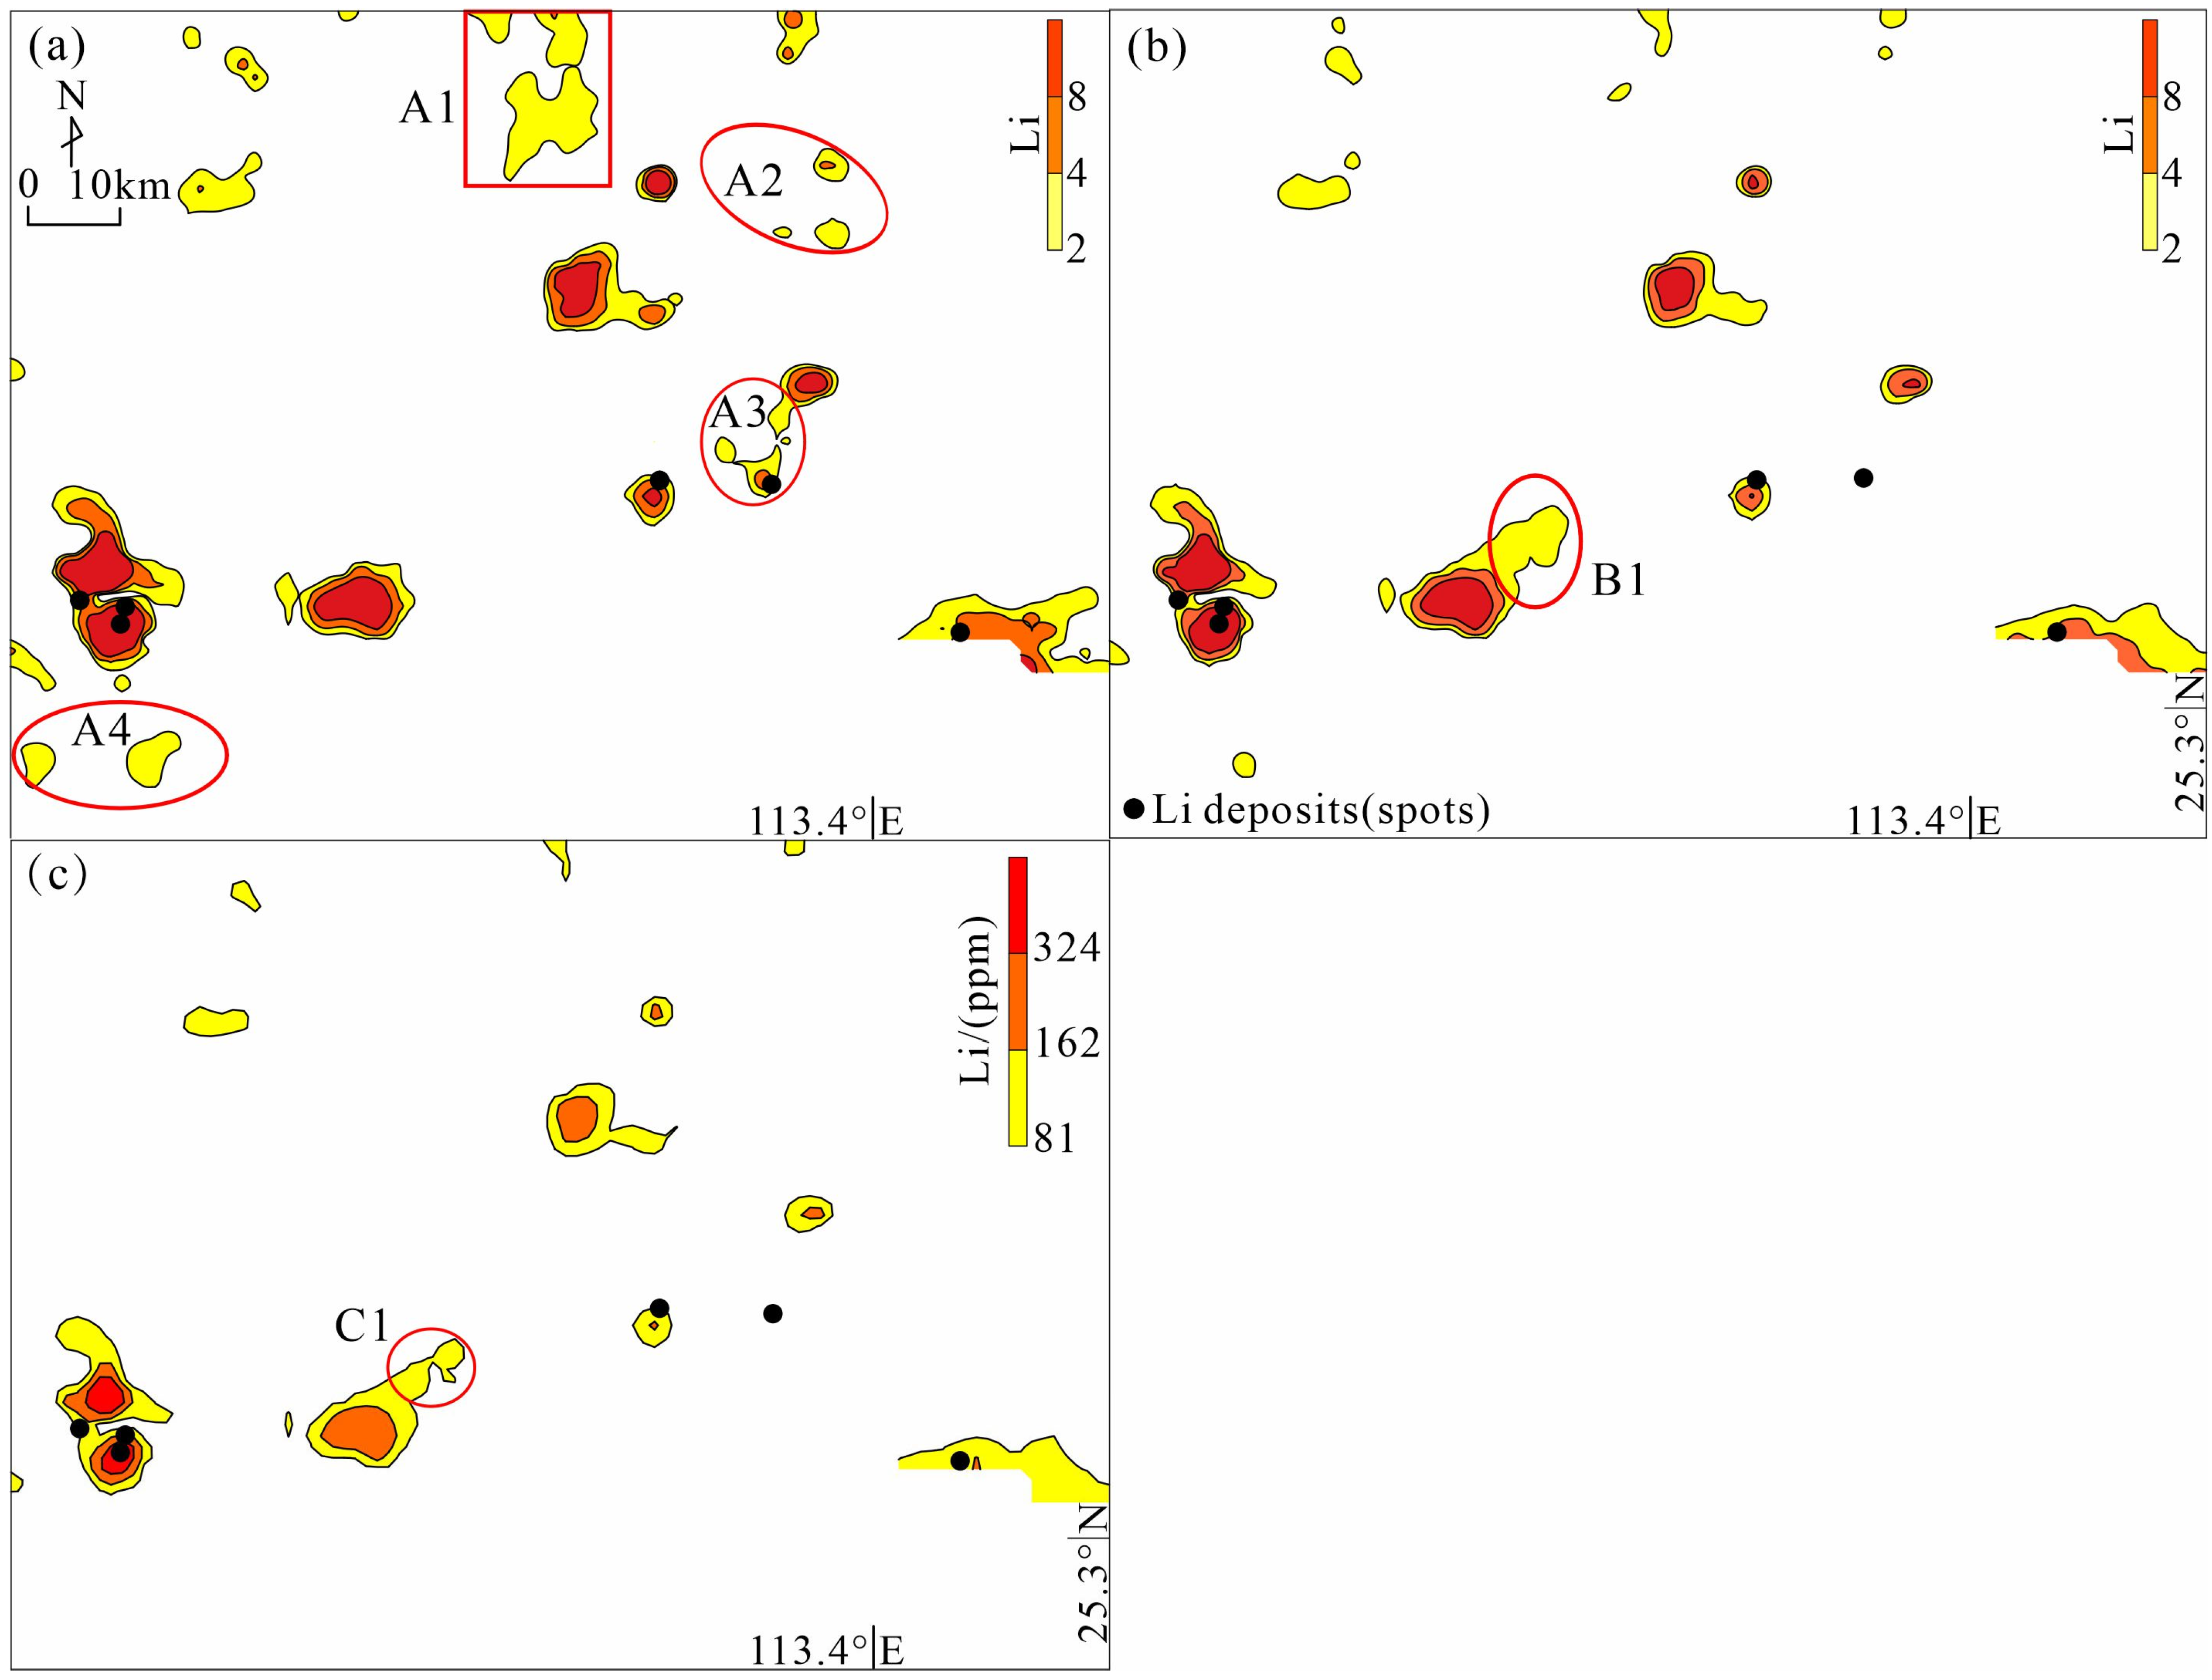
To eliminate inter-cluster background differences and enable unified anomaly detection, data within each cluster underwent Z-score standardization. This process involved first removing outliers, then calculating the robust mean and robust standard deviation of Li in each cluster, and subsequently applying Z-score standardization to the Li concentration data within each cluster. This standardization facilitates direct comparisons across clusters or lithologies. The standardized datasets were then merged. Within this merged dataset, the standardized Li background is centered at 0 with a standard deviation of 1. Anomalies of Li were subsequently delineated using a background threshold of 2, defined as the mean plus 2 times the standard deviation. The 2× and 4× background thresholds were applied to identify moderate and strong anomalies, respectively (Figure 5a).
Most Li anomalies exhibit significant and distinct condensation centers (Figure 5a). These anomalies are predominantly concentrated in the southwestern region of the study area, where the Xianghualing and Qitianling granitic intrusions are located [32,34]; in the southeastern region, where the Zhuguangshan granitic intrusion is situated; and in the central-northern area near the Jurassic granitic intrusion east of Chenzhou. The Xianghualing anomaly is associated with a fold-related syncline underlain by slightly metamorphosed Cambrian fine sandstone. The Qitianling anomaly corresponds to a large Triassic monzogranite intrusion, while the Zhuguangshan anomaly is linked to a Jurassic monzogranite pluton. Overall, these anomalies are typically associated with granitic intrusions and fault-controlled zones.
Notably, attention should also be given to anomalies in the A1, A2, A3, and A4 areas. These anomalies are spatially associated with sedimentary rocks, including sandstone, siliceous rocks, and carbonate rocks. This spatial correlation may suggest the potential for a new type of sedimentary Li mineralization, such as clay-type Li deposits hosted within carbonate rocks or sandstone formations [41,42,43]. The previous research demonstrates that the weathering of carbonate rocks and sandstones can lead to the formation of clay layers, within which Li is adsorbed under reducing sedimentary environments. Alternatively, these anomalies may be linked to deep-seated magmatic intrusions, considering the region’s complex tectonic and magmatic history, as well as the presence of known granite-related Li deposits. These anomalies provide a scientific basis and guidance for subsequent exploration efforts.

4.3. The Effect of EM Clustering on the Identification of Li Anomalies

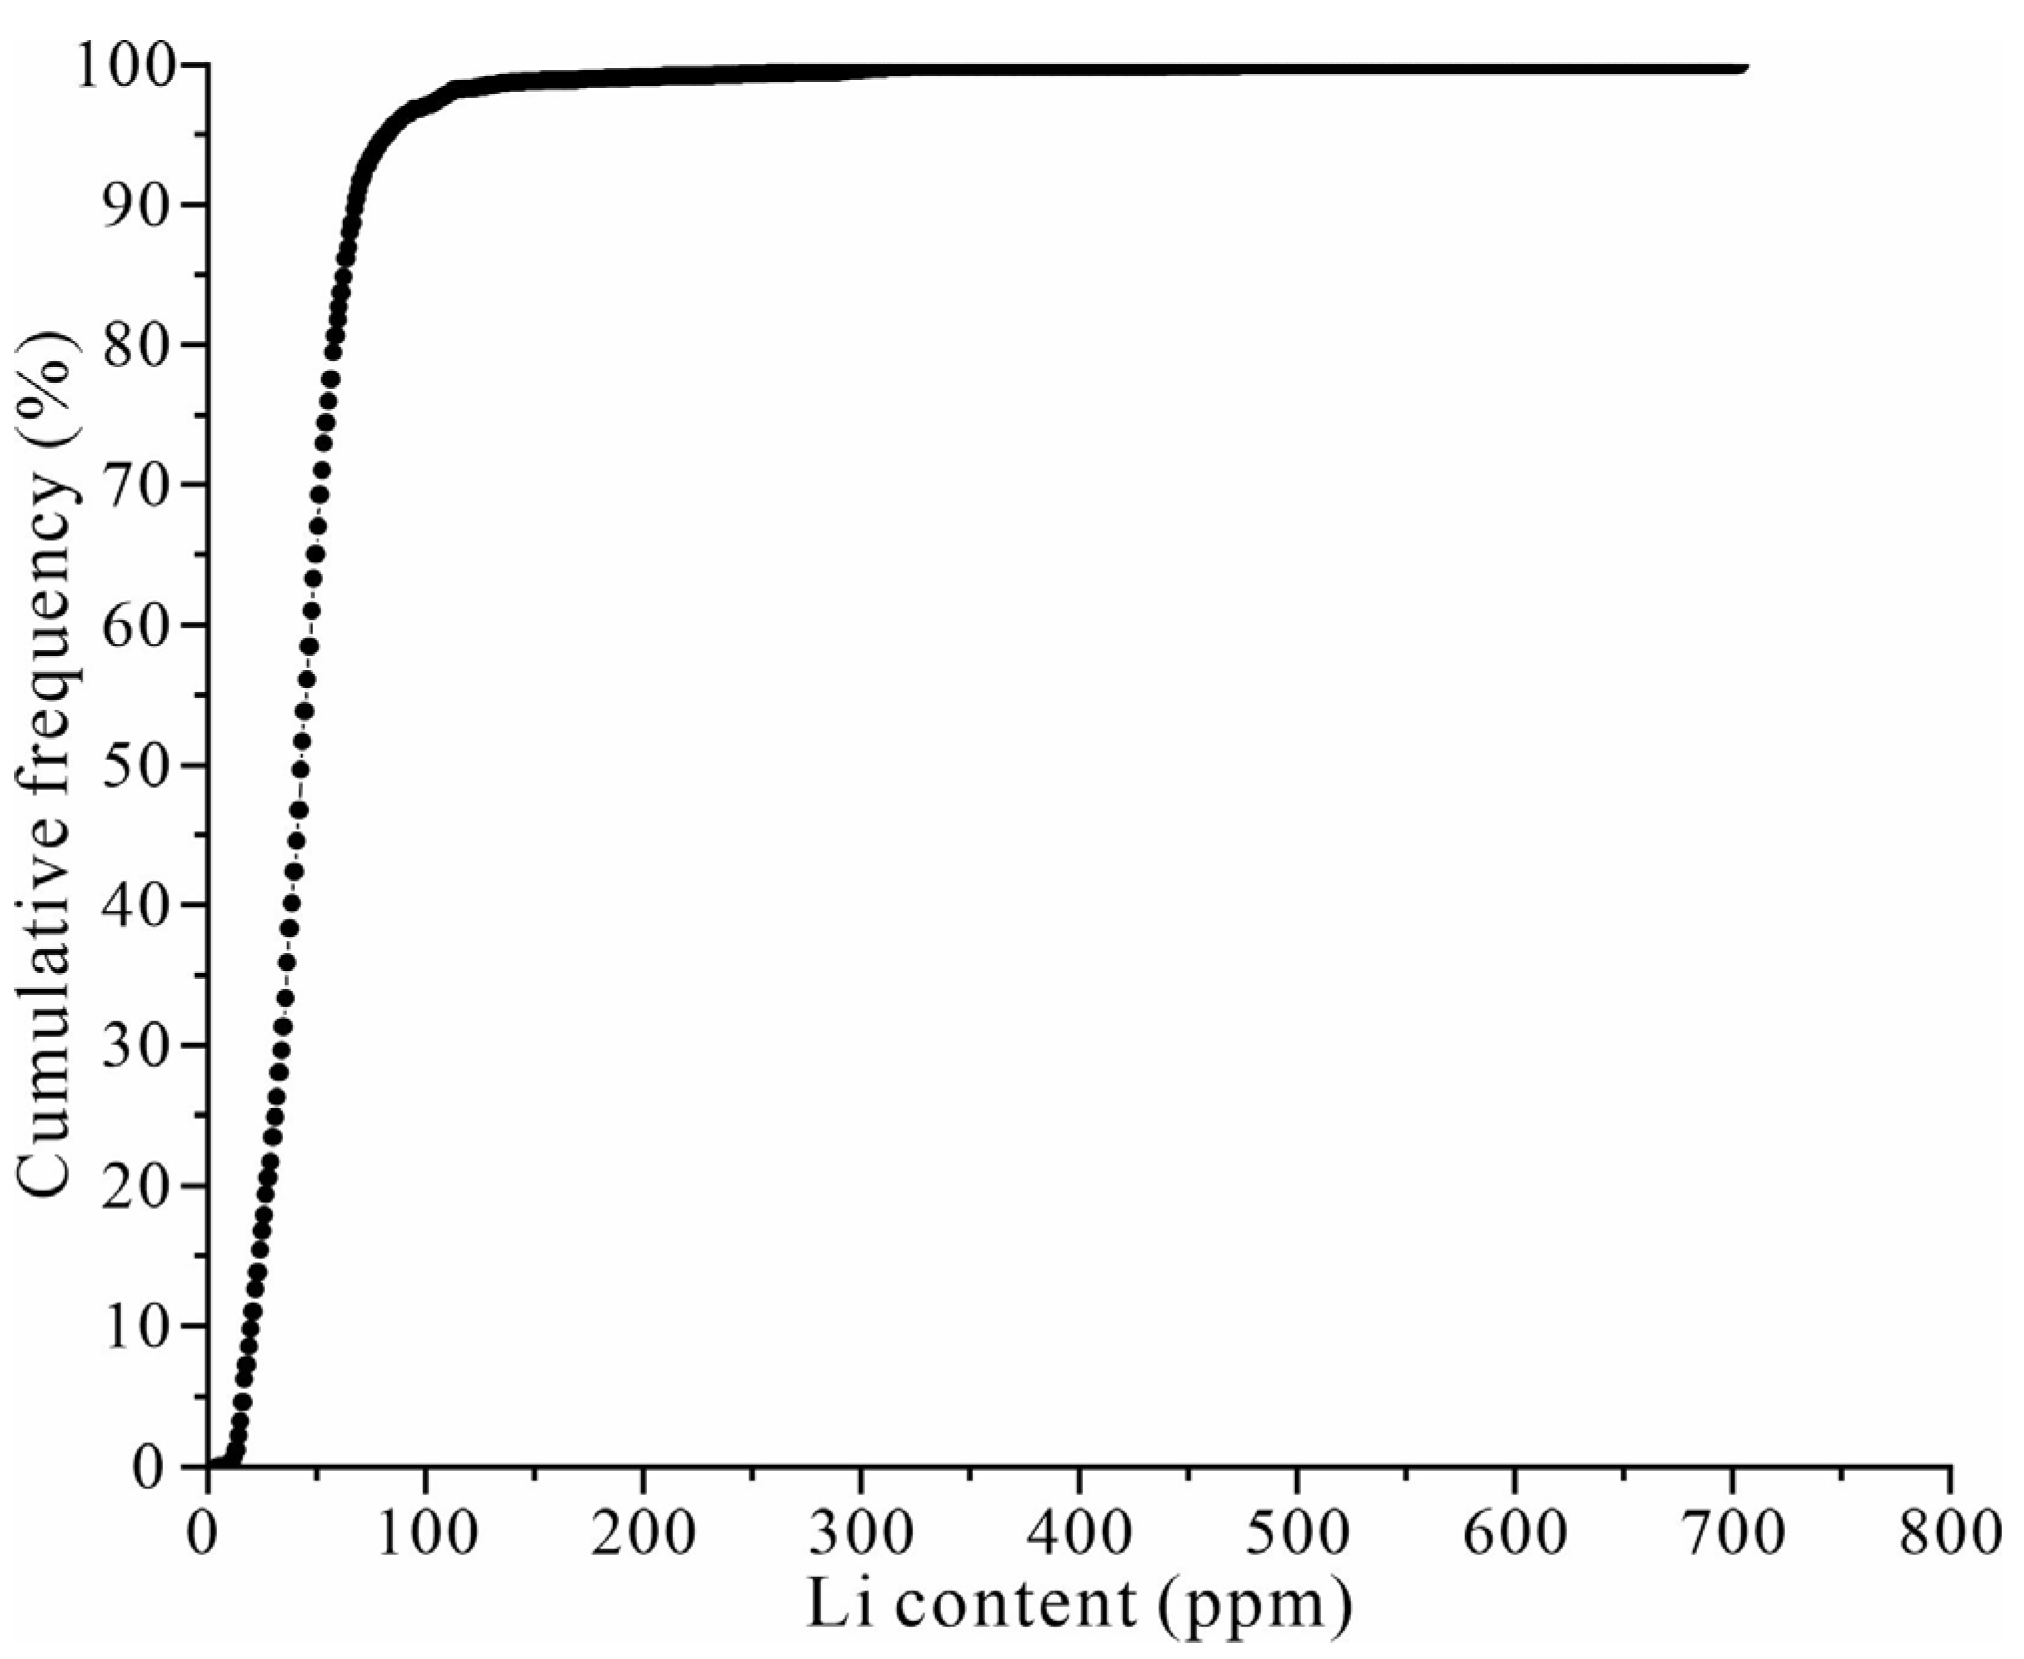
To evaluate the effectiveness of the EM clustering method in identifying Li anomalies, the anomalies detected by this method (Figure 5a) were compared with those identified using the traditional [mean + 2 standard deviations] method and the widely recognized cumulative distribution function (CDF) [44,45,46] (Figure 5b,c). The anomalies in Figure 5b were delineated using the [mean + 2 standard deviations] method, which utilized the original data from the entire region rather than the classified data. The procedure for the CDF method was as follows. First, cumulative distribution plots of Li concentrations were generated. Next, obvious inflection points or slope changes on the CDF curve—typically indicating transitions from one population (background) to another (anomaly)—were identified visually. Based on practical considerations, a specific inflection point was then selected, and its corresponding Li concentration value was used to distinguish background from anomalies. The cumulative distribution curve of Li concentrations in the study area revealed an inflection point at 81 ppm (Figure 6). Multiples of this value (1×, 2×, and 4×) were then used to define weak, moderate, and strong anomalies, respectively. It is evident that the Li anomalies identified by all methods correspond to the known Li deposits (spots) in the southwestern and southeastern parts of the study area (Figure 5), demonstrating the validity of all approaches. However, in identifying the Changchengling and Jiepailing Li deposits located in the central region of the study area, the performance of the EM clustering method surpasses that of both the traditional and CDF methods (Figure 5). Clearly, the traditional and CDF methods are affected by variations in the lithological background.
Not only do these three anomalies exhibit significant differences, but the anomalies identified in other areas by these methods also show notable discrepancies. For example, anomalies within the B1 region detected by the traditional method and those in the C1 region identified by the CDF method were absent from the results of the EM clustering method. Analysis indicates that the anomalies in regions B1 and C1, where granite intrusions are located, are likely spurious, primarily due to the inherently high Li background present in certain rock types. The background Li concentration in the granite corresponding to Cluster 3 is the highest, measuring 63.66 ppm. Importantly, the EM-based method effectively suppressed these false anomalies by separating geochemical compartments.
Meanwhile, the EM-based method identified subtle anomalies in areas A1, A2, A3, and A4, which contain slightly metamorphic and siliceous rocks. These anomalies were not detected by either the traditional method or the CDF method. The primary reason for this oversight is that they are situated in regions with low background values and are obscured by other high-value anomalies during the identification process. For example, the Li background content in siliceous rocks and sandstones corresponding to Cluster 4 is 25.53 ppm, which is less than half of the content found in granite. However, it is important to note that although these anomalies are weak, they are not insignificant. As previously analyzed, these anomalies may have substantial implications for Li exploration. Overall, explicitly accounting for lithological background variations through EM clustering significantly enhances the accuracy and reliability of geochemical anomaly delineation.

5. Conclusions

This study establishes the Expectation-Maximization (EM) clustering algorithm as an effective solution for addressing background variation in the identification of Li geochemical anomalies within the complex geological setting of Chenzhou, Hunan Province, yielding remarkable results. The EM clustering method successfully differentiates lithological backgrounds by grouping stream sediment samples into six spatially coherent clusters using seven major elements as indicators. In comparison to the approach of employing a uniform background value for the entire region, this method suppresses spurious anomalies in high-background zones while revealing credible anomalies in low-background areas that were previously undetected due to lithological dilution effects. The EM algorithm provides a data-driven, unsupervised framework that effectively resolves Gaussian mixture distributions inherent in multi-lithology geochemical data. This approach is broadly applicable to regional mineral exploration in geologically complex terrains, particularly for critical metals such as Li.

Author Contributions

Conceptualization, W.D. and X.Z.; methodology, X.Z.; software, X.Z.; validation, W.D., Q.Z. and X.Z.; formal analysis, Q.Z.; investigation, W.D.; resources, X.Z.; data curation, X.Z.; writing—original draft preparation, W.D. and Q.Z.; writing—review and editing, X.Z.; visualization, Q.Z.; supervision, X.Z.; project administration, W.D.; funding acquisition, W.D. All authors have read and agreed to the published version of the manuscript.

Funding

This research was funded by the Science Foundation of Jiang-Xi Educational Committee (GJJ2403801), the Ph.D. Programs Foundation of Ministry of GanDong College (No. 122000801), and the Hunan Provincial Natural Resources Science and Technology Program Project (20240131DZ).

Institutional Review Board Statement

Not applicable.

Informed Consent Statement

Not applicable.

Data Availability Statement

Data are provided in the article.

Acknowledgments

We would like to express our gratitude to the geochemical exploration workers for their contributions to the collection and analysis of stream sediment samples.

Conflicts of Interest

The authors declare no conflicts of interest.

References

  1. Dai, H.Z.; Wang, D.H.; Liu, S.B.; Li, X.; Wang, C.H.; Sun, Y. New progress in lithium prospecting abroad (2019~2021) and its significance to China’s strategic mining resources exploration. Acta Geol. Sin. 2023, 97, 583–595, (In Chinese with English Abstract). [Google Scholar]
  2. Wang, D.H.; Dai, H.Z.; Liu, S.B.; Wang, C.H.; Yu, Y.; Zhao, Z. Progress in strategic critical minerals exploration and production and proposals for a new round of prospecting in China. Sci. Technol. Rev. 2024, 42, 7–25, (In Chinese with English Abstract). [Google Scholar]
  3. Balaram, V.; Santosh, M.; Satyanarayanan, M.; Srinivas, N.; Gupta, H. Lithium: A Review of Applications, Occurrence, Exploration, Extraction, Recycling, Analysis, and Environmental Impact. Geosci. Front. 2024, 15, 101868. [Google Scholar] [CrossRef]
  4. Wang, X.Q.; Liu, H.L.; Wang, W.; Zhou, J.; Zhang, B.M.; Xu, S.F. Geochemical Abundance and Spatial Distribution of Lithium in China: Implications for Potential Prospects. Acta Geosci. 2020, 41, 797–806. [Google Scholar]
  5. Cheng, Z.Z.; Xie, X.J. Influence of Variation in Element Background Values in Rocks on Metallogenic Prognosis in Geochemical Maps. Geol. China 2006, 33, 411–417, (In Chinese with English Abstract). [Google Scholar]
  6. Chi, Q.H.; Yan, M.C. Handbook of Elemental Abundance for Applied Geochemistry; Geological Publishing House: Beijing, China, 2007. (In Chinese) [Google Scholar]
  7. Horstman, E.L.V.C. The Distribution of Lithium, Rubidium and Caesium in Igneous and Sedimentary Rocks. Geochim. Cosmochim. Acta 1957, 12, 1–28. [Google Scholar] [CrossRef]
  8. Zhao, X.Y.; Hao, L.B.; Lu, J.L.; Zhao, Y.Y.; Ma, C.Y.; Wei, Q.Q. Origin of skewed frequency distribution of regional geochemical data from stream sediments and a data processing method. J. Geochem. Explor. 2018, 194, 1–8. [Google Scholar] [CrossRef]
  9. Sun, Y.Y.; Hao, L.B.; Zhao, X.Y.; Lu, J.L.; Shi, Y.X.; Ma, C.Y.; Li, Q.Q.; Wei, Q.Q. Identification of stream sediment geochemical anomalies in lithologically complex regions: Case study of Cu mineralization in Hunan province, SE China. Geochem. Explor. Environ. Anal. 2022, 22, 96. [Google Scholar] [CrossRef]
  10. Sun, Y.Y.; Zhao, Y.Y.; Hao, L.B.; Zhao, X.Y.; Lu, J.L.; Shi, Y.X.; Ma, C.Y. Role of the EM clustering method in determining the geochemical background of As and Cr in soils: A case study in the north of Changchun, China. Environ. Geochem. Health 2023, 45, 6675–6692. [Google Scholar] [CrossRef]
  11. Sun, Y.Y.; Zhao, Y.Y.; Hao, L.B.; Zhao, X.Y.; Lu, J.L.; Shi, Y.X.; Ma, C.Y.; Li, Q.Q. Application of the partial least square regression method in determining the natural background of soil heavy metals: A case study in the Songhua River basin, China. Sci. Total Environ. 2024, 918, 170695. [Google Scholar] [CrossRef] [PubMed]
  12. Hajihosseinlou, M.; Maghsoudi, A.; Ghezelbash, R. A comprehensive evaluation of OPTICS, GMM and K-means clus-tering methodologies for geochemical anomaly detection connected with sample catchment basins. Geochemistry 2024, 84, 126094. [Google Scholar] [CrossRef]
  13. Sinclair, A.J. Selection of threshold values in geochemical data using probability graphs. J. Geochem. Explor. 1974, 3, 129–149. [Google Scholar] [CrossRef]
  14. Krige, D.G.; Matheron, G. Two-dimensional weighted moving average trend surfaces for ore valuation. J. S. Afr. Inst. Min. Metall. 1967, 67, 12–38. [Google Scholar]
  15. Li, B.Q.; Sun, Z.K. Study on the method of geochemical anomalies analysis. Northwest. Geol. 2004, 37, 102–108, (In Chinese with English Abstract). [Google Scholar]
  16. Zhou, D. Unit-wise adjustment of geochemical background data and its significance in geochemical anomaly delineation. Geophys. Geochem. Explor. 1986, 10, 263–274, (In Chinese with English Abstract). [Google Scholar]
  17. Hao, L.B.; Zhao, X.Y.; Zhao, Y.Y.; Lu, J.L.; Sun, L.J. Determination of the geochemical background and anomalies in areas with variable lithologies. J. Geochem. Explor. 2014, 139, 177–182. [Google Scholar] [CrossRef]
  18. Cheng, Q.M.; Xu, Y.G.; Grunsky, E.C. Integrated spatial and spectrum method for geochemical anomaly separation. Nat. Resour. Res. 2000, 9, 43–51. [Google Scholar] [CrossRef]
  19. Cheng, Q.M.; Agterberg, F.P.; Ballantyne, S.B. The separation of geochemical anomalies from background by fractal methods. J. Geochem. Explor. 1994, 51, 109–130. [Google Scholar] [CrossRef]
  20. Cheng, Q.M. A new model for quantifying anisotropic scale invariance and for decomposition of mixing patterns. Math. Geol. 2004, 36, 345–360. [Google Scholar] [CrossRef]
  21. Xie, S.Y.; Bao, Z.Y. Continuous Multifractal Model of Geochemical Fields. Geochimica 2002, 31, 191–200, (In Chinese with English Abstract). [Google Scholar]
  22. Yan, G.S.; Zhao, X.Y.; Chen, M. The Principle of Moving Average with Zooming Windows. Geol. Rev. 2000, 46, 267–271, (In Chinese with English Abstract). [Google Scholar]
  23. Wang, J.; Zhou, Y.Z.; Xiao, F. Identification of multi-element geochemical anomalies using unsupervised machine learning algorithms: A case study from Ag–Pb–Zn deposits in north-western Zhejiang, China. Appl. Geochem. 2020, 120, 104679. [Google Scholar] [CrossRef]
  24. Zhou, Y.Z.; Zuo, R.G.; Liu, G.; Yuan, F.; Mao, X.C.; Guo, Y.J.; Xiao, F.; Liao, J.; Liu, Y.P. The great-leap-forward development of mathematical geoscience during 2010–2019: Big data and artificial intelligence algorithm are changing mathematical geoscience. Bull. Mineral. Petrol. Geochem. 2021, 40, 556–573+777. [Google Scholar]
  25. Huang, D.Z.; Zuo, R.G.; Wang, J. Geochemical anomaly identification and uncertainty quantification using a Bayesian convolutional neural network model. Appl. Geochem. 2022, 146, 105450. [Google Scholar] [CrossRef]
  26. Liu, H.; Harris, J.; Sherlock, R.; Behnia, P.; Grunsky, E.; Naghizadeh, M.; Rubingh, K.; Tuba, G.; Roots, E.; Hill, G. Mineral prospectivity mapping using machine learning techniques for gold exploration in the Larder Lake area, Ontario, Canada. J. Geochem. Explor. 2023, 253, 107279. [Google Scholar] [CrossRef]
  27. Zhang, Q.H.; Lu, J.L.; Dai, W.M.; Wu, H.; Fan, Y.; Gou, Z.; Zhao, X. A novel method for the identification of geochemical anomalies with emphasis on addressing the problem of elemental background variation using Pb deposits in Shaoshan, central China, as a case study. Ore Geol. Rev. 2025, 181, 106615. [Google Scholar] [CrossRef]
  28. Govett, G.J.S.; Goodfellow, W.D.; Chapman, R.P. Exploration geochemistry—Distribution of elements and recognition of anomalies. Math. Geol. 1975, 7, 415–446. [Google Scholar] [CrossRef]
  29. Vistelius, A.B. The skew frequency distributions and the fundamental law of the geochemical processes. J. Geol. 1960, 68, 1–22. [Google Scholar] [CrossRef]
  30. Dempster, A.P.; Laird, N.M.; Rubin, D.B. Maximum likelihood from incomplete data via EM algorithm. J. R. Stat. Soc. Ser. B-Methodol. 1977, 39, 1–38. [Google Scholar] [CrossRef]
  31. Qiu, R.Z.; Zhou, S.; Chang, H.L.; Du, S.H.; Peng, S.B. The evolution of Li-bearing micas from Xianghualing granites and their ore prospecting significance in Hunan. J. Guilin Inst. Technol. 1998, 18, 49–57, (In Chinese with English Abstract). [Google Scholar]
  32. Qin, L.X.; Rao, C.; Lin, X.Q.; Wu, R.Q.; Wang, Q. Constraints of lithium on the petrogenesis and mineralization of granite in Xianghualing area, Hunan Province. Geol. J. China Univ. 2021, 27, 149–162, (In Chinese with English Abstract). [Google Scholar]
  33. Song, Z.F.; Yang, Q.Z.; Zhu, Z.Z.; Cao, N.W. Prospecting potential of medium-fine-grained rock-type lithium resources in the Xianghualing orefield, Hunan Province, China. Geophys. Geochem. Explor. 2024, 48, 366–374, (In Chinese with English Abstract). [Google Scholar]
  34. Lin, X.Q. Mineralogical Study on Metallogenic Processes of Rare (Earth) Metals from Jiepailing Porphyry Deposit, Hunan Province. Master’s Thesis, Zhejiang University, Hangzhou, China, 2020. (In Chinese with English Abstract). [Google Scholar]
  35. Jiang, Z.H. Ore-bearing potentian and metallogenic regularity about rare metal of Fengchuiluodai granite in the Changchengling, Hunan. Master’s Thesis, Kunming University of Science and Technology, Kunming, China, 2021. (In Chinese with English Abstract). [Google Scholar]
  36. Cawood, P.A.; Wang, Y.J.; Xu, Y.J.; Zhao, G.C. Locating South China in Rodinia and Gondwana: A Fragment of Greater India Lithosphere? Geology 2013, 41, 903–906. [Google Scholar] [CrossRef]
  37. Jiang, H.; Jiang, S.Y.; Zhao, K.D.; Li, W.Q.; Liu, H.C. Origin of paleosubduction-modified mantle for Late Cretaceous (~100 Ma) diabase in northern Guangdong, South China: Geochronological and geochemical evidence. Lithos 2020, 370, 105603. [Google Scholar] [CrossRef]
  38. Guan, Y.L.; Yuan, C.; Long, X.P.; Wang, Y.J.; Zhang, Y.Y.; Huang, Z.Y. Early Paleozoic intracontinental orogeny of the eastern South China block: Evidence from I-type granitic plutons in the SE Yangtze block. Geotecton. Metallog. 2013, 37, 698–720, (In Chinese with English Abstract). [Google Scholar]
  39. Bai, D.Y.; Tang, F.P.; Li, B.; Zeng, G.Q.; Li, Y.M.; Jiang, W. Summary of main mineralization events in Hunan Province. Geol. China 2022, 49, 151–180, (In Chinese with English Abstract). [Google Scholar]
  40. Sun, Y.Y.; Hao, L.B.; Zhao, X.Y.; Lu, J.L.; Ma, C.Y.; Wei, Q.Q. The application of EM clustering method to the determination of stream sediment geochemical anomalies in areas with variable lithologies. Geophys. Geochem. Explor. 2020, 44, 1306–1312, (In Chinese with English Abstract). [Google Scholar]
  41. Tao, N.; Xie, Z.J.; Ren, T.X.; Xia, Y.; Zhang, J.; Wang, Z.Q.; Zhang, X.P. Discovery of the intrusive rocks hydrothermal altered clay-type lithium mineralization in southern Anhui Province and its geological significance. Acta Petrol. Sin. 2024, 40, 2653–2663, (In Chinese with English Abstract). [Google Scholar] [CrossRef]
  42. Wang, Y.P. The Occurrence Forms and Enrichment Mechanisms of Lithium in Carbonate-Hosted Clay-Type Lithium Deposit in the Yunnan-Guizhou Region, China. Master’s Thesis, Qinghai Institute of Salt Lakes, Chinese Academy of Sciences, Xining, China, 2024. (In Chinese with English Abstract). [Google Scholar]
  43. Zhang, Y.L.; Chen, L.; Wang, K.M.; Wang, G.; Guo, X.Q.; Nie, X.; Pang, X.Y. Metallogenic characteristics of sedimentary lithium resources. Miner. Depos. 2022, 41, 1073–1092, (In Chinese with English Abstract). [Google Scholar]
  44. Reimann, C.; Filzmoser, P.; Garrett, R.G. Background and threshold: Critical comparison of methods of determination. Sci. Total Environ. 2005, 346, 1–16. [Google Scholar] [CrossRef]
  45. Liu, H.L.; Wang, X.Q.; Zhang, B.M.; Wang, W.; Han, Z.X.; Chi, Q.H.; Zhou, J.; Nie, L.S.; Xu, S.F.; Yao, W.S.; et al. Concentration and distribution of lithium in catchment sediments of China: Conclusions from the China Geochemical Baselines project. J. Geochem. Explor. 2020, 215, 106540. [Google Scholar] [CrossRef]
  46. Cao, J.F.; Li, W.Y.; Isokov, M.; Movlanov, J.; Mirkhamdamov, M.; Ma, Z.P.; Weng, K.; Cao, K.; Meng, G.L. Distribution, enrichment characteristics and prospecting potential of lithium in Uzbekistan: Insights from 1:1 million geochemical mapping. J. Geochem. Explor. 2025, 268, 107606. [Google Scholar] [CrossRef]
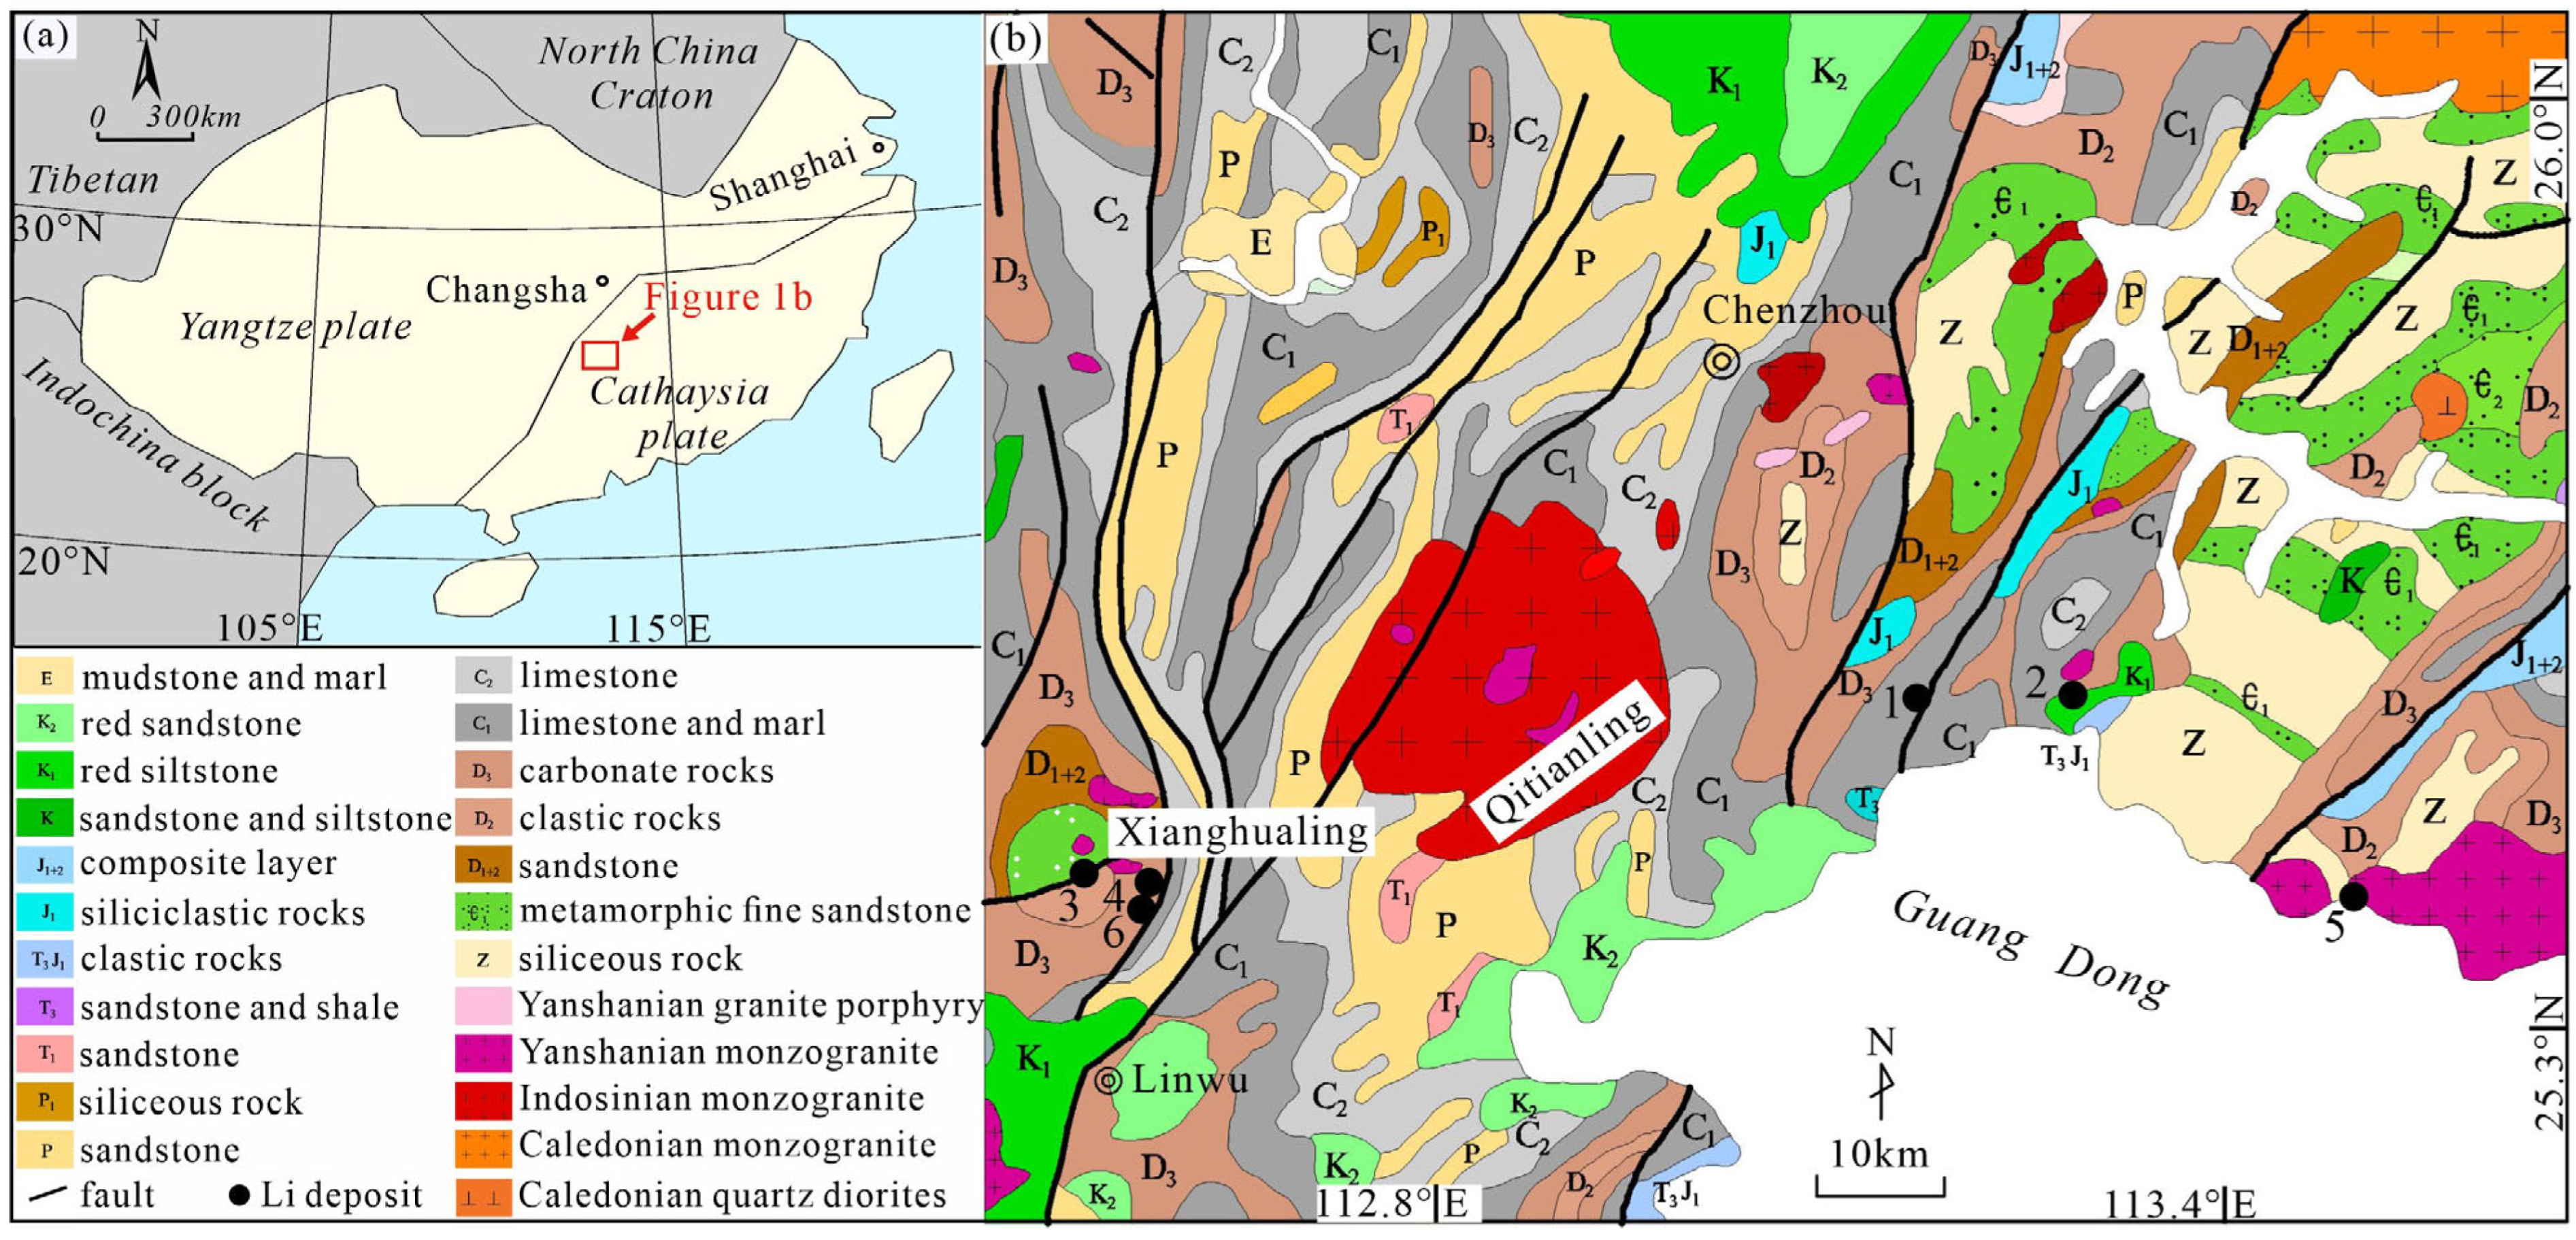
Figure 1. (a) Tectonic background of the study area (after [37]); (b) geological map of the study area. (1) Changchengling Li polymetallic deposit, (2) Jiepailing Li deposit, (3) Jijiaoshan Li polymetallic deposit, (4) Xianghualing Li deposit, (5) Jiangjunzhai Li-Be deposit, (6) Jianfengling Li-Nb-Ta deposit.
Applsci 15 09827 g001
Figure 2. The trend of AIC values with an increasing number of sample clusters in the study area.
Applsci 15 09827 g002
Figure 3. Spatial distribution map showing the six clusters identified by the EM clustering algorithm.
Applsci 15 09827 g003
Figure 4. Frequency distribution histograms of Li within the six clusters.
Applsci 15 09827 g004
Figure 5. (a) Geochemical anomaly map of Li delineated from the EM classified data; (b) geochemical anomaly map of Li delineated from the original dataset; (c) geochemical anomaly map of Li delineated using the cumulative distribution function method.
Applsci 15 09827 g005
Figure 6. The cumulative distribution plot of Li’s original data.
Applsci 15 09827 g006
Table 1. Statistical parameters of Li for the six clusters and the original dataset.
LithiumCluster 1
(725)
Cluster 2
(241)
Cluster 3
(204)
Cluster 4
(648)
Cluster 5
(218)
Cluster 6
(523)
Original Dataset
(2559)
Background40.558.363.725.545.349.642.8
Mean48.460.675.627.256.552.247.8
Median40.658.464.323.744.549.543.5
Standard deviation68.615.350.716.656.015.346.3
The unit is ppm. (n) is the number of samples.
Disclaimer/Publisher’s Note: The statements, opinions and data contained in all publications are solely those of the individual author(s) and contributor(s) and not of MDPI and/or the editor(s). MDPI and/or the editor(s) disclaim responsibility for any injury to people or property resulting from any ideas, methods, instructions or products referred to in the content.