Article

Multi-Scale Electromechanical Impedance-Based Bolt Loosening Identification Using Attention-Enhanced Parallel CNN

1
School of Mechanical and Precision Instrument Engineering, Xi’an University of Technology, Xi’an 710048, China
2
Zhejiang Zomax Transmission Co., Ltd., Wenling 317513, China
*
Author to whom correspondence should be addressed.
Appl. Sci. 2025, 15(17), 9715; https://doi.org/10.3390/app15179715
Submission received: 18 July 2025 / Revised: 31 August 2025 / Accepted: 2 September 2025 / Published: 4 September 2025

Abstract

Bolted connections are extensively utilized in aerospace, civil, and mechanical systems for structural assembly. However, inevitable structural vibrations can induce bolt loosening, leading to preload reduction and potential structural failure. Early-stage preload degradation, particularly during initial loosening, is often undetectable by conventional monitoring methods due to limited sensitivity and poor noise resilience. To address these limitations, this study proposes an intelligent bolt preload monitoring framework that combines electromechanical impedance (EMI) signal analysis with a parallel deep learning architecture. A multiphysics-coupled model of flange joint connections is developed to reveal the nonlinear relationships between preload degradation and changes in EMI conductance spectra, specifically resonance peak shifts and amplitude attenuation. Based on this insight, a parallel convolutional neural network (P-CNN) is designed, employing dual branches with 1 × 3 and 1 × 7 convolutional kernels to extract local and global spectral features, respectively. The architecture integrates dilated convolution to expand frequency–domain receptive fields and an enhanced SENet-based channel attention mechanism to adaptively highlight informative frequency bands. Experimental validation on a flange-bolt platform demonstrates that the proposed P-CNN achieves 99.86% classification accuracy, outperforming traditional CNNs by 20.65%. Moreover, the model maintains over 95% accuracy with only 25% of the original training samples, confirming its robustness and data efficiency. The results demonstrate the feasibility and scalability of the proposed approach for real-time, small-sample, and noise-resilient structural health monitoring of bolted connections.

1. Introduction

As one of the most commonly used fasteners in mechanical and civil structures, the performance of bolted connections directly affects the load-bearing capacity and safety of entire structures. Particularly in pipeline systems, the preload of flange bolt connections critically determines both joint integrity and sealing performance, where insufficient preload may result in leakage or even structural failure [1]. Due to causes such as alternating loads, material creep, and corrosion, bolt preload inevitably degrades during long-term service [2]. Notably, the performance deterioration of bolted connections does not occur after complete loosening but manifests abruptly when preload decreases to a critical threshold, potentially leading to instantaneous structural instability [3]. However, during the initial loosening phases, structural appearance usually remains unaltered, making conventional visual inspection or torque wrench checking ineffective [4]. Therefore, developing high-sensitivity monitoring techniques capable of capturing the microscale performance degradation has become crucial for ensuring engineering safety. Conventional monitoring approaches are often limited by inadequate real-time performance, operational complexity, and high implementation costs, which restrict their applicability for continuous, long-term monitoring [5,6,7]. These challenges are further exacerbated in systems comprising numerous bolted joints, such as flanged assemblies [8].
Over the past several decades, substantial advancements have been achieved in vibration-based bolt loosening monitoring within structural health monitoring. The modal analysis approach primarily relies on the variations in the dynamic characteristics, including mode shapes, natural frequency, and damping ratio, to detect loosening. Impact hammer and vibration exciter methods, respectively, acquire vibration responses through transient and steady-state excitations. Deka et al. [9] revealed that natural frequencies increase with preload elevation while damping ratios exhibit inverse trends. Brons et al. demonstrated that single-bolt loosening in multi-bolt structures induces higher-order frequency shifts. Liu et al. [10] validated preload sensitivity in composite bolted joints using spring-contact models. Nevertheless, modal analysis shows insensitivity to contact stiffness saturation under high preload and struggles to precisely locate loosened bolts in multi-bolt systems. Current vibration-based methods generally suffer from three main limitations: (1) insufficient detection capability and low localization accuracy for multi-bolt systems and complex structures; (2) signal saturation caused by contact nonlinearity under high preload, reducing sensitivity; (3) dependence on laboratory environments and specialized equipment, hindering cost-effective large-scale deployment.
In recent years, lead zirconate titanate (PZT)-based smart piezoelectric materials have gained extensive application in structural health monitoring (SHM) due to their high energy conversion efficiency and cost-effectiveness. Piezoelectric transducers can serve dually as actuators for excitation and sensors for signal acquisition, which have been widely employed in wave-based methodologies for monitoring bolt preload. These systems utilize actuators to induce elastic waves within the structure, while sensors capture the corresponding response signals. Diagnostic assessment of bolt loosening is conducted by analyzing variations in wave energy, sideband generation, and electrical impedance characteristics within the acquired responses, which reflect changes in the mechanical integrity of the bolted joints. Wave propagation-based approaches demonstrate high sensitivity to the early-stage bolt preload variations. The linear ultrasonic wave features, including wave energy dissipation and time reversal, were employed to detect bolt loosening. Wang et al. [11] explored how interfacial surface roughness influences both the transmission and attenuation of ultrasonic waves as they pass through bolted joints. Wang et al. [5] developed a wave energy indicator based on the second norm time domain signal and revealed the relationship between the received signal energy and bolt preload. Nevertheless, the existence of various propagation modes and dispersion in ultrasonic waves poses challenges in accurately interpreting channel responses and retrieving valuable information. Time reversal techniques offer an adaptive approach to enhance both spatial and temporal focusing of wave energy. Parvasi et al. [12] studied the correlation between the peak amplitude of the focused signal and bolt preload and defined a tightness index based on the energy of the structure’s impulse response function. Yin et al. [13] developed smart washers integrated with time reversal to overcome signal saturation under high preload. However, these methods exhibit limited accuracy in complex geometric configurations (e.g., L-shaped joints and pipeline flange connections), as they require precise sensor placement and are sensitive to interfacial surface roughness, thereby reducing their reliability and practicality in real-world engineering applications. Vibro-acoustic modulation (VAM) leverages nonlinear responses from coupled low-frequency vibration and high-frequency probing to identify loosening through sideband signals. Zhang et al. [14] proposed a modulation index-based quantification method successfully differentiating early-stage loosening in metal and composite joints. However, VAM requires complex signal processing (e.g., empirical mode decomposition) and faces integration challenges with real-time monitoring systems due to bulky excitation devices (e.g., electromagnetic shakers). Kong et al. [15] classified loosening levels through audio signal power spectrum energy analysis, while Wang et al. [16] enhanced detection accuracy using Mel-frequency cepstral coefficients. These methods remain vulnerable to environmental noise interference and demand high-quality signal acquisition equipment, introducing stochastic errors in practical applications.
As a specialized high-frequency ultrasonic non-destructive testing (NDT) technique, electromechanical impedance (EMI) has demonstrated distinct advantages in SHM, including high sensitivity, real-time detection capabilities, and non-invasive implementation [17,18]. Operating predominantly within the ultrasonic frequency range, EMI is particularly effective in detecting subtle variations in structural stress states, such as the early-stage loosening of bolts [19]. The EMI-based SHM approach identifies structural changes by analyzing variations in the electrical impedance signals of piezoelectric transducers before and after damage occurrence. This methodology is grounded in the direct and inverse piezoelectric effects, where changes in local mechanical impedance caused by structural damage are transmitted to the piezoelectric sensors via stress waves. These alterations manifest as systematic deviations in the amplitude–frequency characteristics of the admittance spectra, including shifts in resonance magnitude and phase. The electromechanical coupling intrinsic to the EMI technique enables quantitative damage assessment, offering physical insight into structural integrity. To leverage EMI for practical SHM applications, an accurate understanding of the interfacial interaction mechanisms is essential for establishing reliable correlations between admittance signatures and structural conditions. In recent years, numerous studies have sought to investigate this relationship across various structural types and damage scenarios. For example, Lim et al. [20] employed piezoelectric patches to detect damage in concrete cubes, aluminum beams, and truss structures, and proposed a root mean square deviation (RMSD) index derived from effective impedance for damage quantification. Ai et al. [21] developed a two-dimensional coupled electromechanical model capable of translating tensile and compressive stresses into admittance variations, thus enabling crack detection in reinforced concrete beams. Bois and Hochard [22] introduced a delamination-informed beam model for predicting damage in composite structures under static and cyclic loading. Additionally, Ai et al. [23] presented a graded damage evaluation approach by linking resonance frequency shifts in the admittance spectra to crack growth, thereby establishing a linear relationship between damage severity and frequency deviation.
For bolt preload loss or loosening detection, these methods have garnered significant research attention. Martowicz et al. [24] investigated pipeline bolt loosening detection using multiple piezoelectric sensors and transfer impedance functions, validating sensitivity through statistical damage indices (RMSD, cross-correlation). Wang et al. [25] introduced multivariate multiscale fuzzy entropy (MMFE) to quantify nonlinear features generated by stress waves crossing contact interfaces for damage index construction. Wang et al. [26] developed a piezoelectric impedance model based on fractal contact theory to quantify bolt interface stiffness and damping, correlating preload with impedance variations via effective impedance concepts. Leveraging embedded piezoelectric smart structures, Huo et al. [27] innovatively proposed piezoelectric smart washers for direct preload monitoring, quantifying loosening severity through resonance frequency shifts and RMSD indices. Despite these advances, most of the aforementioned methods rely on manually engineered feature extraction strategies, which often require subjective selection of signal features such as resonance frequency shifts. Additionally, many studies primarily depend on global statistical indices (e.g., RMSD) to characterize impedance variations across entire frequency bands only capture overall energy or spectral distribution changes. Due to the averaging effects inherent in these methods, weak signals associated with early-stage damage may be masked, thereby limiting the accuracy and robustness of damage quantification under complex or evolving boundary conditions [28].
The recent advancement of deep learning and its widespread integration with engineering disciplines has introduced adaptive and powerful network models for analyzing EMI response signals. Convolutional neural networks (CNNs) have been widely adopted due to their capability to autonomously extract nonlinear and high-dimensional features from raw impedance data. Nguyen et al. [29] pioneered the use of 1D CNNs for automated feature extraction in bolt loosening detection. Lou et al. [30] extended this approach to access to non-uniform corrosion. They processed complex impedance responses by integrating finite element simulations of corrosion pit distributions and generating real-world samples via mechanical drilling. Regression models were then built to estimate mass loss based on impedance spectra. Similarly, Li et al. [31] applied CNNs to monitor early-stage concrete strength development. By combining smart aggregate-acquired impedance signals with hybrid learning models, they successfully mapped impedance features to hydration-driven strength evolution. To improve detection under complex operational conditions, researchers have explored model designs that account for environmental and nonlinear coupling effects. De Rezende et al. [32] developed a temperature-agnostic 1D CNN architecture capable of automatically extracting damage-sensitive multi-frequency features without requiring explicit compensation. Their results highlighted CNN’s ability to decouple thermal influences from impedance variations. Du et al. [33] addressed the challenge of temperature-induced feature entanglement in bolt health monitoring. They proposed a multi-task CNN framework incorporating both impedance and temperature vectors as parallel inputs and optimized using a dynamic weight multi-loss strategy to achieve accurate detection under small-sample constraints. In terms of local feature learning and input structure innovation, Ai et al. [34] introduced a 2D CNN-based method for damage quantification using electromechanical admittance (EMA) signals. By segmenting raw admittance signals into RMSD-maximizing sub-bands and reshaping them into 2D inputs, the model autonomously learned localized distortion patterns induced by micro-damage through multilayer convolution.
While these studies demonstrate innovation by applying a CNN’s robust feature extraction capabilities to electromechanical impedance signal analysis, several practical challenges remain unsolved. A major limitation lies in the insufficient consideration of multi-scale feature variation in EMI responses, which significantly affects recognition accuracy. Specifically, bolt preload loss alters the local mechanical impedance of the host structure, resulting in resonance frequency shifts and amplitude variations in the admittance spectrum. Although both features correlate with structural changes, they exist at different characteristic scales and exhibit distinct response sensitivities. Conventional CNN architectures struggle to simultaneously capture both global resonance patterns and local frequency deviations, leading to suboptimal feature representation and limited classification performance—particularly under small-sample training conditions.
To overcome these limitations, this study proposes a novel one-dimensional convolutional neural network (1D CNN) framework that integrates multi-scale feature extraction with a channel attention mechanism. The core of the method lies in a multi-scale dual-core parallel CNN (P-CNN) architecture, which employs convolutional kernels of varying receptive fields to concurrently extract global EMI spectral characteristics and localized frequency shift details. This design effectively mitigates the drawbacks of single-scale feature extraction and improves the representation of multi-resolution structural damage indicators. The Squeeze-and-Excitation Network (SENet) attention module is embedded into the architecture to further enhance feature discrimination and network adaptability. This module adaptively recalibrates feature channel responses by learning their relative importance, thereby emphasizing damage-relevant features and suppressing noise or redundant information. A laboratory-scale flange bolt monitoring platform is developed to simulate both single-bolt loosening and multi-stage torque loss scenarios, providing EMI datasets for model training and evaluation. Experimental results demonstrate that the proposed approach achieves accurate identification of preload variations with only 25% of the training data required by standard CNNs. The proposed approach provides a novel technical pathway for pipeline flange connection health monitoring, combining high sensitivity with engineering practicality.

2. Materials and Methods

2.1. Theoretical Background of EMI-Based Technique

The EMI technique is a non-destructive evaluation method grounded in the electromechanical coupling effect between piezoelectric transducers (e.g., PZT) and host structures. The core principle lies in monitoring variations in the electrical impedance spectrum of PZT sensors induced by structural dynamic property changes. When a PZT patch bonded to a structure is excited by a harmonic voltage, it generates high-frequency vibrations (typically 10 KHz–2 MHz) through the inverse piezoelectric effect. These vibrations propagate through the structure, and the resultant mechanical response is converted back into electrical impedance via the piezoelectric effect [35]. The relationship between the electrical impedance Z ω of the PZT and the mechanical impedance Z s ω of the host structure is described by Liang’s 1D model (see Figure 1):
Z ω = i ω w A l A h A ε 33 T Z s ω Z s ω + Z a ω d 32 2 Y 22 E 1
where Z a ω , ε 33 T ,   d 32 , and Y 22 E represent the mechanical impedance of the PZT, complex dielectric constant, piezoelectric coupling coefficient, and complex Young’s modulus, respectively. Structural damage alters Z s ω , leading to measurable shifts in the PZT’s impedance spectrum.
Bolt loosening identification using EMI has been widely investigated in structural health monitoring [8]. Traditional approaches typically rely on manually extracted statistical features from the impedance spectrum, which are often sensitive to measurement noise and boundary conditions. In this study, we adopt a CNN-based framework, where the input consists of the conductance spectra obtained from a high-frequency impedance analyzer, and the output corresponds to the classification of the bolt preload state. This formulation emphasizes the non-trivial nature of the task, as it requires capturing both subtle local resonance shifts and global variations across the frequency spectrum.
In the context of bolt-loosening detection, loosening at bolted interfaces leads to localized reductions in joint stiffness, increased damping, and altered interfacial contact conditions. It disrupts the dynamic response of the structure, which is reflected in the impedance spectrum through frequency shifts, amplitude variations, and statistical deviations. Quantitative assessment of these variations commonly employs statistical metrics such as root mean square deviation (RMSD), covariance (Cov), and correlation coefficient deviation (CCD). The sensitivity and effective sensing range of the EMI technique are intrinsically dependent on the excitation frequency. Low-frequency regimes (10 KHz–100 KHz) offer greater monitoring coverage but exhibit reduced sensitivity to localized damage. Conversely, a frequency range higher than 200 KHz enables precise detection of localized anomalies but suffers from significant ultrasonic attenuation, which limits the effective propagation distance. Therefore, selecting an appropriate frequency is essential for effectively detecting localized loosening while maintaining broad sensing coverage [36]. Accordingly, a frequency range of 10 KHz–400 KHz has been chosen to balance these requirements.

2.2. Proposed Bolt Loosening Identification Method Using EMI Data

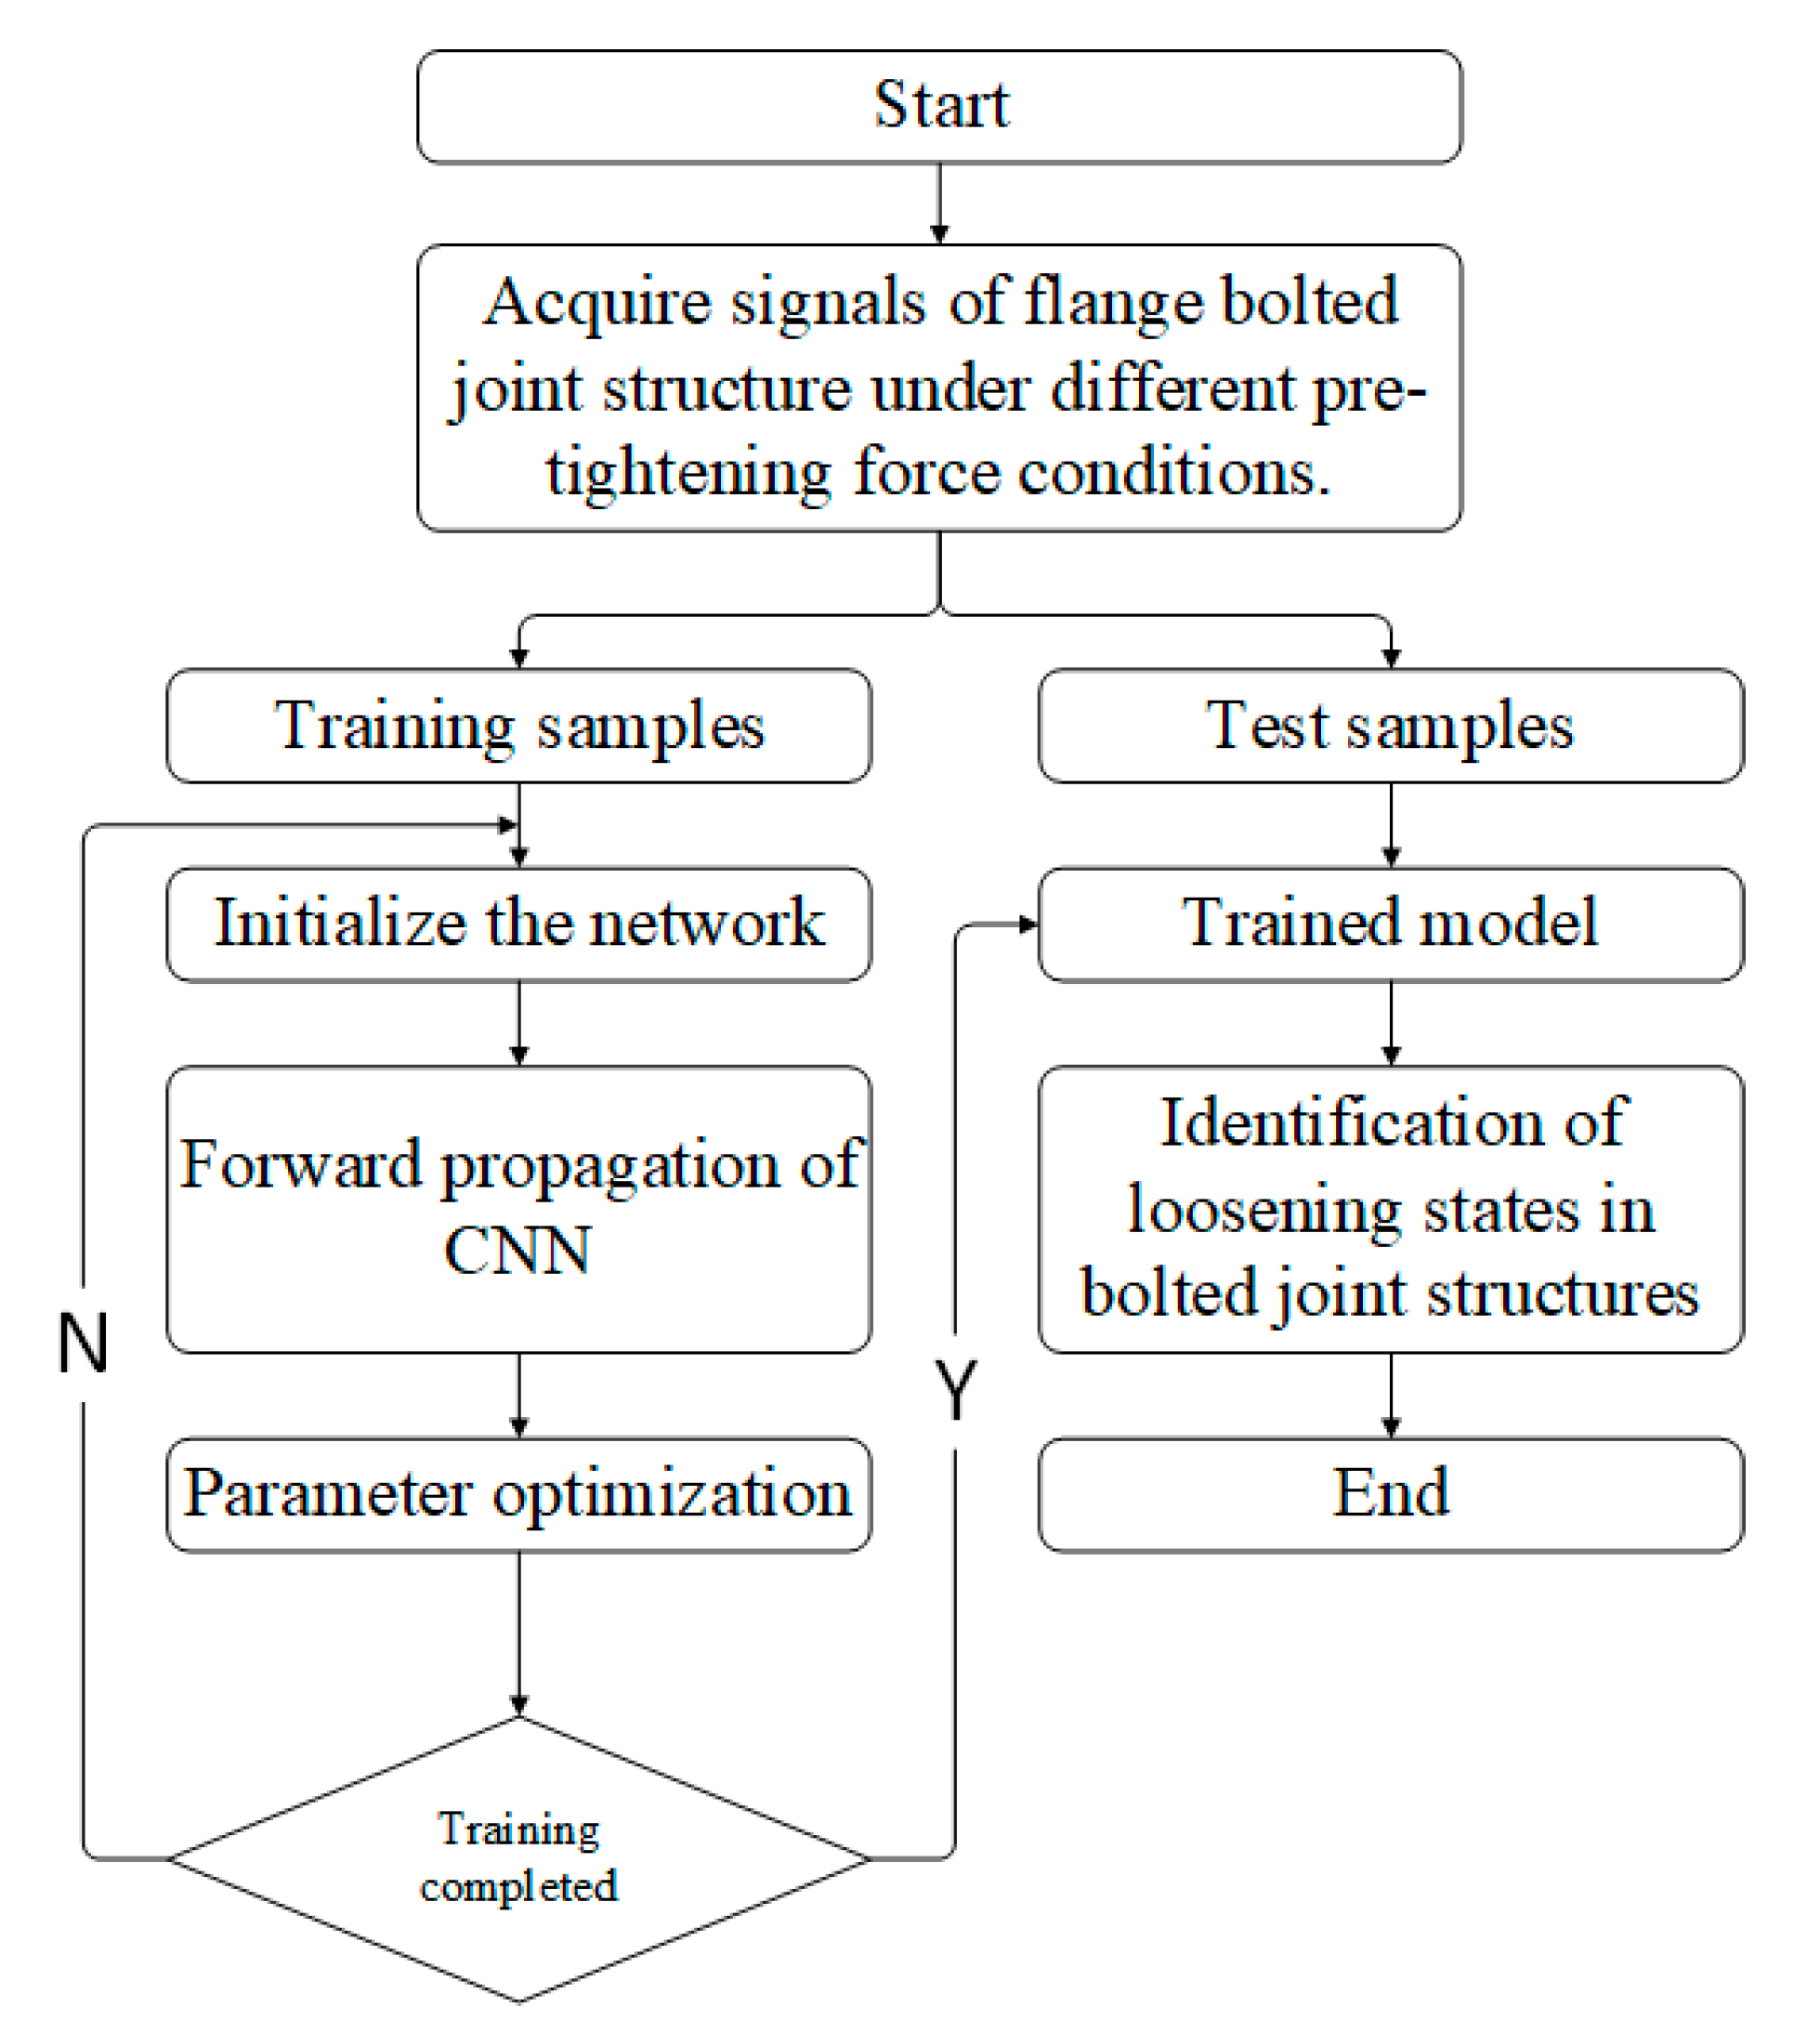
As shown in Figure 2, the overall workflow of the proposed attention-enhanced multi-scale EMI-based P-CNN method is illustrated in the form of a flowchart. The process starts with signal acquisition from PZT sensors under different preload conditions, followed by the partitioning of the collected data into training and testing samples. In the training branch, the CNN is initialized, and forward propagation together with parameter optimization is iteratively performed until convergence. Once the model is trained, the testing branch employs the trained network to identify the loosening states of flange bolted connections.
Conventional statistical damage metric of EMI can only provide limited information about the host structure. To improve the feature extraction ability, machine learning base methods have been induced, and the powerful tools such as CNN have extremely extended the identification performance by representations of the monitoring data. Since the EMI responses are normally represented in the frequency domain spectrum, a 1D CNN model is one of the most efficient techniques for feature extraction based on its inherent capabilities. The feature extraction capability of CNNs is largely influenced by the receptive field (RF), which is determined by the size of the convolutional kernels. This principle, which is well-established in image processing tasks, also applies to one-dimensional signal analysis. Small kernels offer a fine-grained resolution but lack broader contextual awareness, while large kernels capture more global trends at the cost of missing localized variations. EMI signals typically contain multi-scale information, such as large-amplitude deviations associated with stiffness loss and small-frequency shifts reflecting early contact degradation. These diverse features require different receptive field sizes for optimal extraction. Localized amplitude fluctuations demand high-resolution attention, whereas resonance peak drift may be better captured using a global view. Consequently, CNNs employing a fixed kernel size may fail to capture the full range of relevant features, resulting in information loss and reduced classification accuracy.

2.2.1. Architecture of the Proposed Dual Parallel Channels Convolutional Neural Network

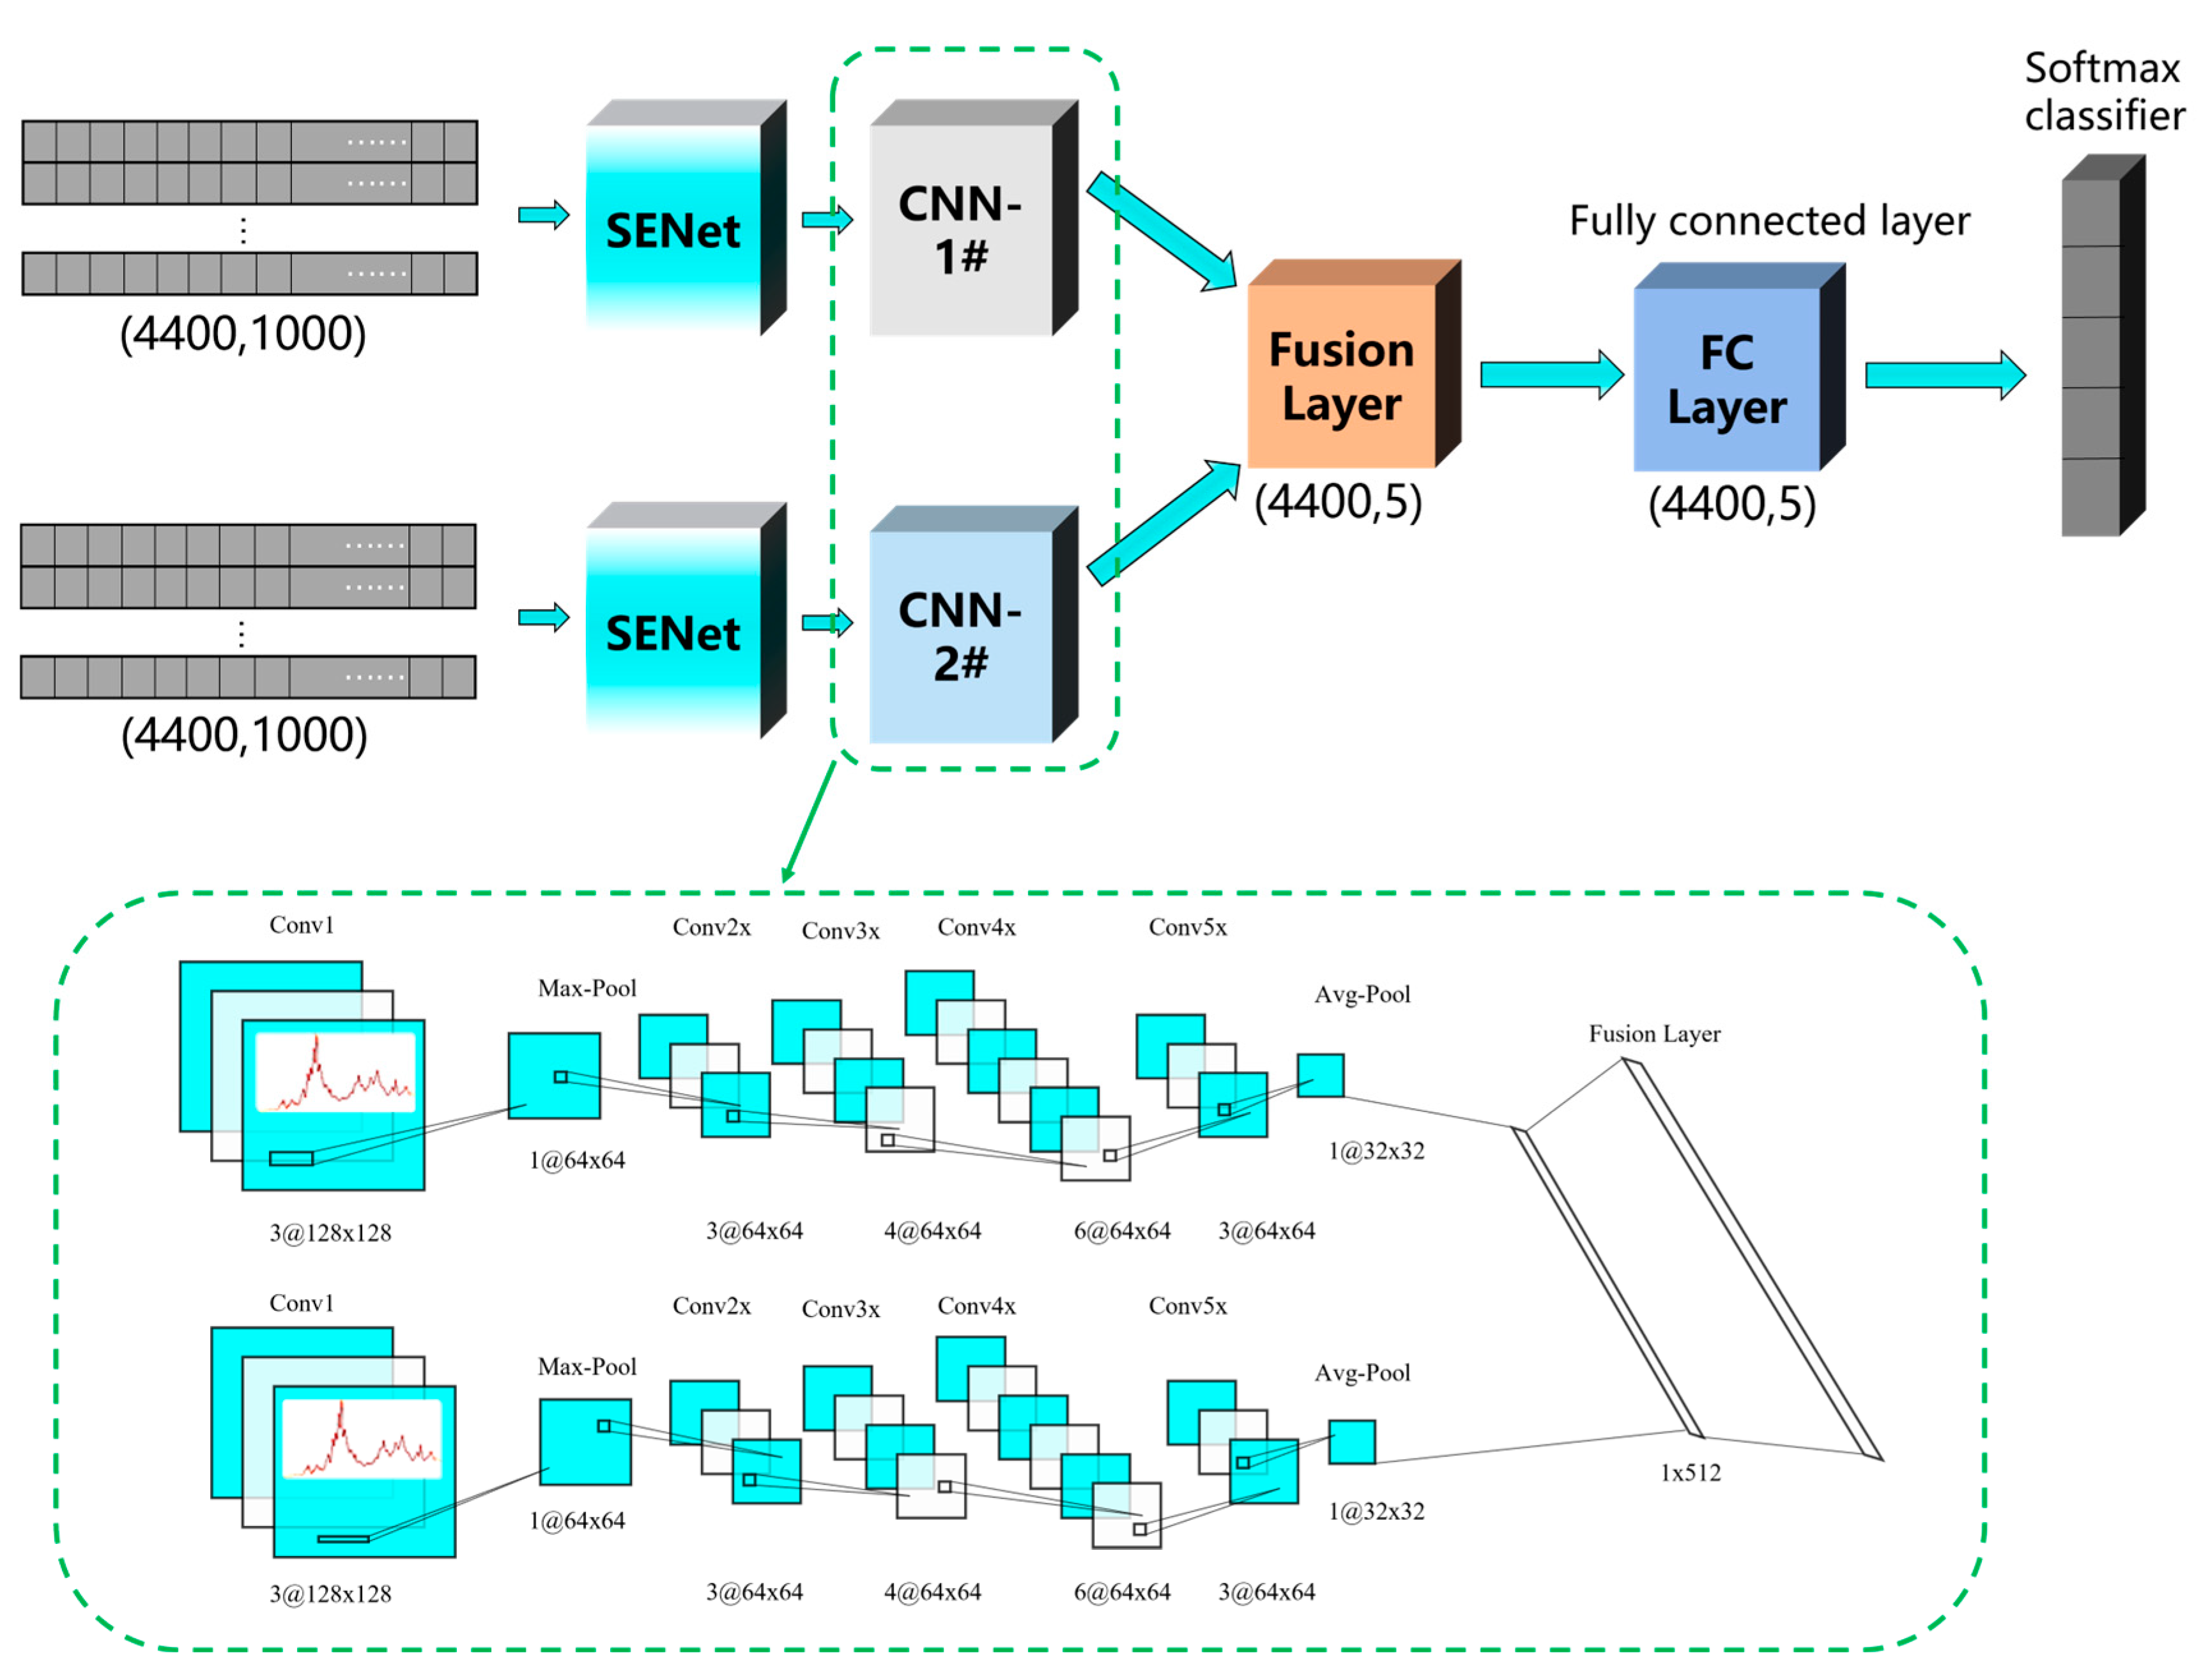
Focused on addressing the limitations of unidimensional feature extraction and insufficient exploration of multi-scale signal correlations in EMI data, this study proposes a parallel convolutional neural network (P-CNN) architecture integrating multi-scale feature extraction with a channel attention mechanism. Based on the EMI technique, this method employs piezoelectric ceramic sensors to acquire high-frequency electrical conductance signals at bolted interfaces, enabling end-to-end intelligent identification of preload states through deep learning. Compared with conventional single-branch CNNs, the P-CNN enables hierarchical spectral analysis by deploying two parallel convolutional pathways: one for learning localized resonance peak shifts, and the other for capturing broadband amplitude variations. As shown in Figure 3, this architectural design enhances feature representation and classification robustness under variable working conditions.
The core innovation of the P-CNN lies in its dual-branch structure, which comprises two modified ResNet34-based subnetworks employing different convolutional kernel sizes—1 × 3 for fine-scale feature extraction and 1 × 7 for coarse-scale patterns. The model input consists of one-dimensional frequency–domain conductance signals with a fixed dimension of 1 × 1000. A total of 4400 samples were collected, derived from 110 measurement groups under five preload conditions, with measurements repeated across eight bolts for each condition. Thus, the complete input dataset can be expressed as 4400 × 1000.
Each branch includes five convolutional layers, followed by a max-pooling layer, an average-pooling layer, and a fully connected layer. The max-pooling operation reduces computational cost, while the ReLU activation function is applied after each convolution to introduce nonlinearity. After average pooling, the output features from both branches are concatenated into a single feature vector, enabling cross-scale feature fusion. The fused feature vector is passed through three fully connected layers with 512, 84, and 5 neurons, respectively.
The final fully connected layer outputs 512 floating-point features, which are then fed into a Softmax classifier. The Softmax layer produces a 5-dimensional floating-point vector, where each value represents the predicted probability that the input sample belongs to one of the five discrete bolt preload states. The predicted class is obtained by selecting the maximum probability. This setup ensures a proper multi-class classification interpretation, with outputs summing to 1 and providing a probabilistic confidence measure for each class.
To mitigate overfitting during training, the Dropout technique is employed within the fully connected layers. Additionally, a cross-entropy loss function is adopted to quantify the discrepancy between predicted and ground-truth labels, providing a reliable metric for model convergence and classification accuracy.

2.2.2. Channel Attention Module (SENet)

The attention mechanism, originally introduced in image processing and natural language processing, is widely recognized for its ability to enhance deep neural networks by dynamically emphasizing task-relevant information within input data. In the context of EMI-based bolt preload assessment, training data are often limited due to practical engineering constraints. To address this challenge and improve model adaptability under small-sample conditions, this study integrates the Squeeze-and-Excitation Network (SENet) attention module into the residual blocks of the proposed P-CNN architecture.
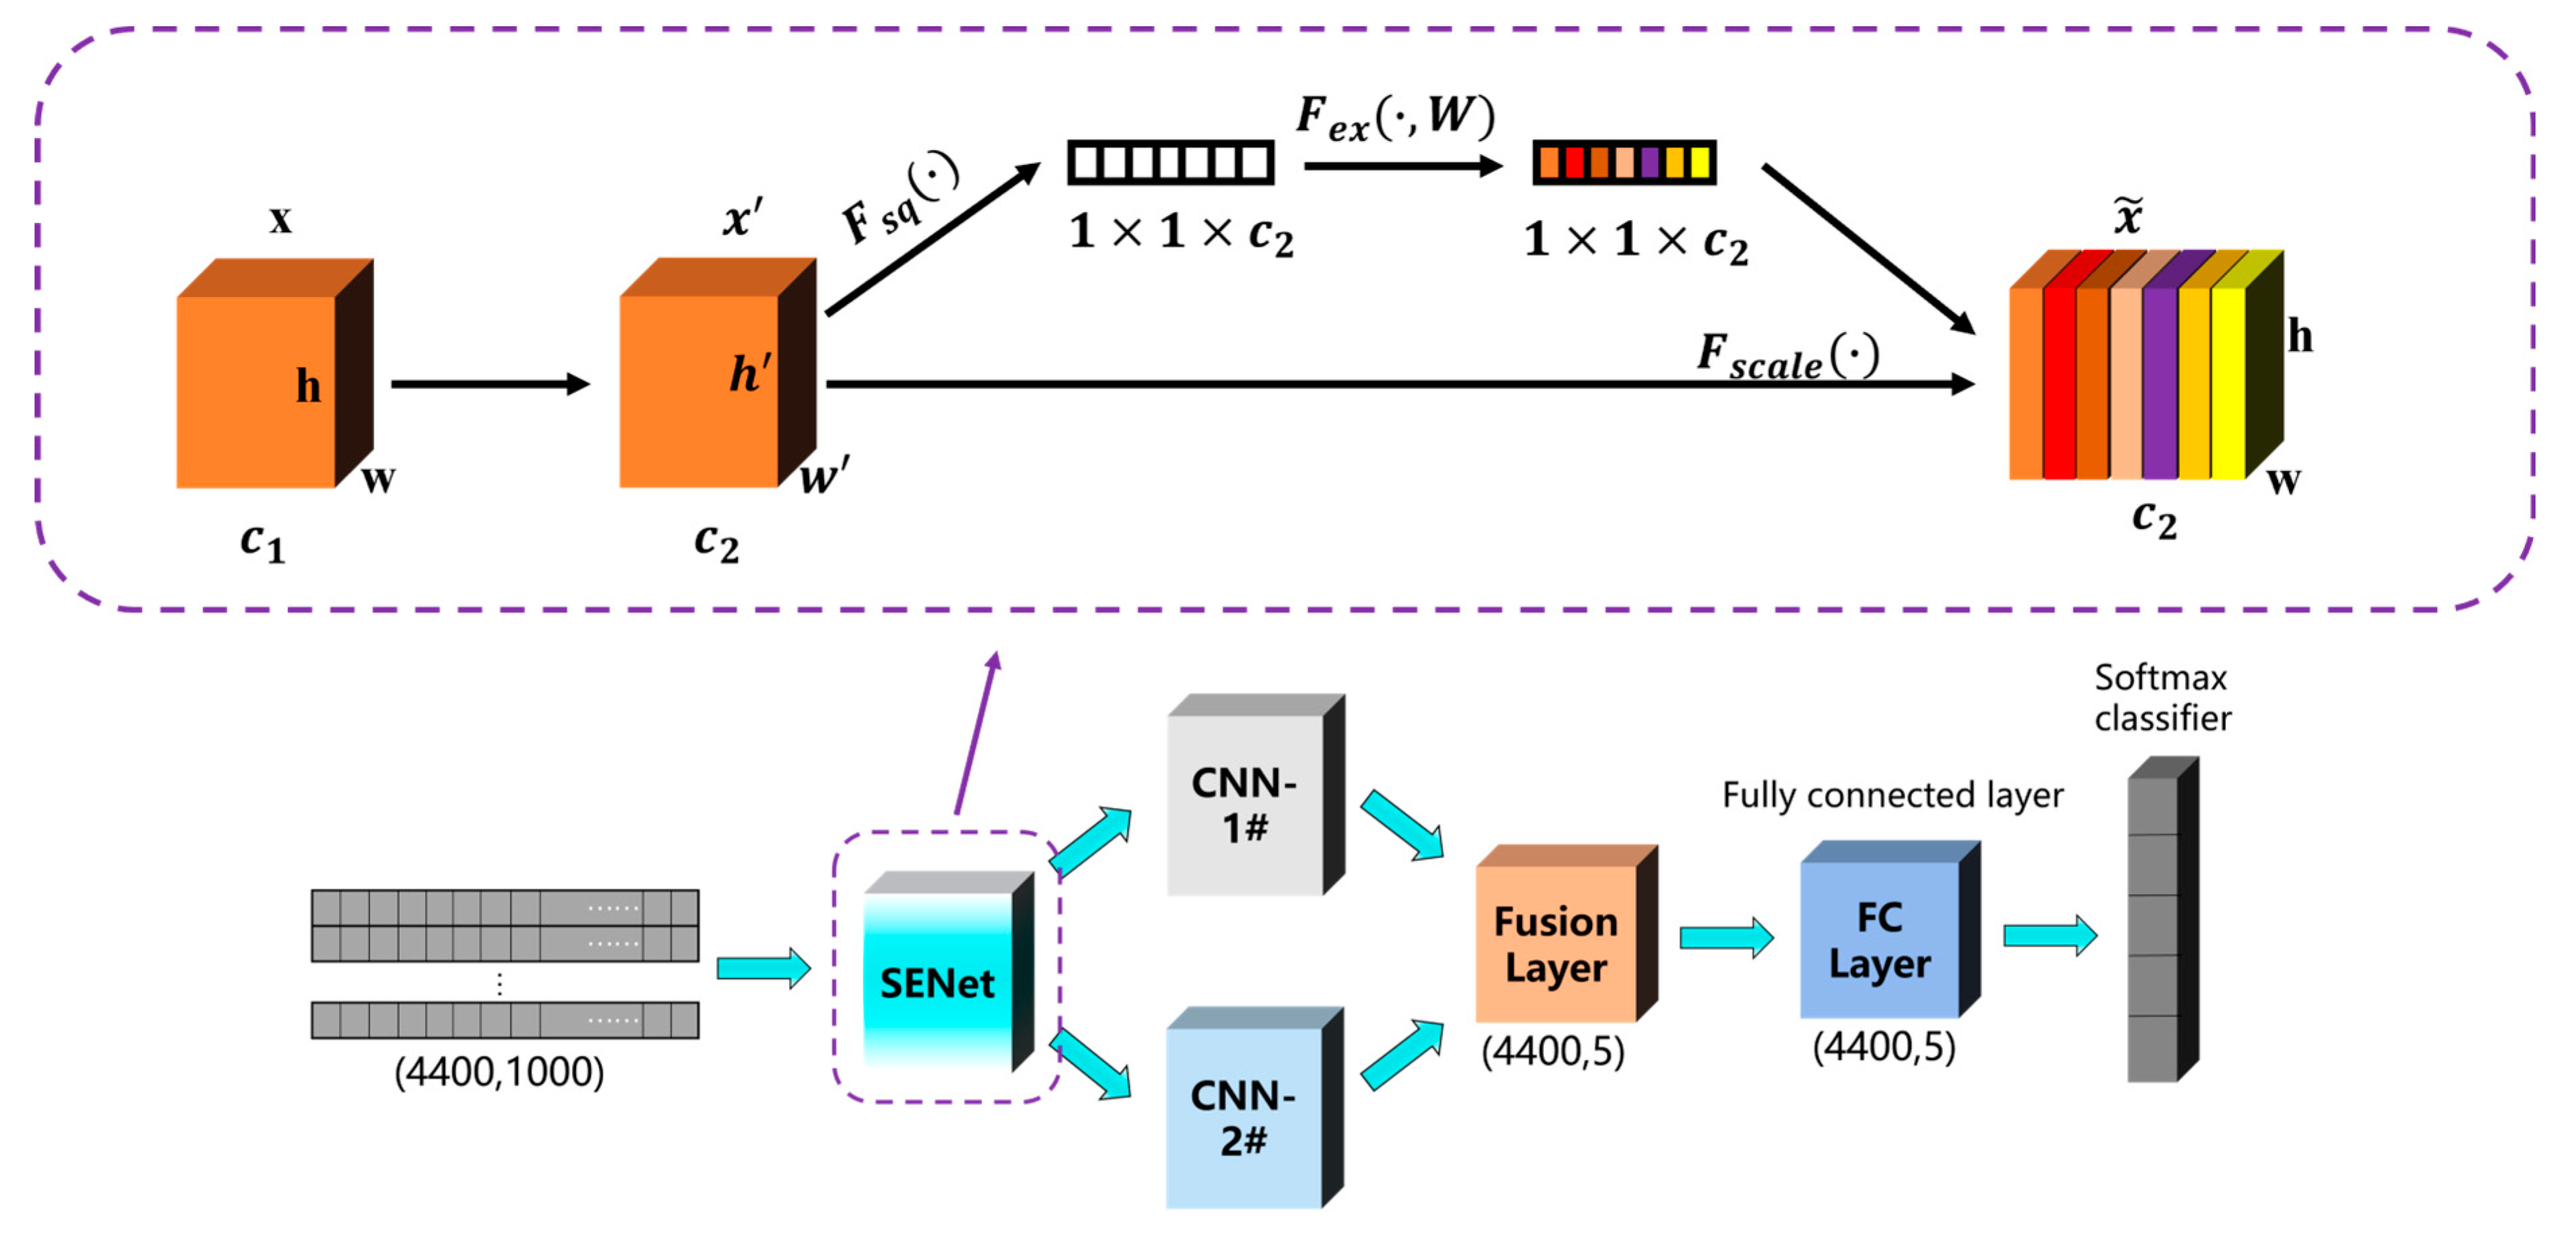
The SENet module enhances the discriminative power of the network by learning channel-wise dependencies and assigning dynamic weights to feature maps. This process involves three stages: squeeze, excitation, and scaling. First, the output of a residual block undergoes adaptive average pooling, reducing each channel to a single scalar that reflects its global importance. Then, the pooled vector is passed through a convolutional layer followed by a ReLU activation, which reduces the dimensionality and introduces nonlinearity. Next, another convolutional layer and a sigmoid activation function are applied to generate attention weights for each channel. Finally, these weights are multiplied by the original feature maps to recalibrate the output, thereby highlighting salient features and suppressing redundant information.
This channel attention mechanism is embedded within each residual block of the P-CNN, as illustrated in Figure 4. By selectively amplifying important channels during feature learning, the SENet module significantly enhances the network’s recognition accuracy and generalization performance, particularly in low-data regimes.

2.2.3. Hyperparameter Determination of the P-CNN Model

In deep learning-based time-series classification tasks, the batch size and learning rate are two critical hyperparameters that significantly affect the training performance and efficiency of a model. To optimize the model performance, we systematically experimented with and analyzed these parameters.
(1)
Batch Size
The batch size determines the number of training samples processed in each iteration and directly influences both the convergence speed and generalization capability of the model. Smaller batch sizes allow more frequent weight updates and may improve generalization by introducing stochasticity; however, they often lead to increased training noise and instability. In contrast, larger batch sizes typically improve computational efficiency and reduce training time, but may impair model generalization and slow convergence due to fewer updates per epoch. In this work, several batch sizes were evaluated in order to balance training efficiency with recognition accuracy.
(2)
Learning Rate
The learning rate not only influences the speed at which the model weights are adjusted during training but also determines the step size of the parameter updates during the optimization process, thereby directly affecting the final training outcome. An excessively high learning rate may cause oscillations or even divergence during training, whereas an overly small learning rate, although ensuring stable convergence, can significantly prolong the training time and potentially trap the model in a local optimum. To determine a suitable learning rate for the proposed model, multiple candidate values were tested to identify the configuration that achieves high recognition accuracy without compromising stability.
Based on these considerations, a systematic hyperparameter search was performed, and the optimal configuration was subsequently adopted for model training.

2.2.4. Experimental Configuration

To validate the effectiveness of the proposed method for identifying and quantifying bolt loosening, an experimental investigation was conducted using a test specimen with a flanged pipe connection. The impedance analyzer was initially employed to measure the electrical admittance signals of a PZT during the reduction in the bolt preload. The electromechanical impedance spectroscopies were analyzed based on the conventional statistical indicators. Then, the electrical admittance signal data obtained under different bolt preloads were used to create a dataset for training and testing the proposed parallel convolutional neural network. The outcomes obtained from the proposed approach are analyzed and subjected to a comparative assessment.
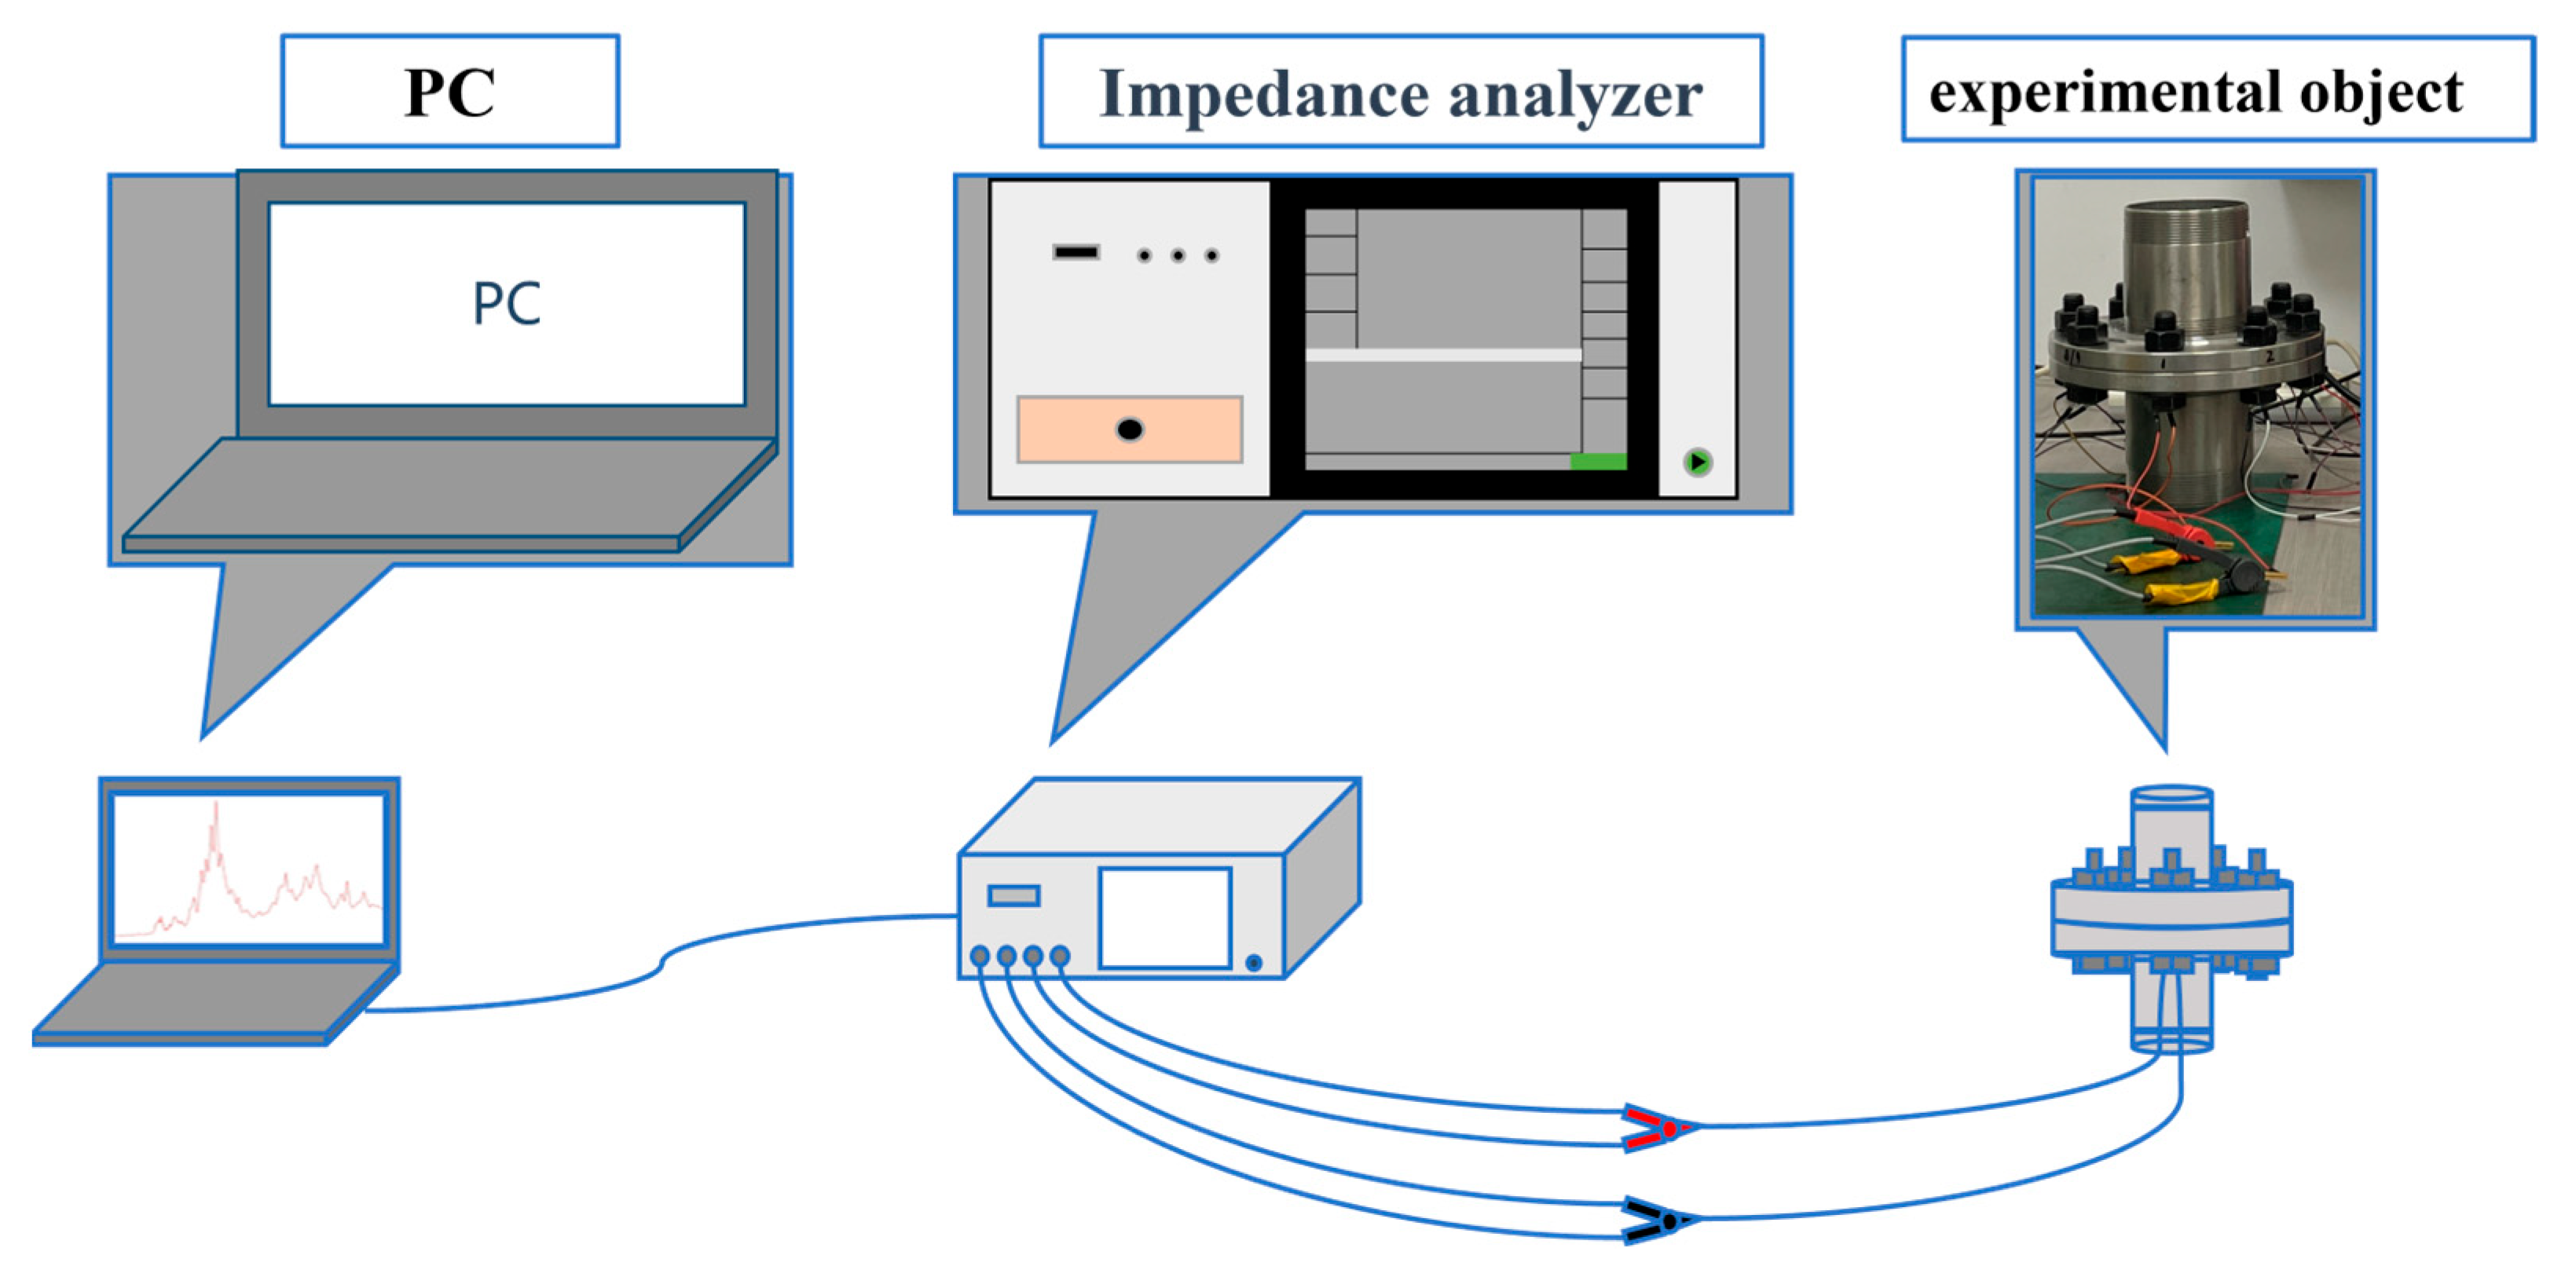
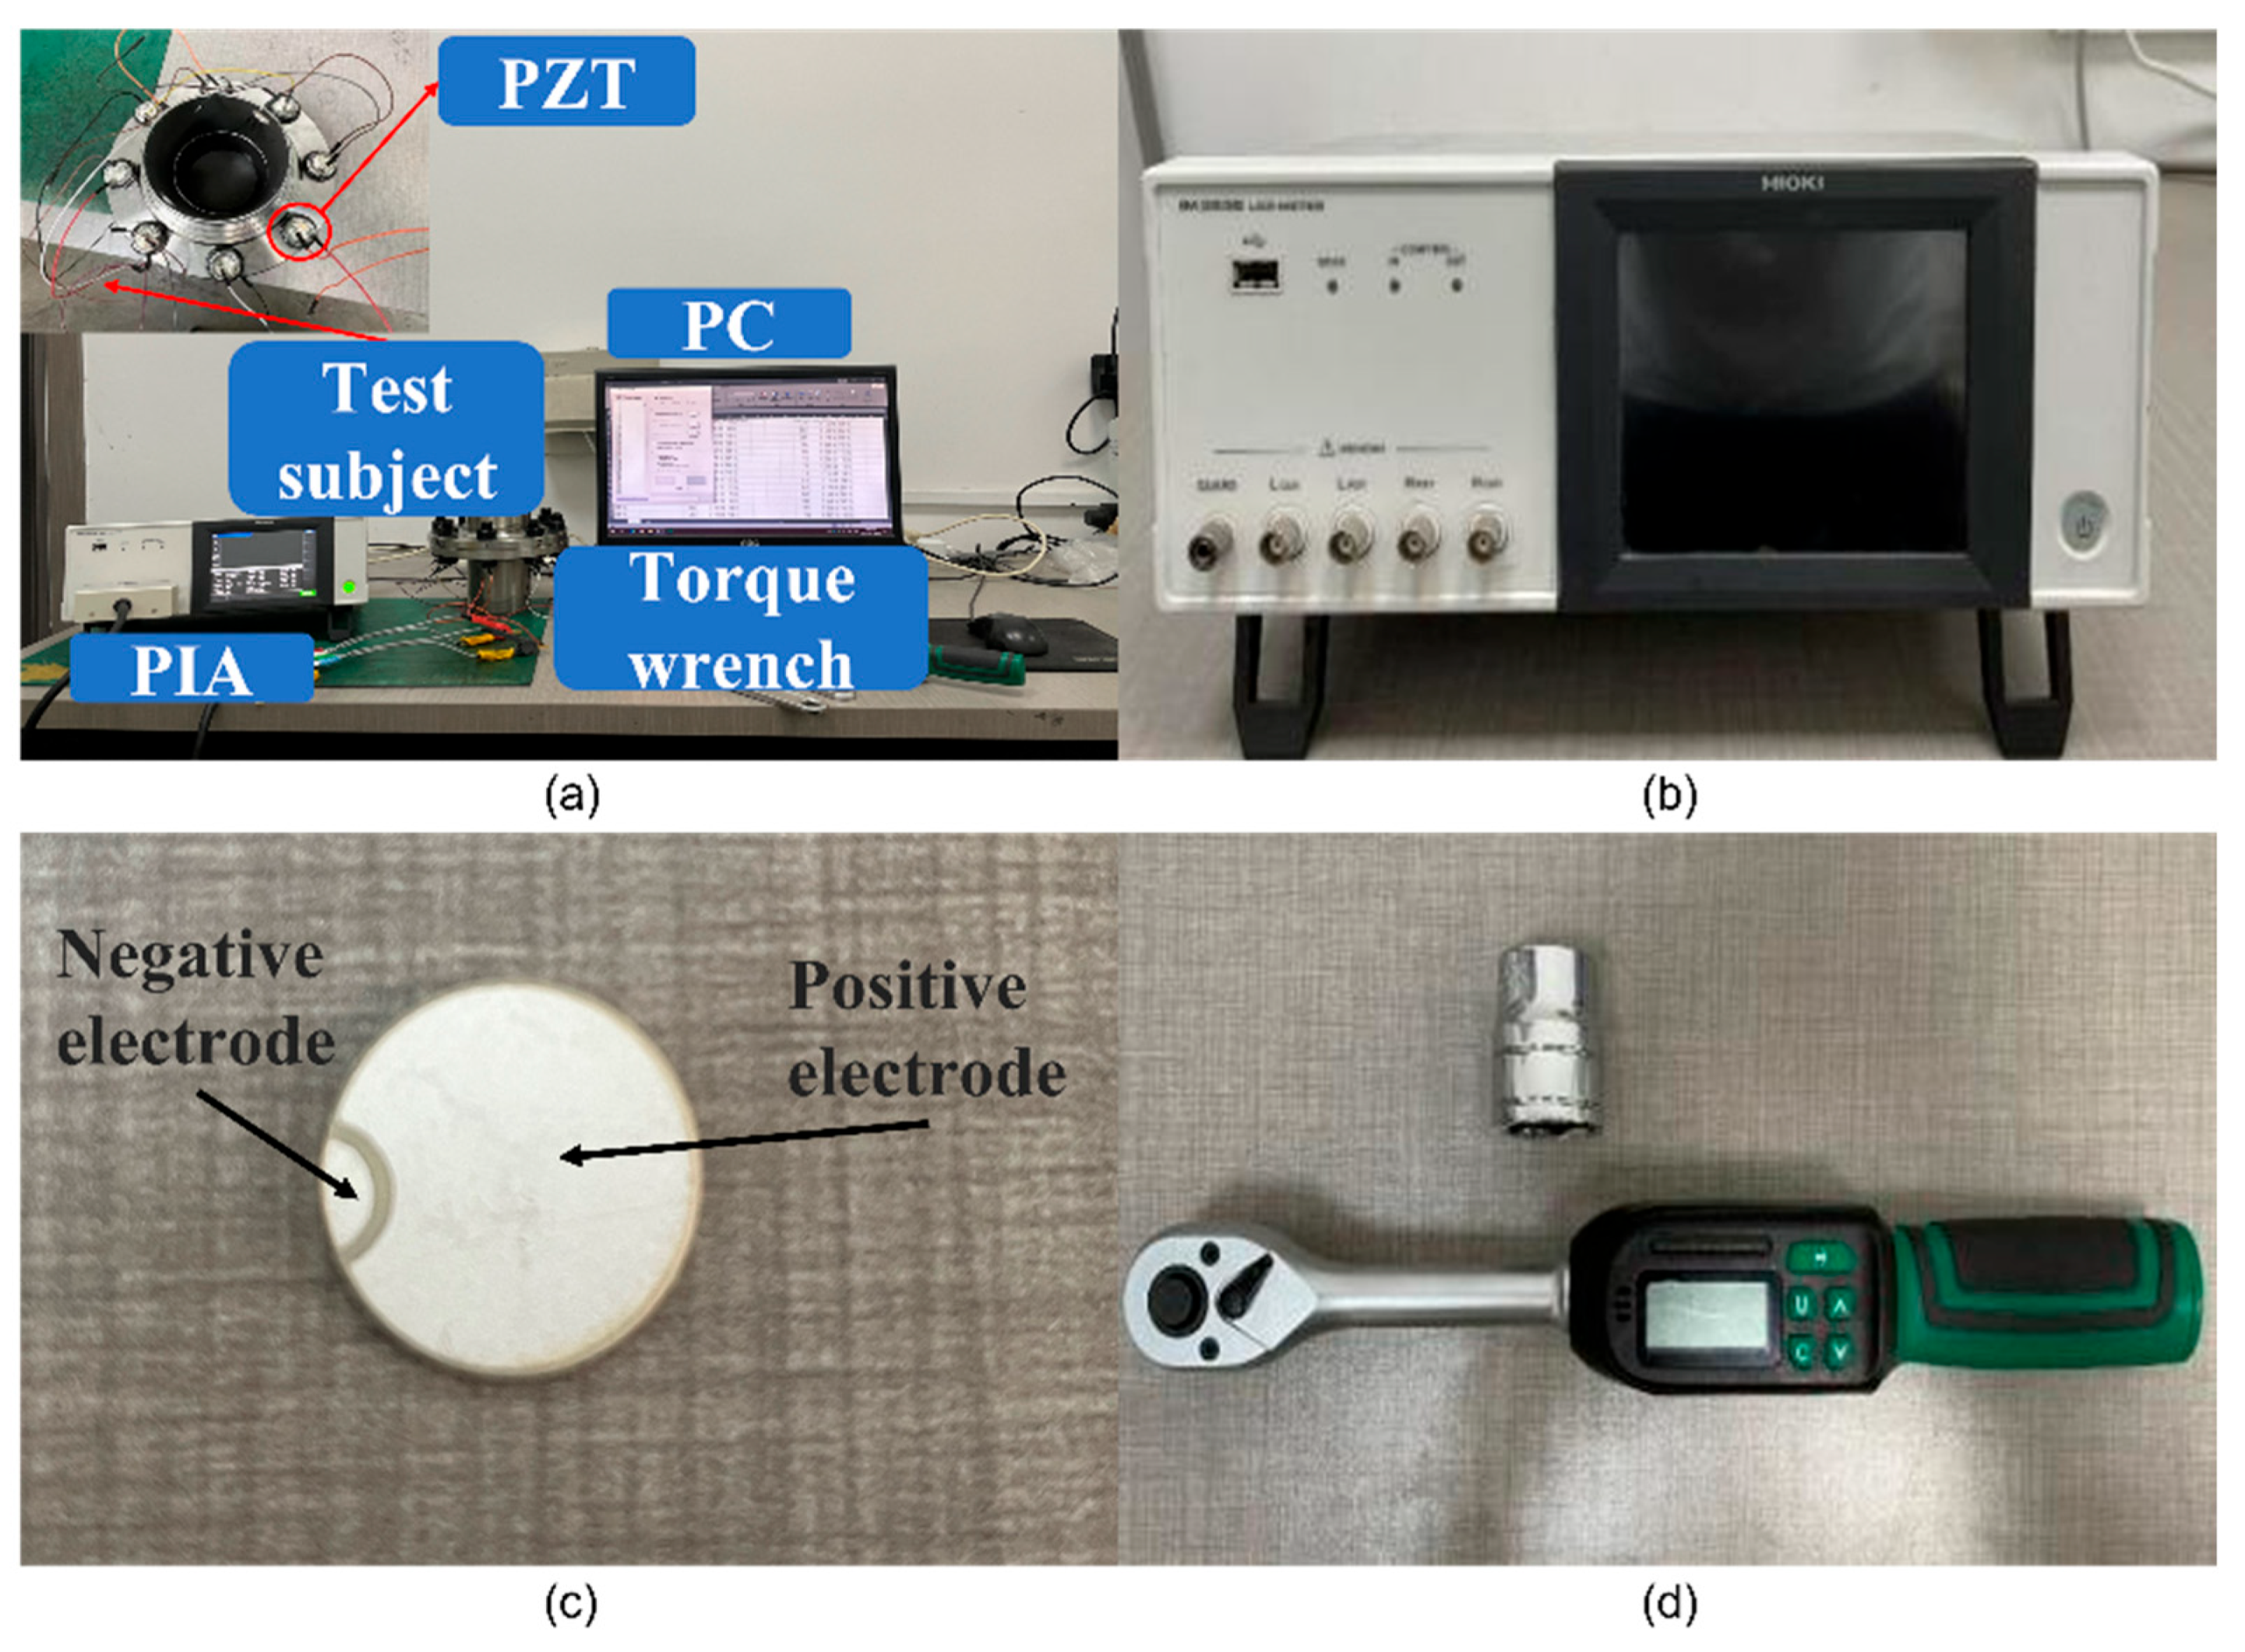
The experimental setup consisted of four primary components: a desktop computer, a HIOKI IM3536 high-frequency impedance analyzer, PZT patches, and a flange assembly with bolted connections. The working principle of the experimental platform is illustrated in Figure 5. As shown in Figure 6a, the impedance analyzer was connected to the PZT patches via soldered wires and equipped with contact shielding modules to minimize external noise. It generated sinusoidal excitation signals and acquired real-time electrical admittance data, which were transmitted to the computer for storage and analysis. The PZT patches (PZT-5 material, dimensions: φ15 mm × 0.2 mm, Figure 6c) are bonded to the center of bolt heads using epoxy adhesive. After a 24 h stationary curing period at room temperature (20–25 °C), the epoxy achieves stable mechanical properties. A calibrated torque wrench (Laplace Instruments Co., Ltd. North Walsham, UK, BS04-135BN) with a range of 6.8–135 N·m and ±3% accuracy (Figure 6d), simulates preload reduction.
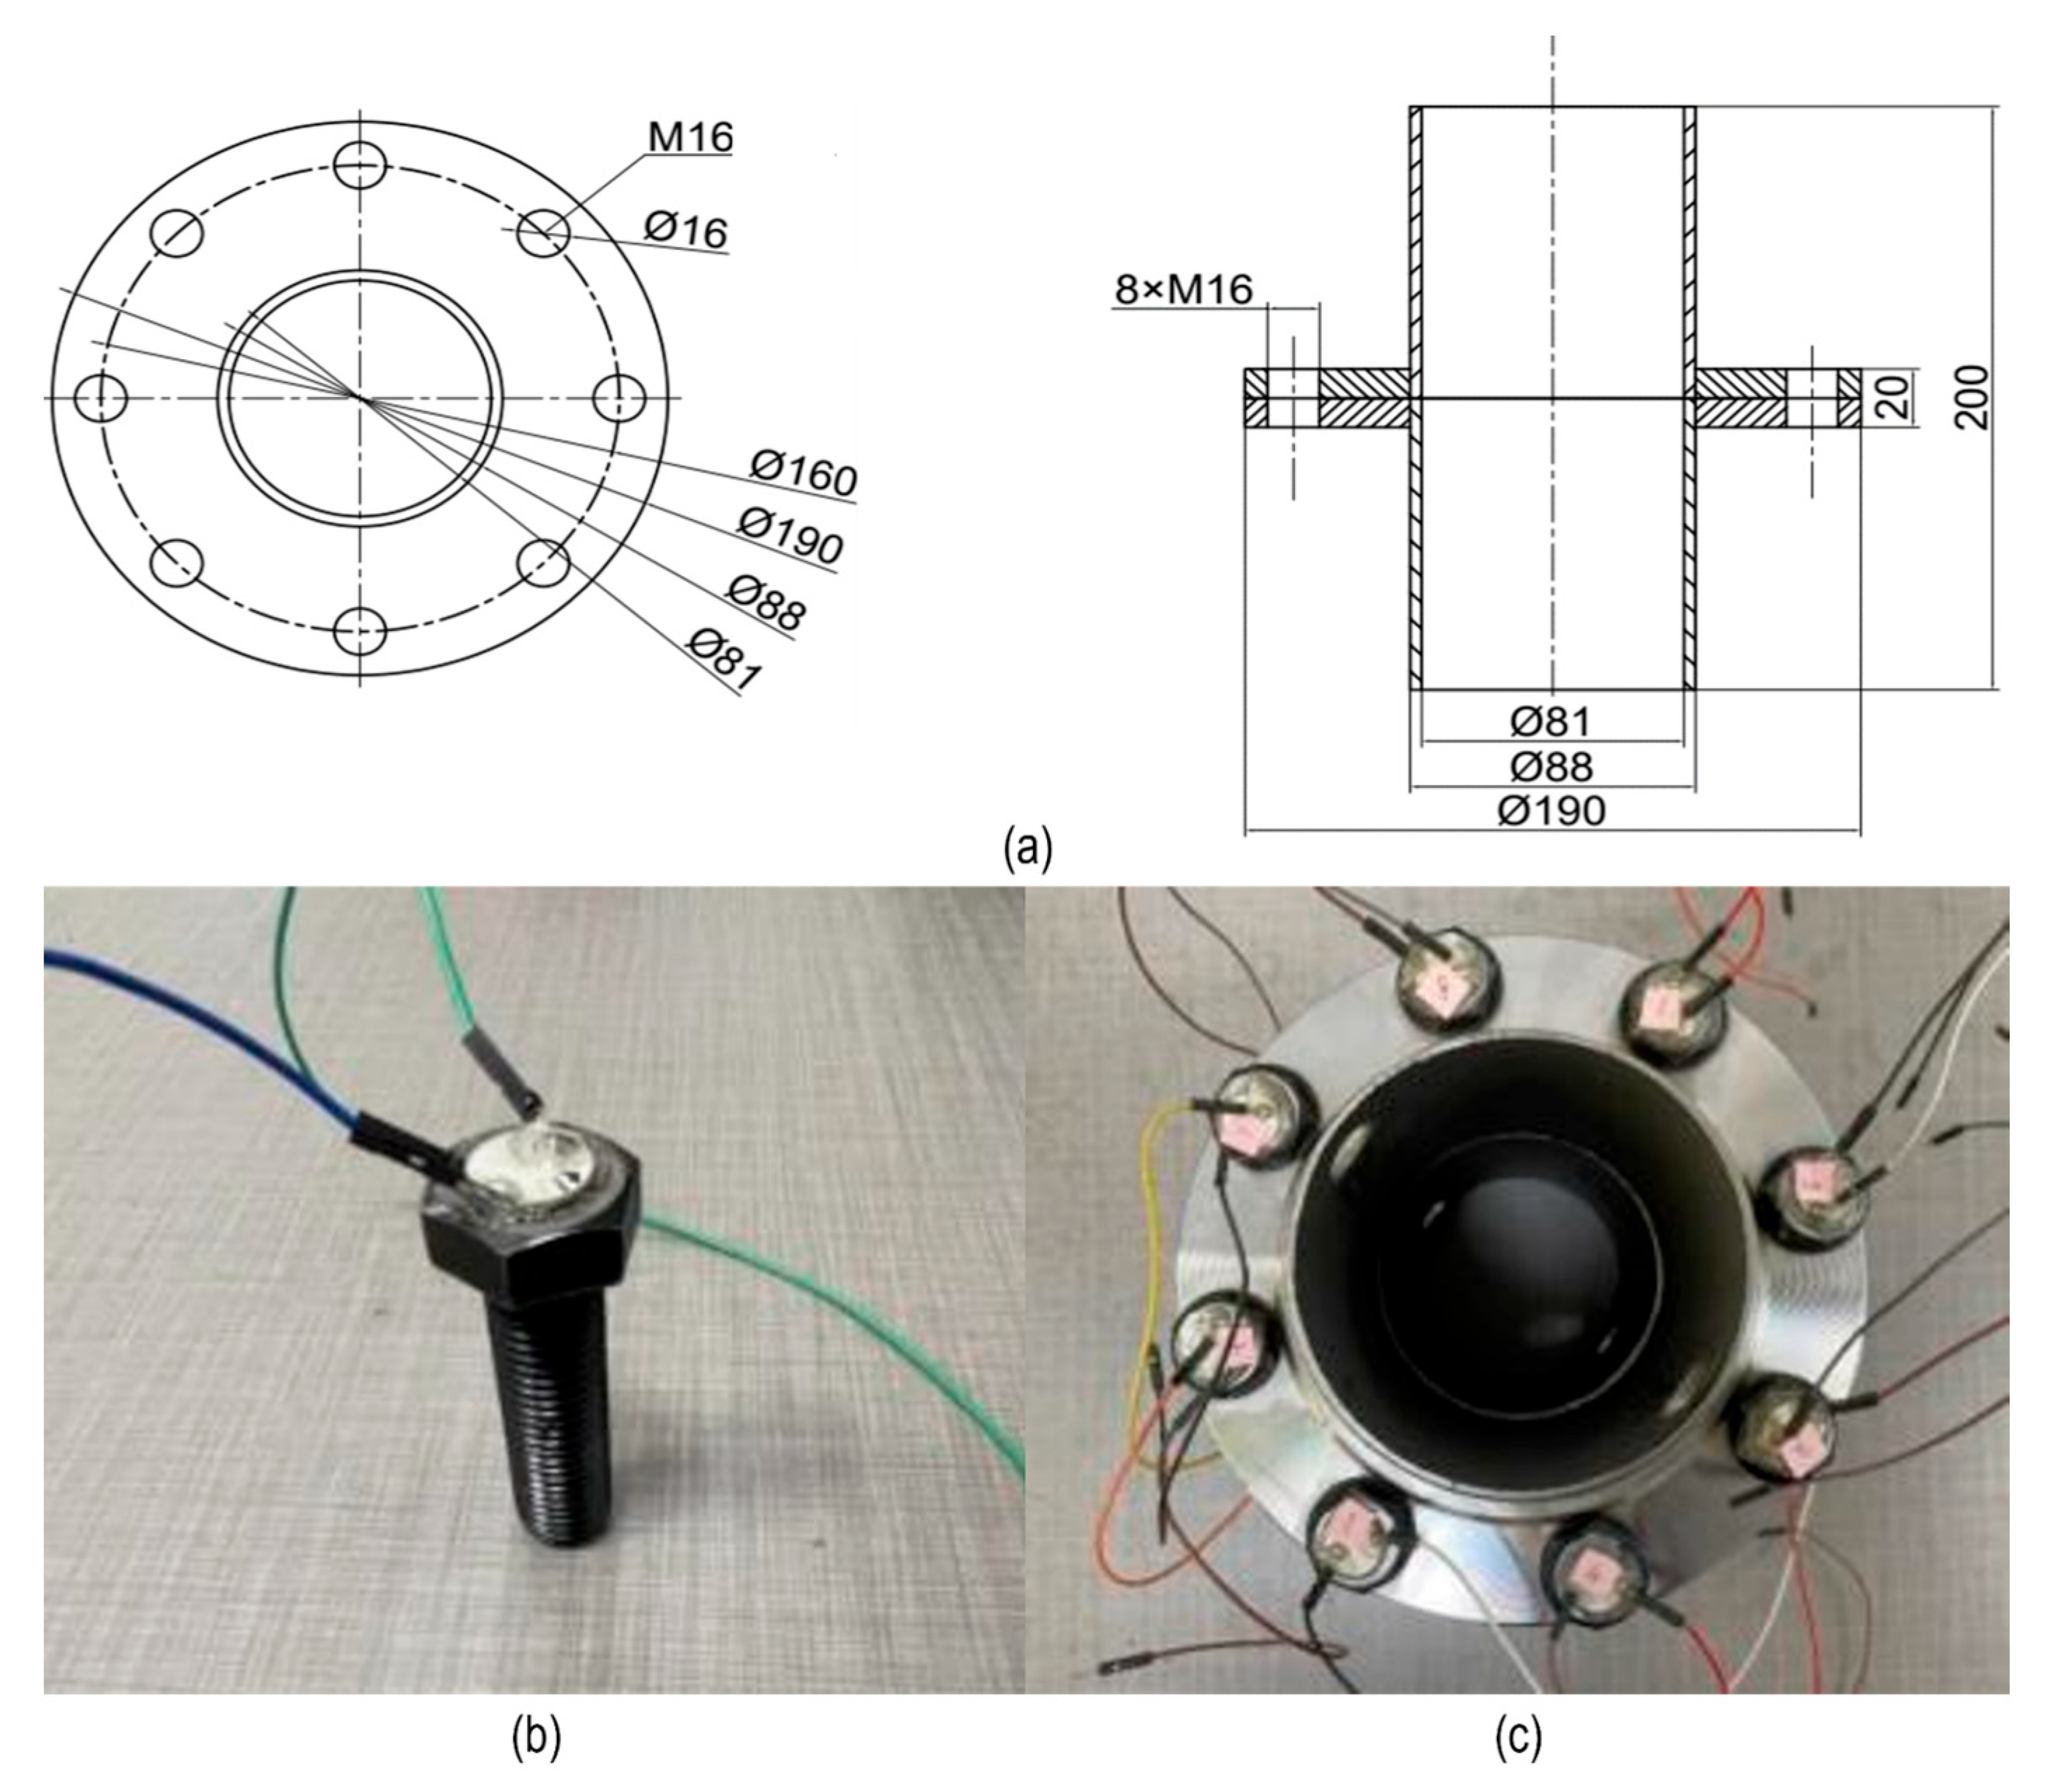
The test specimen of the pipeline flange joint was conducted, featuring a steel flange (outer diameter: 190 mm, height: 200 mm) with eight evenly spaced 16 mm holes for Grade 12.9 M16 bolts (Figure 7a). Each bolt was centrally bonded to a PZT patch (Figure 7b), which functioned as a self-excited transducer. The impedance analyzer output was configured to 1 Vpp, sweeping from 10 Hz to 500 KHz to excite the system. This range was selected based on prior studies [37], which demonstrated that low-frequency admittance components offer higher sensitivity to preload variations, while high-frequency components help reduce structural boundary interference. Additionally, rubber mats were placed beneath the test specimen to mitigate environmental vibration noise. After curing, all bolts were numbered, and their layout is shown in Figure 7c.
To ensure consistent loading and reduce short-term relaxation effects, each bolt was fully loosened and re-tightened before each measurement. Ambient temperature was maintained at 20–25 °C to avoid thermal variability. A total of five discrete preload conditions (50, 40, 30, 20, and 10 N·m) were defined in 10 N·m increments, with 50 N·m representing the fully preloaded state and 10 N·m representing the minimal tightening condition. The experimental procedure was conducted as follows:
(1).
Initial Configuration: All bolts were uniformly torqued to 50 N·m and rested for 5 min to stabilize.
(2).
Preload Variation on Bolt #1: Bolt #1 was fully loosened and re-tightened to 50 N·m for baseline testing. Then, its preload was reduced stepwise to 10 N·m in 10 N·m increments. After each adjustment, a 5 min rest period was applied, followed by impedance data acquisition.
(3).
Sequential Testing: Step 2 was repeated for bolts #2 through #8 to ensure full coverage.
(4).
Repeatability Check: After all bolts were unloaded, the entire test process was repeated the following day to verify data repeatability.
(5).
Data Management: All acquired admittance signals were saved and analyzed to ensure signal consistency and experimental reproducibility.

3. Results

3.1. Hyperparameter Optimization Results

To evaluate the influence of hyperparameters on the training performance of the proposed P-CNN model, we systematically tested different batch sizes and learning rates.
(1)
Batch size
We tested batch sizes of 8, 16, 32, and 128, using a fixed learning rate of 0.02 and 50 training iterations. As shown in Figure 8, the recognition accuracies initially increased with batch size—96.91% (batch size = 8), 98.27% (batch size = 16), 99.27% (batch size = 32)—and then slightly decreased at the largest batch size, reaching 97.84% (batch size = 128). Although training time decreased with increasing batch size—215.6 s (8), 123.4 s (16), 73.5 s (32), and 59.8 s (128)—the accuracy exhibited a slight decline at larger batch sizes. Considering the trade-off between accuracy and efficiency, a batch size of 128 was chosen as it ensures faster training while retaining high recognition performance.
(2)
Learning rate
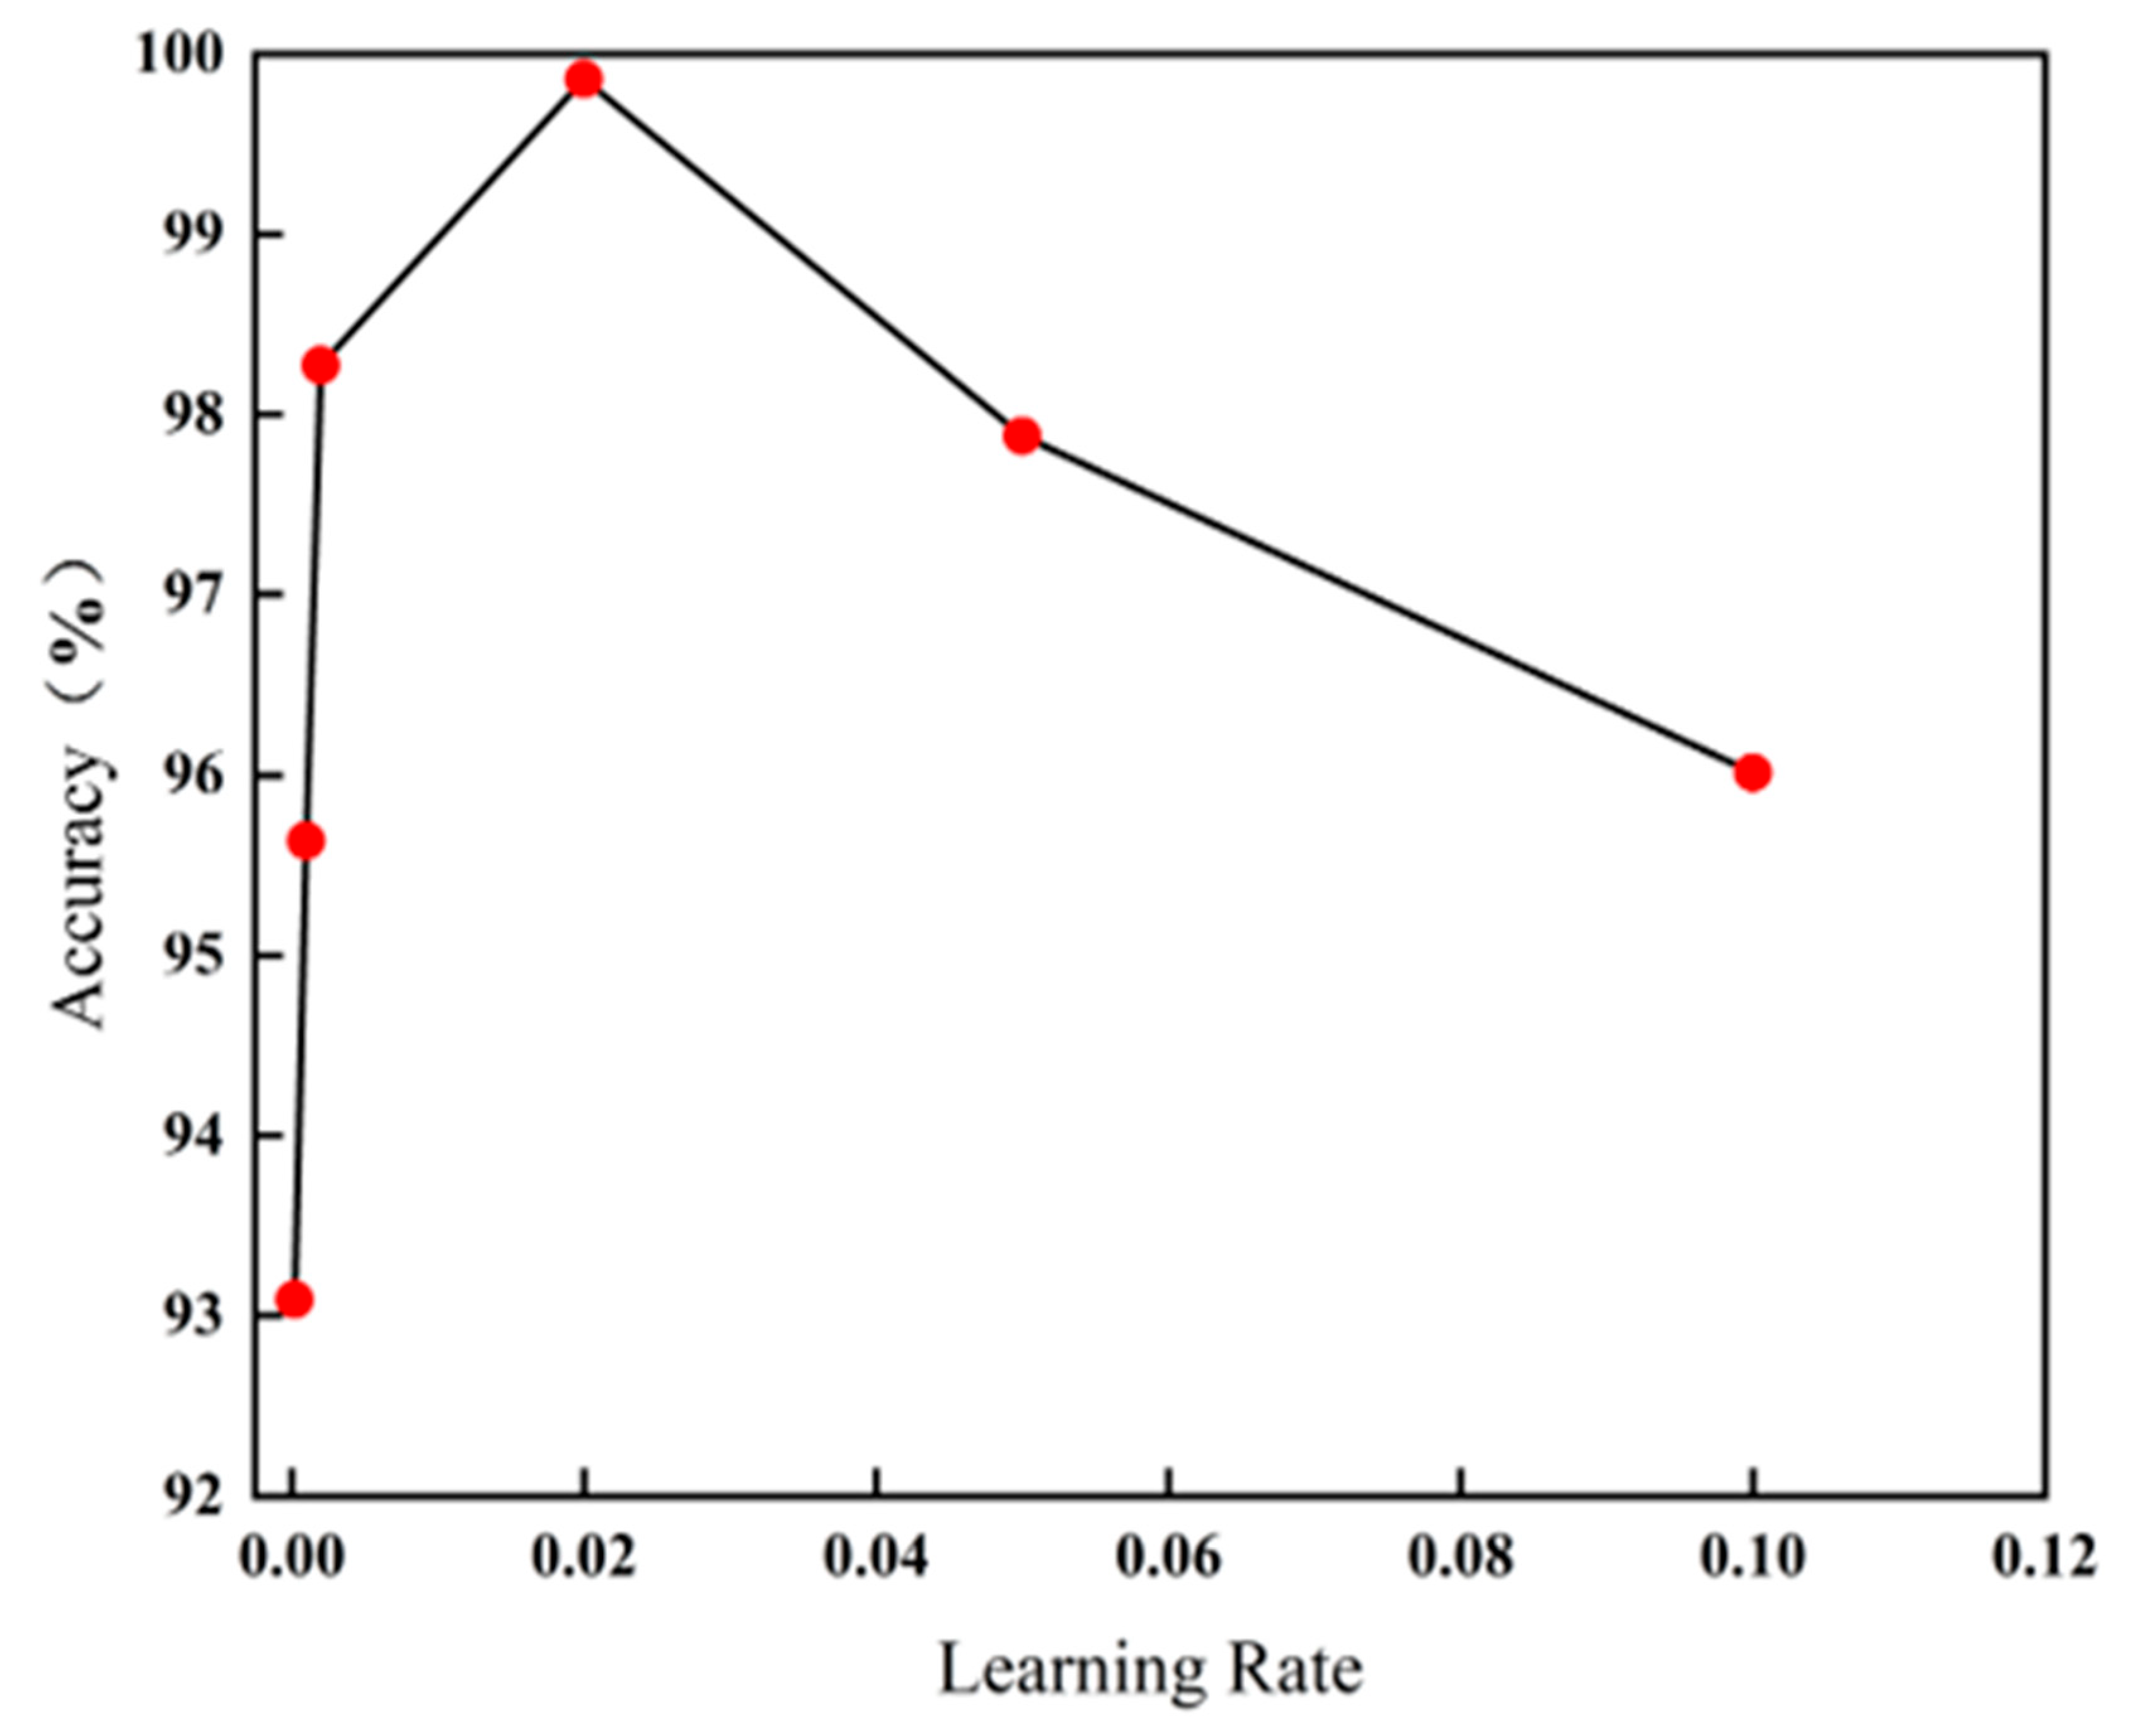
To determine the optimal learning rate, four different values were tested: 0.1, 0.05, 0.02, 0.002, 0.001, and 0.0002. The experiments were conducted with a batch size of 128 and 50 iterations each. As shown in Figure 9, the model achieved its highest recognition accuracy at a learning rate of 0.02 (99.86%). In addition, the differences in training time across the four learning rates were minimal, whereas the differences in recognition accuracy were more pronounced. Therefore, the learning rate was set to 0.02 for subsequent experiments.
Overall, the selected hyperparameter configuration (batch size = 128, learning rate = 0.02) provides a practical balance between training efficiency and classification accuracy, and is particularly suitable for EMI-based monitoring tasks with limited data volume.

3.2. Experiment Results

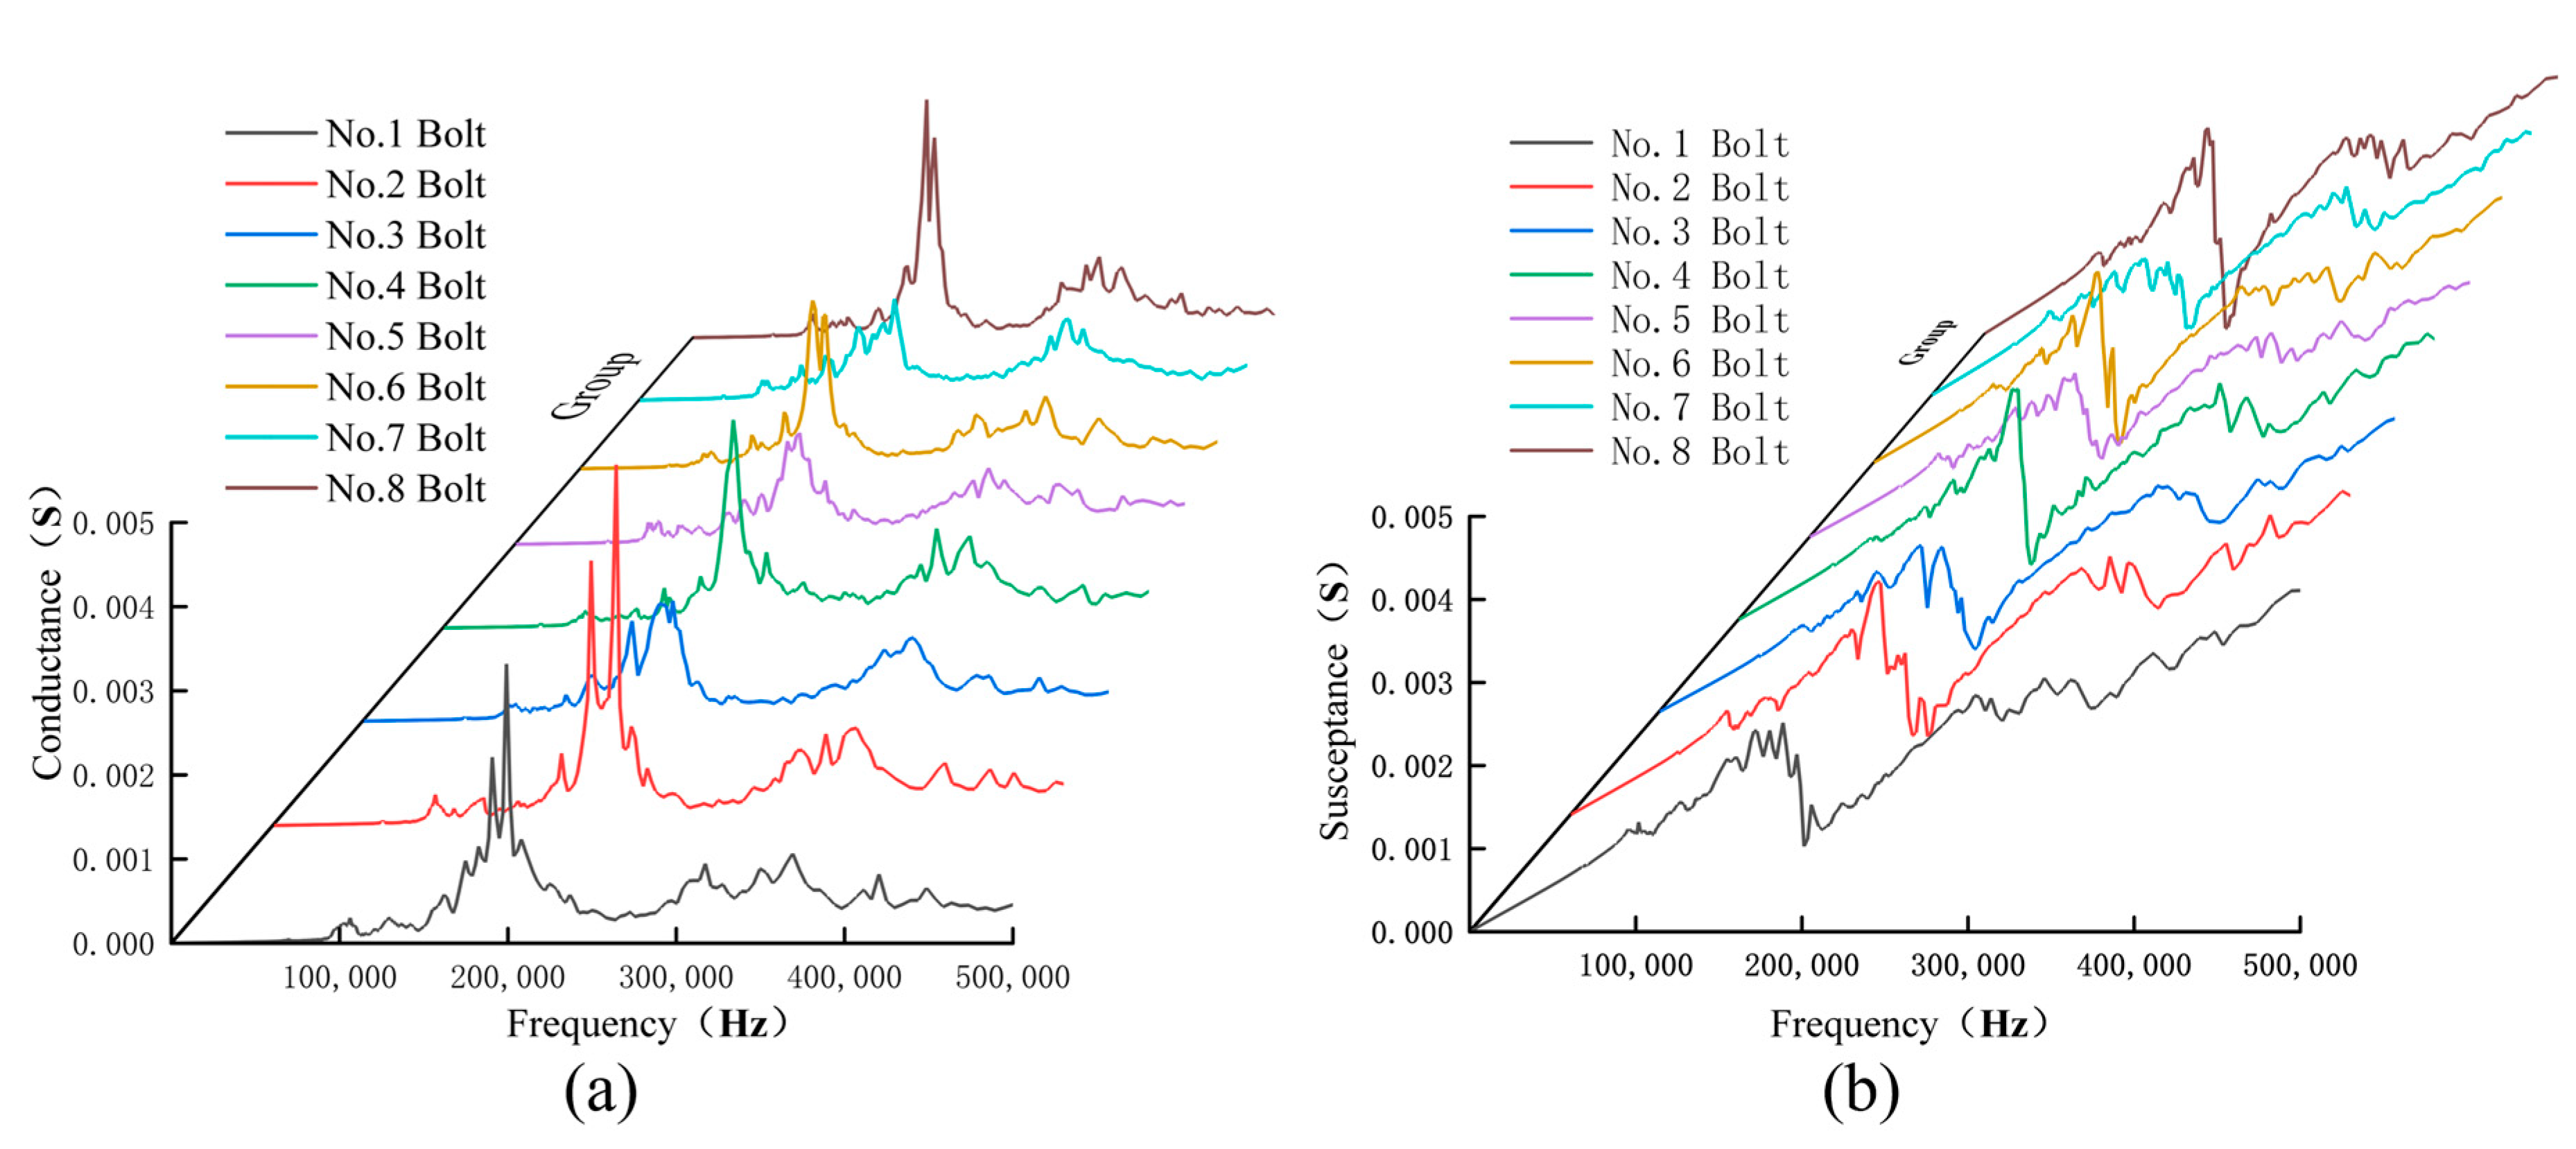
To investigate the relationship between EMI signatures and bolt preload variations, experimental tests were conducted on all eight bolts under fully preloaded conditions (50 N m). Both the real (conductance) and imaginary (susceptance) components of the admittance spectrum were acquired using a precision impedance analyzer. As shown in Figure 10a,b, all bolts exhibited similar admittance response patterns, including a pronounced resonance peak near 200 KHz. Minor frequency shifts and amplitude variations were observed, likely caused by manufacturing tolerances. However, the proposed multi-scale feature extraction strategy is robust to these variations, and the peak-frequency bands remain the primary regions of interest due to their richness in damage-related features. Following prior studies [11], the conductance signal was selected as the primary data source, given its superior sensitivity to structural changes.
Figure 11a,b present the conductance and susceptance curves for Bolt #1 under five different preload conditions (50 to 10 N m). The results show that conductance signals exhibit more significant changes in resonance peak amplitude than susceptance signals as the preload decreases. This trend is further highlighted in Figure 11a, which compares peak variation magnitudes of conductance and susceptance under loosening. These findings confirm that conductance-based features offer higher sensitivity and reliability for identifying preload degradation, thereby justifying their exclusive use in model training.
Figure 12 illustrates the changes in conductance peaks during progressive bolt loosening. Although the amplitude generally increases as the preload decreases, this trend is nonlinear and is embedded within subtle frequency shifts. Specifically, as the preload drops from 50 N m to 10 N m, the admittance amplitude increases, reflecting changes in local interface stiffness and damping. These observations are consistent with existing electromagnetic induction (EMI) studies [35,37]. By examining the abscissa of the conductance curves, it can be seen that the peak frequencies of the curves shift under different conditions. However, compared with the changes in the curve peaks, the amount of frequency shift is relatively small. Although the degree of frequency shift is relatively small compared with the changes in the curve peaks, both frequency shift and peak changes can serve as multi-scale feature information for bolt preload variation for neural network learning and recognition. Taken together, these amplitude and frequency variations constitute multi-scale features that cannot be effectively captured by traditional statistical indices, thereby necessitating the use of deep learning-based methods.

3.3. Comparative Analysis with Conventional CNN

To verify the effectiveness of the proposed P-CNN model in identifying the pre-loading state of bolts in flange connections, comparative experiments were conducted using both a conventional CNN and a single-scale dual-kernel CNN (D-CNN). The bolt preloading dataset obtained from the experiments was used for training and testing. Table 1 provides a comparative analysis of the recognition performance of the traditional CNN, D-CNN, and P-CNN in detecting changes in the bolt preloading force.
As shown in Table 1, the recognition accuracy of the traditional CNN is significantly lower than that of the D-CNN and P-CNN models, with accuracies of 88.21%, 94.66%, and 99.86%, respectively. This confirms that the effective extraction of multi-scale features related to changes in the bolt preloading force enables the D-CNN and P-CNN models to achieve superior performance, with P-CNN providing the highest recognition capability.
This confirms that the effective extraction of multi-scale features related to changes in the bolt preloading force enables the P-CNN to achieve superior performance. Previous research [38] has indicated that integrating the multi-scale features of structural damage allows the P-CNN model to capture and utilize more information for learning and recognition, thereby enhancing its performance.
Training time consumption is another important indicator for evaluating network performance, which is jointly affected by the iteration count, number of network parameters, and network depth. As shown in Table 1, compared with the traditional CNN, the training time of the P-CNN model increased by approximately 36 s. This increase is attributed to the fact that the feature extraction branch of the P-CNN has more layers and parameters, requiring more optimization during training, which extends the training duration. However, compared with the improvement in recognition accuracy, the difference in time consumption can be considered negligible.
As shown in Figure 13a, all models are sensitive to changes in bolt preload. The training loss value drops rapidly after 10 iterations, indicating that the neural network successfully extracted feature information in the early stages of training. The curve flattens out after 25 iterations, suggesting that the learning process is essentially complete. Figure 13b shows that the recognition accuracy of all models rises quickly within 10 iterations and stabilizes around 30 iterations, with test accuracies all exceeding 90%, demonstrating the network’s high sensitivity to changes in bolt preload status. Comparisons reveal that the training loss curves of the single-scale dual-core CNN and P-CNN decline swiftly, indicating higher learning efficiency. Although the traditional CNN can also achieve a test accuracy of over 90% in the later stages, its speed and precision are both lower than those of the single-scale dual-core CNN and P-CNN. The P-CNN has higher recognition accuracy and a smoother curve, outperforming the single-scale dual-core CNN. Overall, the P-CNN outperforms both the single-scale dual-core CNN and the traditional CNN, with a recognition accuracy as high as 99%, proving its superiority.

3.4. Confusion Matrix Analysis

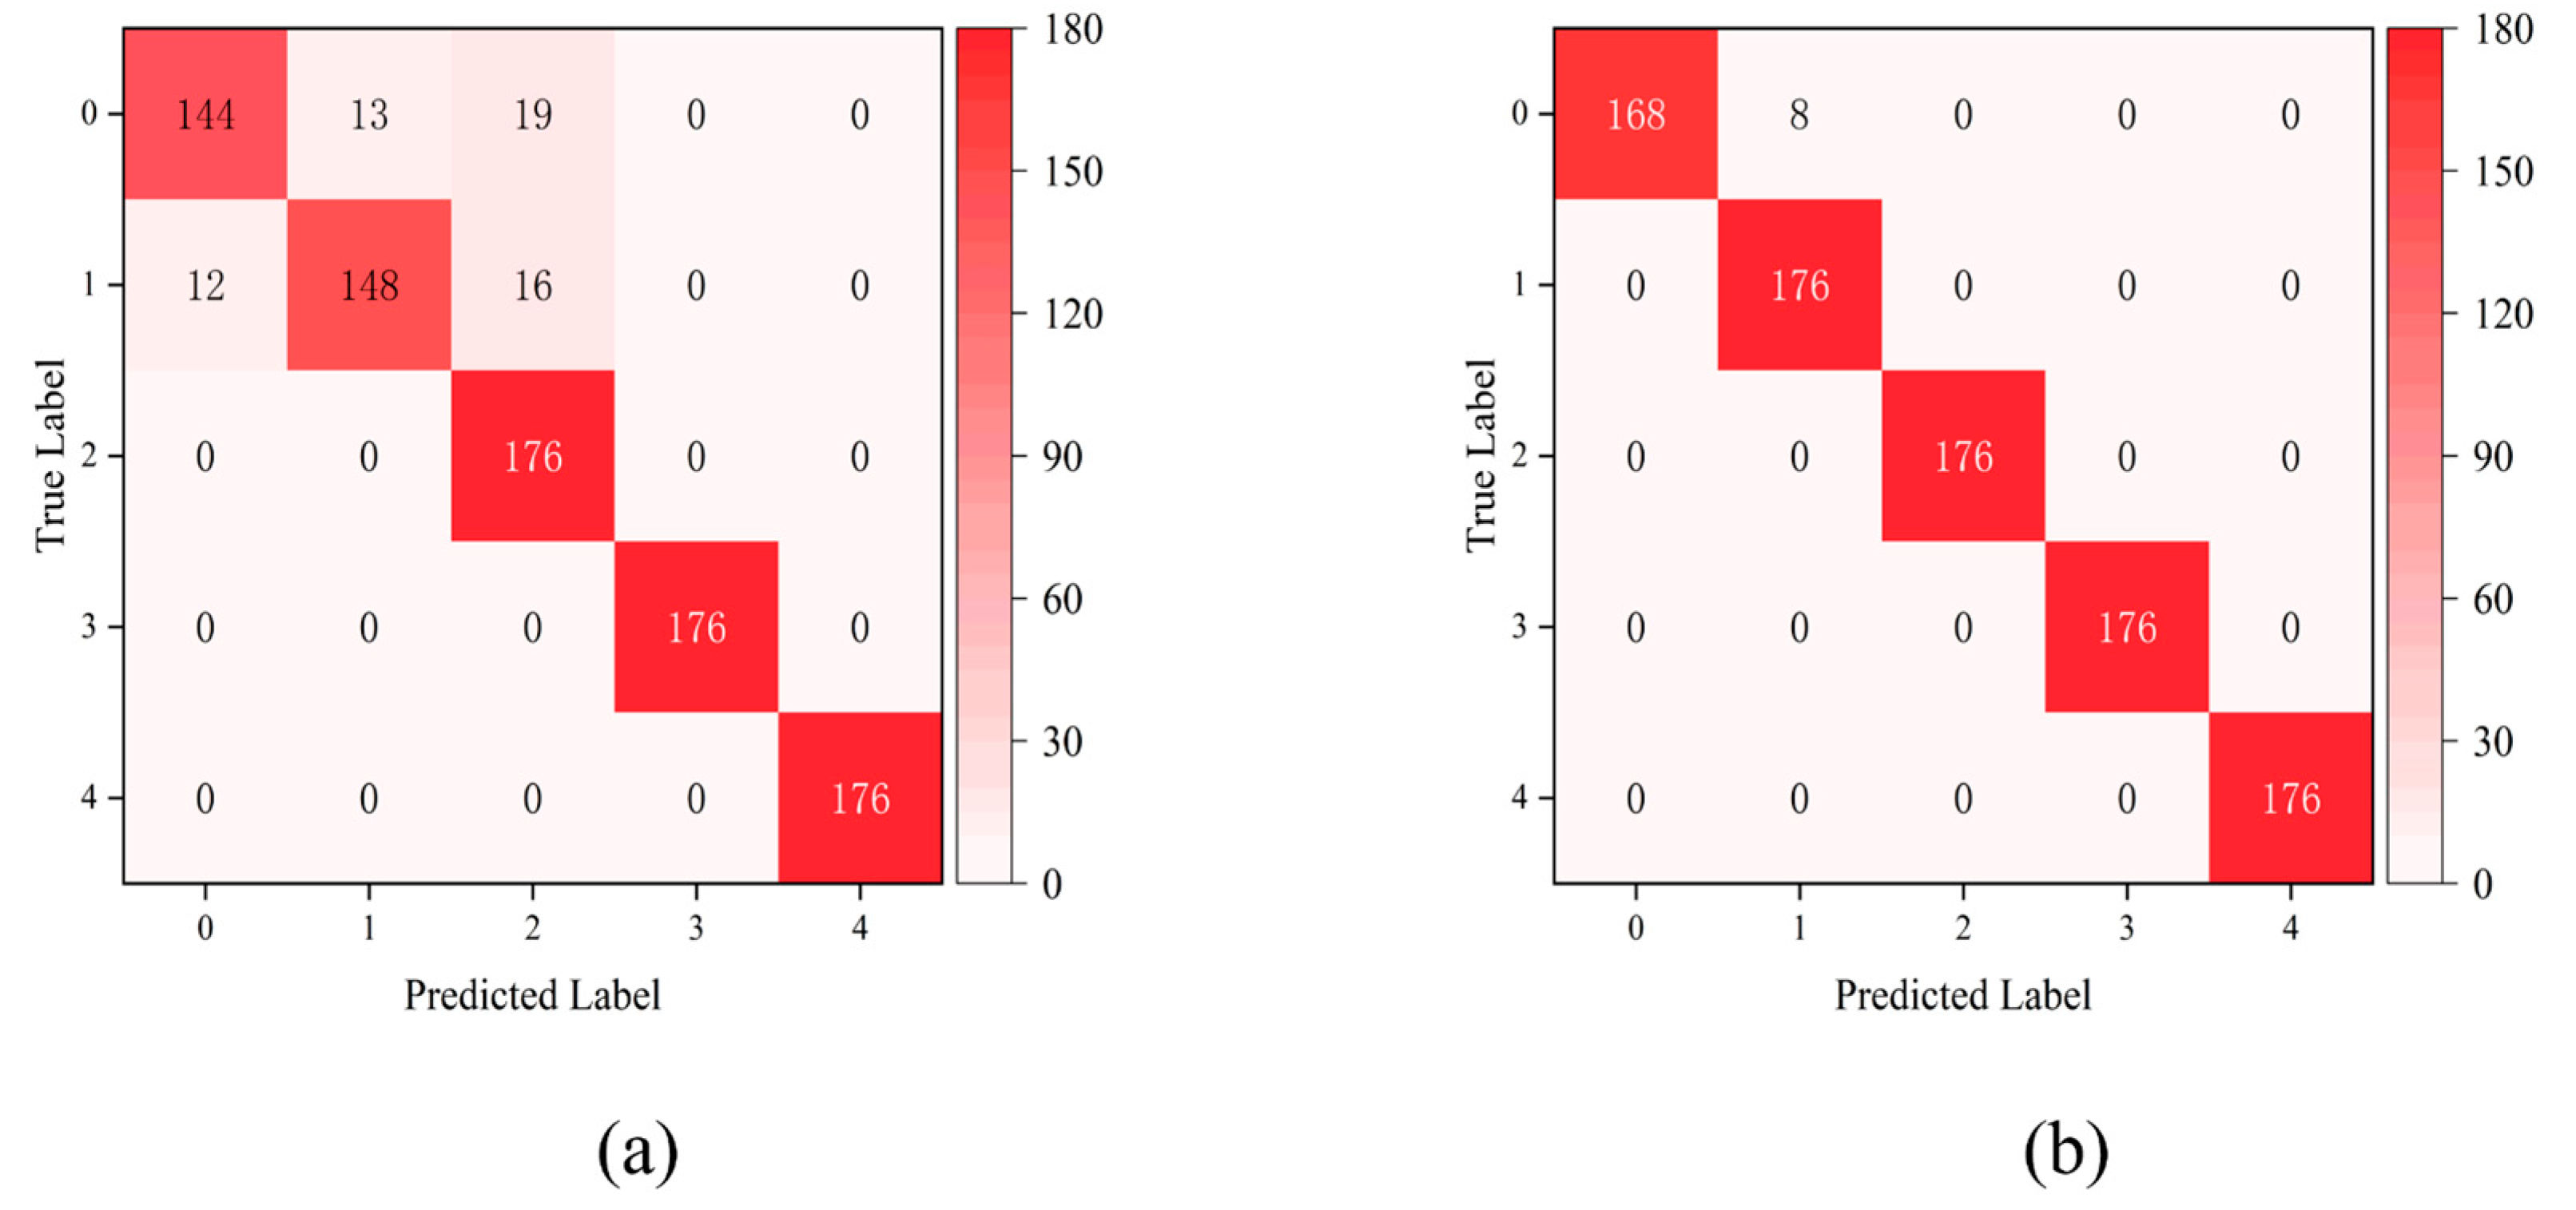
The confusion matrix was used as a criterion for evaluating the correct and incorrect classifications for each damage condition. From Figure 14, by comparing the confusion matrices of the two models, it can be observed that the traditional CNN exhibits misclassifications in identifying the first three conditions, with as many as 53 misclassifications out of 176 classifications in the first condition alone. In contrast, the P-CNN confusion matrix showed only 8 misclassifications out of 176 classifications in the first condition, with all other conditions being correctly classified. Therefore, it can be concluded that, compared with the traditional CNN, the P-CNN demonstrates superior capability in identifying changes in the bolt preloading force and achieves extremely high classification accuracy.
In conclusion, combining EMI-based sensing with deep learning significantly improves the capability for rapid, accurate, and automated monitoring of bolt preload states. The proposed P-CNN, empowered by multi-scale feature extraction and attention mechanisms, achieved extremely high classification accuracy (99.86%), validating its effectiveness for intelligent bolt health monitoring in practical engineering scenarios.

4. Discussion

To further enhance the performance of the proposed P-CNN method under limited data conditions, a channel attention mechanism (SE-Net) was integrated into the original network architecture. Additionally, the experimentally obtained bolt preload dataset was systematically reduced to create reduced-size sample sets for analysis. The training results on these reduced datasets were then compared with those obtained using the full dataset to evaluate the model’s performance under small-sample scenarios. To ensure fairness, all network parameters were kept constant, and the training environment was strictly controlled.
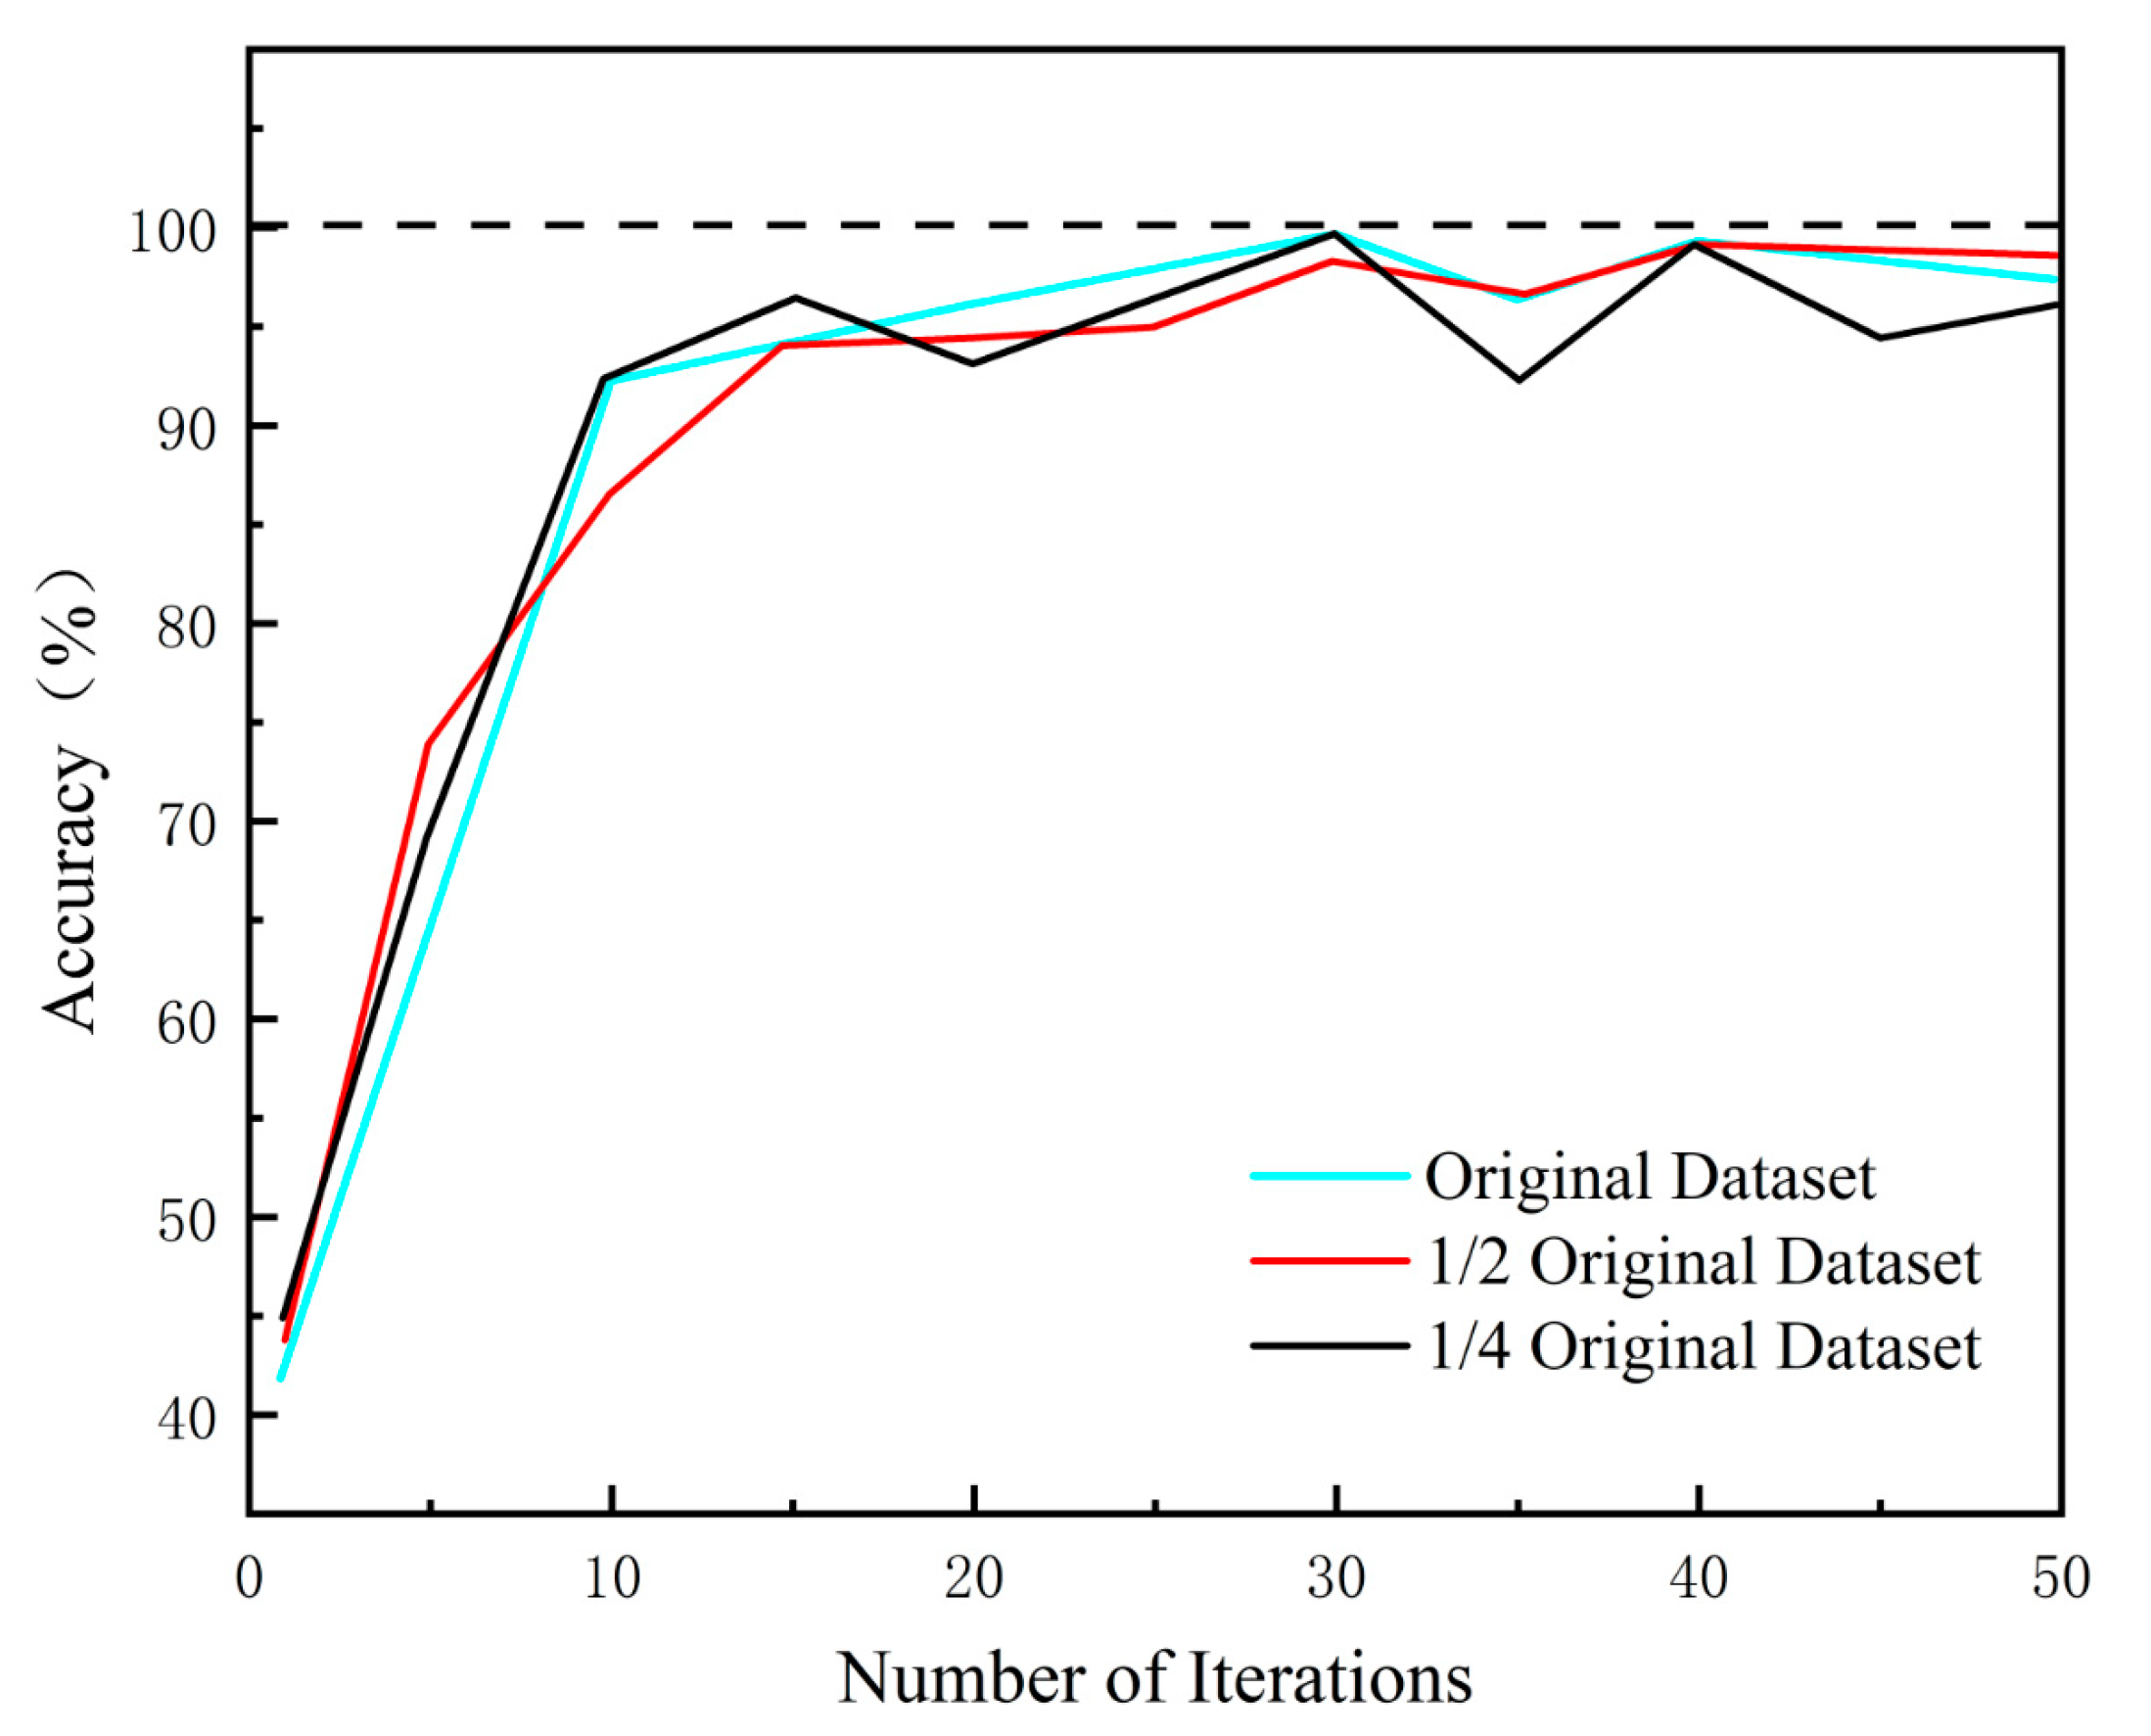
Figure 15 presents the classification performance of the proposed P-CNN model under three different dataset scales: full-size, 1/2 scale, and 1/4 scale, with a horizontal dotted line at 100% accuracy included as a reference benchmark to indicate the ideal recognition accuracy. This analysis was conducted to evaluate the model’s robustness and generalization capability in small-sample scenarios, which are common in real-world structural health monitoring tasks. Despite a slight increase in variance, the 1/4 scale dataset still achieved an average recognition accuracy of approximately 95%, with only slight fluctuations in classification accuracy. The 1/2 scale dataset maintained accuracy levels nearly identical to those of the full dataset. These results demonstrate that the P-CNN retains high classification performance even under significant data reduction, indicating strong adaptability and stability. This capability is particularly valuable in practical engineering applications where collecting large amounts of high-quality training data is often labor-intensive, time-consuming, or constrained by operational conditions. Therefore, the proposed model not only maintains reliable performance across varying data scales but also reduces the burden of data acquisition, offering a resource-efficient solution for intelligent bolt preload monitoring.
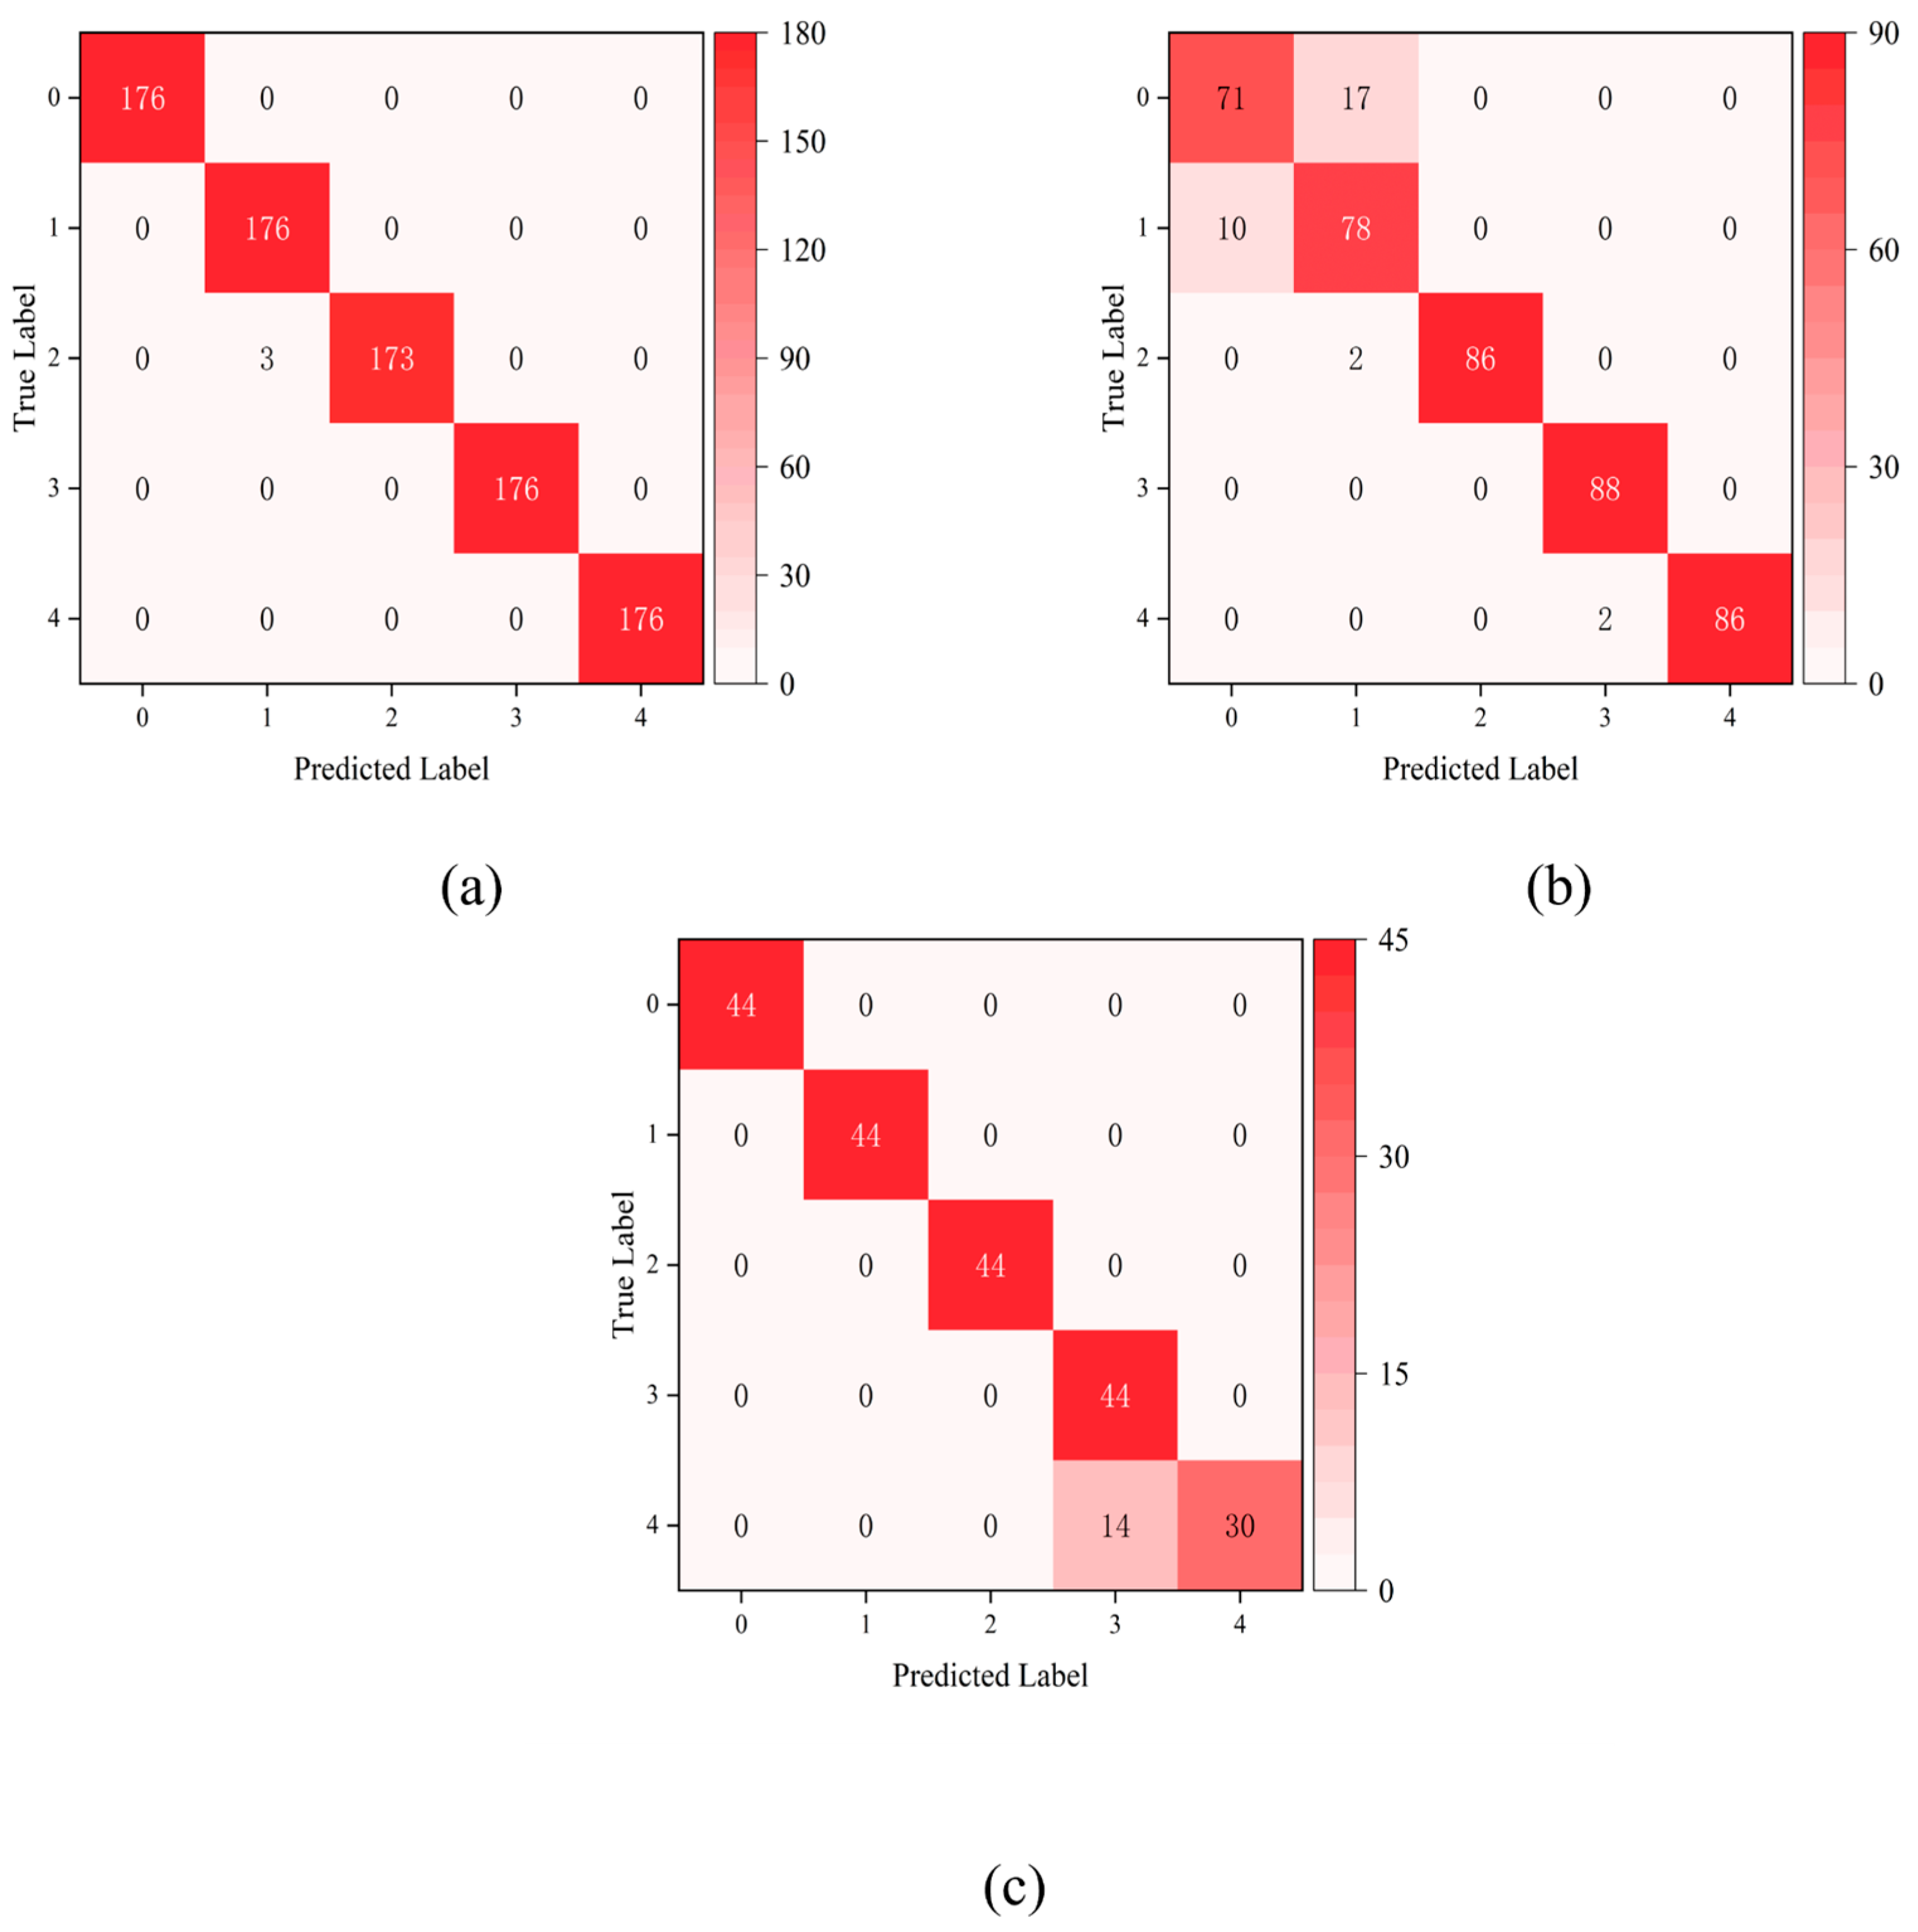
Figure 16 presents the confusion matrices of the P-CNN model trained on datasets of three different sizes: full, 1/2, and 1/4 of the original dataset. When trained on the full dataset, the model achieved perfect classification across all preload conditions, with no misclassifications. With the dataset reduced to 50% of its original size, the model introduced only a small number of misclassifications—10 and 17 instances in two specific conditions—while maintaining perfect recognition in the remaining classes. This corresponds to a misclassification rate below 5% overall. Further reduction to 25% of the original dataset size led to 14 misclassifications in a single condition comprising 44 instances, with all other conditions accurately identified. Despite the substantial reduction in training data availability, the P-CNN still achieved over 95% accuracy across the board. These results confirm that the P-CNN maintains strong generalization capability and class-level robustness even under limited data scenarios, which is critical in practical applications where extensive data collection is often infeasible. Even with a 75% reduction in training data, the model preserved over 95% class-wise accuracy, demonstrating with only a marginal performance degradation (less than 4%).
In summary, integrating the SENet attention mechanism into the P-CNN architecture significantly enhanced the model’s performance and interpretability under small-sample scenarios. By applying channel-wise weighting to convolutional outputs, the attention module enables the network to focus on structurally salient features while suppressing irrelevant information. Combined with the dual-branch multi-scale structure, this attention-guided framework enables more effective representation learning across a wide range of feature scales. Consequently, the SENet-enhanced P-CNN not only outperforms the baseline CNN in terms of overall classification accuracy but also demonstrates superior stability, especially when trained on limited or imbalanced datasets. These results validate the practical applicability of the proposed method for intelligent bolt preload monitoring and provide a promising foundation for broader deployment in data-constrained structural health monitoring applications.

5. Conclusions

To address the limitations of traditional vibration methods and electromagnetic impedance techniques in structural health monitoring, such as insufficient multi-scale feature extraction, susceptibility to environmental interference, and poor recognition accuracy under small sample conditions, this study proposes a new intelligent structural health monitoring method. The proposed approach is elaborated as follows:
  • The method combines multi-scale convolutional feature extraction and channel attention mechanisms to monitor changes in bolt preload by analyzing the changes in the electrical admittance spectra of surface-mounted piezoelectric sensors. A wide excitation frequency range of 10–400 KHz is selected to capture key signal changes related to bolt loosening, such as resonance peak shifts and amplitude attenuations.
  • The method innovatively employs a dual-branch multi-scale convolutional strategy. It uses convolutional kernels of sizes 1 × 3 and 1 × 7 to extract local and global frequency–domain features, respectively. Dilated convolutions are applied to enhance the long-range receptive field. Moreover, a channel attention module based on SENet is embedded to adaptively recalibrate the importance of the learned frequency bands. This approach helps to mitigate the limitations of traditional CNNs in capturing weak damage signals.
  • Under laboratory-scale bolted flange connections, the P-CNN achieved a classification accuracy of 99.86% across different preload levels (50–10 N m), which is 11.65% higher than that of traditional CNN models. Even with only 25% of the original training data, the model still maintained an accuracy of 95.4%, demonstrating strong robustness and generalization ability under data-scarce conditions. By combining electromagnetic impedance techniques with data-driven learning, this method effectively decouples multi-scale signal features related to connection stiffness degradation, providing a highly sensitive and scalable solution for bolt health monitoring. It also represents a significant advancement in the practical deployment of electromagnetic impedance-based methods in complex engineering environments.

Author Contributions

Conceptualization, X.F. and J.K.; methodology, X.F.; software, J.K.; validation, J.K., H.W. and K.H.; formal analysis, J.K.; investigation, J.K.; resources, X.F.; data curation, H.W.; writing—original draft preparation, J.K.; writing—review and editing, H.W., K.H. and L.L.; visualization, K.H. and L.L.; supervision, T.Z.; project administration, X.F. and T.Z.; funding acquisition, X.F. and T.Z. All authors have read and agreed to the published version of the manuscript.

Funding

The author(s) disclosed receipt of the following financial support for the research, authorship, and/or publication of this article: This work is supported by the National Natural Science Foundation of China (No. 52108285) and the QinChuangYuan Platform High-level Innovation and Entrepreneurship Talent Projects (No. QCYRCXM-2022-311).

Data Availability Statement

The raw data supporting the conclusions of this article will be made available by the authors on request.

Conflicts of Interest

Author Xingyu Fan was employed by the company Zhejiang Zomax Transmission Co., Ltd. The remaining authors declare that the research was conducted in the absence of any commercial or financial relationships that could be construed as a potential conflict of interest.

Abbreviations

The following abbreviations are used in this manuscript:
EMIElectro-mechanical impedance
PZTLead zirconate titanate
SHMStructural health monitoring
NDTNon-destructive testing
CNNConvolutional neural network
P-CNNMulti-scale dual-core parallel convolutional neural network
SENetSqueeze-and-Excitation Network

References

  1. Wang, Y.-Q.; Wu, J.-K.; Liu, H.-B.; Kuang, K.; Cui, X.-W.; Han, L.-S. Analysis of elastic interaction stiffness and its effect on bolt preloading. Int. J. Mech. Sci. 2017, 130, 307–314. [Google Scholar] [CrossRef]
  2. Na, W.S.; Baek, J. A review of the piezoelectric electromechanical impedance based structural health monitoring technique for engineering structures. Sensors 2018, 18, 1307. [Google Scholar] [CrossRef]
  3. Huda, F.; Kajiwara, I.; Hosoya, N.; Kawamura, S. Bolt loosening analysis and diagnosis by non-contact laser excitation vibration tests. Mech. Syst. Signal Process. 2013, 40, 589–604. [Google Scholar] [CrossRef]
  4. Miao, R.; Shen, R.; Zhang, S.; Xue, S. A review of bolt tightening force measurement and loosening detection. Sensors 2020, 20, 3165. [Google Scholar] [CrossRef] [PubMed]
  5. Wang, T.; Song, G.; Wang, Z.; Li, Y. Proof-of-concept study of monitoring bolt connection status using a piezoelectric based active sensing method. Smart Mater. Struct. 2013, 22, 087001. [Google Scholar] [CrossRef]
  6. Wang, F.; Chen, Z.; Song, G. Monitoring of multi-bolt connection looseness using entropy-based active sensing and genetic algorithm-based least square support vector machine. Mech. Syst. Signal Process. 2020, 136, 106507. [Google Scholar] [CrossRef]
  7. Li, D.; Nie, J.-H.; Wang, H.; Ren, W.-X. Loading condition monitoring of high-strength bolt connections based on physics-guided deep learning of acoustic emission data. Mech. Syst. Signal Process. 2024, 206, 110908. [Google Scholar] [CrossRef]
  8. Kaye, A. Undertaking bolted joint integrity management: Getting to zero leaks quickly and effectively. In Proceedings of the Pressure Vessels and Piping Conference, Vancouver, BC, Canada, 17–21 July 2016; American Society of Mechanical Engineers: Two Park Avenue, NY, USA, 2016; Volume 50398, p. V003T03A010. [Google Scholar]
  9. Deka, A.; Rao, A.N.; Kamath, S.R.; Anmol, G.; Gangadharan, K.V. Bolted lap joint structure: Structural health monitoring using damping ratio as indicator. In Proceedings of the 2nd Mechanical Engineering Graduate Research Symposium, Mumbai, India, 21 March 2015; IIT Mumbai: Mumbai, India, 2015. [Google Scholar]
  10. Liu, H.; Sun, W.; Du, D.; Liu, X. Modeling and free vibration analysis for bolted composite plate under inconsistent pre-tightening condition. Compos. Struct. 2022, 292, 115634. [Google Scholar] [CrossRef]
  11. Wang, F.; Ho, S.C.M.; Huo, L.; Song, G. A novel fractal contact-electromechanical impedance model for quantitative monitoring of bolted joint looseness. IEEE Access 2018, 6, 40212–40220. [Google Scholar] [CrossRef]
  12. Parvasi, S.M.; Ho, S.C.M.; Kong, Q.; Mousavi, R.; Song, G. Real time bolt preload monitoring using piezoceramic transducers and time reversal technique—A numerical study with experimental verification. Smart Mater. Struct. 2016, 25, 085015. [Google Scholar] [CrossRef]
  13. Yin, H.; Wang, T.; Yang, D.; Liu, S.; Shao, J.; Li, Y. A smart washer for bolt looseness monitoring based on piezoelectric active sensing method. Appl. Sci. 2016, 6, 320. [Google Scholar] [CrossRef]
  14. Zhang, Z.; Xu, H.; Liao, Y.; Su, Z.; Xiao, Y. Vibro-acoustic modulation (VAM)-inspired structural integrity monitoring and its applications to bolted composite joints. Compos. Struct. 2017, 176, 505–515. [Google Scholar] [CrossRef]
  15. Kong, Q.; Zhu, J.; Ho, S.C.M.; Song, G. Tapping and listening: A new approach to bolt looseness monitoring. Smart Mater. Struct. 2018, 27, 07LT02. [Google Scholar] [CrossRef]
  16. Wang, F.; Song, G. Bolt-looseness detection by a new percussion-based method using multifractal analysis and gradient boosting decision tree. Struct. Health Monit. 2020, 19, 2023–2032. [Google Scholar] [CrossRef]
  17. Tenreiro, A.F.G.; Lopes, A.M.; da Silva, L.F.M. A review of structural health monitoring of bonded structures using electromechanical impedance spectroscopy. Struct. Health Monit. 2022, 21, 228–249. [Google Scholar] [CrossRef]
  18. Cao, P.; Zhang, S.; Wang, Z.; Zhou, K. Damage identification using piezoelectric electromechanical impedance: A brief review from a numerical framework perspective. Structures 2023, 50, 1906–1921. [Google Scholar] [CrossRef]
  19. Zhou, L.; Chen, S.X.; Ni, Y.Q.; Choy, A.W.H. EMI-GCN: A hybrid model for real-time monitoring of multiple bolt looseness using electromechanical impedance and graph convolutional networks. Smart Mater. Struct. 2021, 30, 035032. [Google Scholar] [CrossRef]
  20. Lim, Y.Y.; Bhalla, S.; Soh, C.K. Structural identification and damage diagnosis using self-sensing piezo-impedancetransducers. Smart Mater. Struct. 2006, 15, 987. [Google Scholar] [CrossRef]
  21. Ai, D.; Luo, H.; Wang, C.; Zhu, H. Monitoring of the load-induced RC beam structural tension/compression stress and damage using piezoelectric transducers. Eng. Struct. 2018, 154, 38–51. [Google Scholar] [CrossRef]
  22. Bois, C.; Hochard, C. Monitoring of laminated composites delamination based on electro-mechanical impedance measurement. J. Intell. Mater. Syst. Struct. 2004, 15, 59–67. [Google Scholar] [CrossRef]
  23. Ai, D.; Zhang, R. Deep learning of electromechanical admittance data augmented by generative adversarial networks for flexural performance evaluation of RC beam structure. Eng. Struct. 2023, 296, 116891. [Google Scholar] [CrossRef]
  24. Martowicz, A.; Sendecki, A.; Salamon, M.; Rosiek, M.; Uhl, T. Application of electromechanical impedance-based SHM for damage detection in bolted pipeline connection. Nondestruct. Test. Eval. 2016, 31, 17–44. [Google Scholar] [CrossRef]
  25. Wang, L.; Yuan, B.; Xu, Z.; Sun, Q. Synchronous detection of bolts looseness position and degree based on fusing electro-mechanical impedance. Mech. Syst. Signal Process. 2022, 174, 109068. [Google Scholar] [CrossRef]
  26. Huo, L.; Chen, D.; Liang, Y.; Li, H.; Feng, X.; Song, G. Impedance based bolt pre-load monitoring using piezoceramic smart washer. Smart Mater. Struct. 2017, 26, 057004. [Google Scholar] [CrossRef]
  27. Nguyen, T.T.; Ta, Q.B.; Ho, D.D.; Kim, J.T.; Huynh, T.C. A method for automated bolt-loosening monitoring and assessment using impedance technique and deep learning. Dev. Built Environ. 2023, 14, 100122. [Google Scholar] [CrossRef]
  28. Luo, W.; Liu, T.; Li, W.; Luo, M. Pitting corrosion prediction based on electromechanical impedance and convolutional neural networks. Struct. Health Monit. 2023, 22, 1647–1664. [Google Scholar] [CrossRef]
  29. Li, G.; Luo, M.; Huang, J.; Li, W. Early-age concrete strength monitoring using smart aggregate based on electromechanical impedance and machine learning. Mech. Syst. Signal Process. 2023, 186, 109865. [Google Scholar] [CrossRef]
  30. de Rezende, S.W.F.; Moura, J.d.R.V.d.; Neto, R.M.F.; Gallo, C.A.; Steffen, V. Convolutional neural network and impedance-based SHM applied to damage detection. Eng. Res. Express 2020, 2, 035031. [Google Scholar] [CrossRef]
  31. Du, F.; Wu, S.; Xu, C.; Yang, Z.; Su, Z. Electromechanical impedance temperature compensation and bolt loosening monitoring based on modified Unet and multitask learning. IEEE Sens. J. 2021, 23, 4556–4567. [Google Scholar] [CrossRef]
  32. Ai, D.; Cheng, J. A deep learning approach for electromechanical impedance based concrete structural damage quantification using two-dimensional convolutional neural network. Mech. Syst. Signal Process. 2023, 183, 109634. [Google Scholar] [CrossRef]
  33. Ghaderiaram, A.; Schlangen, E.; Fotouhi, M. Structural Fatigue Life Monitoring with Piezoelectric-Based Sensors: Fundamentals, Current Advances, and Future Directions. Sensors 2025, 25, 334. [Google Scholar] [CrossRef]
  34. Zu, K.; Zhu, J.; Haardt, M. Uplink Multi—User MIMO Detection via Parallel Access. In Proceedings of the ICASSP 2019 IEEE International Conference on Acoustics, Speech and Signal Processing (ICASSP), Brighton, UK, 12–17 May 2019; pp. 4365–4369. [Google Scholar]
  35. Guo, H.; Zhong, J.; Feng, B.; Chen, Y.; Zhong, S. Detection Method for Bolt Loosening Based on Summation Coefficient of Absolute Spectrum Ratio. Sensors 2025, 25, 246. [Google Scholar] [CrossRef]
  36. Liang, C.; Sun, F.P.; Rogers, C.A. An impedance method for dynamic analysis of active material systems. J. Vib. Acoust. 1994, 116, 120–128. [Google Scholar] [CrossRef]
  37. Ju, M.; Dou, Z.; Li, J.-W.; Qiu, X.; Shen, B.; Zhang, D.; Yao, F.-Z.; Gong, W.; Wang, K. Piezoelectric materials and sensors for structural health monitoring: Fundamental aspects, current status, and future perspectives. Sensors 2023, 23, 543. [Google Scholar] [CrossRef]
  38. Park, G.; Inman, D.J. Impedance-Based Structural Health Monitoring. In Damage Prognosis: For Aerospace, Civil and Mechanical Systems; Wiley: Hoboken, NJ, USA, 2005; pp. 275–292. [Google Scholar]
Figure 1. Simplified one-dimensional model of EMI.
Applsci 15 09715 g001
Figure 2. Workflow of the proposed attention-enhanced multi-scale EMI-based P-CNN method for bolt loosening identification.
Applsci 15 09715 g002
Figure 3. Architecture of the 1D CNNs using EMI spectroscopy as input.
Applsci 15 09715 g003
Figure 4. The structural framework of the SENet attention module.
Applsci 15 09715 g004
Figure 5. The working principle of the experimental platform.
Applsci 15 09715 g005
Figure 6. (a) Test platform. (b) High Frequency Impedance Analyzer. (c) PZT-5 piezoelectric ceramic sensor. (d) BS04-135BN force wrench.
Applsci 15 09715 g006
Figure 7. (a) Schematic representation of the geometric dimensions of the test model. (b) Glue the bolts of the PZT. (c) Bolt number and position.
Applsci 15 09715 g007
Figure 8. The recognition accuracy of P-CNN under different batch numbers (batch size = 8, 16, 32, and 128).
Applsci 15 09715 g008
Figure 9. The recognition accuracy of P-CNN under different learning rates (0.1, 0.05, 0.02, 0.002, 0.001, and 0.0002).
Applsci 15 09715 g009
Figure 10. Admittance responses of all eight bolts under fully preloaded conditions (50 N·m) (a) Conductance curve; (b) susceptance curve.
Applsci 15 09715 g010
Figure 11. Conductance and susceptance curves of Bolt #1 under five different preload conditions (50 to 10 N·m) (a) Conductance curve; (b) susceptance curve.
Applsci 15 09715 g011
Figure 12. Multi-scale variations in conductance and susceptance during progressive loosening of Bolt #1 under different preload forces (50 to 10 N·m) (a) Comparison of the peak changes in the conductance and susceptance of bolt no. 1, (b) variation in the peak conductance under different preloading forces.
Applsci 15 09715 g012
Figure 13. Training and recognition performance of all models under varying bolt preload conditions (a) Loss curve; (b) accuracy curve.
Applsci 15 09715 g013
Figure 14. (a) Traditional CNN confusion matrix; (b) P-CNN confusion matrix.
Applsci 15 09715 g014
Figure 15. Recognition accuracy of P-CNN under different sample datasets.
Applsci 15 09715 g015
Figure 16. (a) Original dataset; (b) 1/2 original dataset; (c) 1/4 original dataset.
Applsci 15 09715 g016
Table 1. Identification of two types of networks.
Evaluation CriteriaTraditional CNND-CNNP-CNN
Epoch (times)505050
Iteration time (s)40.888.276.9
Accuracy (%)88.2194.6699.86
Disclaimer/Publisher’s Note: The statements, opinions and data contained in all publications are solely those of the individual author(s) and contributor(s) and not of MDPI and/or the editor(s). MDPI and/or the editor(s) disclaim responsibility for any injury to people or property resulting from any ideas, methods, instructions or products referred to in the content.