1. Introduction
Wetlands, among the most productive ecosystems on Earth, play a crucial role in regulating regional hydrology, preserving biodiversity, sequestering carbon, mitigating emissions, and improving water quality [
1]. However, in recent decades, wetlands have suffered significant loss and degradation, resulting in ecological and environmental challenges at both regional and global scales. These changes have significantly affected the sustainable development of regional ecosystems, economies, and societies, positioning the simulation of wetland landscape change trends as a key research focus in resource and environmental science [
2,
3].
The degradation of wetlands is often driven by a combination of natural factors (e.g., climate change, hydrological alterations) and anthropogenic activities (e.g., urbanization, agricultural expansion, and policy interventions). Understanding these dynamics requires robust modeling approaches that can capture both gradual changes and abrupt shifts caused by policy implementations or extreme events.
Research on wetland landscape change currently spans multiple spatial scales, ranging from national and provincial to municipal and local levels. Key research areas include the spatiotemporal characteristics of wetland changes, driving factors, landscape pattern evolution, and future trend simulations. However, the complexity of factors influencing wetland systems, coupled with the stochastic nature of human activities and policy interventions, makes predicting wetland change trends a frontier research challenge. Traditional models often assume linear evolution of spatial patterns based on historical trajectories, which may fail to account for nonlinear or abrupt changes, such as those driven by sudden policy shifts (e.g., ecological redline enforcement or large-scale afforestation programs). Commonly used models for predicting wetland landscape change include the Markov model, system dynamics (SD) model, cellular automata (CA) and its enhanced versions, the conversion of land use and its effects (CLUE) model, and the future land use simulation (FLUS) model [
4,
5]. However, previous studies have shown that these models are limited in analyzing the driving factors of change and face challenges in balancing numerical prediction accuracy with spatial pattern forecasting capabilities [
6]. For instance, while Markov models excel in quantifying transition probabilities, they often lack spatial explicitness, whereas CA models may struggle with capturing the complex interactions between multiple driving factors.
The Patch-Generating Land Use Simulation (PLUS) model, developed in [
7], is a CA-based model utilizing raster data. It is widely employed to investigate the driving mechanisms of multi-class land expansion and to predict land use landscape evolution at the patch level. With its high predictive accuracy and capacity to effectively identify the driving factors of land use changes [
6], the PLUS model has gained increasing attention in wetland landscape prediction in recent years. The model’s integration of a land expansion analysis strategy (LEAS) and a multi-class random patch seed mechanism (CARS) allows for a more nuanced understanding of both gradual and abrupt changes, making it particularly suitable for regions subject to strong policy interventions or natural disturbances. However, its applications have primarily focused on medium- and large-scale predictions, as demonstrated in large watershed simulations [
6] with relatively few studies addressing its use in local-scale wetland landscape prediction such as that of specific lake ecosystems [
7].
East Dongting Lake is a national nature reserve for wetland ecosystems and rare bird species, and it is one of the 21 internationally important wetland nature reserves designated by the Chinese government and listed under the Ramsar Convention on Wetlands. However, studies on predicting and simulating wetland change trends in this region remain limited [
8,
9]. The region has experienced dramatic landscape transformations, such as the plantation land due to the “Three-Year Action Plan for Ecological Environment Special Rectification of Dongting Lake (2018–2020),” highlighting the need for models that can incorporate such policy-driven changes. This study examines the East Dongting Lake wetland using the PLUS model, integrated with the Markov model’s quantitative predictive capabilities, to analyze wetland change processes and identify key driving factors and their contributions. The study subsequently simulates wetland change trends in 2030, offering scientific support for the protection, planning, and management of the East Dongting Lake wetland while providing a methodological reference for future wetland prediction studies. By incorporating dynamic transition rules and scenario-based approaches, this research addresses the limitations of linear assumptions and provides a framework for predicting both gradual and abrupt changes in wetland landscapes.
In the context of scenario setting, the study acknowledges the limitations of assuming linear evolution of spatial patterns. For example, the sharp decline in poplar plantations land from 2019 to 2022 was driven by policy interventions (e.g., poplar tree felling), which cannot be captured by linear projections alone. To address this, the study defines two scenarios—natural development and ecological regulation—explicitly accounting for policy impacts and nonlinear dynamics. This approach enhances the model’s ability to predict future changes under varying governance and environmental conditions.
The findings underscore the importance of integrating policy-driven changes into predictive models, as purely linear or historical trajectory-based assumptions may lead to significant inaccuracies. Future research could further refine the PLUS model by coupling it with dynamic evaluation frameworks or machine learning algorithms to better capture the complex, nonlinear interactions between natural and anthropogenic drivers.
2. Materials and Methods
2.1. Study Area
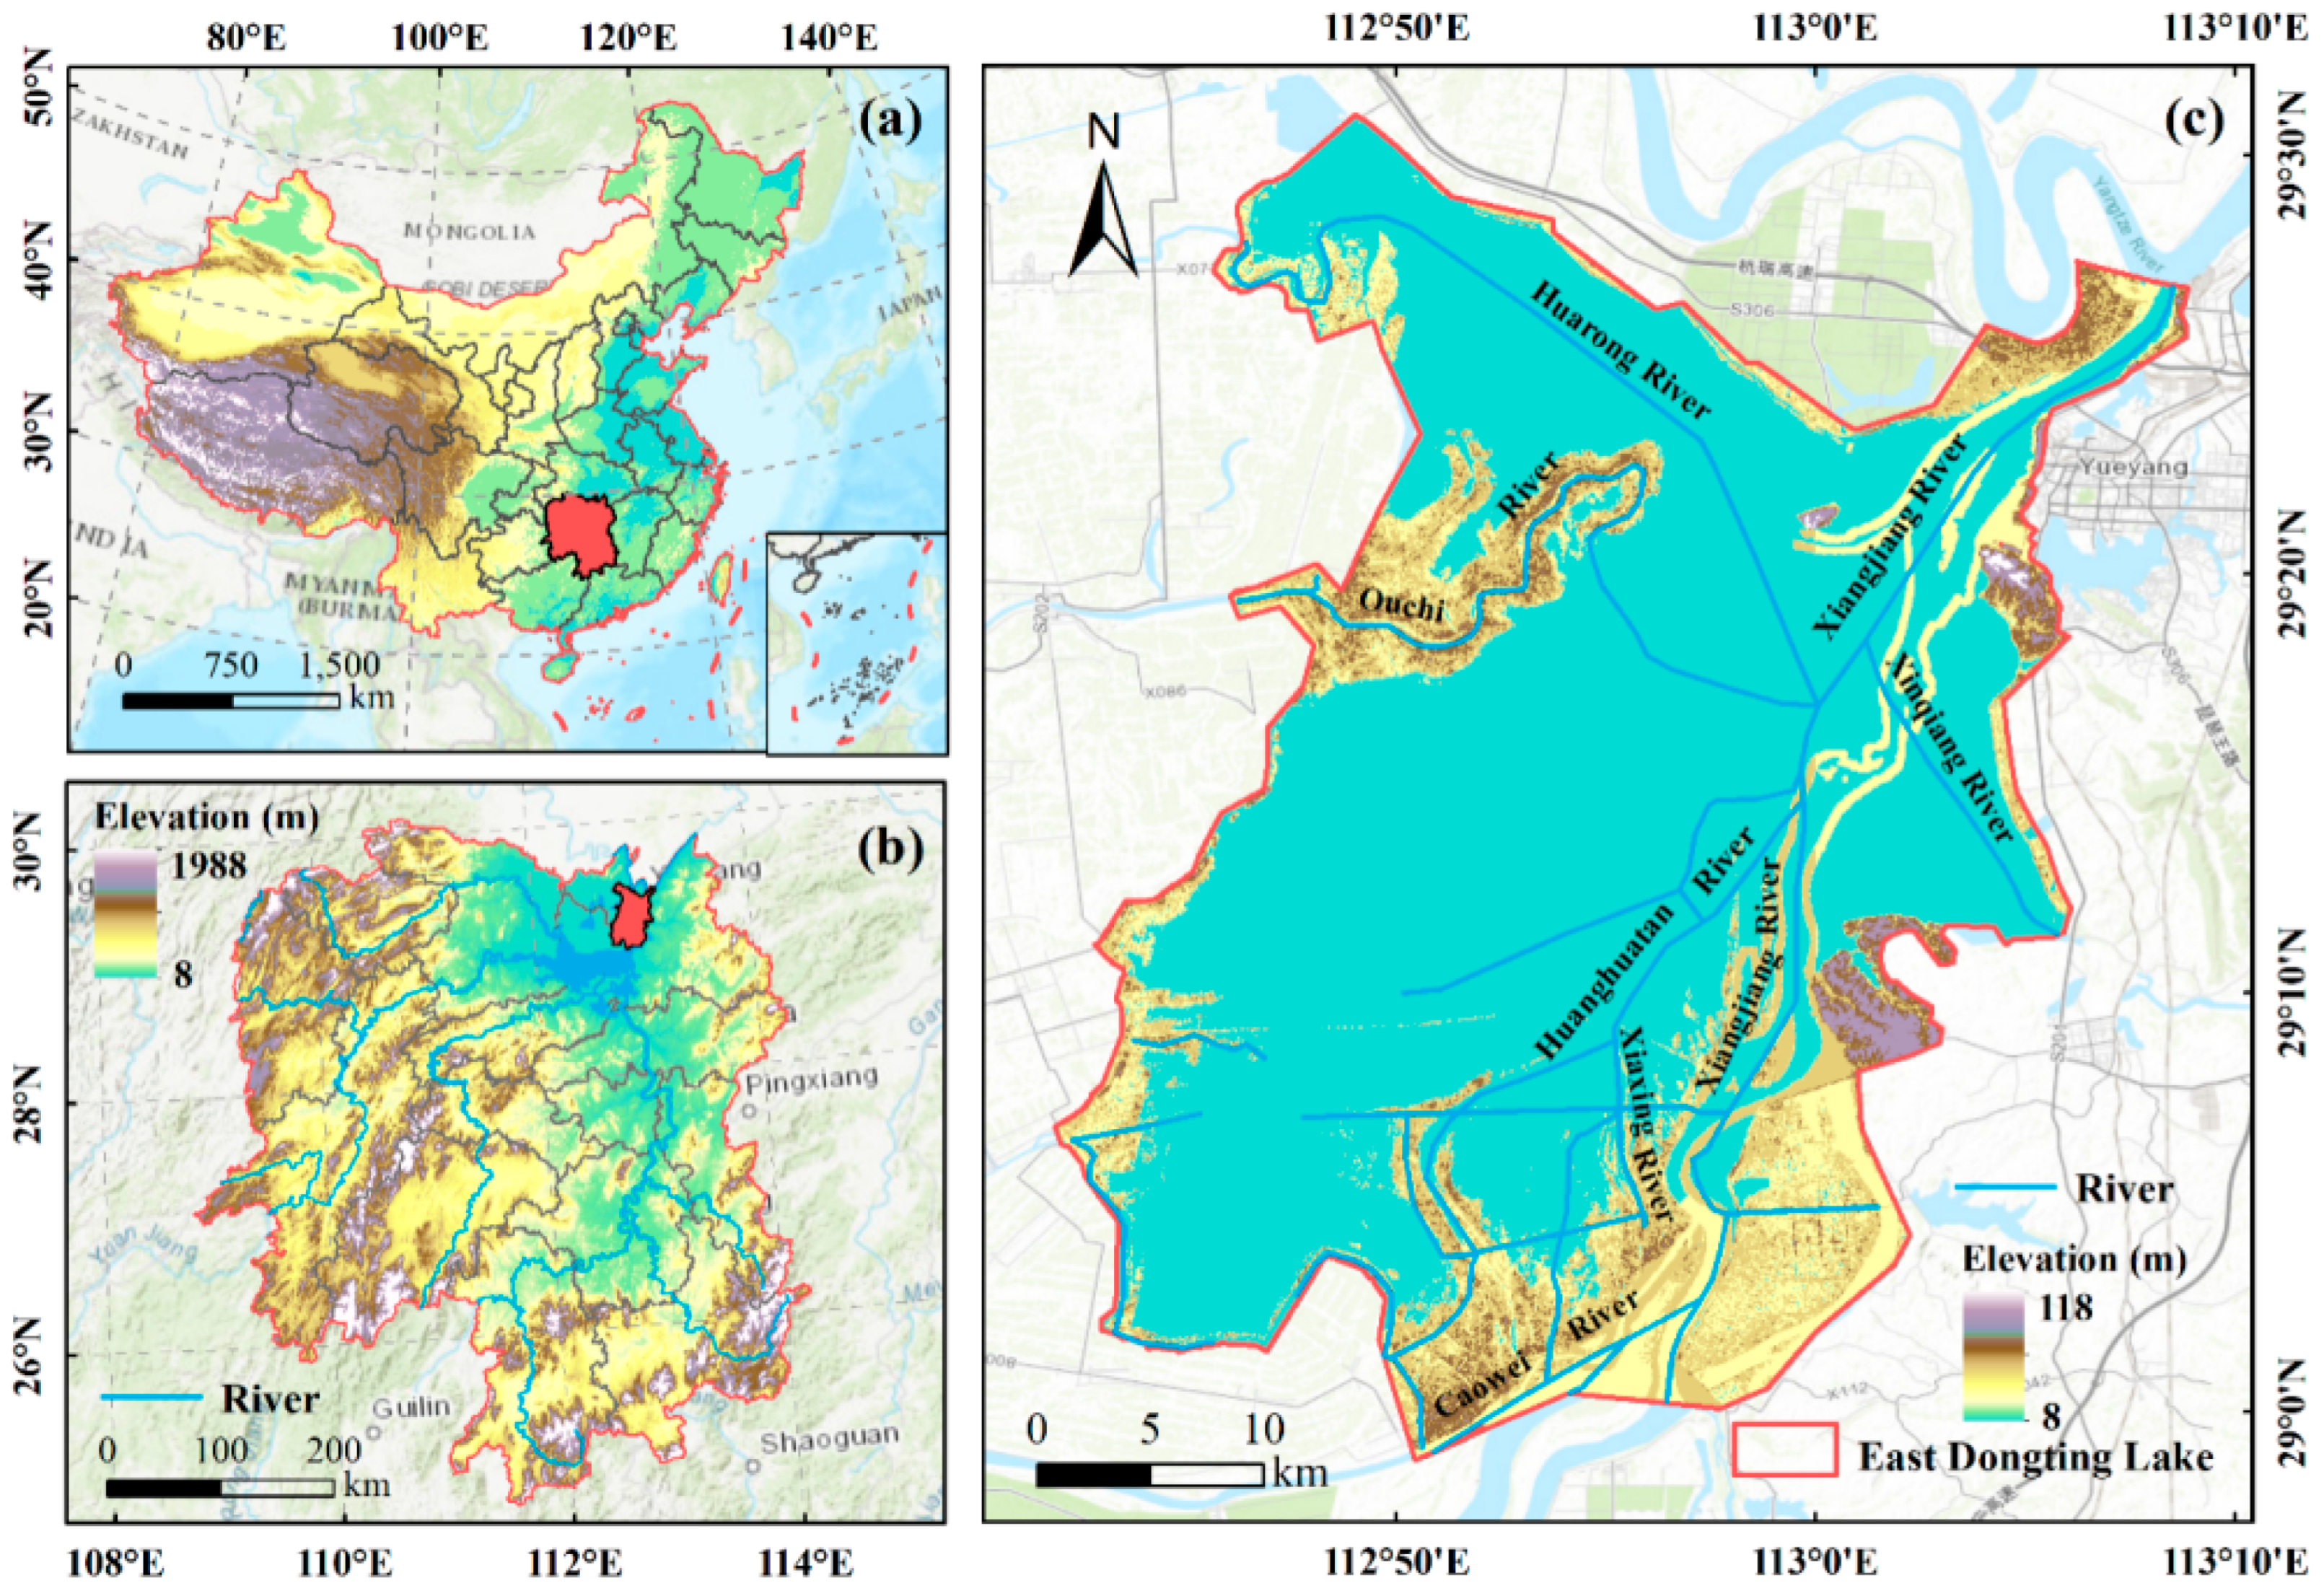
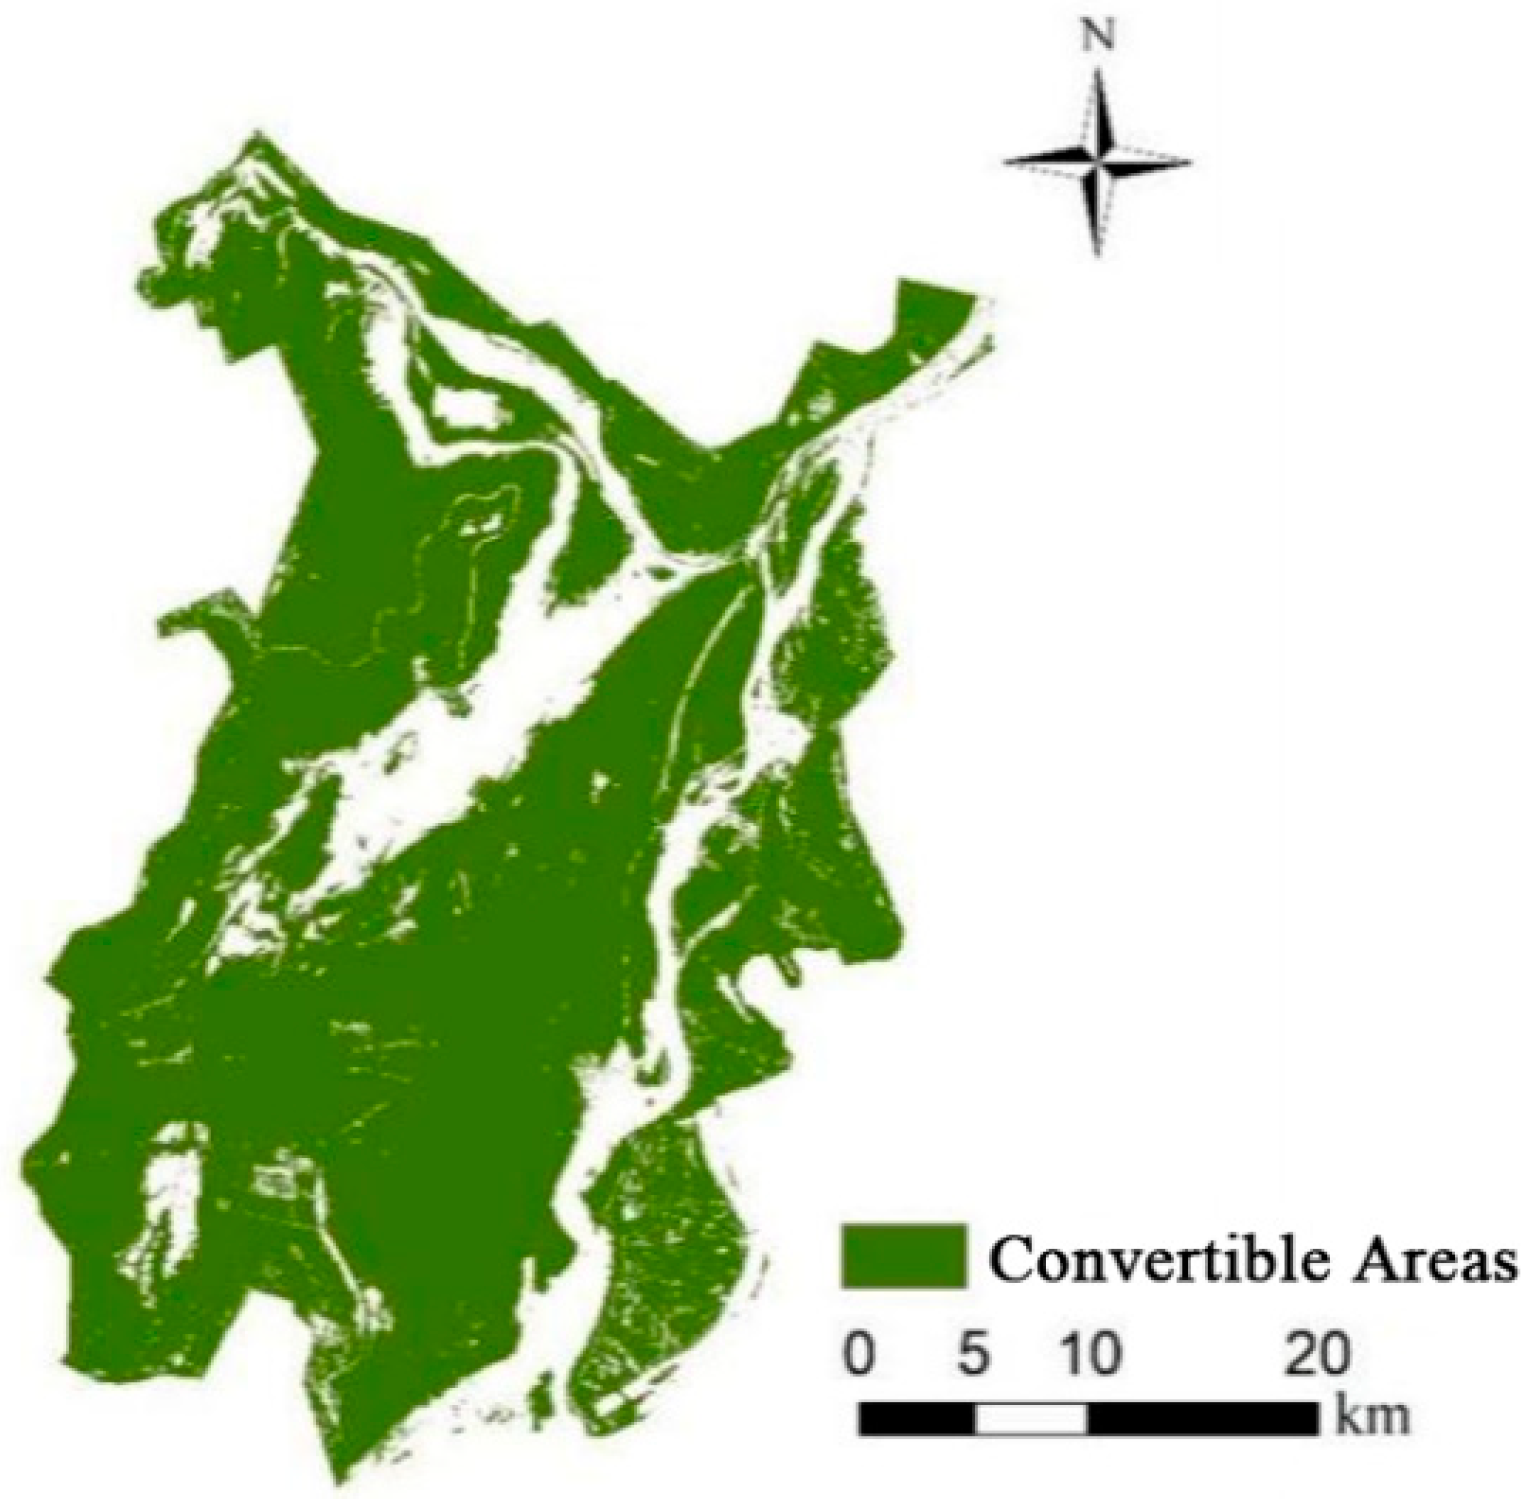
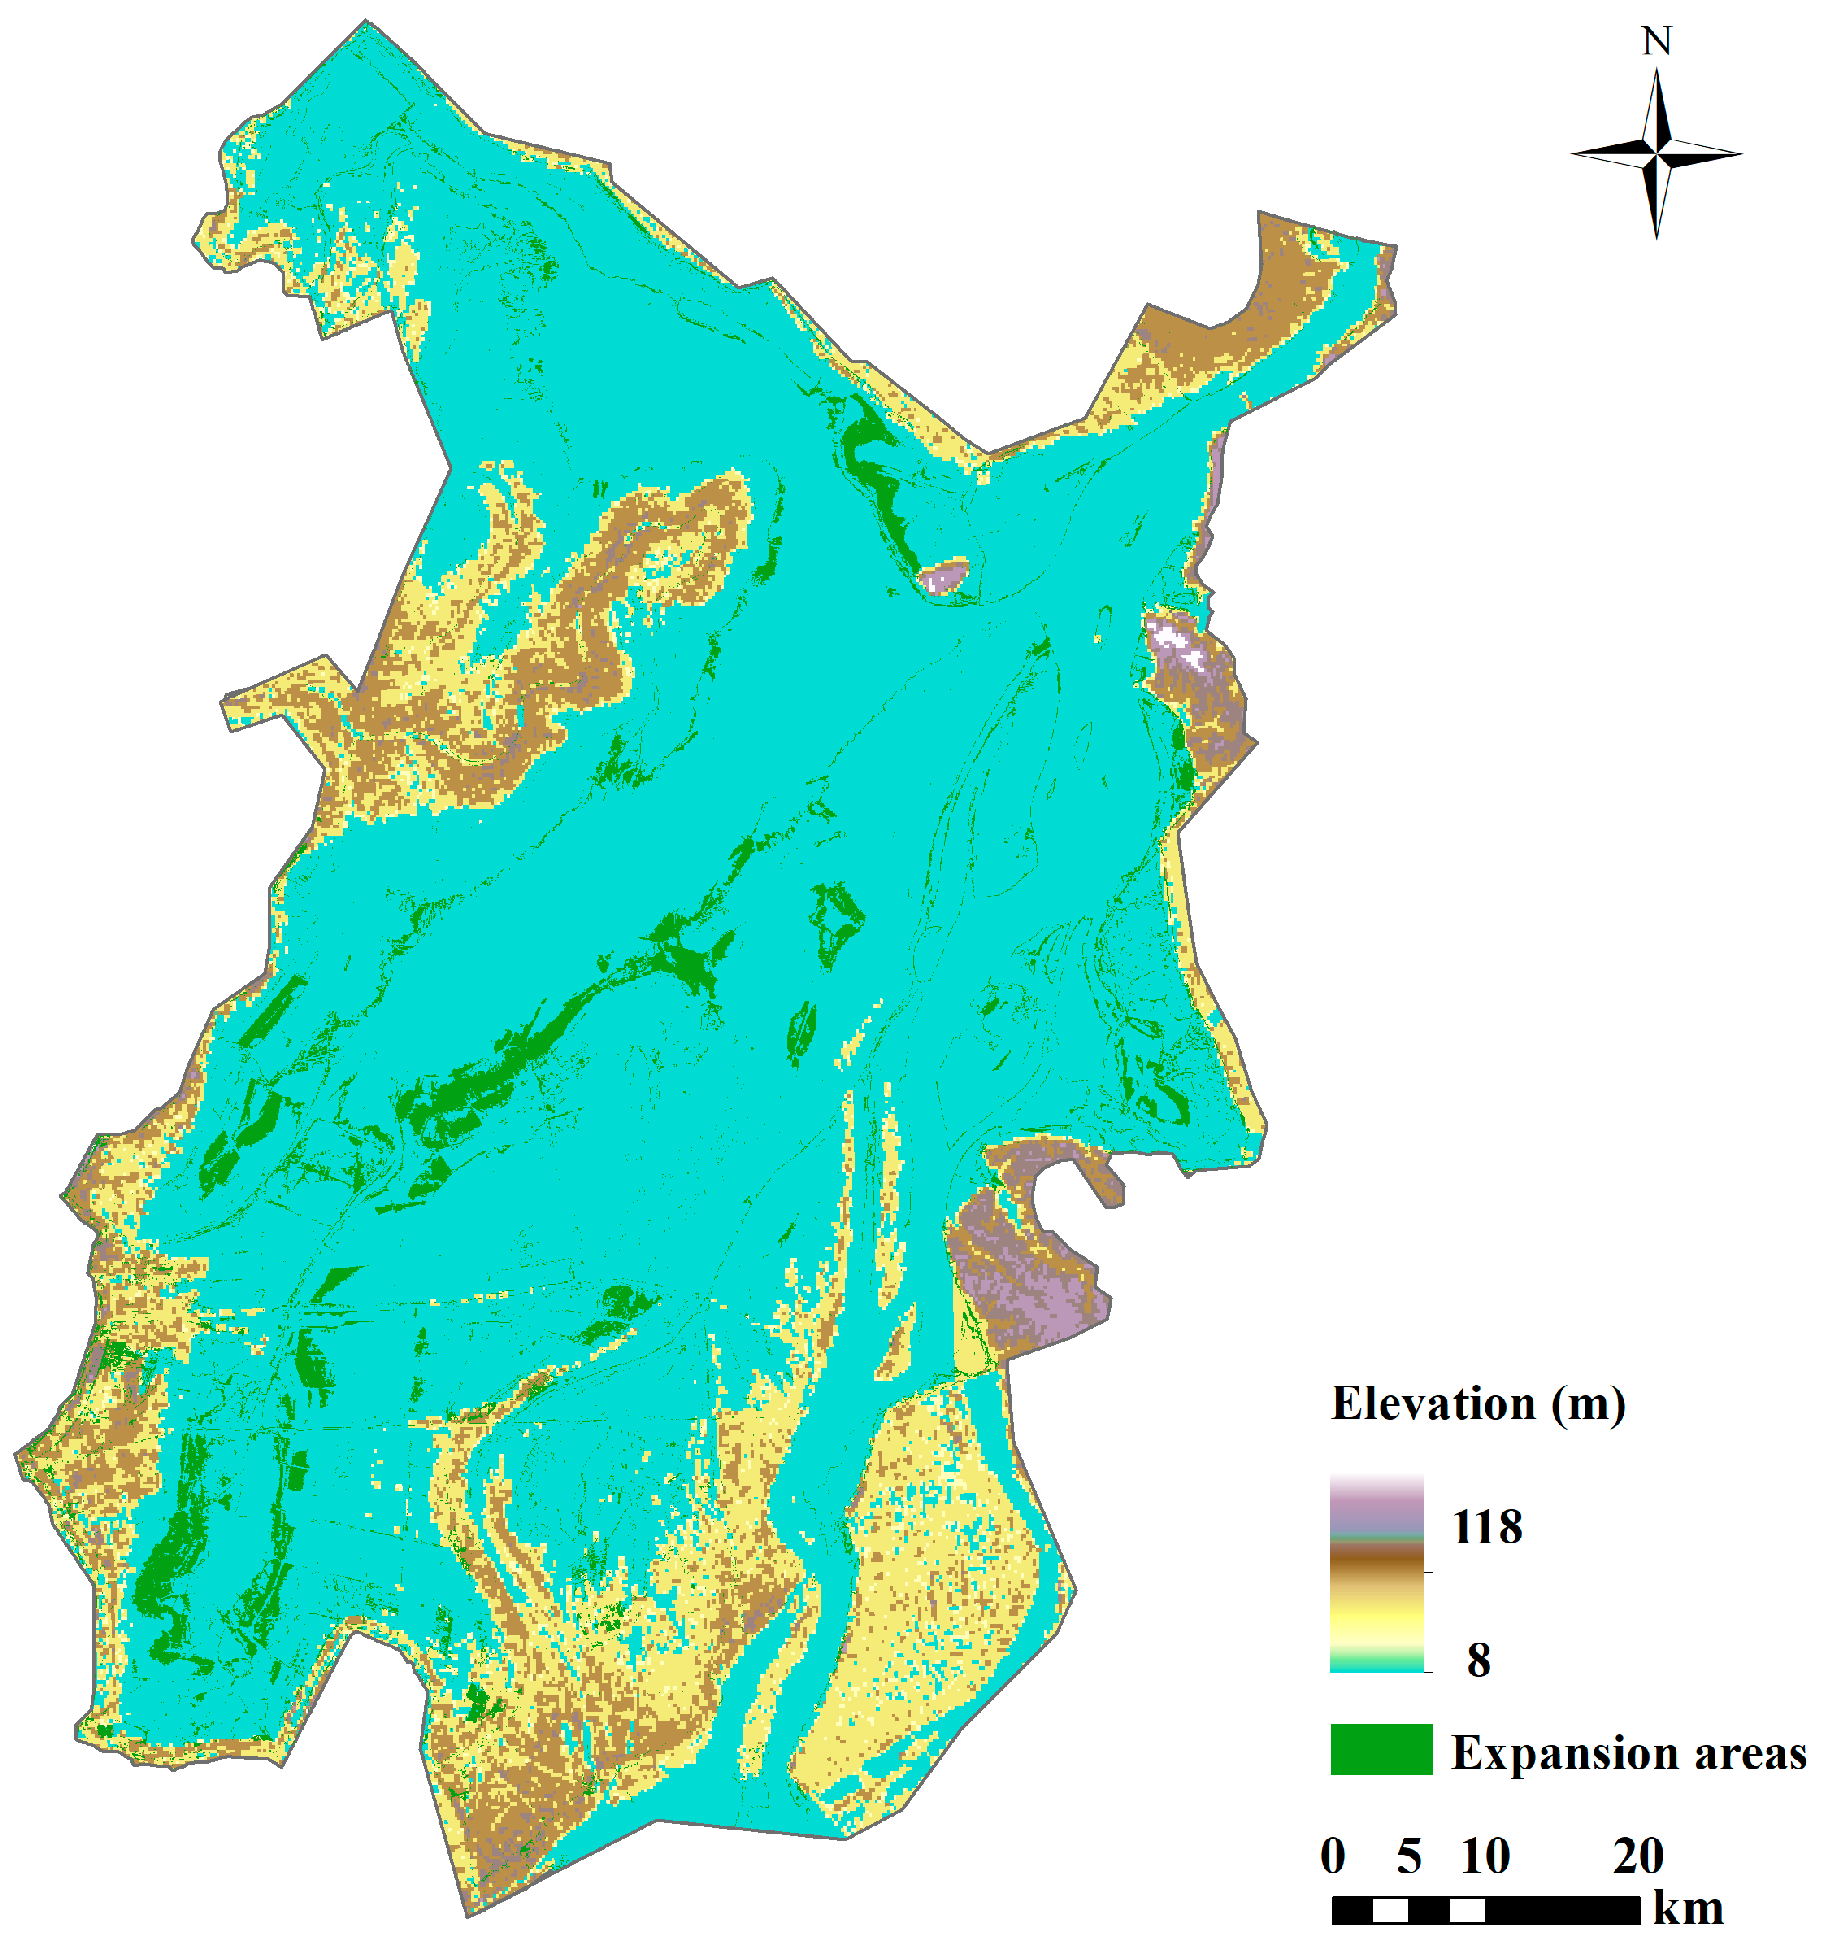
The East Dongting Lake Wetland is situated in the eastern region of Dongting Lake, the second-largest freshwater lake in China, and is administratively governed by Yueyang City. Geographically, the wetland lies between 28°59′–29°38′ N latitude and 112°43′–113°15′ E longitude (
Figure 1). The region is distinguished by broad river channels characteristic of major lake systems, surrounded by extensive marshlands. This area is abundant in water, biological, and land resources, making it one of the most biodiverse regions in China. In recent decades, the combined effects of natural factors and human activities have led to substantial transformations in the wetland, posing a potential threat to regional biodiversity.
2.2. Methods, Data Sources and Preprocessing
This study investigated wetland landscape changes in East Dongting Lake using integrated geospatial data analysis. The research combines remote sensing imagery with environmental and socioeconomic datasets to enable comprehensive modeling of landscape dynamics.
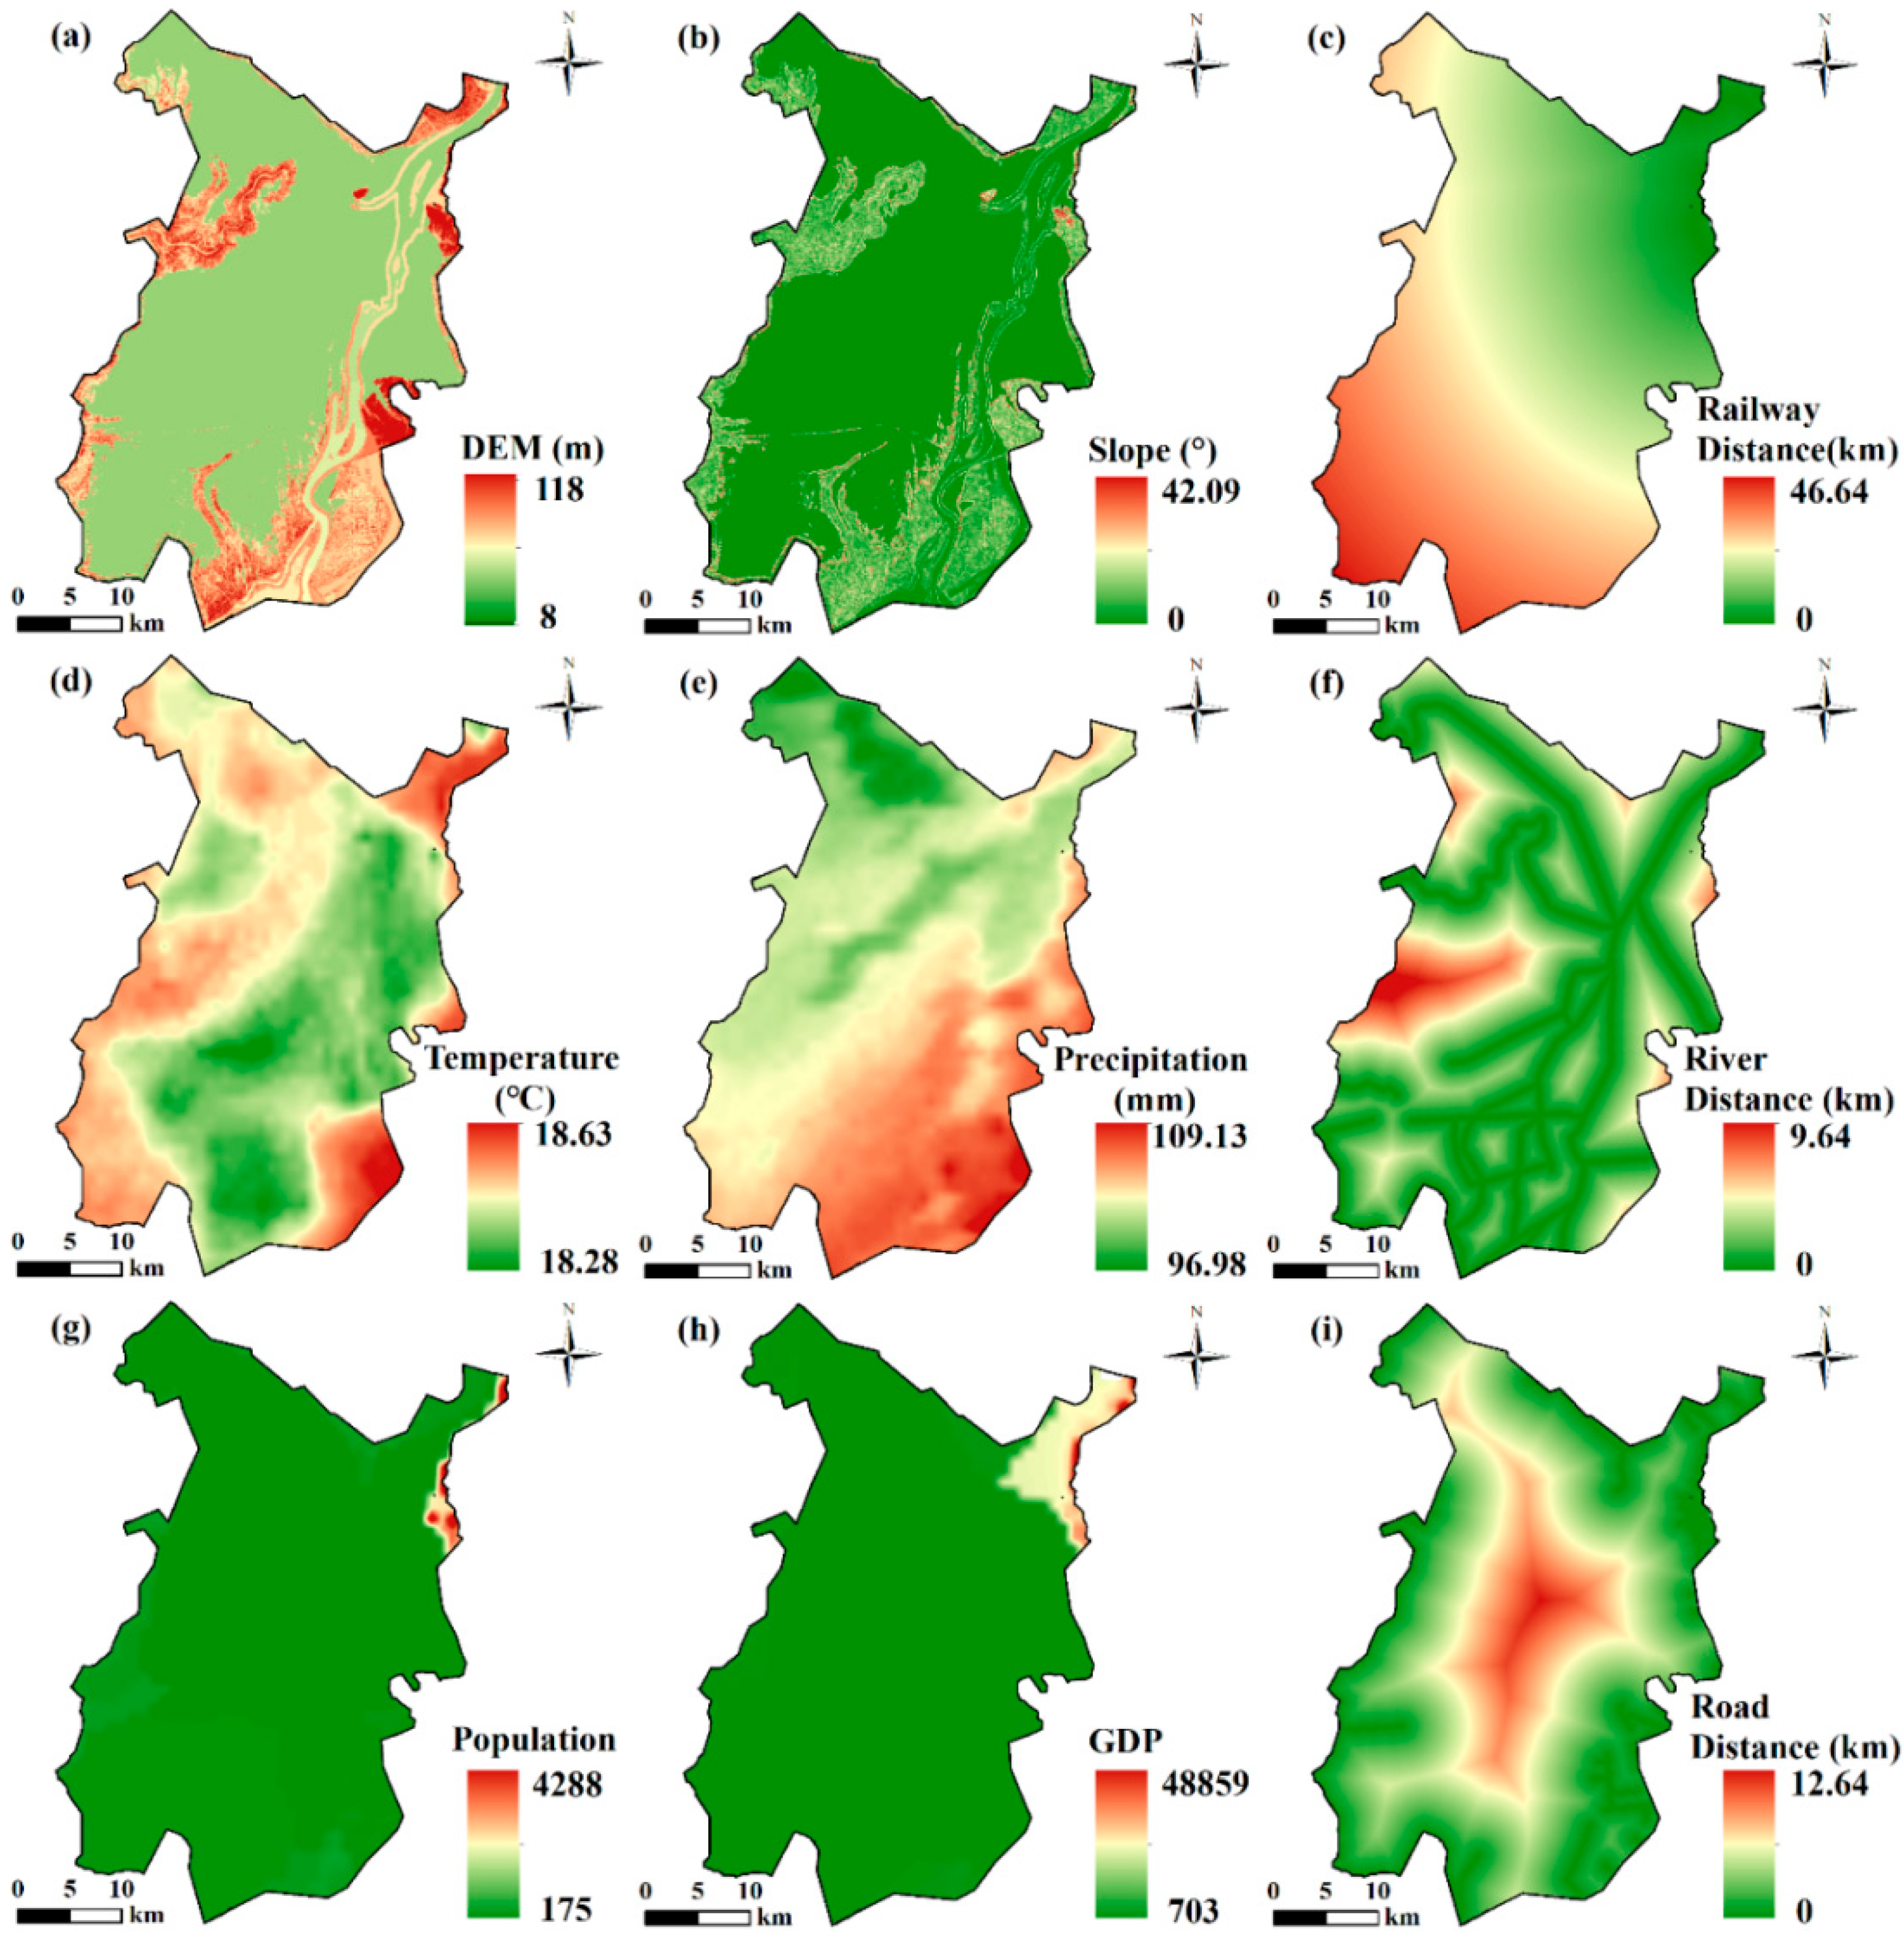
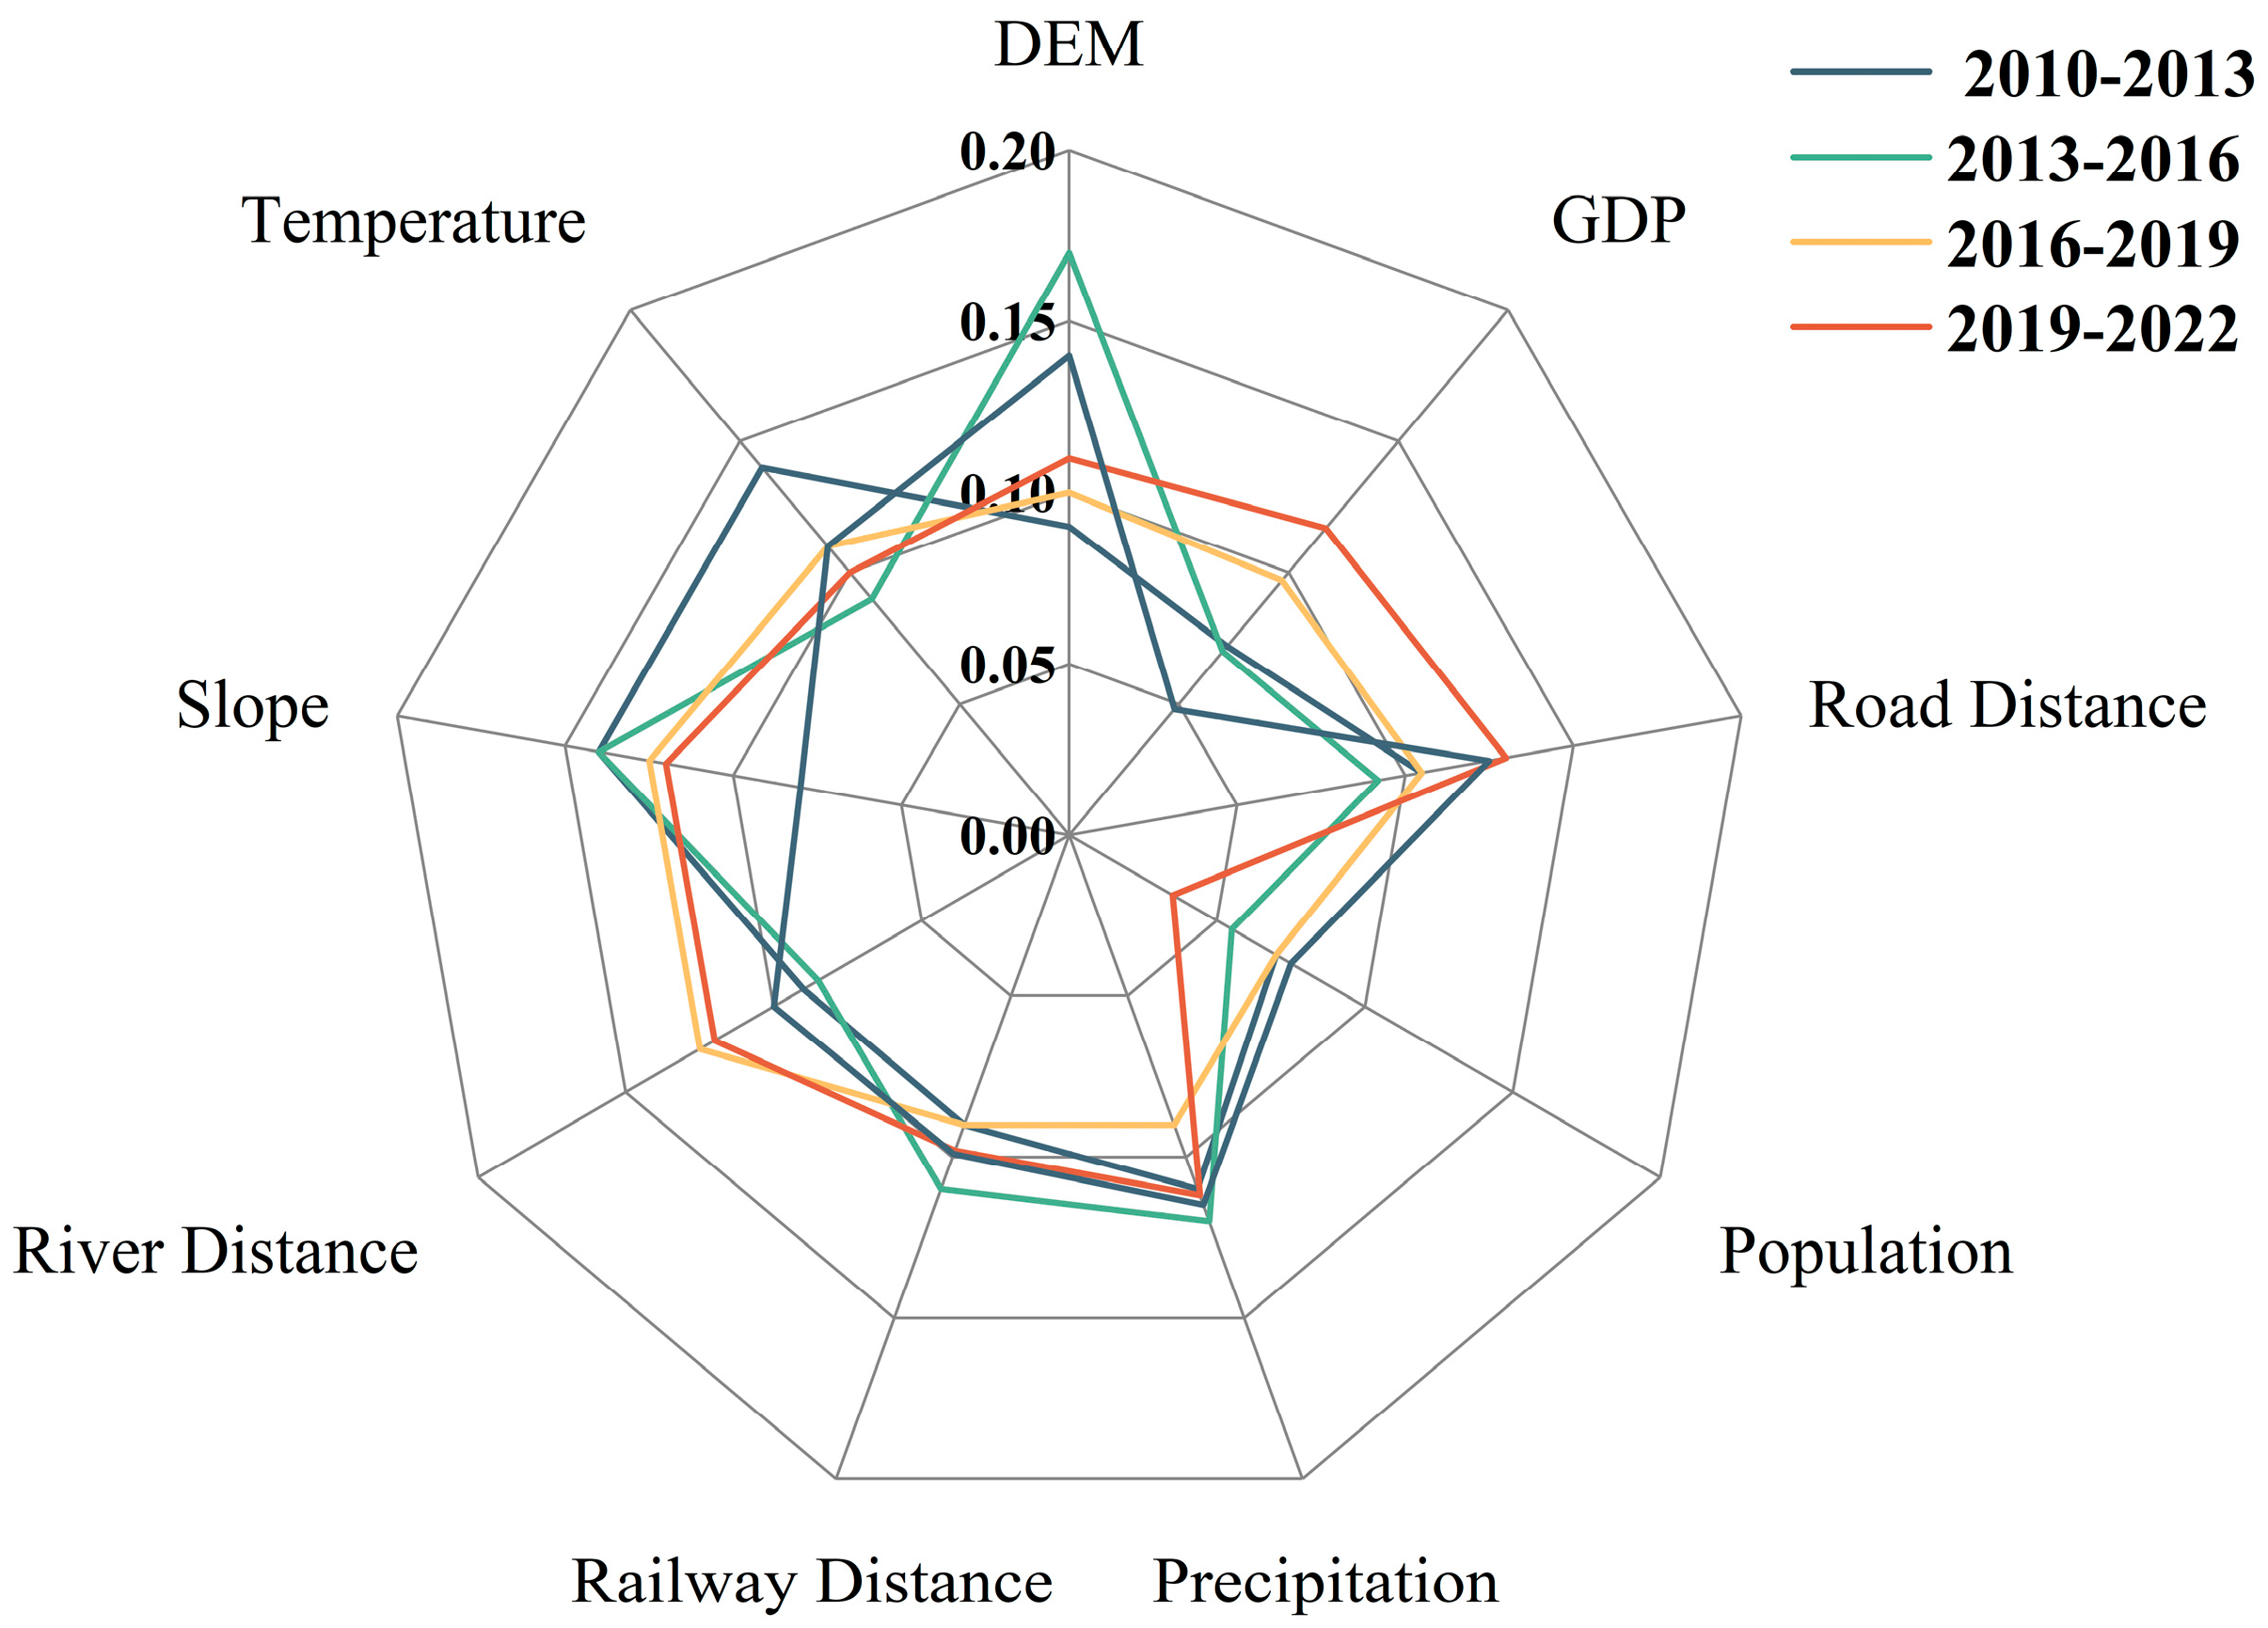
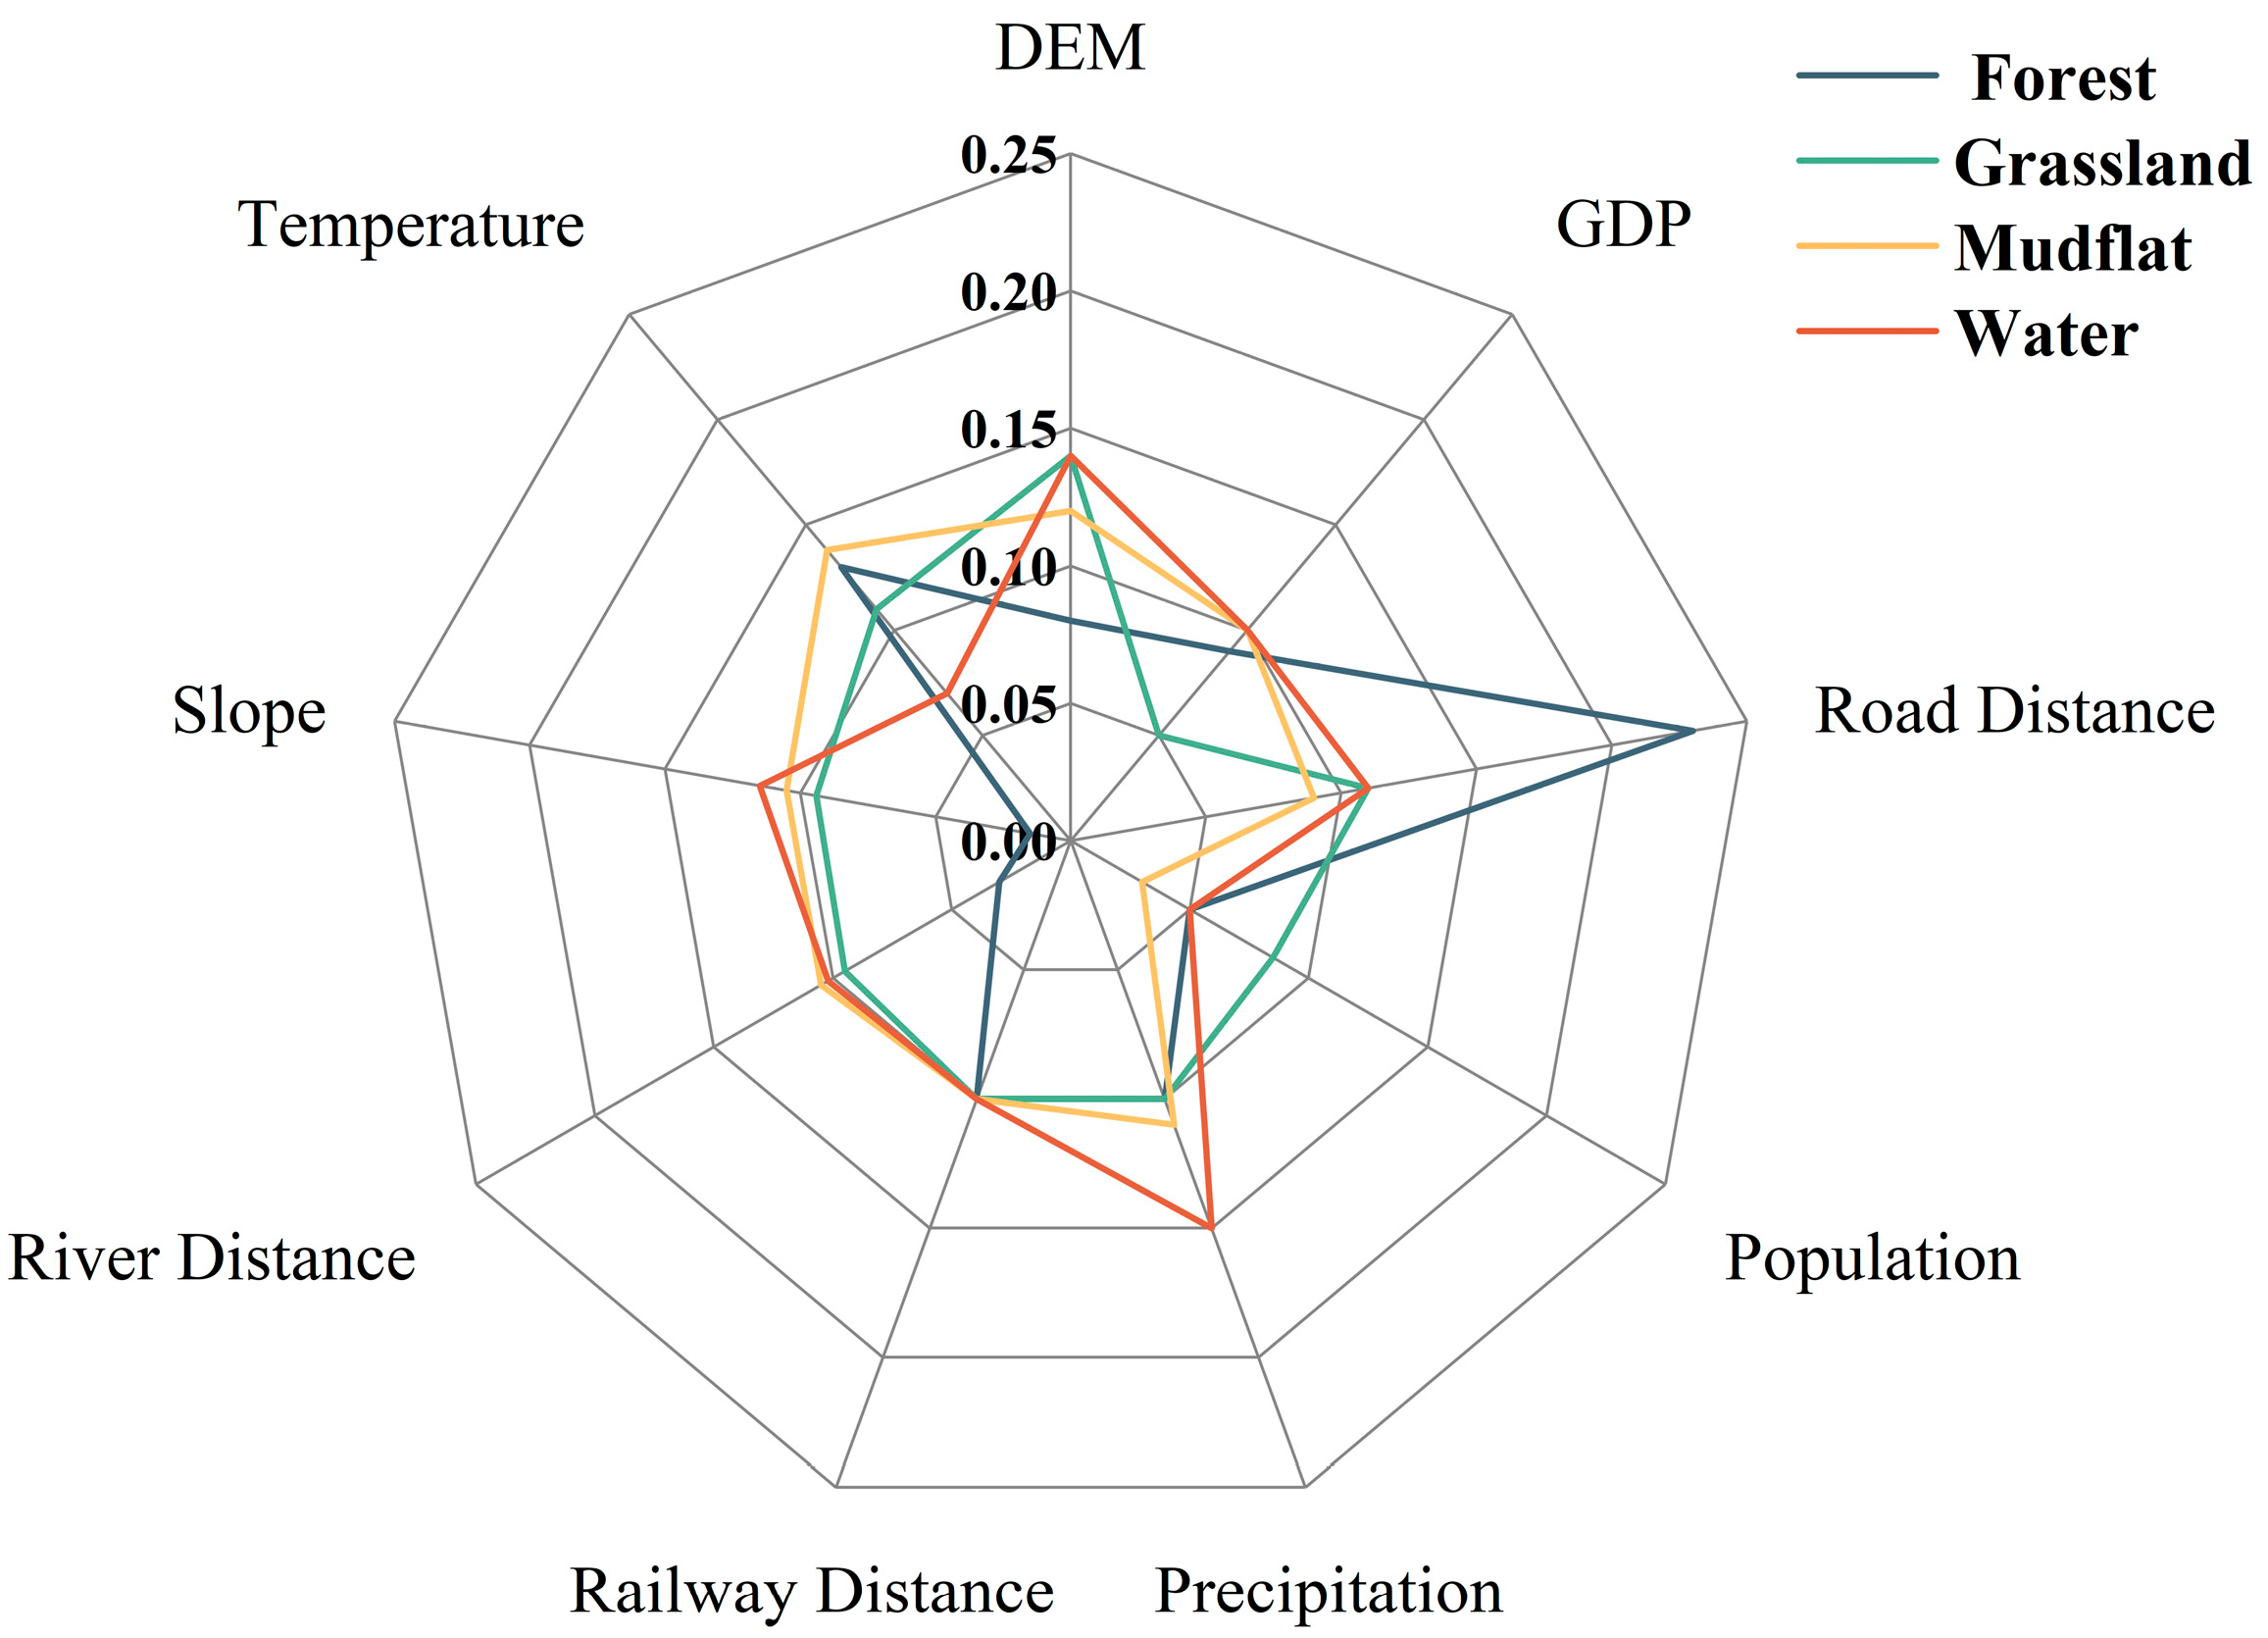
The evolution of wetland landscapes in the study area is shaped by a combination of diverse driving factors. Considering the unique natural and social environment of the study area, along with relevant research findings, nine driving factors were selected for the analysis: natural factors including DEM, slope, temperature, and precipitation; socio-economic factors such as population density and GDP; and spatial accessibility factors including main roads, railways, and rivers.
The remote sensing and environmental data used in this study are summarized in
Table 1. The analysis was based on Landsat 7 imagery (acquired on 17 September 2010, 8 August 2013, and 16 August 2016) and Sentinel-2 imagery (acquired on 16 August 2019, and 20 August 2022); the Random Forest classification method was applied to this imagery to analyze the distribution characteristics of wetland landscape types in East Dongting Lake from 2010 to 2022. Initially, East Dongting Lake was selected as the study area, and these images from 2010 to 2022 were gathered as source data for analysis. Following preprocessing of the remote sensing imagery, all nine driving factors (DEM, slope, temperature, precipitation, population density, GDP, and distances to roads, railways, and rivers) were standardized to a 0–1 range using min–max normalization to ensure comparability across variables in the PLUS model analysis.
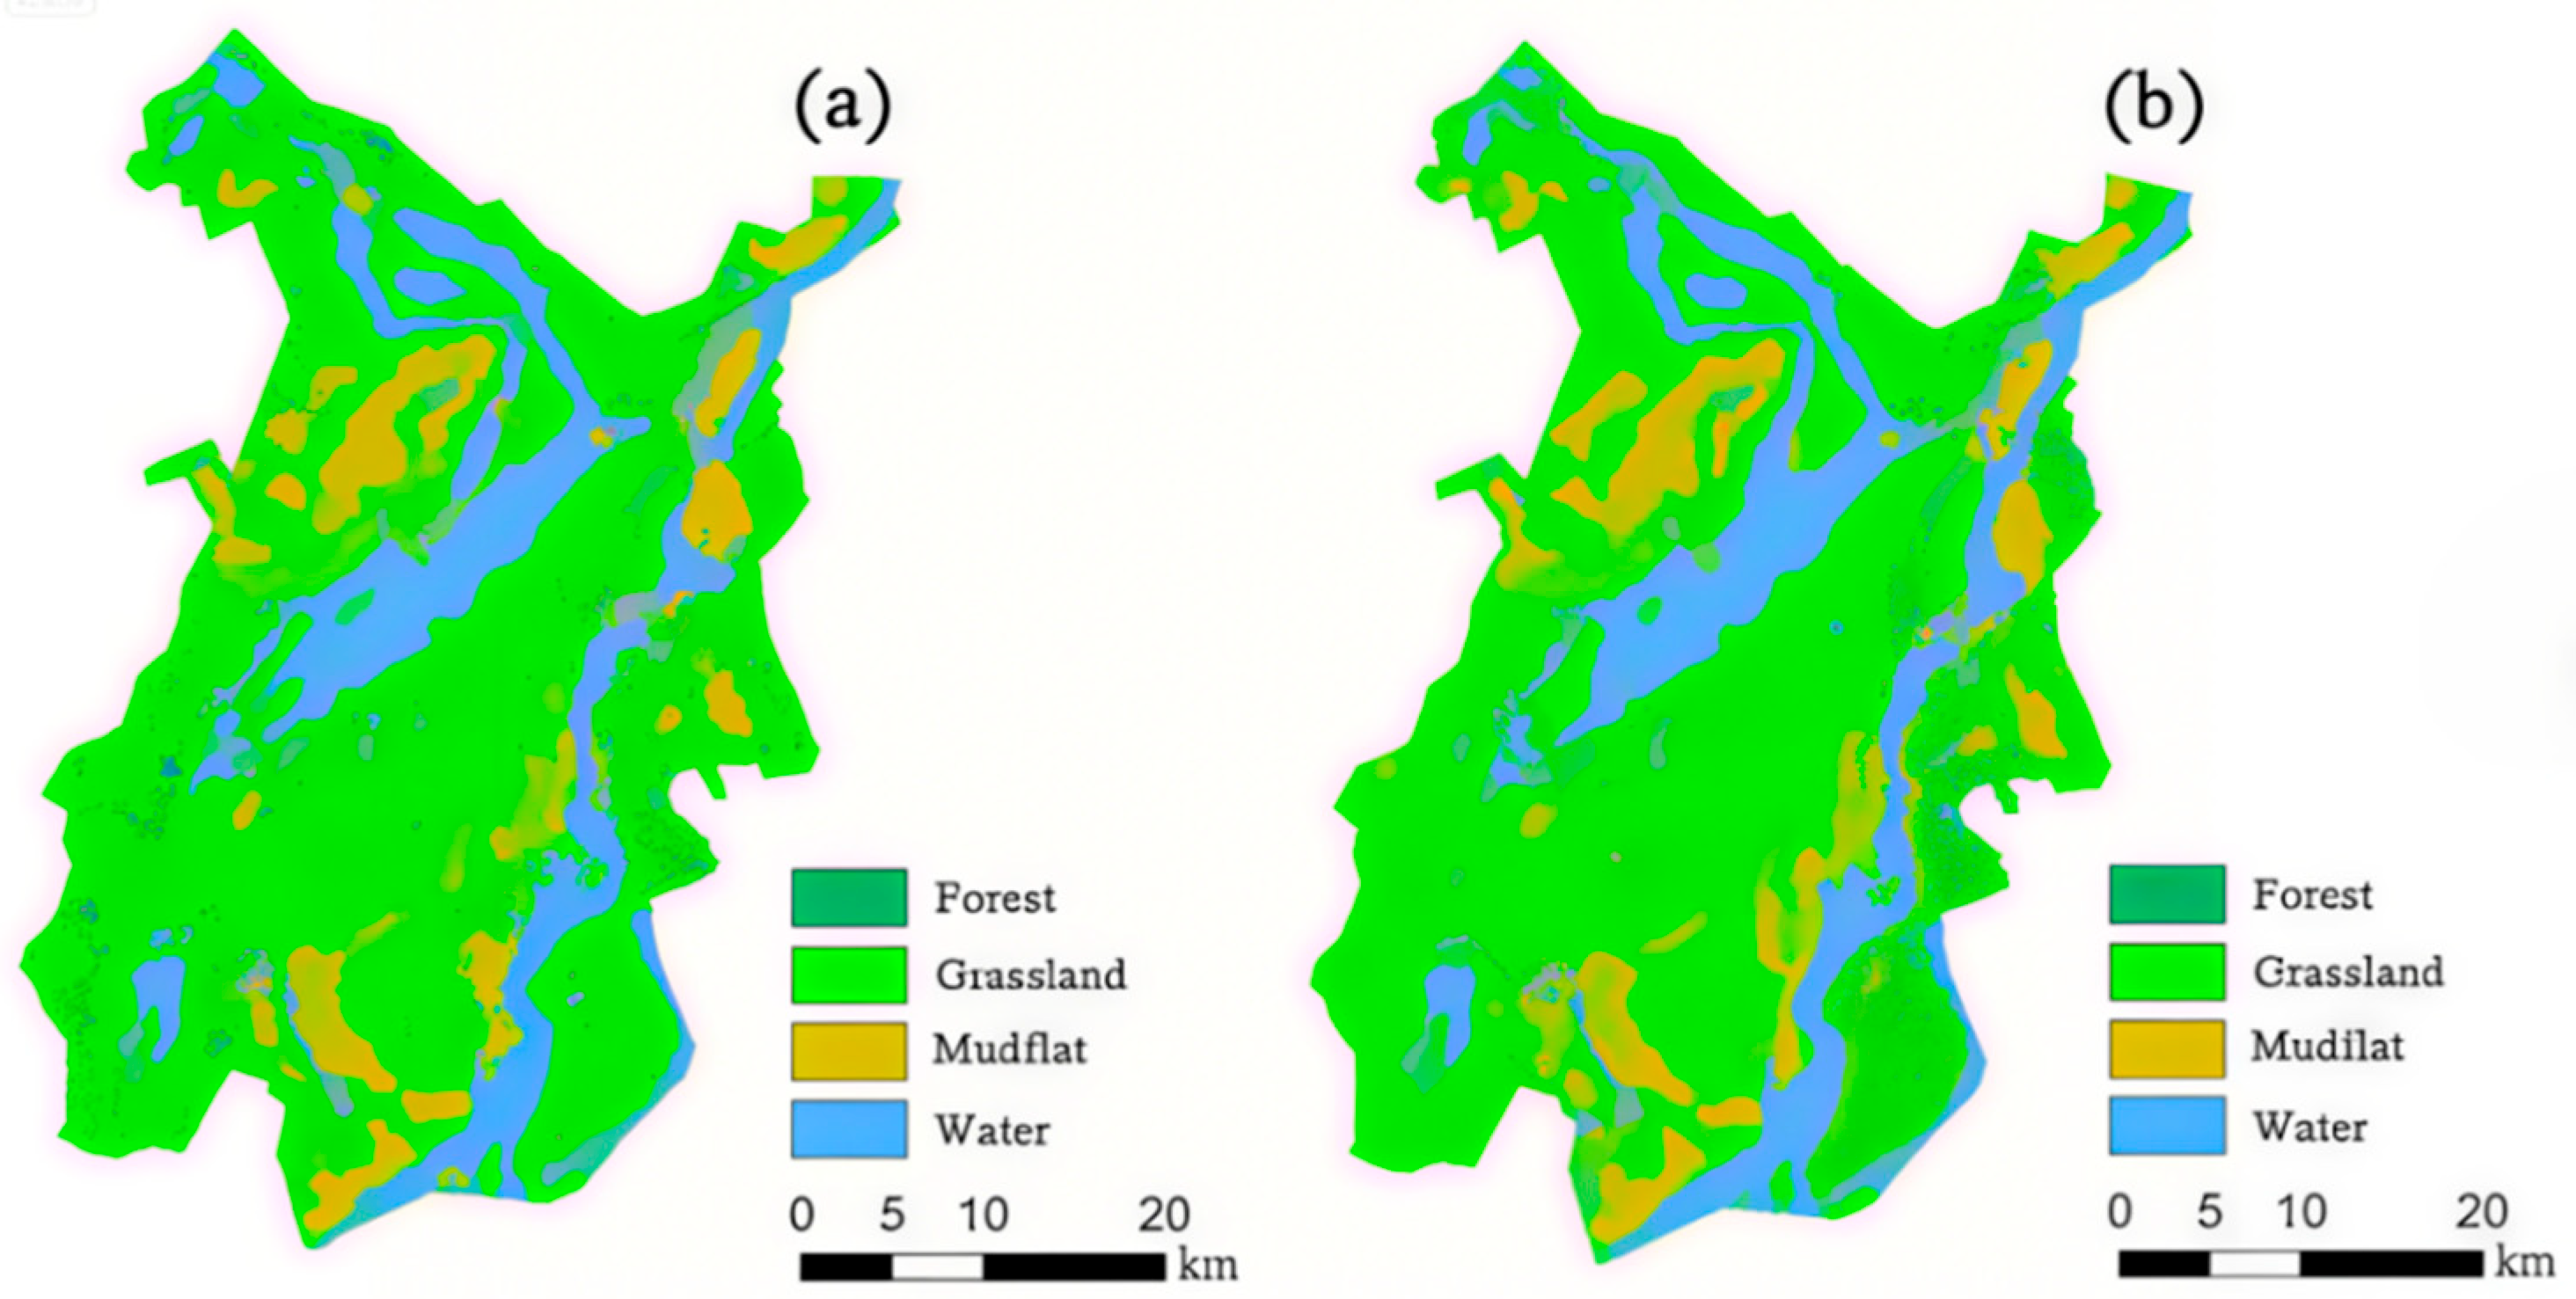
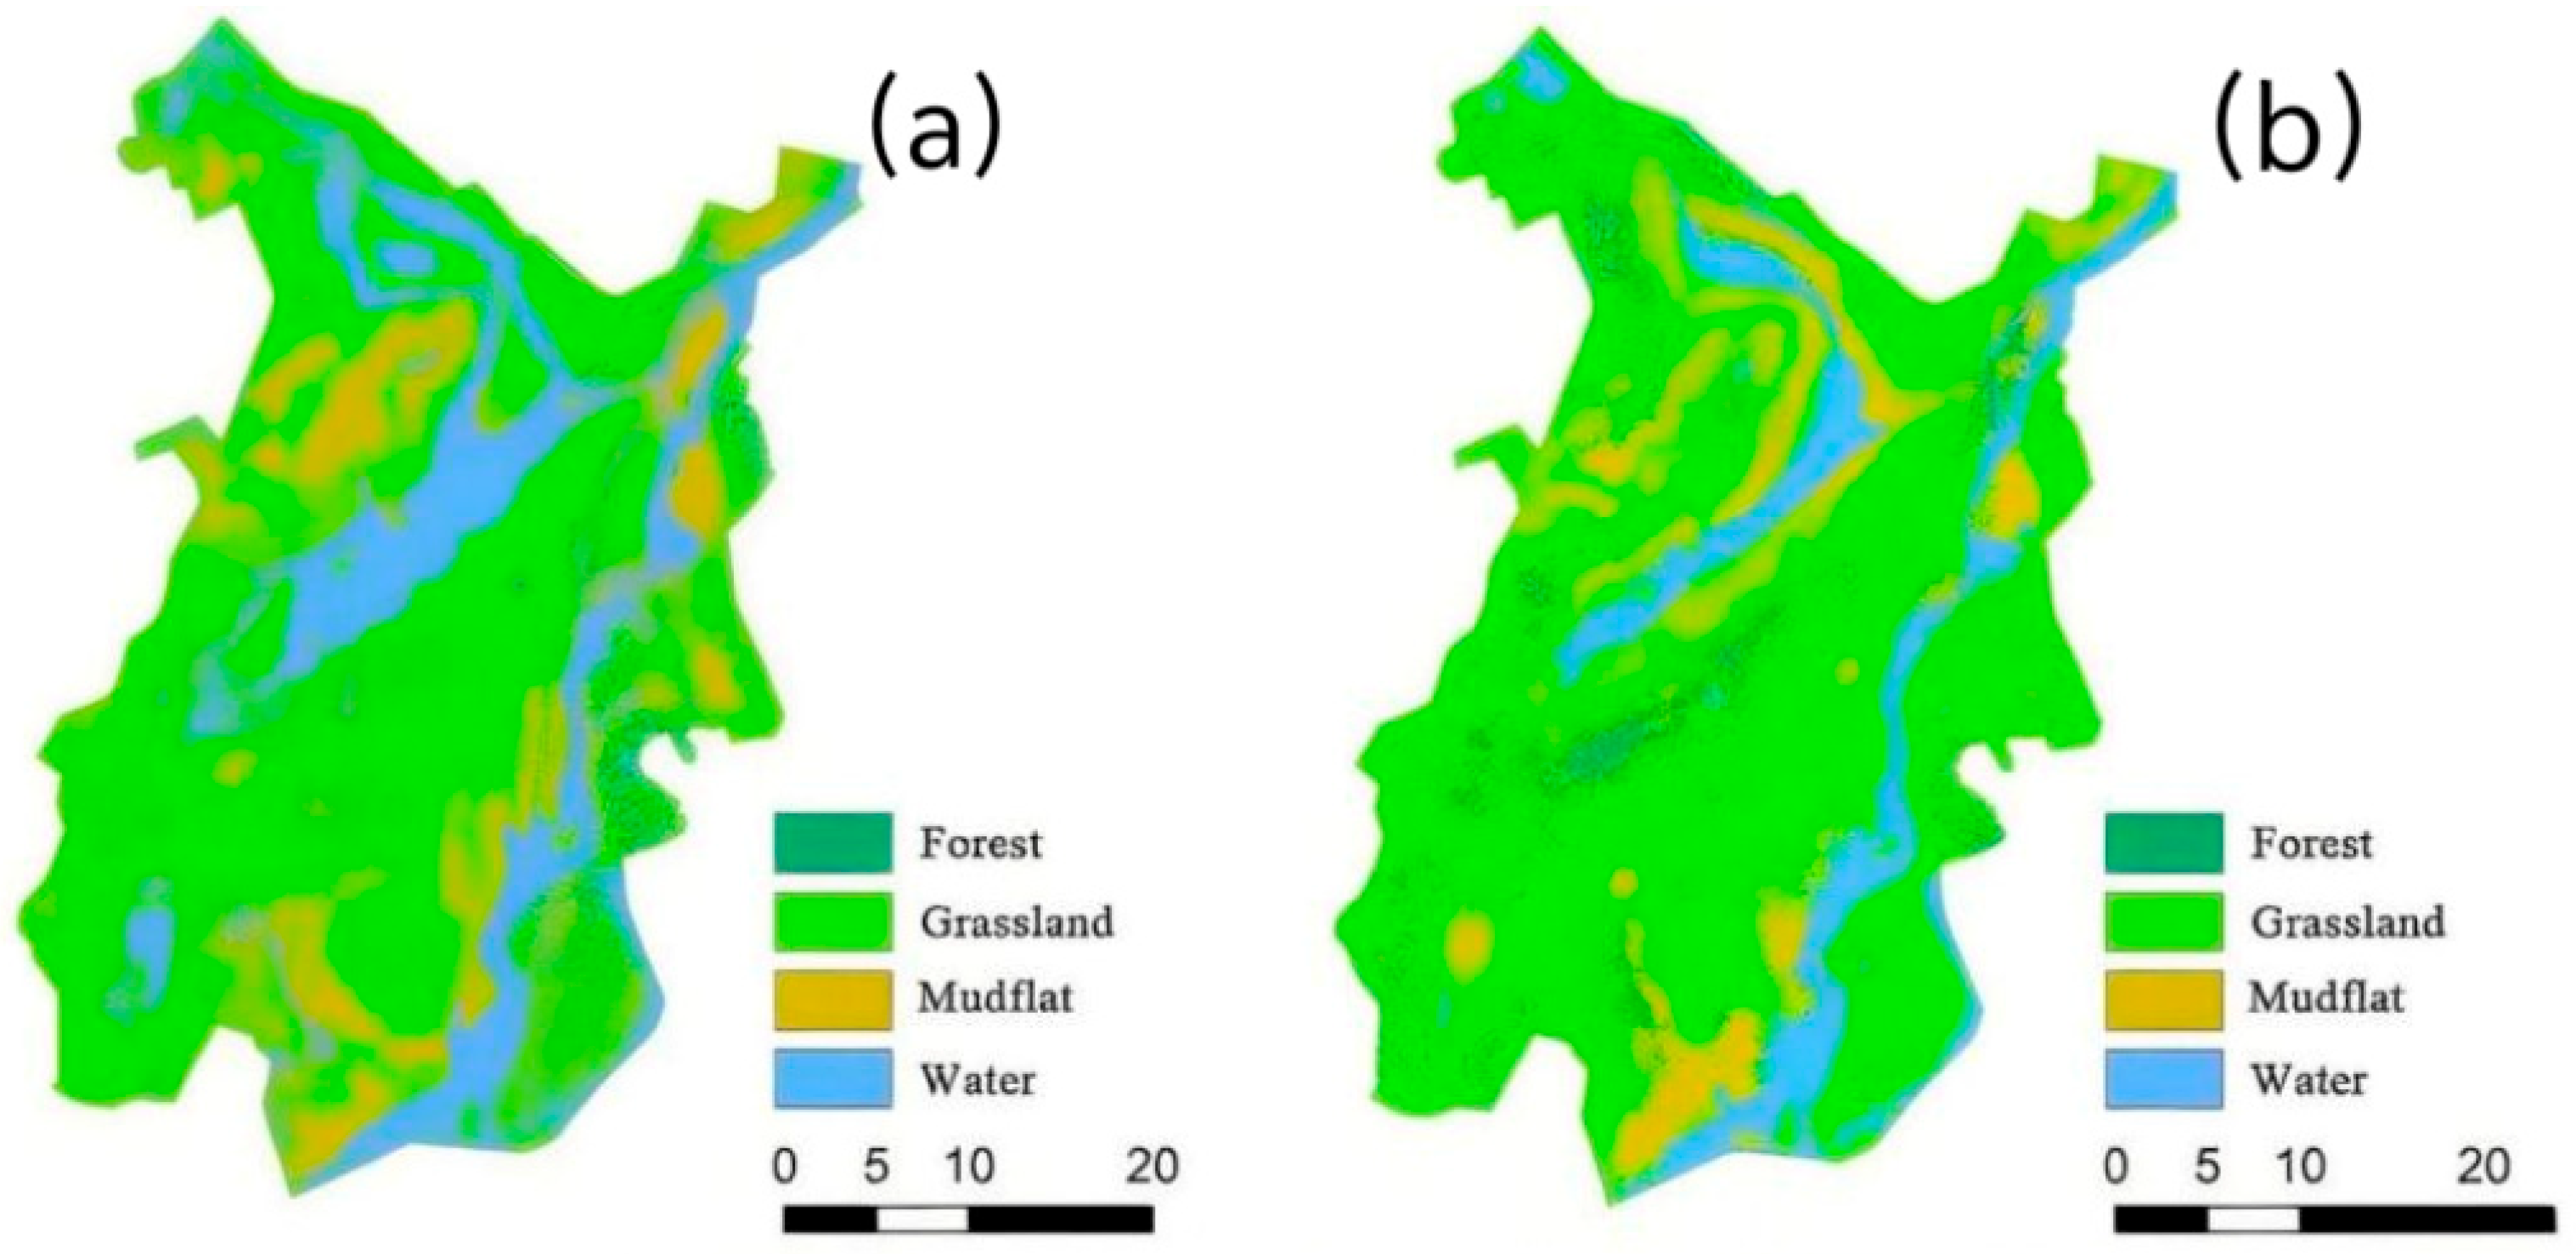
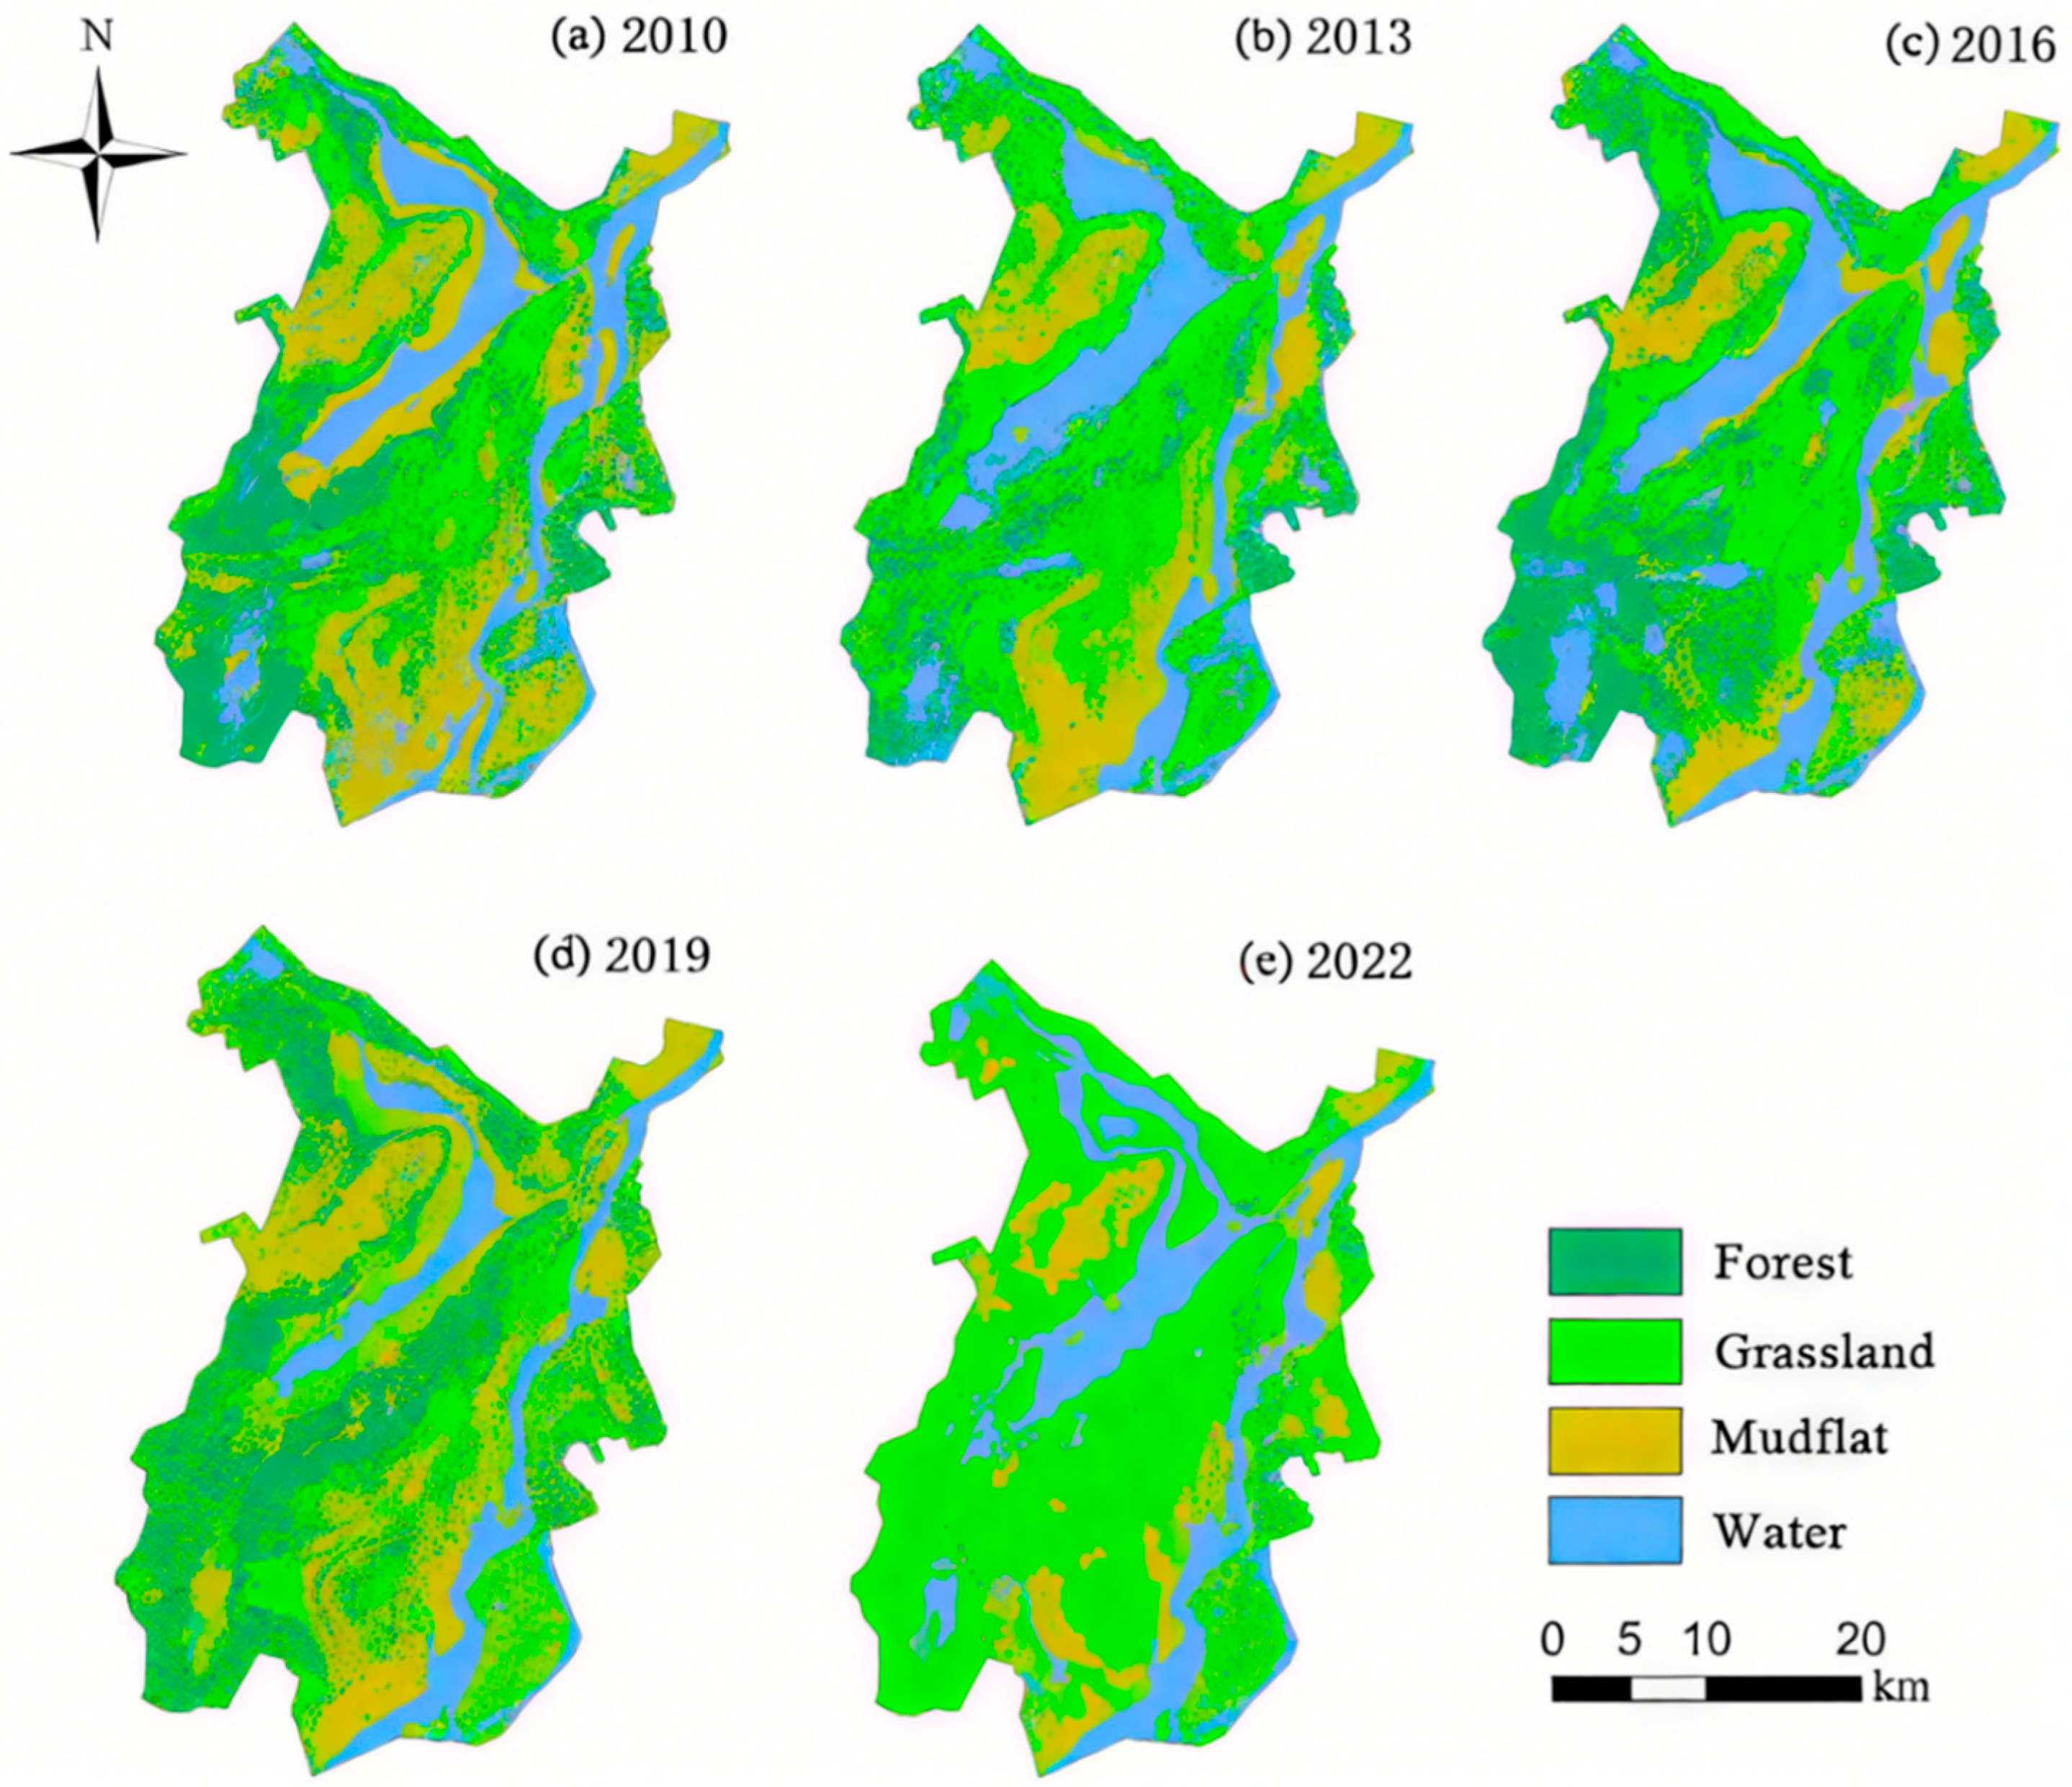
Wetland landscape types in East Dongting Lake from 2010 to 2022 were classified into four categories: poplar plantations, grassland, mudflats, and water bodies. A Random Forest classifier was developed using sample data and classification features for interpretation, generating wetland landscape distribution maps for East Dongting Lake across various years and periods from 2010 to 2022.
The selection of driving factors was based on the unique natural-social system characteristics of the East Dongting Lake wetland [
7]. Natural factors (e.g., DEM, precipitation) primarily govern hydrological processes, while human activity factors (e.g., road distance) reflect spatial heterogeneity in policy interventions (e.g., the 2018–2020 poplar tree removal campaign). All factors were normalized to a 0–1 range using min–max standardization to eliminate unit differences. The chosen factors account for the following:
Slope data were extracted from DEM data using the Slope tool in ArcGIS 10.8 software (developed by Environmental Systems Research Institute, Inc. (ESRI), Redlands, CA, USA). The Euclidean Distance tool was applied to vector data of main roads, railways, and rivers to extract the accessibility factor raster data. All data were clipped, resampled, and projected to ensure consistency in boundaries, projection, and spatial resolution across the datasets.
2.3. Methods
2.3.1. PLUS Model
The PLUS model integrates a novel land expansion analysis strategy (LEAS) with a multi-class, random patch seed-based cellular automata (CARS) model [
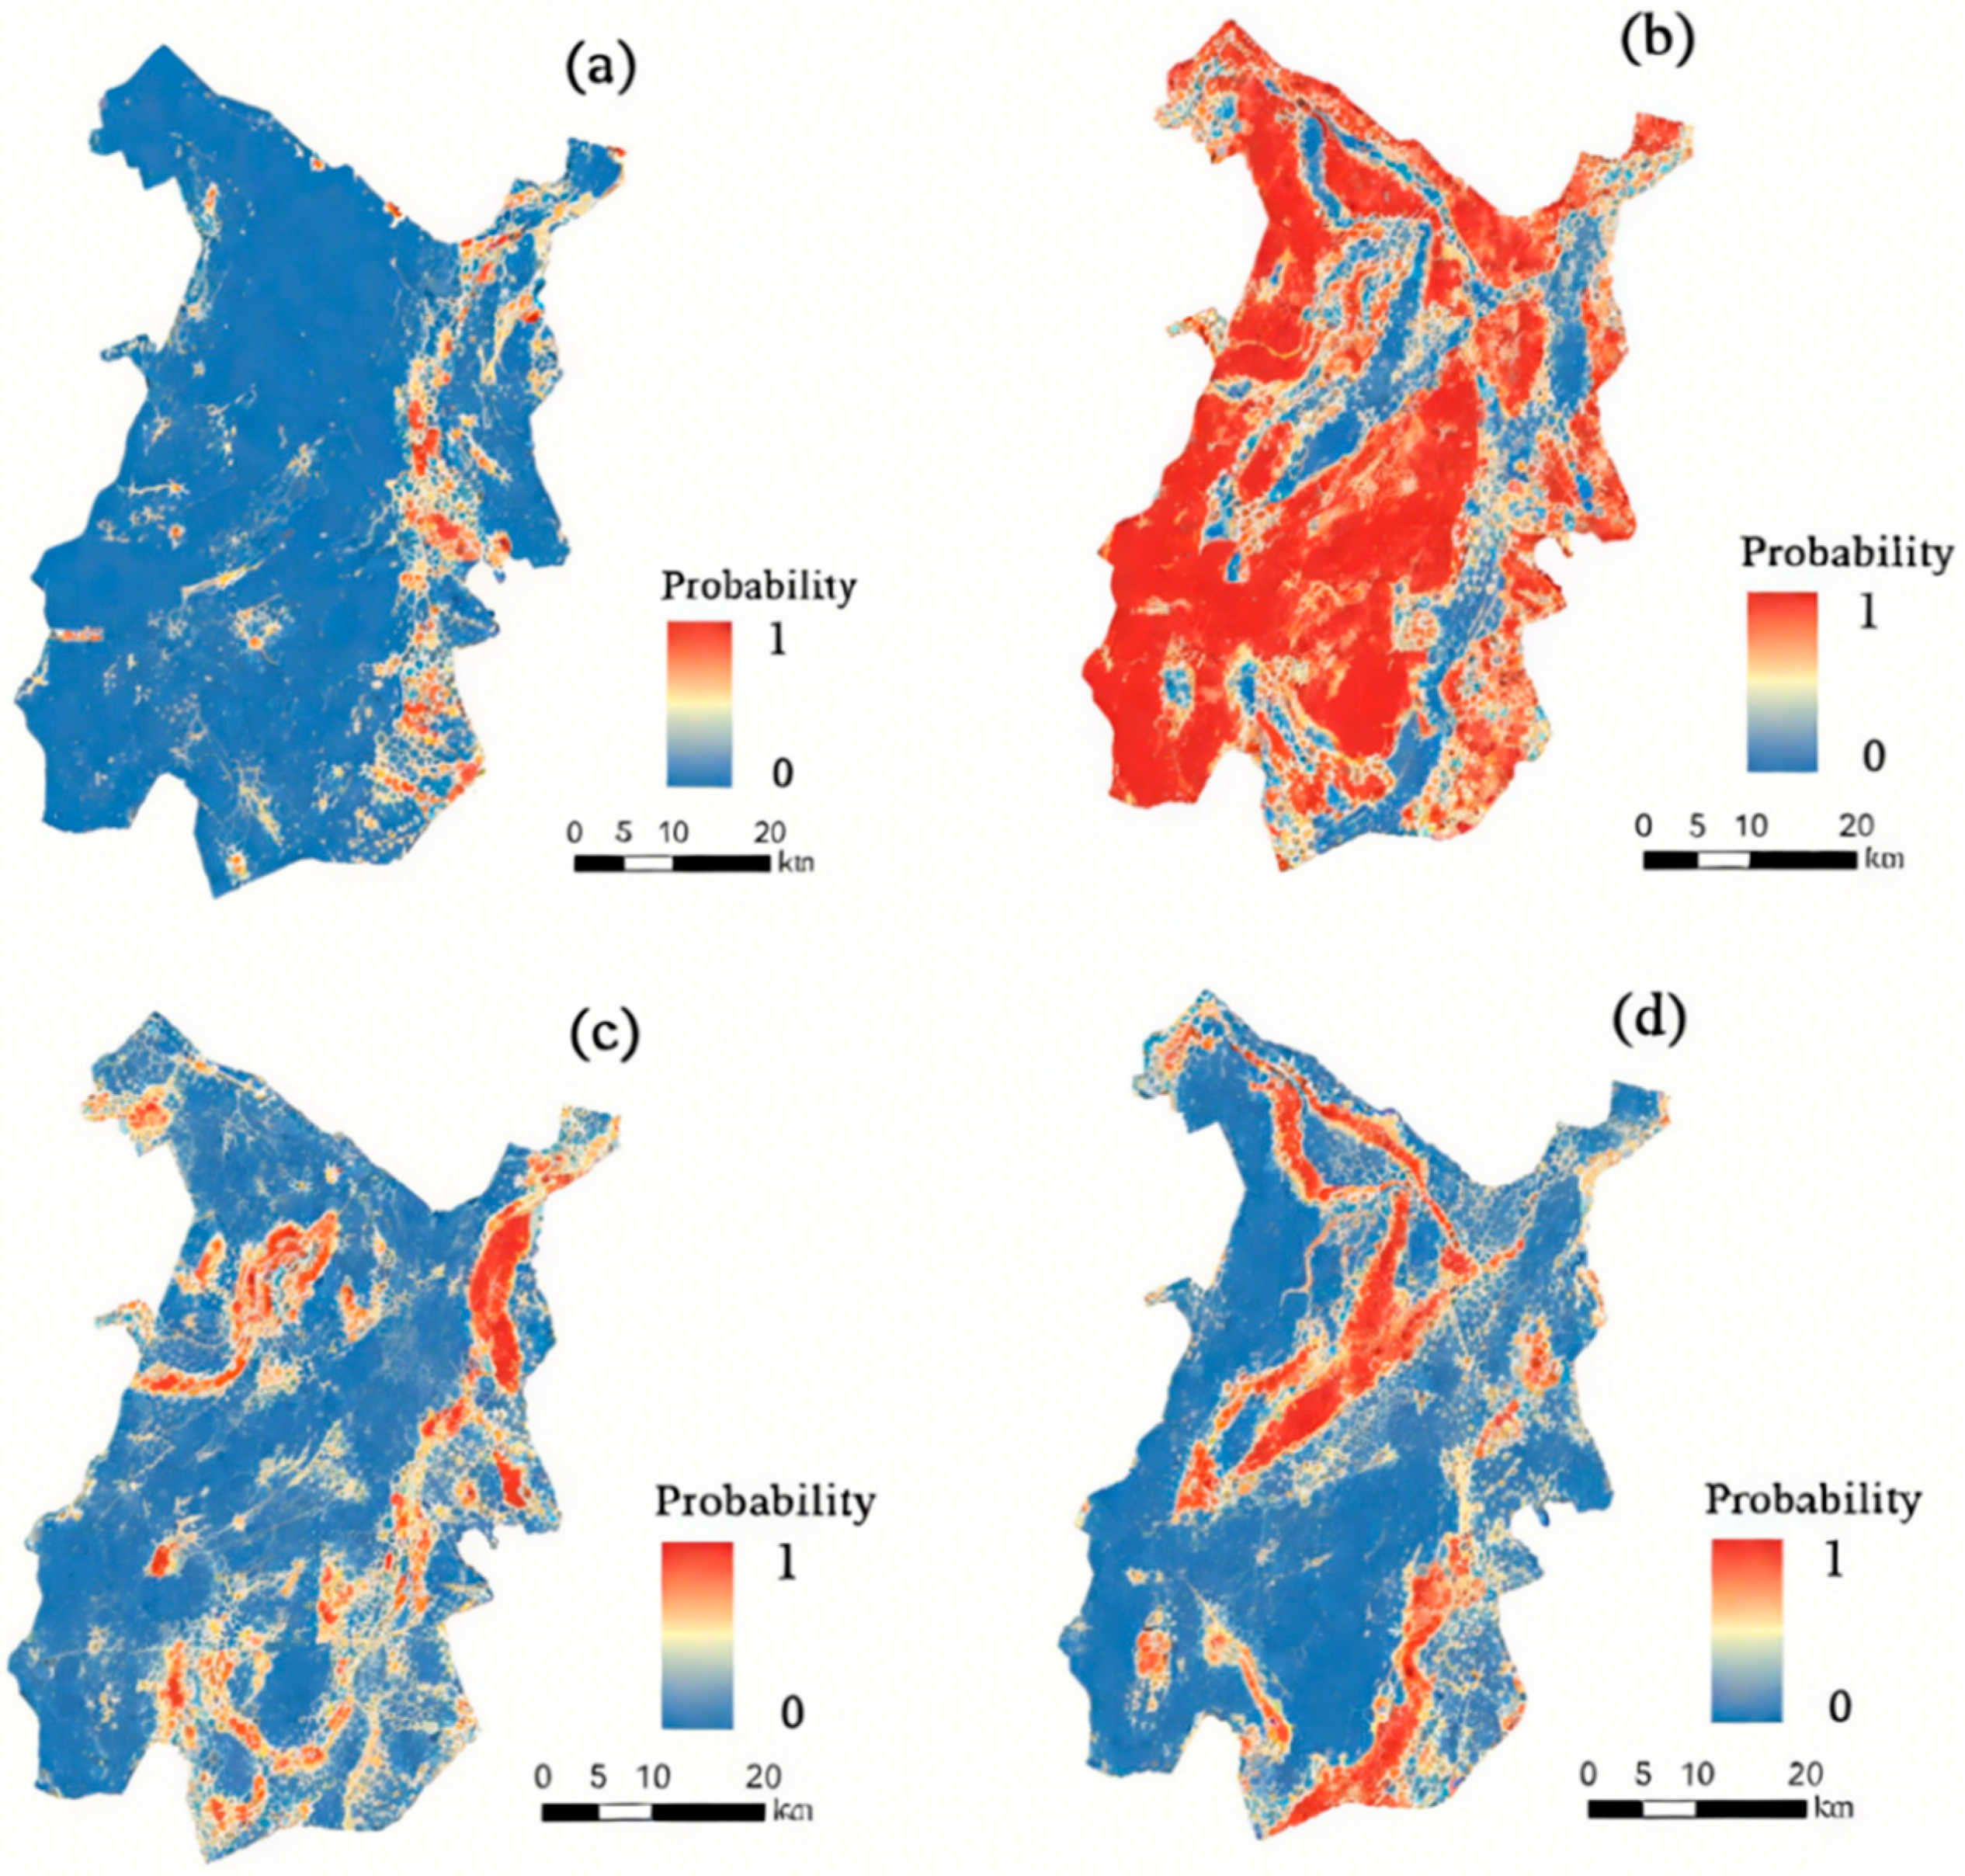
7]. In this model, LEAS employs the Random Poplar Plantations classification algorithm to examine the relationship between land class expansion and various driving factors, determining the development probability of each land class and the contribution of these factors to their expansion over a specified period. The CARS model, in contrast, applies a threshold-decreasing, multi-type random patch seed mechanism to simulate the evolution of patches for different land types. The simulation parameters include a transition matrix, neighborhood weights, and land use demand.
The transition matrix is primarily derived from historical land use data and expert knowledge. The neighborhood weight parameter represents the expansion intensity of different land types, reflecting the expansion capacity of each land class under spatial driving factors. Land use demand is predicted using either the Markov chain or linear regression model within the PLUS framework.
Policy interventions (e.g., poplar tree removal mandates under the ‘Three-Year Action Plan’) were incorporated through the following: (1) transition constraints: prohibiting conversion to poplar plantations in ecological regulation scenarios; (2) neighborhood weights: setting low expansion capacity for poplar plantations (0.053) to reflect suppressed regrowth; (3) binary masks: using 2022 actual poplar distribution as a spatial constraint to limit simulated expansion.
To ensure the replicability and computational efficiency of the model implementation, this study deployed the PLUS model using Python (v3.9) (Python Software Foundation, Wilmington, DE, USA), leveraging its robust ecosystem of geospatial analysis and machine learning libraries such as GDAL (v3.6) for raster data processing, NumPy (v1.24) for numerical computations, and scikit-learn (v1.2) for algorithmic support. The source code of the PLUS model is publicly accessible on GitHub (
https://github.com/), enabling researchers to reproduce the analytical workflow, verify results, and adapt the model to specific research contexts. All simulations were conducted in a high-performance computing environment to handle large-volume geospatial datasets and complex multi-class land use simulations efficiently. Visual Studio Code (v1.78) was utilized as the primary integrated development environment (IDE), facilitating seamless debugging, code versioning, and integration of diverse spatial datasets throughout the modeling process.
This study applies the model to predict the trends of patch-level changes across different wetland types, providing both theoretical and practical insights.
2.3.2. Accuracy Validation Methods
The accuracy of the PLUS simulation results was evaluated using the Kappa coefficient and the FoM coefficient. The FoM coefficient is used to quantitatively evaluate simulation accuracy at the cellular scale. A higher value indicates greater simulation accuracy, with typical values ranging from 0.01 to 0.25 [
6]. The FoM coefficient is presented in Formula (1):
In the formula, A denotes the area of error where land use has changed, but was predicted to remain unchanged; B represents the area where the prediction is accurate; C indicates the area of error where the prediction was incorrect; and D refers to the area of error where land use has remained unchanged, but the prediction shows a change. Limiting large-scale human activities, including planned regulatory measures (e.g., the felling of poplar trees), allows wetland landscape types to primarily evolve under the influence of natural factors.
2.3.3. Scenario Setting
To investigate future trends in wetland landscape changes under different development objectives, two scenarios—natural development and ecological regulation—are defined to predict the spatial patterns of wetland landscape types in the study area by 2030. These scenarios are based on the characteristics of the East Dongting Lake wetland as a national nature reserve and integrate relevant research findings. In the natural development scenario, the current status and driving factors of 2022 serve as the baseline. It is assumed that the spatial pattern of the wetland landscape in the study area will evolve linearly, following its historical trajectory. This scenario envisions the evolution of wetland landscape types primarily driven by natural influences, with changes occurring due to natural succession [
3]. In the ecological regulation scenario, the impact of poplar plantations on biodiversity is considered, including the continued deforestation of poplar trees and restrictions on converting existing grasslands into poplar plantations. This scenario predicts a multi-factor development of wetland landscape types, driven by both natural factors and human activities.
4. Discussion
4.1. Technical Features of the PLUS Model in Wetland Prediction
Although other land-use change models exist, the PLUS model represents a significant advancement through its innovative integration of a rule-mining framework based on land expansion analysis strategy (LEAS) and a cellular automata approach using multi-type random patch seeds (CARS) [
12]. The PLUS model is particularly effective in revealing the driving forces behind changes in land use/cover types and can simulate multi-class land use/cover changes based on patch-level evolution [
6]. However, its application in predicting and simulating wetland landscape pattern changes remains relatively limited, particularly in the simulation of patch-level changes.
The PLUS model has the following advantages in wetland prediction:
Deep Analysis of Driving Factors: The LEAS module extracts expansion-driving forces using the Random Poplar Plantations algorithm, quantifying the contributions of natural factors (such as climate and hydrology) and human factors (such as urbanization, agricultural development, and tourism development) to wetland degradation. For instance, Ref. [
13] integrated the PLUS model to explore the spatiotemporal evolution characteristics and driving mechanisms of land use in the Zhengzhou-Luoyang Yellow River region from the perspectives of land use dynamics, transition matrix, centroid migration, and landscape pattern.
Flexible Dynamic Transition Rules and Multi-Class Interactions: The model allows the setup of transition probabilities and constraints between different land types (e.g., prohibiting wetlands from being converted to urban areas), making it adaptable to specific wetland protection needs [
7].
High-Precision Patch Generation Mechanism: The CARS module uses a “competitive seed” mechanism to generate random patches, which more accurately simulates the complex spatial processes of wetland fragmentation, expansion, or contraction. This is superior to the grid-based rule division in traditional models such as CLUE-S. For example, Ref. [
14] provides a detailed discussion on the application of the CARS module, simulates the patch evolution process of wetland ecosystems, emphasizes the impact of multiple types of random patch seeds on wetland patterns, and verifies the reliability of the patch generation mechanism through simulation.
Multi-Scale and Multi-Scenario Compatibility: The PLUS model supports simulations at multiple scales, from local wetland protection zones to watershed levels. Ref. [
15] through multi-scenario simulations using the PLUS model, proposed an ecological restoration priority zoning plan for the Poyang Lake Wetland Basin, providing a scientific basis for wetland protection and restoration decision-making in the region.
Coupling with Other Models for Comprehensive Research. For example, Hu et al. conducted a study using the PLUS-InVEST-SolVES model to analyze land use changes and the social value of ecosystem services in the Weihe River Basin. The SolVES model is primarily used to assess social values, such as human preferences and subjective evaluations of ecosystem services [
16].
Ecological land serves as both a crucial mechanism for implementing ecological protection and an external representation of policy effectiveness under an ecological-priority approach [
17]. While multiple land-use change models exist, the PLUS model’s integration of LEAS and CARS frameworks provides unique advantages for capturing such policy-driven landscape transformations.
This conceptual framework is vividly demonstrated in our case study, where the PLUS model’s technical advantages enable effective capture of policy-driven landscape transformations. The dramatic poplar plantation-to-grassland conversion observed from 2019 to 2022 (decreasing from 387.92 km2 to 39.49 km2) directly reflects three key protection policies: (1) wetland restoration through afforestation reduction (e.g., systematic poplar tree removal under Hunan’s “Three-Year Action Plan”), (2) lake management via hydrological regulation, and (3) ecological redline enforcement (as implemented through transition constraints in the CARS module).
These quantifiable outcomes not only validate the model’s utility for assessing conservation effectiveness in ecologically sensitive regions like East Dongting Lake, but more importantly demonstrate the PLUS model’s breakthrough application in simulating policy effects in wetland systems—overcoming the limitations of conventional models in capturing abrupt policy impacts. Such quantifiable policy impacts validate the model’s utility for assessing conservation effectiveness in ecologically sensitive regions like East Dongting Lake, while also providing measurable indicators for evaluating ecological redline policy implementation.
4.2. Limitations and Future Prospects
This study utilizes the PLUS model to quantitatively analyze the contributions of driving factors to wetland changes in the study area and predict the spatial-temporal distribution patterns of four different wetland types in East Dongting Lake under various scenarios in 2030.
However, the conversion patterns between different wetland types in Dongting Lake are highly complex [
10]. Due to the organic remains of submerged plants, floating plants, and emergent plants, as well as sediment accumulation slowly raising the lakebed, aquatic vegetation in shallow water areas mainly follows the process of hydrosere succession, occupying bare shallow land. Simultaneously, the conversion patterns and rates of wetlands in the study area are influenced by sedimentation rates. When sediment accumulation accelerates, woody plants (primarily poplar plantations in this study context) rapidly occupy sandbars; otherwise, wetland vegetation such as moss grass gradually takes over low-lying sandbars, achieving succession in the sandbars [
18]. This dynamic was incorporated in our model through elevation-dependent transition rules and sediment accumulation proxies in the driving factors.
To achieve higher-accuracy wetland change predictions, more precise and detailed wetland classification data are required. Additionally, the relationship between driving factors and wetland changes, along with their contributions, should be dynamic and even coupled. Therefore, the analysis of wetland factors must also be dynamic. When predicting wetland changes, patch transition probabilities and constraints should be dynamic and nonlinear.
In the future, the effectiveness of wetland dynamic simulation can be further enhanced by coupling dynamic evaluation models and machine learning algorithms, such as deep learning. This also presents a direction for future research and improvements in the model.
