Author Contributions
Conceptualization, M.G.C.; methodology, M.G.C.; software, M.J.O. and M.G.C.; validation, M.G.C.; formal analysis, M.G.C.; investigation, M.G.C.; resources, M.J.O. and A.I.; data curation, M.G.C.; writing—original draft preparation, M.G.C.; writing—review and editing, M.G.C.; visualization, M.G.C.; supervision, M.J.O. and A.I.; project administration, M.J.O. and A.I.; funding acquisition, M.G.C., M.J.O., and A.I. All authors have read and agreed to the published version of the manuscript.
Figure 1.
Images of the test track with details of the main and pretest sections. Adapted from Connolly et al. (2025) [
44] (CC BY 4.0).
Figure 1.
Images of the test track with details of the main and pretest sections. Adapted from Connolly et al. (2025) [
44] (CC BY 4.0).
Figure 2.
The two test vehicles used in the study which included a VW Golf Mk7 (shown left with an inflatable device) and a Citroen Berlingo L1 H1 van (right).
Figure 2.
The two test vehicles used in the study which included a VW Golf Mk7 (shown left with an inflatable device) and a Citroen Berlingo L1 H1 van (right).
Figure 3.
Outline of the equipment and setup used during surface pressure testing, including the EvoScann P8-D pressure scanner, the EvoScann CAN-DI (CANbus to USB converter), the front-mounted surface pressure patch, and the bonnet-mounted pitot static tube.
Figure 3.
Outline of the equipment and setup used during surface pressure testing, including the EvoScann P8-D pressure scanner, the EvoScann CAN-DI (CANbus to USB converter), the front-mounted surface pressure patch, and the bonnet-mounted pitot static tube.
Figure 4.
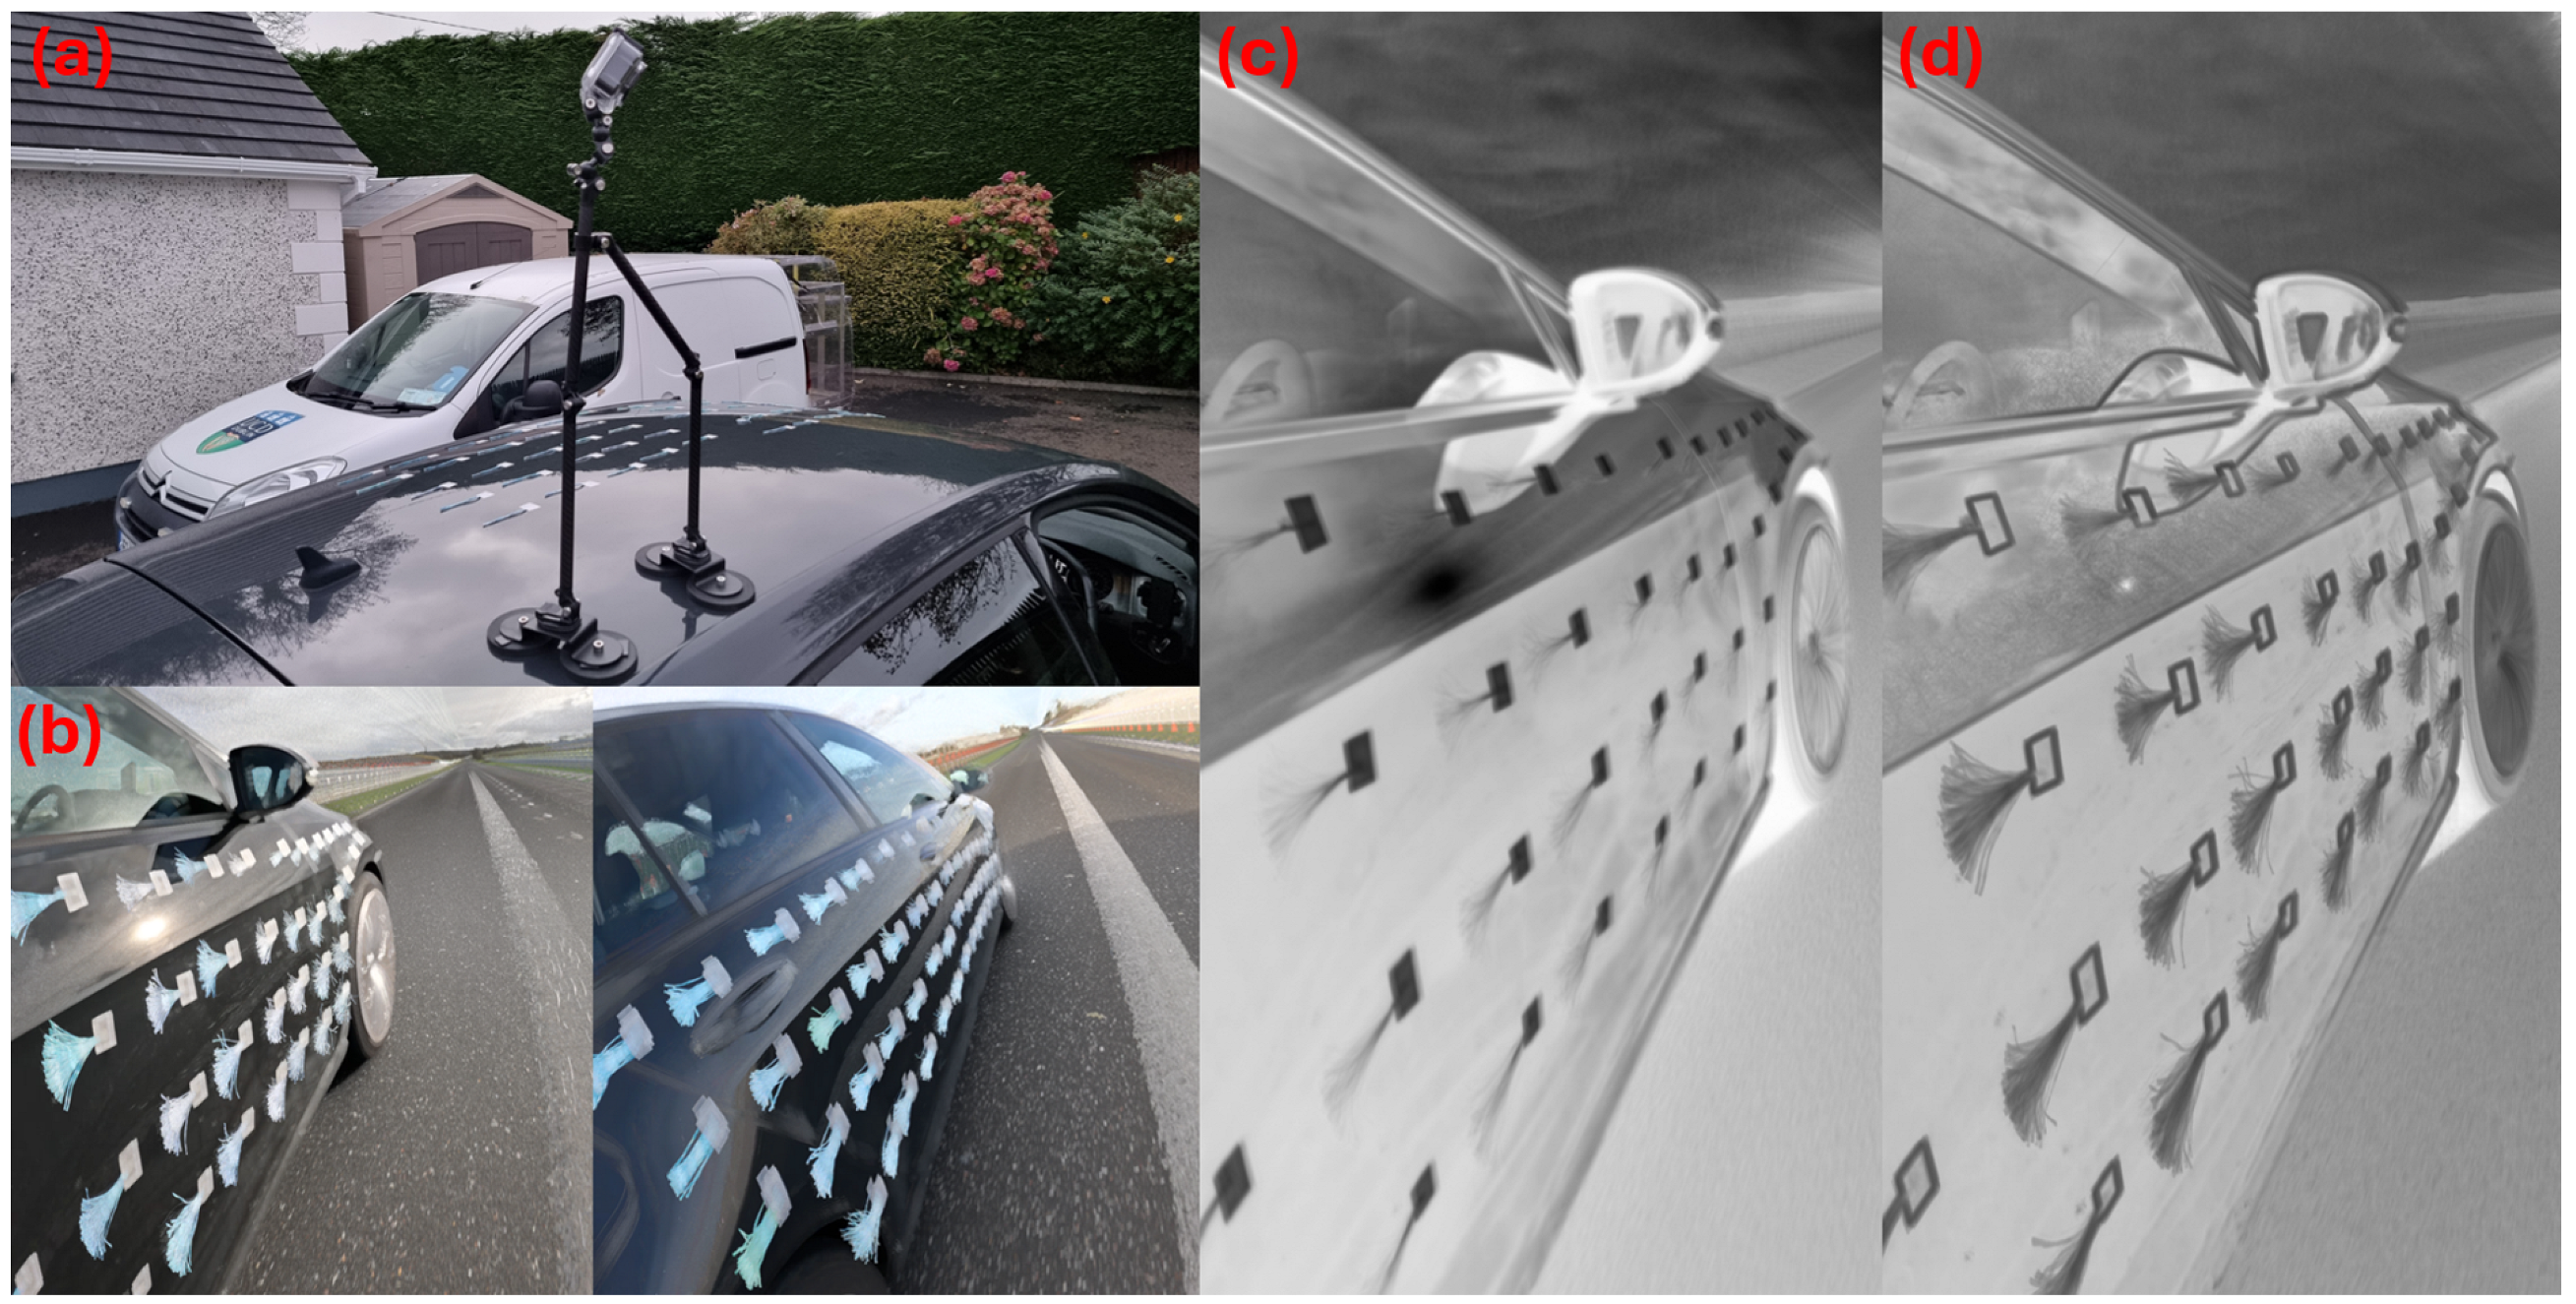
(a) GoPro Hero 12 mounted on a test vehicle. Examples of post-processed images used to evaluate surface flow: (b) Pixel-wise maximum projection, (c) Mean, (d) Standard deviation.
Figure 4.
(a) GoPro Hero 12 mounted on a test vehicle. Examples of post-processed images used to evaluate surface flow: (b) Pixel-wise maximum projection, (c) Mean, (d) Standard deviation.
Figure 5.
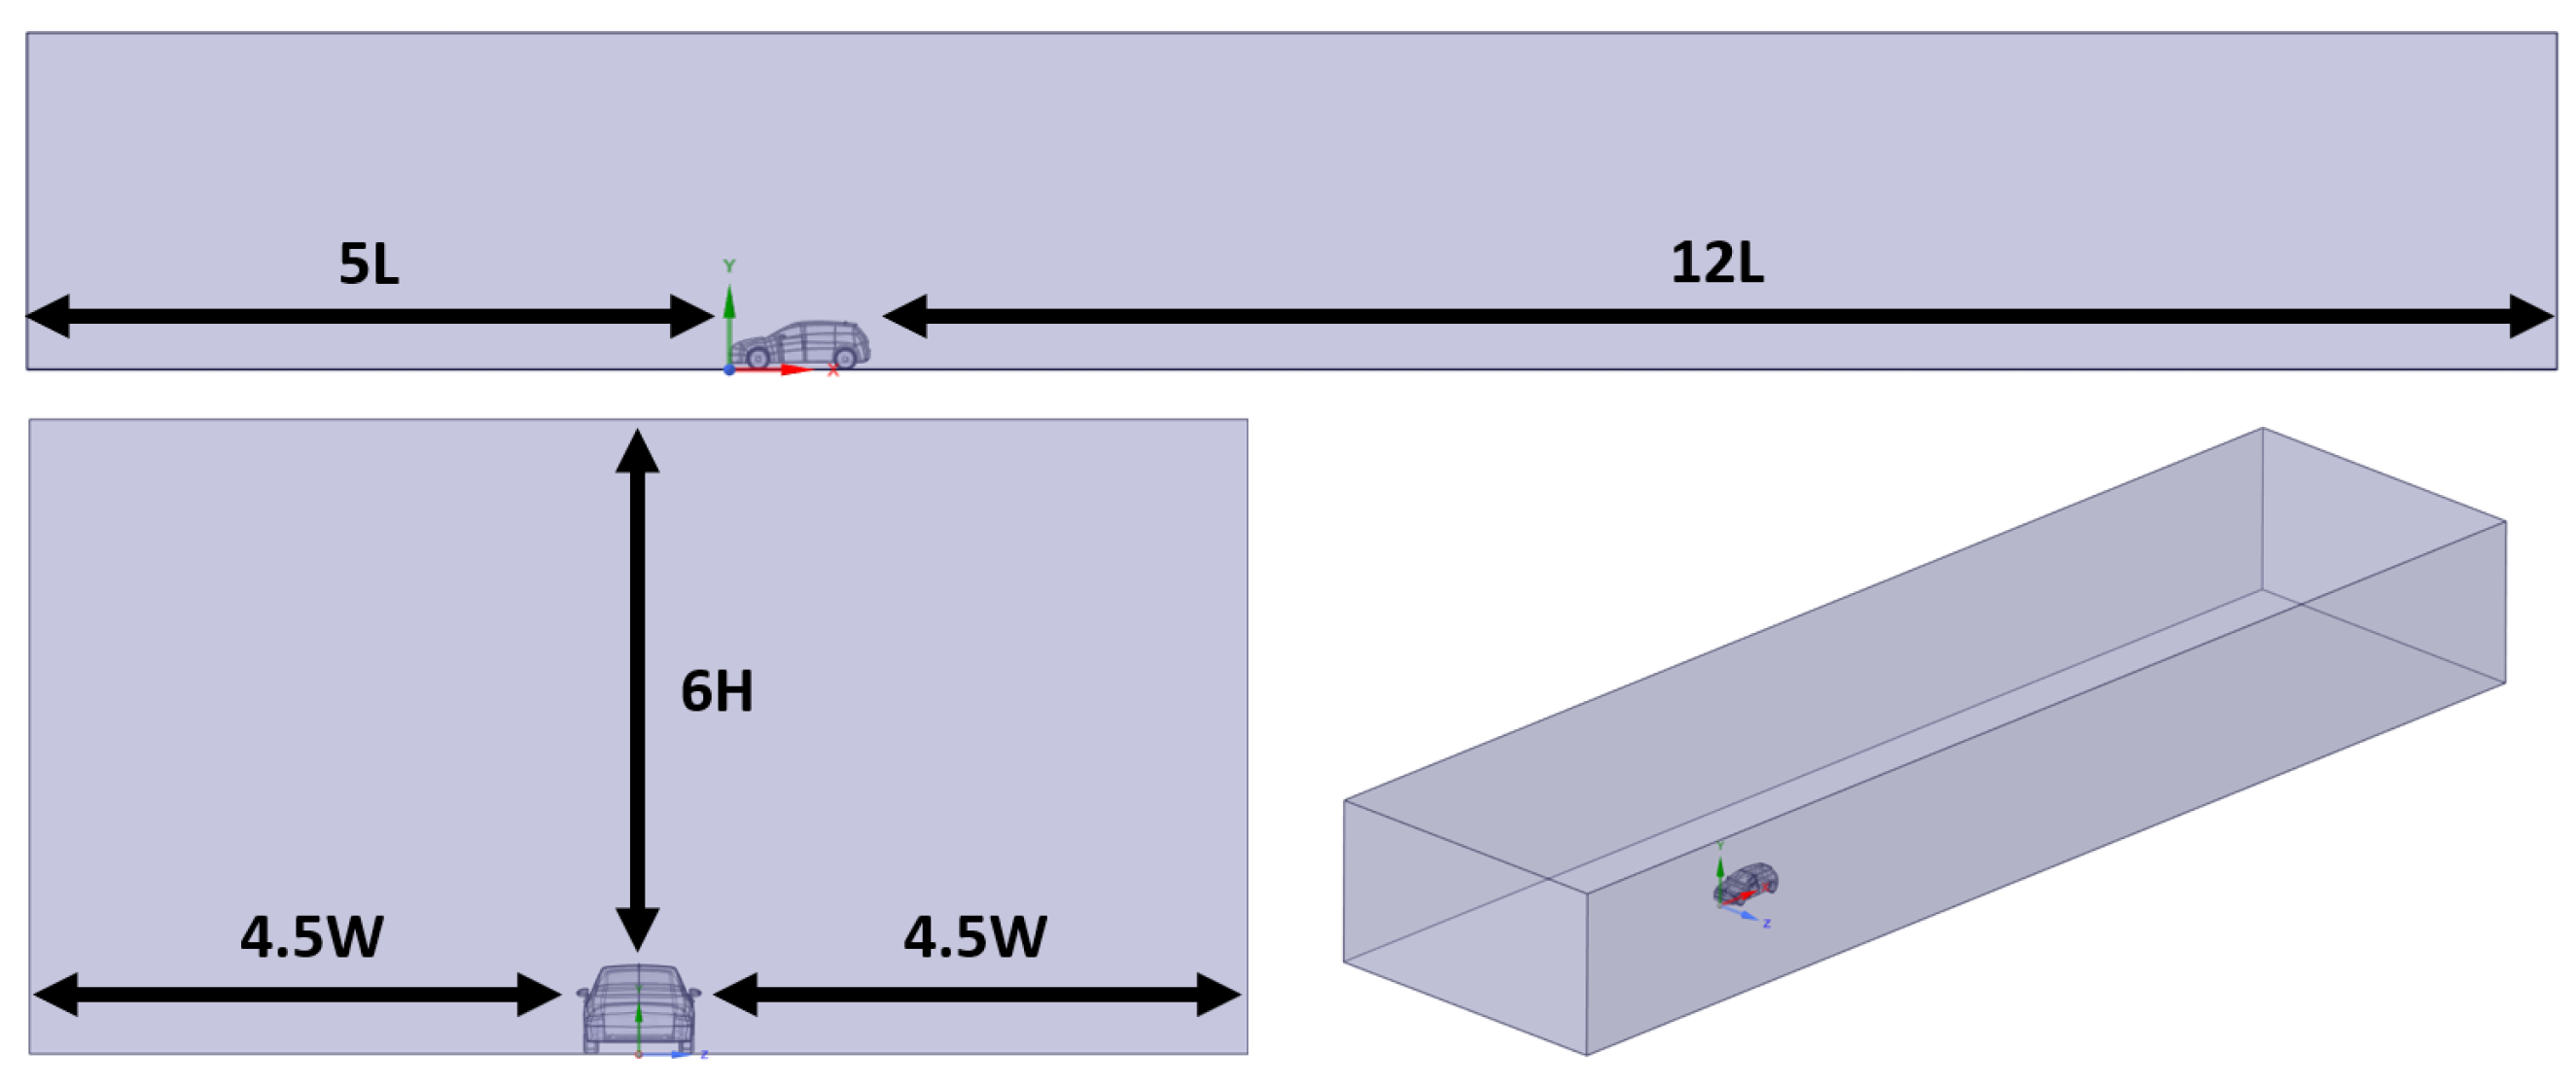
Outline of the fluid domain sizing used for the CFD simulations.
Figure 5.
Outline of the fluid domain sizing used for the CFD simulations.
Figure 6.
Outline of the baseline mesh used for the CFD simulations with a contour plot of the wall y+ (top right) on the VW Golf Mk7 fitted with a taxi sign and a drag-reducing roof ramp ahead of the taxi sign. The wall y+ contour plot ranges from 0 to 5.
Figure 6.
Outline of the baseline mesh used for the CFD simulations with a contour plot of the wall y+ (top right) on the VW Golf Mk7 fitted with a taxi sign and a drag-reducing roof ramp ahead of the taxi sign. The wall y+ contour plot ranges from 0 to 5.
Figure 7.
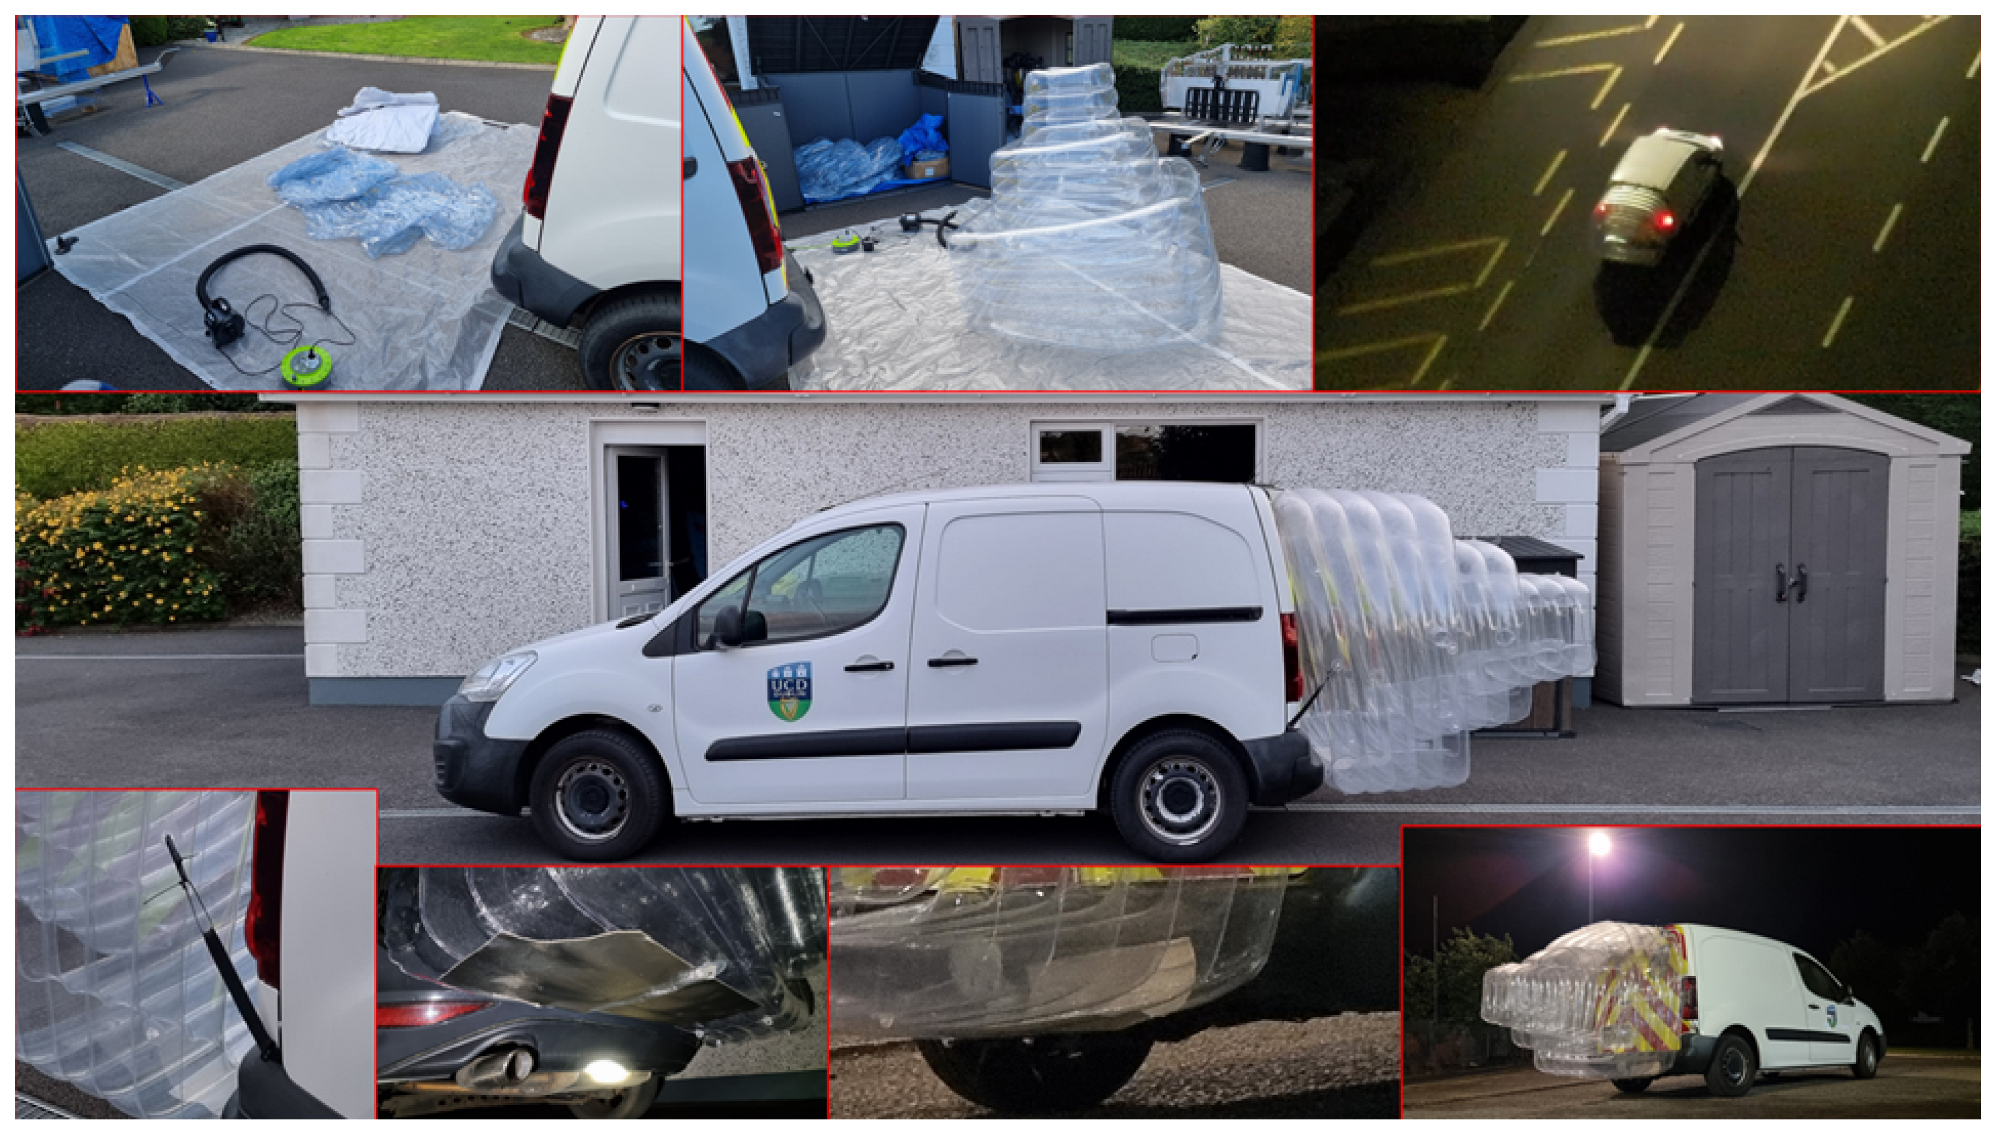
A collection of images highlighting the inflatable triple-cavity device for the van. This figure demonstrates the inflation process, how it is protected from hot exhaust gases (with an image of the shield on the VW Golf Mk7 for a better visual), and how it looks on the road from an aerial view.
Figure 8.
Outline of the CFD model and idealised shaped for the van’s inflatable triple cavity (left) with the velocity flow field inside the device along the vehicle’s symmetry plane (right).
Figure 8.
Outline of the CFD model and idealised shaped for the van’s inflatable triple cavity (left) with the velocity flow field inside the device along the vehicle’s symmetry plane (right).
Figure 9.
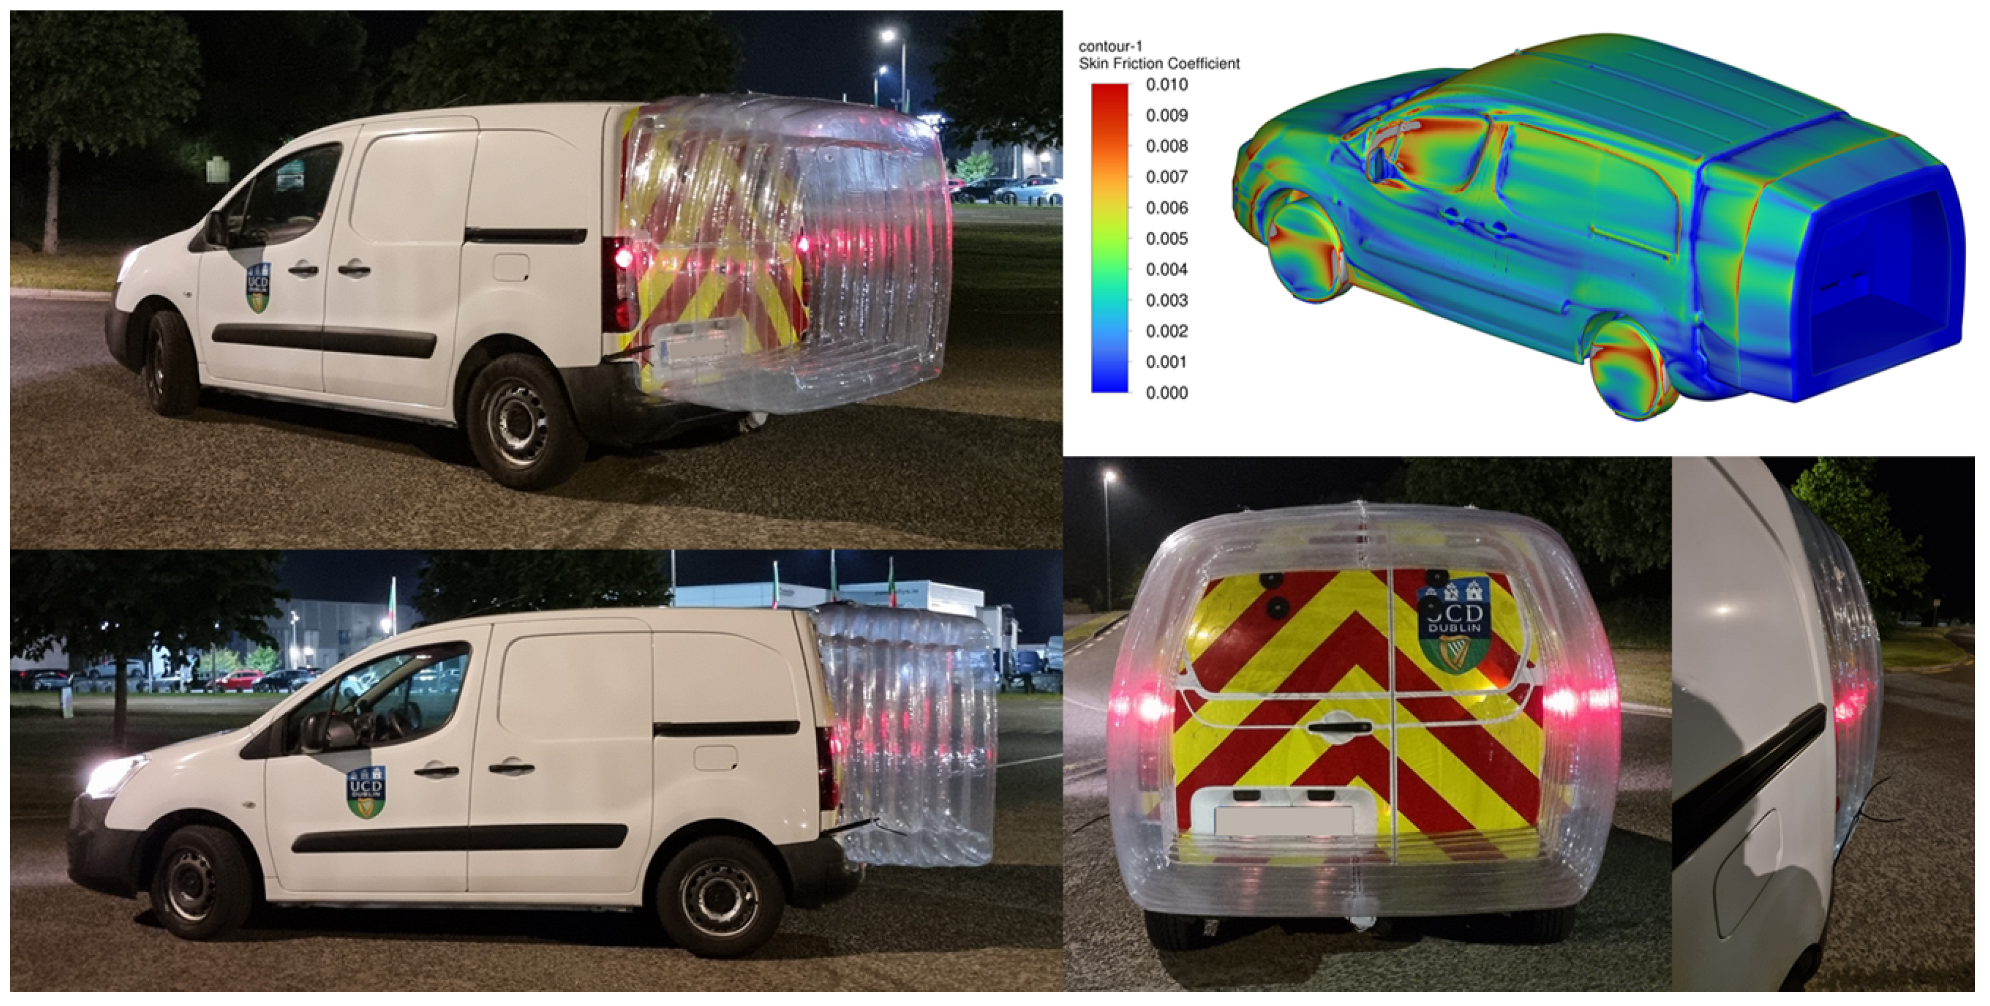
Images highlighting the inflatable single-cavity device on the van. Shown top right is a skin friction coefficient contour plot along the configuration’s surface.
Figure 9.
Images highlighting the inflatable single-cavity device on the van. Shown top right is a skin friction coefficient contour plot along the configuration’s surface.
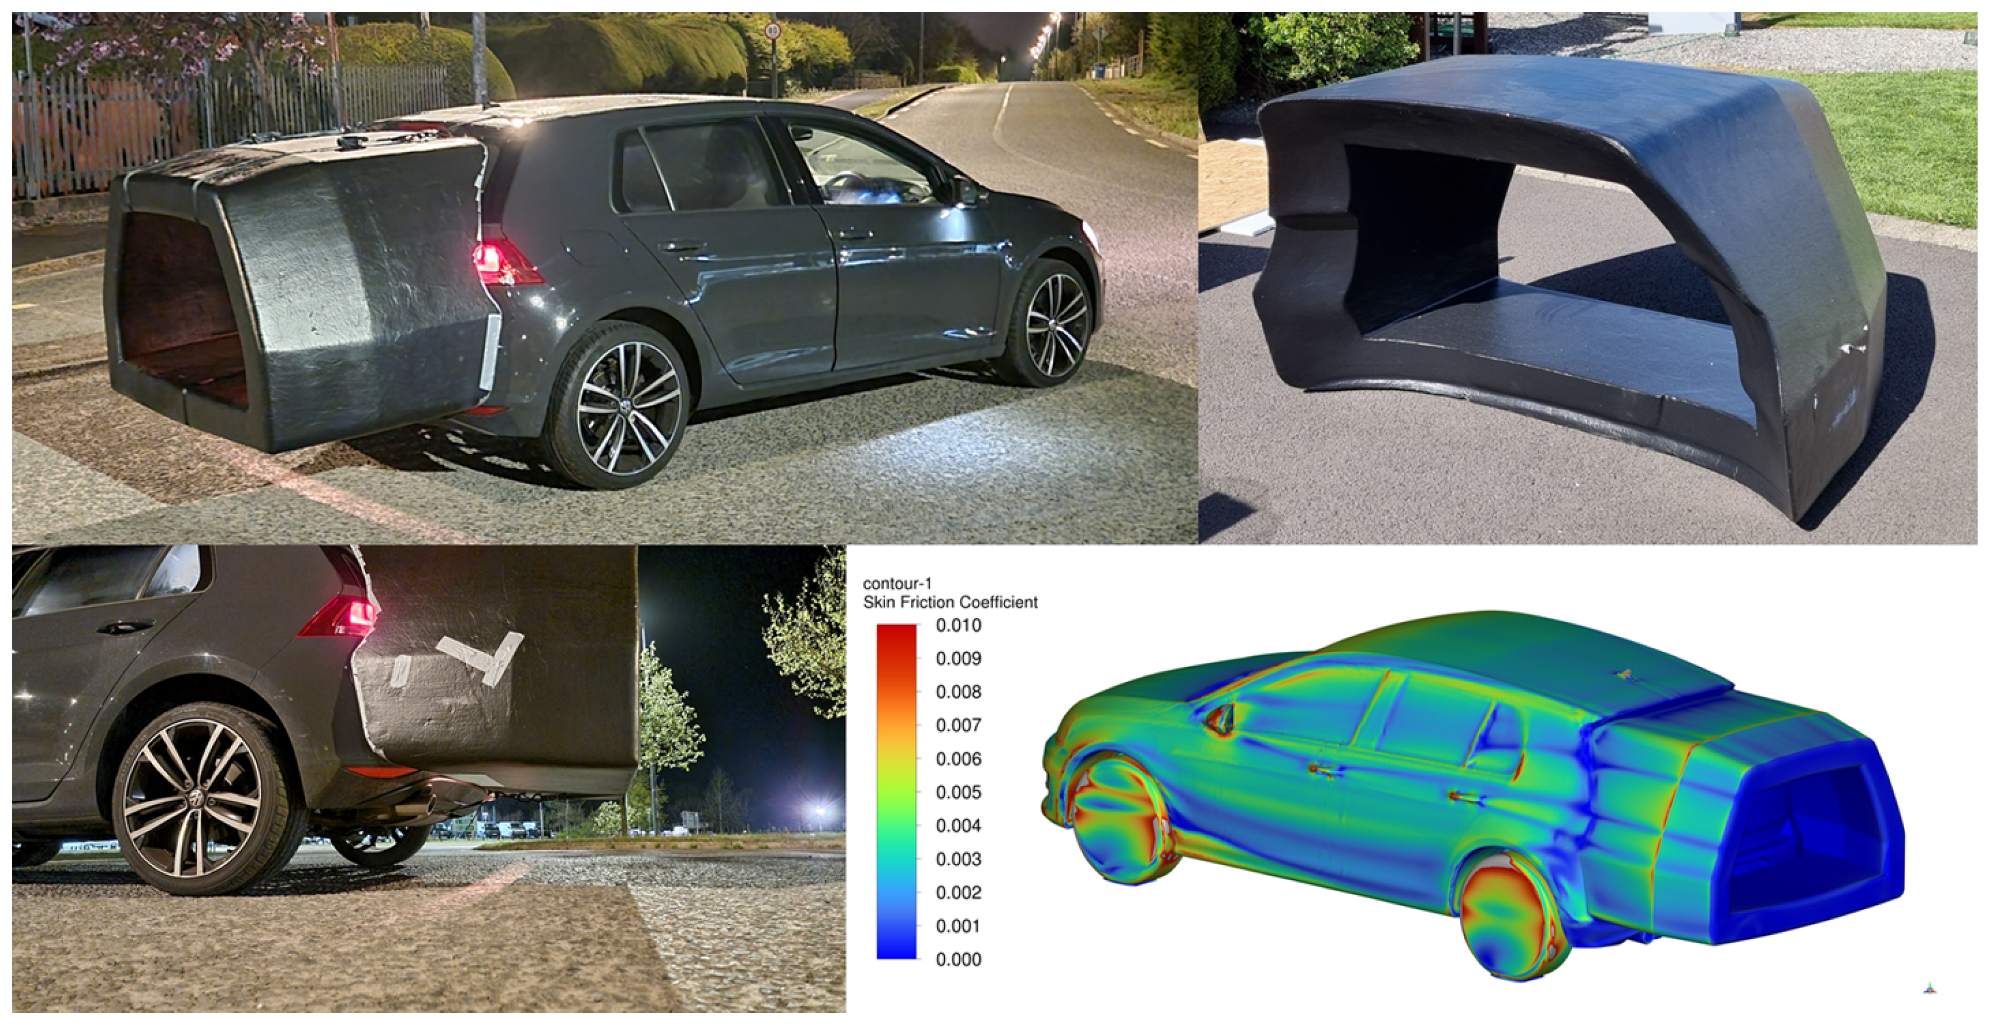
Figure 10.
Images highlighting the foam single-cavity device for the car with a skin friction coefficient contour plot along the configuration’s surface shown bottom right.
Figure 10.
Images highlighting the foam single-cavity device for the car with a skin friction coefficient contour plot along the configuration’s surface shown bottom right.
Figure 11.
Images highlighting the inflatable double-cavity device for the car with a skin friction coefficient contour plot along the configuration’s surface shown bottom right.
Figure 11.
Images highlighting the inflatable double-cavity device for the car with a skin friction coefficient contour plot along the configuration’s surface shown bottom right.
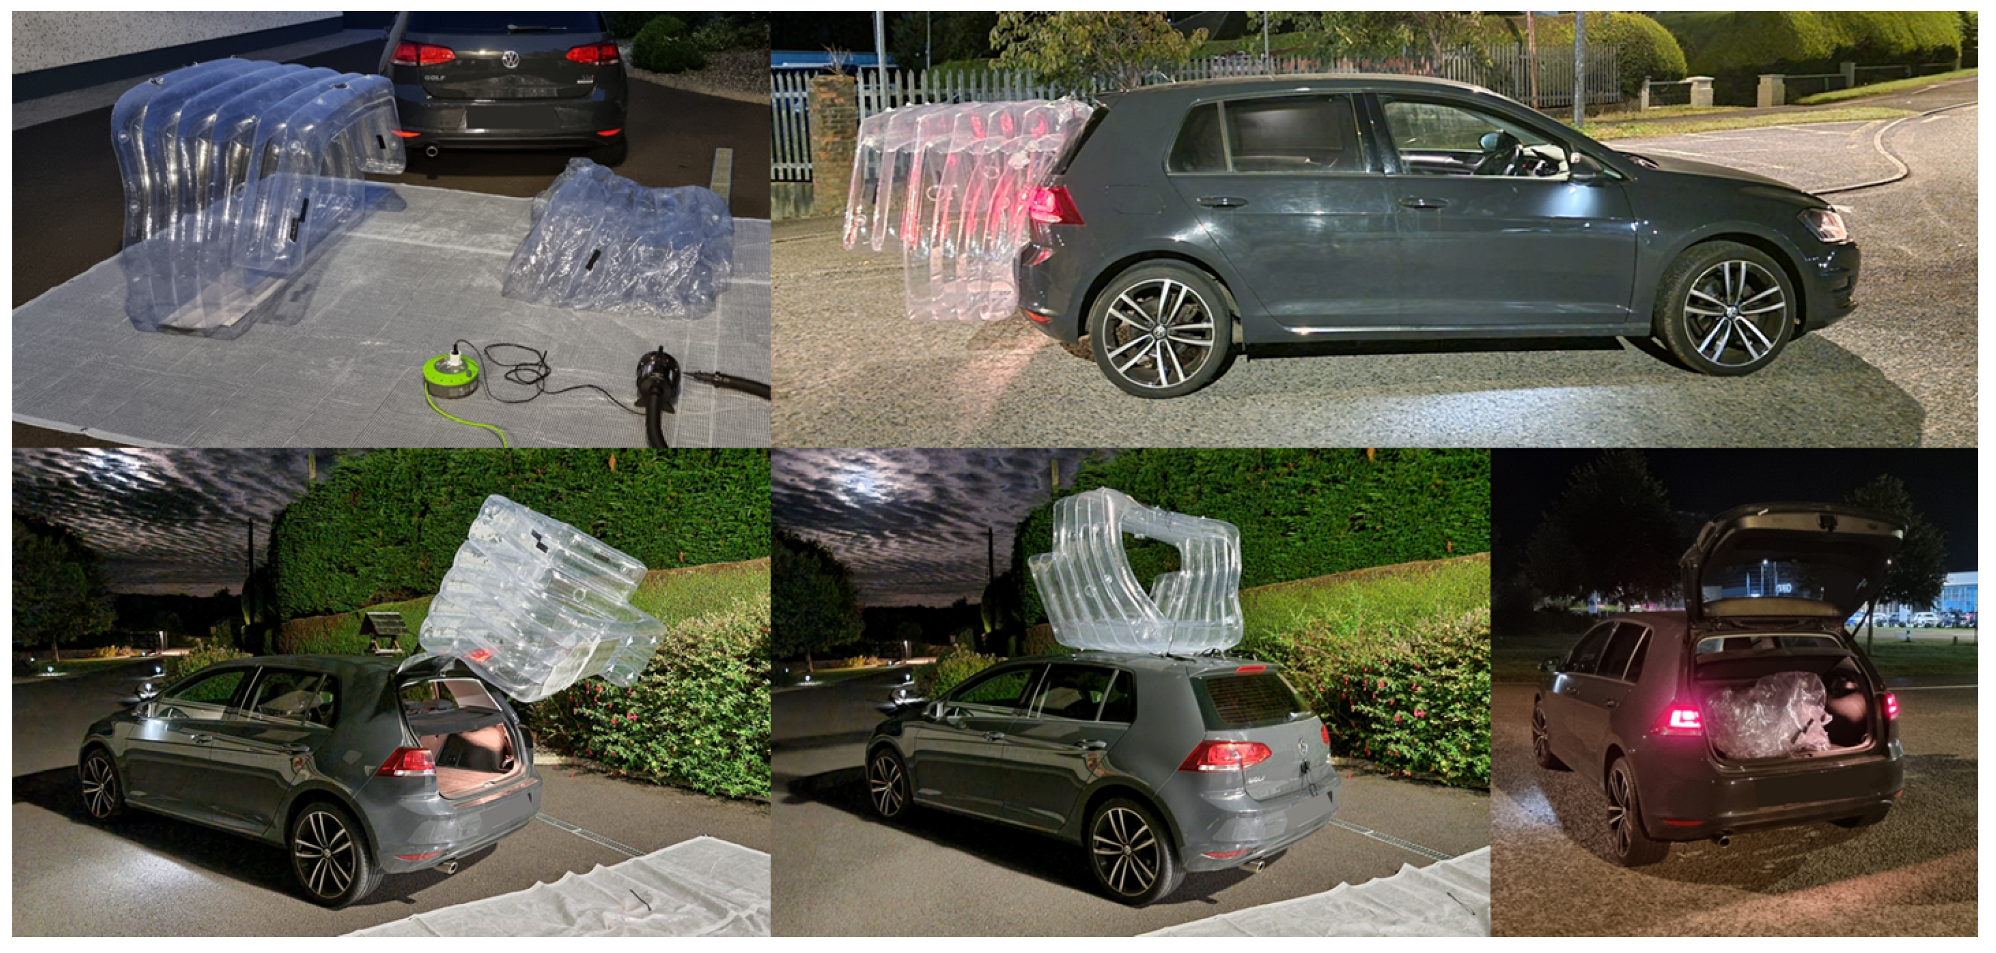
Figure 12.
Images highlighting the adapted (inner-removed) inflatable double-cavity device for the VW Golf. Shown is an outline for how the inner cavity was cut away and how the device can be manoeuvred to facilitate access to the rear boot space and how it can be easily deflated and stored.
Figure 12.
Images highlighting the adapted (inner-removed) inflatable double-cavity device for the VW Golf. Shown is an outline for how the inner cavity was cut away and how the device can be manoeuvred to facilitate access to the rear boot space and how it can be easily deflated and stored.
Figure 13.
Images highlighting the inflatable single-cavity device for the VW Golf. The images include a representation of the device constructed from a white and clear material, as well as views showing the space between the underside of the inflatables and the lower rear of the car.
Figure 13.
Images highlighting the inflatable single-cavity device for the VW Golf. The images include a representation of the device constructed from a white and clear material, as well as views showing the space between the underside of the inflatables and the lower rear of the car.
Figure 14.
Images highlighting the drag reducing roof ramp fitted ahead of the taxi sign on the VW Golf Mk7. The bottom left image shows the surface pressure coefficient plotted for −1 to 0, while the bottom right image shows the skin friction coefficient plotted from 0 to 0.01.
Figure 14.
Images highlighting the drag reducing roof ramp fitted ahead of the taxi sign on the VW Golf Mk7. The bottom left image shows the surface pressure coefficient plotted for −1 to 0, while the bottom right image shows the skin friction coefficient plotted from 0 to 0.01.
Figure 15.
Images showing the locations of the six base pressure patches fitted to the Citroen Berlingo van (left) and the rigid triple-cavity device fitted to the van for testing (right).
Figure 15.
Images showing the locations of the six base pressure patches fitted to the Citroen Berlingo van (left) and the rigid triple-cavity device fitted to the van for testing (right).
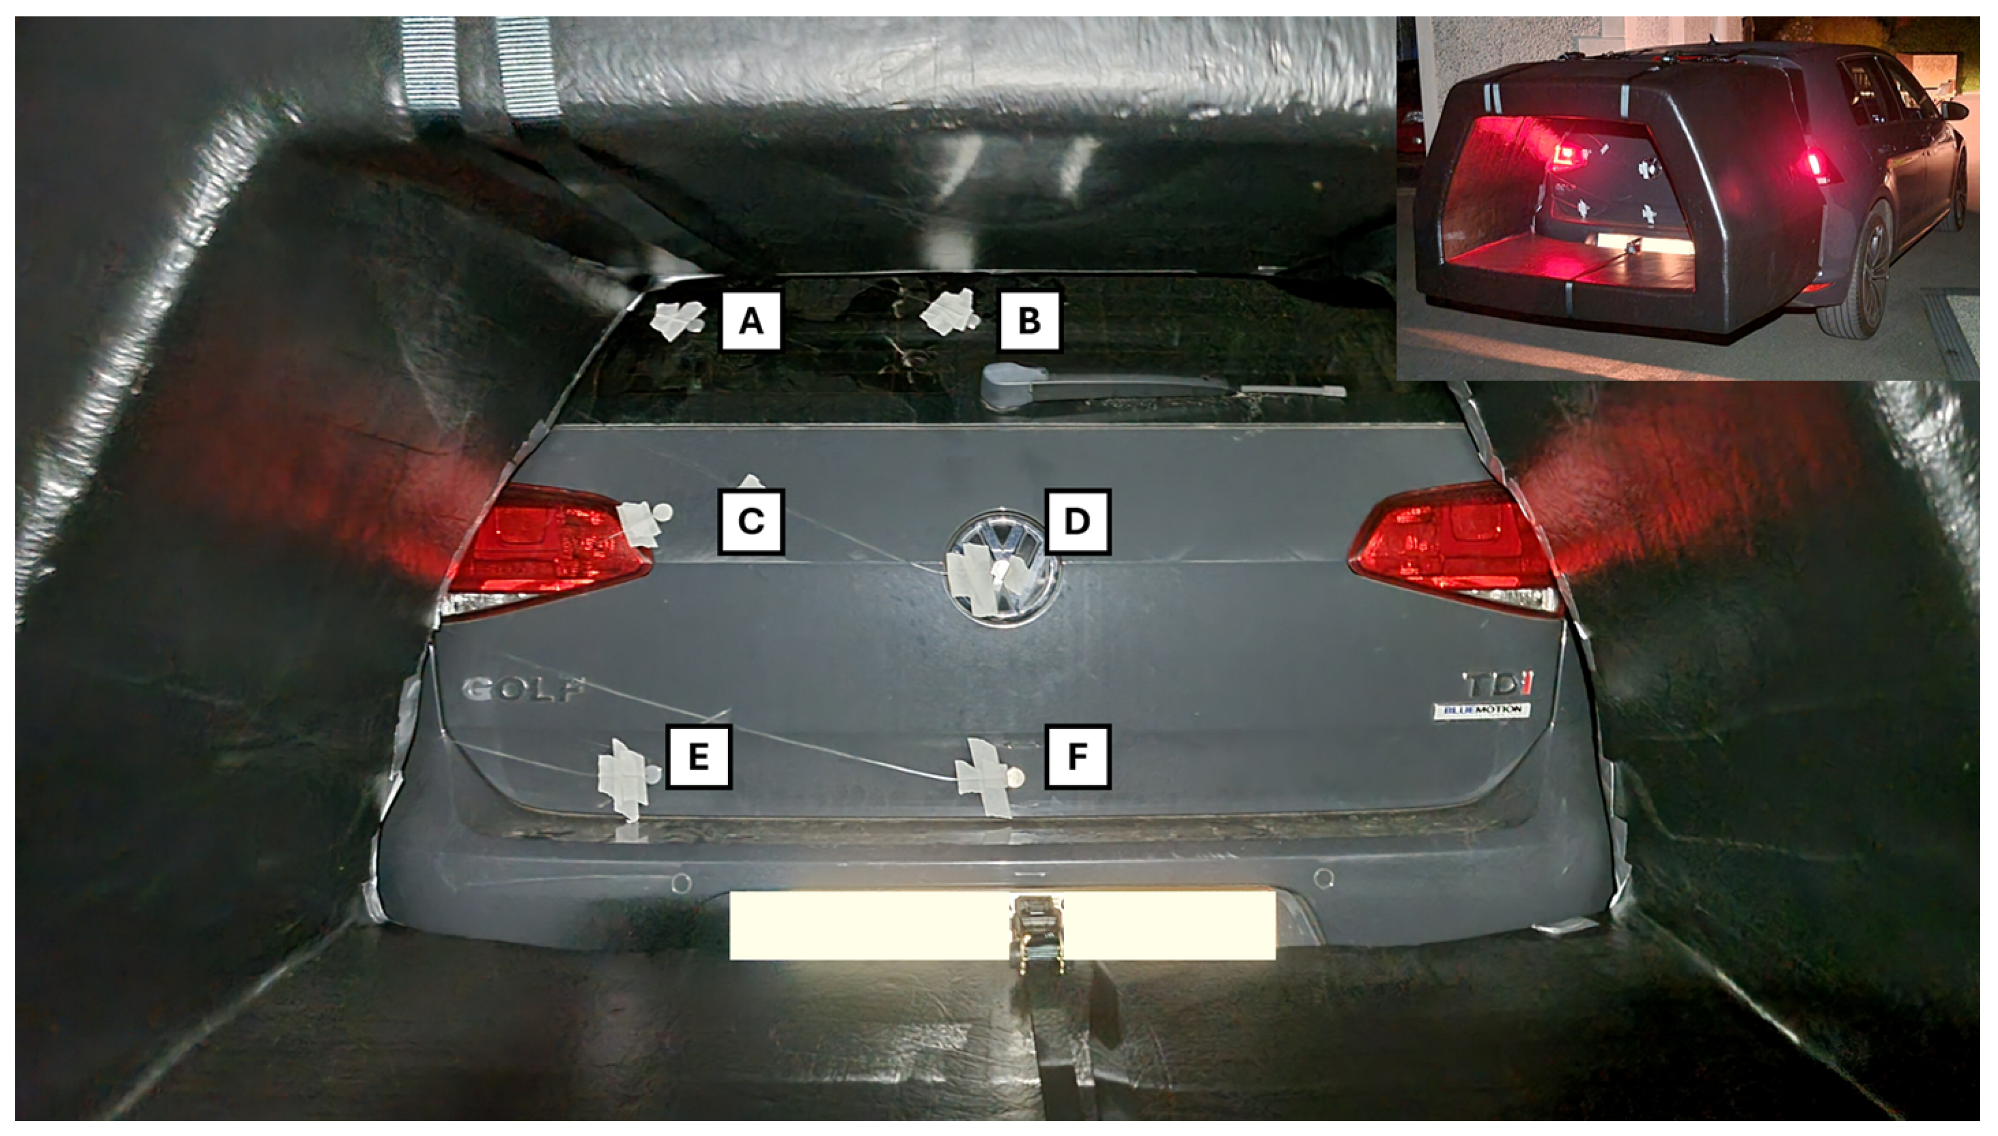
Figure 16.
Locations of the six base pressure patches fitted to the VW Golf Mk7 during the surface pressure testing with the foam cavity device.
Figure 16.
Locations of the six base pressure patches fitted to the VW Golf Mk7 during the surface pressure testing with the foam cavity device.
Figure 17.
Locations for the four additional roof pressure patches (G–J) fitted to the VW Golf Mk7 during the surface pressure testing with the taxi sign.
Figure 17.
Locations for the four additional roof pressure patches (G–J) fitted to the VW Golf Mk7 during the surface pressure testing with the taxi sign.
Figure 19.
An outline of the triple-cavity rear drag reduction device fitted to the VW Golf Mk7 (top right) and velocity magnitude plotted along the symmetry plane for the Car + TC simulation.
Figure 19.
An outline of the triple-cavity rear drag reduction device fitted to the VW Golf Mk7 (top right) and velocity magnitude plotted along the symmetry plane for the Car + TC simulation.
Table 1.
CFD-predicted values using the RANS methodology for the VW Golf Mk7 fitted with a taxi sign in the mesh sensitivity study.
Table 1.
CFD-predicted values using the RANS methodology for the VW Golf Mk7 fitted with a taxi sign in the mesh sensitivity study.
| Mesh Name | Baseline | Fine | Very Fine |
|---|
| Cell Count (millions) | 43.2 | 64.3 | 97.9 |
| Drag Coefficient | 0.4043 | 0.4034 | 0.4031 |
| % Change | – | | |
Table 2.
Drag change results for the van with the inflatable triple cavity.
Table 2.
Drag change results for the van with the inflatable triple cavity.
| Configuration Name | (km/h) | (km/h) | Road-Measured Drag | CFD Predicted Drag |
|---|
| Van with Inflatable Triple Cavity | 99 | 103.25 | | * |
Table 3.
Drag change results for the van with the inflatable single cavity.
Table 3.
Drag change results for the van with the inflatable single cavity.
| Configuration Name | (km/h) | (km/h) | Road-Measured Drag | CFD Predicted Drag |
|---|
| Van with Inflatable Single Cavity | 106.75 | 109.75 | | * |
Table 4.
Drag change results for the car with the foam cavity.
Table 4.
Drag change results for the car with the foam cavity.
| Configuration Name | (km/h) | (km/h) | Road-Measured Drag | CFD Predicted Drag |
|---|
| Car with Foam Cavity | 99 | 104.5 | | * |
Table 5.
Drag change results for the car with the inflatable double cavity.
Table 5.
Drag change results for the car with the inflatable double cavity.
| Configuration Name | (km/h) | (km/h) | Road-Measured Drag | CFD Predicted Drag |
|---|
| Car with Inflatable Double Cavity | 102.5 | 105 | | * |
Table 6.
Drag change results for the car with the adapted (inner-removed) inflatable double cavity.
Table 6.
Drag change results for the car with the adapted (inner-removed) inflatable double cavity.
| Configuration Name | (km/h) | (km/h) | Road-Measured Drag |
|---|
| Car with Adapted Inflatable Double Cavity | 102 | 103.5 | |
Table 7.
Drag change results for the car with the inflatable single cavity.
Table 7.
Drag change results for the car with the inflatable single cavity.
| Configuration Name | (km/h) | (km/h) | Road-Measured Drag |
|---|
| Car with Inflatable Single Cavity | 101 | 103.5 | |
Table 8.
CFD-predicted and road-measured drag change results for the VW Golf Mk7 fitted with a taxi sign and a drag reducing roof ramp.
Table 8.
CFD-predicted and road-measured drag change results for the VW Golf Mk7 fitted with a taxi sign and a drag reducing roof ramp.
| VW Golf | CFD | Area (m2) | CFD Predicted
Drag | Measured Speeds (km/h) | Road-Measured
Drag |
|---|
| with Taxi Sign | 0.404 | 2.230 | – | | – |
| with Taxi Sign and Ramp | 0.345 | 2.246 | | | |
Table 9.
Pressure deltas recorded at each of the six patches shown in
Figure 15 using the three different measurement methods, with an outline for the errors between the CFD methods and the experiment.
Table 9.
Pressure deltas recorded at each of the six patches shown in
Figure 15 using the three different measurement methods, with an outline for the errors between the CFD methods and the experiment.
| Patch Pressure Difference (Pa) | A | B | C | D | E | F |
|---|
| Road-Measured | 24 | 20 | 34 | 52 | 64 | 75 |
| RANS | 58 | 63 | 52 | 91 | 36 | 49 |
| HLES | 23 | 32 | 30 | 46 | 69 | 87 |
| RANS Error | 34 | 43 | 18 | 39 | | |
| HLES Error | | 12 | | | 5 | 12 |
Table 10.
Pressure measurements from each of the six pressure patches (as shown in
Figure 16) for the VW Golf Mk7, with and without the foam cavity.
Table 10.
Pressure measurements from each of the six pressure patches (as shown in
Figure 16) for the VW Golf Mk7, with and without the foam cavity.
| Road-Measured Patch Pressure (Pa) | A | B | C | D | E | F |
|---|
| VW Golf Mk7 | | | | | | |
| VW Golf Mk7 with Foam Cavity | | | | | | |
| Delta | 48 | 52 | 56 | 48 | 42 | 33 |
| ∣% Base Pressure Increase∣ | | | | | | |
Table 11.
Pressure measurements for the six base pressure patches (
Figure 16) and the additional four roof patches (
Figure 17) for the VW Golf Mk7, with and without the taxi sign.
Table 11.
Pressure measurements for the six base pressure patches (
Figure 16) and the additional four roof patches (
Figure 17) for the VW Golf Mk7, with and without the taxi sign.
| Patch Pressures (Pa) | Road Measured | CFD HLES |
|---|
| VW Golf | with Taxi Sign | | VW Golf | with Taxi Sign | |
|---|
| A | | | | | | |
| B | | | | | | |
| C | | | | | | 5 |
| D | | | | | | 14 |
| E | | | | | | |
| F | | | | | | 8 |
| G | | 41 | 355 | | 82 | 306 |
| H | – | 153 | – | – | 214 | – |
| I | – | | | – | | |
| J | | | | | | |
Table 12.
Drag coefficients for the leader and follower cars (VW Golf Mk7s) in the platooning study, where the leader and follower were optionally configured with a triple-cavity rear drag reduction device.
Table 12.
Drag coefficients for the leader and follower cars (VW Golf Mk7s) in the platooning study, where the leader and follower were optionally configured with a triple-cavity rear drag reduction device.
| Configuration Name | Leader | Follower | Leader (Counts) | Follower (Counts) |
|---|
| Car Only | 0.305 | – | – | – |
| Car Triple Cavity (TC) Only | 0.236 | – | – | – |
| Car + Car | 0.302 | 0.233 | | |
| TC + Car | 0.233 | 0.235 | | |
| Car + TC | 0.301 | 0.191 | | |
| TC + TC | 0.234 | 0.186 | | |


