1. Introduction
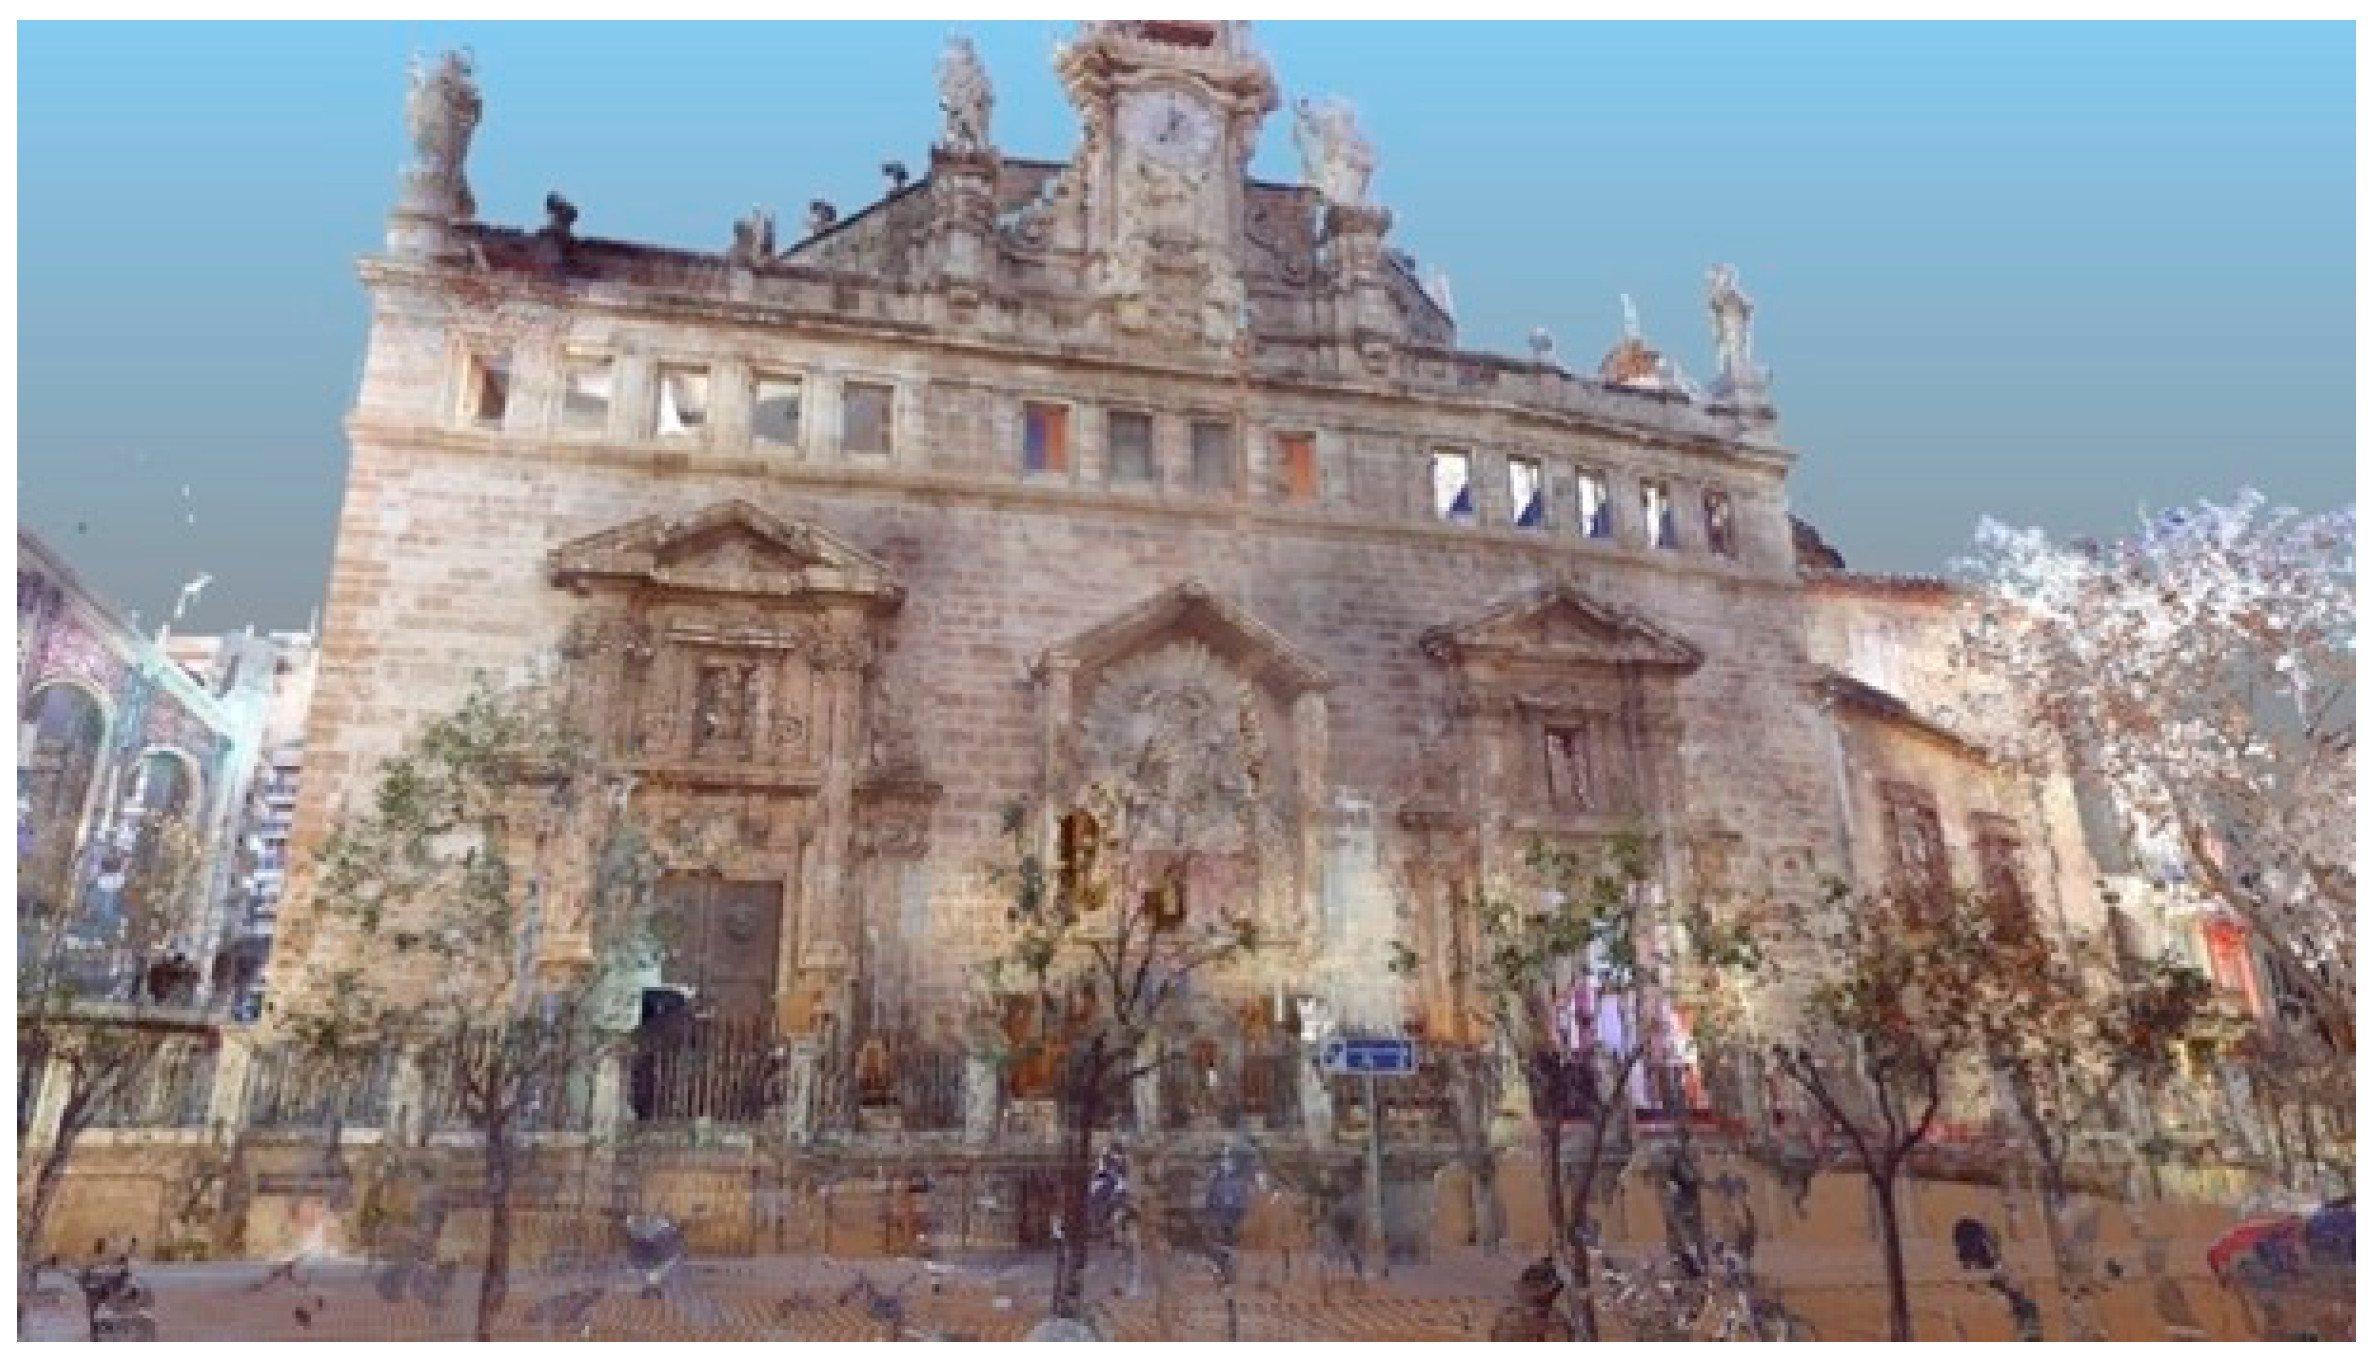
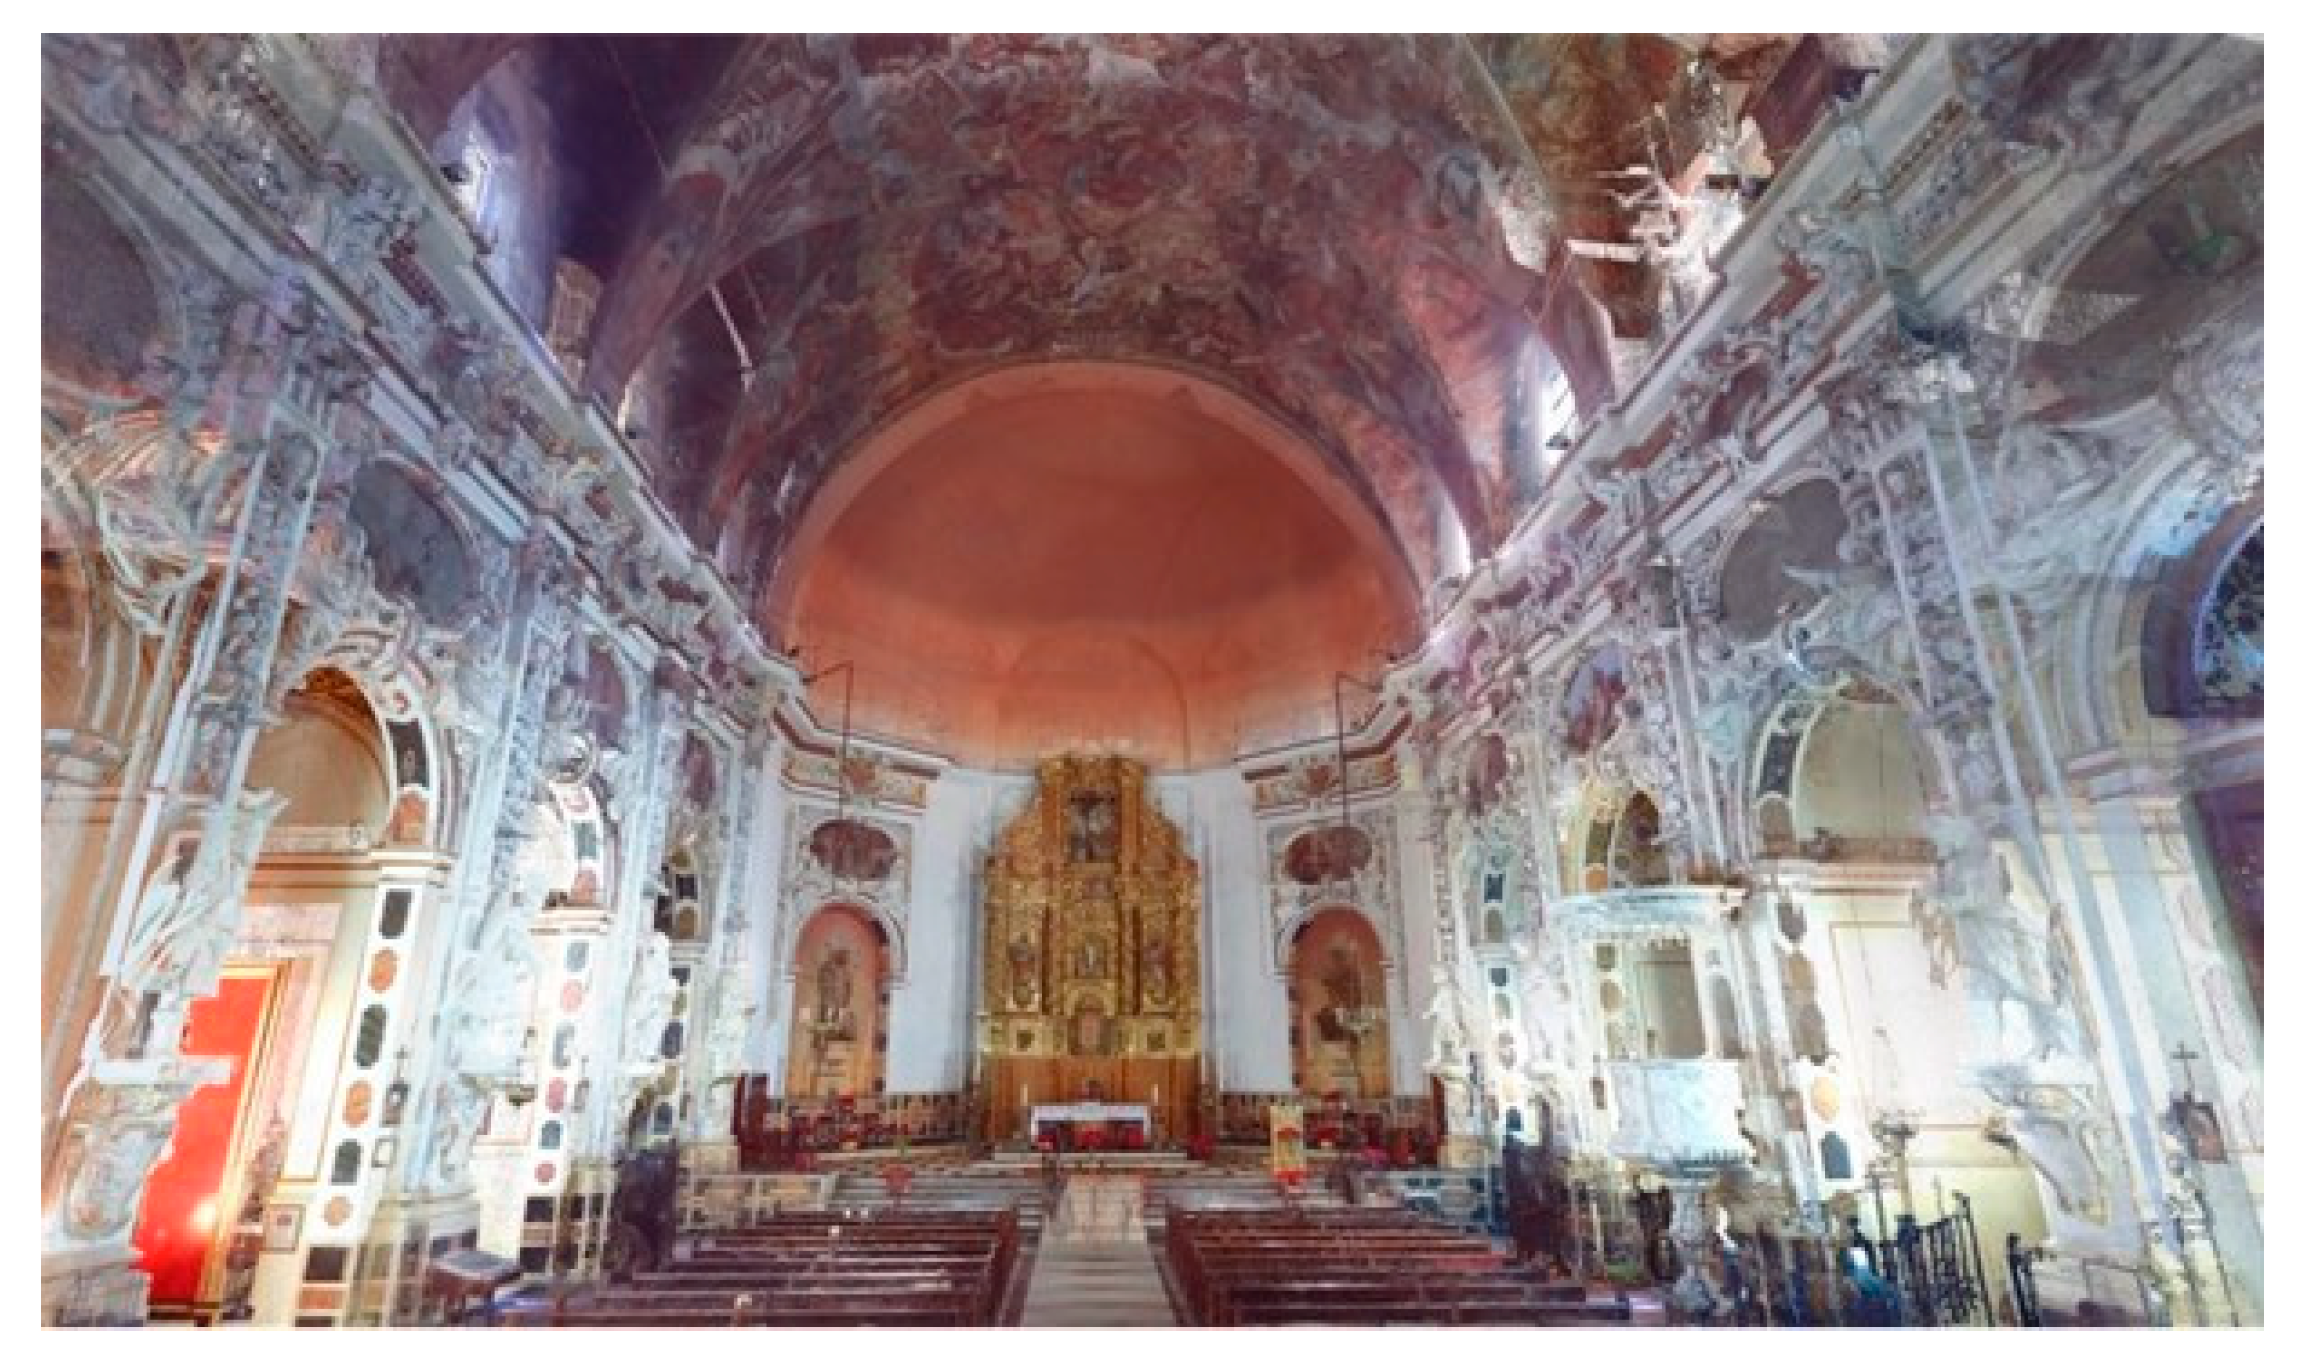
The Church of Santos Juanes in Valencia is one of the most notable examples of Valencian religious architecture. Its strategic location in the Market Square, next to the Lonja de la Seda and the Central Market, has made this building an essential component of the city’s historical, social and urban development. The mediaeval origin of the temple, which was erected on the site of an old mosque in the old Boatella district, and its long biography, marked by fires, alterations and stylistic transformations, make this Church a complex and singular construction, in which Gothic elements coexist with Baroque expressions of great formal power [
1] (p. 5), [
2].
The many phases of its construction and the substantial transformation brought about by the Baroque reform in the 17th century make it difficult to study and interpret its original structural system. In view of the scarcity of reliable documents, especially due to the loss of the parish archive during the Civil War, and the superimposition of architectural layers, it is essential to develop tools that enable a deep and respectful reading of the building. In this context, non-destructive methods take on a leading role, making it possible to explore and analyse the hidden constructive elements without invasive intervention.
From a broader risk perspective, monumental heritage structures are exposed to multiple hazards throughout their life cycle. Besides progressive material degradation due to ageing and environmental factors, threats such as floods, wind storms, fire, ground settlements, or soil instabilities can significantly affect their stability and long-term conservation [
3] (p. 3). The intrinsic vulnerability of these buildings is linked to the lack of modern design criteria, their geometric irregularities, and the historical accumulation of damage and repair, which often results in heterogeneous and weakened structural systems [
4] (p. 12).
Among these hazard sources, seismic actions stand out as particularly critical. Earthquakes have historically demonstrated the fragility of masonry churches, where collapse may occur not only due to global instability but, more frequently, through recurrent local mechanisms: façade overturning, tympanum and gable collapses, shear failure of nave walls, detachment of apses, or partial collapse of bell towers [
5] (p. 395) [
3] (p. 5). Post-earthquake surveys in Italy and Europe have repeatedly confirmed that even moderate seismic events can trigger these mechanisms, producing severe cultural and socio-economic impacts [
6] (p. 1168). Furthermore, site conditions and soil amplification effects can intensify seismic damage, as demonstrated in recent events in Central Italy [
7] (p. 4).
This multiplicity of threats and the observed recurrence of seismic damage underline the importance of preventive assessment and risk mitigation. As noted in recent studies, the vulnerability of churches must be approached not only through mechanical and numerical modelling, but also by integrating historical research, large-scale survey data, and comparative analyses across regions and typologies [
8] (p. 7). This systemic perspective enables the identification of priority interventions and the development of strategies that balance structural safety with the preservation of cultural value.
From a structural safety perspective, historic masonry churches and monumental buildings such as Santos Juanes present a high vulnerability to multiple hazards, particularly seismic actions, due to their large height-to-thickness ratios, irregular geometries, insufficient connections between structural elements, and the natural degradation of materials over centuries [
9] (p. 2). Past earthquakes in Europe and worldwide have repeatedly shown that even moderate seismic events can activate local collapse mechanisms—such as façade overturning, vault failures, or bell tower damage—leading to severe structural and heritage losses [
10] (p. 1128) [
11] (p. 825).
Although the technical literature offers numerous studies on the seismic behaviour of historic masonry, very few studies address soil–structure interaction in heritage buildings, and even fewer apply such analysis to real case studies using detailed geometric and material characterisation. Most previous research has relied on fixed-support assumptions without evaluating the influence of subsoil deformability. The present study addresses this gap by performing a comparative analysis between a fixed-support model and a model incorporating explicit soil–structure interaction, both calibrated with extensive non-destructive testing (3D laser scanning, infrared thermography, and ground-penetrating radar). This integrated approach enables a more accurate interpretation of the structural behaviour under seismic loading and represents a novel contribution to the field.
According to the Italian Guidelines for the Cultural Heritage, this seismic fragility can be assessed at different levels of detail, from rapid territorial-scale approaches (LV0) to simplified macro-element analyses (LV1), which allow the identification of the most vulnerable parts and the estimation of seismic safety indices [
9] (p. 3).
Recent research highlights the effectiveness of integrated approaches that combine historical research, high-precision 3D documentation (e.g., laser scanning), and structural vulnerability assessment for historic churches. Notable examples include the work of Barbieri et al. [
12] on the late Baroque Bibiena church, where a multidisciplinary strategy merged archival studies, detailed metric surveys, material characterisation, and seismic performance modelling. Similarly, Ref. [
11] (p.827) applied such an approach to historic churches in the Banat region (Romania), demonstrating how the combination of metric survey data, mechanical property evaluation, and vulnerability modelling—also considering cultural and socio-economic factors—can effectively identify recurrent damage patterns and prioritise conservation measures. Integrating such methodologies into the study of Santos Juanes enables the evaluation of its expected performance under realistic earthquake scenarios. It supports the prioritisation of preventive conservation measures in line with international risk mitigation strategies.
This work describes a comprehensive study of the Church of Santos Juanes based on a combination of historical analysis and the application of advanced technologies for architectural diagnosis. Non-destructive methods such as 3D laser scanning, infra-red thermography and georadar are used in order to deepen the existing knowledge of its constructive evolution, to unravel the hidden characteristics of its structural elements and materials, and to generate a rigorous graphic base that enables its behaviour to be modelled under both static and dynamic loads. In particular, the resulting numerical models—calibrated through the building’s geometric and material characterisation—are applied to simulate both gravitational and seismic load conditions, enabling the identification of collapse mechanisms and vulnerability indices consistent with LV1-level assessments [
10] (p. 1134) [
9] (p. 4).
This technical approach not only enriches the current understanding of the building from a scientific perspective but also reinforces its value as a unique historical heritage site, especially in a context marked by institutional neglect and repeated complaints about its state of conservation [
13] (p. 18), [
14] (p. 14), [
15] (p. 24).
In short, this is a methodological intervention that seeks to understand the building in all its complexity, to make its historical and structural values visible, and to establish a study model that can be applied to other historical constructions with similar characteristics. This methodology is specific to stone masonry; other structural typologies, such as timber-frame buildings, would require adjustments.
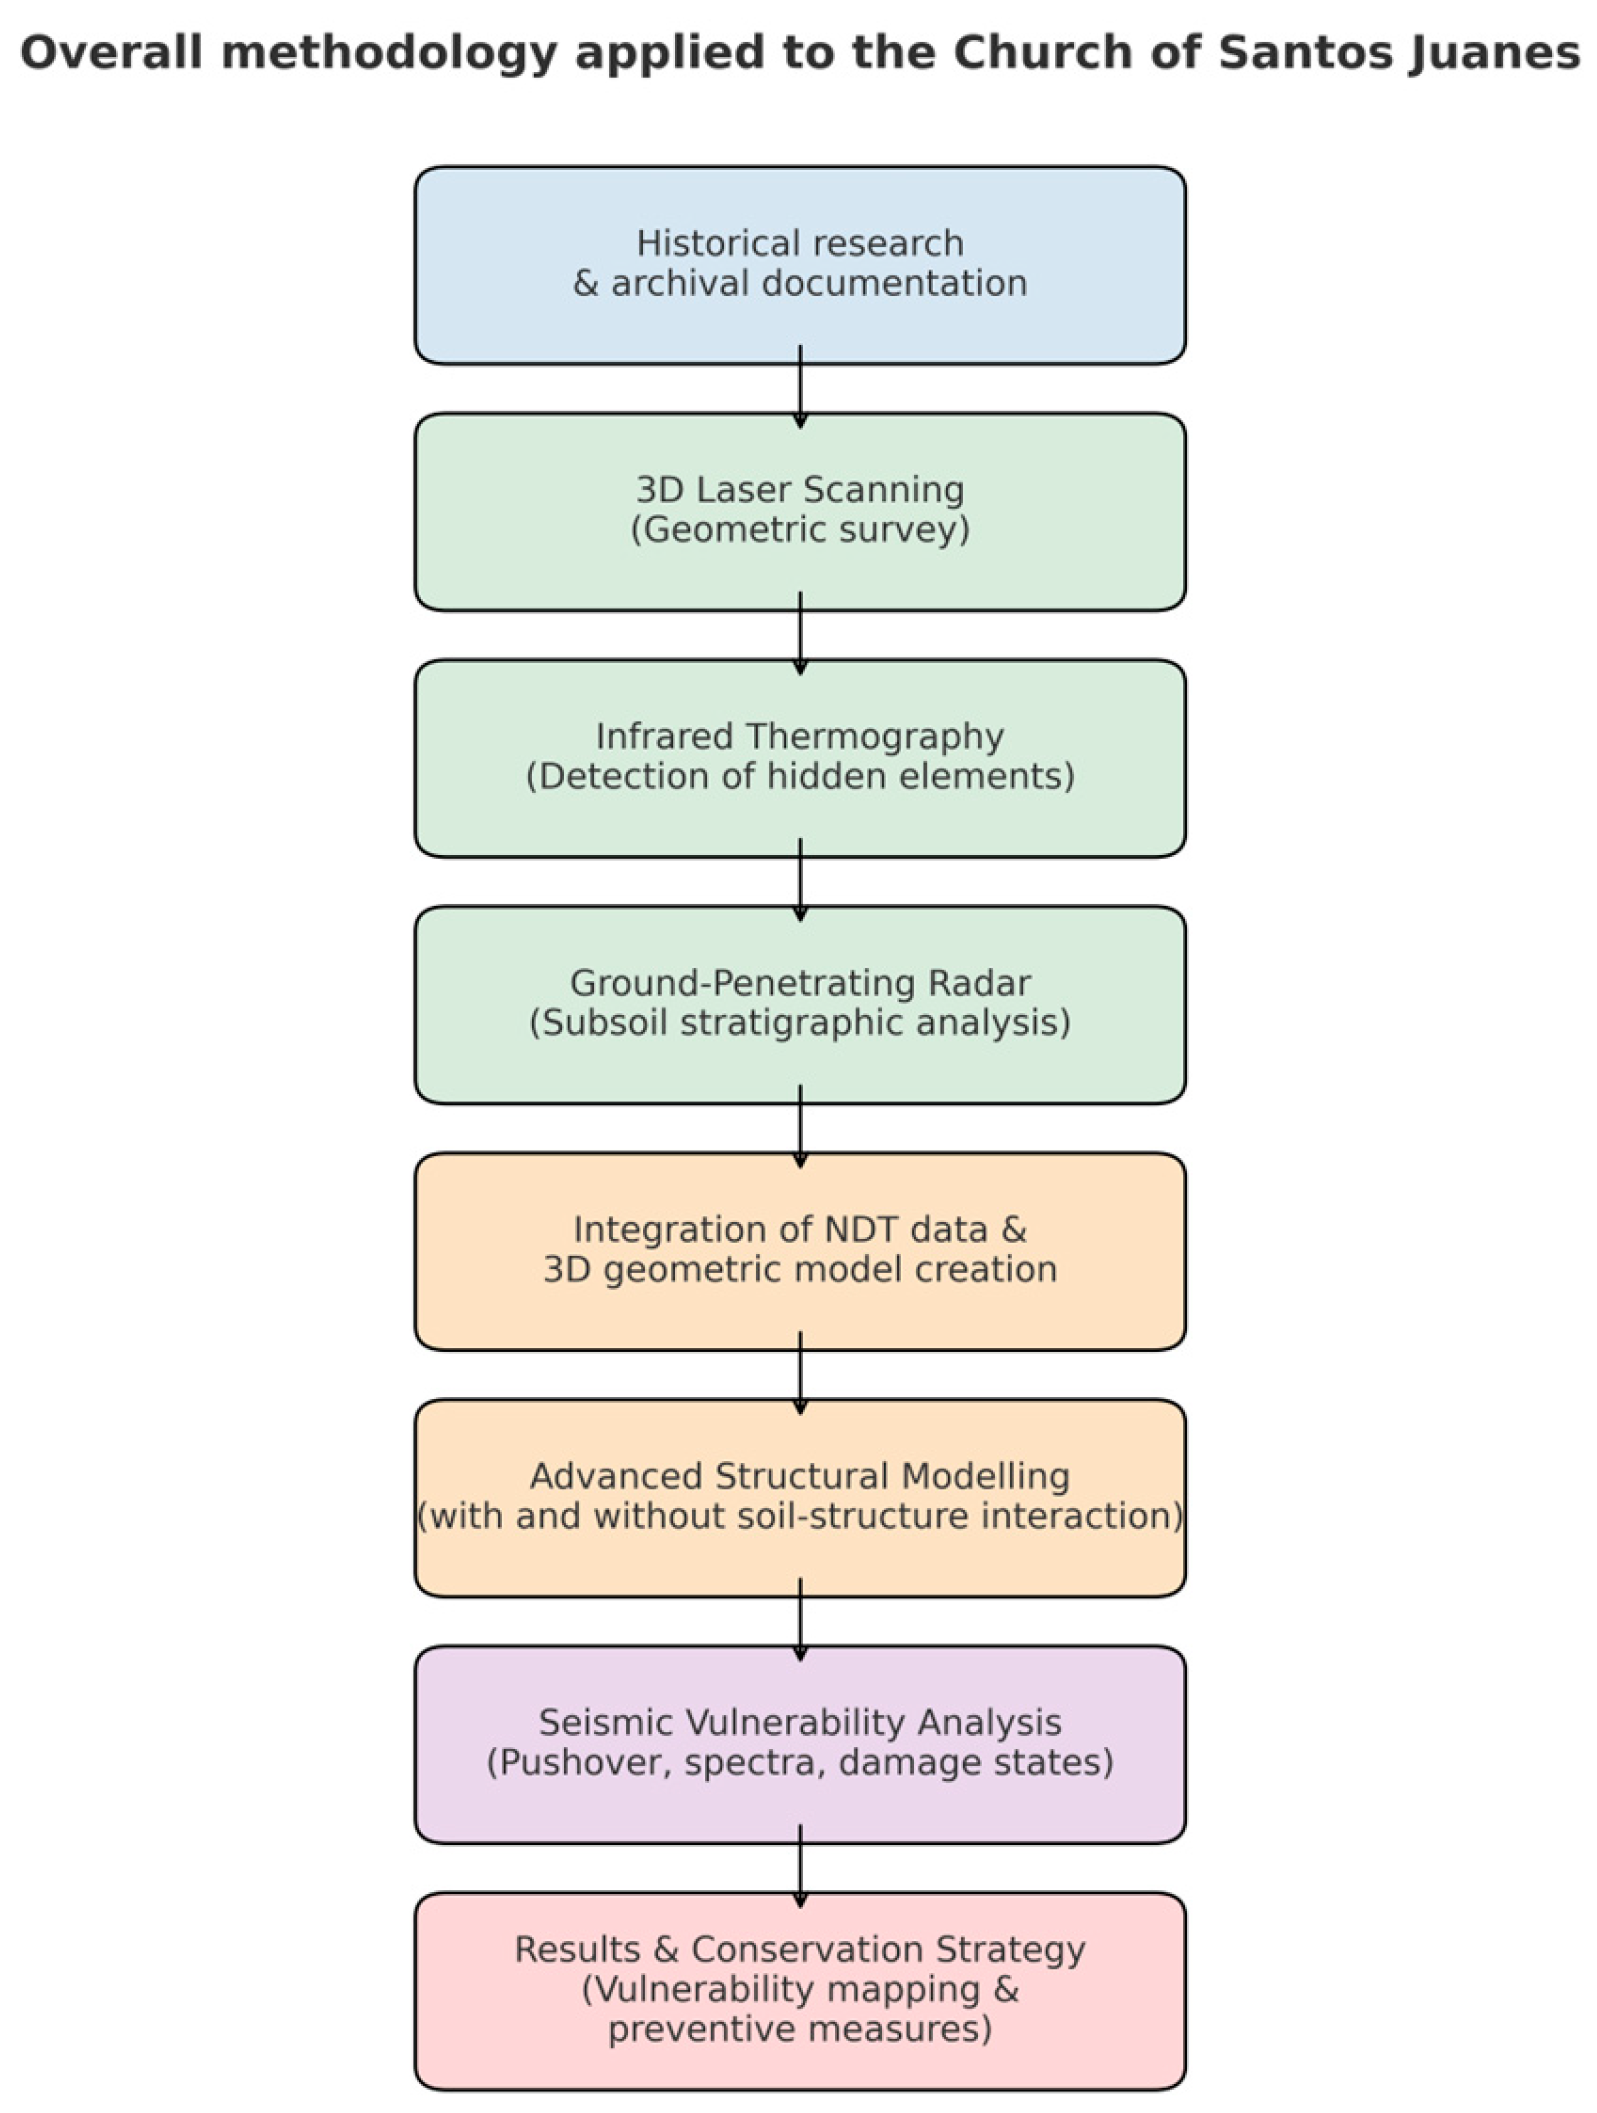
The overall research methodology is summarised in
Figure 1, which illustrates the sequential stages from historical research and non-destructive testing to advanced structural analysis and vulnerability assessment applied to the Church of Santos Juanes.
2. Three-Dimensional Laser Scanning as a Non-Destructive Analysis Tool
In the field of geometric analysis applied to heritage buildings, the use of high-definition geometric documentation techniques has made it possible to combine photogrammetric methodologies with 3D laser scanning to create a non-intrusive, precise and high-speed measurement system. This technology enables massive data capture of the built environment and generates two- and three-dimensional representations with a high level of detail and metric fidelity.
From a theoretical standpoint, terrestrial laser scanning (TLS) is based on the emission of coherent laser pulses towards target surfaces and the measurement of the time taken for the signal to return to the sensor, a principle known as “time-of-flight” [
16] (p. 10). By calculating the distance using the speed of light and combining it with the angular position of the rotating mirrors, the device records the Cartesian coordinates (X, Y, Z) of millions of points per second. Alternative technologies, such as phase-shift measurement, determine distances by analysing the phase difference between emitted and received continuous laser waves, offering higher precision for short ranges [
17] (p. 37). In heritage documentation, TLS is preferred for its ability to rapidly acquire dense point clouds with millimetric accuracy, even in complex geometries and under varying lighting conditions [
18] (p. 523).
To handle the formal and volumetric complexity of the Church of the Santos Juanes, we chose to use a terrestrial laser scanner, specifically the FARO Focus 3D model (Scanning and processing was carried out by Carlos Aleixandre Lluesma, technical architect, and Luís Muñoz Sempere, industrial technical engineer at the company byd3d SL). This device employs the phase-shift principle, enabling high acquisition speeds and accuracies in the order of ±2 mm at distances up to 120 m [
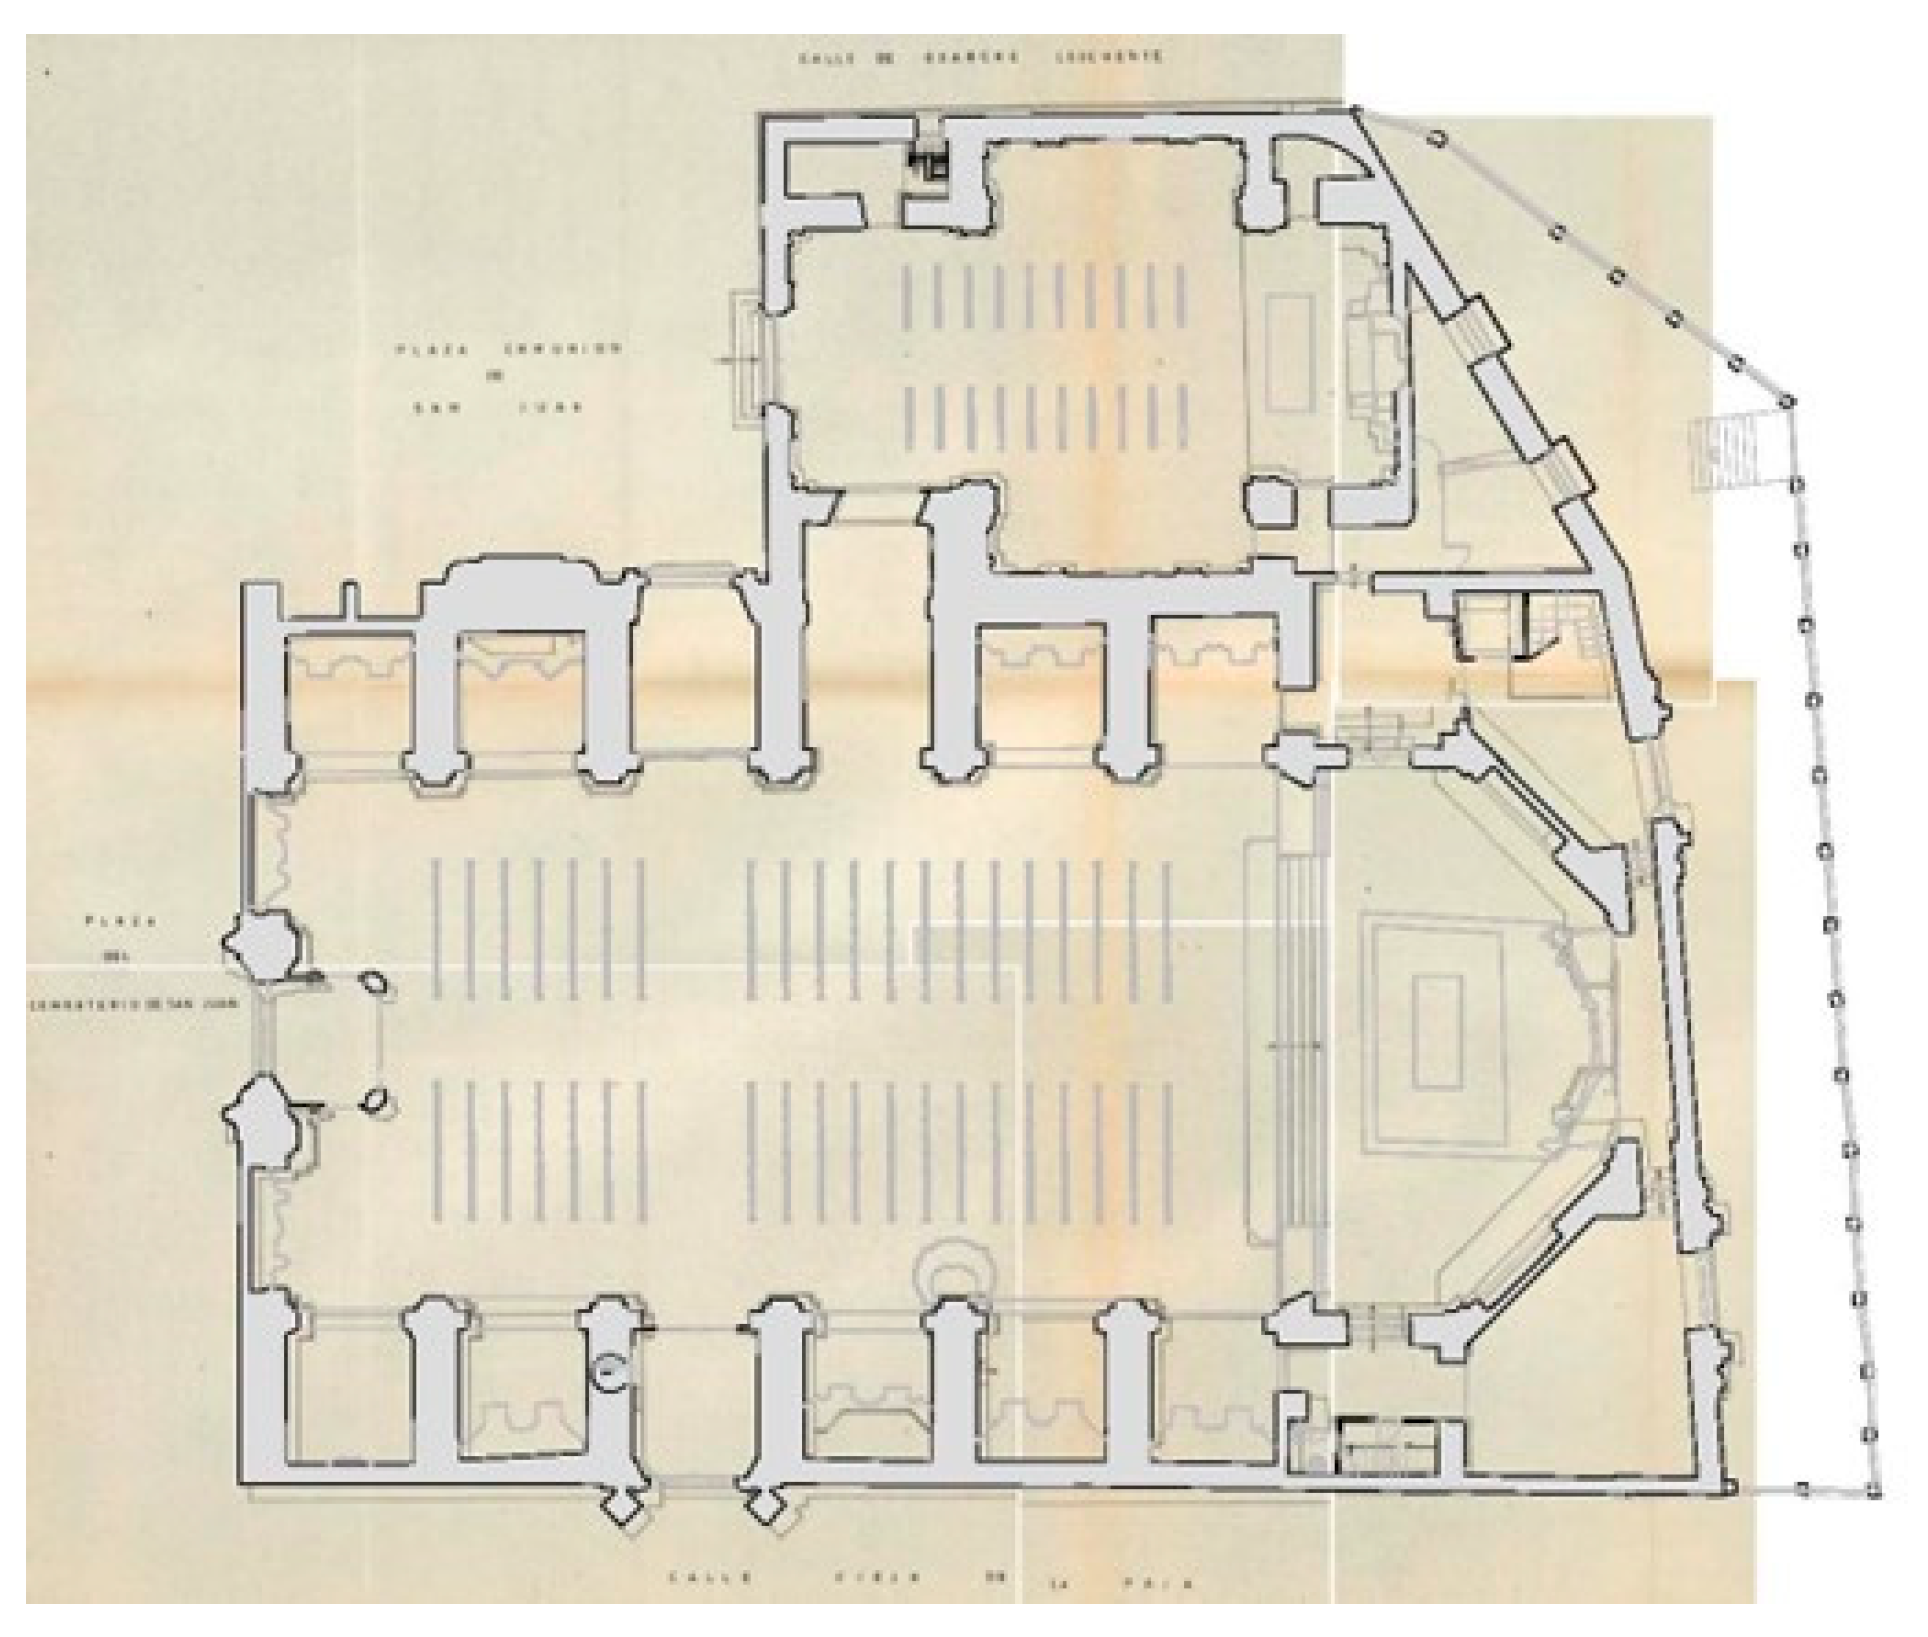
19] (p. 5). This device uses a fan-shaped laser beam to scan the surfaces, recording millions of points per second and generating a three-dimensional point cloud in Cartesian coordinates (XYZ). The floor plan is composed of seven buttresses with an inter-buttress spacing of 5.20 m, plus the head corresponding to the Market Square façade, which was added later. In plan, the building forms a geometric figure with approximate dimensions of 46 m and 43 m on its longer parallel sides, and an approximate width of 28 m. The temple reaches about 21 m (excluding the bell tower), and about 46.5 m when the bell tower is included.
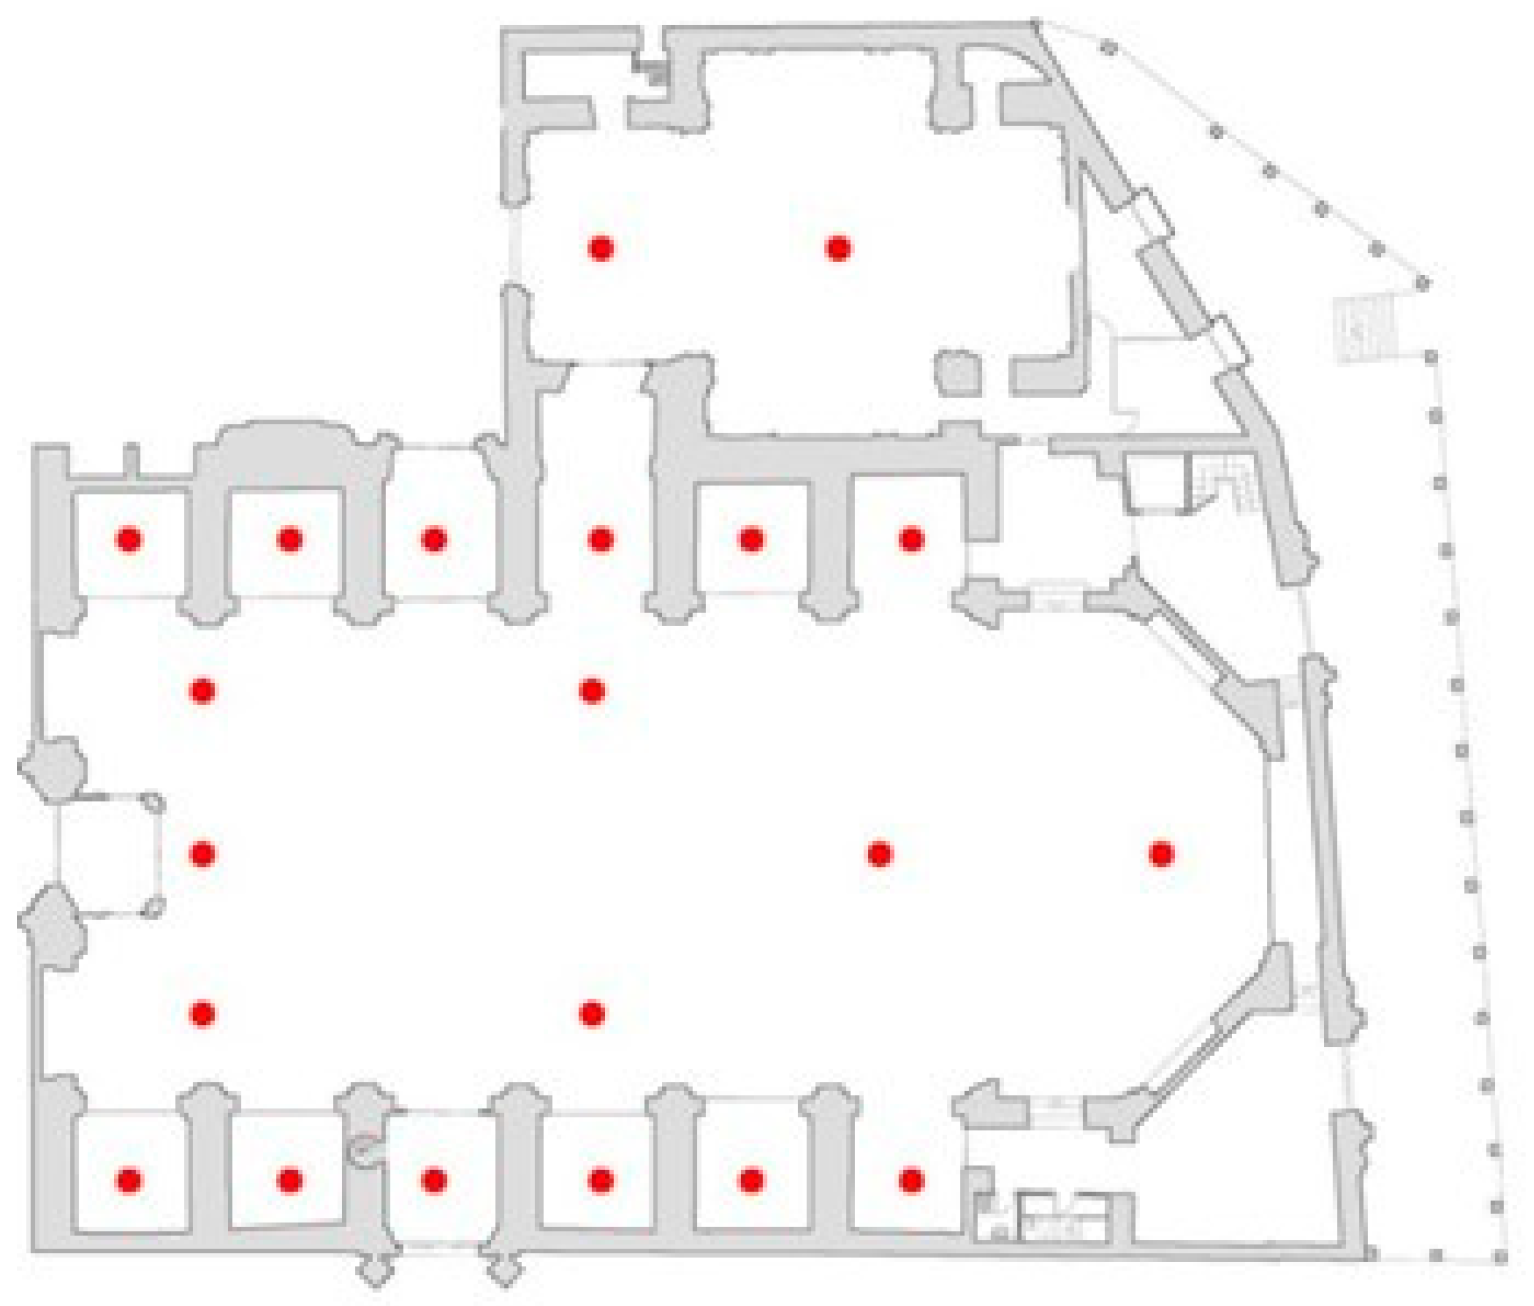
As can be seen in
Figure 2, 41 scanning stations (Note: A station is defined as one of the various positions in which the scanner is placed to scan the entire building.) were used, as this number was considered necessary for the correct definition of a digital model of the Church. Of these, 20 were located on the outside, surrounding the perimeter and on the terraces between buttresses, and 21 were on the inside, covering the main nave and secondary spaces. This arrangement allowed for complete coverage of the building, both internally and externally, ensuring sufficient overlap (at least 30%) between adjacent scans to guarantee accurate registration and avoid data gaps in areas with complex geometry or limited accessibility. The number and placement of stations were determined by the building’s volumetric complexity, line-of-sight limitations, and the need to capture hidden or shaded elements. The point-cloud density was set to achieve millimetric precision in the final model, balancing resolution and file manageability; this corresponded to an average spacing of X mm between points at a 10 m range, which was considered adequate for subsequent modelling and analysis.
Each scan was linked to the previous one by reference spheres, enabling their subsequent alignment and assembly into a single three-dimensional model. The registration process was carried out through iterative closest point (ICP) algorithms, which minimise the distance between overlapping point clouds to achieve sub-centimetric alignment accuracy [
20] (p. 239). After capture, the data were recorded using Scene LT (v5.4) software, which was used to identify the spheres, calculate the best fit and place the scans within the defined system, generating an exchange file in ASCII format.
The process of transforming the scanned data involved the combined use of two programs, Scene LT (v5.4) and Escuadra (v1, Alonso Durá) [
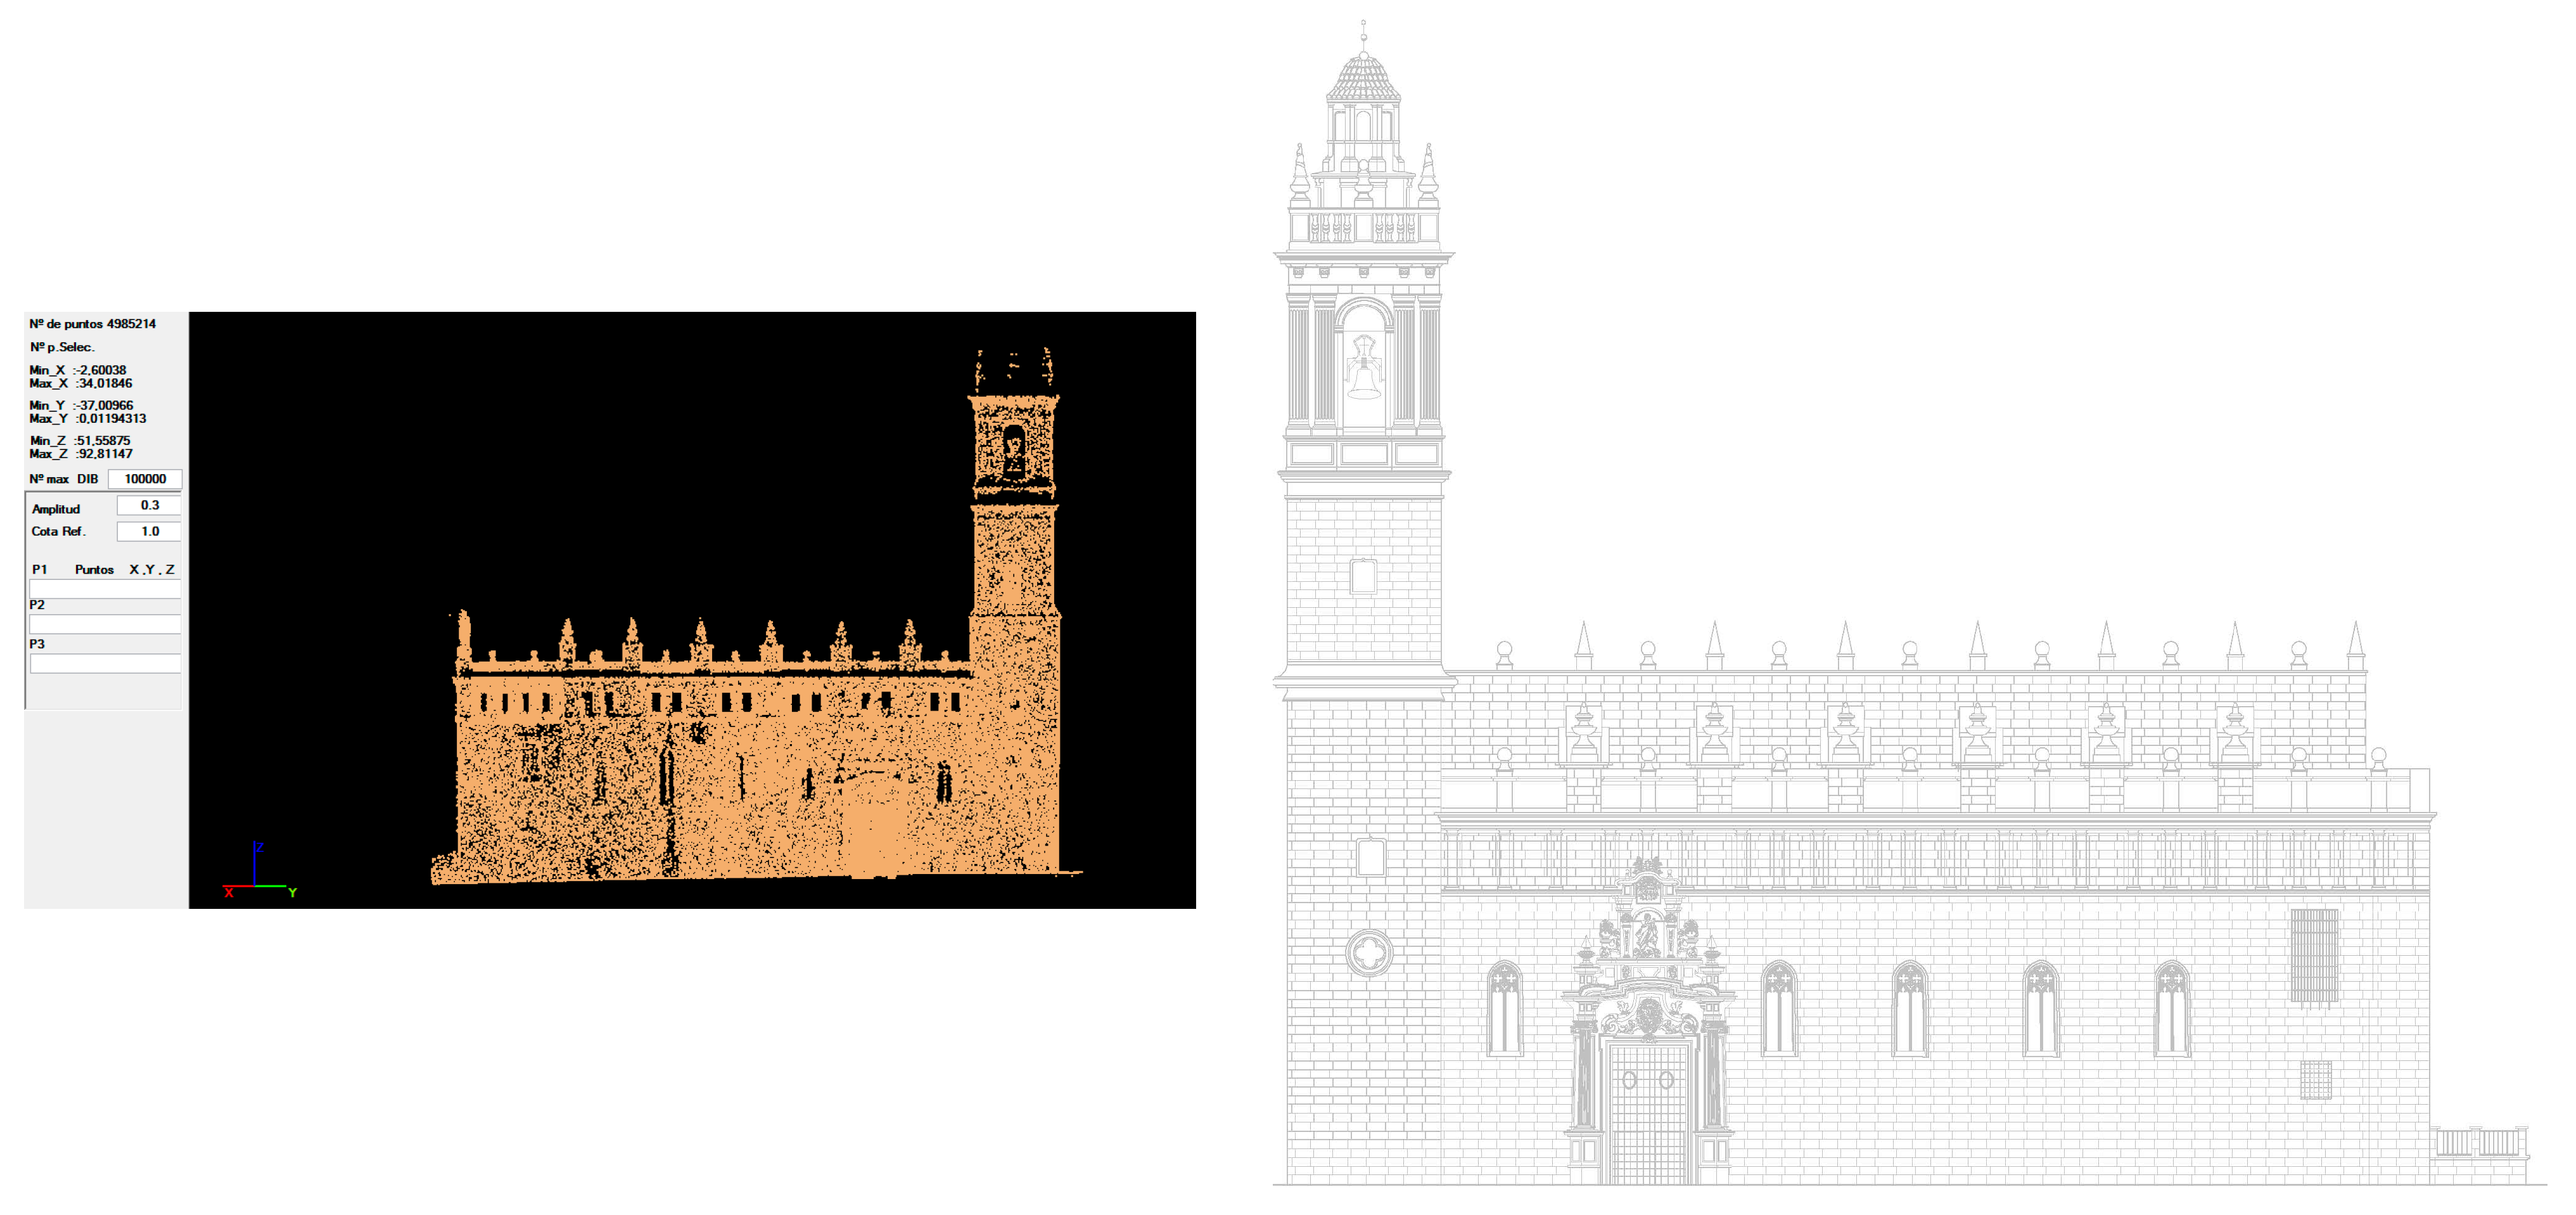
21]. The former allowed for direct visualisation of the point cloud and exporting the files in .pts format; these were subsequently processed by Escuadra for conversion into .dxf files that would be compatible with CAD 2015 environments. Due to the high volume of data, each .pts file was first cleaned using CloudCompare (v2.7.0, 2016) to reduce its density without significant loss of accuracy. Depending on the level of detail required, three paths were considered in order to obtain files in .dxf format (
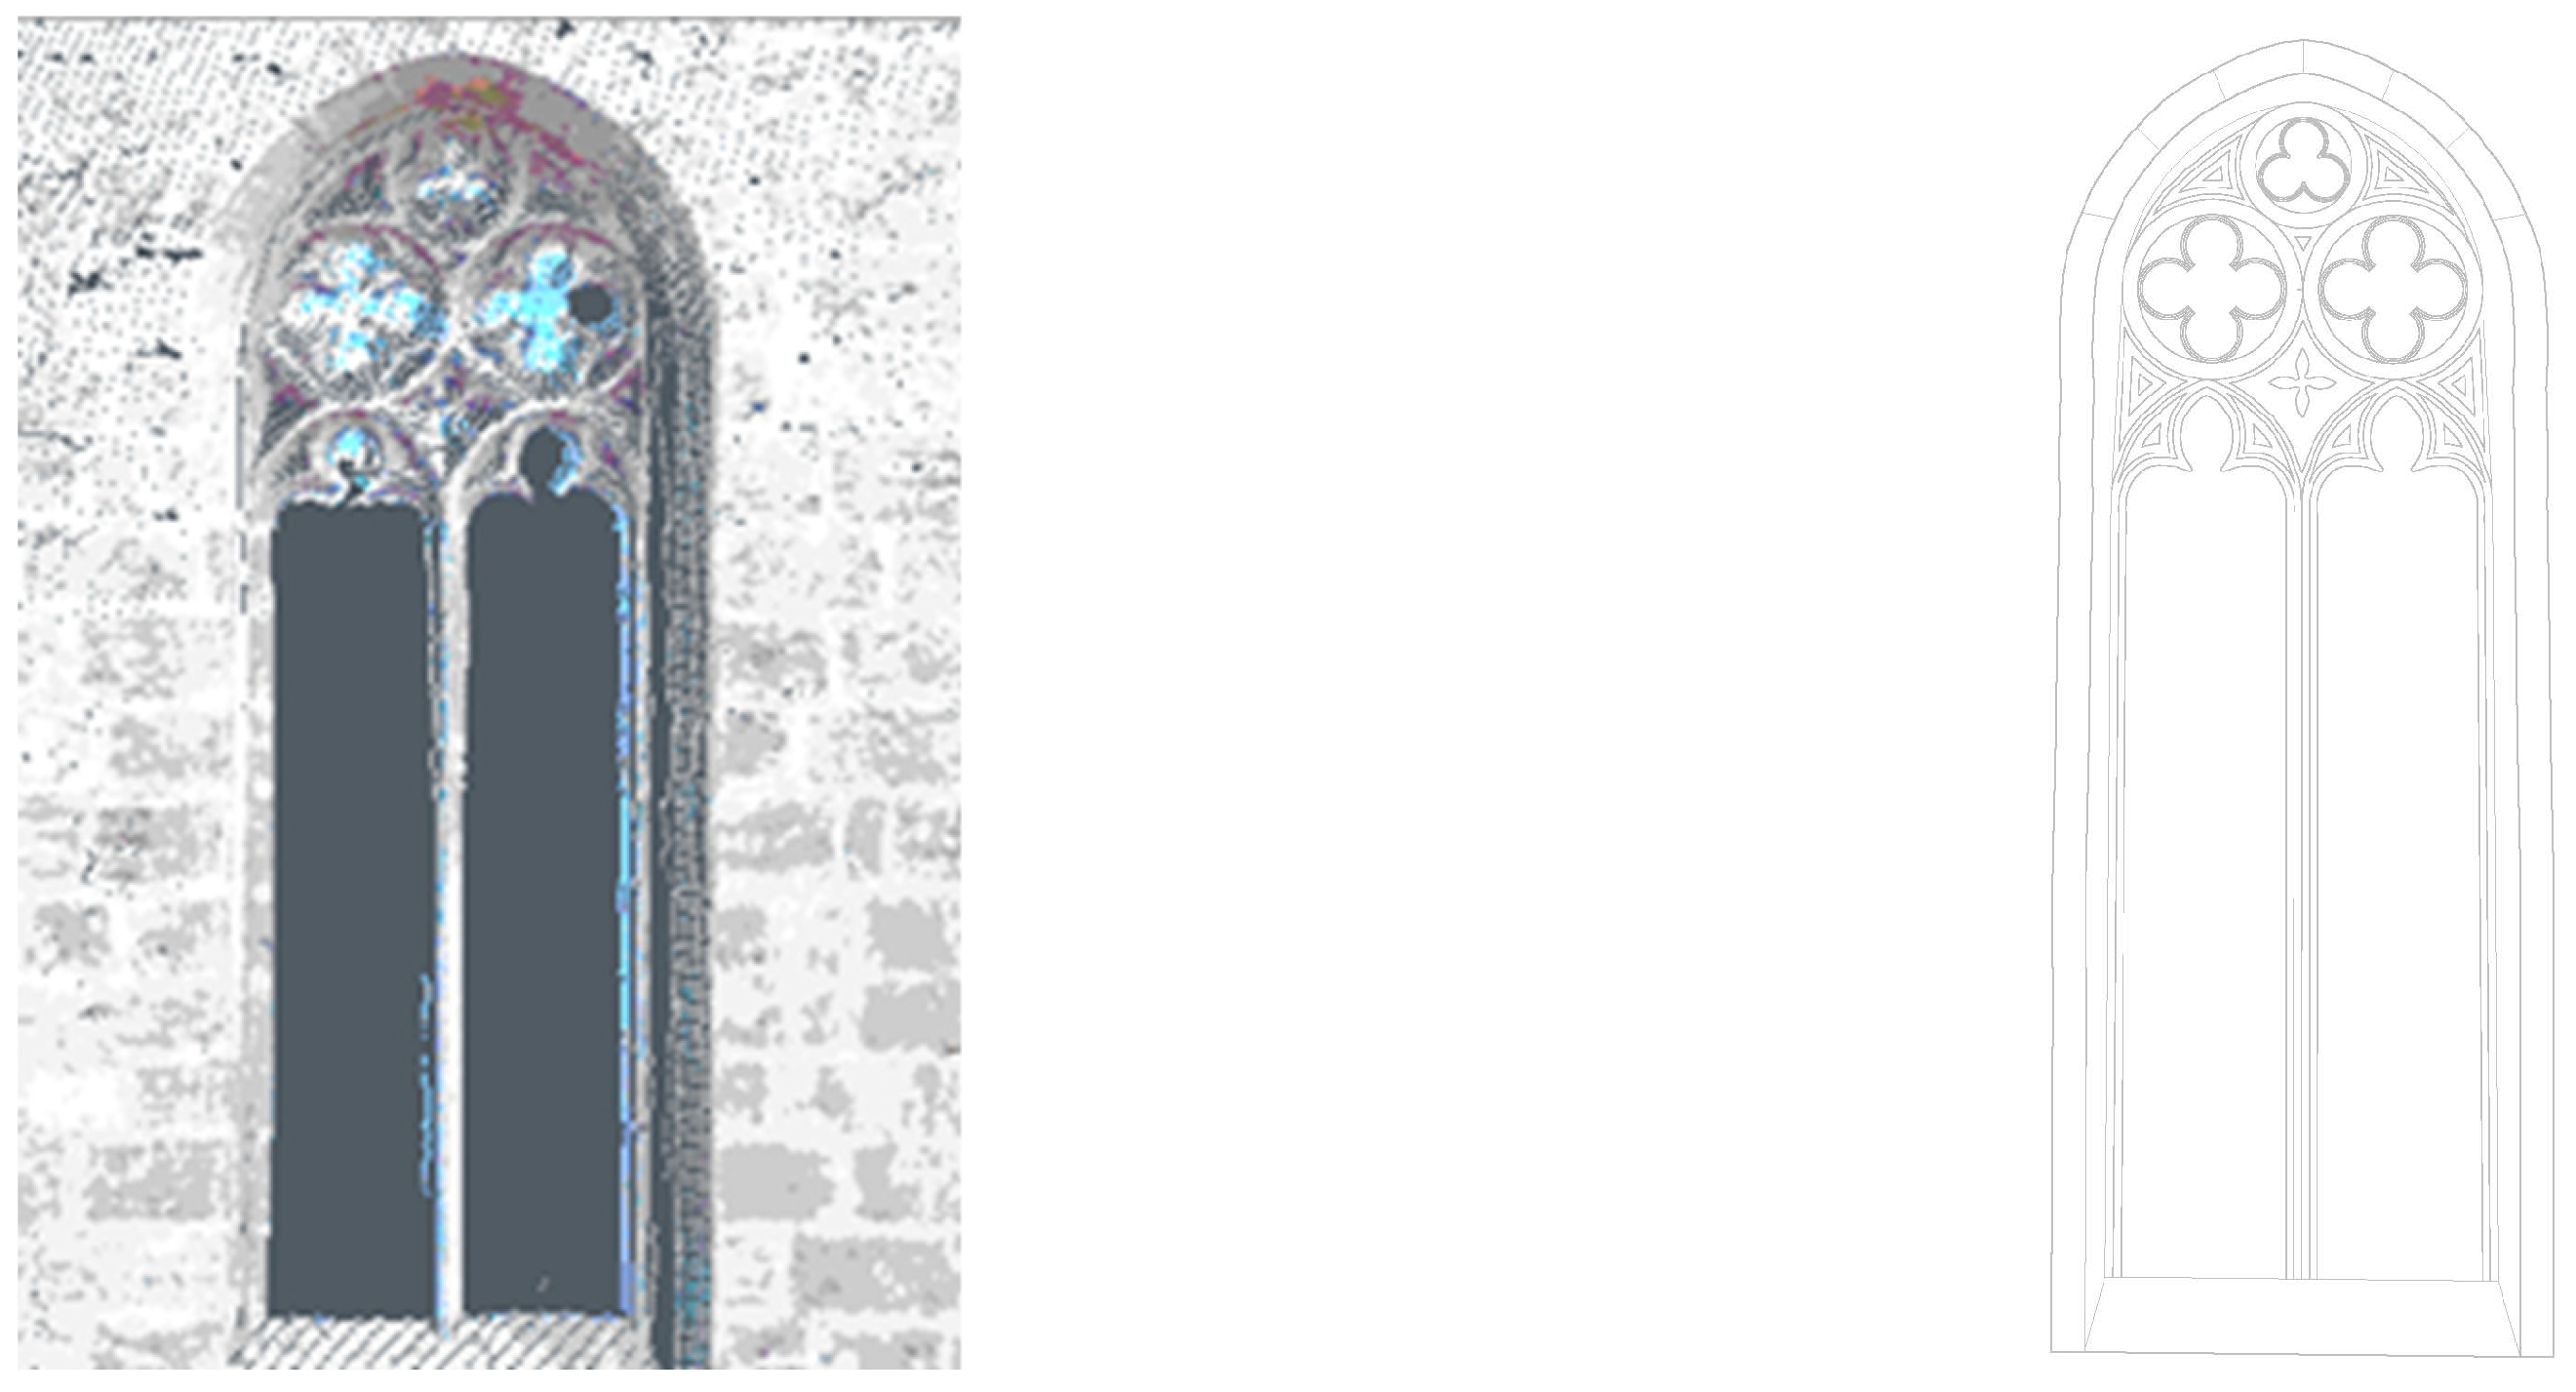
Figure 3). The first consisted of reducing the point density of the .pts file and processing it with Escuadra, while the second involved selecting specific portions of the cloud and exporting them in .E57 format, and then processing these using Autodesk ReCap 2016 (v2.0.0.255) for further conversion. The second option was especially useful for precise drawing of singular elements such as the tracery of the windows overlooking the Peso de la Paja (
Figure 4). The third option involved a direct export from Scene LT to .dxf, although in most cases the resulting files could not be opened with standard versions of CAD 2015 software.
The main difference between the two programs lies in the way they operate: Scene LT (v5.4) offers a visualisation that is rich in detail but with less geometrical control, whereas Escuadra (v1, Alonso Durá) [
21] allows the user to accurately define the cutting planes and can handle precise coordinates, but does not retain chromatic information. The result of this process was a detailed plan of the building, as shown in
Figure 5, which, together with the elevations, enabled a rigorous geometric model of the construction of the Church to be created, as seen in
Figure 6 and
Figure 7. This model formed an essential basis for subsequent analysis and allowed for a thorough understanding of the phases of construction that shaped it.
3. Thermographic Analysis for the Characterisation of Hidden Elements
Infrared thermography has been established as an effective and non-invasive technique for studying consolidated historical constructions. Its usefulness lies in its ability to detect temperature differences in surfaces, which allows for the visualisation of possible lesions or alterations without the need for testing or drilling [
22] (pp. 171–183), [
23] (p. 1261). In this particular case, in addition to focusing on the identification of pathologies, this technique was used to clarify the hidden configurations of architectural elements resulting from the multiple transformations of the building over time.
From a theoretical perspective, infrared thermography is based on the physical principle that all bodies with a temperature above absolute zero emit electromagnetic radiation in the infrared spectrum, with an intensity and wavelength distribution governed by Planck’s law [
24] (p. 15). The amount of emitted radiation depends on the temperature and emissivity of the surface material—emissivity being a dimensionless coefficient (ranging between 0 and 1) that characterises a material’s ability to emit infrared energy compared to an ideal black body [
25] (p. 21). In building diagnostics, thermographic cameras typically operate in the 8–14 µm range, where the atmospheric transmittance is highest, allowing accurate surface temperature readings even at a distance.
There are two primary modalities: active thermography, where an external energy source (e.g., halogen lamps, heat pulses) induces a thermal gradient to highlight subsurface anomalies, and passive thermography, which relies on natural temperature differentials due to environmental conditions [
24] (p. 23). The present study adopted a passive approach, taking advantage of daily heating and cooling cycles to detect hidden features and material heterogeneities.
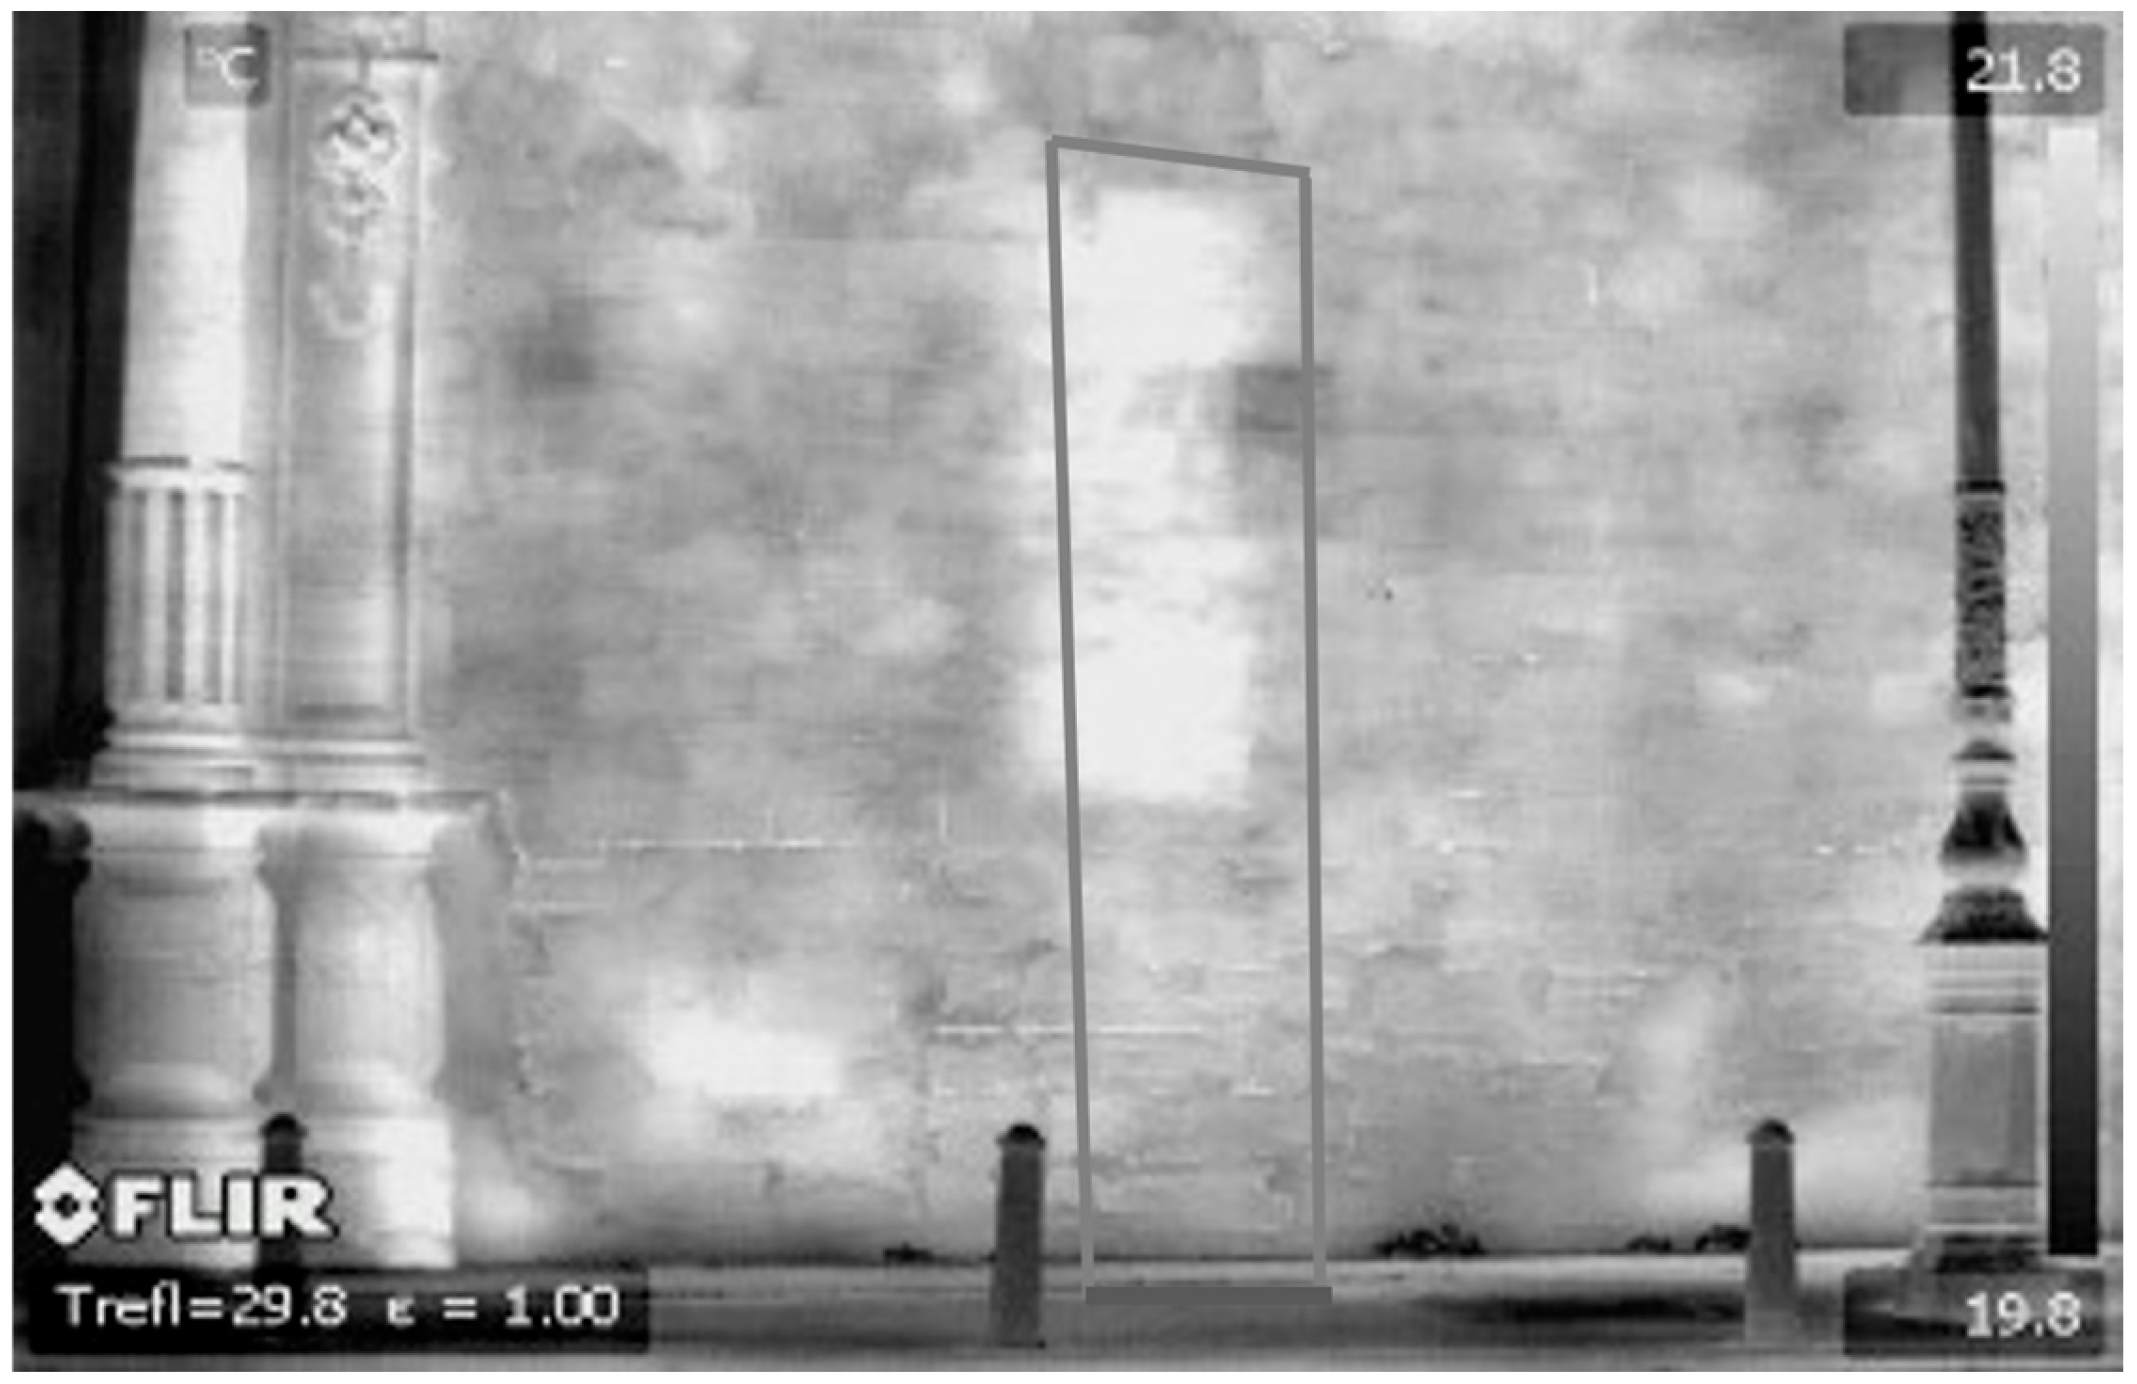
For this purpose, a complete thermographic scan of the temple, including its interior walls and exterior façades, was carried out. This strategy enabled it to detect the presence, location and dimensions of construction components that remained hidden or whose existence could only be intuited. The effectiveness of this procedure depends to a great extent on a marked thermal difference between the interior and the exterior of the building; capture of the images was therefore carefully planned to coincide with the early hours of the day, when solar radiation begins to heat the façades while the interior retains the nighttime cold, or in the late afternoon, when the opposite effect occurs.
The main result was a graphic record of the heat emitted by the surface, which was obtained using a non-contact procedure based on the measurement of infrared radiation. Thermal detectors in the camera convert incident infrared radiation into electrical signals, which are then processed to produce a false-colour image where each colour corresponds to a specific temperature range [
26] (p. 12307). This radiation is transformed into temperature values, which enables mapping of the thermal distribution of the surface materials [
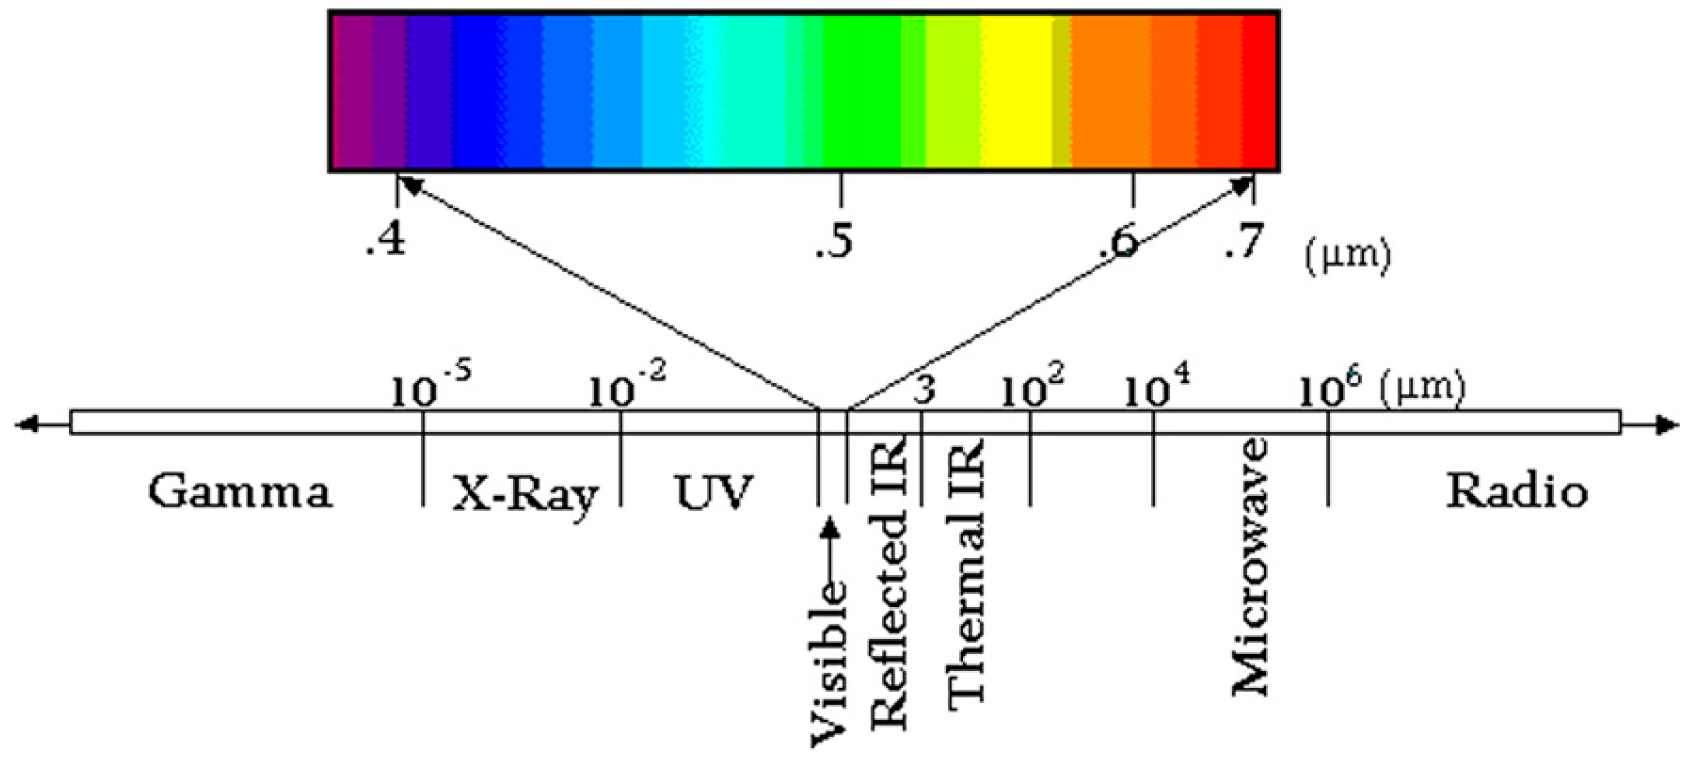
27] (p. 5). Although the spectrum visible to the human eye is only between 0.4 and 0.7 µm, the thermographic camera captures wavelengths between 0.7 and 100 µm, translating into a perceptible colour-coded image that can represent a wide range of temperatures, as shown in
Figure 8 [
27].
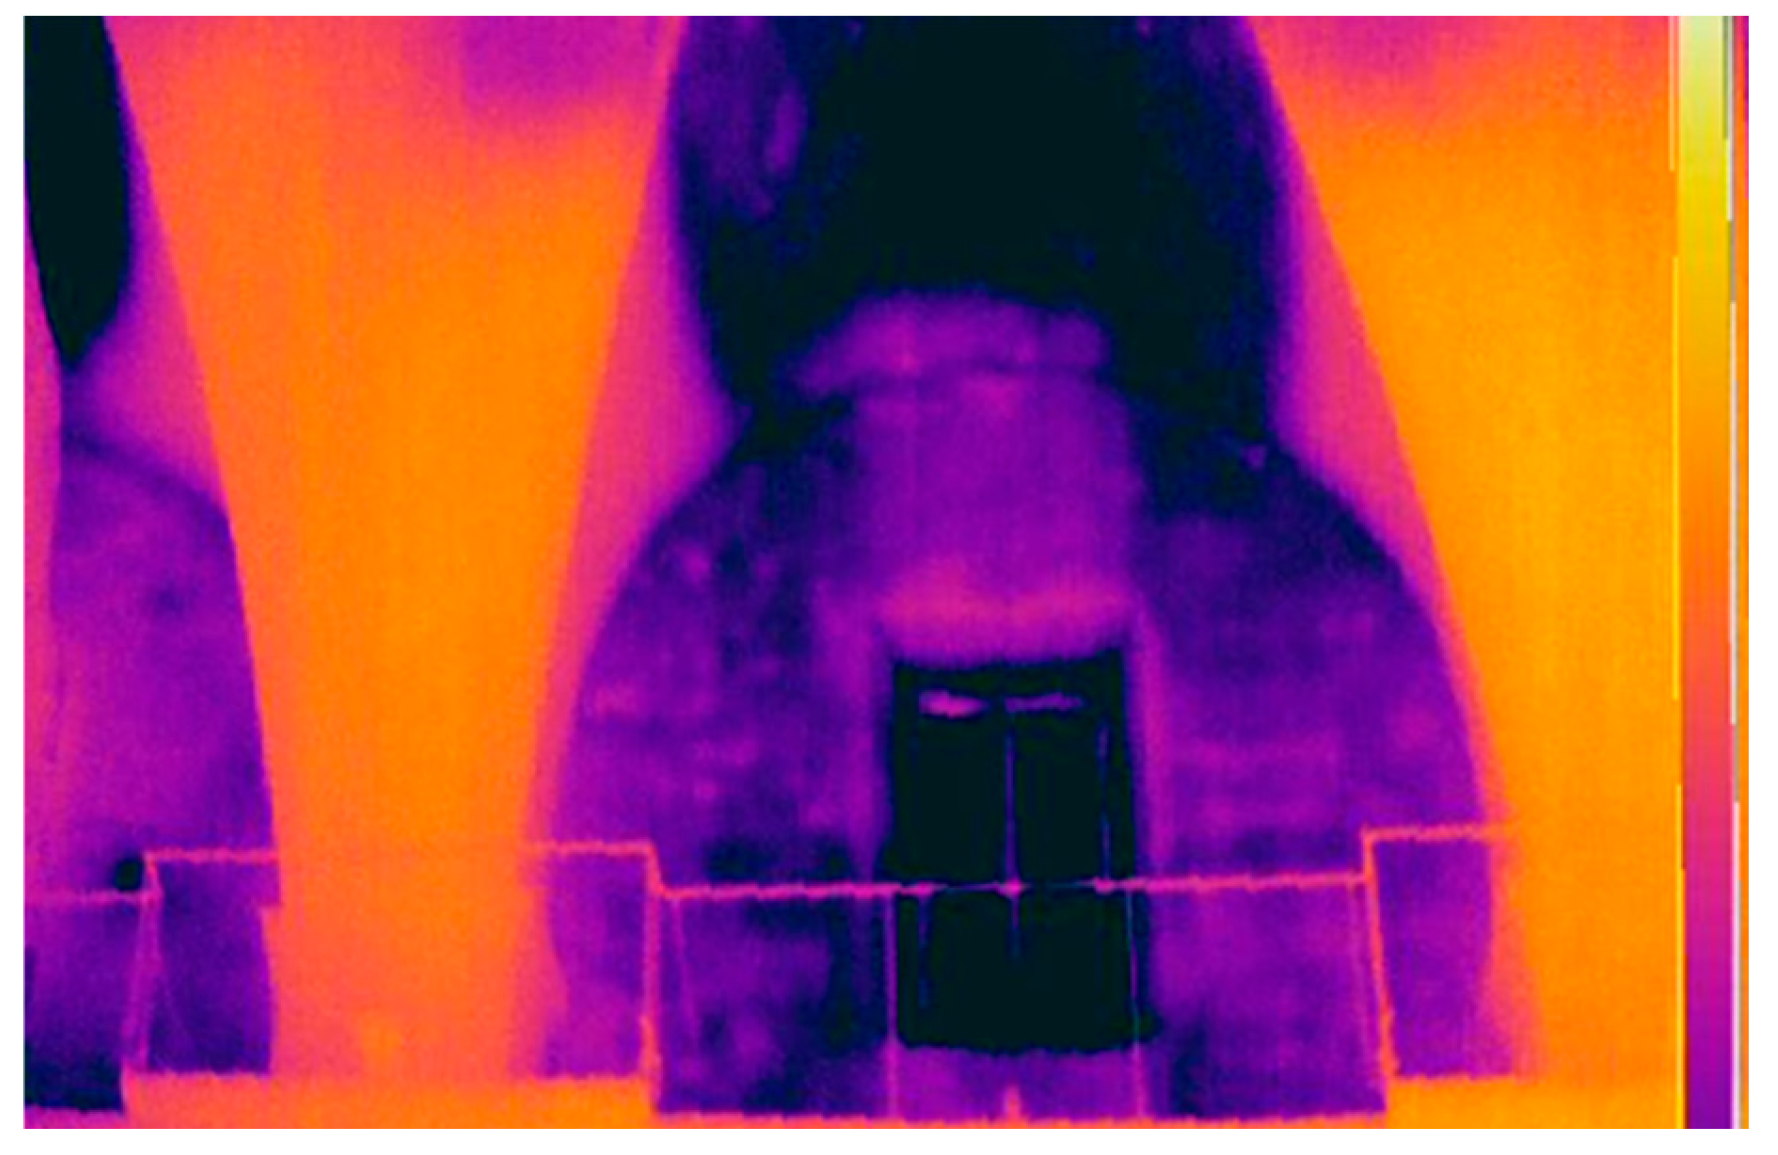
This technique reveals notable thermal differences between the original construction elements and later decorative additions, indicating vulnerable areas where heat is lost. This was the case for the façade facing Market Square, where a thermal gradient that included material discontinuities could be seen. At the meeting between the buttress of the apse and the central nave, a vertical joint was also clearly visible due to its thermal contrast. Even more revealing was the thermographic image of the façade facing the old cemetery of San Juan, which showed a possible bricked-up door, which had disappeared, suggesting secondary access from the exterior to the primitive church (
Figure 9).
Thermographic images must be digitally processed before they can be accurately interpreted: a first approximation offers a general chromatic mapping, but does not provide exact measurements or quantifiable values. Hence, quantitative thermography was carried out, a process that allows images to be calibrated through corrections that result in greater reliability of the analysis. This calibration requires input parameters such as emissivity, reflected apparent temperature, distance to the target, atmospheric temperature, and relative humidity, all of which affect the apparent temperature reading and must be adjusted to obtain true surface temperatures [
25] (p. 5). This correction is essential, since surface temperature is directly related to the density, composition and pathology of the materials, which enables the detection of wet areas, determination of the differences between coatings and structural elements, or distinguishing of materials according to their thermal mass.
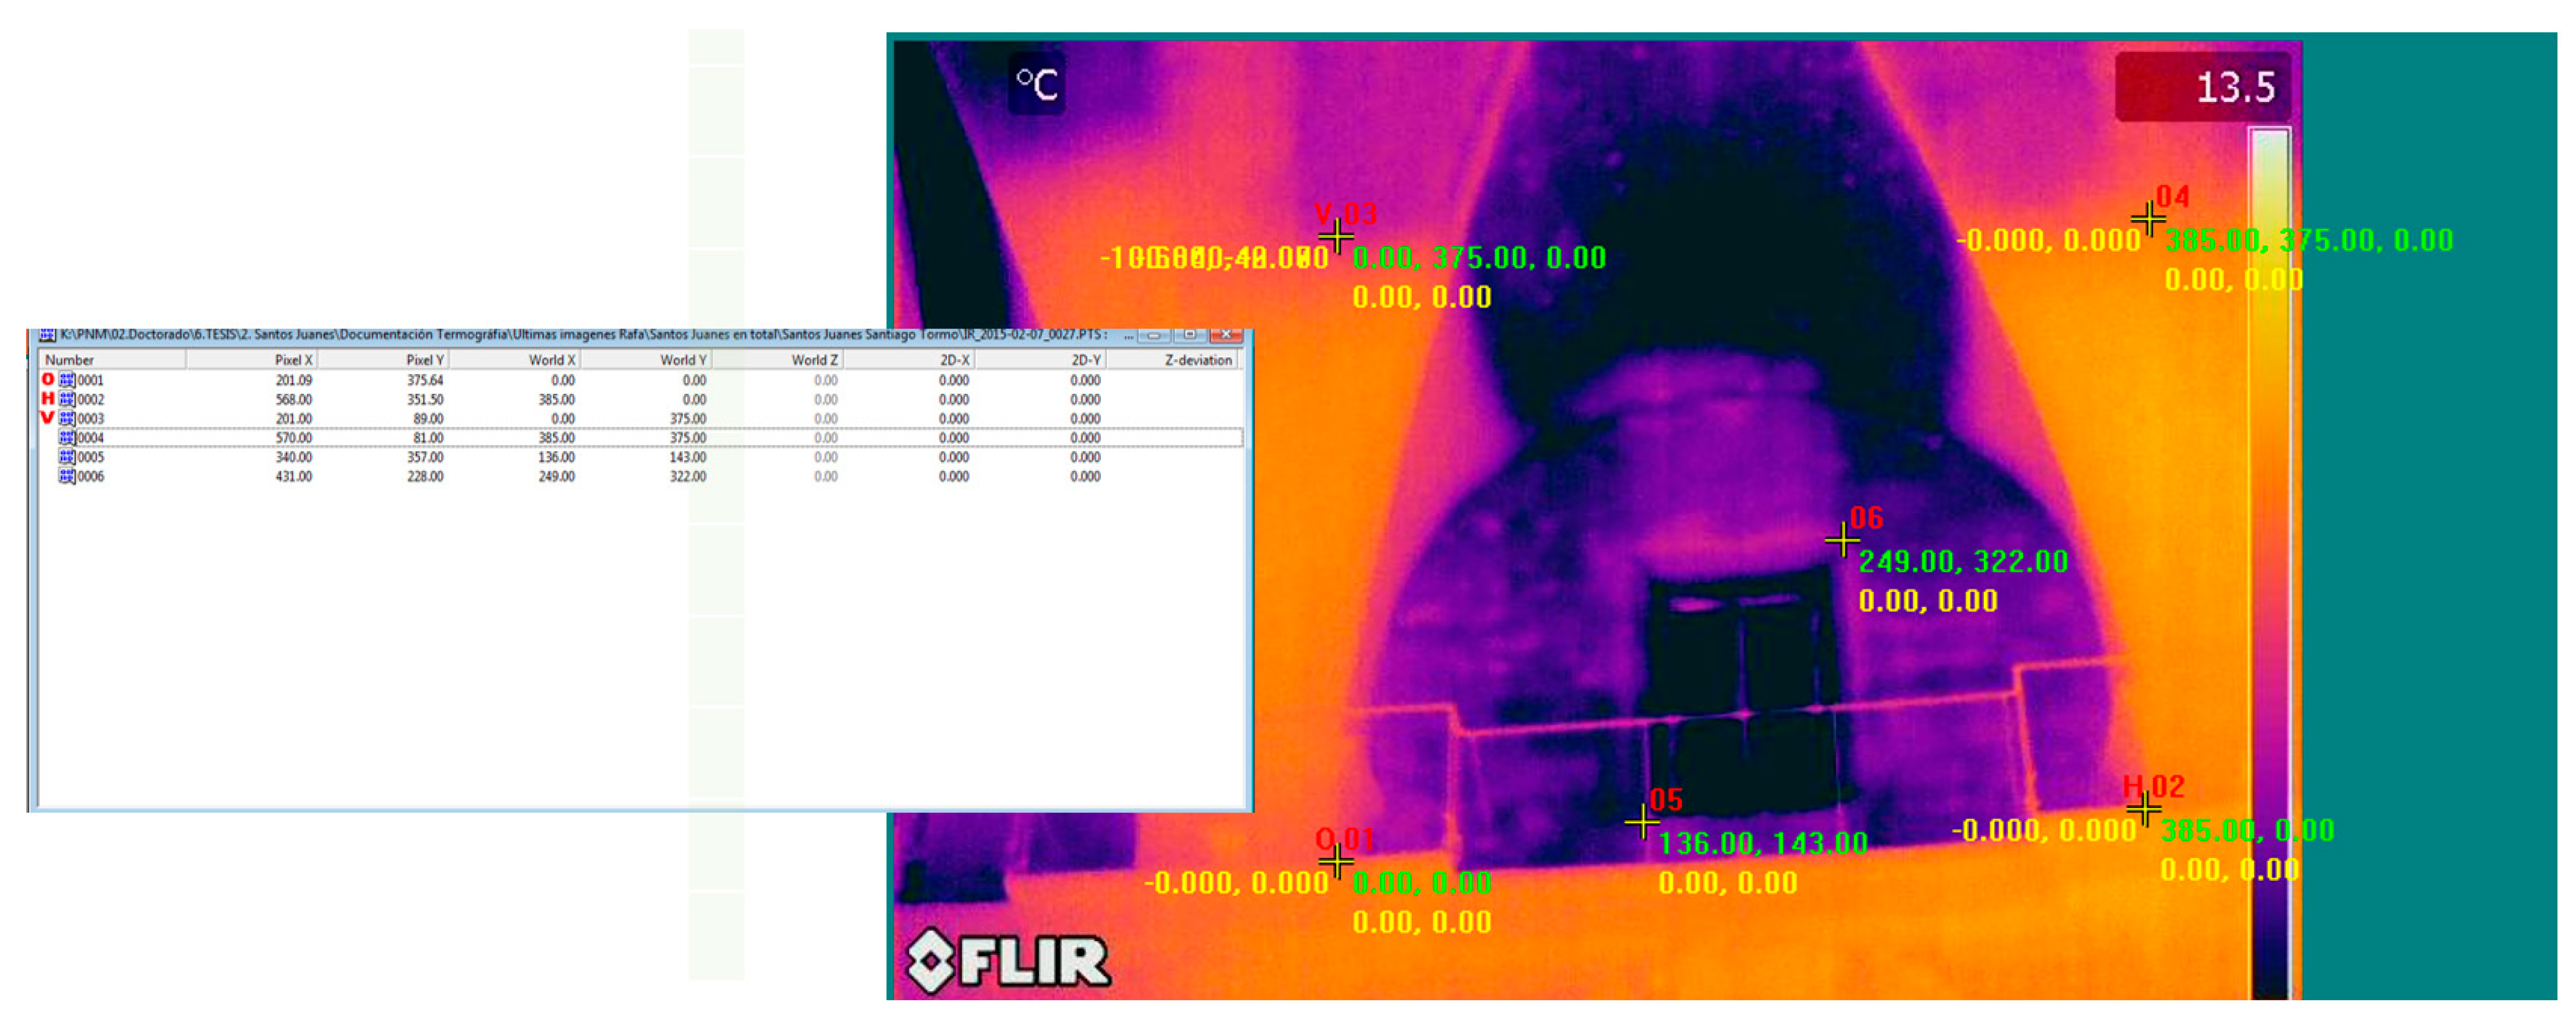
Once the calibrated images had been obtained, photogrammetry was used to rectify the conical distortion of the view. Using Asrix (v2.0) software, as shown in
Figure 10 and
Figure 11, photographic rectification was carried out using coordinates previously extracted from the point cloud of the laser scan as a basis. This rectification converts the image into a metric orthophotography, which enables direct and precise measurements to be made on it.
The resulting image was imported into the CAD 2015 environment and superimposed with sections obtained from the three-dimensional model of the temple from the point cloud. Since thermography makes it possible to visualise hidden elements whose geometry and dimensions are unknown, it was possible to draw these accurately and scale them on the sections or elevations already produced, as shown in
Figure 12.
The set of results obtained in this way allowed us to confirm previous hypotheses about missing or unknown elements such as secondary accesses, floor fillings, and structural discontinuities. Of special interest were the detection of the height of the interior filling, verification of the real thickness of the transverse arches hidden by the baroque vault, and evidence that the buttress of the apse did not interlock with the wall of the nave. In addition to their historical interest, these findings provided key information for rigorous structural modelling of the building.
4. Application of Georadar for Stratigraphic Analysis of the Subsurface
In recent years, georadar (or ground-penetrating radar, GPR) has been established as a high-resolution, non-invasive geophysical prospecting technique especially useful for superficial subsurface investigations. The versatility and precision of this tool have made it an essential resource in disciplines as diverse as archaeology, civil engineering or heritage conservation, as it allows for the detection of stratigraphies, buried structures and material elements up to depths of up to 50 m.
From a theoretical perspective, GPR operates by transmitting short pulses of high-frequency electromagnetic waves (typically in the range of 10 MHz to 2.5 GHz) into the ground through a transmitting antenna. When these waves encounter an interface between materials with different relative dielectric permittivity, the receiving antenna reflects back towards the surface and records part of the energy [
29] (p. 23). The travel time of the reflected signals is converted into depth by assuming or measuring the electromagnetic wave velocity in the medium, which depends on the material’s dielectric properties and moisture content [
30] (p. 7). The strength of the reflections is influenced by the contrast in permittivity and conductivity between layers, with stronger contrasts producing more pronounced reflections.
The resolution and penetration depth of GPR are inversely related to the antenna frequency: high-frequency antennas (e.g., 900 MHz) yield high-resolution images but shallow penetration, while lower frequencies (e.g., 100–400 MHz) penetrate deeper but with lower resolution. In the present study, a 400 MHz antenna was selected as an optimal compromise for detecting subsurface features at depths of several metres with sufficient detail for heritage assessment [
29] (p. 119).
The principle of operation of georadar is based on the same fundamentals as a conventional radar; however, it is adapted to subsurface exploration and uses a wide bandwidth and a pair of antennas (emitter and receiver) that are oriented towards the ground. The transmitting antenna transmits electromagnetic pulses, which generate reflected echoes as they pass through materials with different dielectric properties, which are picked up by the receiving antenna. These echoes are interpreted as continuous vertical sections, known as radar records or radagrams, representing internal variations in the subsurface.
In practice, GPR data is commonly processed using a sequence of filtering, gain adjustment, background removal, and migration algorithms to improve signal-to-noise ratio and correctly position reflectors in space [
31] (p. 56). This enhances the visibility of archaeological features, foundation remains, or stratigraphic boundaries in heritage contexts. In this study, data processing was carried out using gprMax (2016) and GPR-SLICE (v7.MT), which enabled the optimisation of signal clarity and three-dimensional visualisation.
Field operations are simple, and rapid data acquisition can be achieved by moving the antennas either manually or with specially adapted vehicles. The penetration depth and resolution of the analysis depend on the frequency of the antennas used and the properties of the terrain. In this case, a 400 MHz antenna was used, which was chosen to strike a balance between the resolution and depth of penetration.
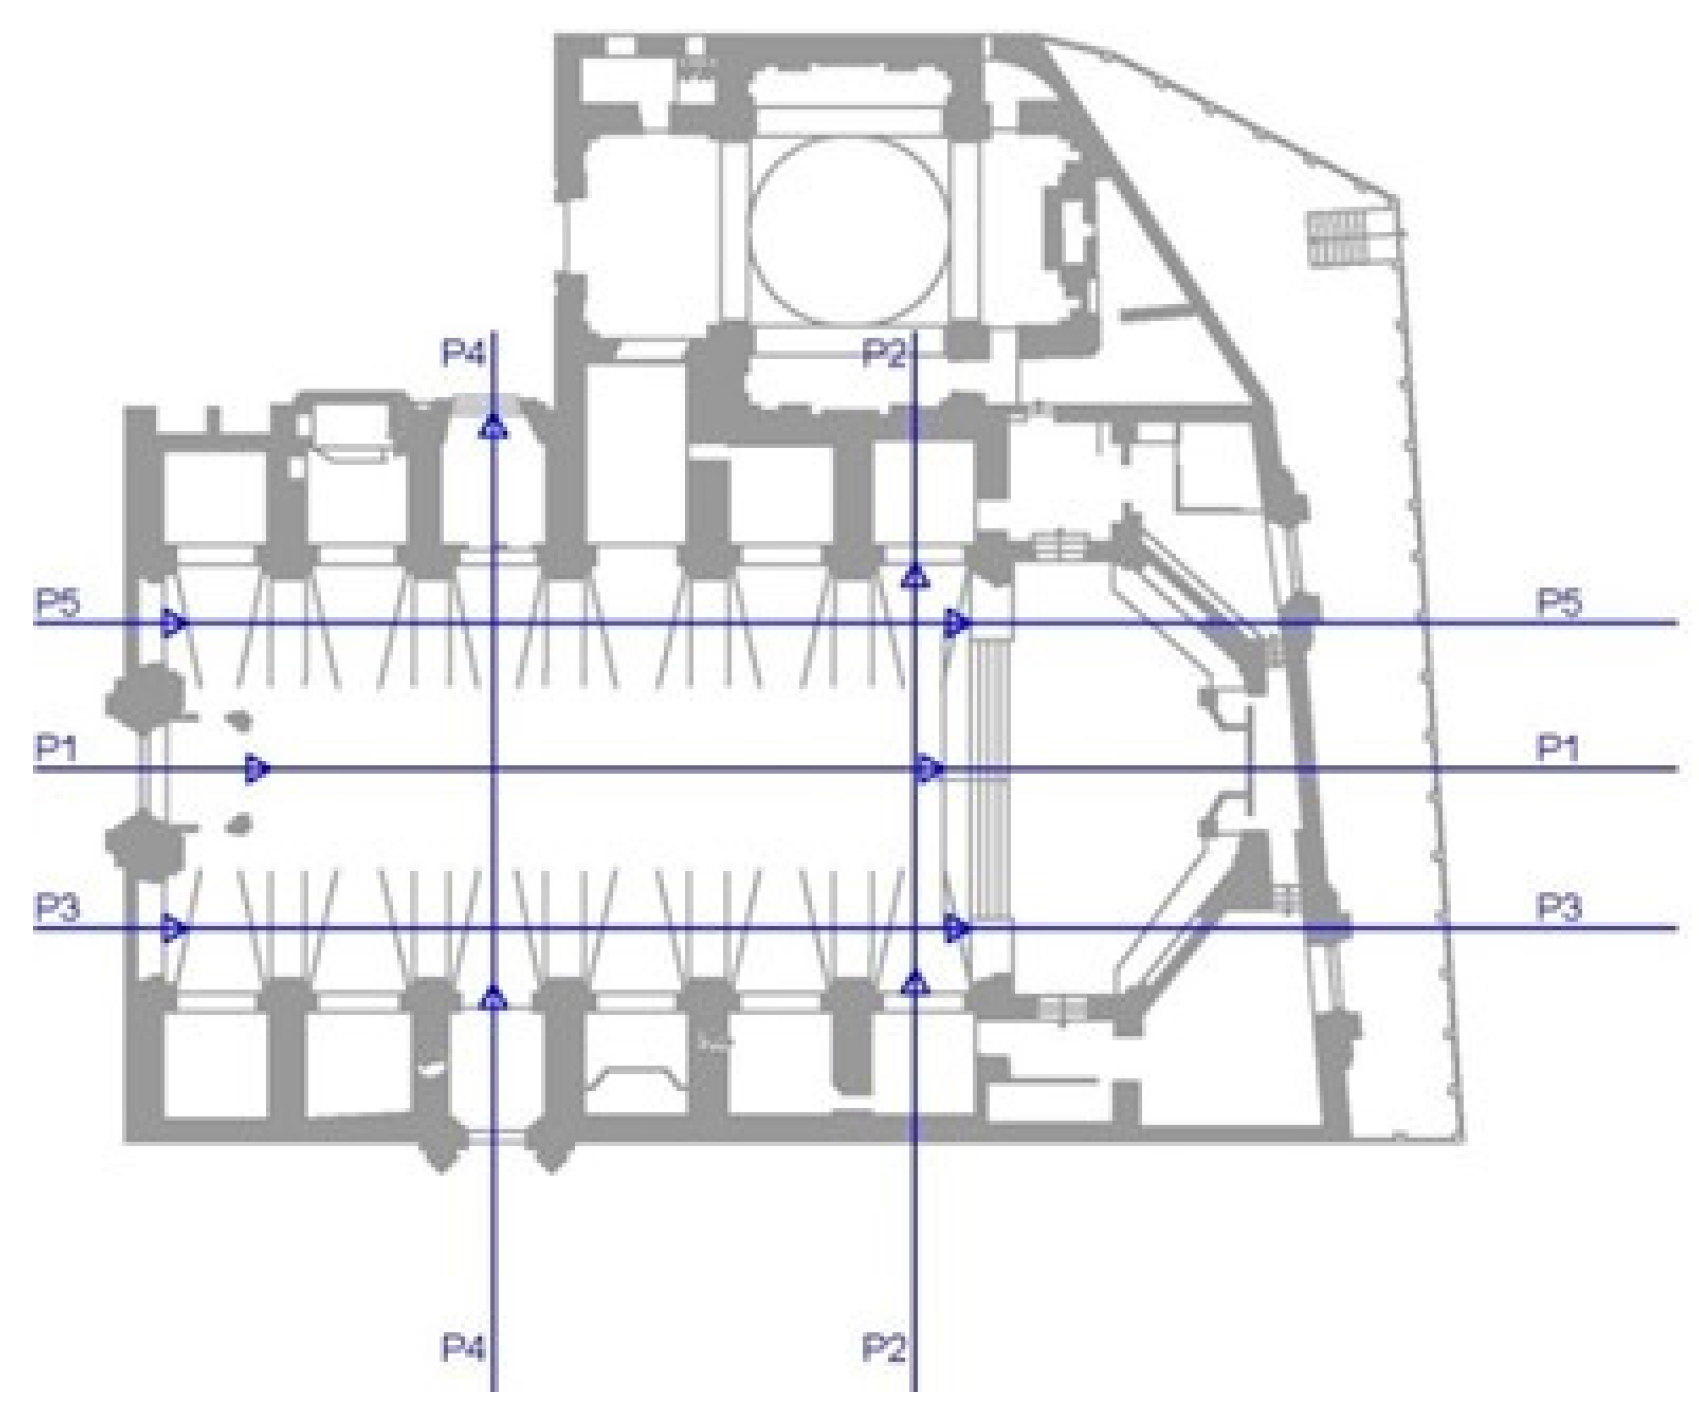
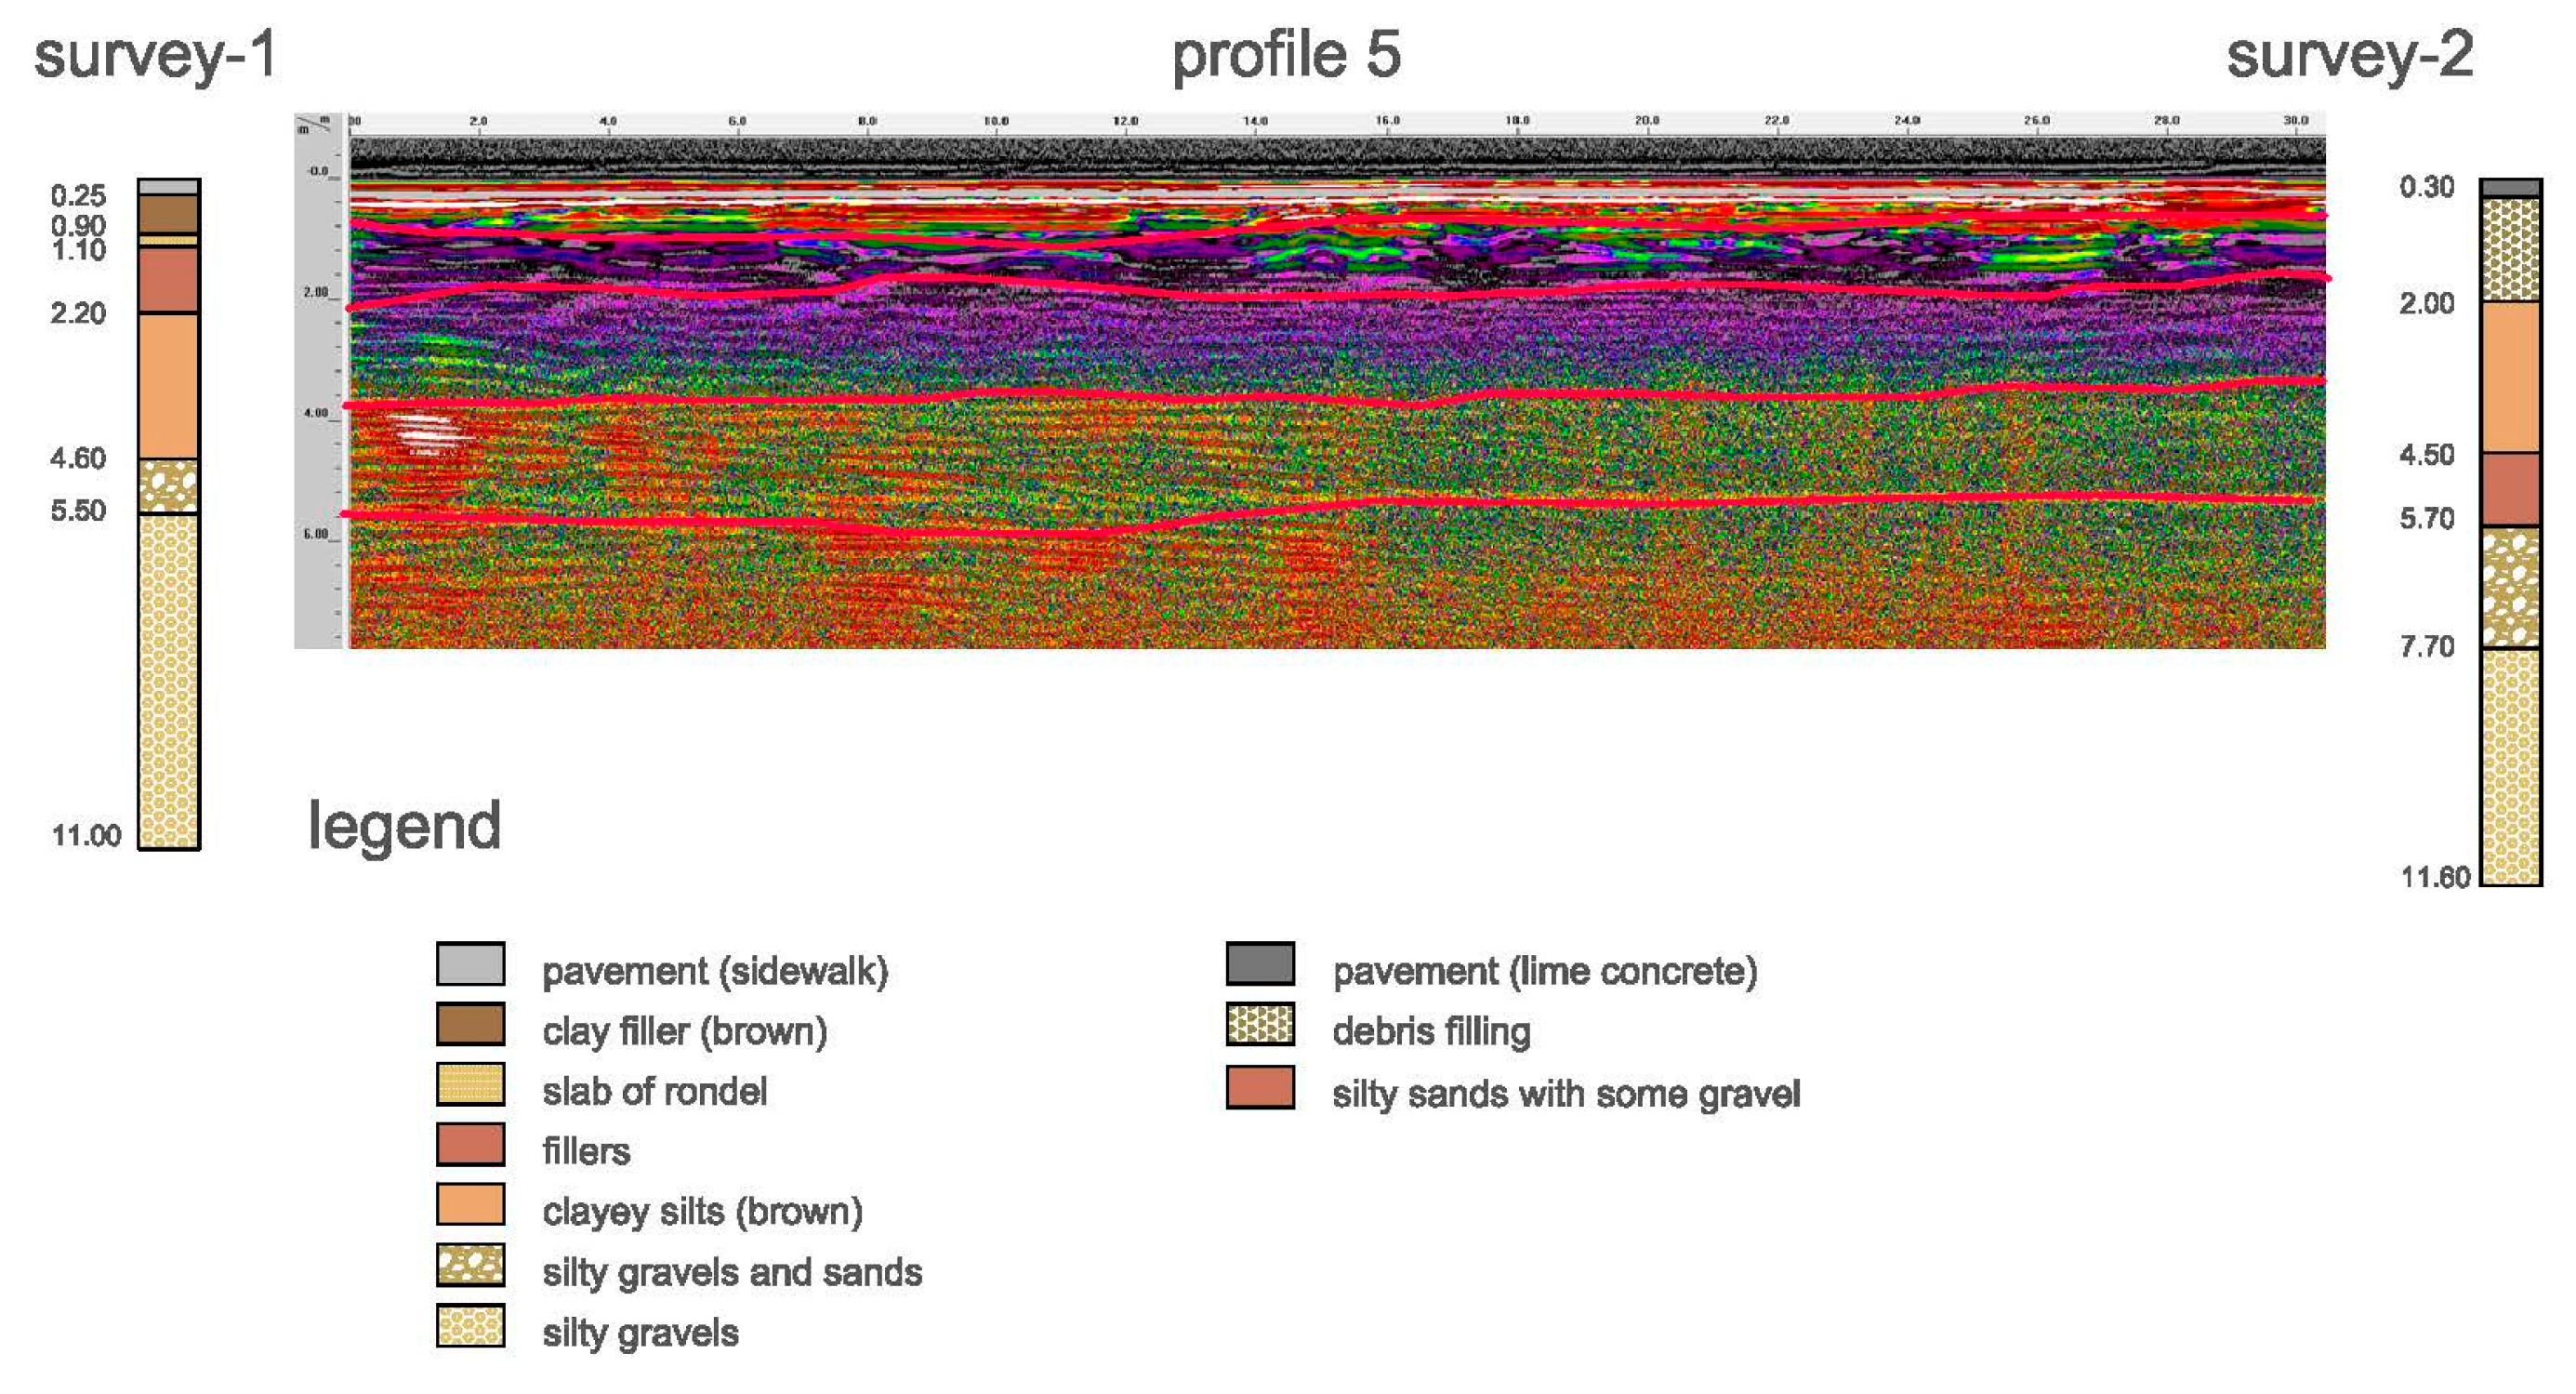
To enable an analysis of the Church of Santos Juanes subsoil, five survey profiles were designed and strategically distributed along the length of the building, as seen in
Figure 13. These profiles allowed for a complete sweep of the study area, covering both the longitudinal and transverse axes. The selection of these specific profile locations responded not only to the need for full geometric coverage of the footprint but also to generating an accurate three-dimensional model of the subsoil for the proposed structural analysis when combined with the existing geotechnical borehole data. This ensured that the soil–structure interaction simulation would be based on a realistic and spatially representative characterisation of the terrain beneath the most relevant structural elements, such as the bell tower and the ‘O’ façade of San Juan, identified as critical in the vulnerability assessment.
The information obtained in this way was georeferenced, represented graphically, and compared with data from a geotechnical study previously carried out by Estellés Ceba in his research on the building [
2].
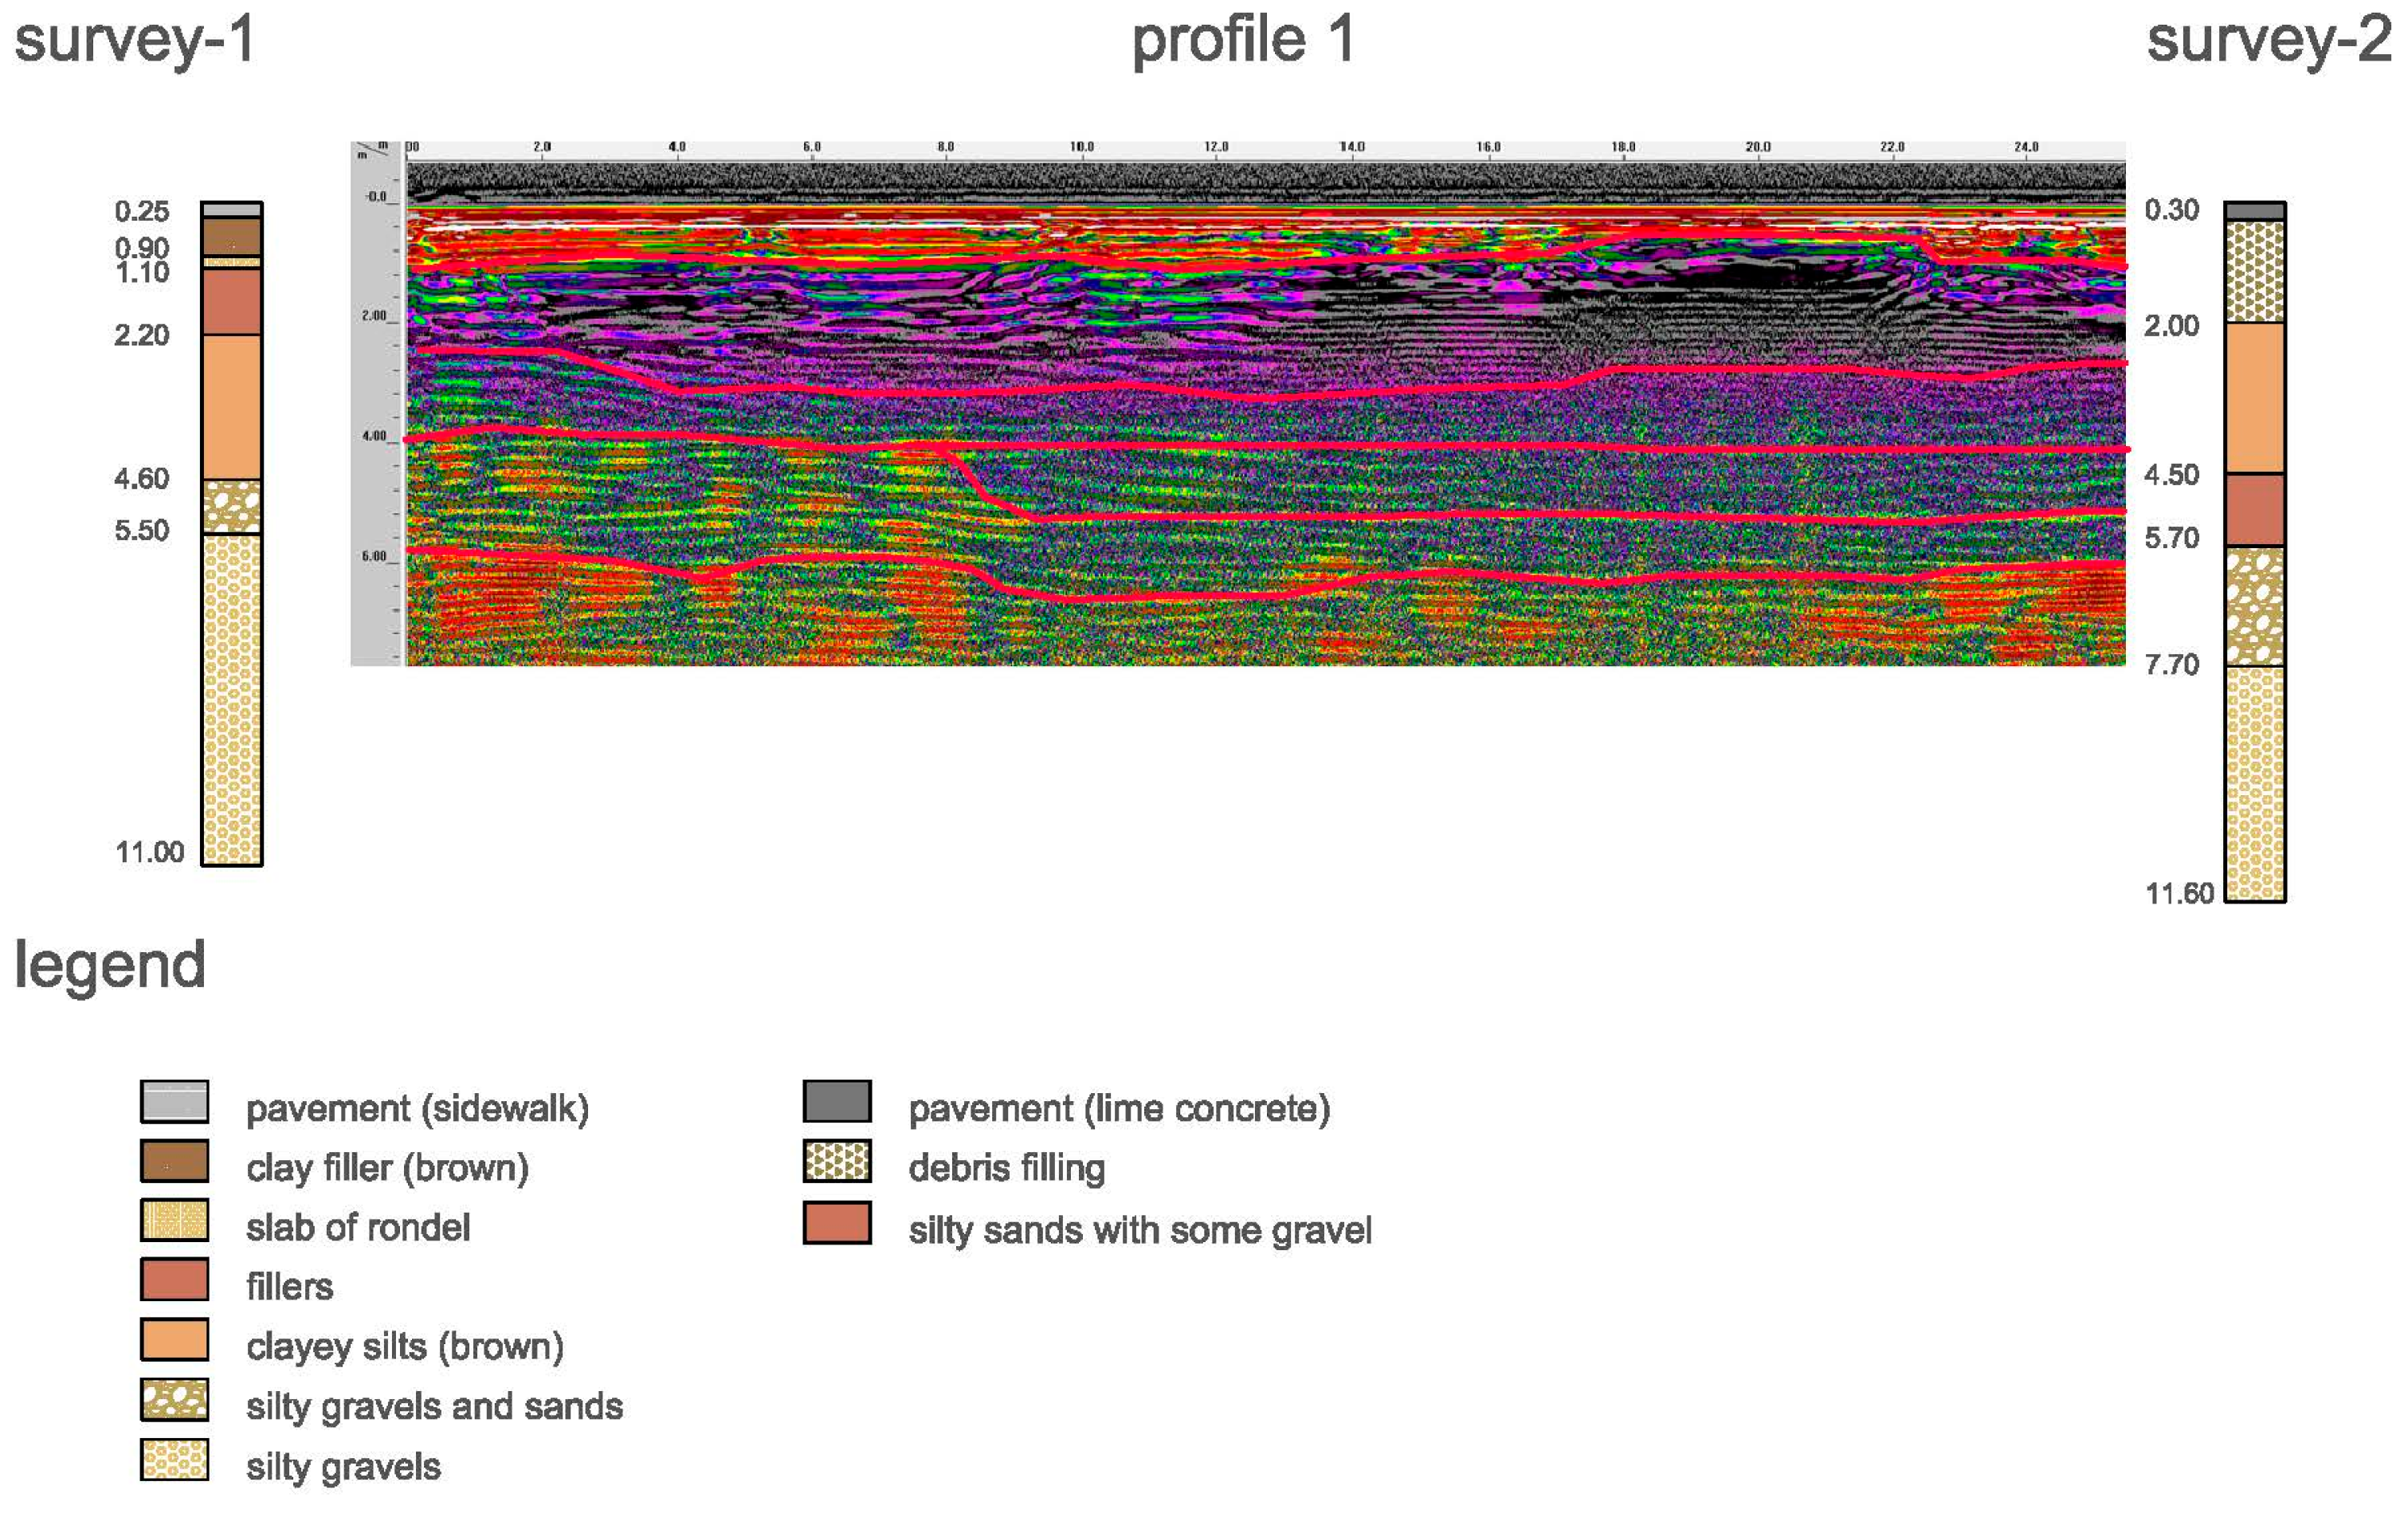
Figure 14 shows Profile 1, corresponding to the main longitudinal axis of the church. It illustrates a general coincidence between the layers recorded with georadar and the periodic soundings taken in the Estellés study, although there are small discrepancies in elevation due to the difference between these methods: a vertical sounding covers a very small area, while georadar analyses large sections. This profile reveals the use of a layer of fill to level the slight slope of the natural terrain, which descends from the Plaza del Cementerio de San Juan towards the Plaza del Mercado. No evidence of earlier structures is detected, suggesting that the former Boatella mosque was completely demolished.
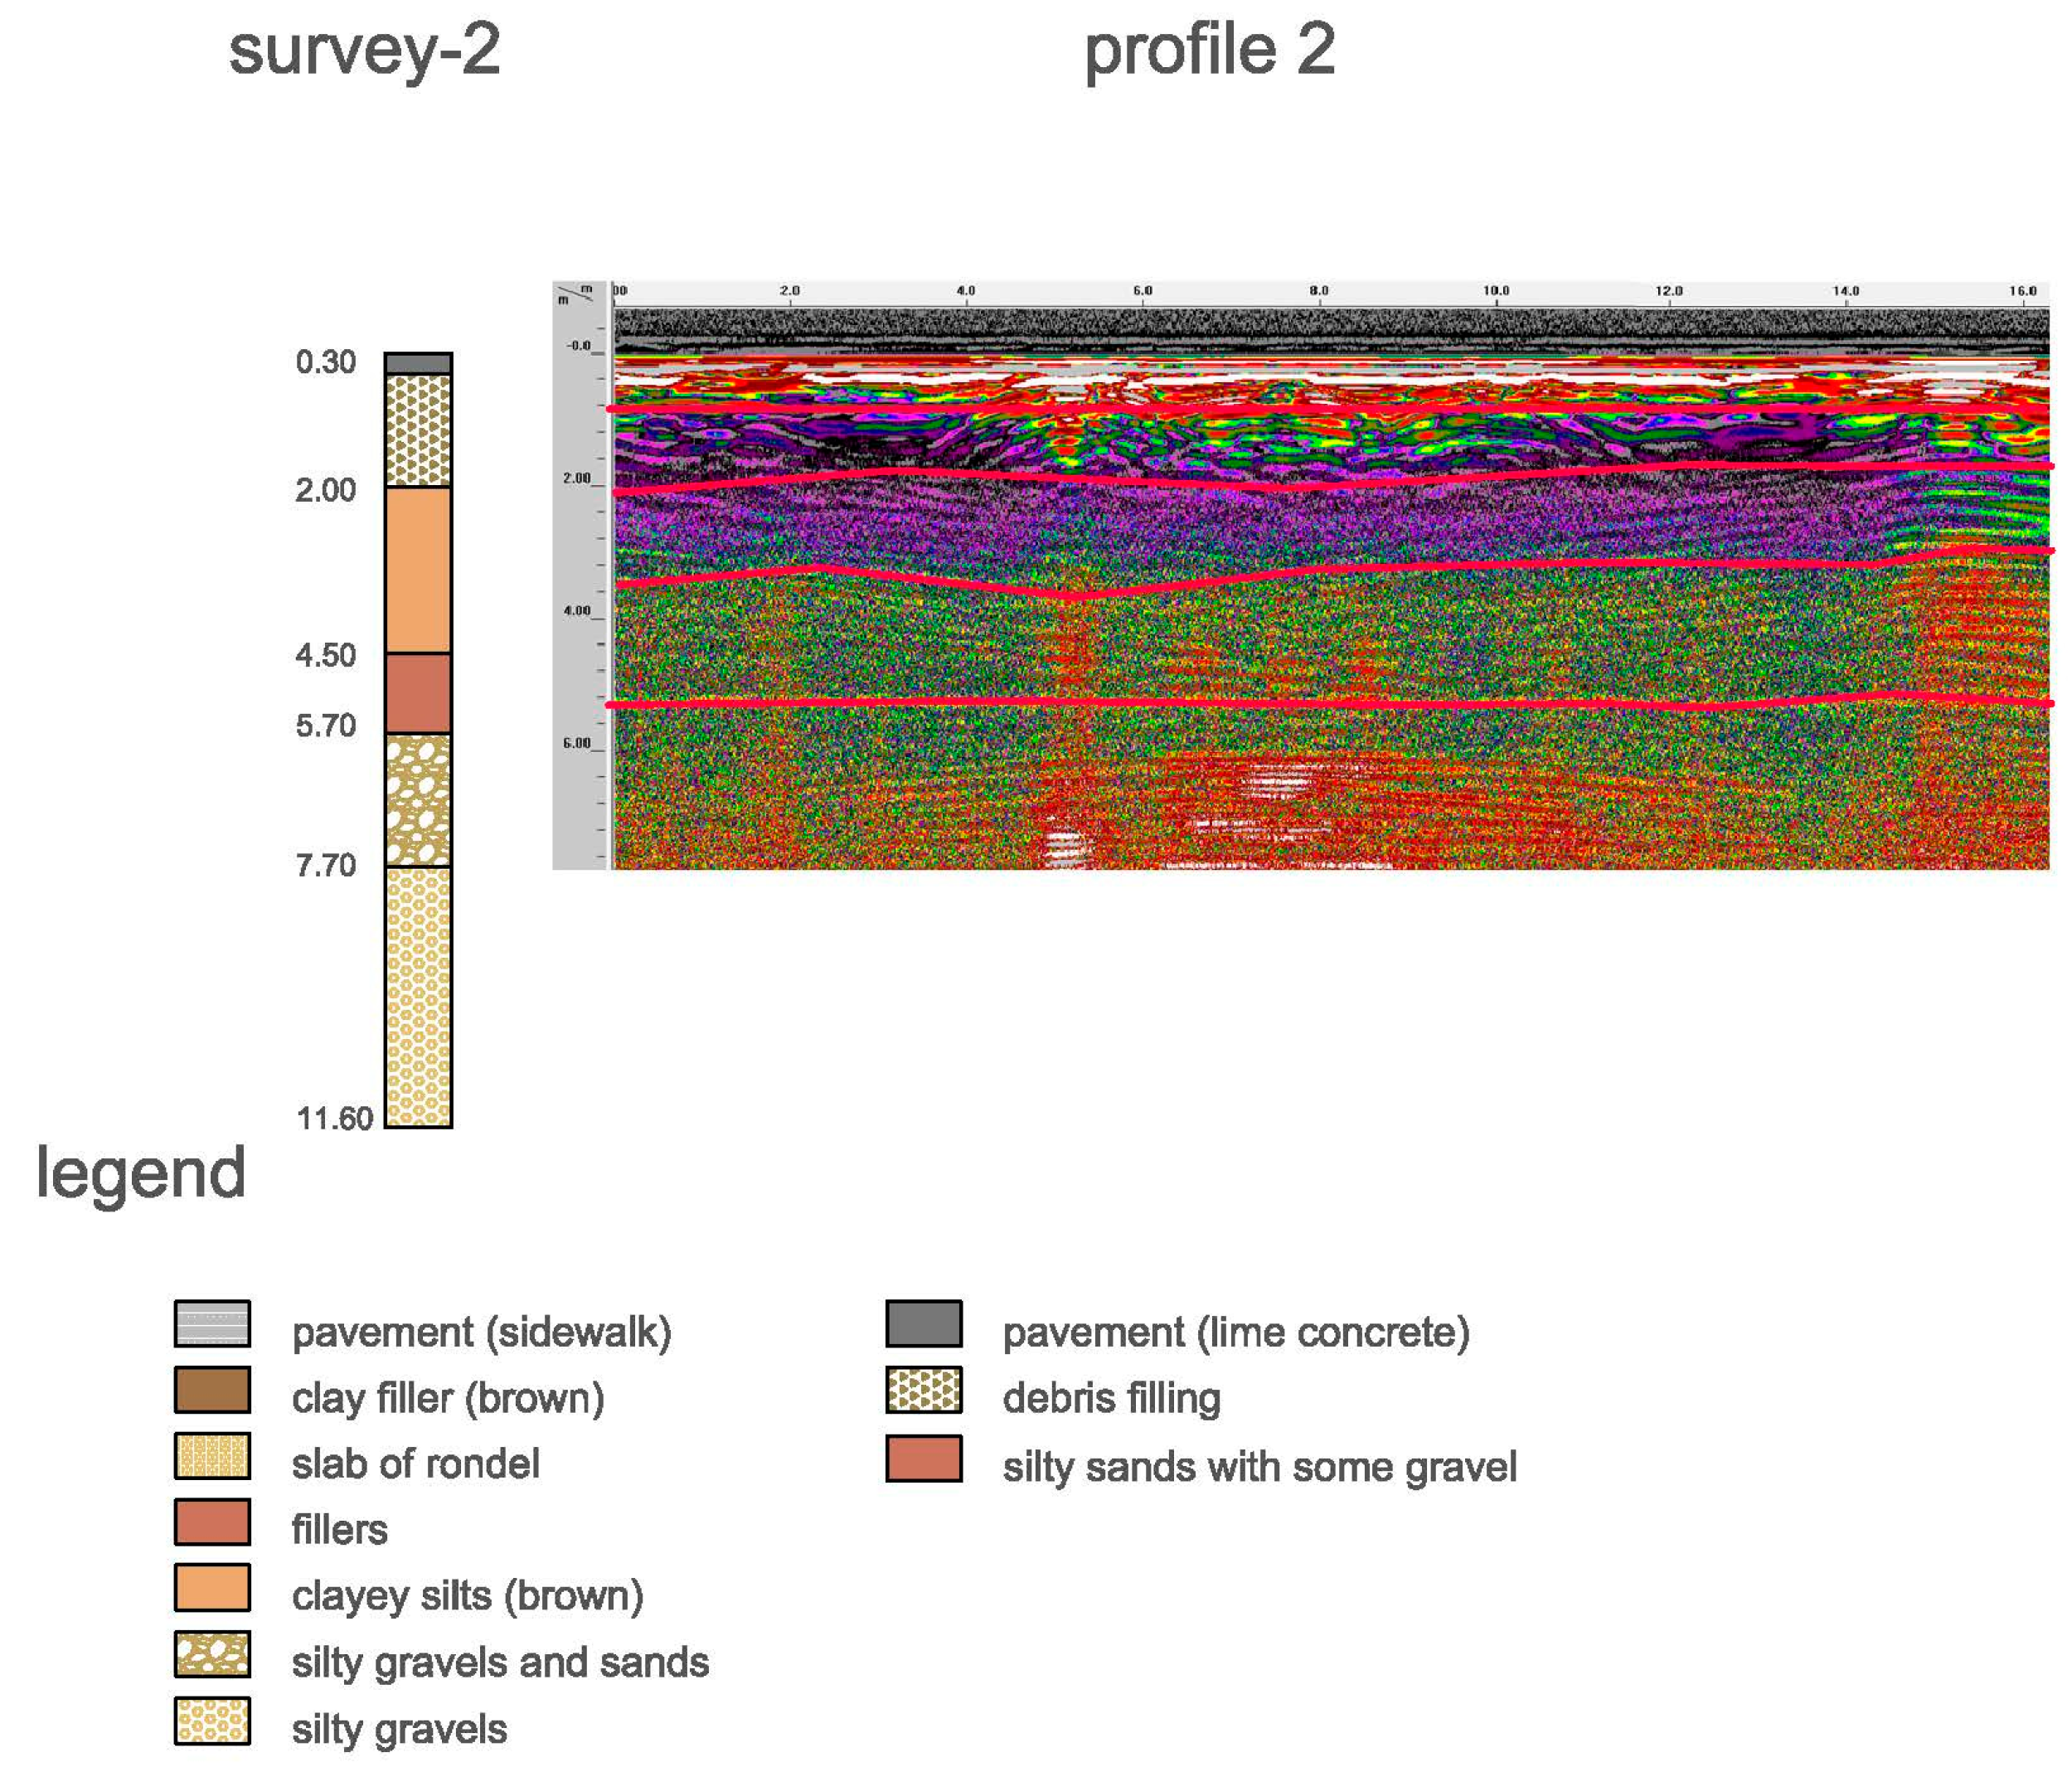
Figure 15 shows Profile 2, a cross-section close to the head of the building, which confirms the results of the previous longitudinal profile. At a depth of approximately 4 m, a significant irregularity is detected between elevations of 14 and 16 m; this is interpreted as a burial, in line with Gil Gay’s historical references [
32].
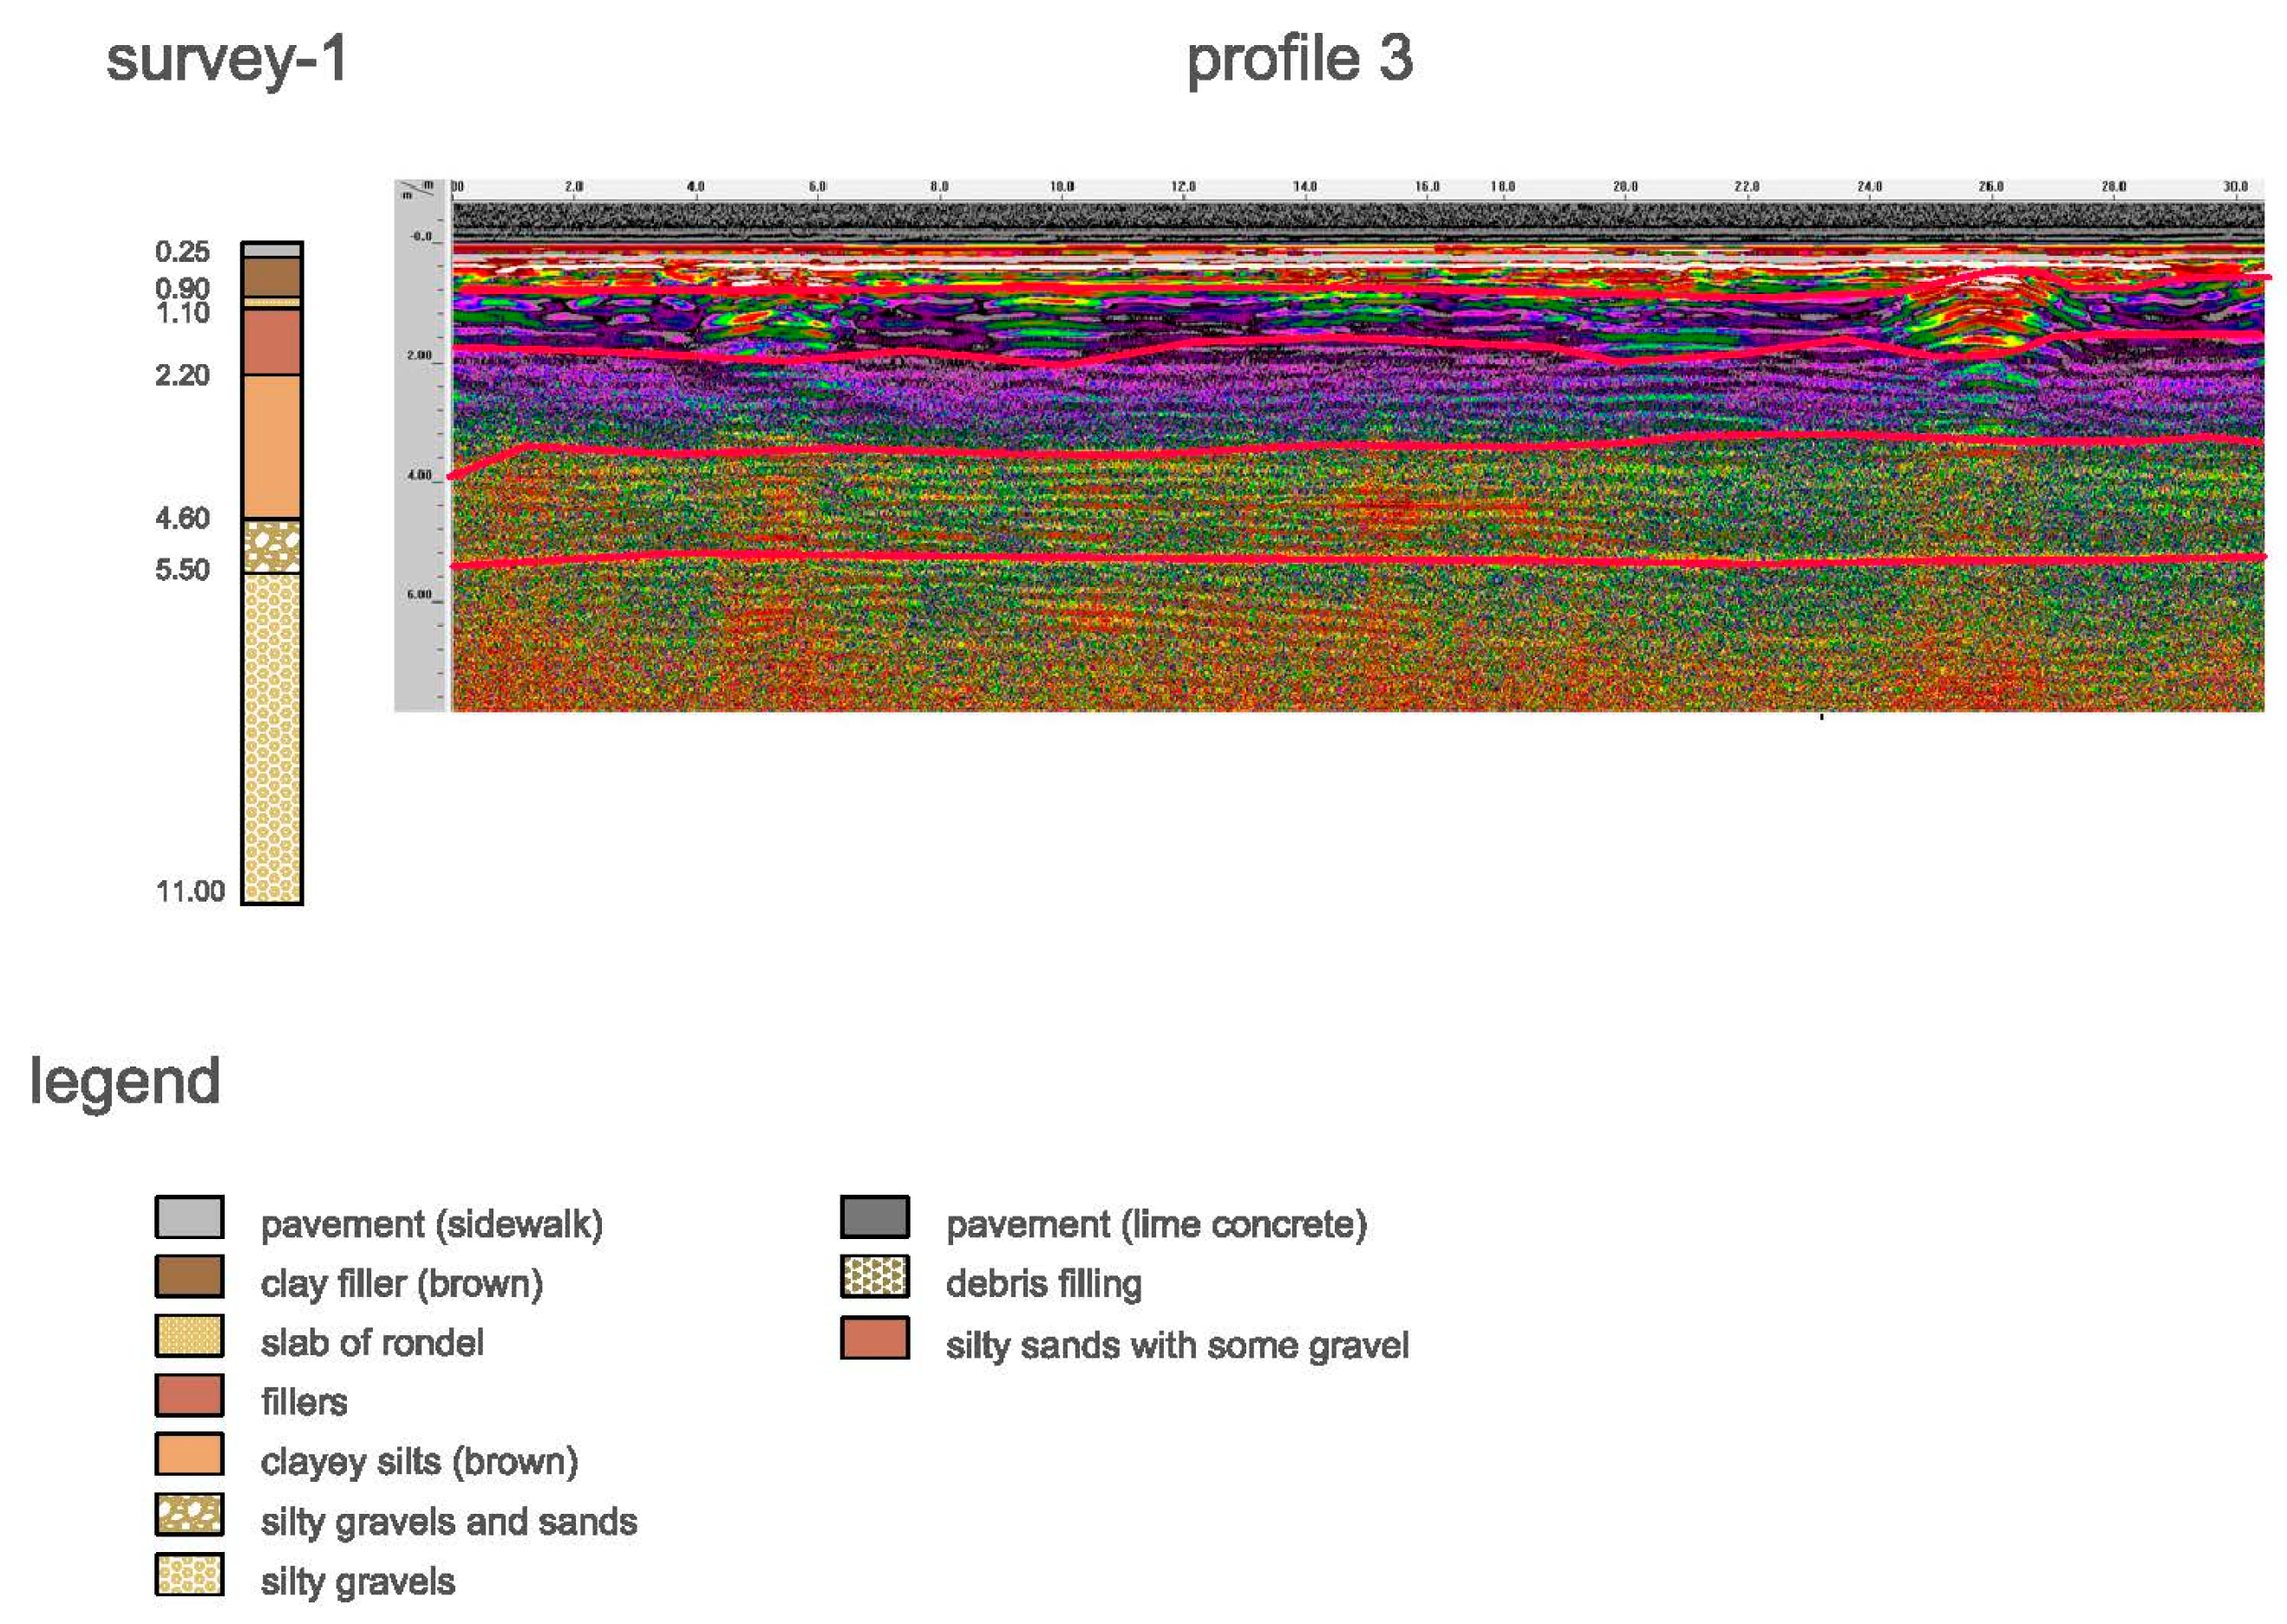
Profile 3, which is shown in
Figure 16, runs parallel to the chapels of the Peso de la Paja street, and does not contain notable discontinuities except for an anomaly between elevations of 25 and 27 m, which is also attributed to a burial. There are also no remains of structures prior to the present church, which reinforces the hypothesis of a complete reconstruction.
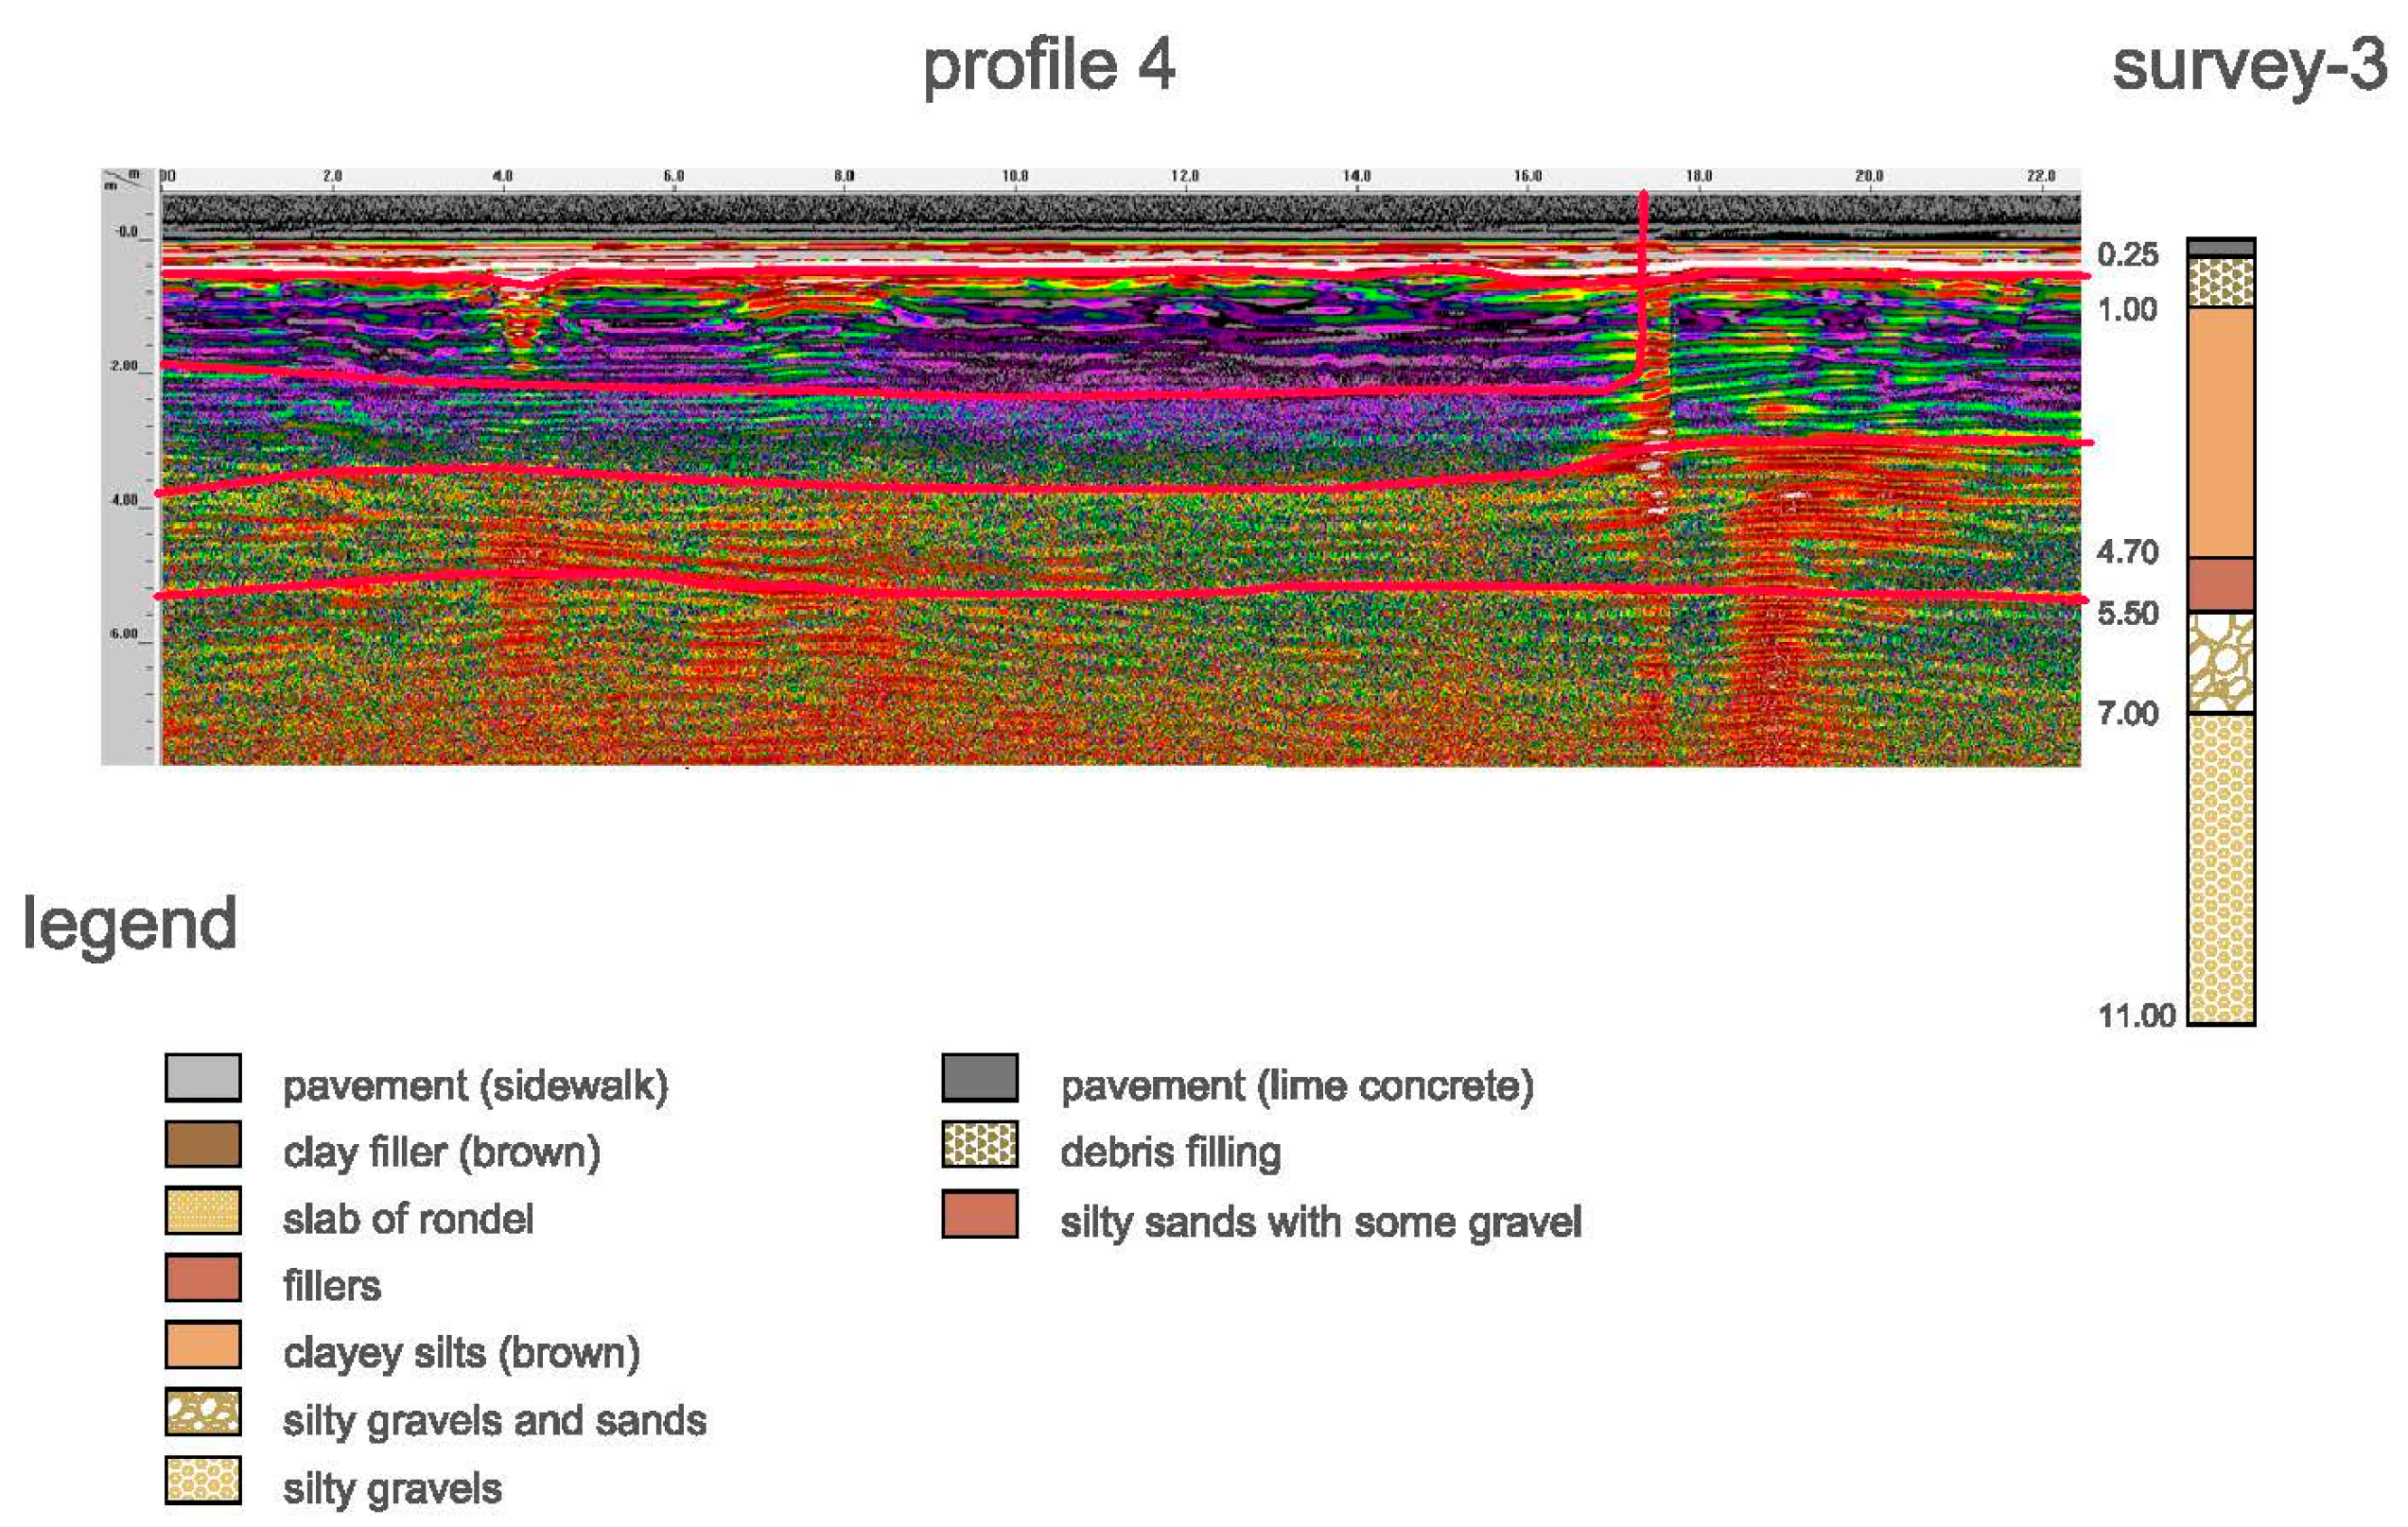
Profile 4 is shown in
Figure 17, representing a transverse section of the church from Peso de la Paja street to the Plaza de la Comunión de San Juan. This contains certain discrepancies with respect to survey number 3 of the Estellés study, although the layers recorded are equivalent. Thermal anomalies that are associated with burials of benefactors of the church can be identified. In addition, there is an irregularity near an elevation of 17.5 m, which may correspond to the remains of a previous construction, although this is not verified with certainty. The absence of visible humidity symptoms and the area’s topographic elevation reduce the probability that it is an accumulation of water.
Profile 5 (
Figure 18), which runs parallel to the chapels facing the Plaza de la Comunión de San Juan, reinforces the results for Profile 1. A slight slope of the terrain is confirmed, with no significant irregularities beyond occasional burials, some of which were also noted by Gil Gay [
32].
In general, the sections analysed here show a clear coherence with previous studies and enable the difference in foundation levels along the building to be explained. The church is located on a natural depression, possibly an old riverbed of the Turia, whose lowest area coincides with the Market Square. It was therefore necessary to carry out a generalised filling of the site before undertaking the construction of the building. No clear evidence has been found of structures prior to the present church. However, an anomaly located in the access area from the Plaza de la Comunión de San Juan may reveal the remains of the ancient mosque in a future, more detailed study.
5. Integrated Non-Destructive Testing and Advanced Structural Analysis of the Santos Juanes Church
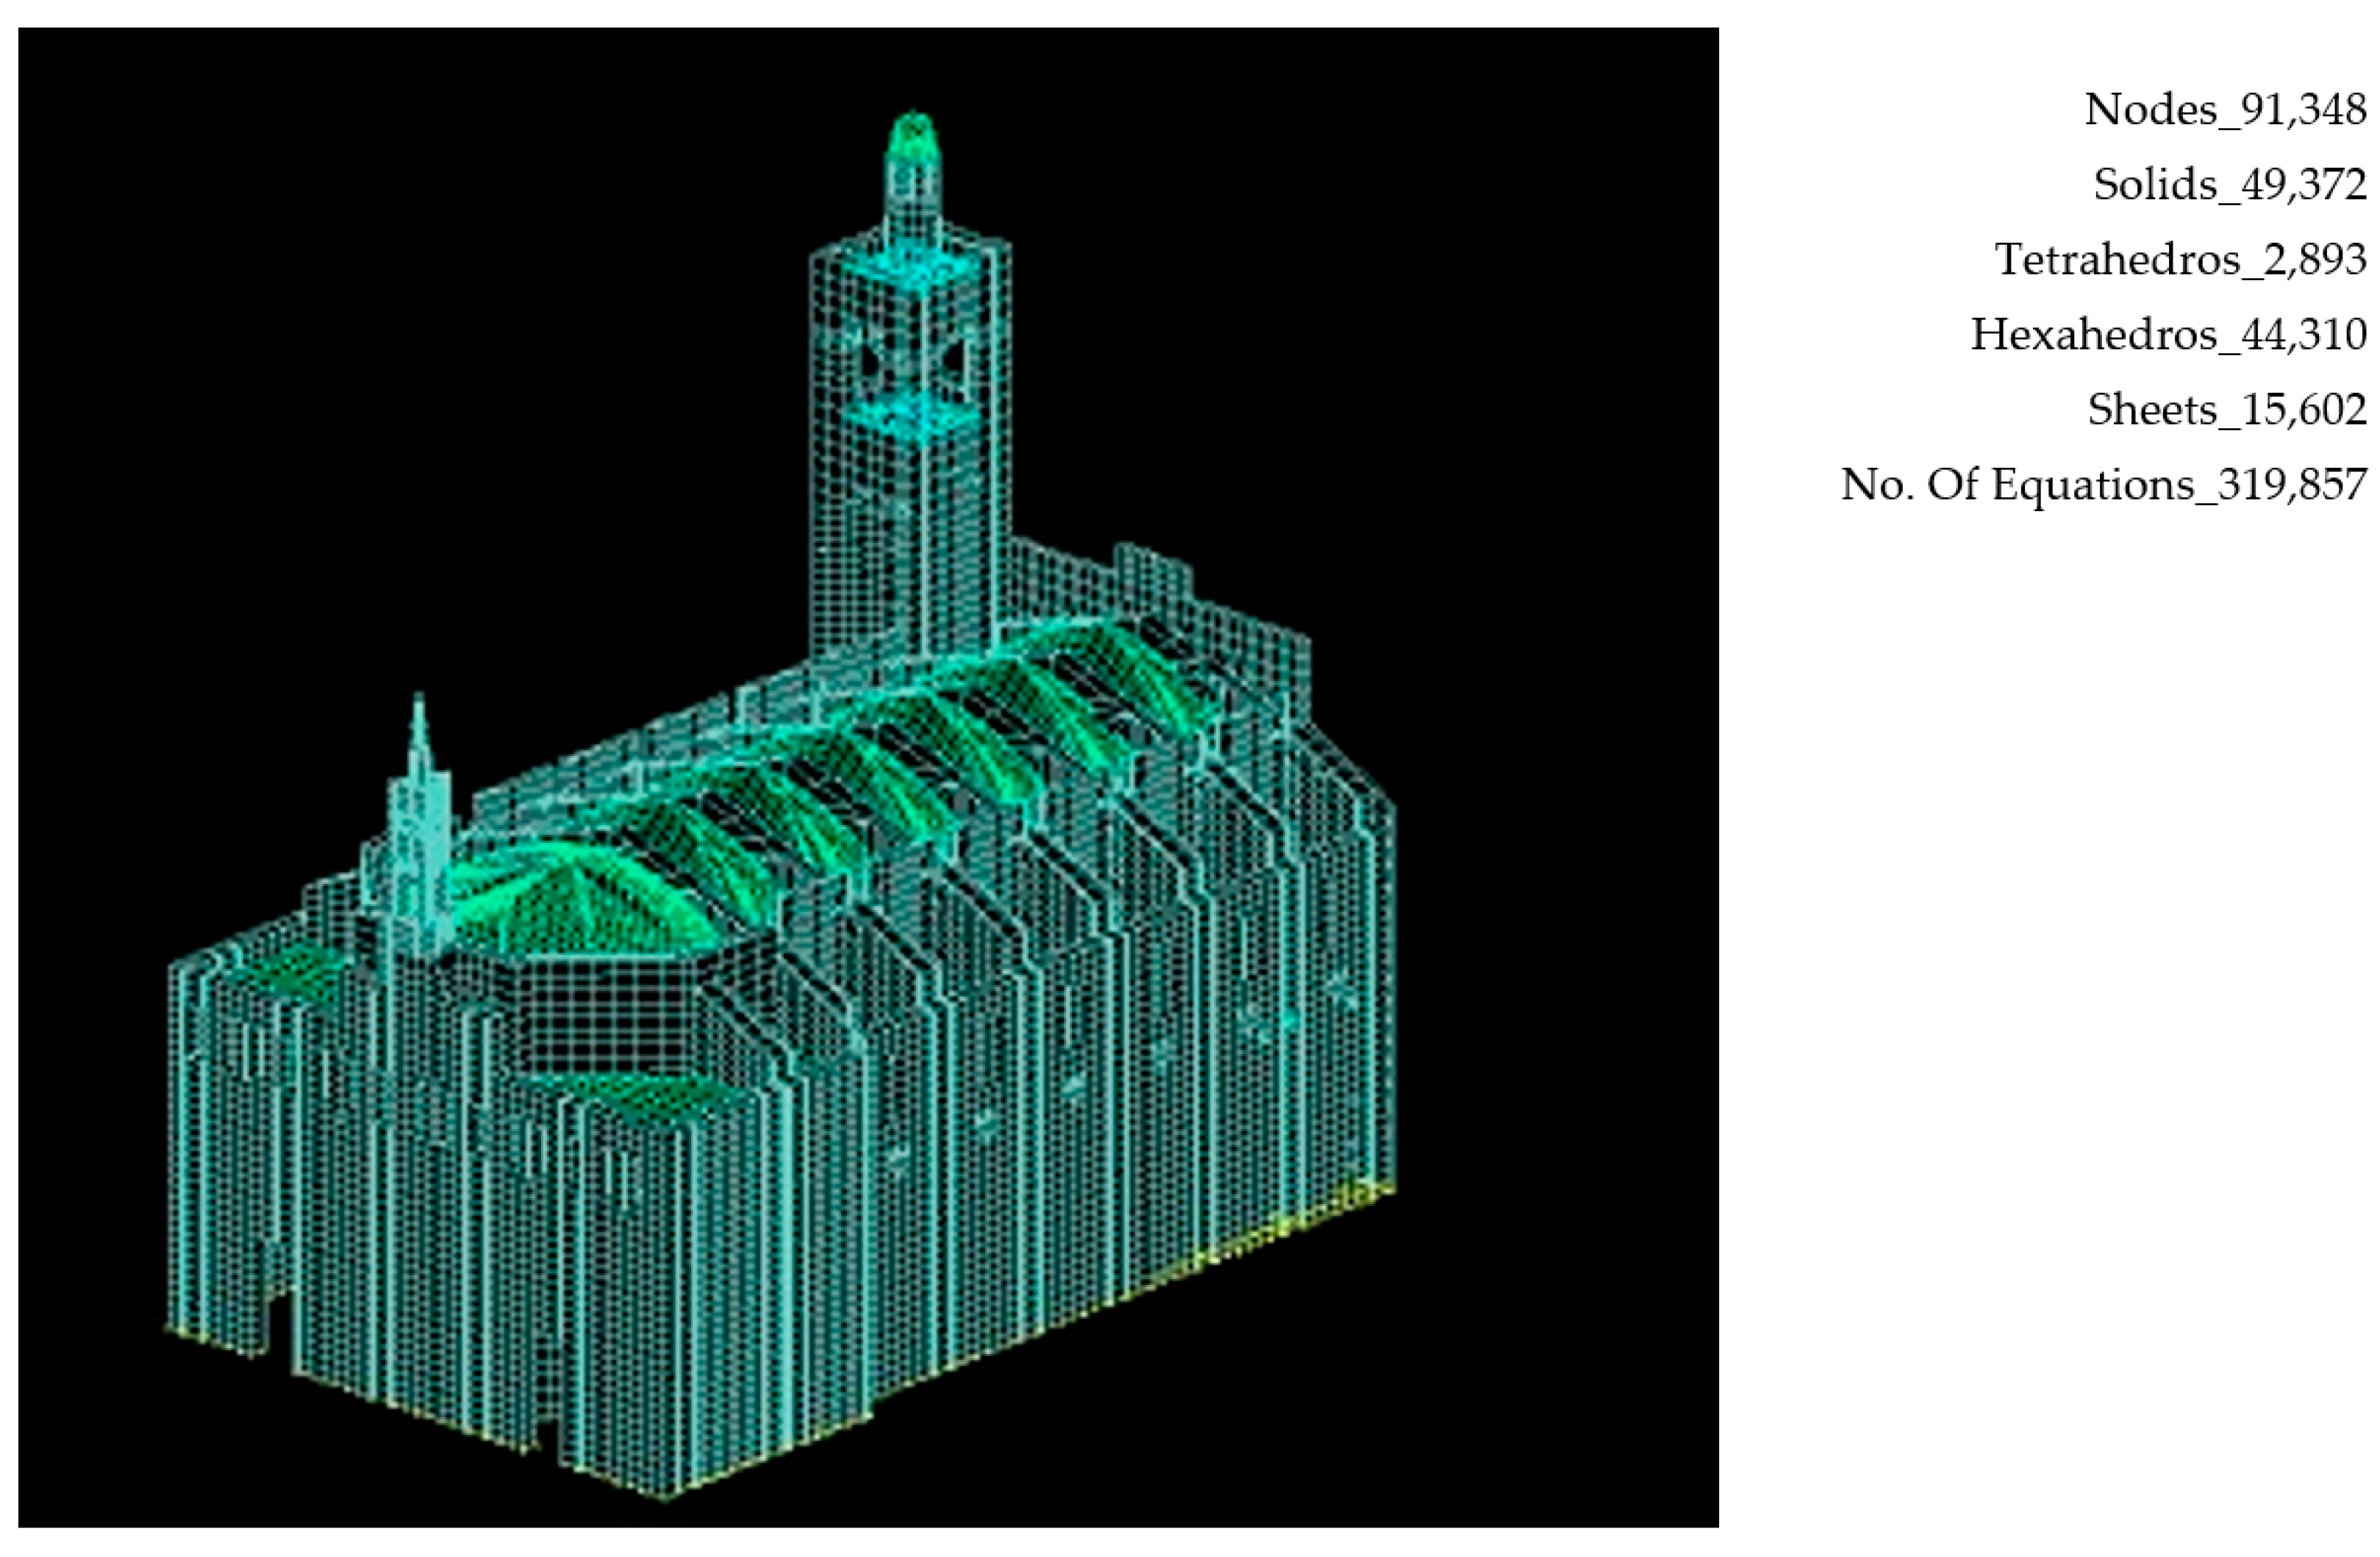
By applying non-destructive techniques such as laser scanning, infrared thermography and georadar, it was possible to develop a highly accurate three-dimensional model of the Santos Juanes church, as shown in
Figure 19, including its architectural structure and the ground on which it stands. This process made it possible to digitally reconstruct its geometry and carry out a rigorous structural analysis of the complex to evaluate its behaviour under various actions and load states.
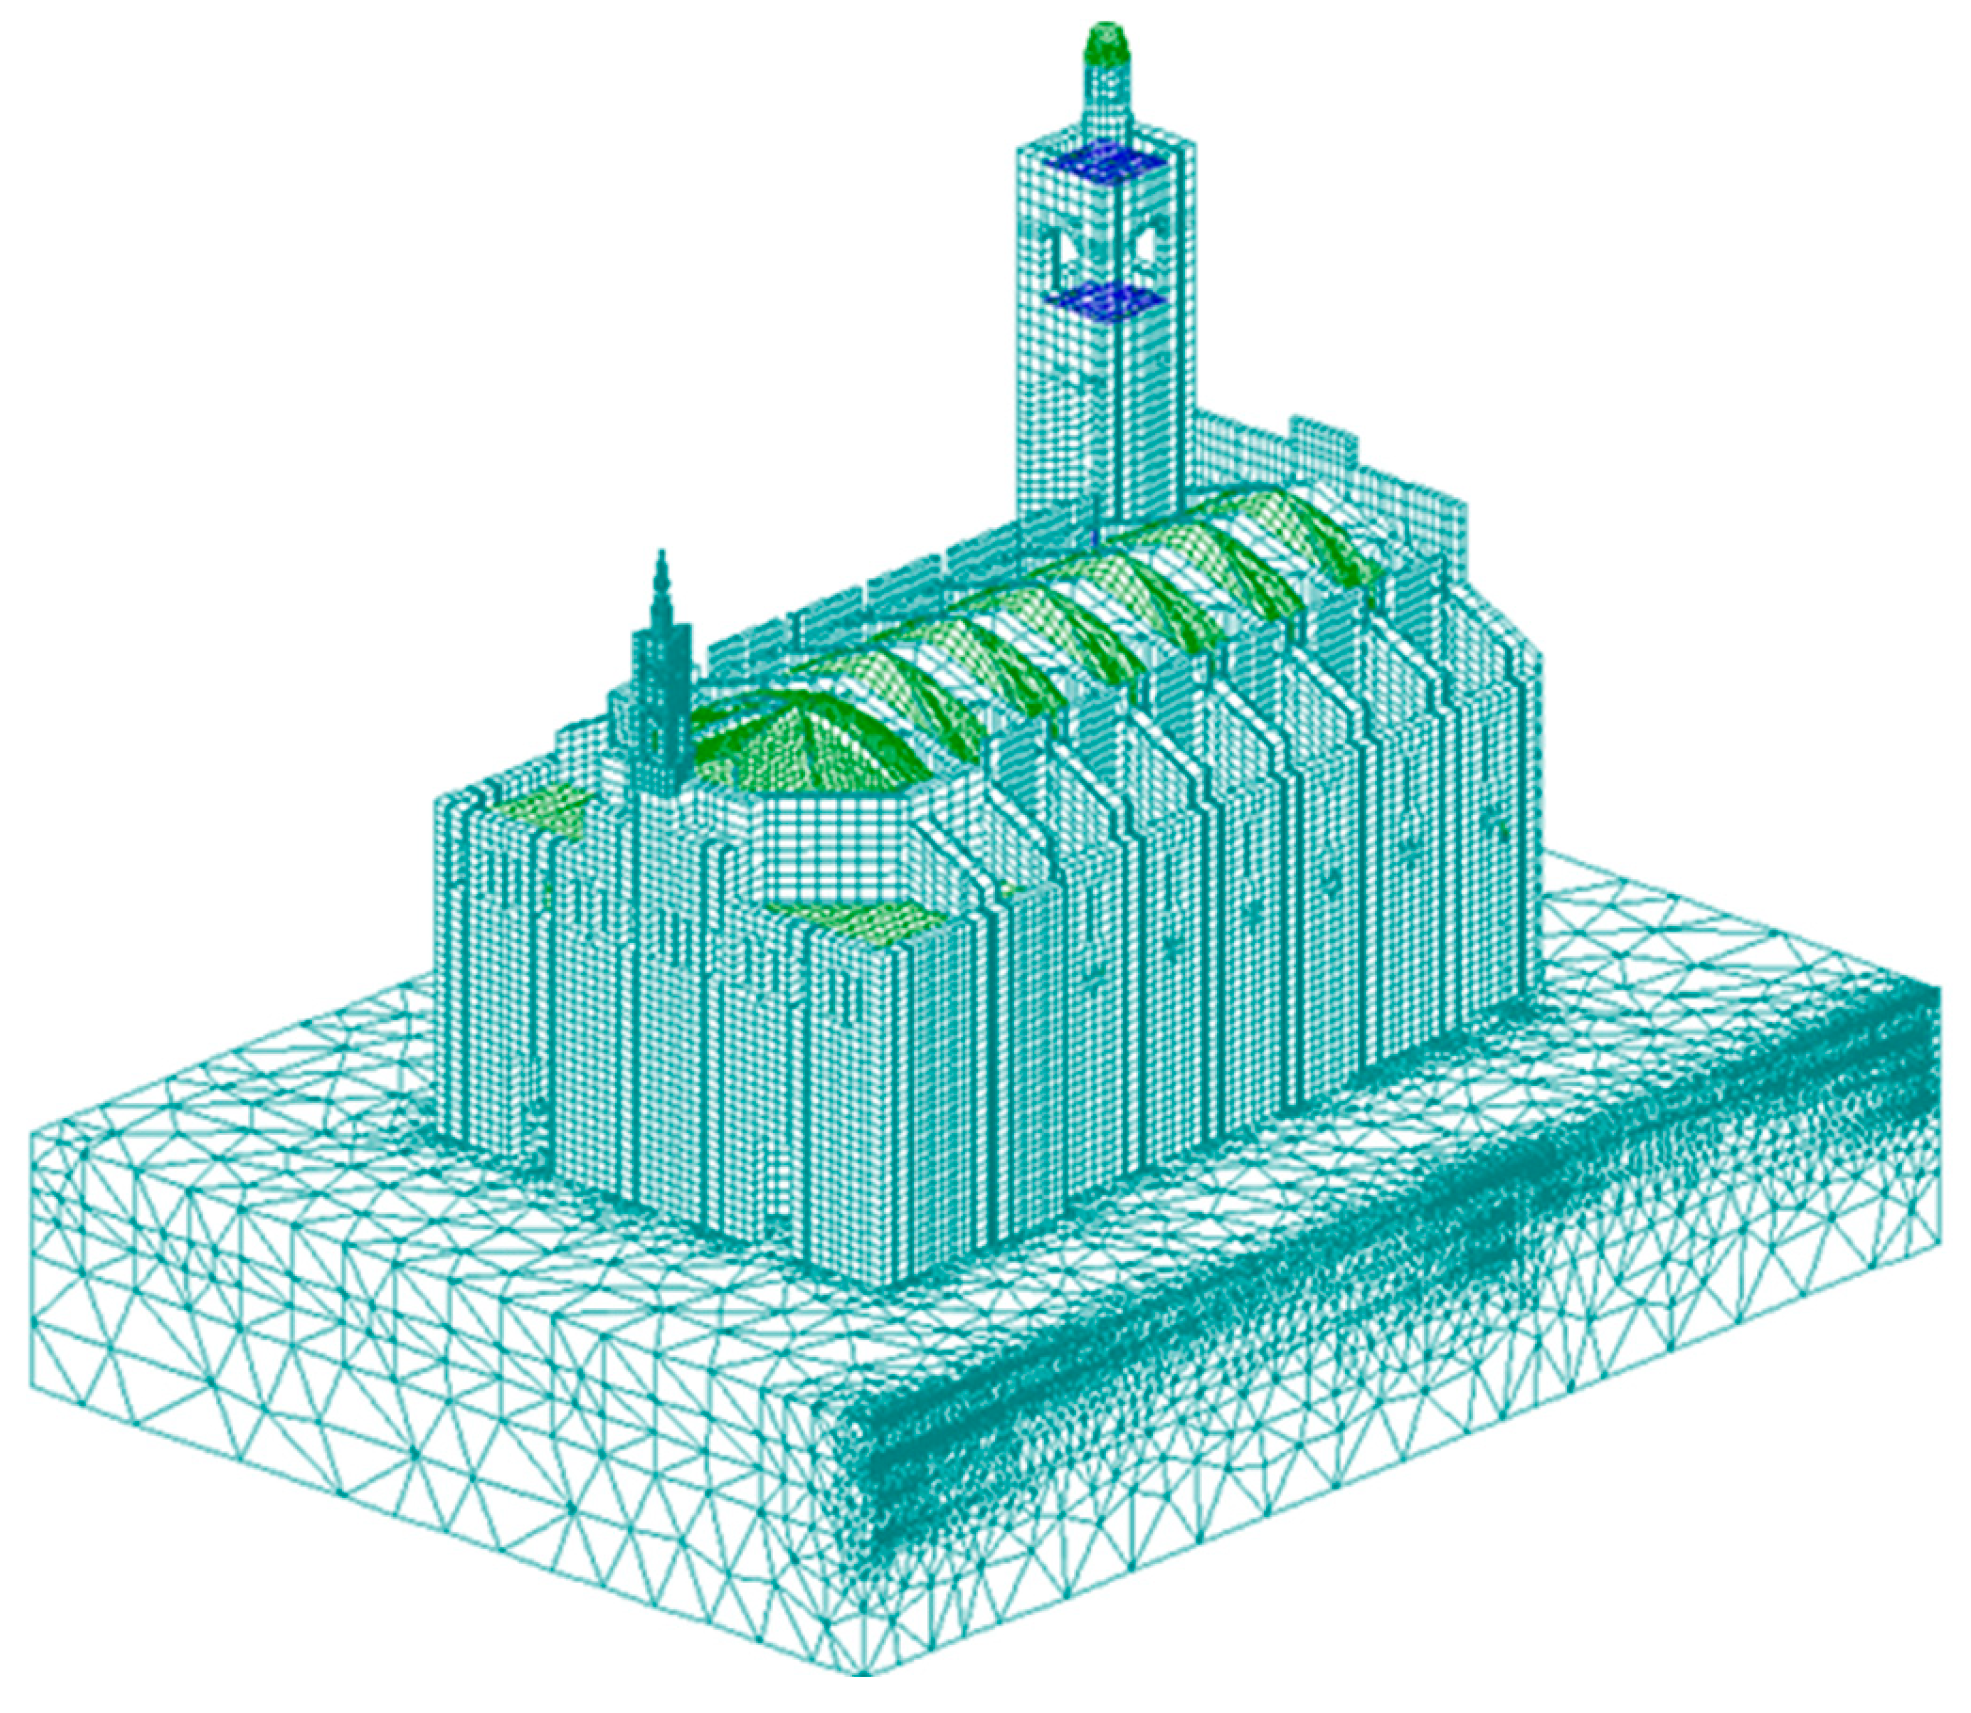
To do this, two different models were generated: one that considered only the church’s structure, on fixed supports (
Figure 19), and the other that included characterisation of the ground (
Figure 20). This comparison allowed us to evaluate the influence of the soil on the structural response, which is particularly interesting for a historic building such as this one.
5.1. Preliminary Considerations
The structural analysis of historic buildings requires attention to some fundamental factors, such as the mode of failure, the mechanical behaviour of the material, the modelling method and the type of analysis used. Unlike in modern construction, the classical theory of members is not valid in this context. Then, we resort to the theory of limit analysis of masonry structures, whose principles were established by Heyman [
33] (p. 63), based on three fundamental hypotheses: masonry does not resist tension, has a theoretically infinite compressive strength, and does not fail by sliding. This formulation guarantees stability if it is possible to find an internal thrust line that satisfies the static equilibrium [
34] (p. 15).
5.2. Damage Model
Given the heterogeneous nature of the materials used in the church (ashlar and mortar), a continuous isotropic damage model was created to reproduce their mechanical behaviour under load. This model takes into consideration the microstructural evolution of the material over time, integrating the deterioration through a damage variable d (
Figure 21), which represents the loss of resistant surface [
35] (p. 167) as shown in Equation (1):
The equilibrium condition can be used to determine the relationship between the Cauchy stress and the effective stress acting on the effective resistant section.
then,
The model was implemented in the ANGLE (v1) program [
36], based on the formulations developed by Oñate [
37], Oliver [
38], Oller [
39] and Hanganu [
40], and took into consideration the asymmetric behaviour in tension and compression as well as the influence of the finite element mesh size on the simulated response [
41]. In the numerical implementation within ANGLE (v1), the constitutive law is applied at the Gauss integration points of each finite element, updating the stiffness matrix at every load increment according to the current value of the damage variable
d. This allows the simulation to capture the progressive degradation of stiffness and strength, reflect the distinct behaviour in compression and tension, and account for mesh-size effects, thereby ensuring a realistic representation of the nonlinear behaviour of masonry materials.
Although this continuous isotropic damage model and its finite element implementation in ANGLE (v1) have been widely applied to ordinary masonry and reinforced concrete structures, their use is fully justified for the present case of historical masonry. As highlighted in recent reviews, the analysis of monumental buildings poses unique difficulties related to the heterogeneity of materials, complex geometries, and historical alterations, which limit the applicability of purely classical or linear methods [
42] (p. 300). In this context, damage mechanics offers the most consistent framework, since it explicitly represents the absence of tensile strength, the high compressive capacity and the progressive stiffness degradation observed in masonry [
35] (p. 167).
Furthermore, this approach overcomes some of the limitations of alternative strategies, such as rigid block models or purely elastic analyses, which cannot realistically capture cracking patterns, localised damage evolution, or the cumulative effects of loading [
42] (p. 302). The damage model also allows direct calibration from in situ non-destructive testing and historical construction data, which ensures that the numerical response is closely adapted to the actual behaviour of the church [
35] (p. 172).
Previous studies on monumental buildings of similar typology and scale [
43] confirm the applicability and reliability of this approach for seismic vulnerability assessment of heritage structures. Therefore, far from being a mere extension of methods developed for concrete, the isotropic/orthotropic damage framework is a robust and validated option to capture the nonlinear response of masonry [
44] (p. 929).
This model’s operational simplicity and its variables’ suitability to the case study make it a particularly useful tool for analysing the church’s fabric. The index d indicates the degree of deterioration of the material (0 ≤ d ≤ 1), where zero represents the virgin, undamaged material and one represents deterioration of the resistant area [
28,
29]. As shown in
Figure 22, the material’s stiffness decreases proportionally to (1 – d). Consequently, this index accurately represents the mechanical behaviour of this type of masonry mainly brick and stone. Extending the above relation to the total stress vector gives:
where
D is the elasticity matrix for an isotropic material. For the FEM calculation process, the constitutive matrix of
D′ is calculated as follows [
45]:
To obtain the damage variable at each instant of the loading and deformation process we must evaluate the normal
rn corresponding to the deformation tensor as follows:
where we define
n as the ratio between the uniaxial compressive and tensile strengths of the material, as follows:
In addition, we define
θ as the characterisation of the predominant compressive or tensile behaviour, using the expression:
where the undamaged stresses and the Macaulay function of the undamaged principal stresses are:
It should be noted that the damage begins at the moment when the index
rn exceeds
r0, which is taken as the origin:
The current value of the parameter
r is taken as the historical maximum over the whole loading process, as follows:
and the damage variable at each instant of the loading and deformation process is defined as:
The
r,
r0, and
A values are obtained as Oñate described [
46], where
Gf is defined as the fracture energy per unit area. At the same time, the characteristic length of the domain for each point analysed in the finite element mesh is determined as a function of the volume
V associated with the relevant solid mesh node [
47].
In this study, the integration of non-destructive techniques with the continuous isotropic damage model is complemented by a detailed structural material characterisation campaign, as described in Molines-Cano [
48] (pp. 219–268). This work includes in situ and laboratory tests that determine mechanical parameters and evaluate the homogeneity of the masonry fabric, ensuring that the finite element simulations are based on realistic and site-specific input data. In addition, a sensitivity and calibration study was carried out on the main mechanical parameters of the masonry—compressive and tensile strength and elastic modulus—in order to account for the dispersion of values reported by different authors for similar materials and construction phases.
For example, Mas [
49] (p. 112) identified two distinct types of travertine stone associated with the Gothic and Baroque phases of the church, while Bosch [
50] (p. 998) and Hernández [
51] (p. 157) obtained compressive strengths for analogous Valencian limestones ranging from 22.9 MPa to 66.9 MPa. These values were contrasted with those proposed by Llopis [
41] (p. 173) and Mas-Guindal [
52] (p. 66), who provide complementary characterisations for masonry structures of similar chronology. Based on this heterogeneous dataset, a series of sensitivity analyses were performed [
48] (pp. 219–268) to evaluate the influence of the adopted parameters on the global and local structural response, thereby defining a safe and realistic range of values for the numerical modelling. The calibration demonstrated that low tensile strengths (≈0.1 MPa) produced unrealistic premature collapse mechanisms, whereas moderate increases in tensile capacity or elastic modulus led to results comparable with the actual behaviour of the church, as confirmed by observed deformation patterns and archival data. Therefore, the present analysis cannot be considered merely preliminary, but rather the result of a complete methodology that combines geometric and pathological diagnosis with experimental material characterisation and numerical calibration of the constitutive model.
5.3. Evolution of Design Methods
The increasing complexity of masonry structures has led to a constant evolution of design methods, and especially those using finite elements. Advanced models, such as those proposed by Roca, Cervera and Pelà [
35,
40], make it possible to capture not only the stiffness and strength but also the inelastic dissipation of the material. Other studies, such as those by Mallardo et al. [
53], have analysed the behaviour under long-term cracking, viscoelastic behaviour or the orientation of damage propagation [
54]. This evolution shows a clear trend towards models that increasingly closely reflect the real behaviour of the material.
5.4. Seismic Vulnerability
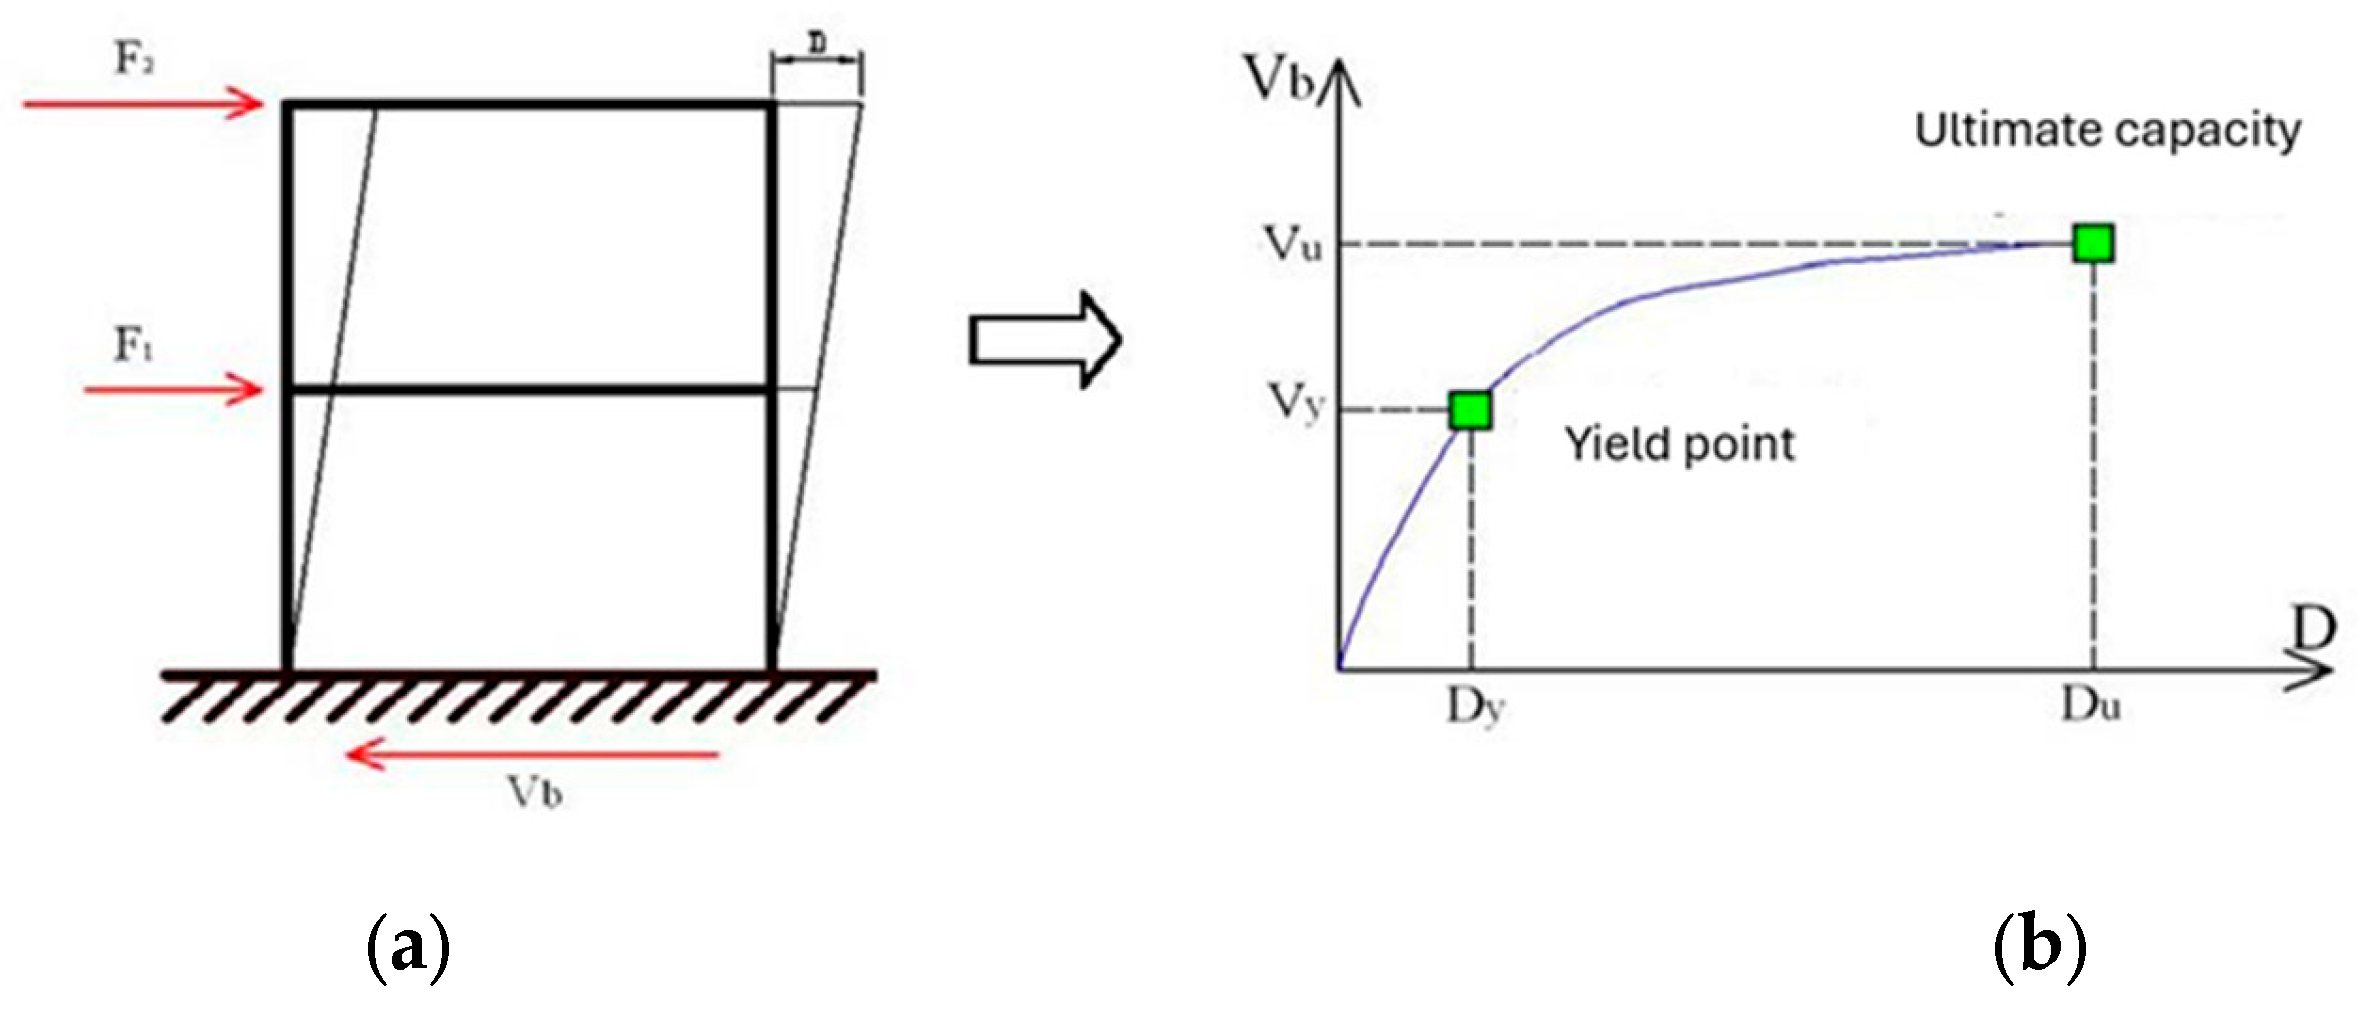
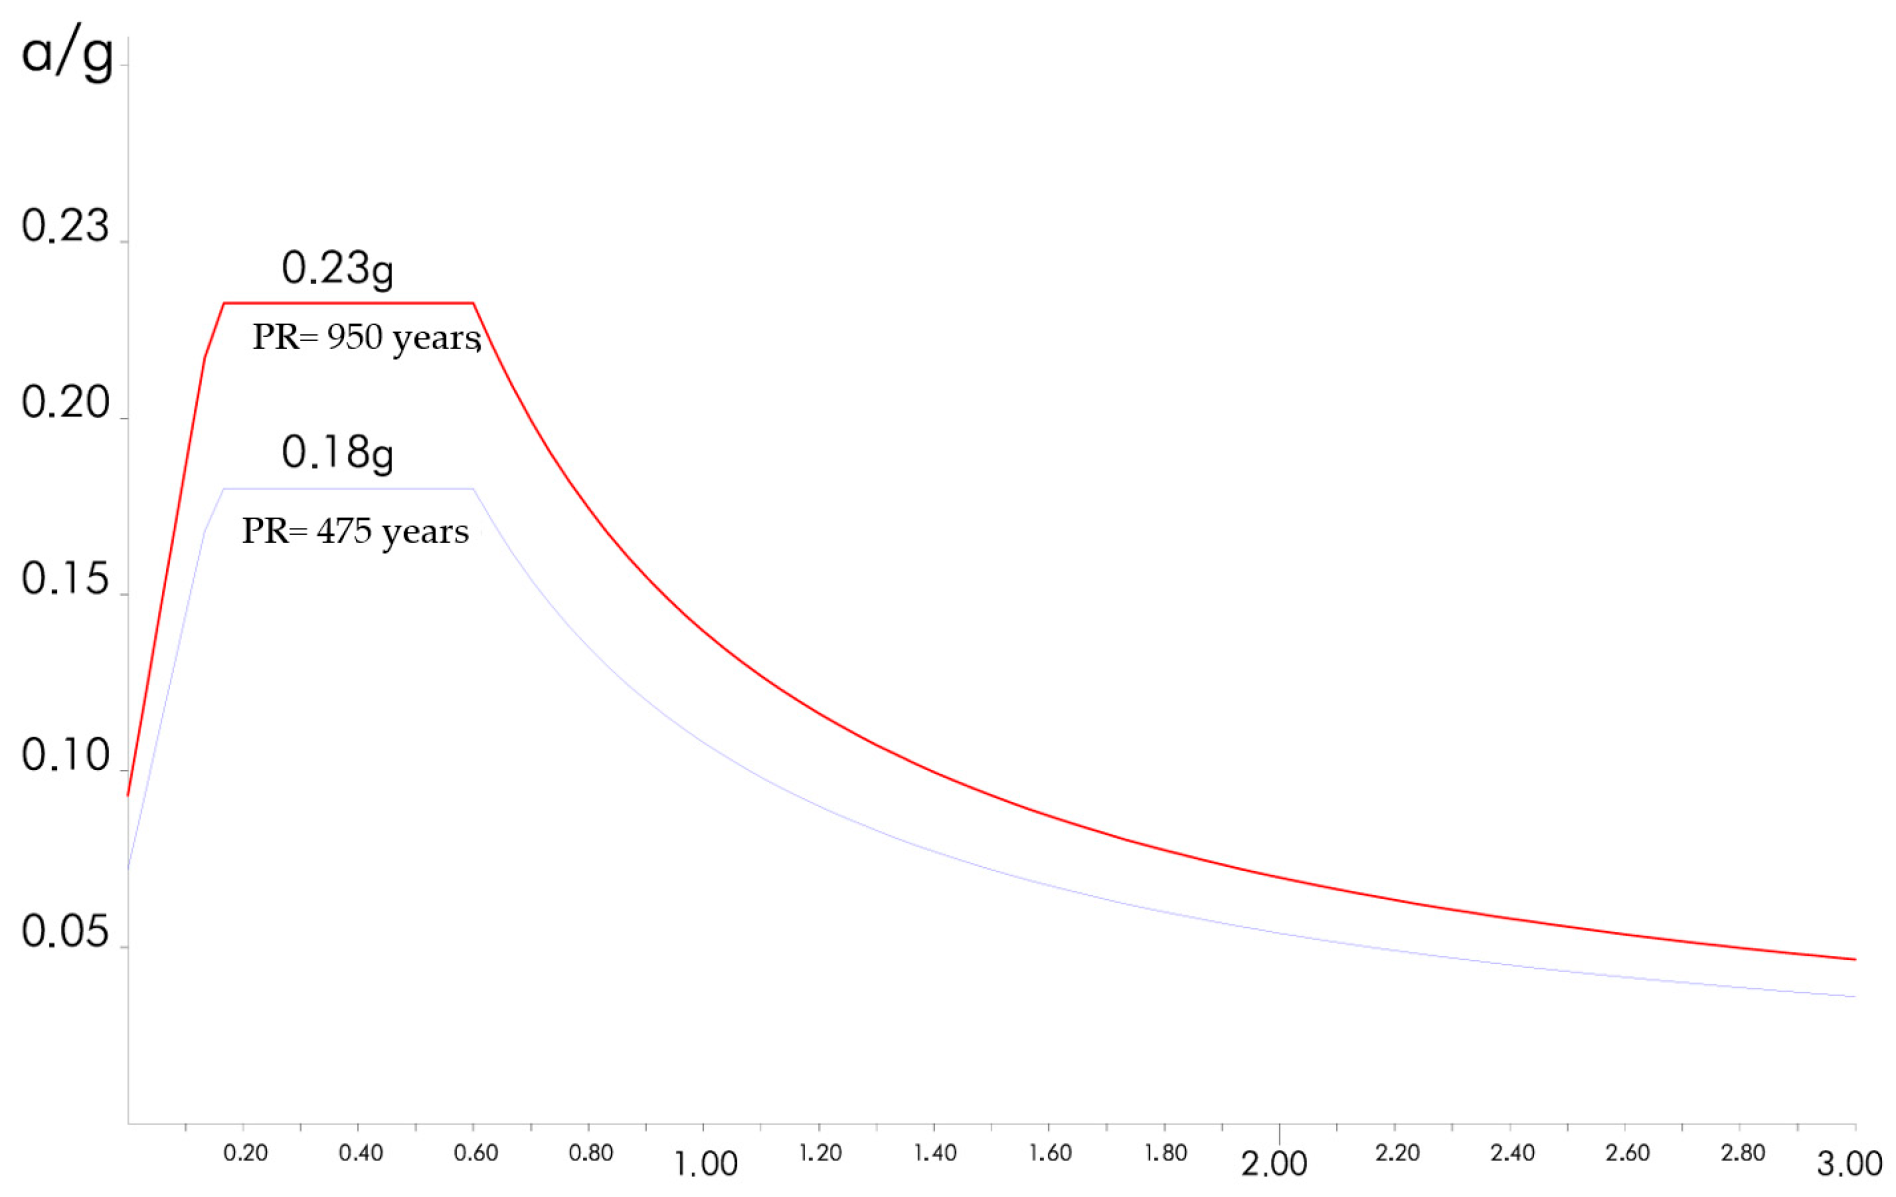
The safety of buildings against earthquakes has been studied using two complementary approaches: nonlinear static (or pushover) analysis and dynamic analysis in the time domain. When integrated in a simulation environment, these methods enable the structural vulnerability of the church to be estimated based on its capacity to respond to seismic spectra, as defined in the NCSE-02 standard for Valencia (
Figure 23).
Similar methodologies have been successfully applied to the seismic assessment of masonry churches, where both nonlinear static and dynamic analyses provide valuable insight into macro-elements’ vulnerability and the identification of local and global collapse mechanisms [
54,
55]. These studies highlight the importance of combining these approaches to capture historical masonry structures’ complex seismic response and inform effective preservation strategies [
56].
Various seismic scenarios have been considered and defined by their return period, i.e., the service (72 years), design (475 years), and maximum (975 years) return periods. The corresponding spectral curves allow us to establish damage thresholds according to the acceleration-displacement (ADRS) format, and to compare the demand with the structural capacity obtained from the model (
Figure 24 and
Figure 25). The definition of the seismic action is based on probabilistic methods. In this study, two seismic events were considered: the design spectrum, which corresponds to a return period of 475 years, and the maximum considered earthquake, which is considered to have a return period of 950 years. The return period represents the average interval of time, expressed in years, between occurrences of an earthquake producing damage of a severity equal to or greater than a specified threshold.
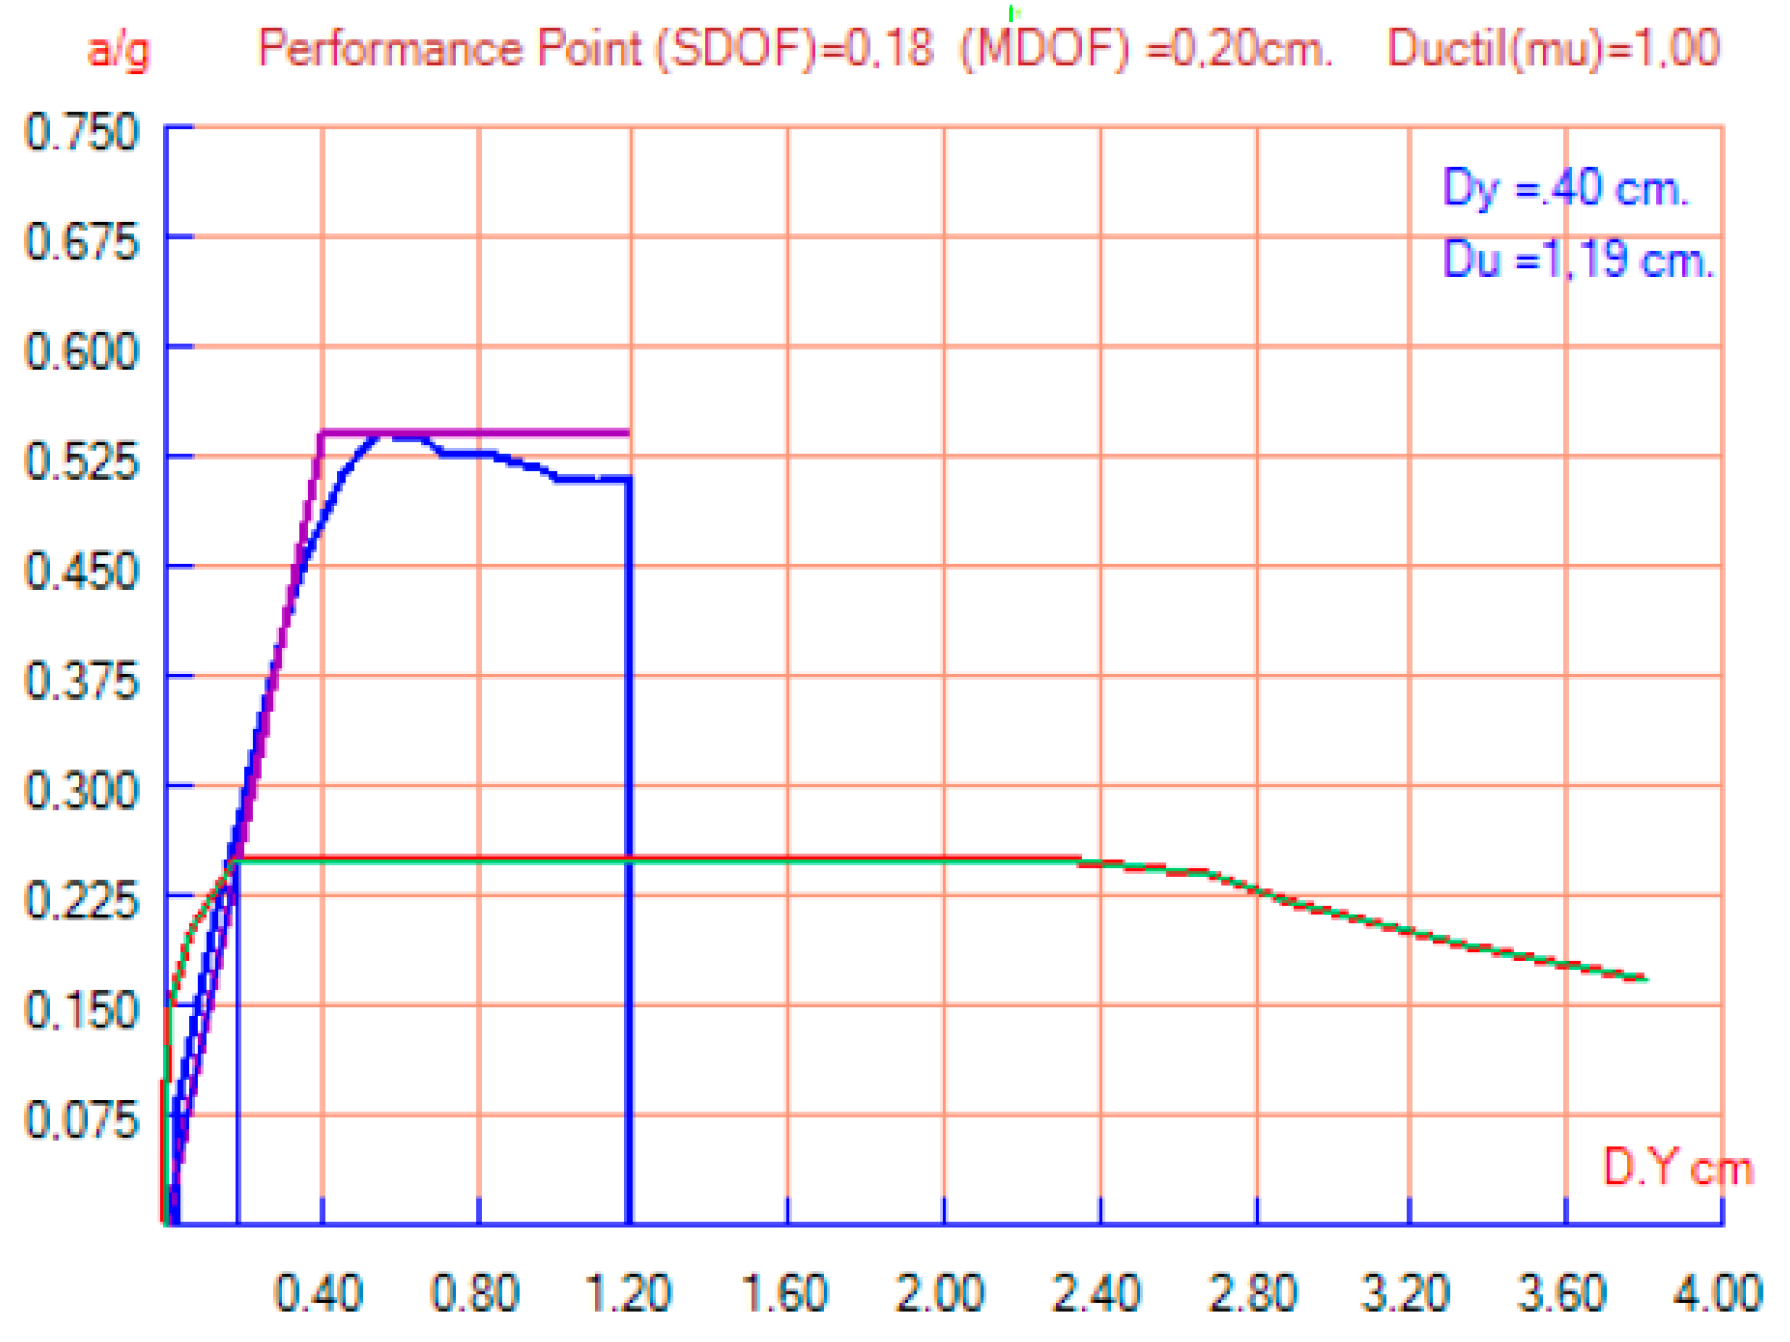
Figure 26 shows the point of intersection between the capacity spectrum and the demand spectrum, which is called the performance point of the structure. This enables the limiting behaviour of the structural elements to be evaluated according to the expected seismic demand.
Several methods can be used to relate the capacity curve and the demand to obtain the performance point [
58]. To enable the demand and capacity curves to be compared, they must be transformed into a homogeneous format called SARD (acceleration-displacement response spectrum), as shown in
Figure 27.
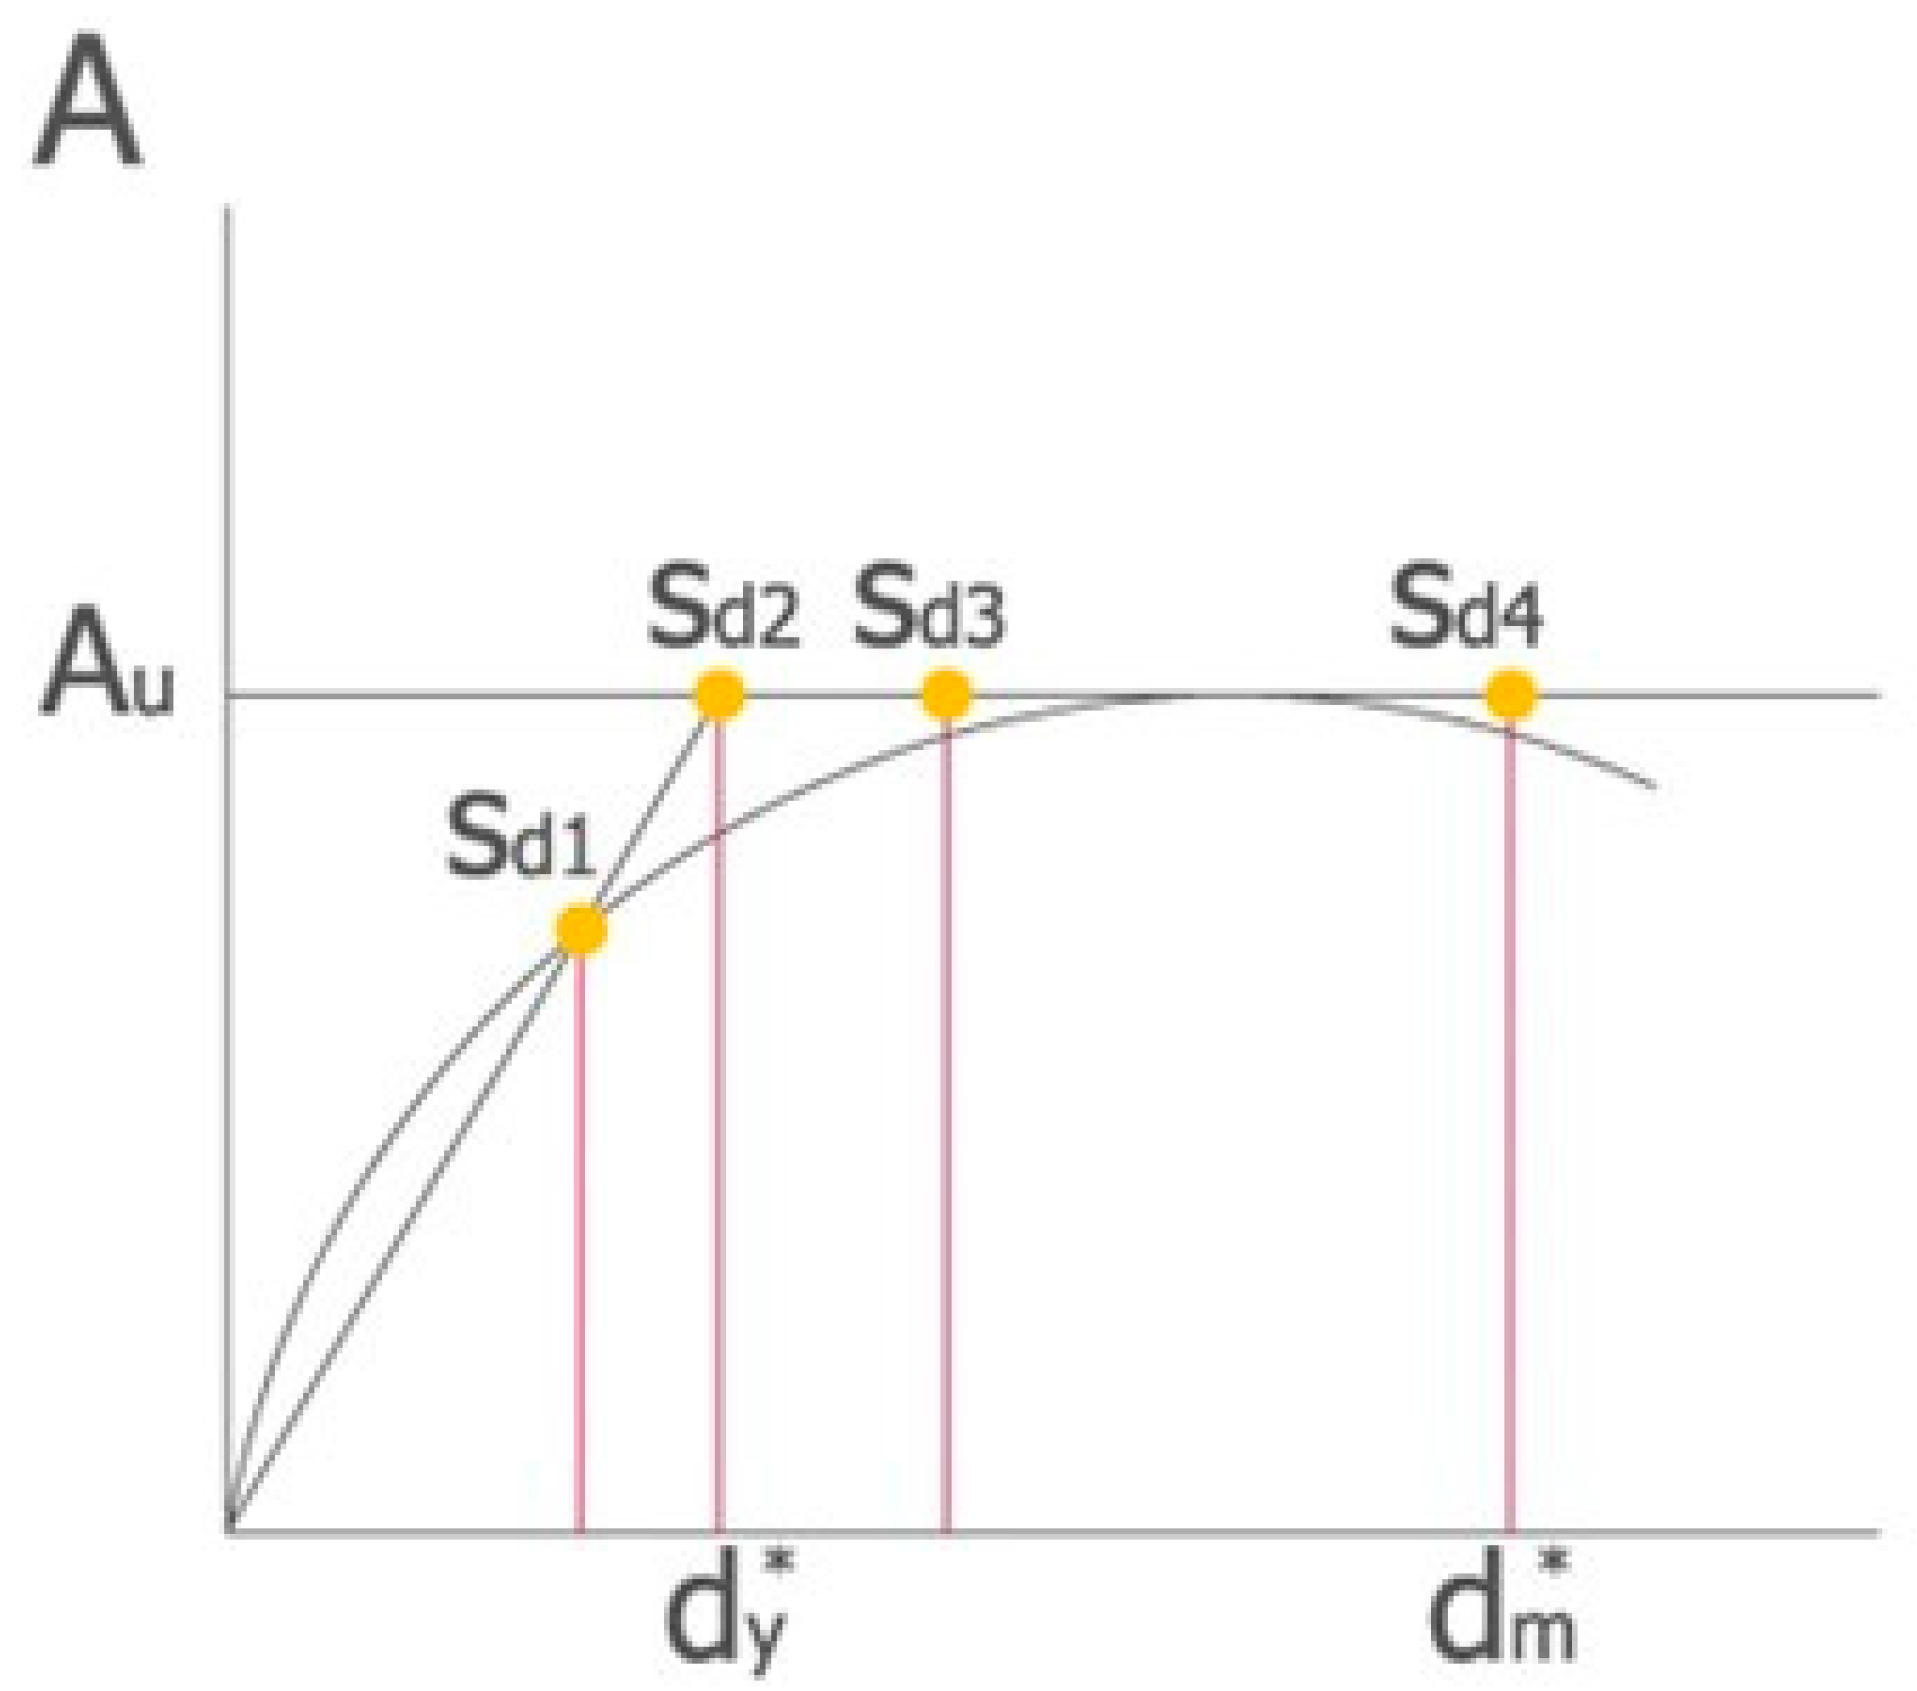
This curve is then simplified into a bilinear plot which must fulfil the following requirements: the areas under the two curves must be the same, the coordinates of the point of maximum displacement must coincide, and the slope of the initial branch must be the same on both curves. The bilinear graph is completely defined by two points that correspond to the spectral displacement (Sd) at the end of the elastic branch (Sd
2) and the spectral displacement at the end of the plastic branch (Sd
4), which form the damage thresholds.
Table 1 shows the classification of damage thresholds more simply and clearly.
The bilinear plot represented in
Figure 26 is completely defined, with two points corresponding to a spectral displacement (Sd
1) at the end of the elastic branch (Sd
2) and a spectral displacement at the end of the plastic branch (Sd
4), which will form the damage thresholds.
6. Comparative Structural Analysis
Once the ashlar masonry that made up the bulk of the church had been characterised (
Figure 3), the focus was on analysing its structural behaviour, with special attention to its response to seismic actions. This analysis was undertaken in part due to growing concern for the conservation of historical heritage sites, especially after events such as the Lorca earthquake in 2011, which highlighted the vulnerability of certain elements of historic churches such as towers, domes or slender walls [
61].
With this objective, a complete digital model of the church of Santos Juanes was developed, implemented in a CAD 2015 environment and exported to the ANGLE (v1) finite element software [
36]. The model accurately reproduced the original configuration of the building and included the Baroque vault, a key element in the evaluation of the overall structural response. The Communion Chapel was excluded from this analysis, as it was outside of the scope defined for this research. To determine the characteristics of the materials, the values listed in
Table 2 (the results of a previous sensitivity and calibration study) were considered.
6.1. Analysis of the Articulated Fixed Structure-Support Model
In order to analyse the structural behaviour of the Santos Juanes church under dynamic actions, a three-dimensional model was developed that faithfully reproduced its current configuration. The model included the central nave, the side chapels, the façades, and the chancel. It was implemented in a CAD 2015 environment for subsequent export to the ANGLE (v1) finite element software [
36], which was used for structural simulation.
For each model, the analysis began with the diagram relating the basal shear to the horizontal deformation. Next, the capacity and demand spectra were evaluated, and the performance point was determined along with the damage thresholds Sd2 (Dy) and Sd4 (Du). The corresponding damage states were defined based on the position of the performance point.
The proposed models were subjected to progressive loading: in the first 10 steps, gravitational loads were applied, while in the next 30 steps, the horizontal earthquake forces were applied according to a modal distribution pattern. For each model, 12 vibration modes were considered.
The Baroque vault, which was added centuries later and is currently visible in the building, was also included in the model. It was represented by two solid brick leaves embedded in the transverse arches, with an oval keystone, in order to evaluate its influence on the overall structural response. The Communion Chapel was excluded, since it fell outside of the scope of the study, which focused on the original Gothic structure.
Two complementary analyses were carried out: a nonlinear static (pushover) analysis and a dynamic analysis in the time domain. In the pushover analysis, which defines the response of the model to seismic action with a return period of 950 years in the Y direction, displacements of approximately 0.20 m were recorded in the elastic range, indicating that no significant damage occurred. The study of vibration modes confirmed the differentiated behaviour of three elements: the bell tower, the main body of the church and the Market Square clock tower. Although the latter has no significant structural effect on the overall stability, it was reinforced at the rear, over the roofs, with diagonal steel profiles against the inner wall of the apse, as documented in the intervention project for this façade.
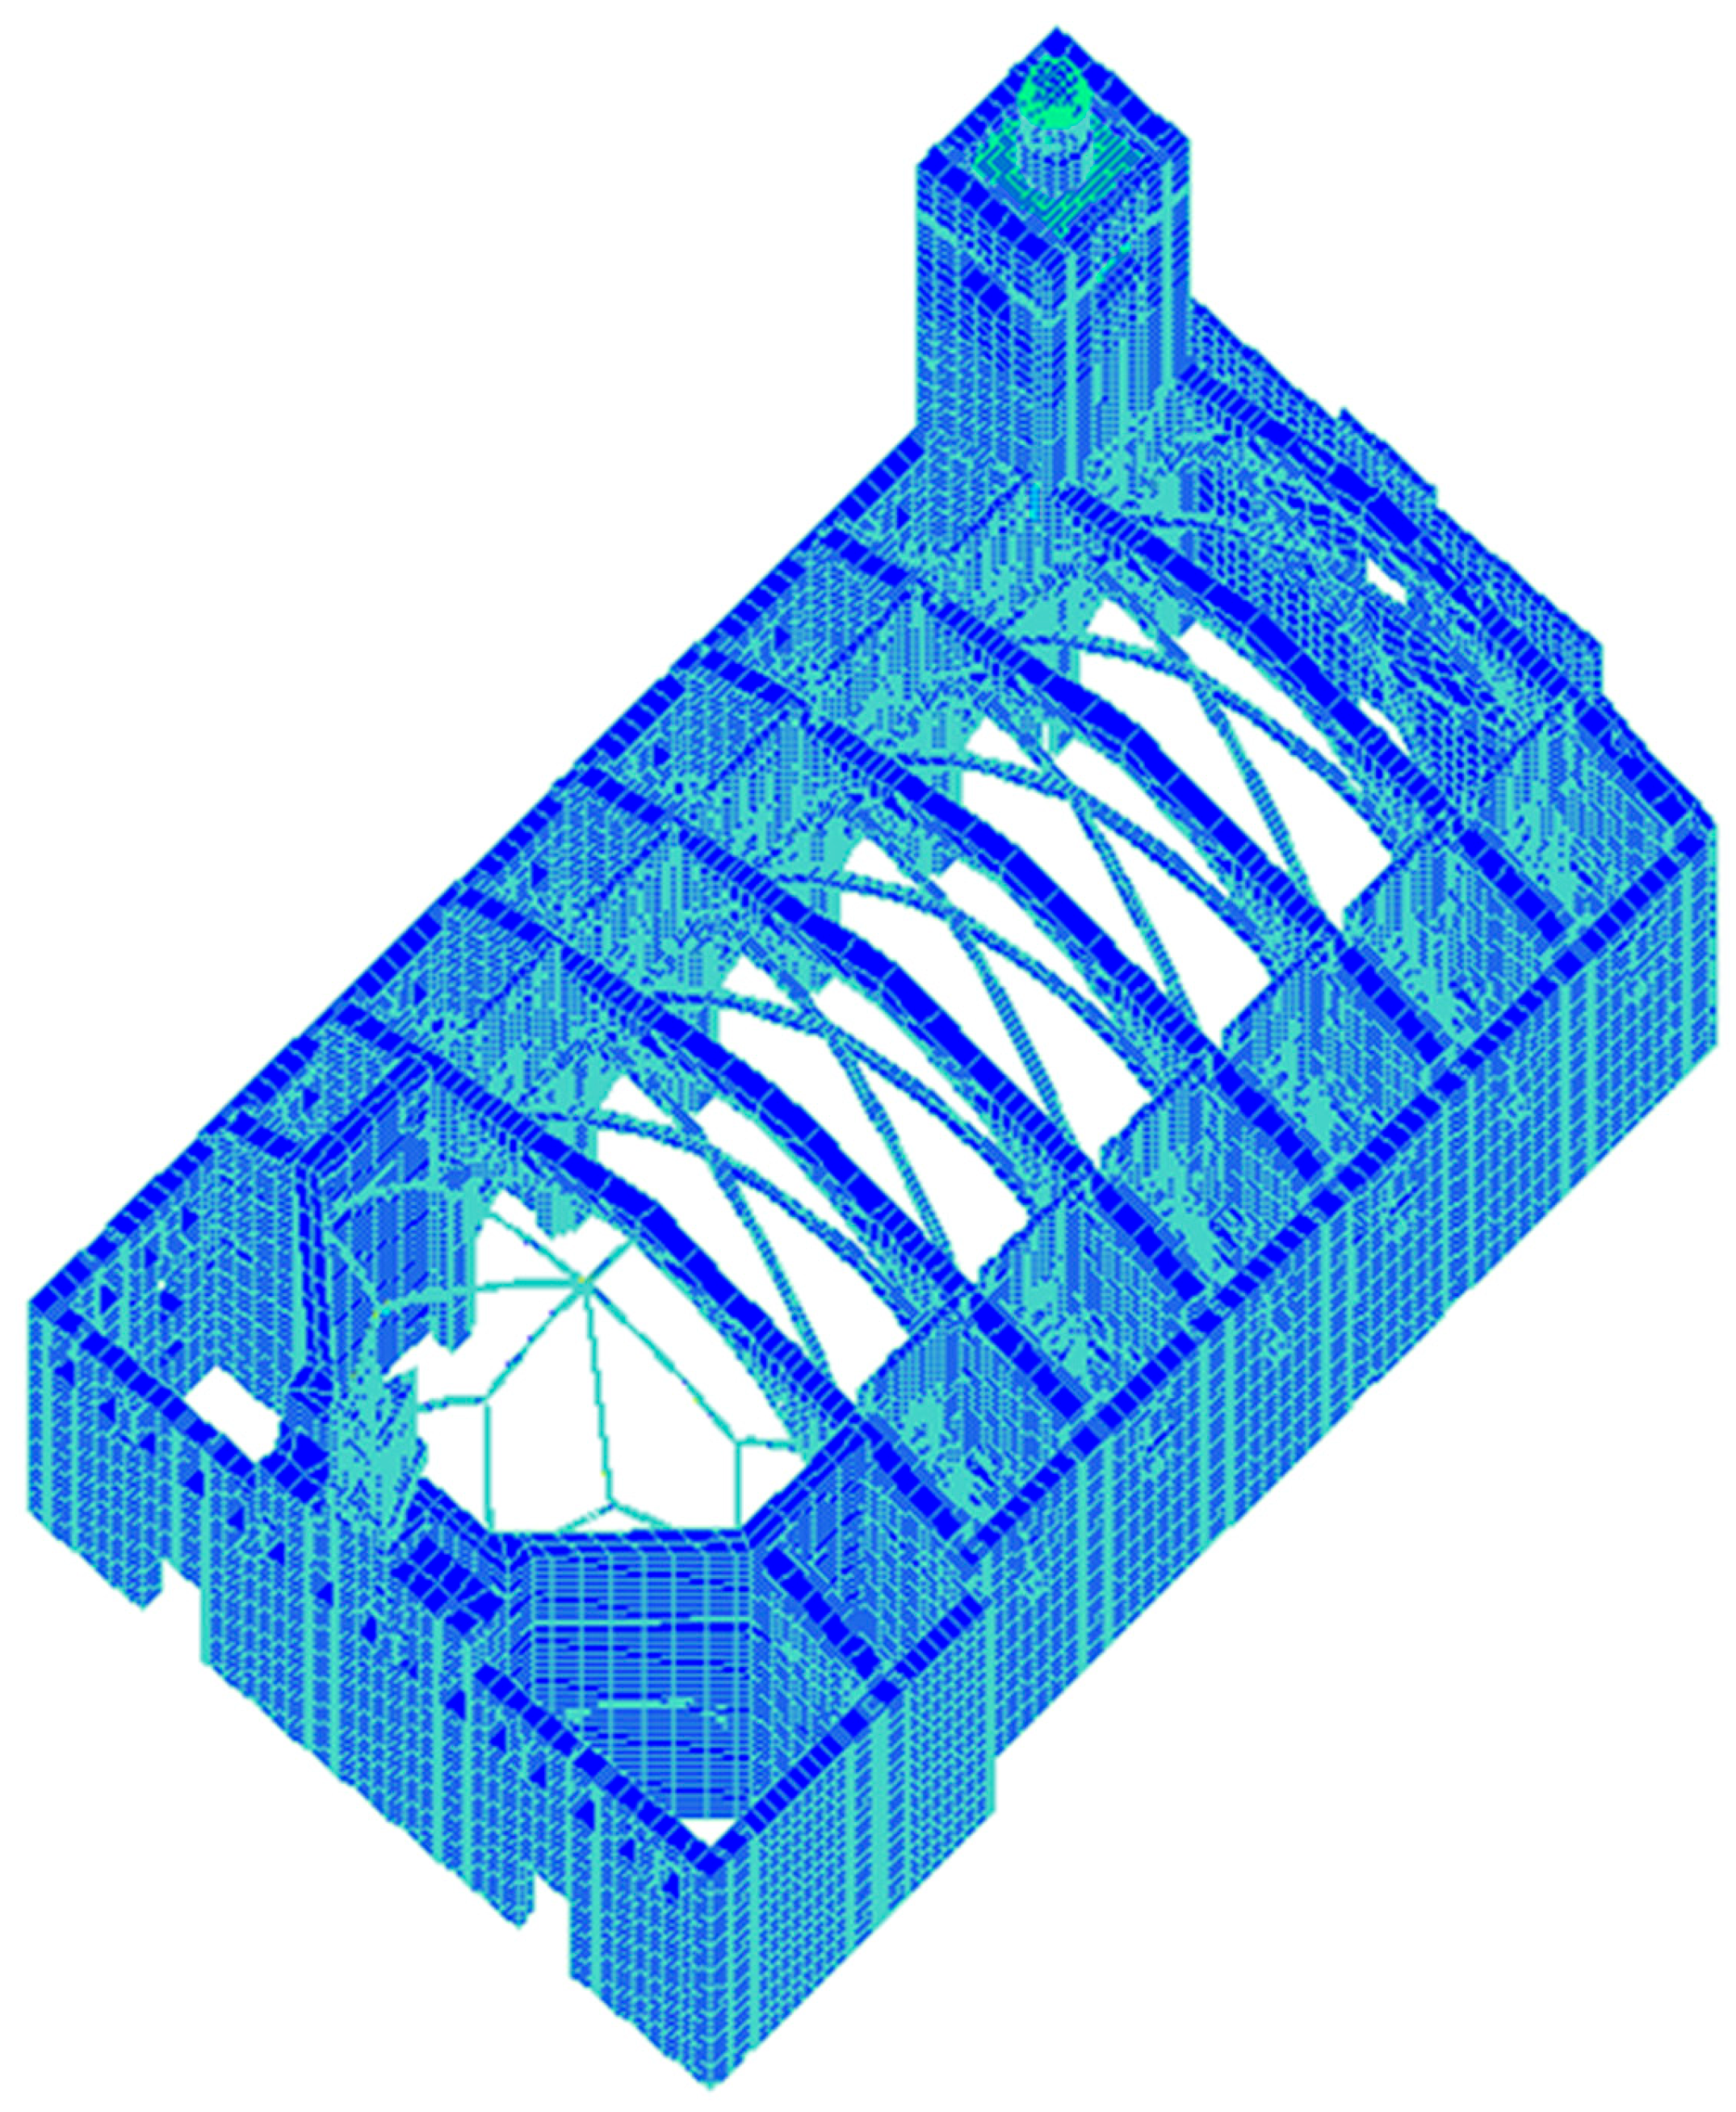
The analysis focused on the model without soil, which consisted of more than 91,000 nodes and 49,000 solids (
Figure 28), and 10 vibration modes were considered. The deformations recorded for the first three modes made it possible to identify differentiated behaviours between the bell tower, the church’s main body, and the Market Square tower. The results confirm a high structural stiffness, with a resistant capacity higher than the seismic demand established for a return period of 950 years (
Figure 29).
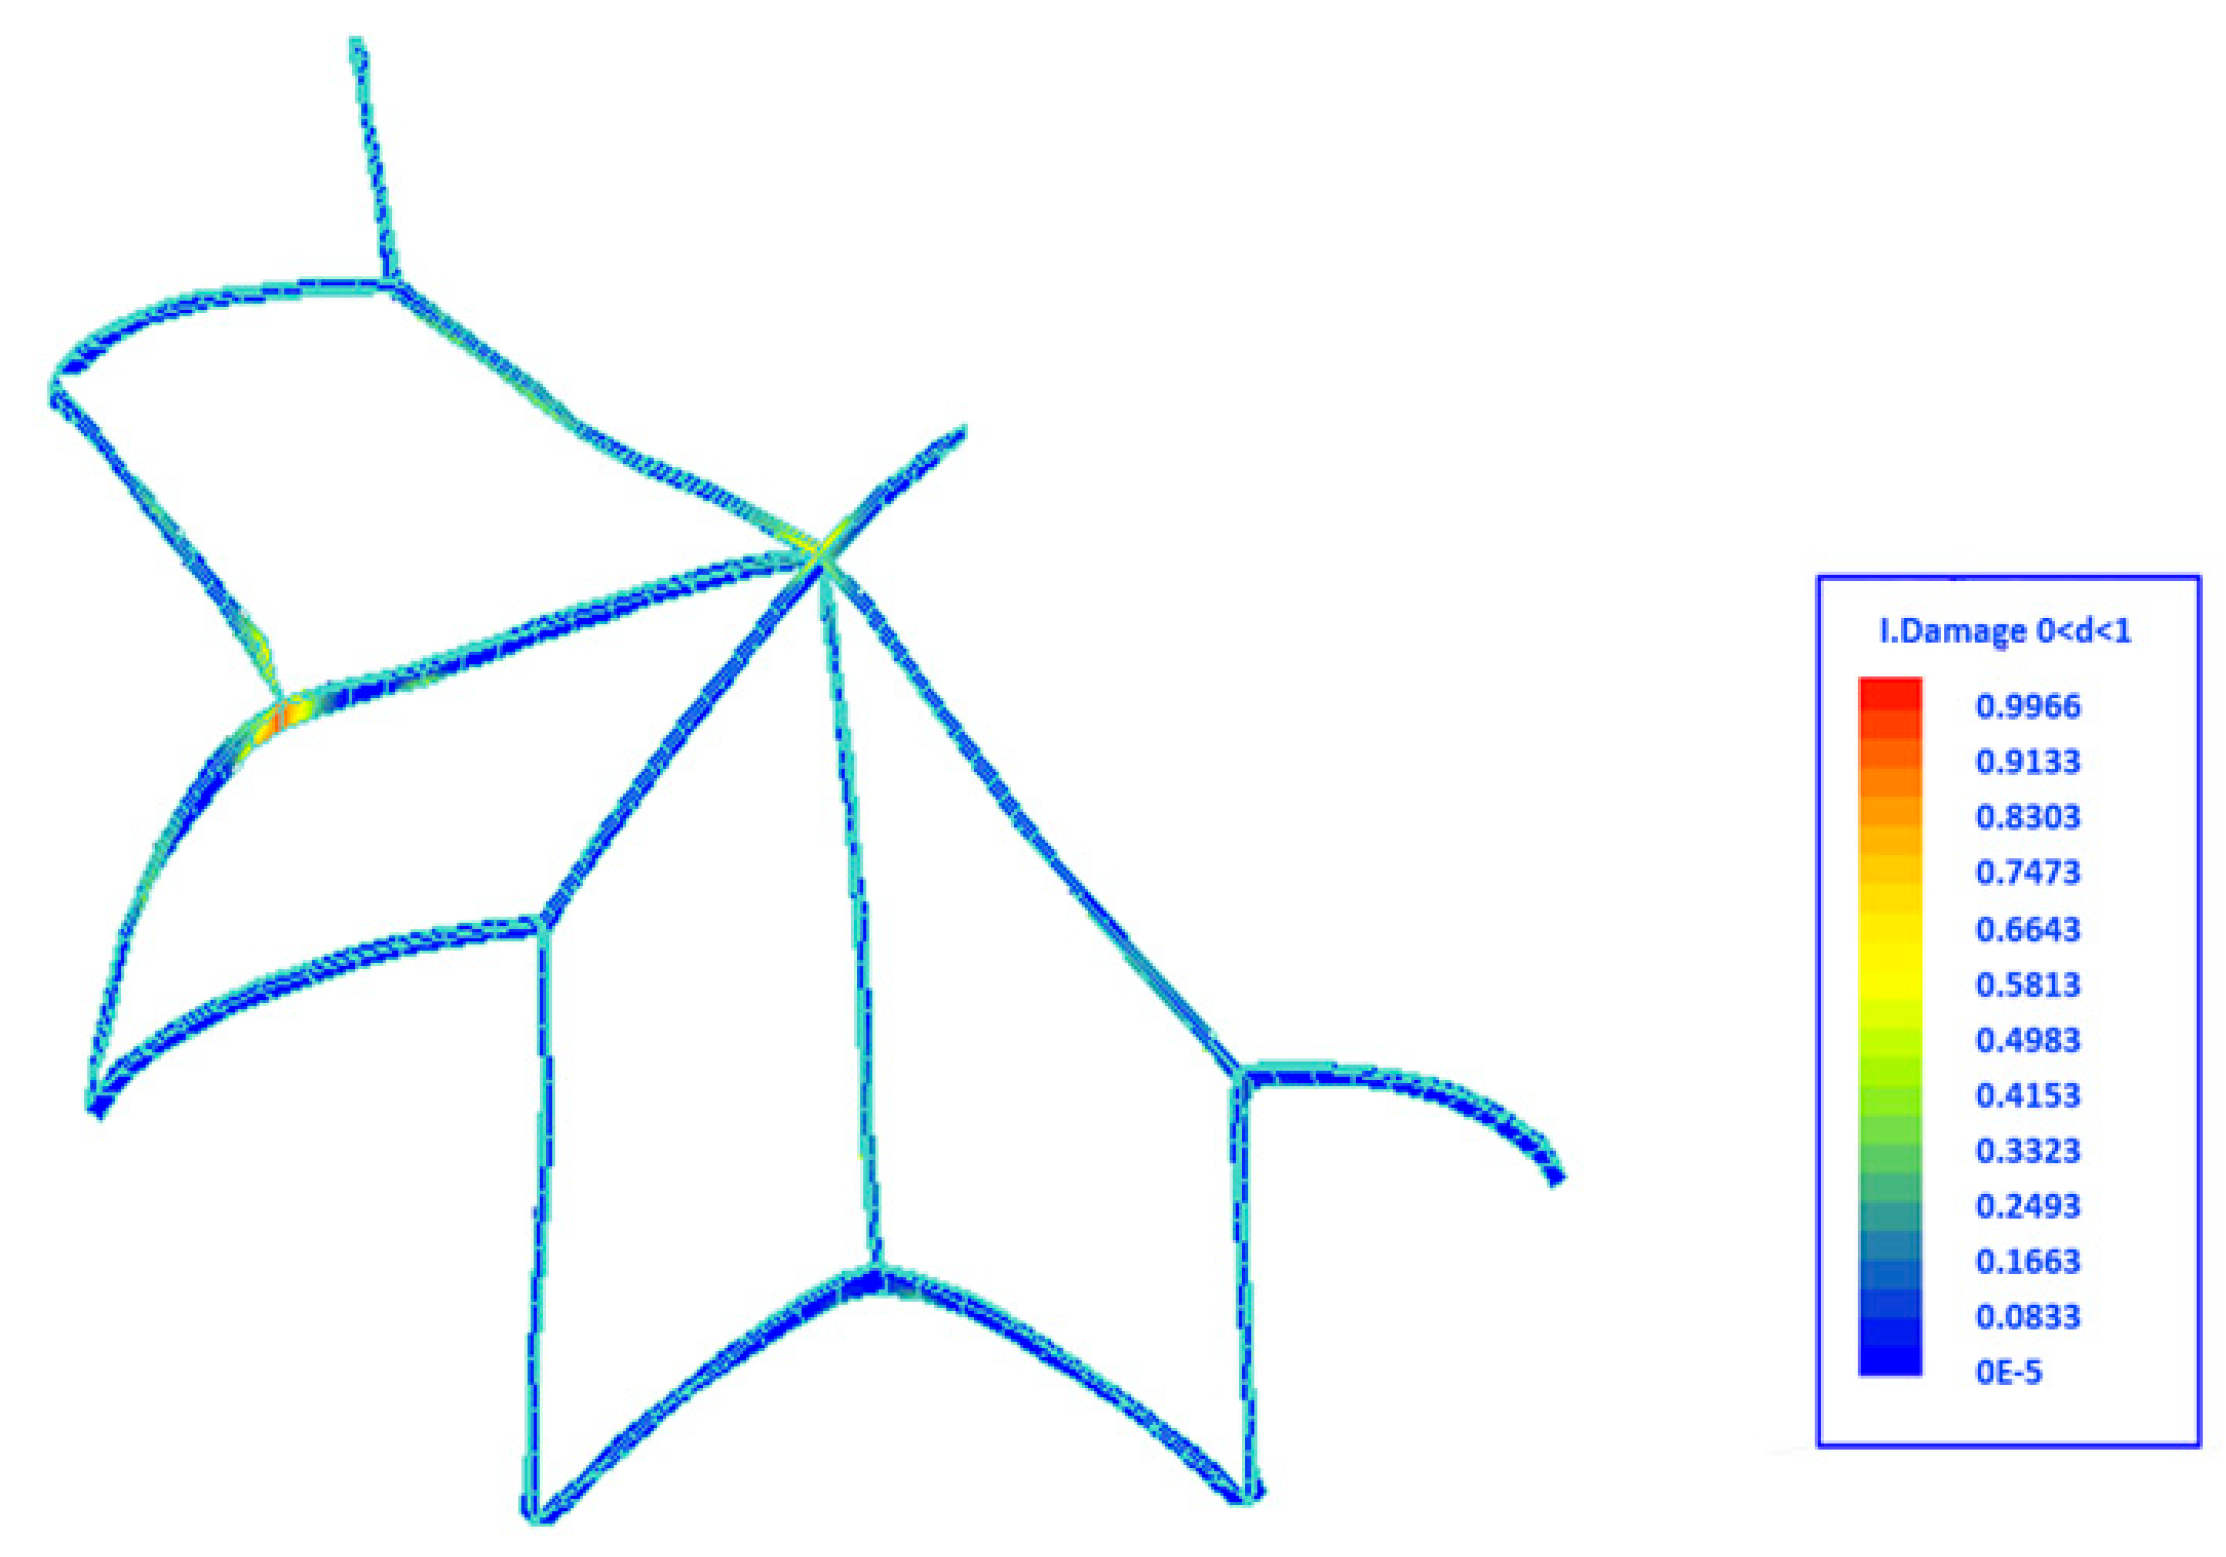
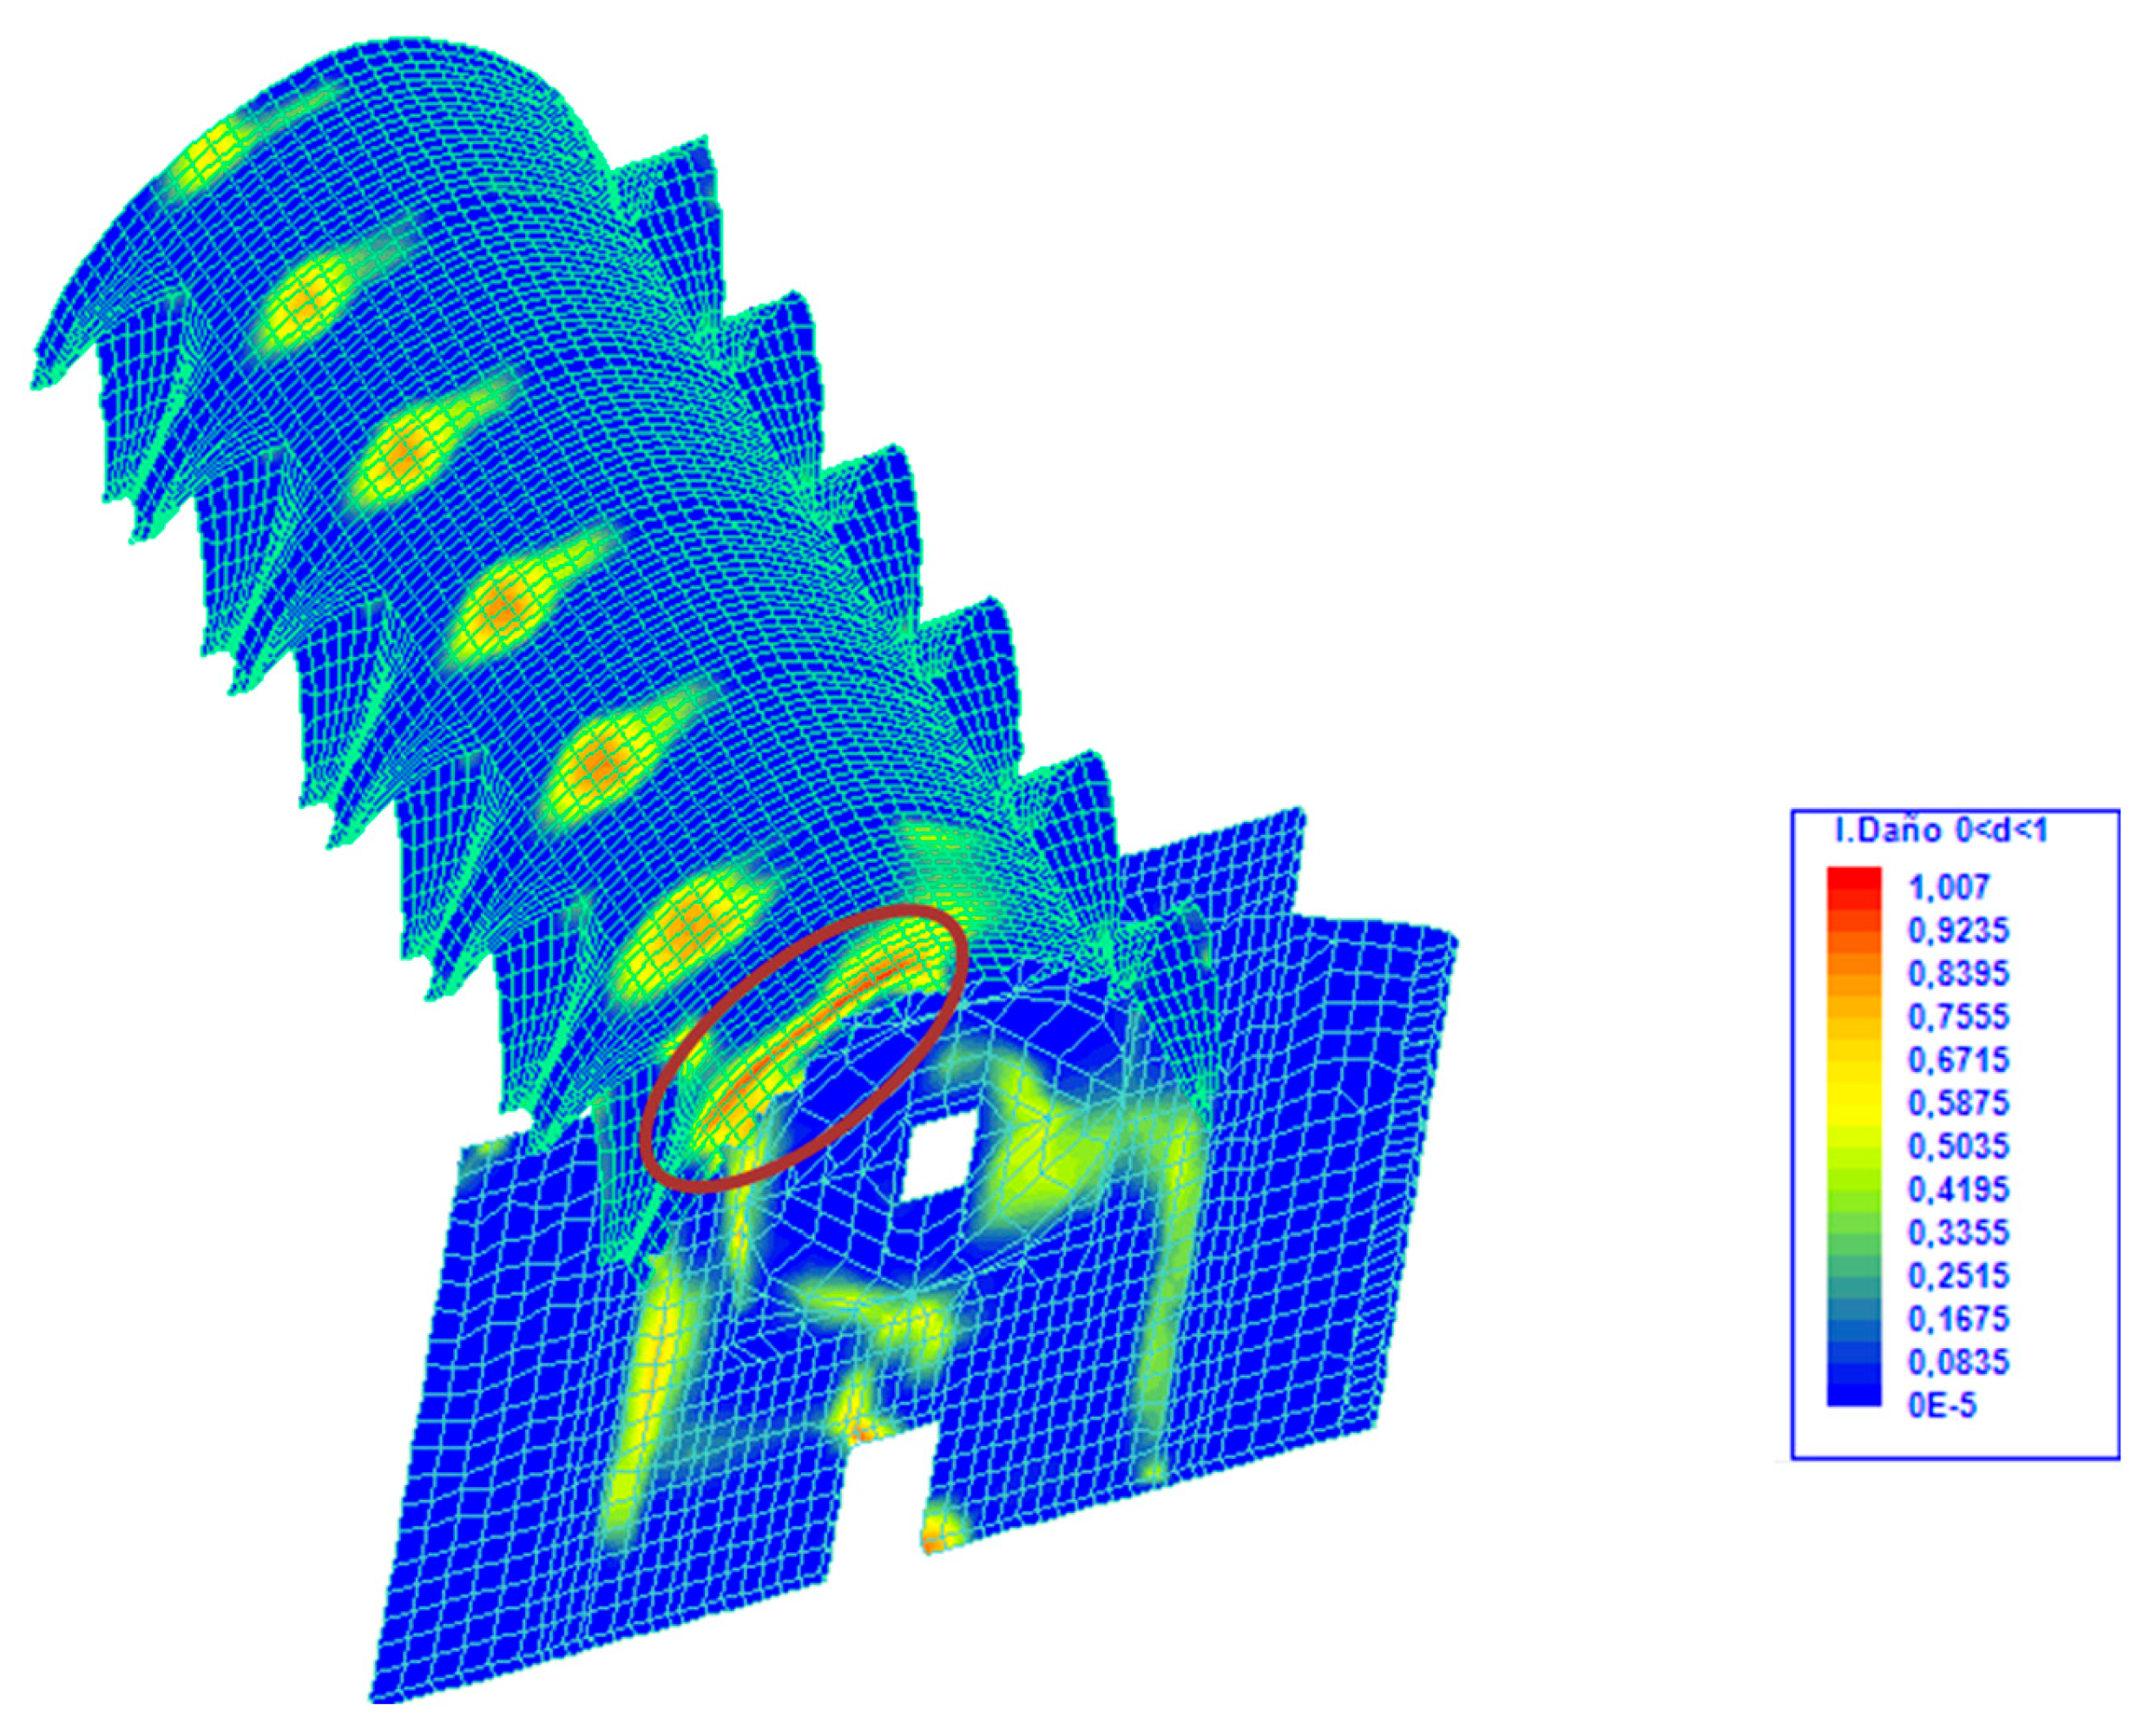
The simulation of the San Juan ‘O’ façade deserves special attention. The pushover analysis indicated the onset of damage in this area at load step 11—corresponding to the completion of gravitational load application and the introduction of a portion of the seismic load—, and the damage index under gravity loads was generally low. However, stress concentrations were observed in specific areas such as the apse ribs (
Figure 30 and
Figure 31), coinciding with the location of a visible crack.
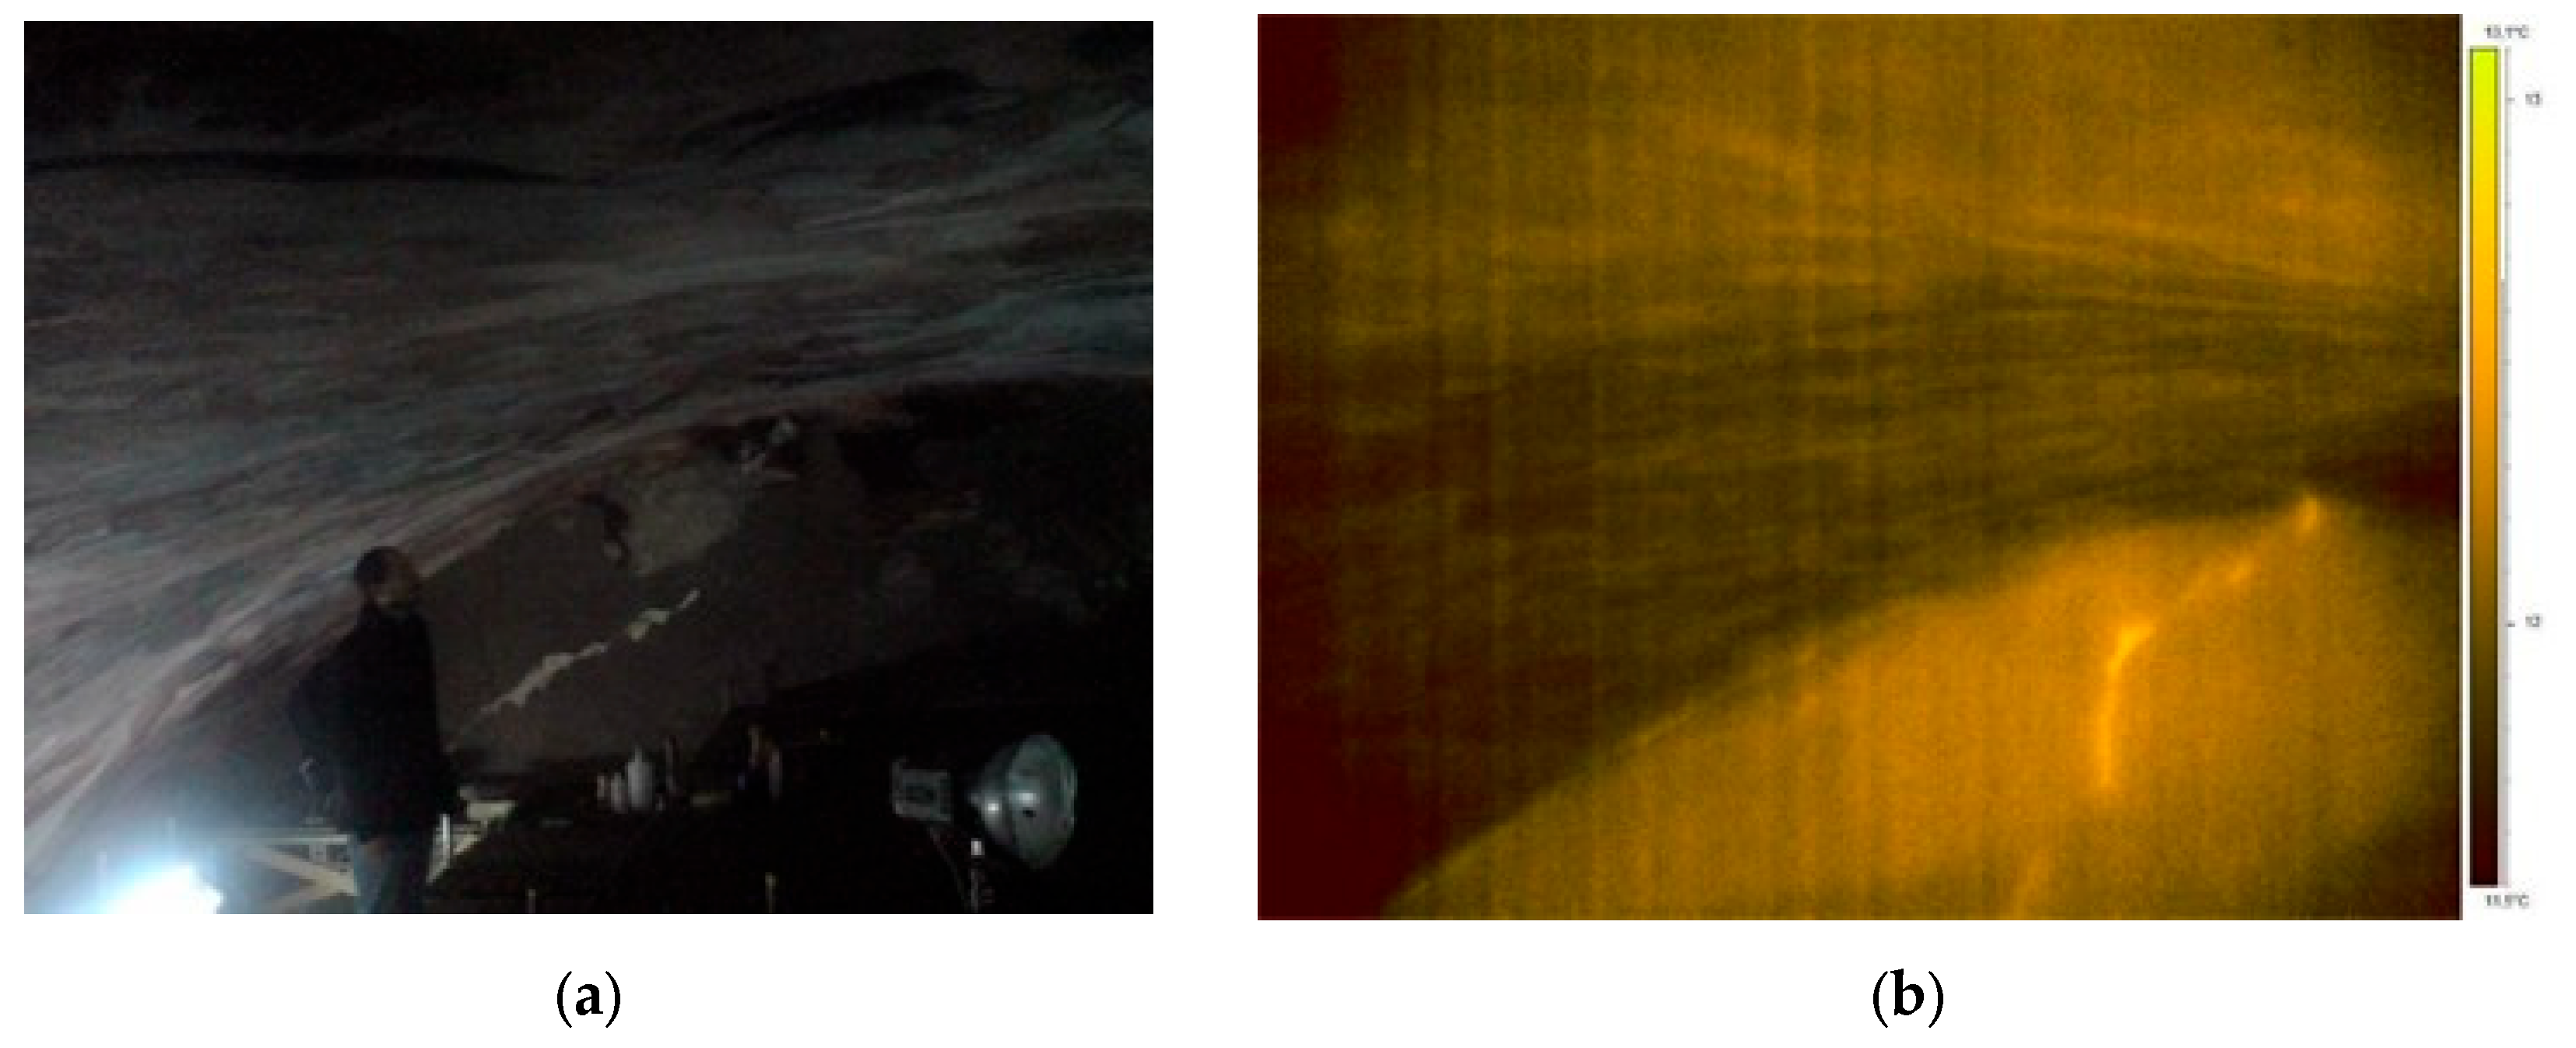
To better understand the nature and extent of this damage, non-destructive methods were employed, particularly infrared thermography, which confirmed the continuity and depth of the crack (
Figure 32). By examining the temperature values shown in the table on the right of
Figure 32b), it can be seen that the crack penetrates the entire thickness of the wall, as the higher interior surface temperatures contrast with the heat loss occurring through the weakened section.
Structural modelling further supported this diagnosis, which identified the bell tower as the main source of vulnerability due to its slenderness and elevated position, a finding later confirmed by the dynamic time-history analysis described below. As a preventive measure, plaster cores were installed on the affected façade to monitor the crack’s progression over time. This confirmed that the proposed hypothesis and the results obtained were consistent with the actual condition of the structure.
The time-history analysis results once again highlighted the vulnerability of the bell tower compared to the rest of the building. The slenderness of the belfry, supported by the older structure of the temple, led—as already anticipated in the preliminary studies—to damage the surrounding area, particularly affecting the façade of the “O” of San Juan. The structure experienced failure at the bell tower, as shown in
Figure 33, at 2.56 s into the simulation for an earthquake with a return period of 950 years.
6.2. Soil-Structure Interaction Analysis
In a traditional structural evaluation of buildings, it is usually assumed that the foundations act as rigid or embedded supports, on which the structure is modelled in order to calculate the stresses and verify whether the stresses transmitted to the ground are permissible [
62] (p. 47). However, this approach ignores the fact that the actual behaviour of the soil rarely conforms to this ideal. The deformability of the subsoil may cause these supports to behave more like joints than embedments, significantly altering the structural response of the whole.
Unlike conventional methods, current advanced tools enable the user not only to analyse the behaviour of the resistant skeleton but also to integrate the response of the soil itself into the calculations. This integration becomes especially relevant in the case of historic buildings, where the construction process has been prolonged and conditioned by intermediate phases, transformations and irregular loads. However, accurate modelling of the soil remains a complex task, due to its inherent heterogeneity.
Many studies have analysed the soil–foundation interaction using both planar and spatial frames, which have been conducted by authors such as Grasshoff [
63], Sommer [
64], Noorzarei et al. [
65], Hain et al. [
66] and Viladkar et al. [
67]. However, studies with a focus on heritage buildings are scarcer. One of the most relevant was carried out by Roca et al. [
68], who analysed the deformations of the Cathedral of Mallorca, attributing them to the joint influence of differential ground settlement and factors such as material creep and the construction process’s duration.
In this context, and with the aim of assessing the impact of the ground on the structure of the Church of Santos Juanes, we performed a comparative analysis of two models: one with rigid supports and the other with explicit modelling of the subsoil. The aim was to evaluate how the stresses, deformations and damage index varied, with special attention to the façade of the Cemetery of San Juan Square, one of the most vulnerable areas of the church.
To define the terrain, we used the three geotechnical borings documented by Estellés in his 1986 intervention [
2] and the stratigraphic sections obtained by georadar in this investigation. From these data, a three-dimensional model of the subsoil was constructed, which was integrated into the ANGLE (v1) calculation environment [
36] together with the structural model used in previous analyses.
The subsoil was classified into four major lithological types characteristic of the city of Valencia: fills, clayey silts, silty sands, and silty gravels with sands. The compressive strength values and the standard penetration test (NSPT) results were used to characterise these. For clayey silts, the modulus of elasticity was obtained from the compressive strength, according to the procedure established in the Technical Building Code (CTE), as follows:
where
α was extracted from Table F.2 of DB-SE-C [
69], based on the over-consolidation range, which is assumed to be less than three in this case.
For fills, sands and gravels, the results of a standard penetration test and the relation proposed by Denver [
70] were used to obtain the modulus of elasticity as follows:
Given the impossibility of precisely defining the Poisson’s coefficient, values of between 0.3 and 0.4 were taken, as recommended in the literature, and more specifically in Table D.24 of DB-SE-C (Note: This table is entitled “Indicative values of Poisson’s coefficient”.).
The values used for the model are summarised in
Table 3 below.
When these parameters had been defined, the calculation model was created, which allowed for a more rigorous analysis of the behaviour of the church under gravity loads, and took into account the deformability of the subsoil. This approach provided a more realistic view of the whole building, which is a key aspect of proper structural conservation. In addition, the model was enriched with data obtained from non-destructive methods, especially by georadar, whose contribution was fundamental in delimiting the composition and stratification of the ground on which the church sits with greater precision.
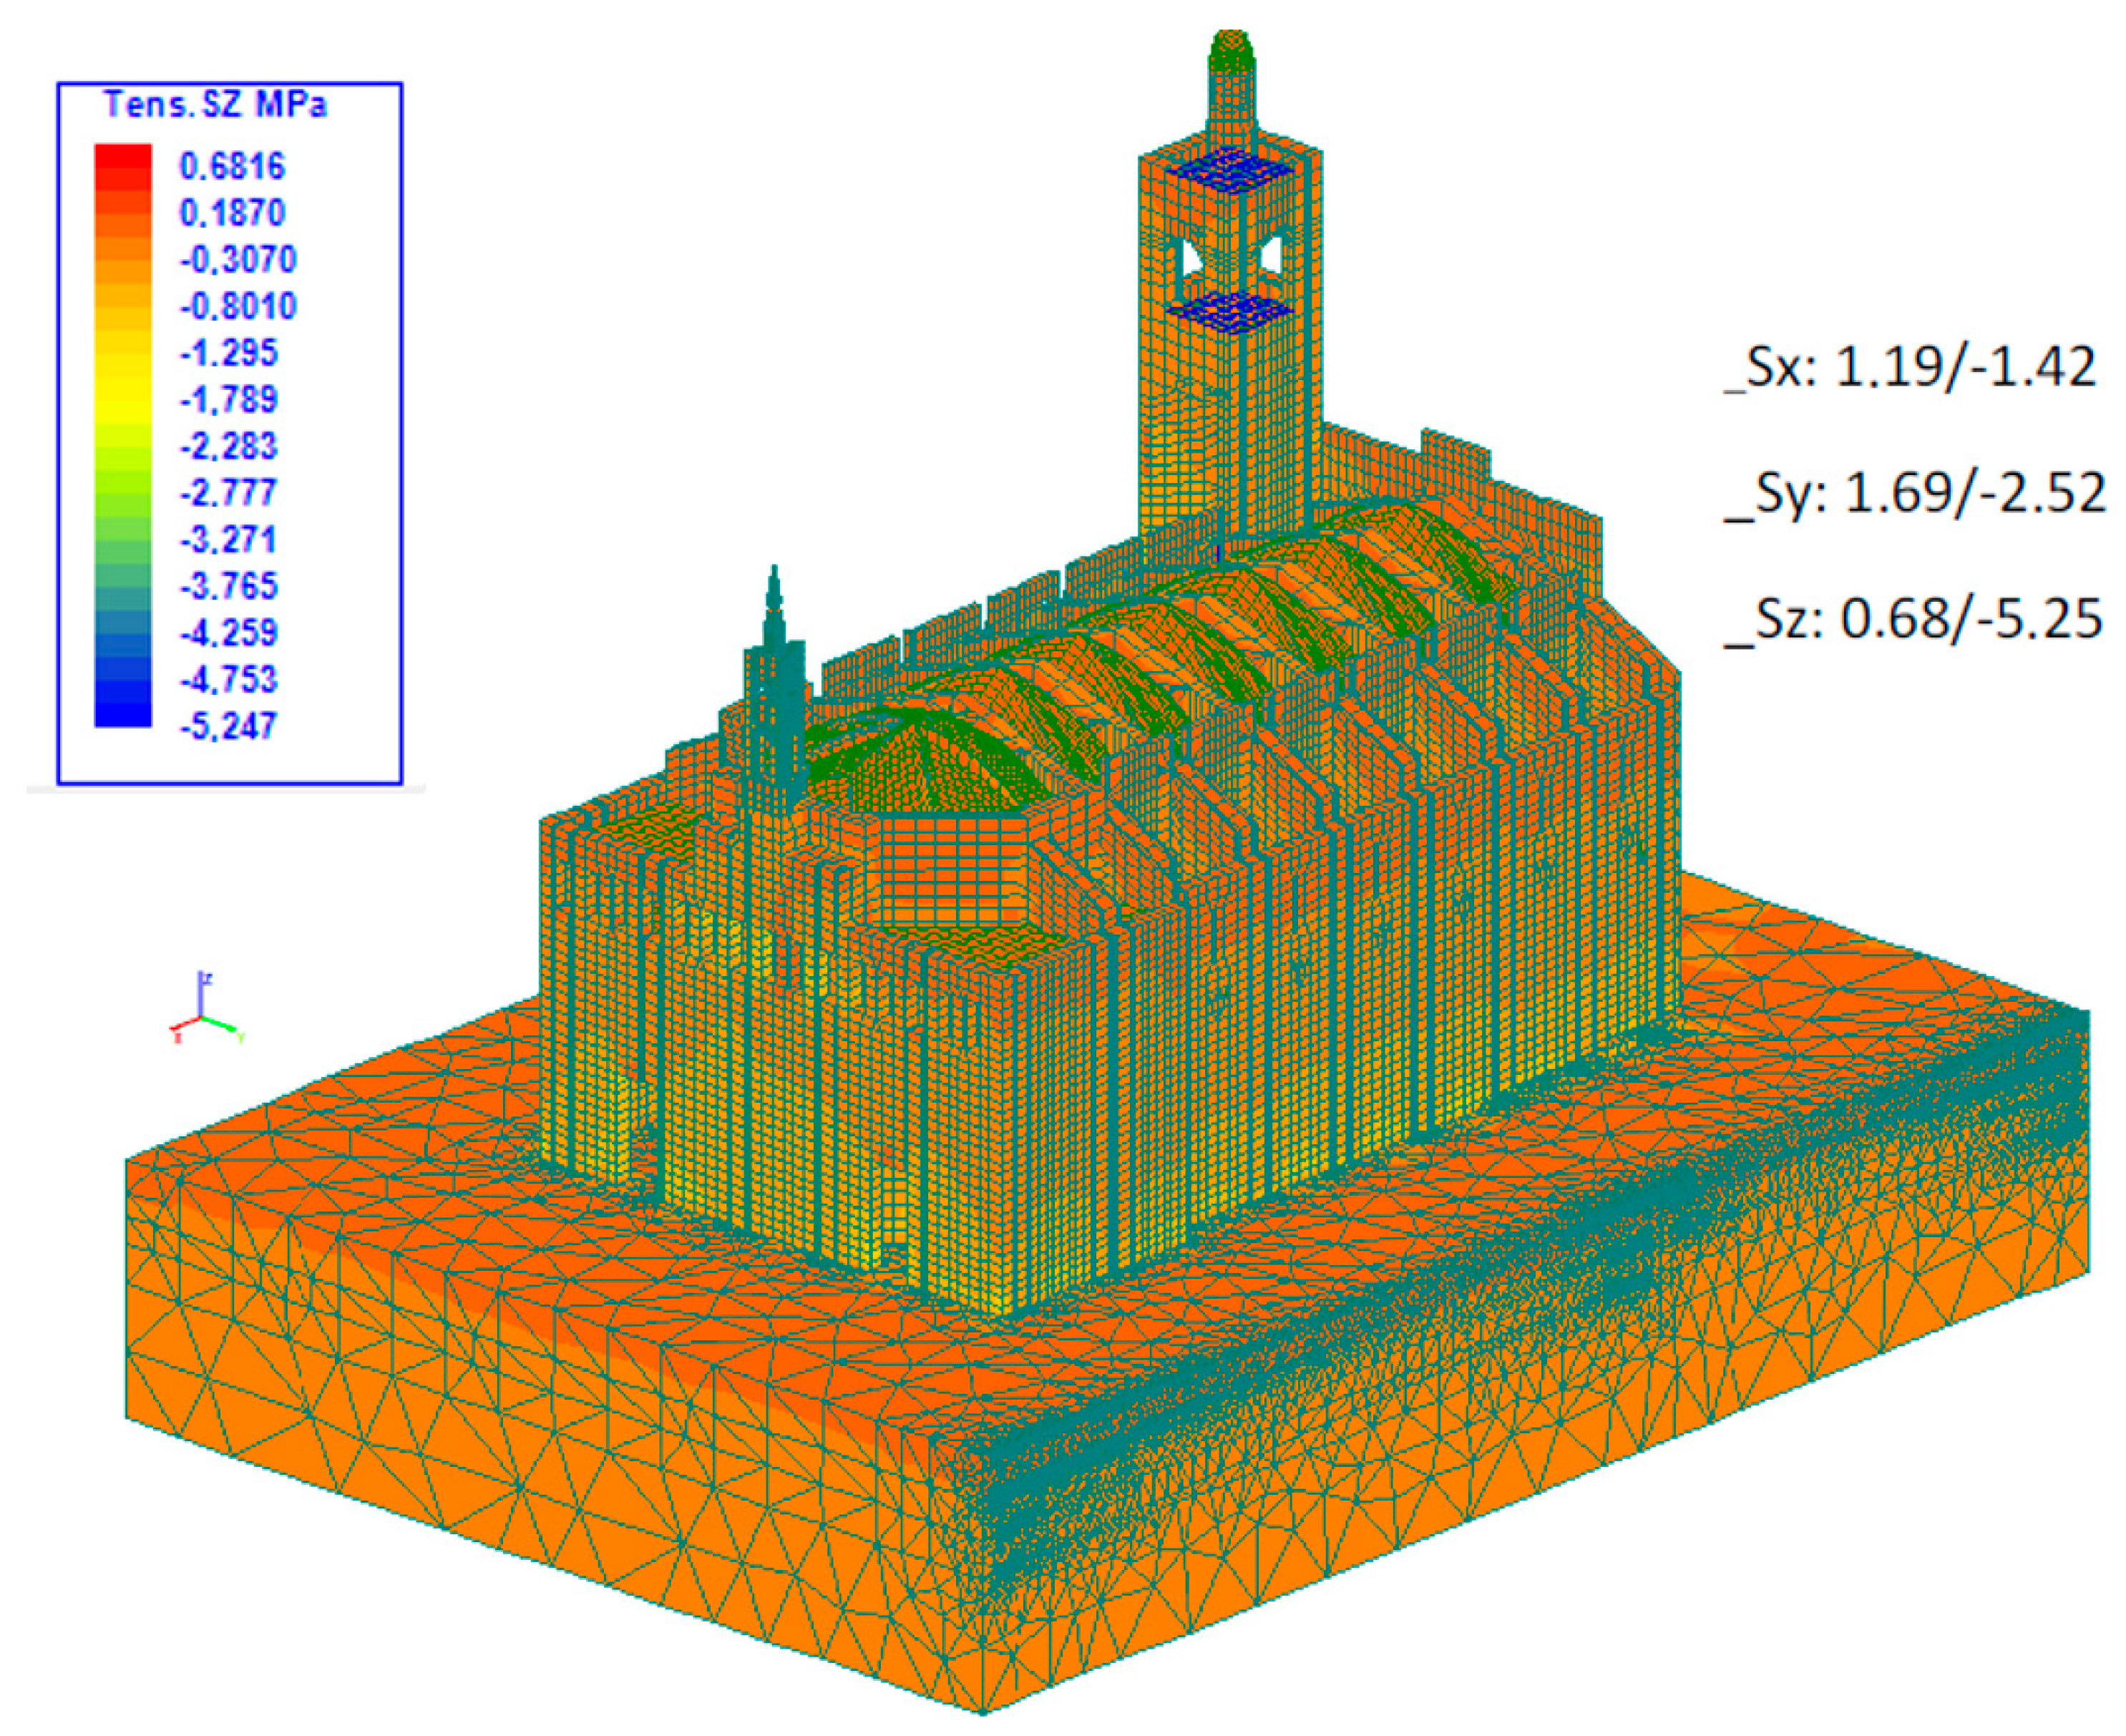
In this model, which takes into account the soil characteristics (
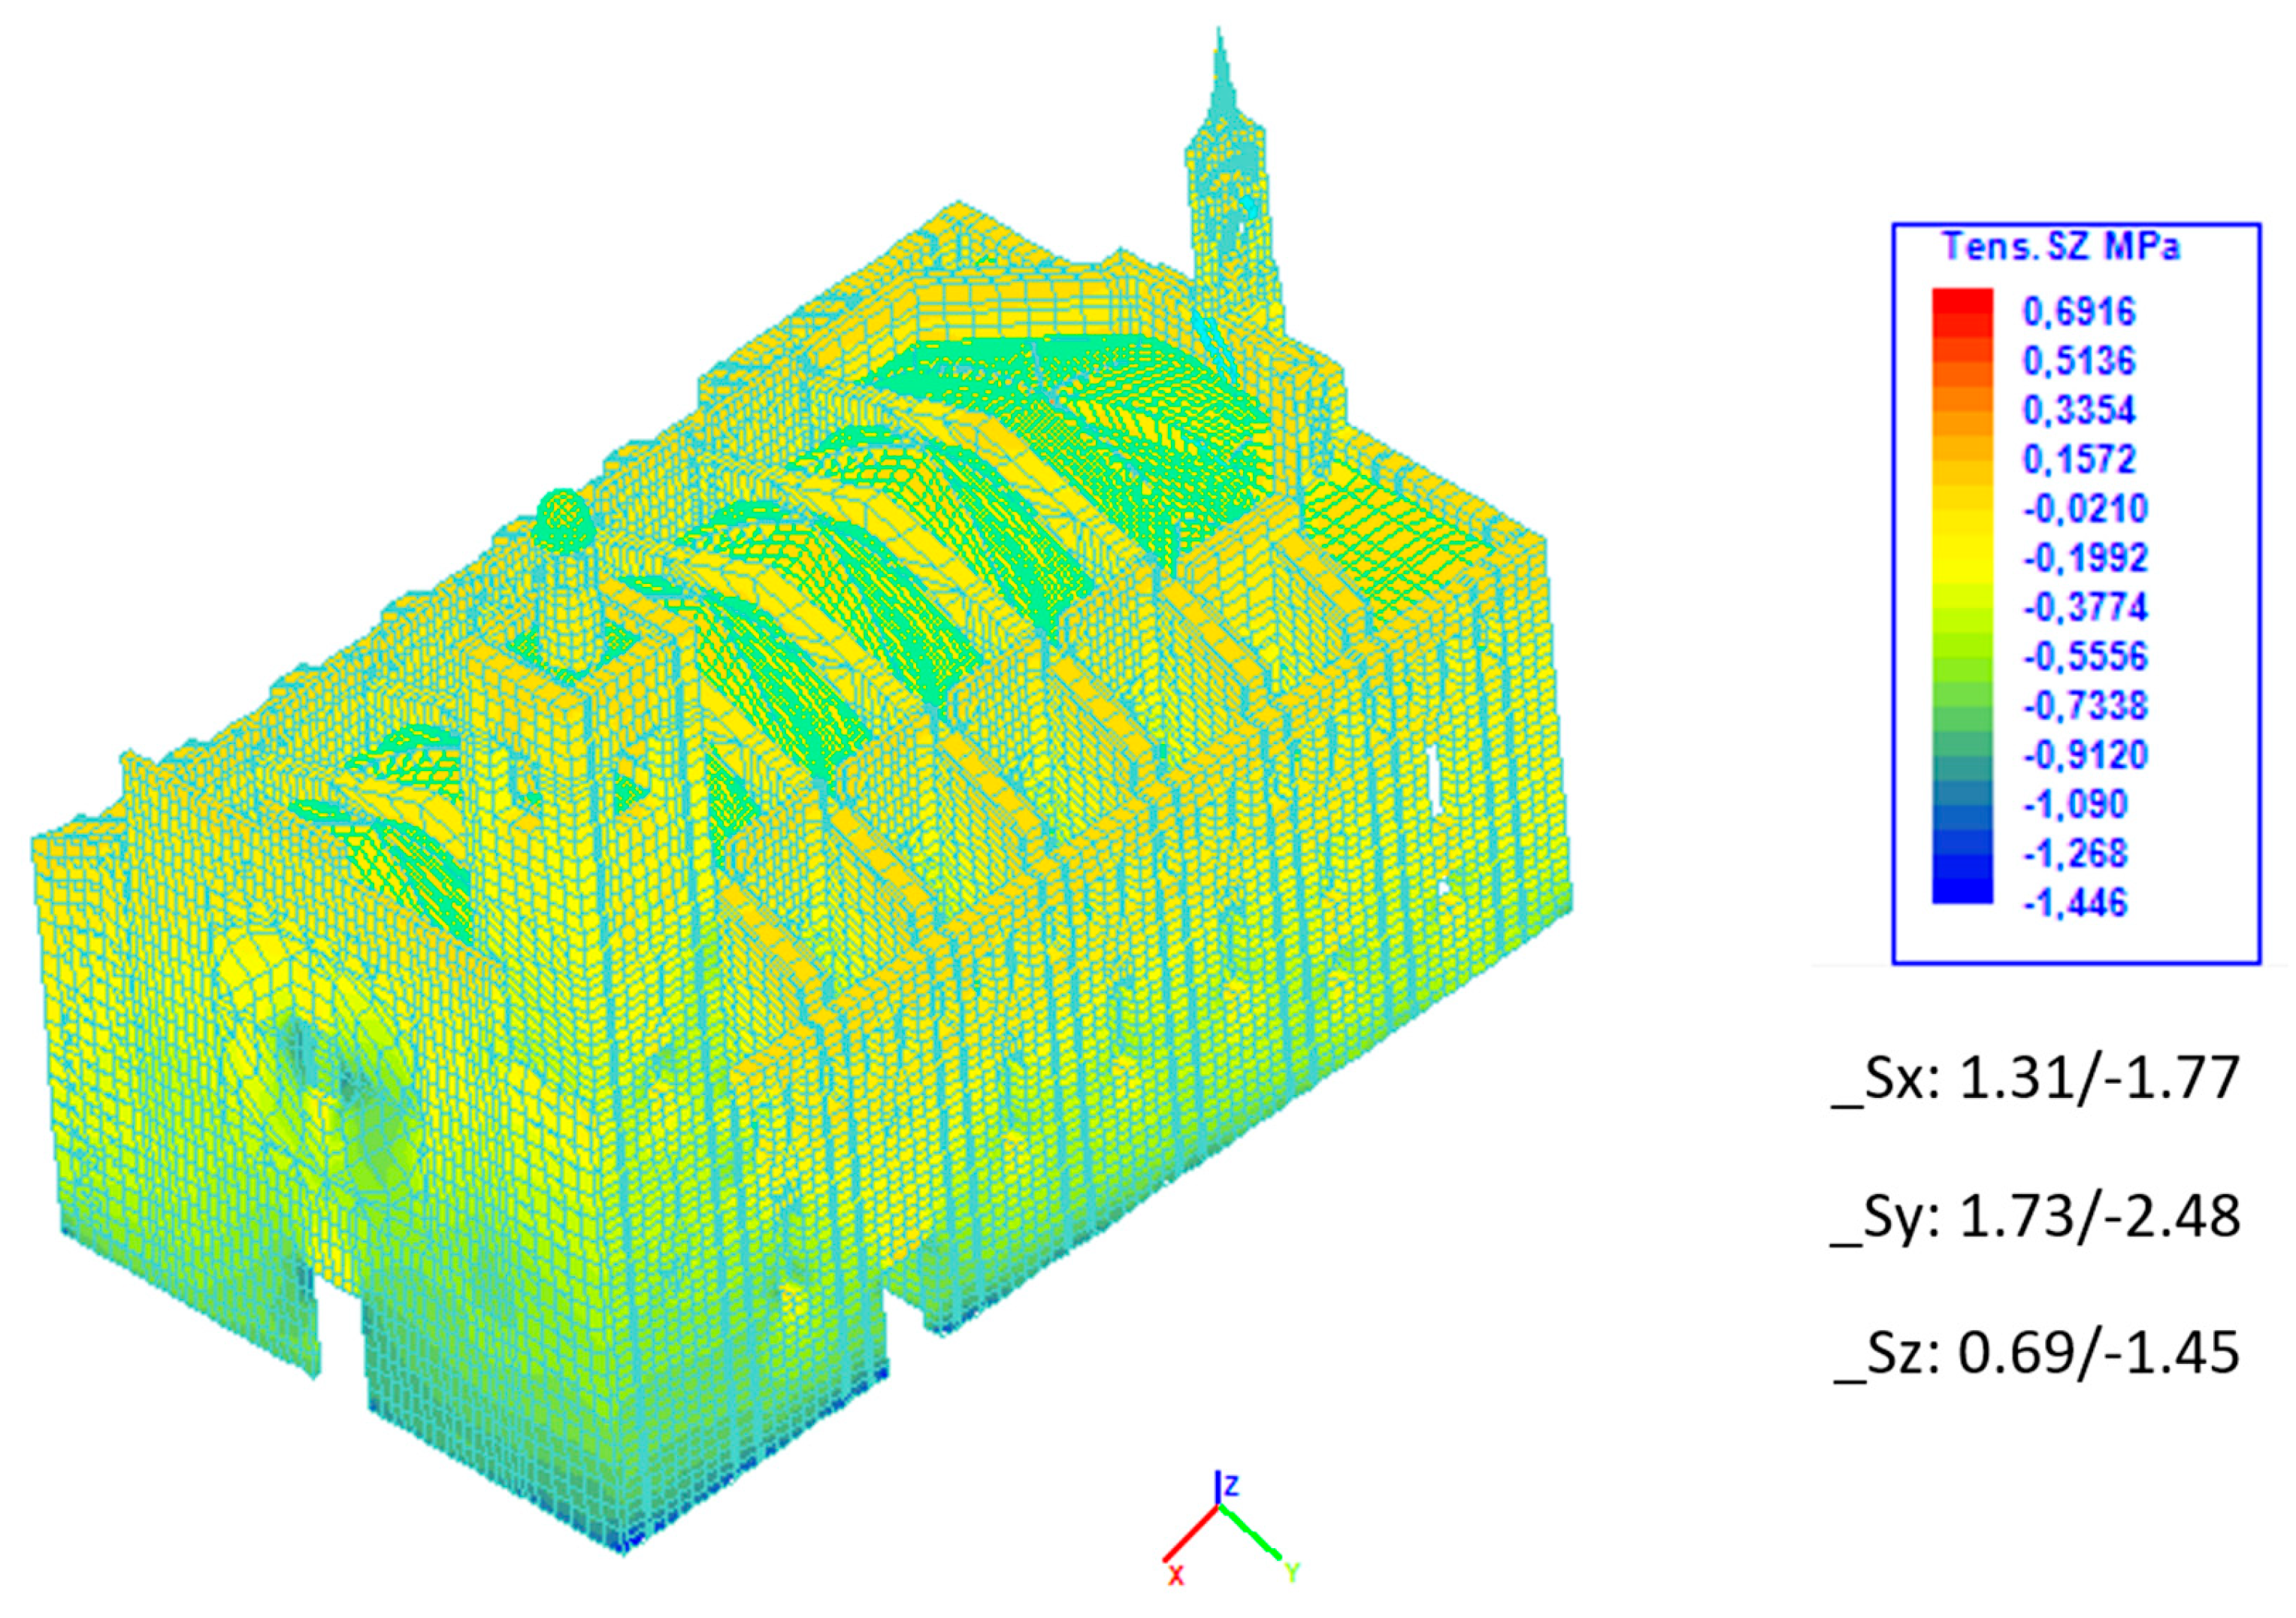
Figure 34), a generalised increase in compressive stresses is observed compared to the model with fixed supports (
Figure 35), as a direct consequence of incorporating the weight of the soil in the analysis. Nevertheless, the results show the correct transmission and distribution of stresses towards the base of the building.
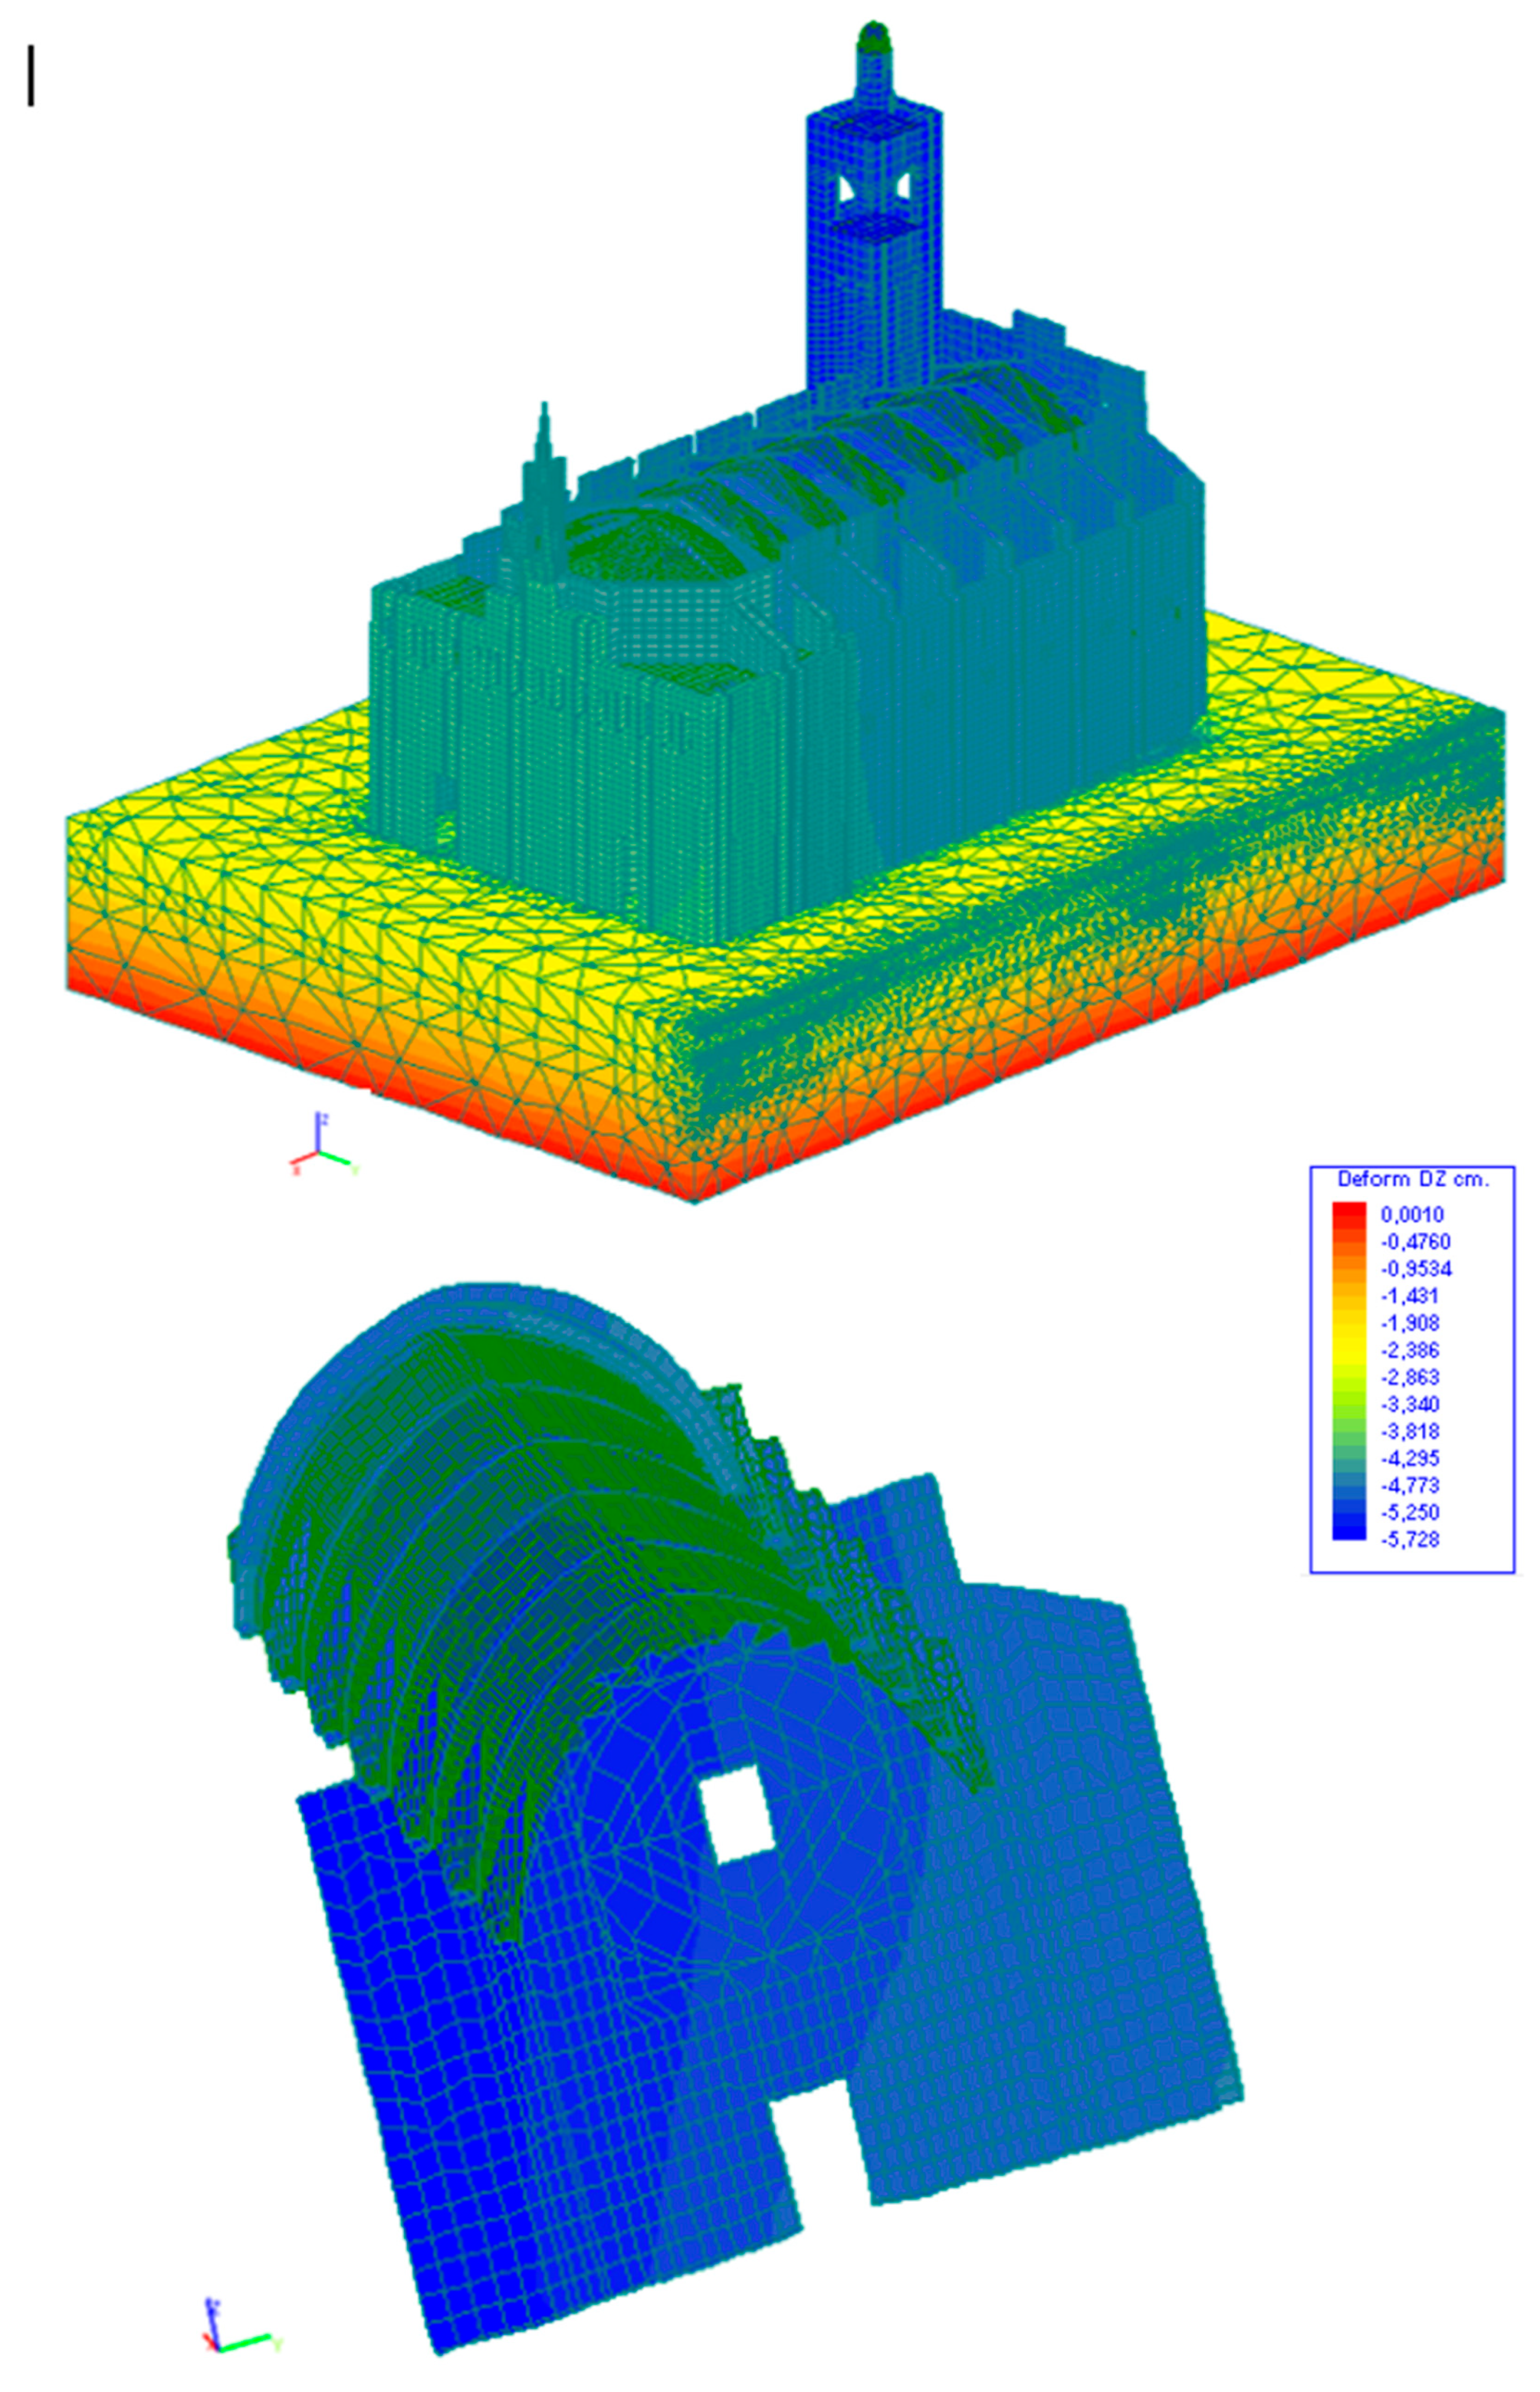
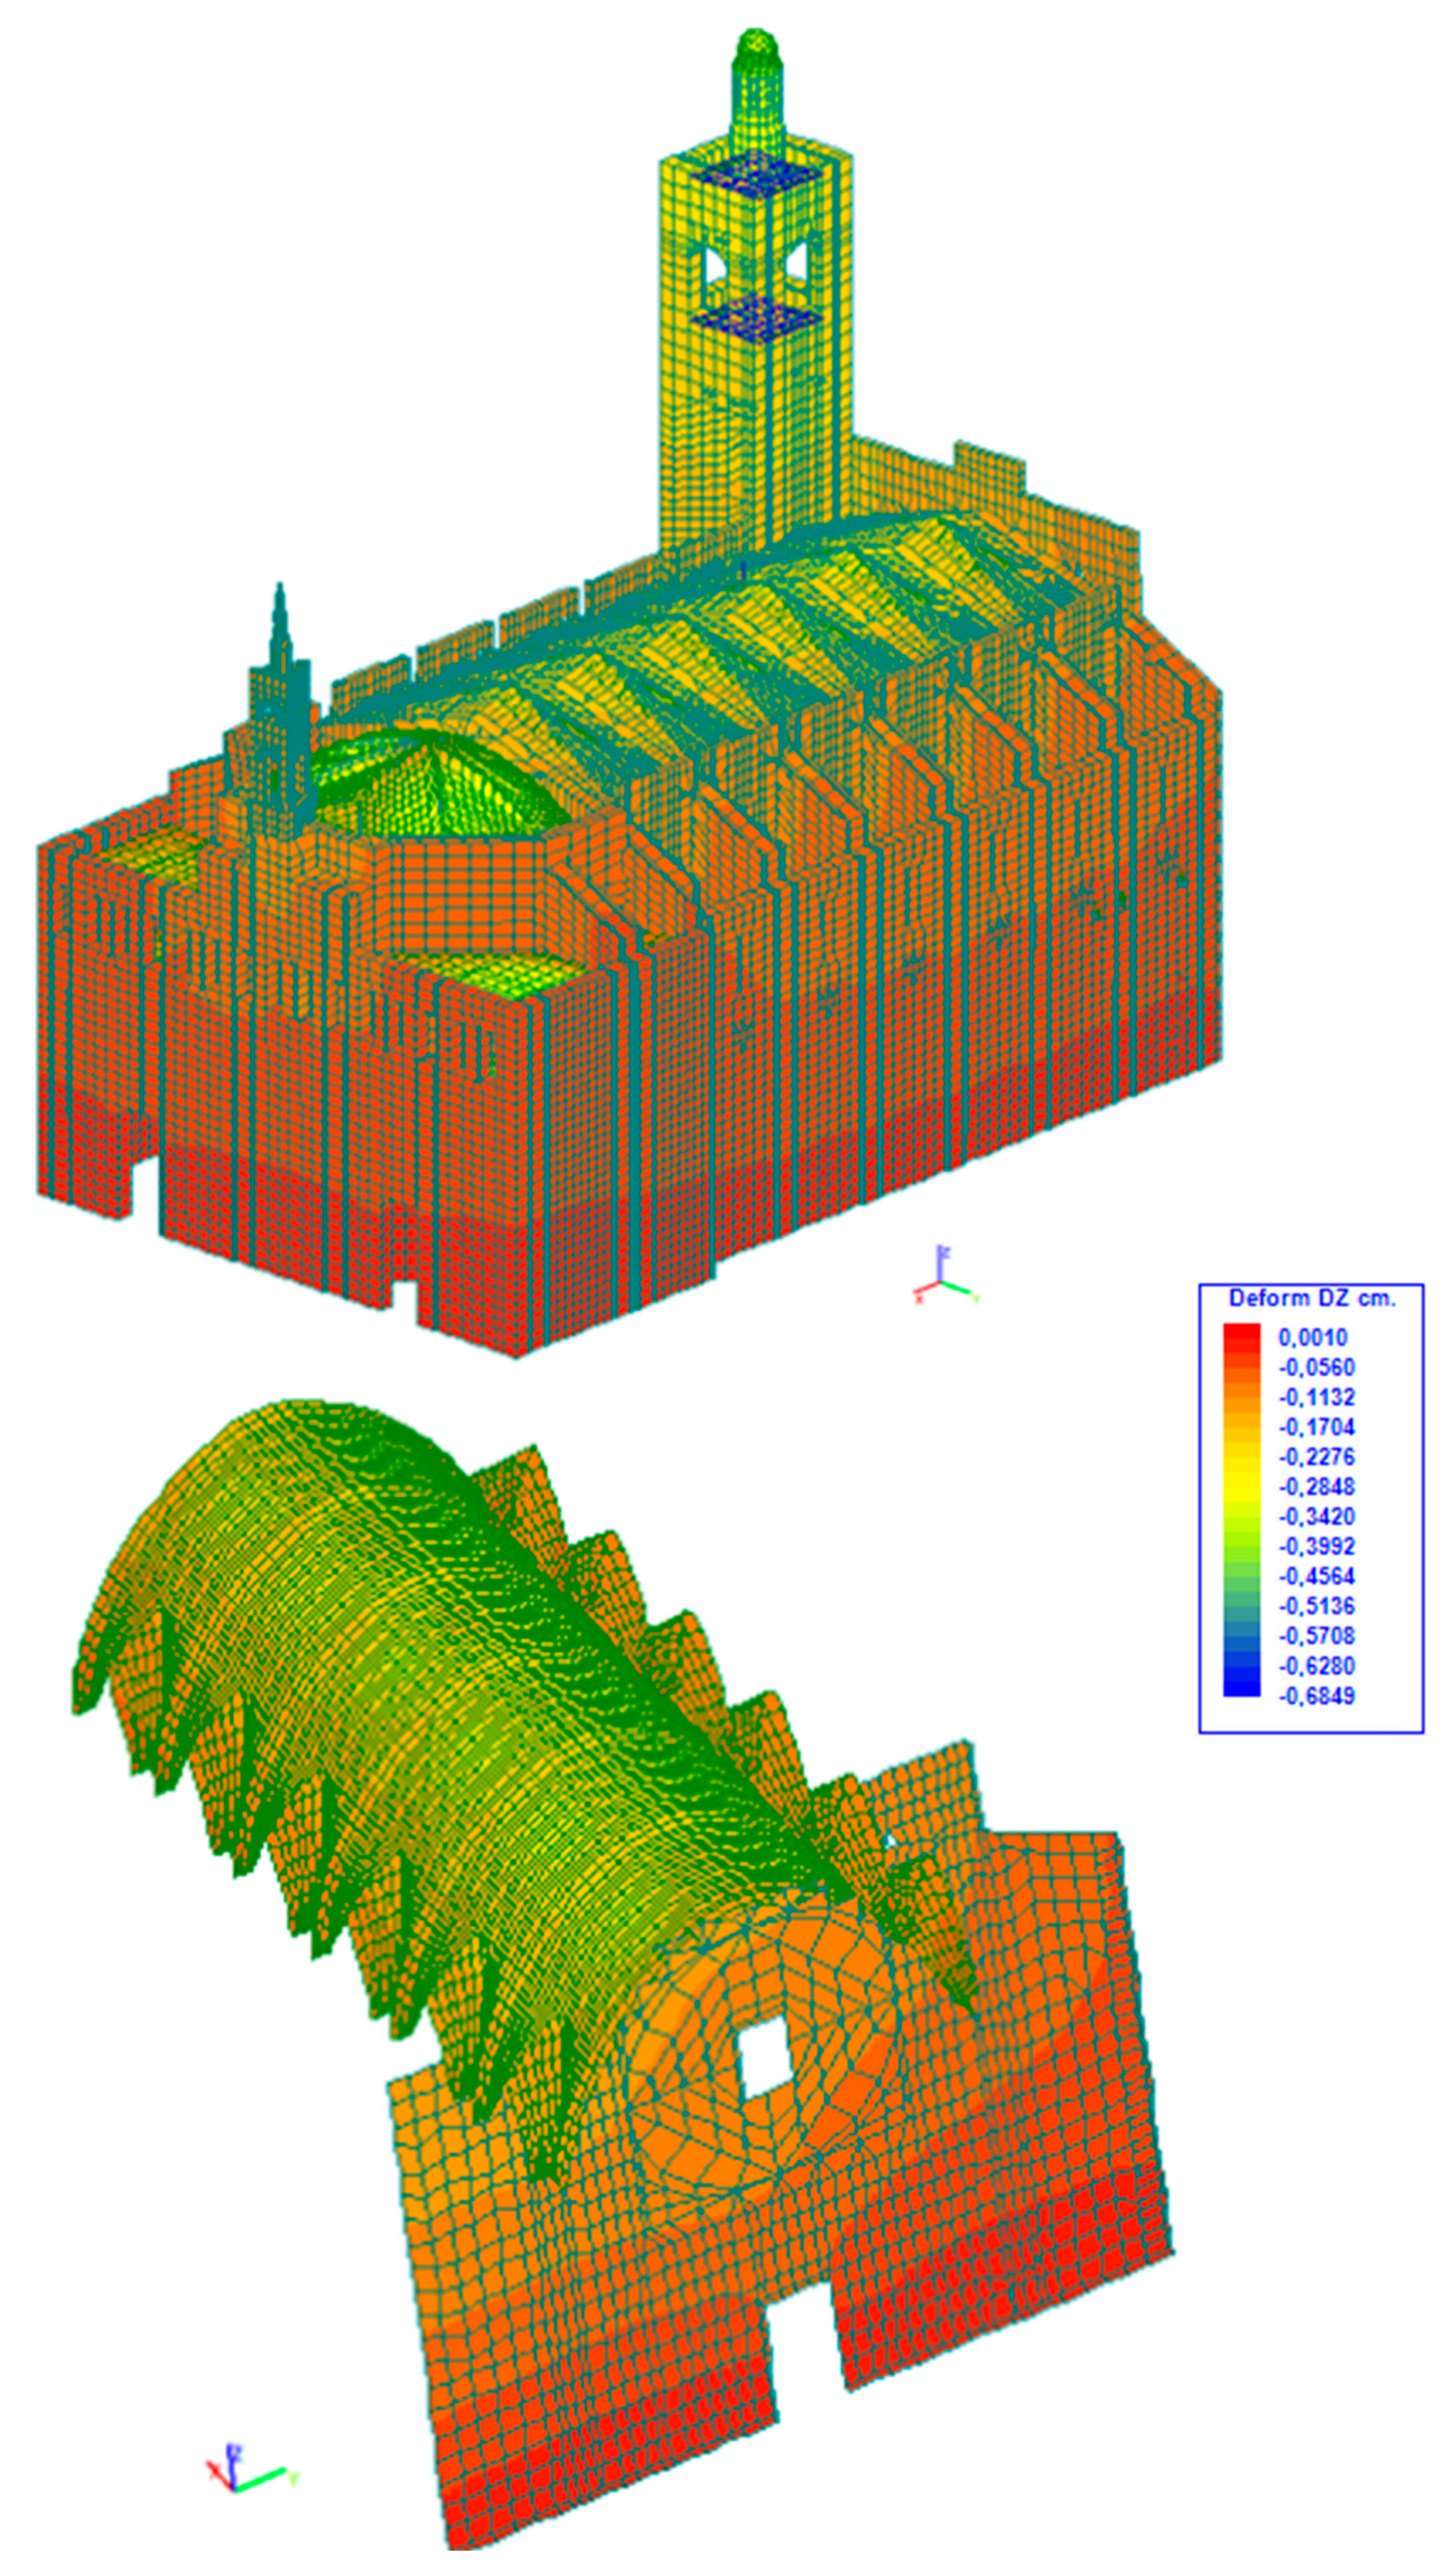
In addition, the appreciable differences in the deformations between the two models (
Figure 36 and
Figure 37) confirm the influence of the prolonged construction process, as pointed out by Roca et al. [
68], in terms of the adaptation of the structure to the progressive settlement of the ground. In quantitative terms, the vertical deformations along the
Z-axis increased from a range of 0.69 mm to −1.45 mm in the fixed-support configuration to a range of −0.68 mm to −5.25 mm when soil deformability was considered, representing a substantially greater displacement in the latter case. This phenomenon, as well as the possibility of previous compaction of the subsoil due to previous constructions, explains the finding that the simulated deformations do not correspond accurately to the current situation of the building.
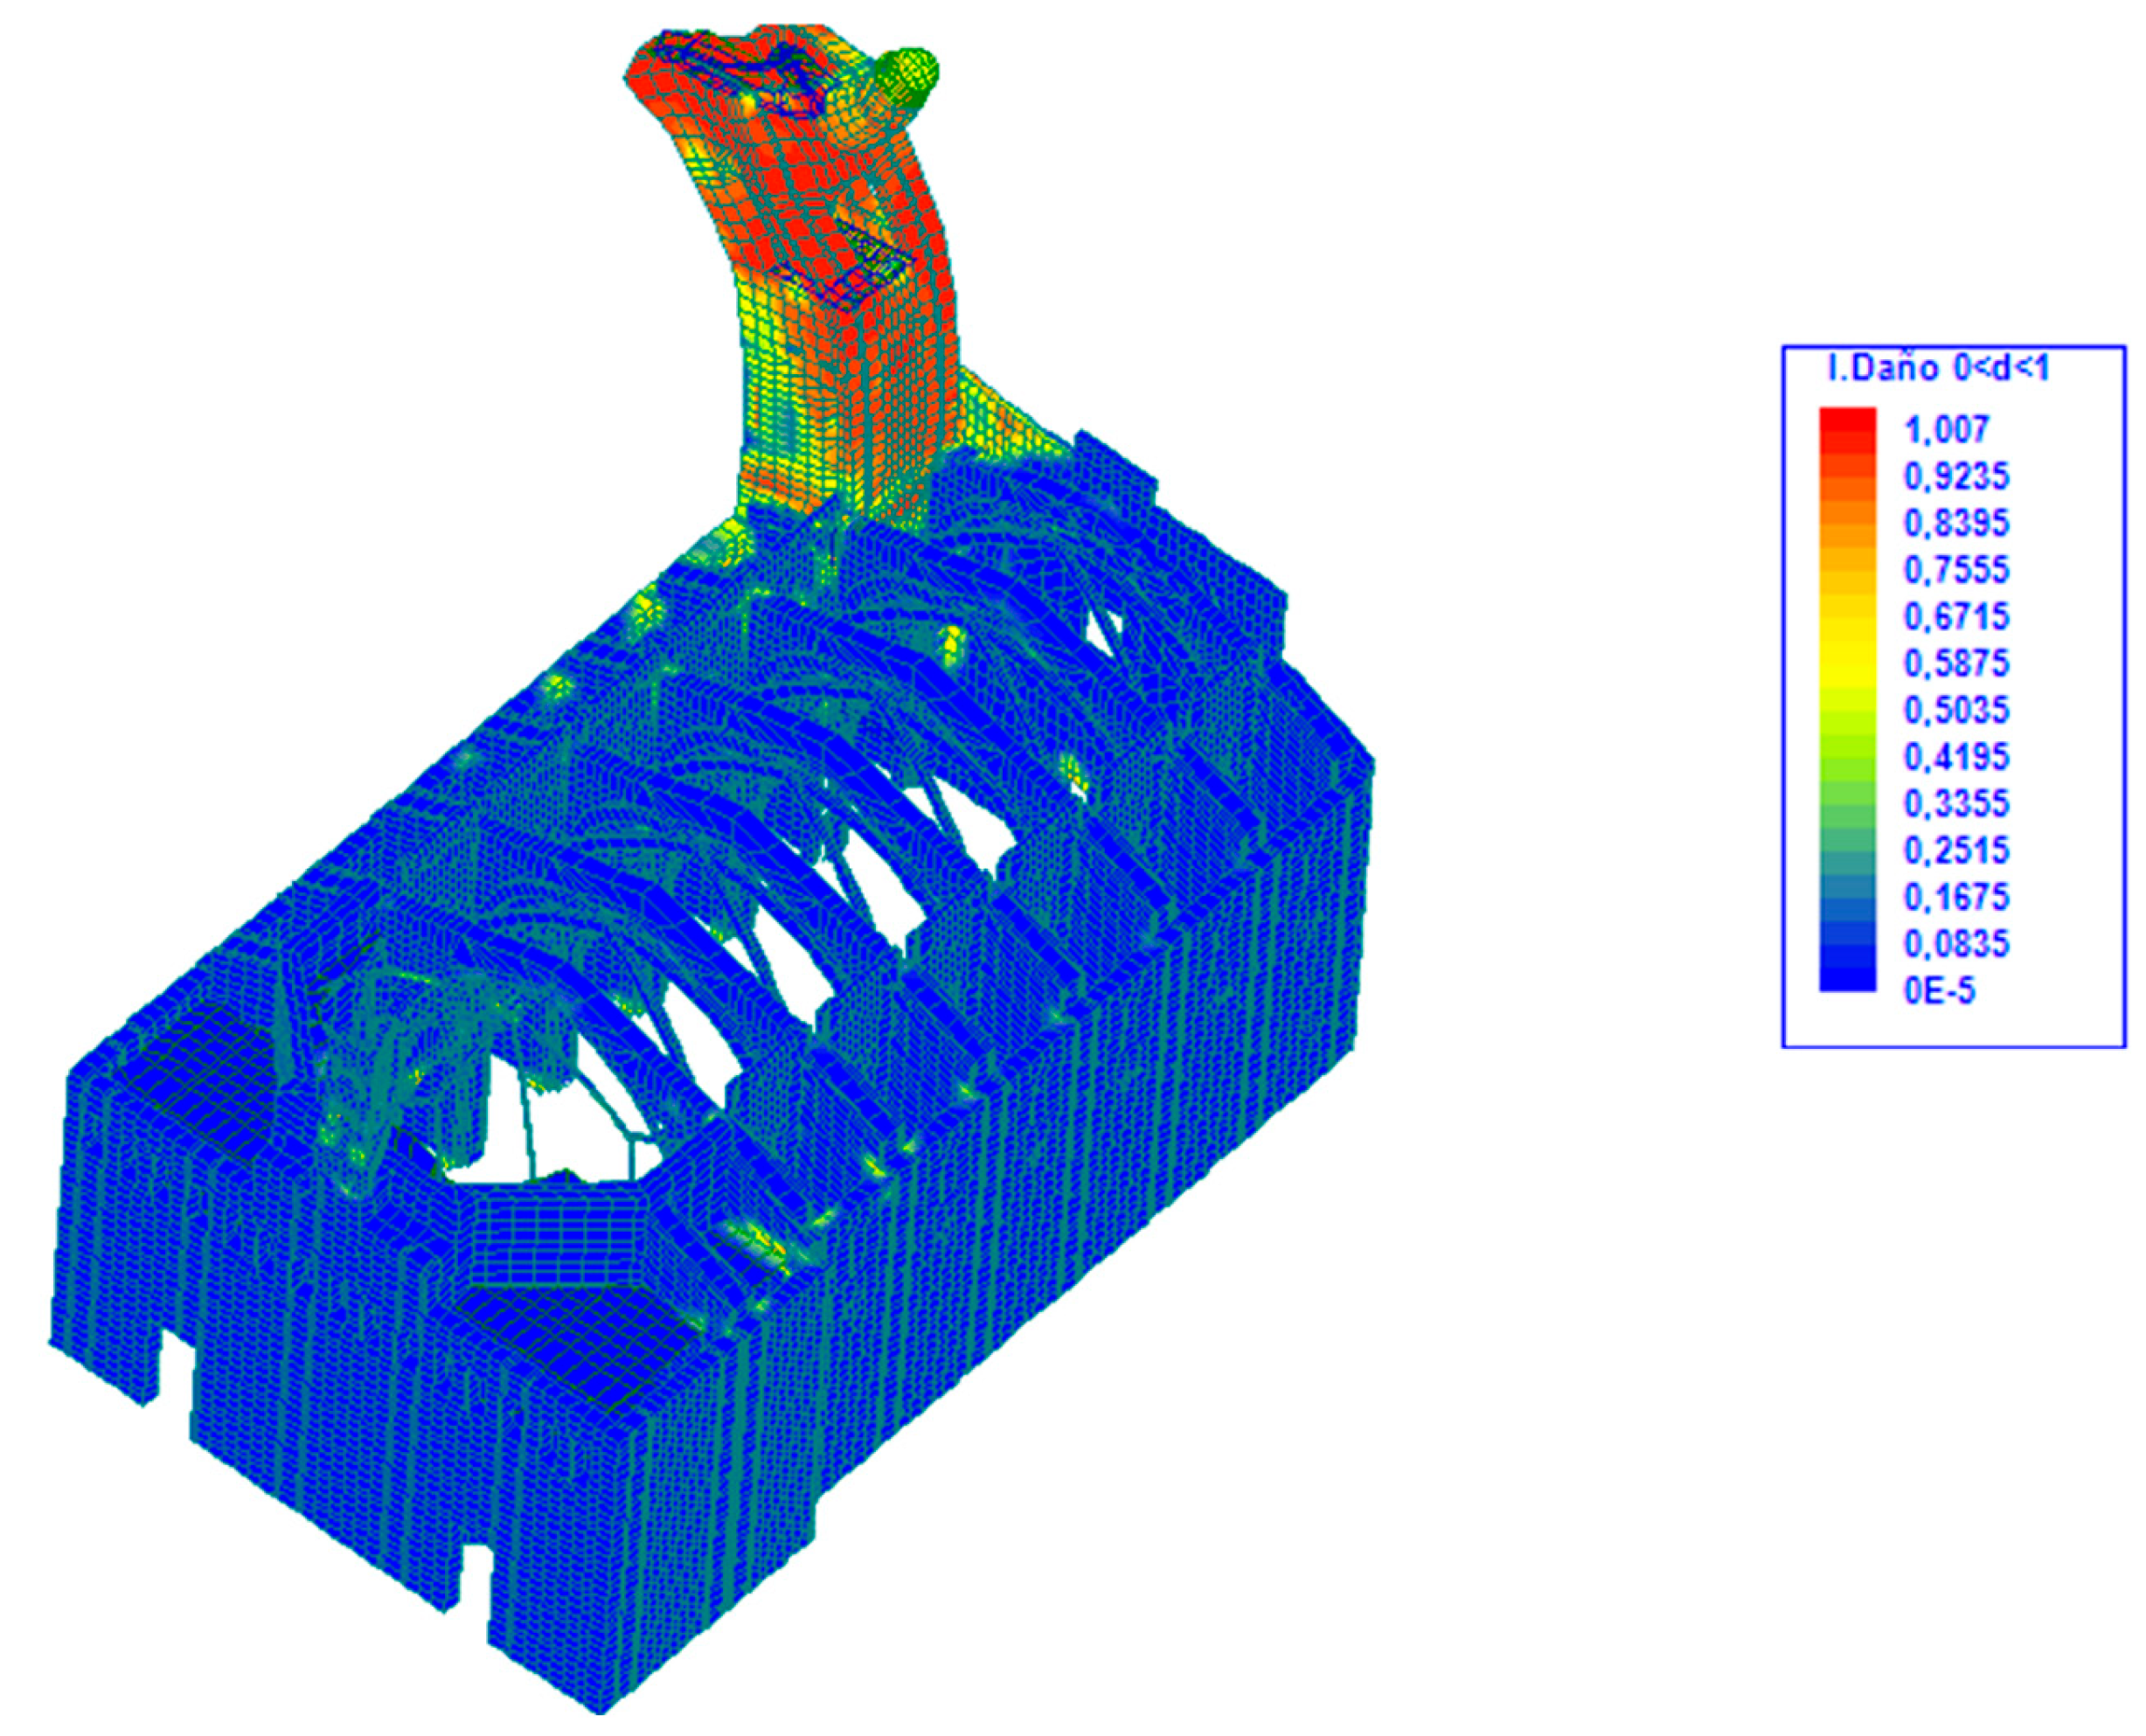
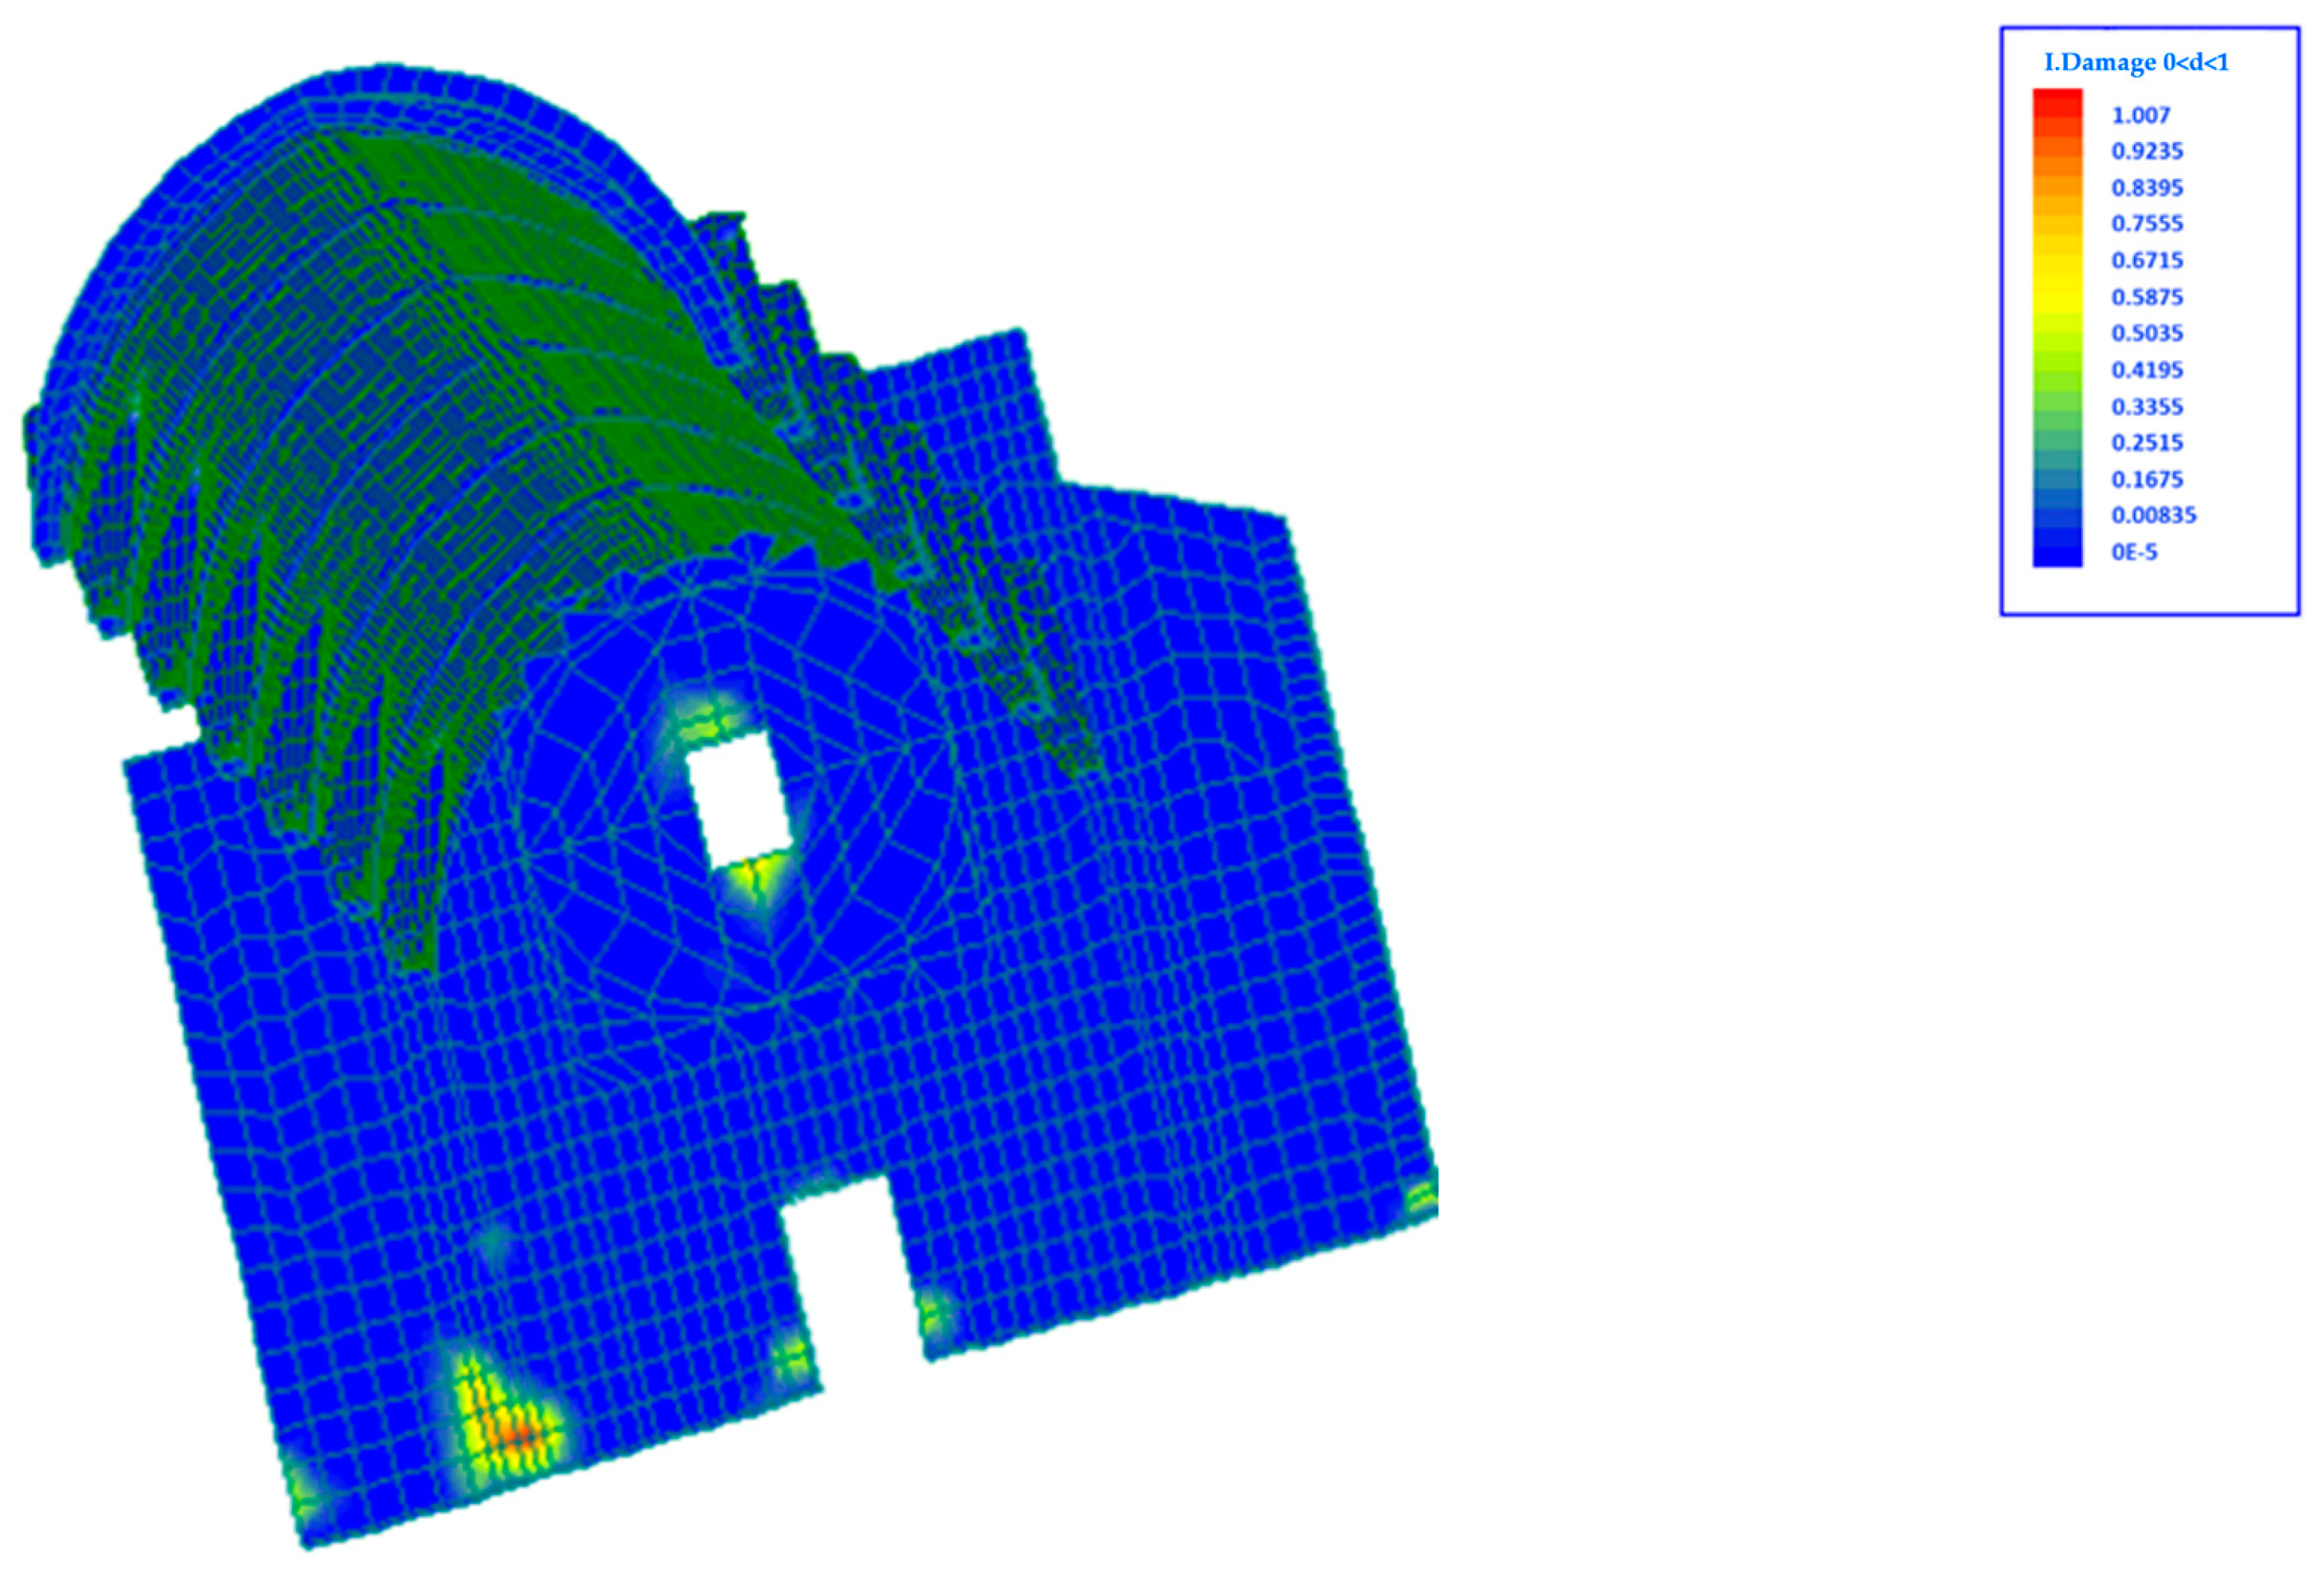
This is also evidenced by an analysis of the damage index, which again shows the façade of the ‘O’ of San Juan as the most vulnerable point, with significant localised damage (
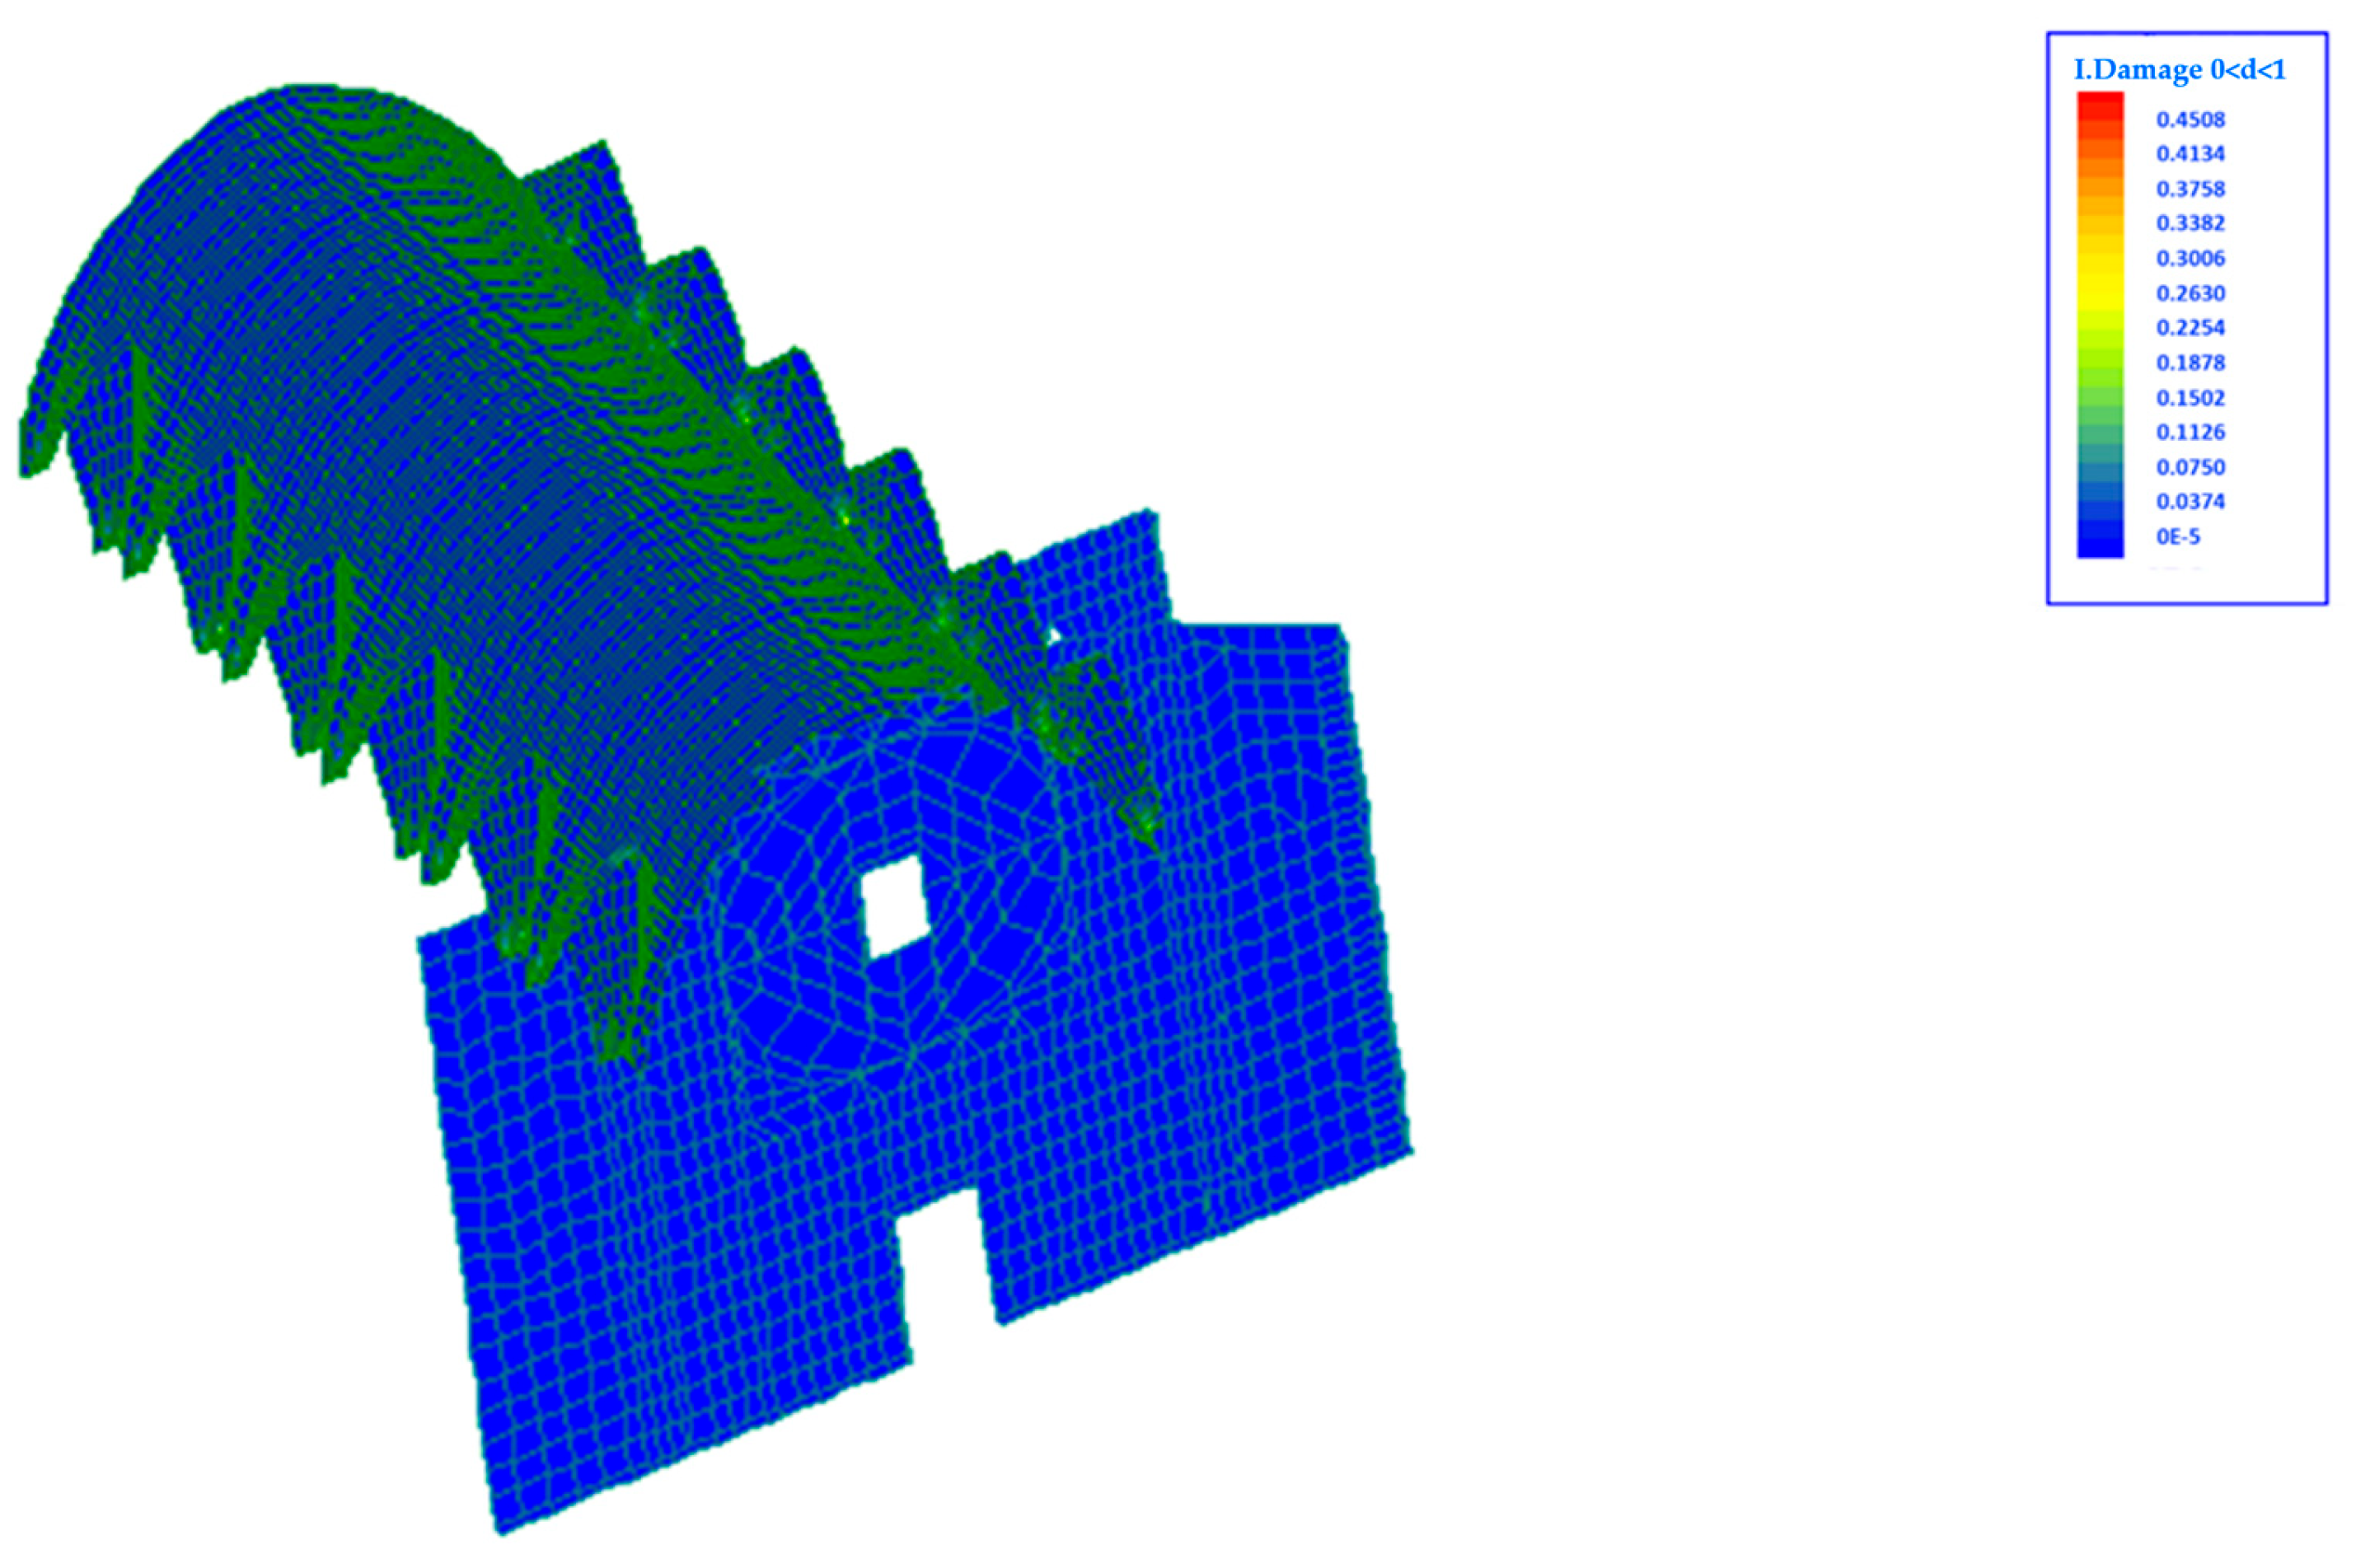
Figure 38). In the fixed-support model, the maximum damage index reached 0.4508 (
Figure 39) and no affected areas were observed after the application of the total gravitational loads. In contrast, the soil–structure interaction model reached a damage index of 1.00 under the same loading conditions (
Figure 38), with visible affected areas indicating the onset of collapse mechanisms. Consequently, although this model offers a more realistic view than conventional approaches, there is a need for a more detailed characterisation of the terrain in order to refine the simulation of its interaction with the historic structure.
7. Conclusions
This research delivers a comprehensive structural diagnosis of the Church of Santos Juanes, combining historical investigation, non-destructive testing, and advanced finite element modelling to evaluate its current condition and seismic vulnerability. The main findings reveal that, while the building exhibits a high overall structural robustness, specific elements—particularly the bell tower and the ‘O’ façade of San Juan—present significant vulnerabilities under maximum considered earthquake scenarios. The study also demonstrates that soil–structure interaction plays a decisive role in stress distribution and deformation patterns, underscoring the importance of incorporating subsoil characteristics into the seismic assessment of heritage masonry churches.
This comprehensive study of the Church of Santos Juanes highlights the architectural, structural and historical complexity of a building that has undergone multiple transformations over the centuries. In the absence of sufficient historical documentation and the overlapping of construction phases, non-destructive methods were found to be essential tools for its analysis.
Through a combination of 3D laser scanning, infrared thermography and georadar, it was possible to document the geometry of the building with high precision and the hidden configuration of its constructive elements. These techniques made it possible to detect structural discontinuities, locate old blinded accesses, characterise the stratigraphy of the subsoil, and determine the real thicknesses of hidden elements such as transverse arches. All of this was achieved without altering or damaging the monument.
A major contribution of this work lies in the integration of the NDT results into advanced finite element modelling, enabling an accurate simulation of both static and dynamic behaviour. This approach confirmed the building’s overall robustness and quantified its seismic performance under service, design, and maximum considered earthquake scenarios.
The information obtained through these technologies served as the basis for the development of reliable three-dimensional models that allowed for an advanced structural analysis to be carried out. This analysis included simulations of static and seismic loads and a study of the damage index and the soil-structure interaction using the finite element program ANGLE (v1). The comparative analysis between the fixed-support model and the model incorporating soil–structure interaction revealed a generalised increase in compressive stresses and significant differences in deformation patterns, providing new insight into the influence of subsoil deformability on historic masonry churches. Simulation of different scenarios confirmed the robustness of the building, but also identified vulnerable areas, such as the façade of the ‘O’ of San Juan, where significant deformation and localised damage are already visible today.
The use of infrared thermography was essential to verify the continuity and depth of the cracks identified by the structural model. Similarly, the use of georadar made it possible to define the subsoil conditions more precisely, allowing for a more realistic representation of the entire structure. This, in turn, revealed significant differences compared to the results obtained using models that assume rigid supports. The time-history analysis further demonstrated that the bell tower is the most critical structural element, with failure occurring within the first seconds of a simulated maximum considered earthquake.
In summary, this work demonstrates that the integration of non-invasive techniques with advanced structural simulation tools allows us to study complex historical constructions with greater depth and respect. This approach improves the knowledge of their behaviour and current state, and offers a solid scientific basis for conservation, diagnosis and future intervention. In terms of scope, the vulnerability assessment carried out corresponds to an LV1 level according to the Italian Guidelines for the Cultural Heritage, situating this study within an internationally recognised methodological framework that facilitates comparison with other heritage assessments and reinforces the replicability of the proposed approach for historic churches of similar typology. This methodological approach is emerging as a replicable model for other heritage buildings with similar problems.
Regarding future work, an important research direction would be to further investigate the model including soil–structure interaction, focusing on the influence of the church’s different construction stages on both the ground and the current behaviour of the structure. Once the construction sequence is fully established, it would be valuable to evaluate how each phase affected the underlying soil and, in turn, how these effects have shaped the present condition of the building. Such an approach could include analysing the deformations arising at different construction stages, identifying their causes, and assessing the capacity of the structure to accommodate them.
